Reed City, MI Map & Demographics
Reed City Map
Reed City Overview
$25,693
PER CAPITA INCOME
$56,989
AVG FAMILY INCOME
$47,250
AVG HOUSEHOLD INCOME
33.5%
WAGE / INCOME GAP [ % ]
66.5¢/ $1
WAGE / INCOME GAP [ $ ]
0.42
INEQUALITY / GINI INDEX
2,481
TOTAL POPULATION
1,104
MALE POPULATION
1,377
FEMALE POPULATION
80.17
MALES / 100 FEMALES
124.73
FEMALES / 100 MALES
43.0
MEDIAN AGE
2.9
AVG FAMILY SIZE
2.4
AVG HOUSEHOLD SIZE
1,032
LABOR FORCE [ PEOPLE ]
50.4%
PERCENT IN LABOR FORCE
8.9%
UNEMPLOYMENT RATE
Reed City Zip Codes
Reed City Area Codes
Income in Reed City
Income Overview in Reed City
Per Capita Income in Reed City is $25,693, while median incomes of families and households are $56,989 and $47,250 respectively.
| Characteristic | Number | Measure |
| Per Capita Income | 2,481 | $25,693 |
| Median Family Income | 595 | $56,989 |
| Mean Family Income | 595 | $69,670 |
| Median Household Income | 999 | $47,250 |
| Mean Household Income | 999 | $59,456 |
| Income Deficit | 595 | $0 |
| Wage / Income Gap (%) | 2,481 | 33.50% |
| Wage / Income Gap ($) | 2,481 | 66.50¢ per $1 |
| Gini / Inequality Index | 2,481 | 0.42 |
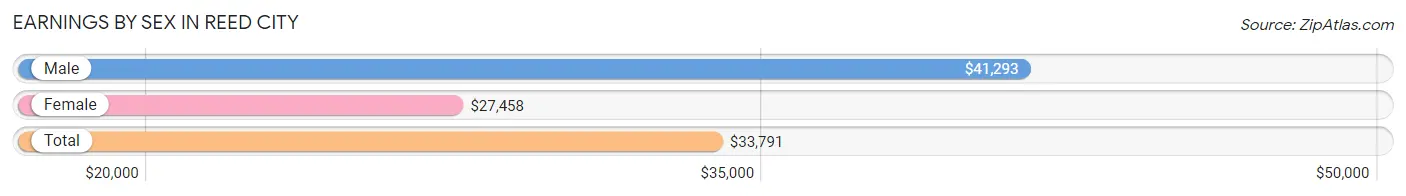
Earnings by Sex in Reed City
Average Earnings in Reed City are $33,791, $41,293 for men and $27,458 for women, a difference of 33.5%.
| Sex | Number | Average Earnings |
| Male | 562 (49.3%) | $41,293 |
| Female | 579 (50.7%) | $27,458 |
| Total | 1,141 (100.0%) | $33,791 |
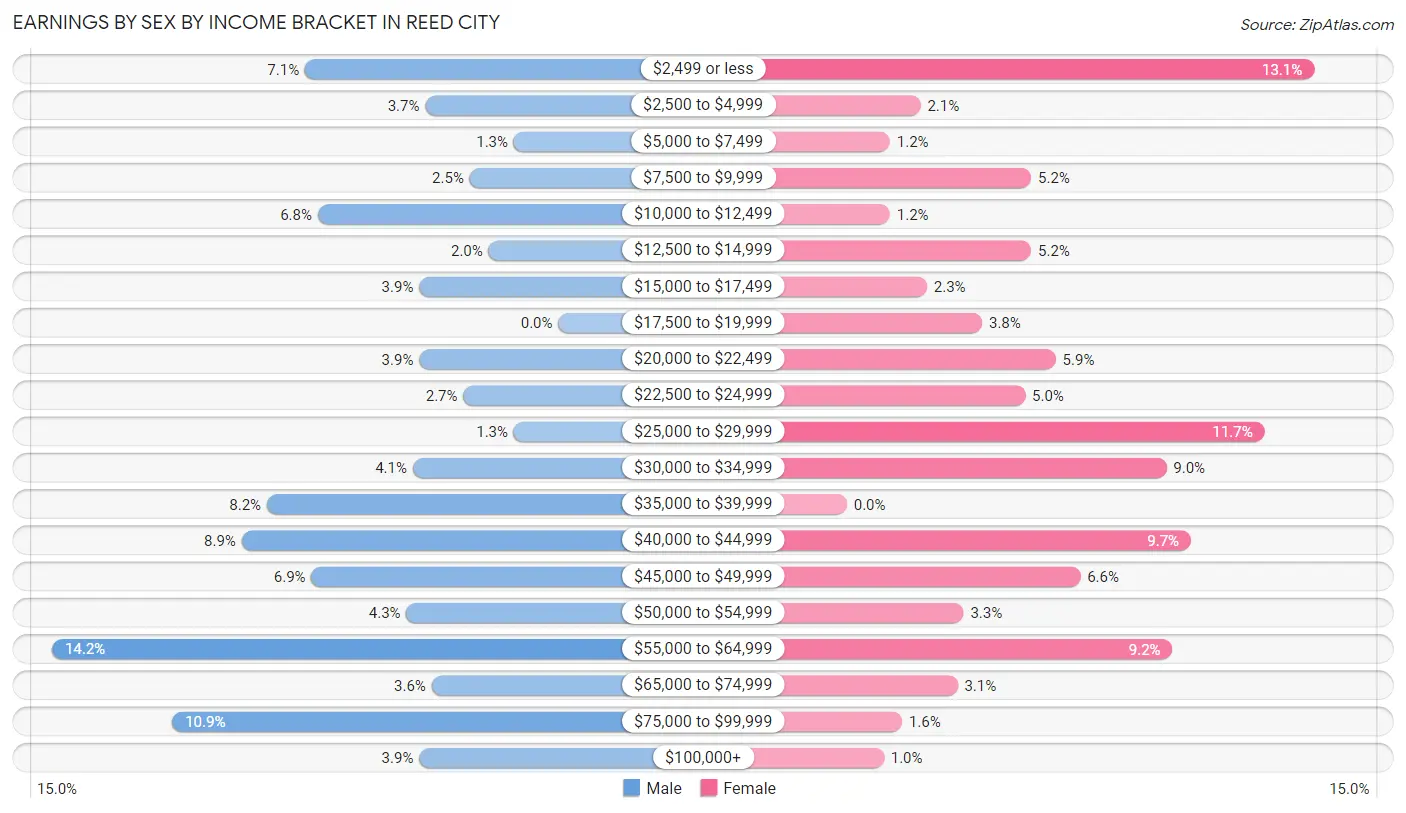
Earnings by Sex by Income Bracket in Reed City
The most common earnings brackets in Reed City are $55,000 to $64,999 for men (80 | 14.2%) and $2,499 or less for women (76 | 13.1%).
| Income | Male | Female |
| $2,499 or less | 40 (7.1%) | 76 (13.1%) |
| $2,500 to $4,999 | 21 (3.7%) | 12 (2.1%) |
| $5,000 to $7,499 | 7 (1.3%) | 7 (1.2%) |
| $7,500 to $9,999 | 14 (2.5%) | 30 (5.2%) |
| $10,000 to $12,499 | 38 (6.8%) | 7 (1.2%) |
| $12,500 to $14,999 | 11 (2.0%) | 30 (5.2%) |
| $15,000 to $17,499 | 22 (3.9%) | 13 (2.2%) |
| $17,500 to $19,999 | 0 (0.0%) | 22 (3.8%) |
| $20,000 to $22,499 | 22 (3.9%) | 34 (5.9%) |
| $22,500 to $24,999 | 15 (2.7%) | 29 (5.0%) |
| $25,000 to $29,999 | 7 (1.3%) | 68 (11.7%) |
| $30,000 to $34,999 | 23 (4.1%) | 52 (9.0%) |
| $35,000 to $39,999 | 46 (8.2%) | 0 (0.0%) |
| $40,000 to $44,999 | 50 (8.9%) | 56 (9.7%) |
| $45,000 to $49,999 | 39 (6.9%) | 38 (6.6%) |
| $50,000 to $54,999 | 24 (4.3%) | 19 (3.3%) |
| $55,000 to $64,999 | 80 (14.2%) | 53 (9.1%) |
| $65,000 to $74,999 | 20 (3.6%) | 18 (3.1%) |
| $75,000 to $99,999 | 61 (10.8%) | 9 (1.5%) |
| $100,000+ | 22 (3.9%) | 6 (1.0%) |
| Total | 562 (100.0%) | 579 (100.0%) |
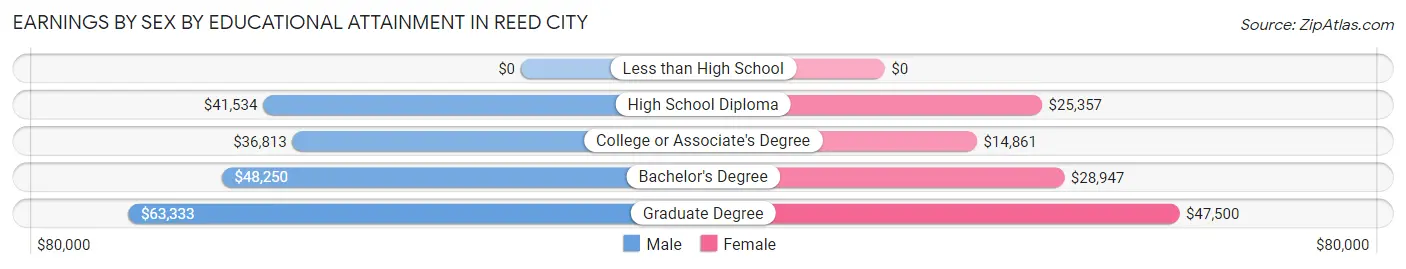
Earnings by Sex by Educational Attainment in Reed City
Average earnings in Reed City are $43,452 for men and $27,599 for women, a difference of 36.5%. Men with an educational attainment of graduate degree enjoy the highest average annual earnings of $63,333, while those with college or associate's degree education earn the least with $36,813. Women with an educational attainment of graduate degree earn the most with the average annual earnings of $47,500, while those with college or associate's degree education have the smallest earnings of $14,861.
| Educational Attainment | Male Income | Female Income |
| Less than High School | - | - |
| High School Diploma | $41,534 | $25,357 |
| College or Associate's Degree | $36,813 | $14,861 |
| Bachelor's Degree | $48,250 | $28,947 |
| Graduate Degree | $63,333 | $47,500 |
| Total | $43,452 | $27,599 |
Family Income in Reed City
Family Income Brackets in Reed City
According to the Reed City family income data, there are 134 families falling into the $50,000 to $74,999 income range, which is the most common income bracket and makes up 22.5% of all families. Conversely, the $150,000 to $199,999 income bracket is the least frequent group with only 9 families (1.5%) belonging to this category.
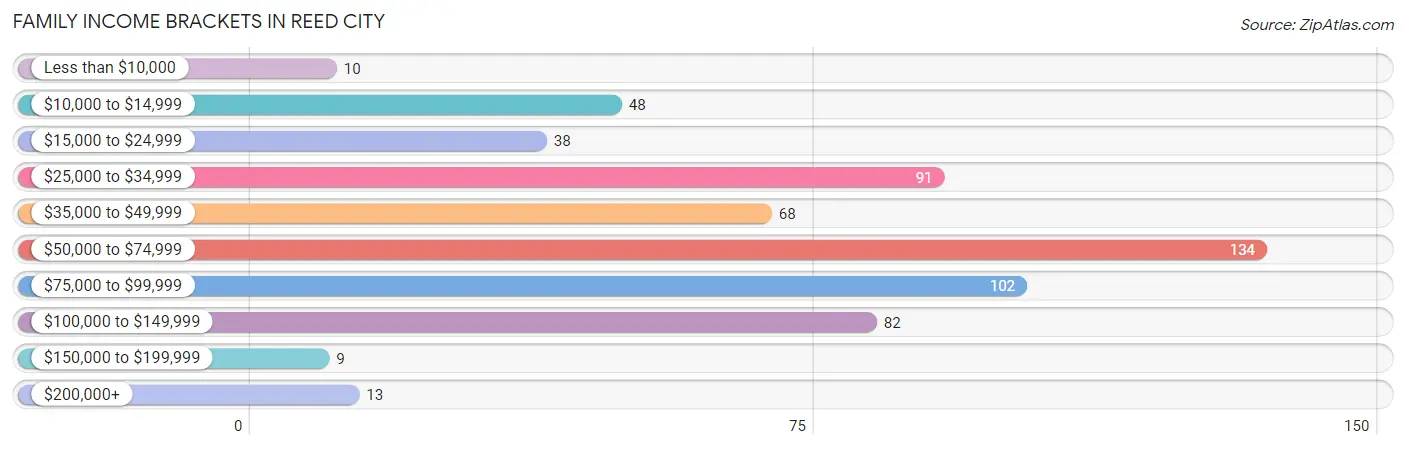
| Income Bracket | # Families | % Families |
| Less than $10,000 | 10 | 1.7% |
| $10,000 to $14,999 | 48 | 8.1% |
| $15,000 to $24,999 | 38 | 6.4% |
| $25,000 to $34,999 | 91 | 15.3% |
| $35,000 to $49,999 | 68 | 11.4% |
| $50,000 to $74,999 | 134 | 22.5% |
| $75,000 to $99,999 | 102 | 17.1% |
| $100,000 to $149,999 | 82 | 13.8% |
| $150,000 to $199,999 | 9 | 1.5% |
| $200,000+ | 13 | 2.2% |
Family Income by Famaliy Size in Reed City
5-person families (36 | 6.0%) account for the highest median family income in Reed City with $95,500 per family, while 3-person families (129 | 21.7%) have the highest median income of $21,146 per family member.
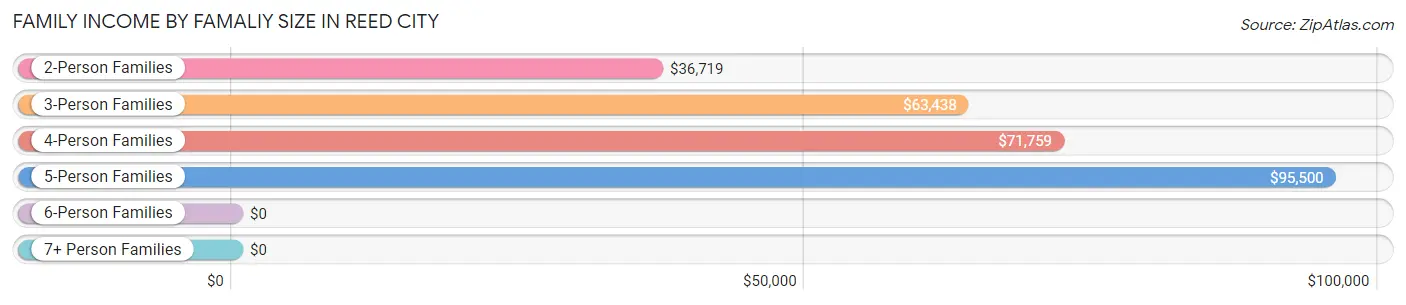
| Income Bracket | # Families | Median Income |
| 2-Person Families | 329 (55.3%) | $36,719 |
| 3-Person Families | 129 (21.7%) | $63,438 |
| 4-Person Families | 80 (13.5%) | $71,759 |
| 5-Person Families | 36 (6.0%) | $95,500 |
| 6-Person Families | 15 (2.5%) | $0 |
| 7+ Person Families | 6 (1.0%) | $0 |
| Total | 595 (100.0%) | $56,989 |
Family Income by Number of Earners in Reed City
The median family income in Reed City is $56,989, with families comprising 2 earners (245) having the highest median family income of $91,065, while families with no earners (126) have the lowest median family income of $26,800, accounting for 41.2% and 21.2% of families, respectively.
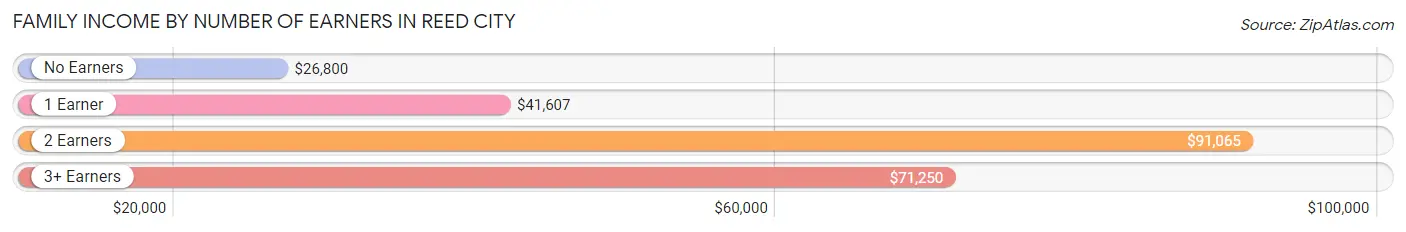
| Number of Earners | # Families | Median Income |
| No Earners | 126 (21.2%) | $26,800 |
| 1 Earner | 201 (33.8%) | $41,607 |
| 2 Earners | 245 (41.2%) | $91,065 |
| 3+ Earners | 23 (3.9%) | $71,250 |
| Total | 595 (100.0%) | $56,989 |
Household Income in Reed City
Household Income Brackets in Reed City
With 204 households falling in the category, the $50,000 to $74,999 income range is the most frequent in Reed City, accounting for 20.4% of all households. In contrast, only 9 households (0.9%) fall into the $150,000 to $199,999 income bracket, making it the least populous group.
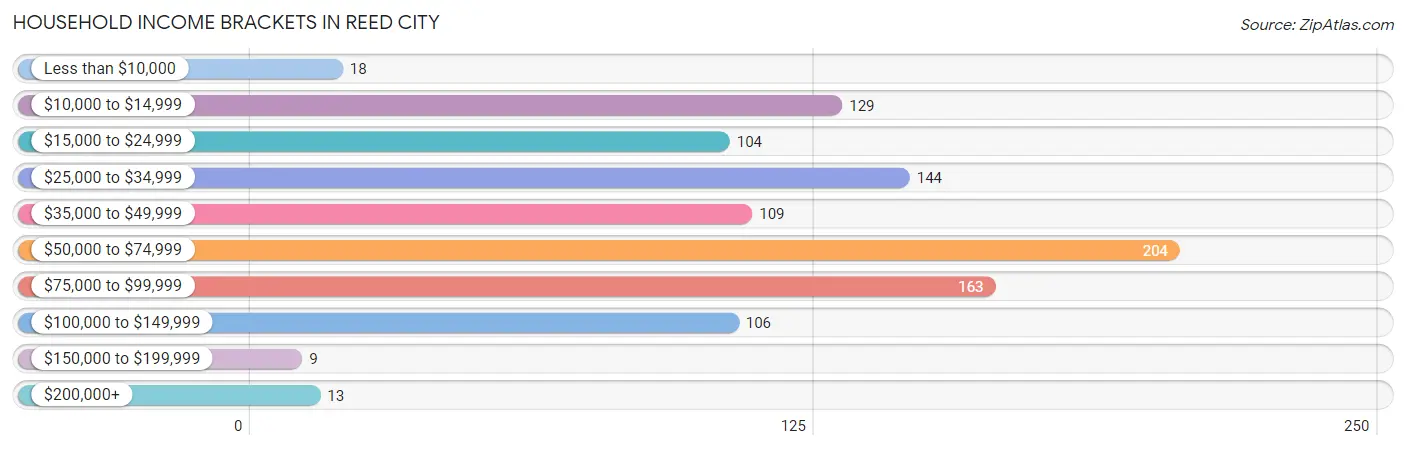
| Income Bracket | # Households | % Households |
| Less than $10,000 | 18 | 1.8% |
| $10,000 to $14,999 | 129 | 12.9% |
| $15,000 to $24,999 | 104 | 10.4% |
| $25,000 to $34,999 | 144 | 14.4% |
| $35,000 to $49,999 | 109 | 10.9% |
| $50,000 to $74,999 | 204 | 20.4% |
| $75,000 to $99,999 | 163 | 16.3% |
| $100,000 to $149,999 | 106 | 10.6% |
| $150,000 to $199,999 | 9 | 0.9% |
| $200,000+ | 13 | 1.3% |
Household Income by Householder Age in Reed City
The median household income in Reed City is $47,250, with the highest median household income of $56,750 found in the 25 to 44 years age bracket for the primary householder. A total of 359 households (35.9%) fall into this category. Meanwhile, the 15 to 24 years age bracket for the primary householder has the lowest median household income of $20,500, with 20 households (2.0%) in this group.
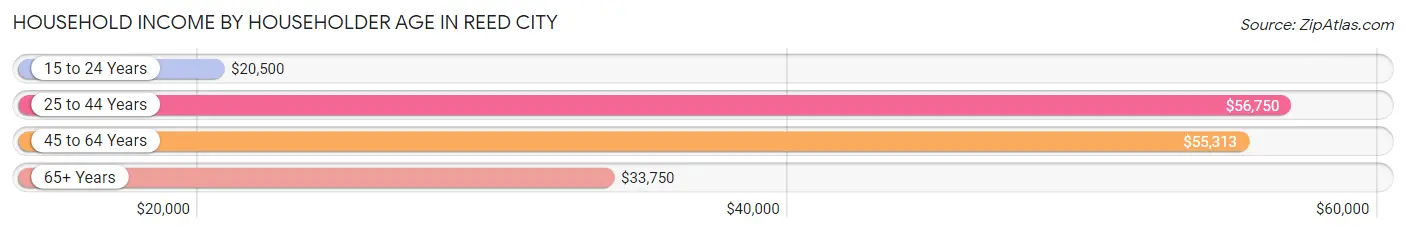
| Income Bracket | # Households | Median Income |
| 15 to 24 Years | 20 (2.0%) | $20,500 |
| 25 to 44 Years | 359 (35.9%) | $56,750 |
| 45 to 64 Years | 324 (32.4%) | $55,313 |
| 65+ Years | 296 (29.6%) | $33,750 |
| Total | 999 (100.0%) | $47,250 |
Poverty in Reed City
Income Below Poverty by Sex and Age in Reed City
With 14.0% poverty level for males and 21.9% for females among the residents of Reed City, under 5 year old males and 65 to 74 year old females are the most vulnerable to poverty, with 20 males (35.1%) and 80 females (43.0%) in their respective age groups living below the poverty level.
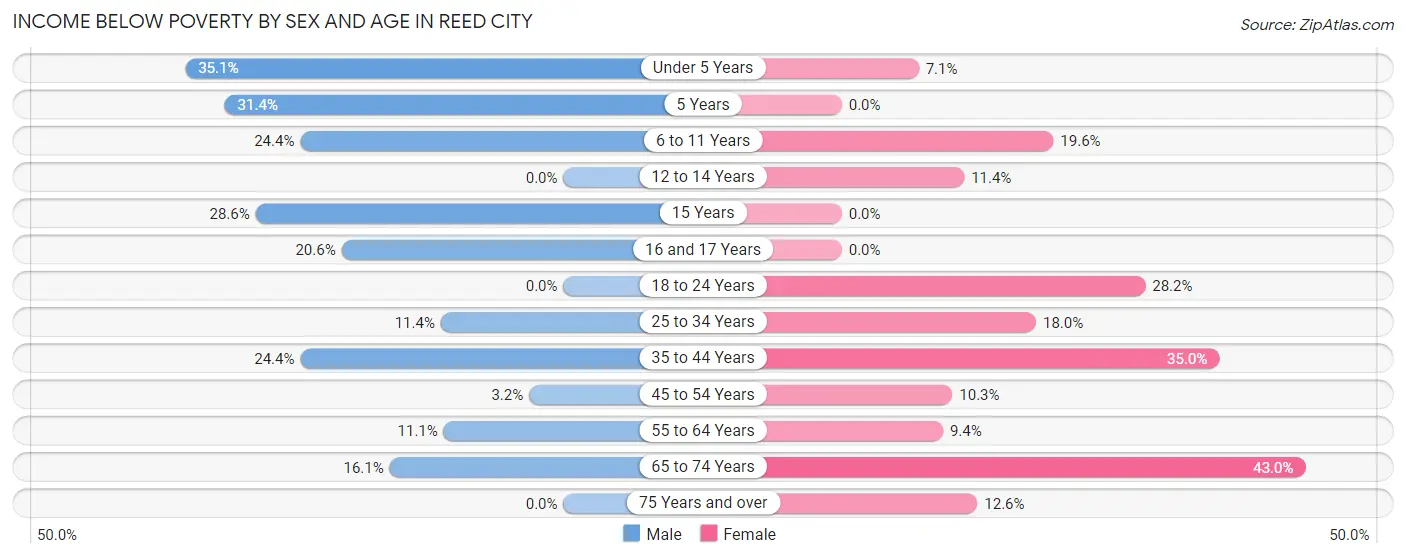
| Age Bracket | Male | Female |
| Under 5 Years | 20 (35.1%) | 4 (7.1%) |
| 5 Years | 11 (31.4%) | 0 (0.0%) |
| 6 to 11 Years | 21 (24.4%) | 11 (19.6%) |
| 12 to 14 Years | 0 (0.0%) | 5 (11.4%) |
| 15 Years | 6 (28.6%) | 0 (0.0%) |
| 16 and 17 Years | 7 (20.6%) | 0 (0.0%) |
| 18 to 24 Years | 0 (0.0%) | 20 (28.2%) |
| 25 to 34 Years | 14 (11.4%) | 33 (18.0%) |
| 35 to 44 Years | 31 (24.4%) | 90 (35.0%) |
| 45 to 54 Years | 5 (3.2%) | 12 (10.3%) |
| 55 to 64 Years | 15 (11.1%) | 17 (9.4%) |
| 65 to 74 Years | 15 (16.1%) | 80 (43.0%) |
| 75 Years and over | 0 (0.0%) | 20 (12.6%) |
| Total | 145 (14.0%) | 292 (21.9%) |
Income Above Poverty by Sex and Age in Reed City
According to the poverty statistics in Reed City, males aged 12 to 14 years and females aged 5 years are the age groups that are most secure financially, with 100.0% of males and 100.0% of females in these age groups living above the poverty line.
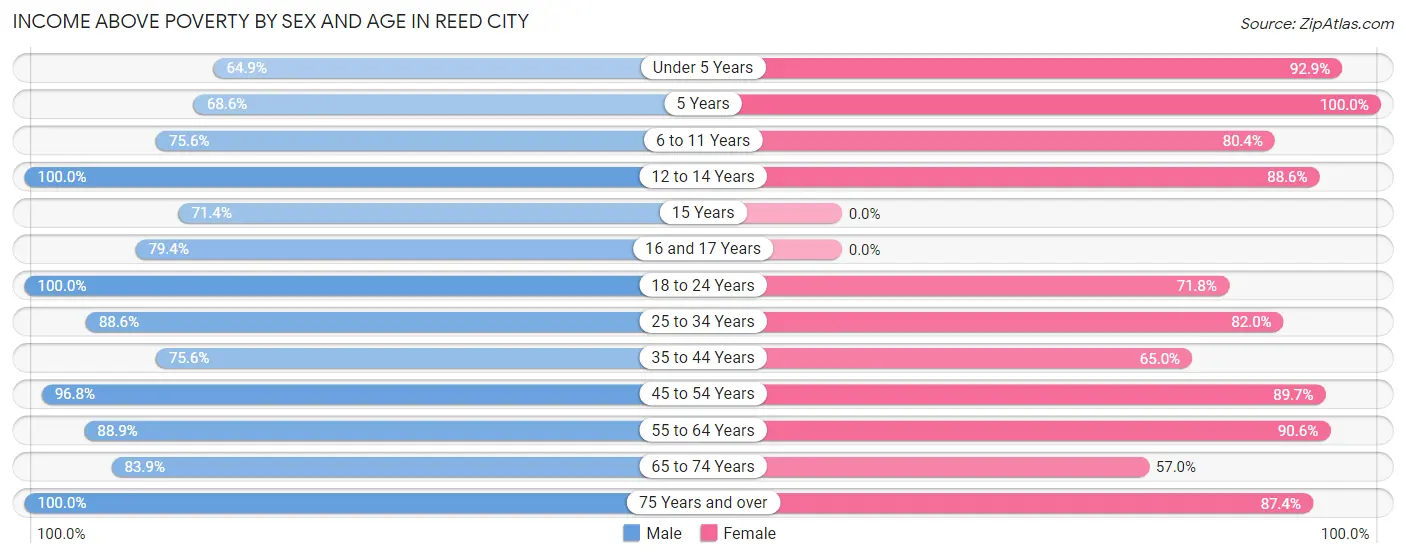
| Age Bracket | Male | Female |
| Under 5 Years | 37 (64.9%) | 52 (92.9%) |
| 5 Years | 24 (68.6%) | 21 (100.0%) |
| 6 to 11 Years | 65 (75.6%) | 45 (80.4%) |
| 12 to 14 Years | 58 (100.0%) | 39 (88.6%) |
| 15 Years | 15 (71.4%) | 0 (0.0%) |
| 16 and 17 Years | 27 (79.4%) | 0 (0.0%) |
| 18 to 24 Years | 51 (100.0%) | 51 (71.8%) |
| 25 to 34 Years | 109 (88.6%) | 150 (82.0%) |
| 35 to 44 Years | 96 (75.6%) | 167 (65.0%) |
| 45 to 54 Years | 152 (96.8%) | 105 (89.7%) |
| 55 to 64 Years | 120 (88.9%) | 164 (90.6%) |
| 65 to 74 Years | 78 (83.9%) | 106 (57.0%) |
| 75 Years and over | 57 (100.0%) | 139 (87.4%) |
| Total | 889 (86.0%) | 1,039 (78.1%) |
Income Below Poverty Among Married-Couple Families in Reed City
The poverty statistics for married-couple families in Reed City show that 7.2% or 28 of the total 391 families live below the poverty line. Families with 5 or more children have the highest poverty rate of 100.0%, comprising of 6 families. On the other hand, families with 3 or 4 children have the lowest poverty rate of 0.0%, which includes 0 families.
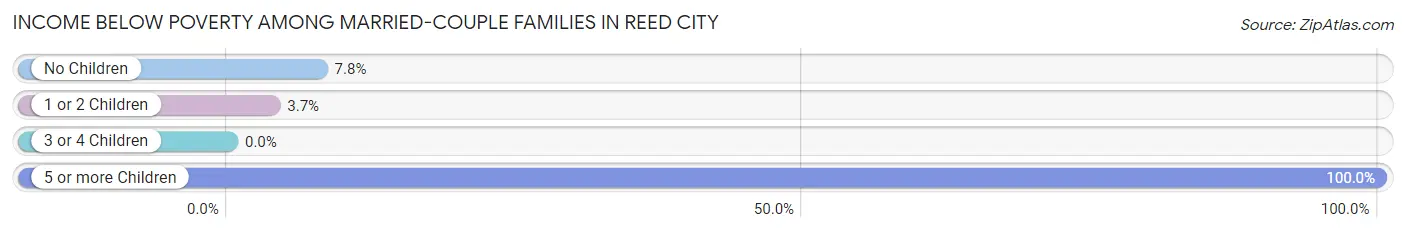
| Children | Above Poverty | Below Poverty |
| No Children | 201 (92.2%) | 17 (7.8%) |
| 1 or 2 Children | 131 (96.3%) | 5 (3.7%) |
| 3 or 4 Children | 31 (100.0%) | 0 (0.0%) |
| 5 or more Children | 0 (0.0%) | 6 (100.0%) |
| Total | 363 (92.8%) | 28 (7.2%) |
Income Below Poverty Among Single-Parent Households in Reed City
According to the poverty data in Reed City, 19.2% or 5 single-father households and 17.4% or 31 single-mother households are living below the poverty line. Among single-father households, those with 3 or 4 children have the highest poverty rate, with 5 households (100.0%) experiencing poverty. Likewise, among single-mother households, those with no children have the highest poverty rate, with 16 households (20.0%) falling below the poverty line.
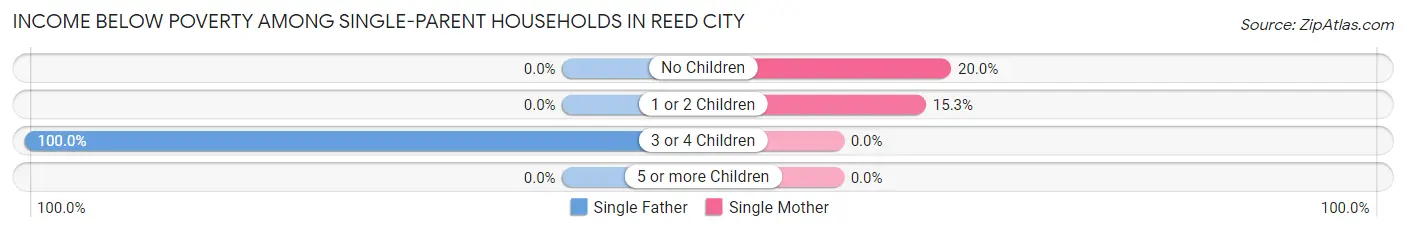
| Children | Single Father | Single Mother |
| No Children | 0 (0.0%) | 16 (20.0%) |
| 1 or 2 Children | 0 (0.0%) | 15 (15.3%) |
| 3 or 4 Children | 5 (100.0%) | 0 (0.0%) |
| 5 or more Children | 0 (0.0%) | 0 (0.0%) |
| Total | 5 (19.2%) | 31 (17.4%) |
Income Below Poverty Among Married-Couple vs Single-Parent Households in Reed City
The poverty data for Reed City shows that 28 of the married-couple family households (7.2%) and 36 of the single-parent households (17.6%) are living below the poverty level. Within the married-couple family households, those with 5 or more children have the highest poverty rate, with 6 households (100.0%) falling below the poverty line. Among the single-parent households, those with 3 or 4 children have the highest poverty rate, with 5 household (100.0%) living below poverty.
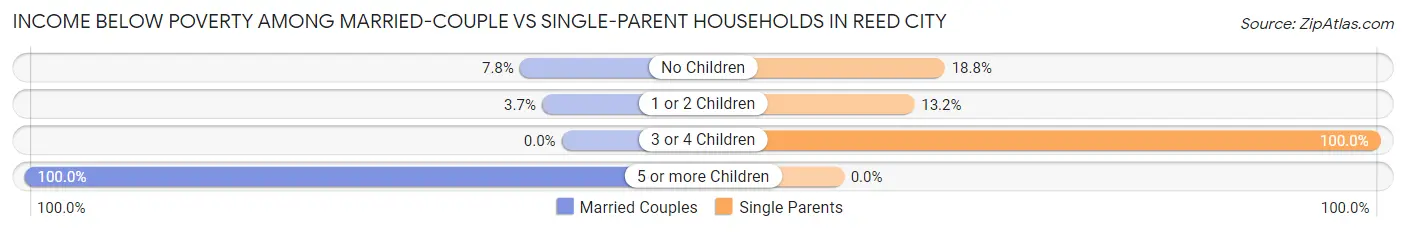
| Children | Married-Couple Families | Single-Parent Households |
| No Children | 17 (7.8%) | 16 (18.8%) |
| 1 or 2 Children | 5 (3.7%) | 15 (13.2%) |
| 3 or 4 Children | 0 (0.0%) | 5 (100.0%) |
| 5 or more Children | 6 (100.0%) | 0 (0.0%) |
| Total | 28 (7.2%) | 36 (17.6%) |
Race in Reed City
The most populous races in Reed City are White / Caucasian (2,336 | 94.2%), Hispanic or Latino (91 | 3.7%), and Two or more Races (91 | 3.7%).
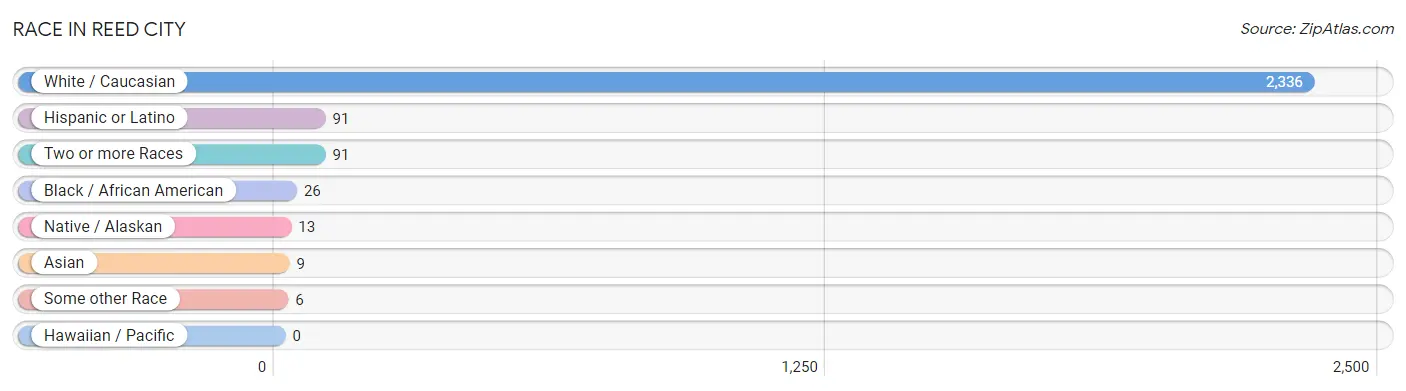
| Race | # Population | % Population |
| Asian | 9 | 0.4% |
| Black / African American | 26 | 1.1% |
| Hawaiian / Pacific | 0 | 0.0% |
| Hispanic or Latino | 91 | 3.7% |
| Native / Alaskan | 13 | 0.5% |
| White / Caucasian | 2,336 | 94.2% |
| Two or more Races | 91 | 3.7% |
| Some other Race | 6 | 0.2% |
| Total | 2,481 | 100.0% |
Ancestry in Reed City
The most populous ancestries reported in Reed City are German (585 | 23.6%), English (457 | 18.4%), Irish (362 | 14.6%), French (110 | 4.4%), and American (108 | 4.3%), together accounting for 65.4% of all Reed City residents.
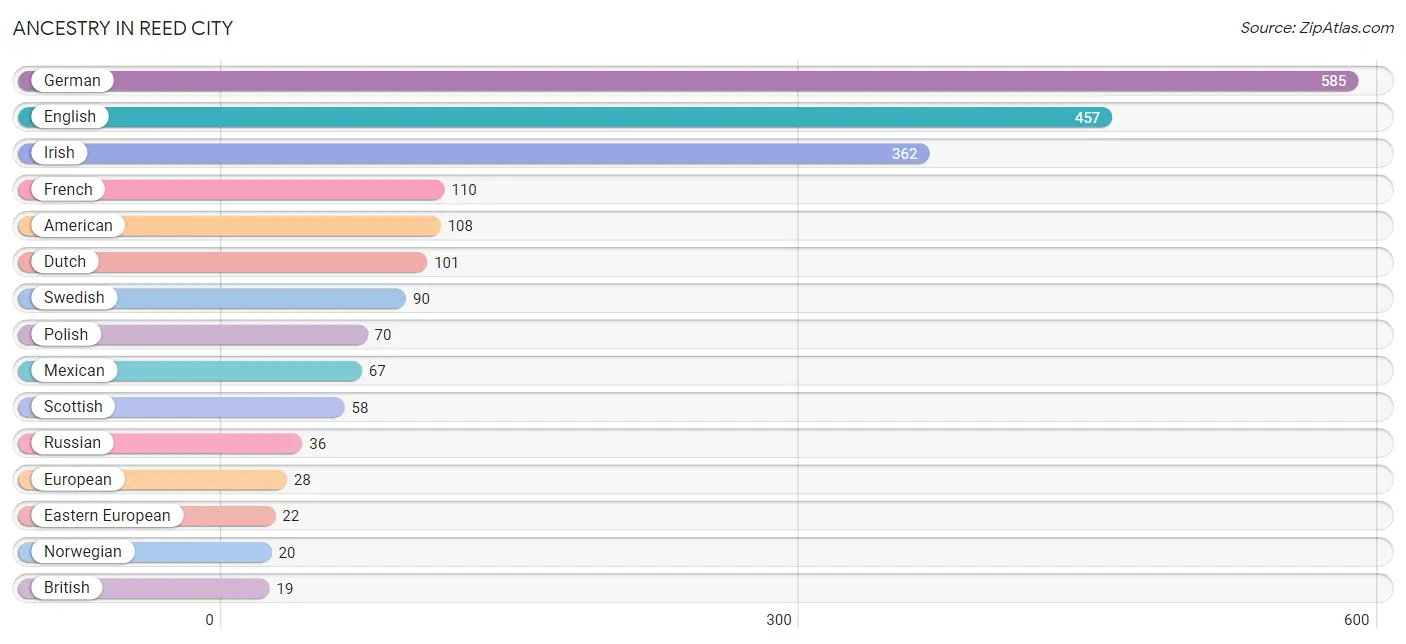
| Ancestry | # Population | % Population |
| American | 108 | 4.3% |
| British | 19 | 0.8% |
| Canadian | 13 | 0.5% |
| Cherokee | 5 | 0.2% |
| Cuban | 5 | 0.2% |
| Danish | 13 | 0.5% |
| Dutch | 101 | 4.1% |
| Eastern European | 22 | 0.9% |
| English | 457 | 18.4% |
| European | 28 | 1.1% |
| Finnish | 6 | 0.2% |
| French | 110 | 4.4% |
| French Canadian | 15 | 0.6% |
| German | 585 | 23.6% |
| Indian (Asian) | 9 | 0.4% |
| Irish | 362 | 14.6% |
| Italian | 17 | 0.7% |
| Lithuanian | 10 | 0.4% |
| Mexican | 67 | 2.7% |
| Norwegian | 20 | 0.8% |
| Okinawan | 8 | 0.3% |
| Pennsylvania German | 6 | 0.2% |
| Polish | 70 | 2.8% |
| Puerto Rican | 19 | 0.8% |
| Russian | 36 | 1.5% |
| Scotch-Irish | 9 | 0.4% |
| Scottish | 58 | 2.3% |
| Sioux | 1 | 0.0% |
| Swedish | 90 | 3.6% |
| Ukrainian | 15 | 0.6% |
| Welsh | 7 | 0.3% | View All 31 Rows |
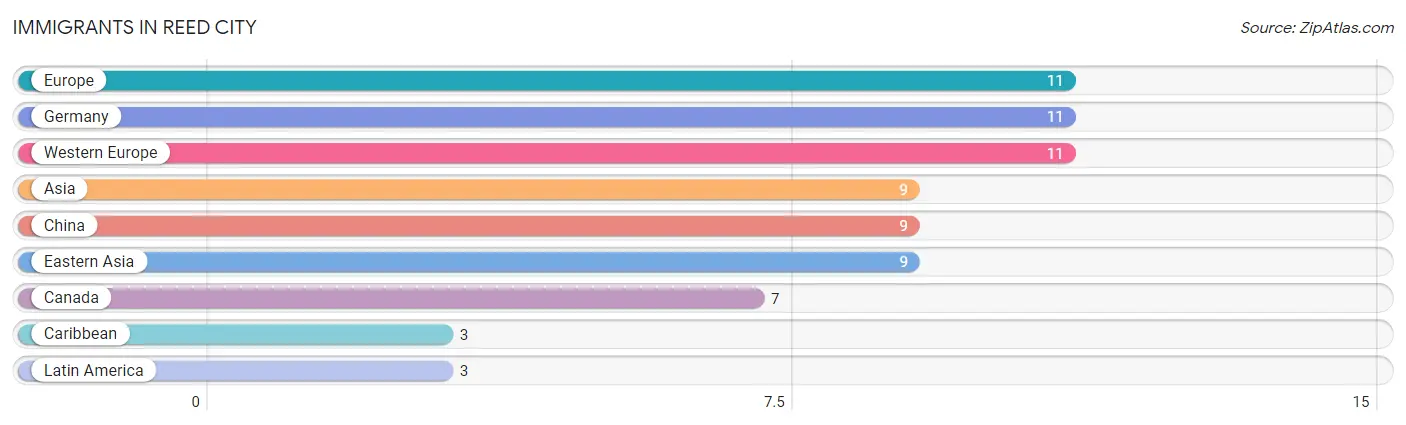
Immigrants in Reed City
The most numerous immigrant groups reported in Reed City came from Europe (11 | 0.4%), Germany (11 | 0.4%), Western Europe (11 | 0.4%), Asia (9 | 0.4%), and China (9 | 0.4%), together accounting for 2.0% of all Reed City residents.
| Immigration Origin | # Population | % Population |
| Asia | 9 | 0.4% |
| Canada | 7 | 0.3% |
| Caribbean | 3 | 0.1% |
| China | 9 | 0.4% |
| Eastern Asia | 9 | 0.4% |
| Europe | 11 | 0.4% |
| Germany | 11 | 0.4% |
| Latin America | 3 | 0.1% |
| Western Europe | 11 | 0.4% | View All 9 Rows |
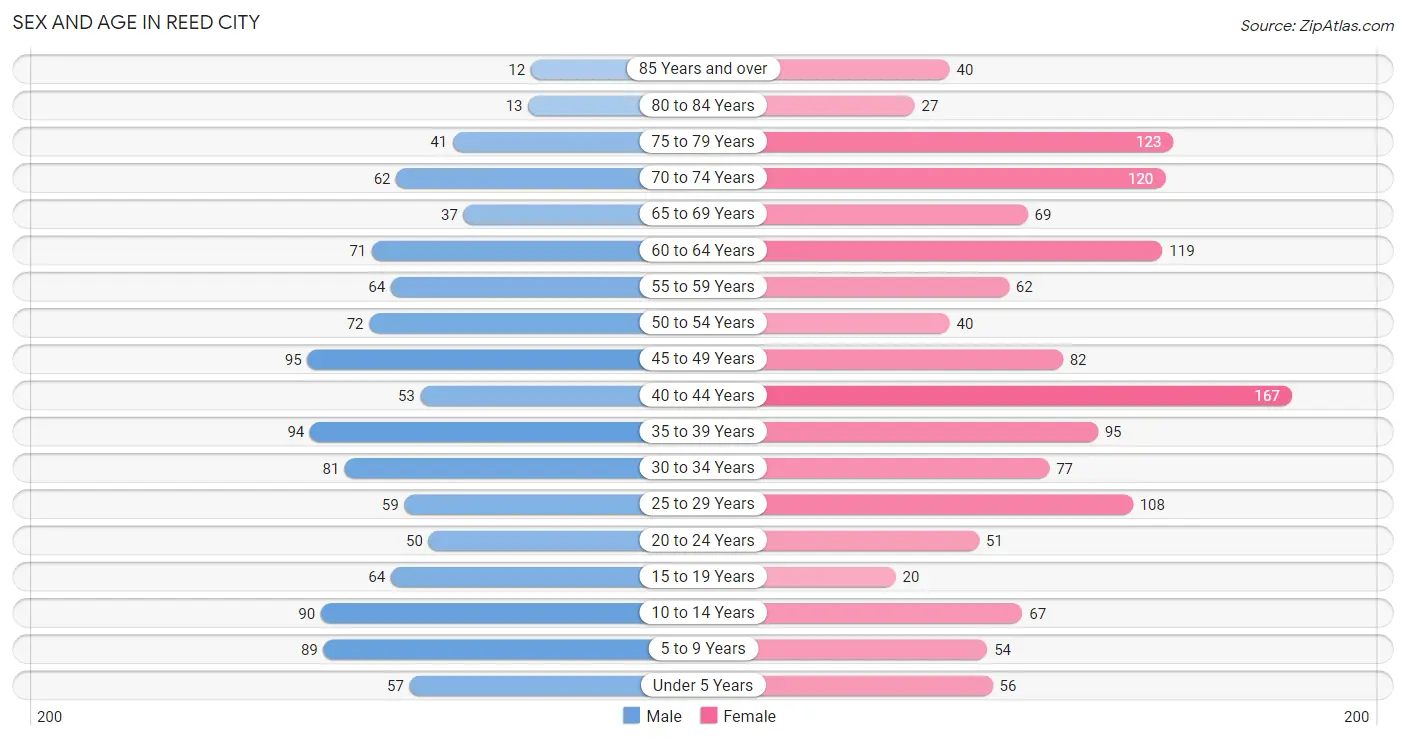
Sex and Age in Reed City
Sex and Age in Reed City
The most populous age groups in Reed City are 45 to 49 Years (95 | 8.6%) for men and 40 to 44 Years (167 | 12.1%) for women.
| Age Bracket | Male | Female |
| Under 5 Years | 57 (5.2%) | 56 (4.1%) |
| 5 to 9 Years | 89 (8.1%) | 54 (3.9%) |
| 10 to 14 Years | 90 (8.2%) | 67 (4.9%) |
| 15 to 19 Years | 64 (5.8%) | 20 (1.5%) |
| 20 to 24 Years | 50 (4.5%) | 51 (3.7%) |
| 25 to 29 Years | 59 (5.3%) | 108 (7.8%) |
| 30 to 34 Years | 81 (7.3%) | 77 (5.6%) |
| 35 to 39 Years | 94 (8.5%) | 95 (6.9%) |
| 40 to 44 Years | 53 (4.8%) | 167 (12.1%) |
| 45 to 49 Years | 95 (8.6%) | 82 (5.9%) |
| 50 to 54 Years | 72 (6.5%) | 40 (2.9%) |
| 55 to 59 Years | 64 (5.8%) | 62 (4.5%) |
| 60 to 64 Years | 71 (6.4%) | 119 (8.6%) |
| 65 to 69 Years | 37 (3.4%) | 69 (5.0%) |
| 70 to 74 Years | 62 (5.6%) | 120 (8.7%) |
| 75 to 79 Years | 41 (3.7%) | 123 (8.9%) |
| 80 to 84 Years | 13 (1.2%) | 27 (2.0%) |
| 85 Years and over | 12 (1.1%) | 40 (2.9%) |
| Total | 1,104 (100.0%) | 1,377 (100.0%) |
Families and Households in Reed City
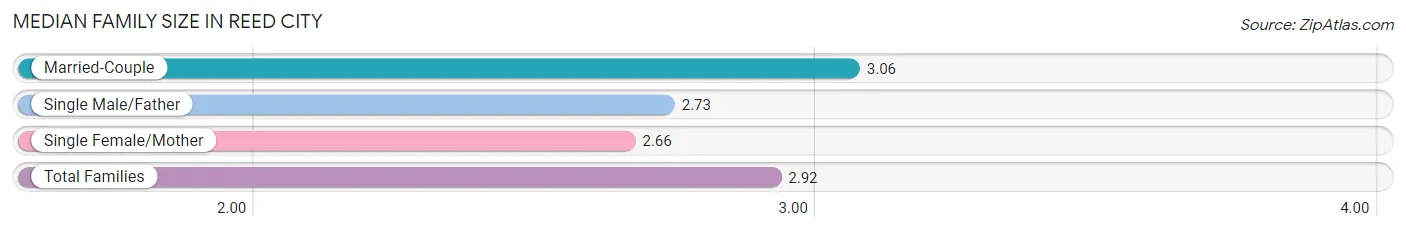
Median Family Size in Reed City
The median family size in Reed City is 2.92 persons per family, with married-couple families (391 | 65.7%) accounting for the largest median family size of 3.06 persons per family. On the other hand, single female/mother families (178 | 29.9%) represent the smallest median family size with 2.66 persons per family.
| Family Type | # Families | Family Size |
| Married-Couple | 391 (65.7%) | 3.06 |
| Single Male/Father | 26 (4.4%) | 2.73 |
| Single Female/Mother | 178 (29.9%) | 2.66 |
| Total Families | 595 (100.0%) | 2.92 |
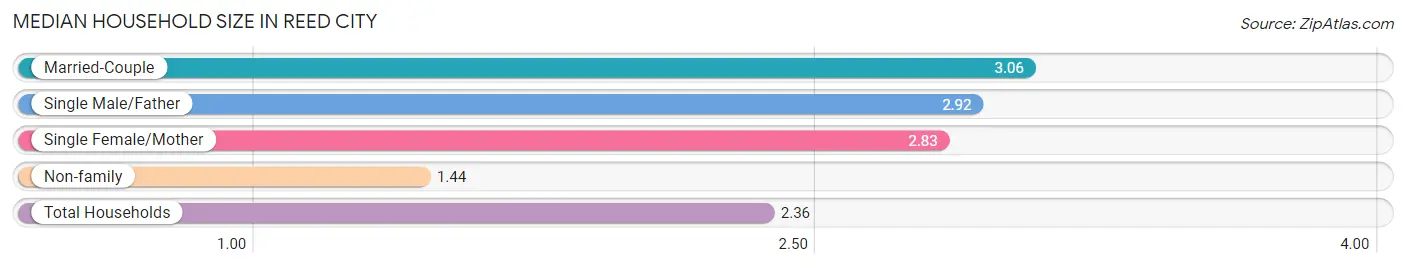
Median Household Size in Reed City
The median household size in Reed City is 2.36 persons per household, with married-couple households (391 | 39.1%) accounting for the largest median household size of 3.06 persons per household. non-family households (404 | 40.4%) represent the smallest median household size with 1.44 persons per household.
| Household Type | # Households | Household Size |
| Married-Couple | 391 (39.1%) | 3.06 |
| Single Male/Father | 26 (2.6%) | 2.92 |
| Single Female/Mother | 178 (17.8%) | 2.83 |
| Non-family | 404 (40.4%) | 1.44 |
| Total Households | 999 (100.0%) | 2.36 |
Household Size by Marriage Status in Reed City
Out of a total of 999 households in Reed City, 595 (59.6%) are family households, while 404 (40.4%) are nonfamily households. The most numerous type of family households are 2-person households, comprising 320, and the most common type of nonfamily households are 1-person households, comprising 354.
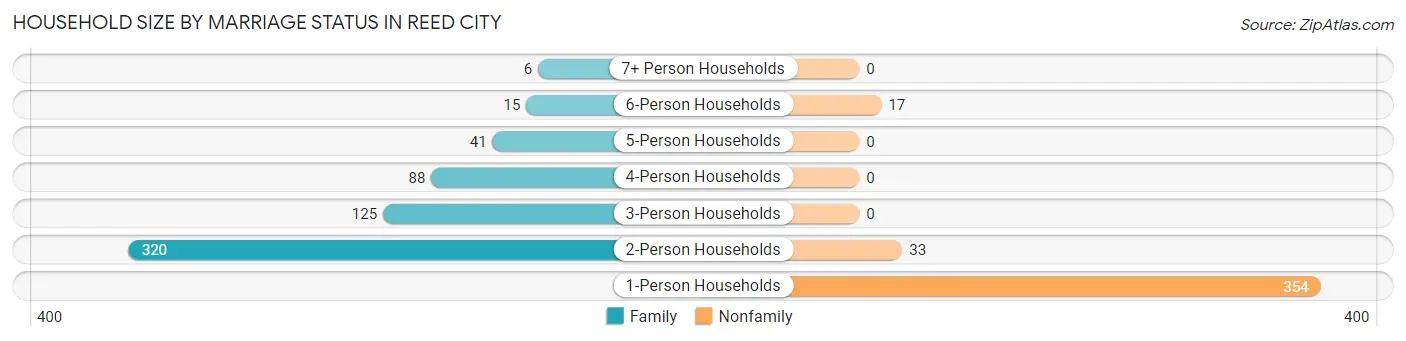
| Household Size | Family Households | Nonfamily Households |
| 1-Person Households | - | 354 (35.4%) |
| 2-Person Households | 320 (32.0%) | 33 (3.3%) |
| 3-Person Households | 125 (12.5%) | 0 (0.0%) |
| 4-Person Households | 88 (8.8%) | 0 (0.0%) |
| 5-Person Households | 41 (4.1%) | 0 (0.0%) |
| 6-Person Households | 15 (1.5%) | 17 (1.7%) |
| 7+ Person Households | 6 (0.6%) | 0 (0.0%) |
| Total | 595 (59.6%) | 404 (40.4%) |
Female Fertility in Reed City
Fertility by Age in Reed City
Average fertility rate in Reed City is 22.0 births per 1,000 women. Women in the age bracket of 20 to 34 years have the highest fertility rate with 30.0 births per 1,000 women. Women in the age bracket of 20 to 34 years acount for 53.8% of all women with births.
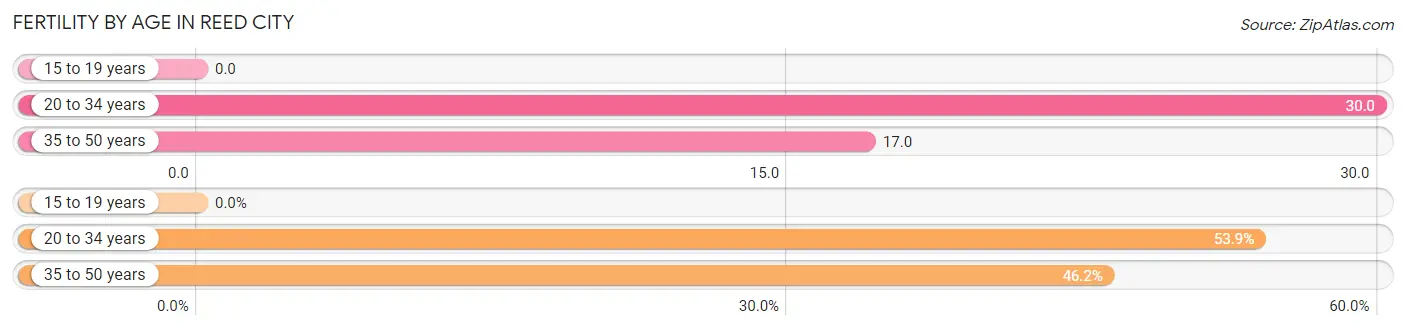
| Age Bracket | Women with Births | Births / 1,000 Women |
| 15 to 19 years | 0 (0.0%) | 0.0 |
| 20 to 34 years | 7 (53.8%) | 30.0 |
| 35 to 50 years | 6 (46.2%) | 17.0 |
| Total | 13 (100.0%) | 22.0 |
Fertility by Age by Marriage Status in Reed City
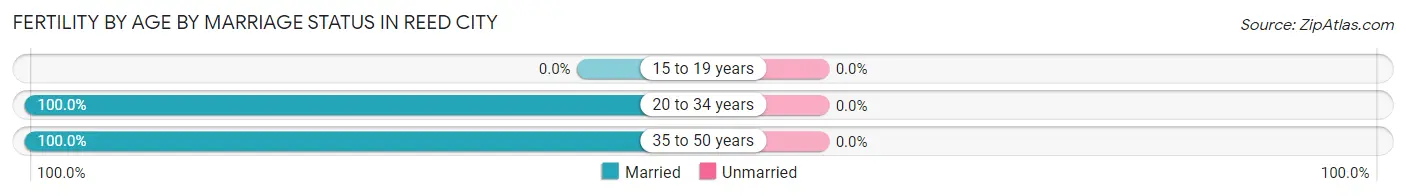
| Age Bracket | Married | Unmarried |
| 15 to 19 years | 0 (0.0%) | 0 (0.0%) |
| 20 to 34 years | 7 (100.0%) | 0 (0.0%) |
| 35 to 50 years | 6 (100.0%) | 0 (0.0%) |
| Total | 13 (100.0%) | 0 (0.0%) |
Fertility by Education in Reed City
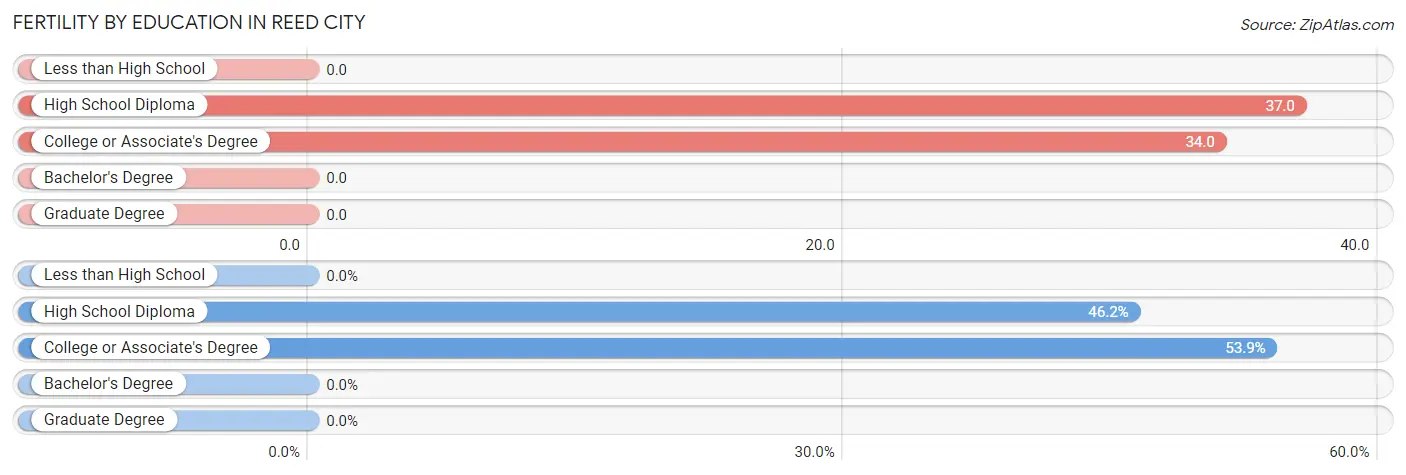
| Educational Attainment | Women with Births | Births / 1,000 Women |
| Less than High School | 0 (0.0%) | 0.0 |
| High School Diploma | 6 (46.2%) | 37.0 |
| College or Associate's Degree | 7 (53.8%) | 34.0 |
| Bachelor's Degree | 0 (0.0%) | 0.0 |
| Graduate Degree | 0 (0.0%) | 0.0 |
| Total | 13 (100.0%) | 22.0 |
Fertility by Education by Marriage Status in Reed City
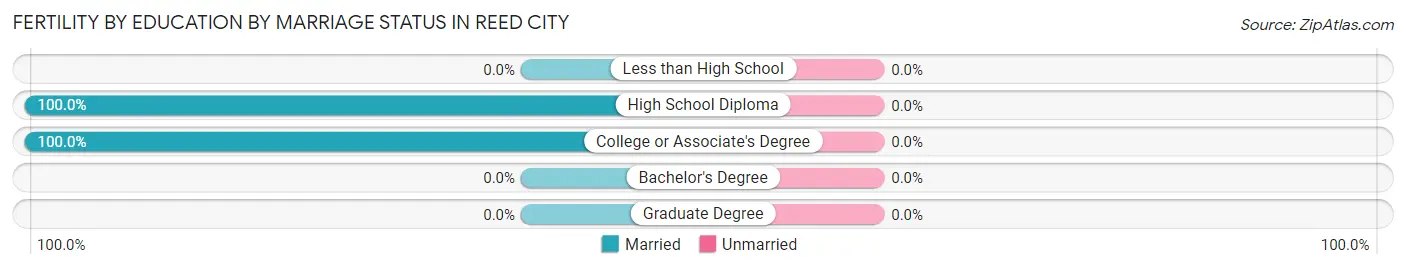
| Educational Attainment | Married | Unmarried |
| Less than High School | 0 (0.0%) | 0 (0.0%) |
| High School Diploma | 6 (100.0%) | 0 (0.0%) |
| College or Associate's Degree | 7 (100.0%) | 0 (0.0%) |
| Bachelor's Degree | 0 (0.0%) | 0 (0.0%) |
| Graduate Degree | 0 (0.0%) | 0 (0.0%) |
| Total | 13 (100.0%) | 0 (0.0%) |
Employment Characteristics in Reed City
Employment by Class of Employer in Reed City
Among the 940 employed individuals in Reed City, private company employees (587 | 62.5%), not-for-profit organizations (104 | 11.1%), and self-employed (incorporated) (87 | 9.3%) make up the most common classes of employment.
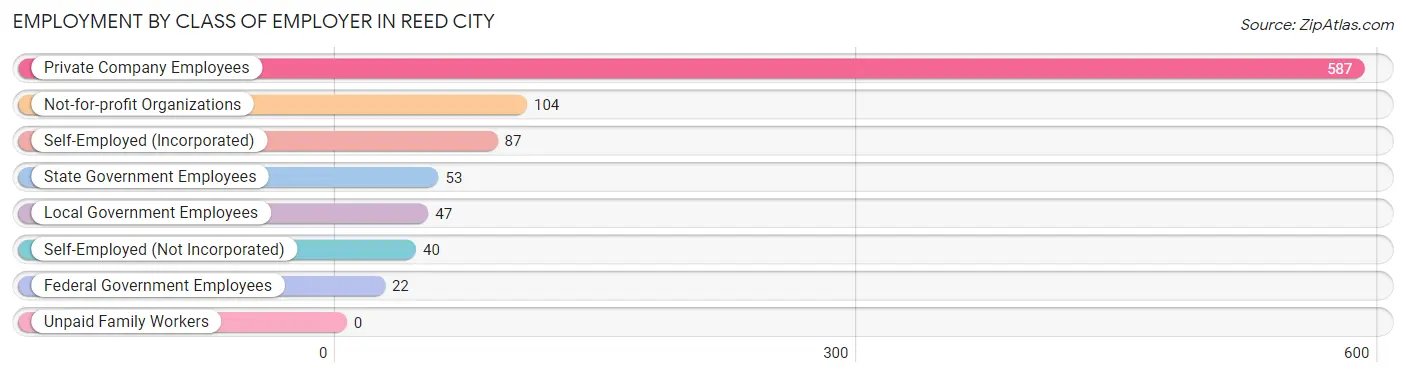
| Employer Class | # Employees | % Employees |
| Private Company Employees | 587 | 62.5% |
| Self-Employed (Incorporated) | 87 | 9.3% |
| Self-Employed (Not Incorporated) | 40 | 4.3% |
| Not-for-profit Organizations | 104 | 11.1% |
| Local Government Employees | 47 | 5.0% |
| State Government Employees | 53 | 5.6% |
| Federal Government Employees | 22 | 2.3% |
| Unpaid Family Workers | 0 | 0.0% |
| Total | 940 | 100.0% |
Employment Status by Age in Reed City
According to the labor force statistics for Reed City, out of the total population over 16 years of age (2,047), 50.4% or 1,032 individuals are in the labor force, with 8.9% or 92 of them unemployed. The age group with the highest labor force participation rate is 20 to 24 years, with 89.1% or 90 individuals in the labor force. Within the labor force, the 20 to 24 years age range has the highest percentage of unemployed individuals, with 36.7% or 33 of them being unemployed.
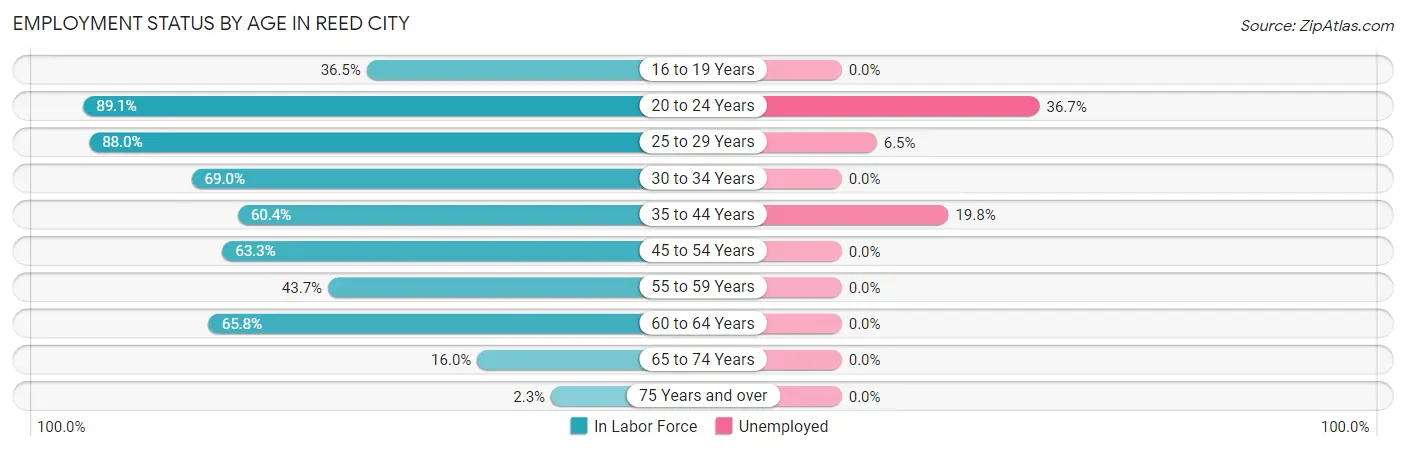
| Age Bracket | In Labor Force | Unemployed |
| 16 to 19 Years | 23 (36.5%) | 0 (0.0%) |
| 20 to 24 Years | 90 (89.1%) | 33 (36.7%) |
| 25 to 29 Years | 147 (88.0%) | 10 (6.5%) |
| 30 to 34 Years | 109 (69.0%) | 0 (0.0%) |
| 35 to 44 Years | 247 (60.4%) | 49 (19.8%) |
| 45 to 54 Years | 183 (63.3%) | 0 (0.0%) |
| 55 to 59 Years | 55 (43.7%) | 0 (0.0%) |
| 60 to 64 Years | 125 (65.8%) | 0 (0.0%) |
| 65 to 74 Years | 46 (16.0%) | 0 (0.0%) |
| 75 Years and over | 6 (2.3%) | 0 (0.0%) |
| Total | 1,032 (50.4%) | 92 (8.9%) |
Employment Status by Educational Attainment in Reed City
According to labor force statistics for Reed City, 64.7% of individuals (866) out of the total population between 25 and 64 years of age (1,339) are in the labor force, with 6.8% or 59 of them being unemployed. The group with the highest labor force participation rate are those with the educational attainment of bachelor's degree or higher, with 83.2% or 257 individuals in the labor force. Within the labor force, individuals with high school diploma education have the highest percentage of unemployment, with 9.3% or 26 of them being unemployed.
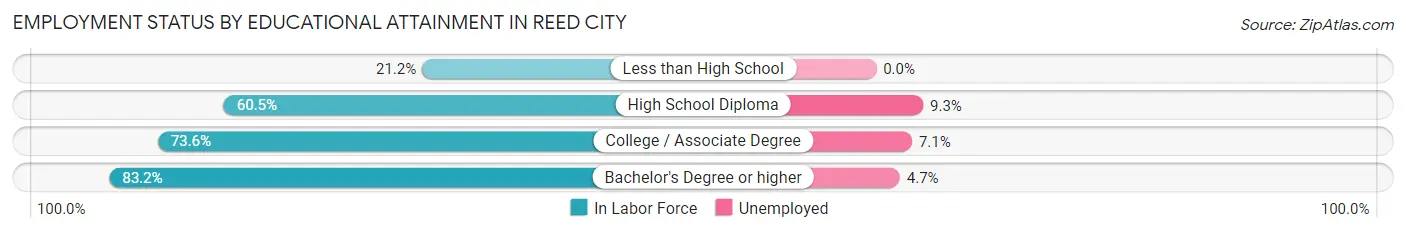
| Educational Attainment | In Labor Force | Unemployed |
| Less than High School | 36 (21.2%) | 0 (0.0%) |
| High School Diploma | 277 (60.5%) | 43 (9.3%) |
| College / Associate Degree | 296 (73.6%) | 29 (7.1%) |
| Bachelor's Degree or higher | 257 (83.2%) | 15 (4.7%) |
| Total | 866 (64.7%) | 91 (6.8%) |
Employment Occupations by Sex in Reed City
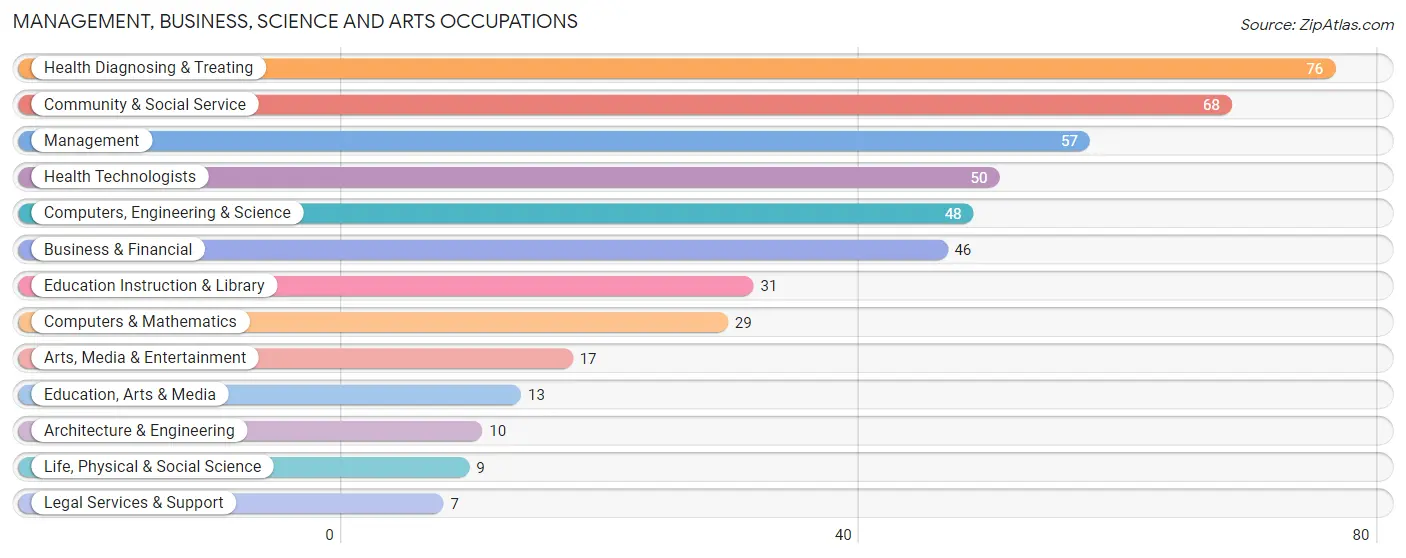
Management, Business, Science and Arts Occupations
The most common Management, Business, Science and Arts occupations in Reed City are Health Diagnosing & Treating (76 | 8.2%), Community & Social Service (68 | 7.3%), Management (57 | 6.1%), Health Technologists (50 | 5.4%), and Computers, Engineering & Science (48 | 5.1%).
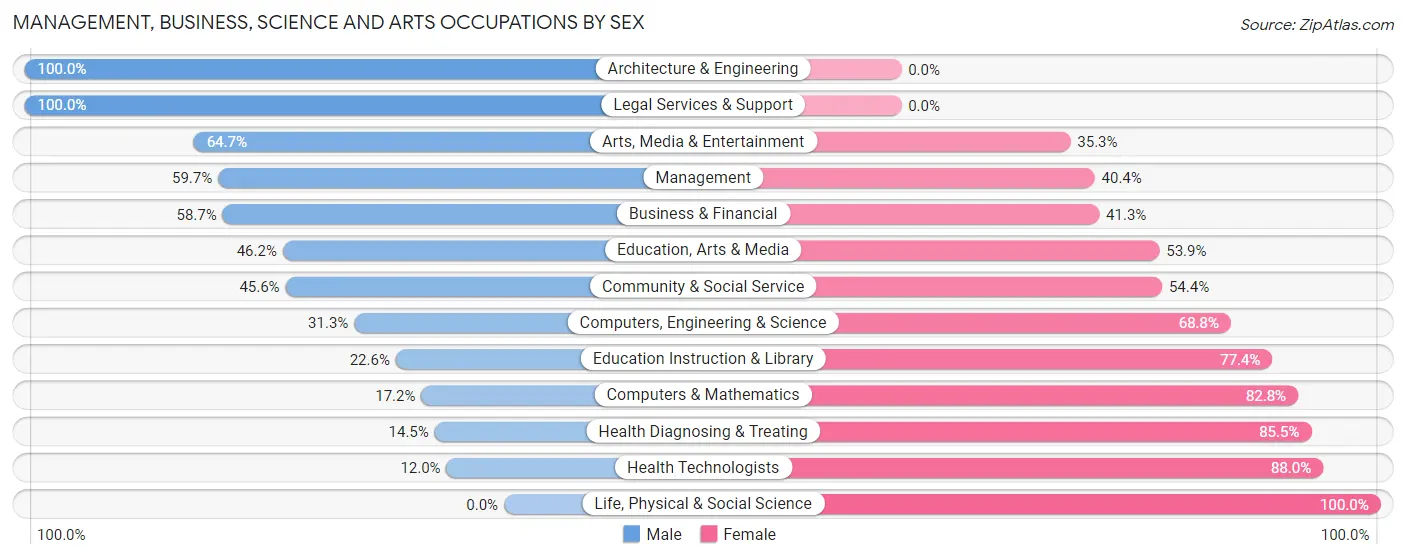
Management, Business, Science and Arts Occupations by Sex
Within the Management, Business, Science and Arts occupations in Reed City, the most male-oriented occupations are Architecture & Engineering (100.0%), Legal Services & Support (100.0%), and Arts, Media & Entertainment (64.7%), while the most female-oriented occupations are Life, Physical & Social Science (100.0%), Health Technologists (88.0%), and Health Diagnosing & Treating (85.5%).
| Occupation | Male | Female |
| Management | 34 (59.7%) | 23 (40.4%) |
| Business & Financial | 27 (58.7%) | 19 (41.3%) |
| Computers, Engineering & Science | 15 (31.2%) | 33 (68.8%) |
| Computers & Mathematics | 5 (17.2%) | 24 (82.8%) |
| Architecture & Engineering | 10 (100.0%) | 0 (0.0%) |
| Life, Physical & Social Science | 0 (0.0%) | 9 (100.0%) |
| Community & Social Service | 31 (45.6%) | 37 (54.4%) |
| Education, Arts & Media | 6 (46.2%) | 7 (53.8%) |
| Legal Services & Support | 7 (100.0%) | 0 (0.0%) |
| Education Instruction & Library | 7 (22.6%) | 24 (77.4%) |
| Arts, Media & Entertainment | 11 (64.7%) | 6 (35.3%) |
| Health Diagnosing & Treating | 11 (14.5%) | 65 (85.5%) |
| Health Technologists | 6 (12.0%) | 44 (88.0%) |
| Total (Category) | 118 (40.0%) | 177 (60.0%) |
| Total (Overall) | 441 (47.3%) | 491 (52.7%) |
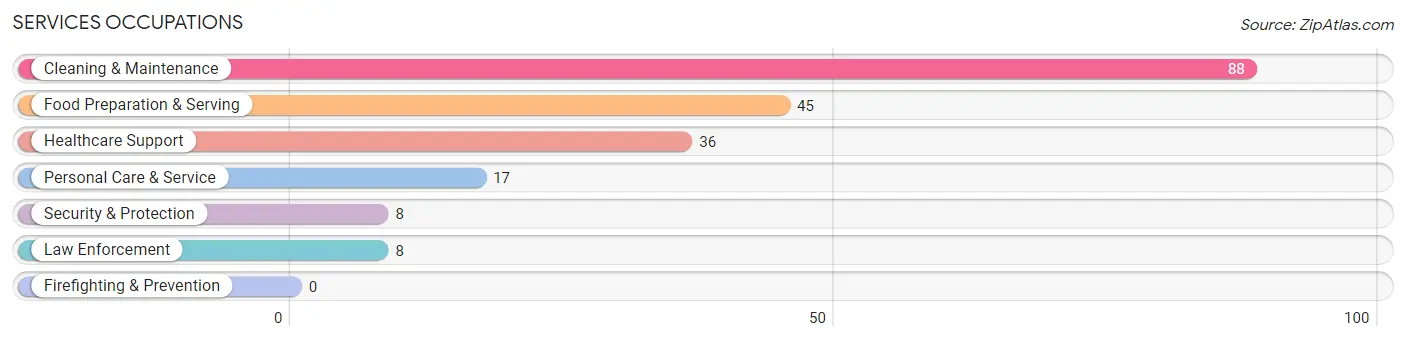
Services Occupations
The most common Services occupations in Reed City are Cleaning & Maintenance (88 | 9.4%), Food Preparation & Serving (45 | 4.8%), Healthcare Support (36 | 3.9%), Personal Care & Service (17 | 1.8%), and Security & Protection (8 | 0.9%).
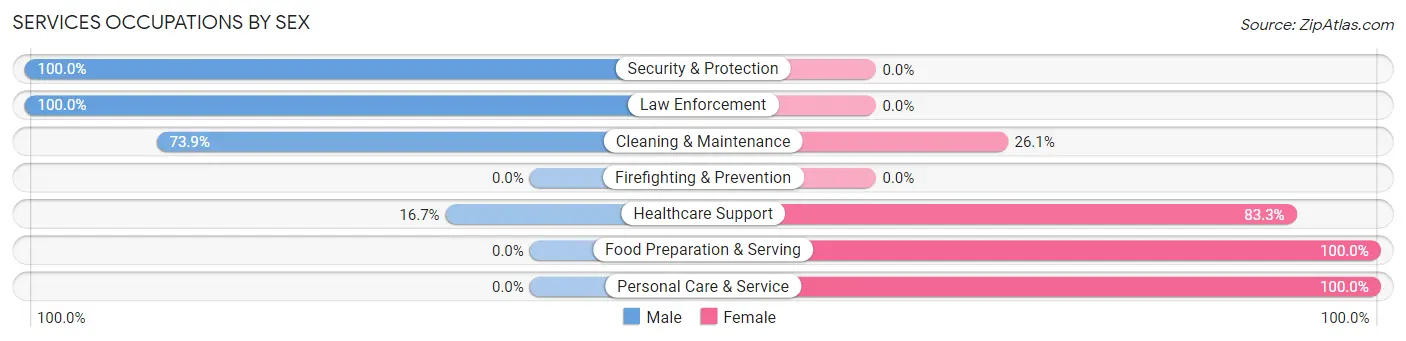
Services Occupations by Sex
Within the Services occupations in Reed City, the most male-oriented occupations are Security & Protection (100.0%), Law Enforcement (100.0%), and Cleaning & Maintenance (73.9%), while the most female-oriented occupations are Food Preparation & Serving (100.0%), Personal Care & Service (100.0%), and Healthcare Support (83.3%).
| Occupation | Male | Female |
| Healthcare Support | 6 (16.7%) | 30 (83.3%) |
| Security & Protection | 8 (100.0%) | 0 (0.0%) |
| Firefighting & Prevention | 0 (0.0%) | 0 (0.0%) |
| Law Enforcement | 8 (100.0%) | 0 (0.0%) |
| Food Preparation & Serving | 0 (0.0%) | 45 (100.0%) |
| Cleaning & Maintenance | 65 (73.9%) | 23 (26.1%) |
| Personal Care & Service | 0 (0.0%) | 17 (100.0%) |
| Total (Category) | 79 (40.7%) | 115 (59.3%) |
| Total (Overall) | 441 (47.3%) | 491 (52.7%) |
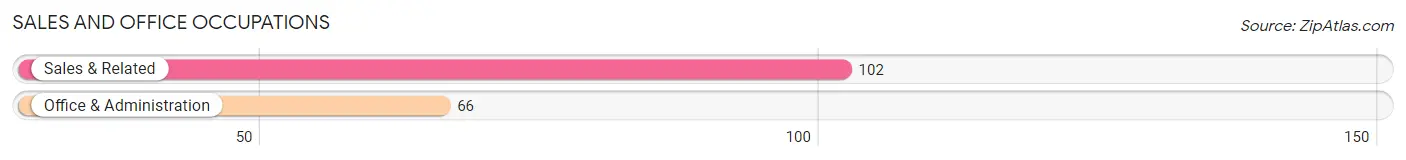
Sales and Office Occupations
The most common Sales and Office occupations in Reed City are Sales & Related (102 | 10.9%), and Office & Administration (66 | 7.1%).
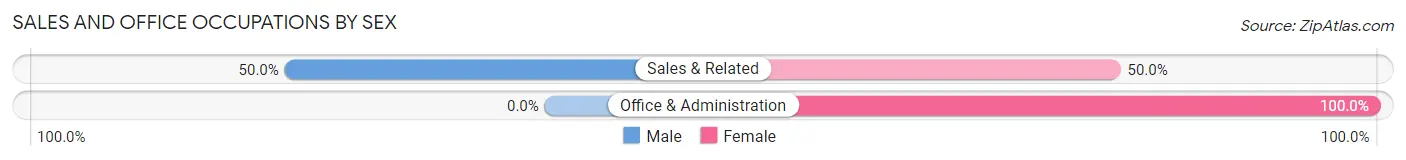
Sales and Office Occupations by Sex
| Occupation | Male | Female |
| Sales & Related | 51 (50.0%) | 51 (50.0%) |
| Office & Administration | 0 (0.0%) | 66 (100.0%) |
| Total (Category) | 51 (30.4%) | 117 (69.6%) |
| Total (Overall) | 441 (47.3%) | 491 (52.7%) |
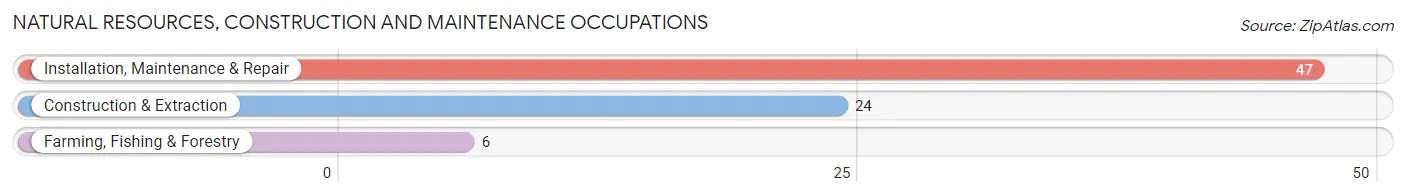
Natural Resources, Construction and Maintenance Occupations
The most common Natural Resources, Construction and Maintenance occupations in Reed City are Installation, Maintenance & Repair (47 | 5.0%), Construction & Extraction (24 | 2.6%), and Farming, Fishing & Forestry (6 | 0.6%).
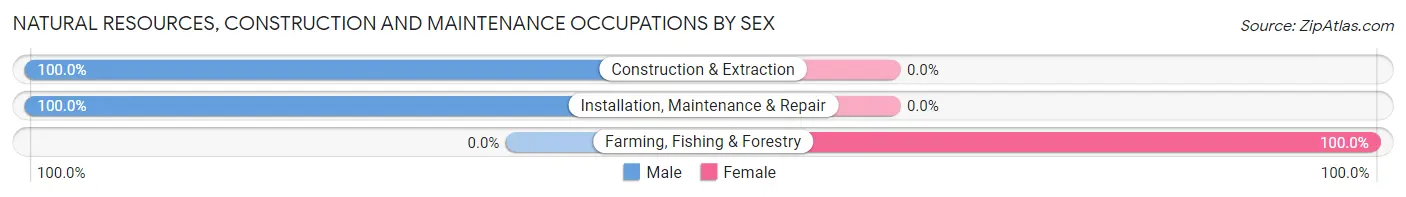
Natural Resources, Construction and Maintenance Occupations by Sex
| Occupation | Male | Female |
| Farming, Fishing & Forestry | 0 (0.0%) | 6 (100.0%) |
| Construction & Extraction | 24 (100.0%) | 0 (0.0%) |
| Installation, Maintenance & Repair | 47 (100.0%) | 0 (0.0%) |
| Total (Category) | 71 (92.2%) | 6 (7.8%) |
| Total (Overall) | 441 (47.3%) | 491 (52.7%) |
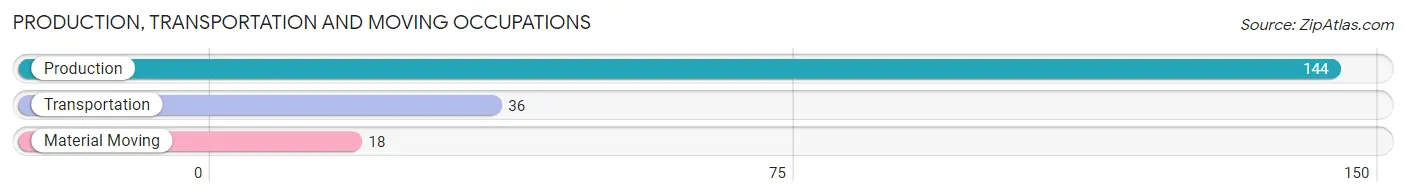
Production, Transportation and Moving Occupations
The most common Production, Transportation and Moving occupations in Reed City are Production (144 | 15.4%), Transportation (36 | 3.9%), and Material Moving (18 | 1.9%).
Production, Transportation and Moving Occupations by Sex
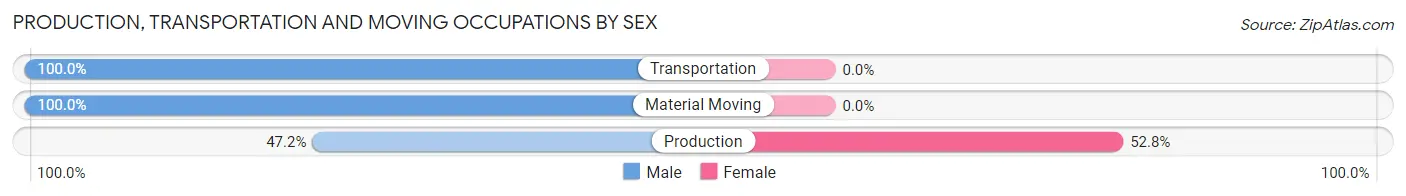
| Occupation | Male | Female |
| Production | 68 (47.2%) | 76 (52.8%) |
| Transportation | 36 (100.0%) | 0 (0.0%) |
| Material Moving | 18 (100.0%) | 0 (0.0%) |
| Total (Category) | 122 (61.6%) | 76 (38.4%) |
| Total (Overall) | 441 (47.3%) | 491 (52.7%) |
Employment Industries by Sex in Reed City
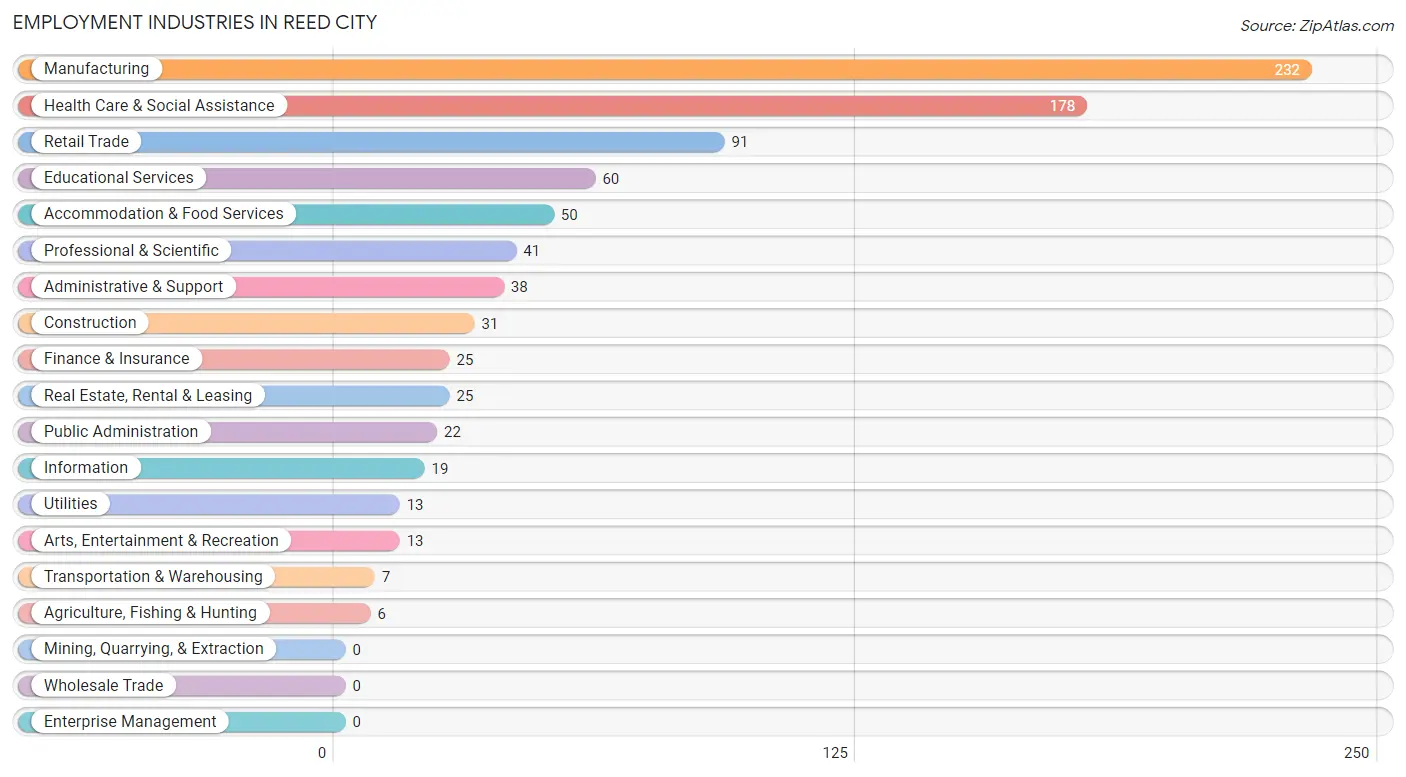
Employment Industries in Reed City
The major employment industries in Reed City include Manufacturing (232 | 24.9%), Health Care & Social Assistance (178 | 19.1%), Retail Trade (91 | 9.8%), Educational Services (60 | 6.4%), and Accommodation & Food Services (50 | 5.4%).
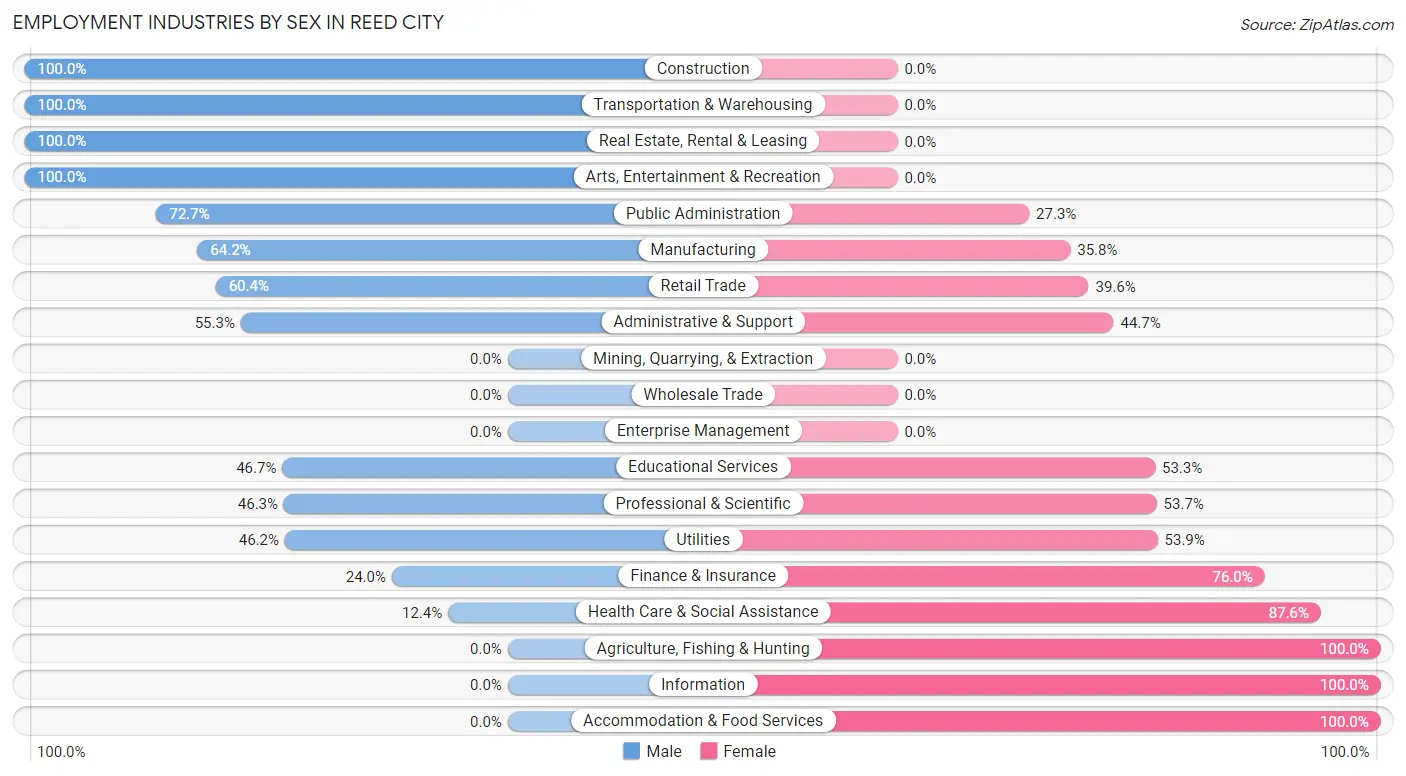
Employment Industries by Sex in Reed City
The Reed City industries that see more men than women are Construction (100.0%), Transportation & Warehousing (100.0%), and Real Estate, Rental & Leasing (100.0%), whereas the industries that tend to have a higher number of women are Agriculture, Fishing & Hunting (100.0%), Information (100.0%), and Accommodation & Food Services (100.0%).
| Industry | Male | Female |
| Agriculture, Fishing & Hunting | 0 (0.0%) | 6 (100.0%) |
| Mining, Quarrying, & Extraction | 0 (0.0%) | 0 (0.0%) |
| Construction | 31 (100.0%) | 0 (0.0%) |
| Manufacturing | 149 (64.2%) | 83 (35.8%) |
| Wholesale Trade | 0 (0.0%) | 0 (0.0%) |
| Retail Trade | 55 (60.4%) | 36 (39.6%) |
| Transportation & Warehousing | 7 (100.0%) | 0 (0.0%) |
| Utilities | 6 (46.2%) | 7 (53.8%) |
| Information | 0 (0.0%) | 19 (100.0%) |
| Finance & Insurance | 6 (24.0%) | 19 (76.0%) |
| Real Estate, Rental & Leasing | 25 (100.0%) | 0 (0.0%) |
| Professional & Scientific | 19 (46.3%) | 22 (53.7%) |
| Enterprise Management | 0 (0.0%) | 0 (0.0%) |
| Administrative & Support | 21 (55.3%) | 17 (44.7%) |
| Educational Services | 28 (46.7%) | 32 (53.3%) |
| Health Care & Social Assistance | 22 (12.4%) | 156 (87.6%) |
| Arts, Entertainment & Recreation | 13 (100.0%) | 0 (0.0%) |
| Accommodation & Food Services | 0 (0.0%) | 50 (100.0%) |
| Public Administration | 16 (72.7%) | 6 (27.3%) |
| Total | 441 (47.3%) | 491 (52.7%) |
Education in Reed City
School Enrollment in Reed City
The most common levels of schooling among the 372 students in Reed City are middle school (139 | 37.4%), elementary school (83 | 22.3%), and high school (53 | 14.2%).
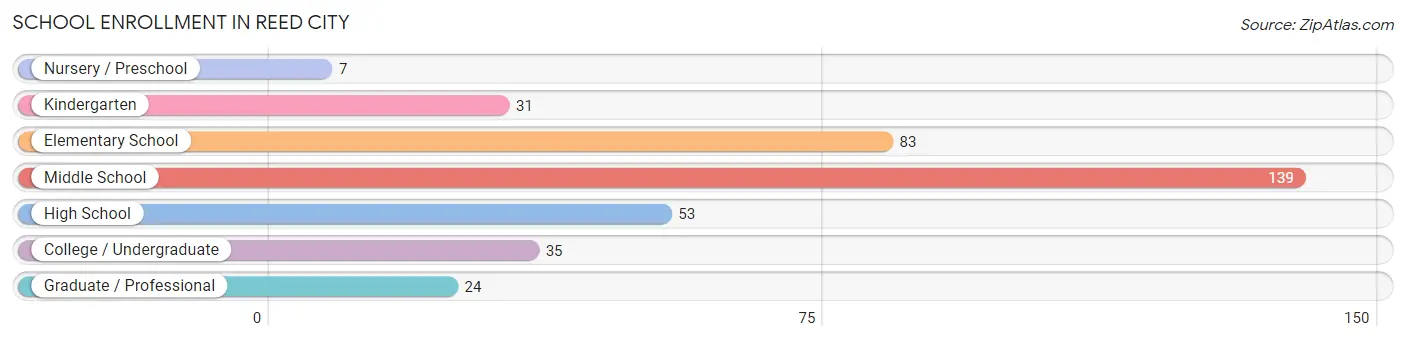
| School Level | # Students | % Students |
| Nursery / Preschool | 7 | 1.9% |
| Kindergarten | 31 | 8.3% |
| Elementary School | 83 | 22.3% |
| Middle School | 139 | 37.4% |
| High School | 53 | 14.2% |
| College / Undergraduate | 35 | 9.4% |
| Graduate / Professional | 24 | 6.5% |
| Total | 372 | 100.0% |
School Enrollment by Age by Funding Source in Reed City
Out of a total of 372 students who are enrolled in schools in Reed City, 77 (20.7%) attend a private institution, while the remaining 295 (79.3%) are enrolled in public schools. The age group of 35 years and over has the highest likelihood of being enrolled in private schools, with 29 (80.6% in the age bracket) enrolled. Conversely, the age group of 3 to 4 year olds has the lowest likelihood of being enrolled in a private school, with 7 (100.0% in the age bracket) attending a public institution.
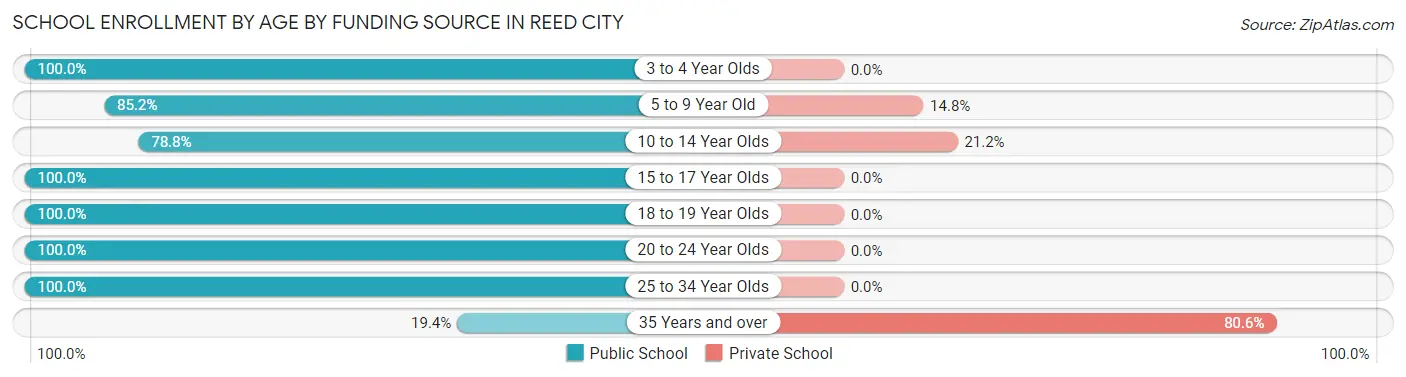
| Age Bracket | Public School | Private School |
| 3 to 4 Year Olds | 7 (100.0%) | 0 (0.0%) |
| 5 to 9 Year Old | 92 (85.2%) | 16 (14.8%) |
| 10 to 14 Year Olds | 119 (78.8%) | 32 (21.2%) |
| 15 to 17 Year Olds | 38 (100.0%) | 0 (0.0%) |
| 18 to 19 Year Olds | 9 (100.0%) | 0 (0.0%) |
| 20 to 24 Year Olds | 16 (100.0%) | 0 (0.0%) |
| 25 to 34 Year Olds | 7 (100.0%) | 0 (0.0%) |
| 35 Years and over | 7 (19.4%) | 29 (80.6%) |
| Total | 295 (79.3%) | 77 (20.7%) |
Educational Attainment by Field of Study in Reed City
Business (92 | 22.7%), education (83 | 20.4%), science & technology (47 | 11.6%), arts & humanities (34 | 8.4%), and computers & mathematics (33 | 8.1%) are the most common fields of study among 406 individuals in Reed City who have obtained a bachelor's degree or higher.
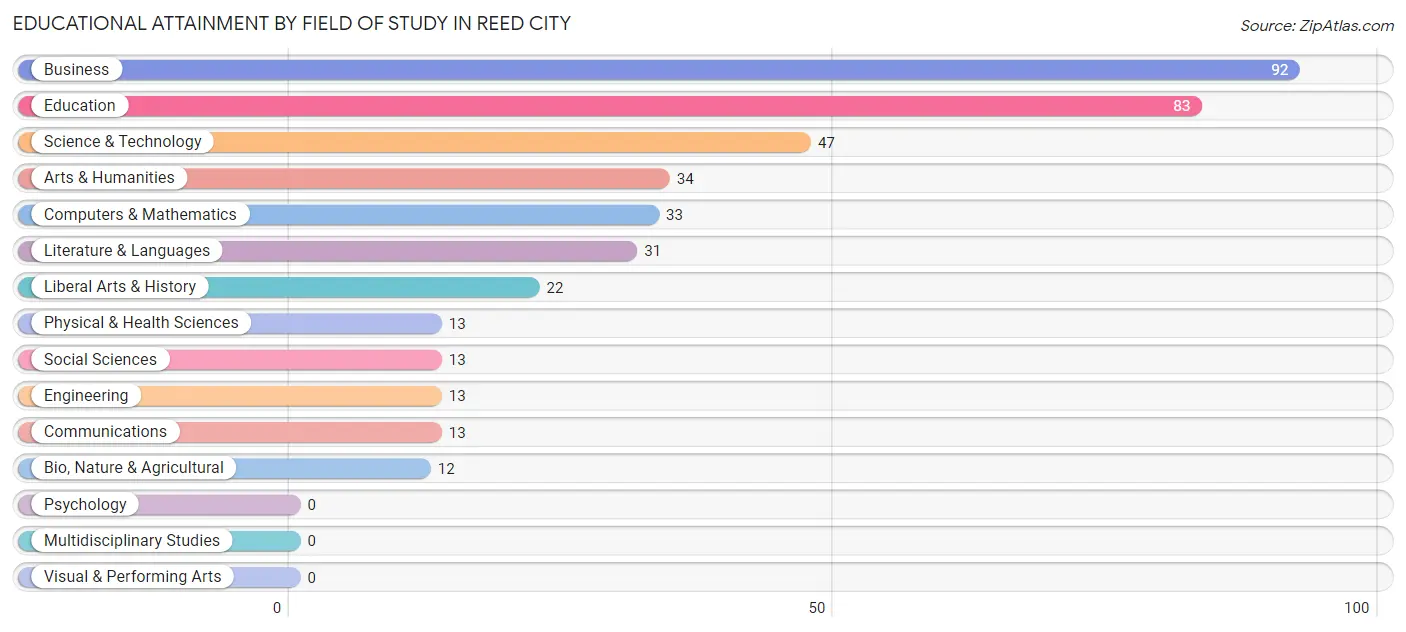
| Field of Study | # Graduates | % Graduates |
| Computers & Mathematics | 33 | 8.1% |
| Bio, Nature & Agricultural | 12 | 3.0% |
| Physical & Health Sciences | 13 | 3.2% |
| Psychology | 0 | 0.0% |
| Social Sciences | 13 | 3.2% |
| Engineering | 13 | 3.2% |
| Multidisciplinary Studies | 0 | 0.0% |
| Science & Technology | 47 | 11.6% |
| Business | 92 | 22.7% |
| Education | 83 | 20.4% |
| Literature & Languages | 31 | 7.6% |
| Liberal Arts & History | 22 | 5.4% |
| Visual & Performing Arts | 0 | 0.0% |
| Communications | 13 | 3.2% |
| Arts & Humanities | 34 | 8.4% |
| Total | 406 | 100.0% |
Transportation & Commute in Reed City
Vehicle Availability by Sex in Reed City
The most prevalent vehicle ownership categories in Reed City are males with 2 vehicles (278, accounting for 61.9%) and females with 2 vehicles (202, making up 56.6%).
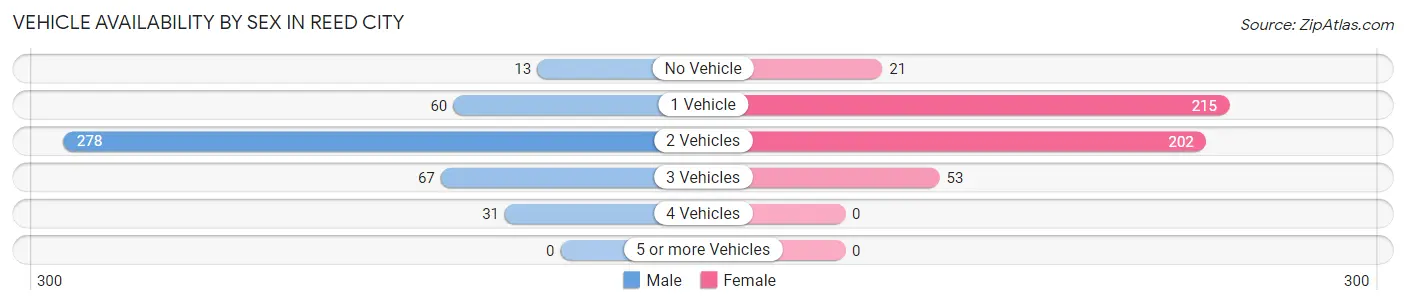
| Vehicles Available | Male | Female |
| No Vehicle | 13 (2.9%) | 21 (4.3%) |
| 1 Vehicle | 60 (13.4%) | 215 (43.8%) |
| 2 Vehicles | 278 (61.9%) | 202 (41.1%) |
| 3 Vehicles | 67 (14.9%) | 53 (10.8%) |
| 4 Vehicles | 31 (6.9%) | 0 (0.0%) |
| 5 or more Vehicles | 0 (0.0%) | 0 (0.0%) |
| Total | 449 (100.0%) | 491 (100.0%) |
Commute Time in Reed City
The most frequently occuring commute durations in Reed City are 20 to 24 minutes (153 commuters, 17.8%), less than 5 minutes (127 commuters, 14.8%), and 30 to 34 minutes (115 commuters, 13.4%).
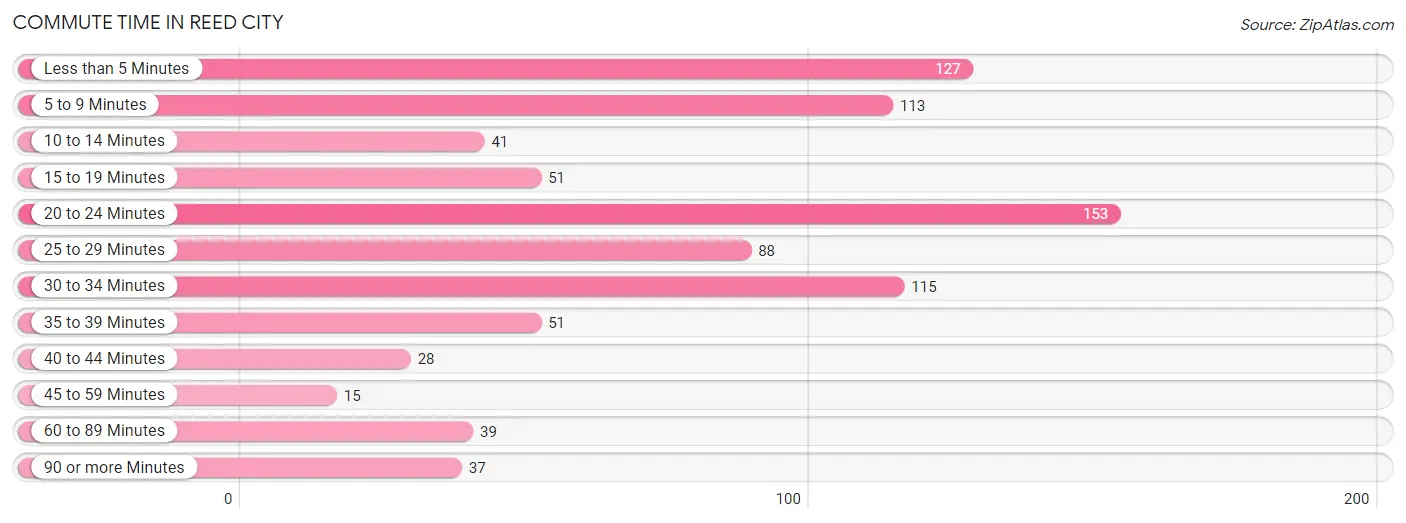
| Commute Time | # Commuters | % Commuters |
| Less than 5 Minutes | 127 | 14.8% |
| 5 to 9 Minutes | 113 | 13.2% |
| 10 to 14 Minutes | 41 | 4.8% |
| 15 to 19 Minutes | 51 | 5.9% |
| 20 to 24 Minutes | 153 | 17.8% |
| 25 to 29 Minutes | 88 | 10.3% |
| 30 to 34 Minutes | 115 | 13.4% |
| 35 to 39 Minutes | 51 | 5.9% |
| 40 to 44 Minutes | 28 | 3.3% |
| 45 to 59 Minutes | 15 | 1.8% |
| 60 to 89 Minutes | 39 | 4.5% |
| 90 or more Minutes | 37 | 4.3% |
Commute Time by Sex in Reed City
The most common commute times in Reed City are 30 to 34 minutes (90 commuters, 21.2%) for males and less than 5 minutes (85 commuters, 19.6%) for females.
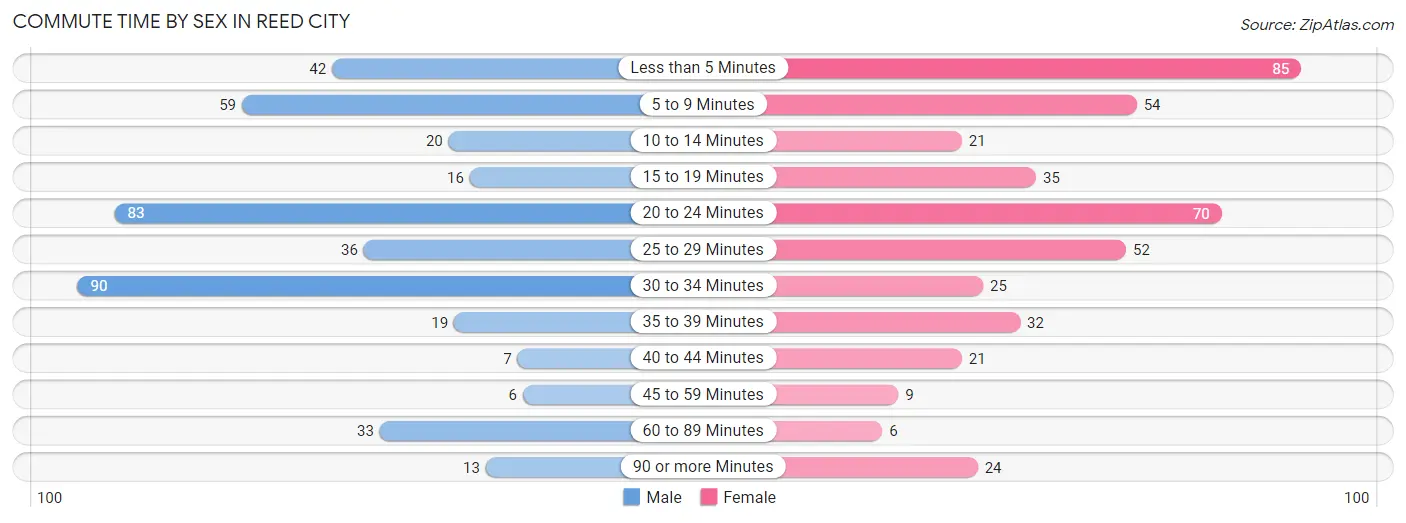
| Commute Time | Male | Female |
| Less than 5 Minutes | 42 (9.9%) | 85 (19.6%) |
| 5 to 9 Minutes | 59 (13.9%) | 54 (12.4%) |
| 10 to 14 Minutes | 20 (4.7%) | 21 (4.8%) |
| 15 to 19 Minutes | 16 (3.8%) | 35 (8.1%) |
| 20 to 24 Minutes | 83 (19.6%) | 70 (16.1%) |
| 25 to 29 Minutes | 36 (8.5%) | 52 (12.0%) |
| 30 to 34 Minutes | 90 (21.2%) | 25 (5.8%) |
| 35 to 39 Minutes | 19 (4.5%) | 32 (7.4%) |
| 40 to 44 Minutes | 7 (1.7%) | 21 (4.8%) |
| 45 to 59 Minutes | 6 (1.4%) | 9 (2.1%) |
| 60 to 89 Minutes | 33 (7.8%) | 6 (1.4%) |
| 90 or more Minutes | 13 (3.1%) | 24 (5.5%) |
Time of Departure to Work by Sex in Reed City
The most frequent times of departure to work in Reed City are 7:30 AM to 7:59 AM (65, 15.3%) for males and 7:30 AM to 7:59 AM (98, 22.6%) for females.
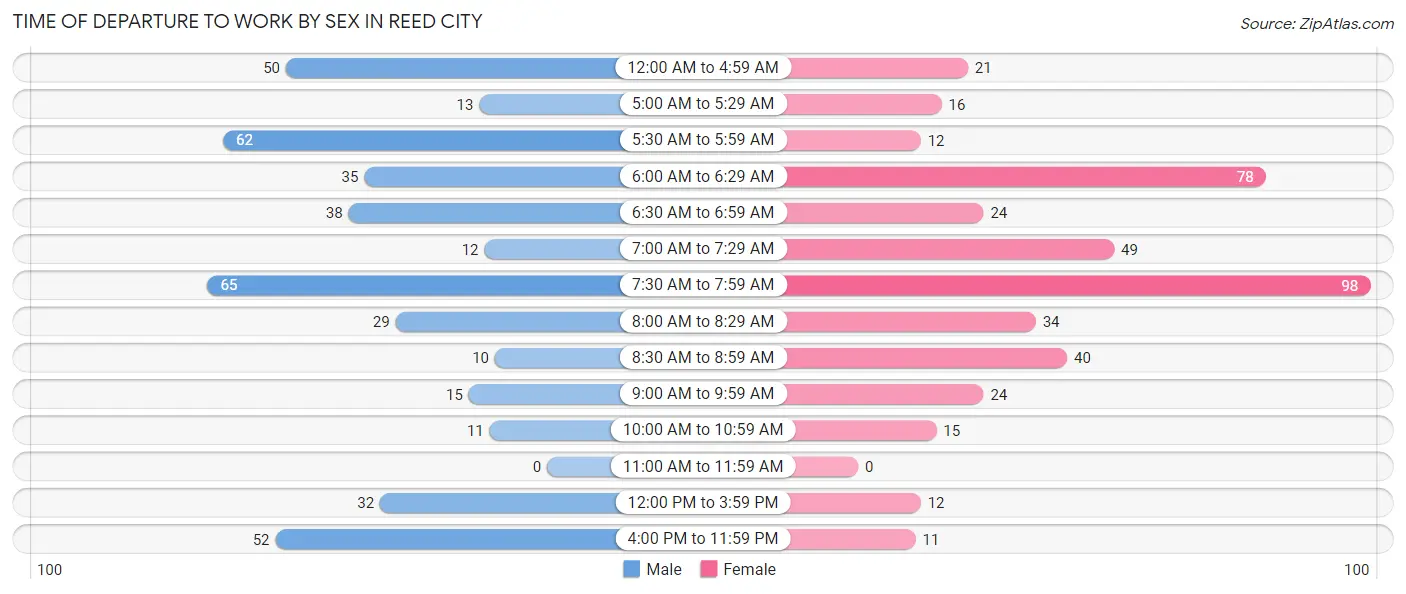
| Time of Departure | Male | Female |
| 12:00 AM to 4:59 AM | 50 (11.8%) | 21 (4.8%) |
| 5:00 AM to 5:29 AM | 13 (3.1%) | 16 (3.7%) |
| 5:30 AM to 5:59 AM | 62 (14.6%) | 12 (2.8%) |
| 6:00 AM to 6:29 AM | 35 (8.3%) | 78 (18.0%) |
| 6:30 AM to 6:59 AM | 38 (9.0%) | 24 (5.5%) |
| 7:00 AM to 7:29 AM | 12 (2.8%) | 49 (11.3%) |
| 7:30 AM to 7:59 AM | 65 (15.3%) | 98 (22.6%) |
| 8:00 AM to 8:29 AM | 29 (6.8%) | 34 (7.8%) |
| 8:30 AM to 8:59 AM | 10 (2.4%) | 40 (9.2%) |
| 9:00 AM to 9:59 AM | 15 (3.5%) | 24 (5.5%) |
| 10:00 AM to 10:59 AM | 11 (2.6%) | 15 (3.5%) |
| 11:00 AM to 11:59 AM | 0 (0.0%) | 0 (0.0%) |
| 12:00 PM to 3:59 PM | 32 (7.5%) | 12 (2.8%) |
| 4:00 PM to 11:59 PM | 52 (12.3%) | 11 (2.5%) |
| Total | 424 (100.0%) | 434 (100.0%) |
Housing Occupancy in Reed City
Occupancy by Ownership in Reed City
Of the total 999 dwellings in Reed City, owner-occupied units account for 633 (63.4%), while renter-occupied units make up 366 (36.6%).
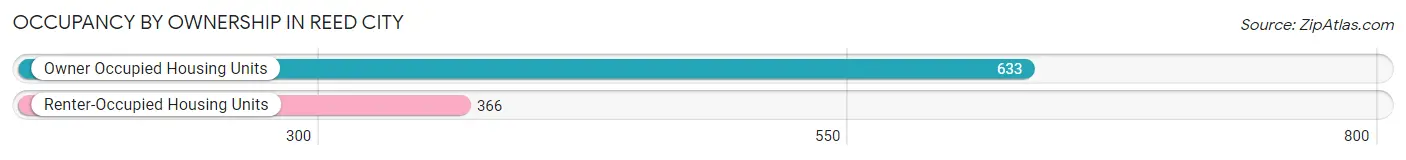
| Occupancy | # Housing Units | % Housing Units |
| Owner Occupied Housing Units | 633 | 63.4% |
| Renter-Occupied Housing Units | 366 | 36.6% |
| Total Occupied Housing Units | 999 | 100.0% |
Occupancy by Household Size in Reed City
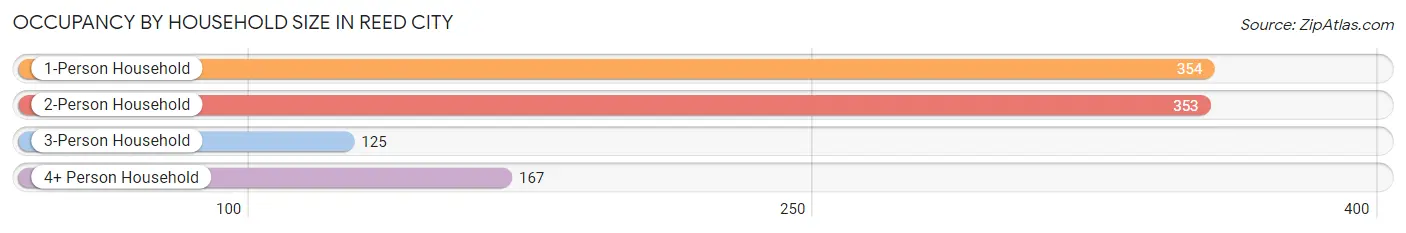
| Household Size | # Housing Units | % Housing Units |
| 1-Person Household | 354 | 35.4% |
| 2-Person Household | 353 | 35.3% |
| 3-Person Household | 125 | 12.5% |
| 4+ Person Household | 167 | 16.7% |
| Total Housing Units | 999 | 100.0% |
Occupancy by Ownership by Household Size in Reed City
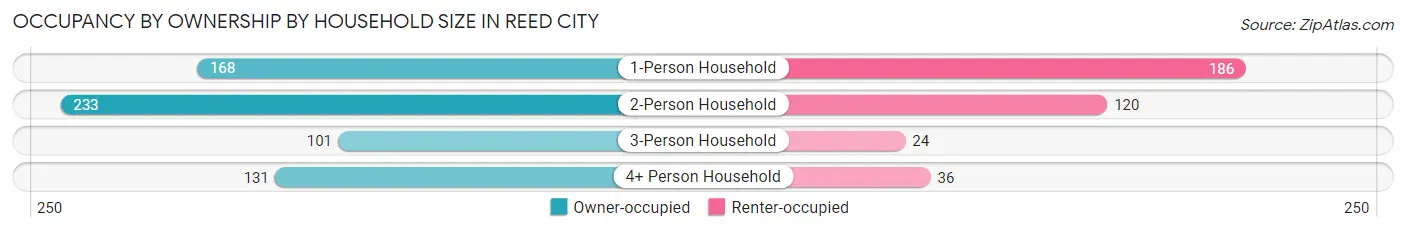
| Household Size | Owner-occupied | Renter-occupied |
| 1-Person Household | 168 (47.5%) | 186 (52.5%) |
| 2-Person Household | 233 (66.0%) | 120 (34.0%) |
| 3-Person Household | 101 (80.8%) | 24 (19.2%) |
| 4+ Person Household | 131 (78.4%) | 36 (21.6%) |
| Total Housing Units | 633 (63.4%) | 366 (36.6%) |
Occupancy by Educational Attainment in Reed City
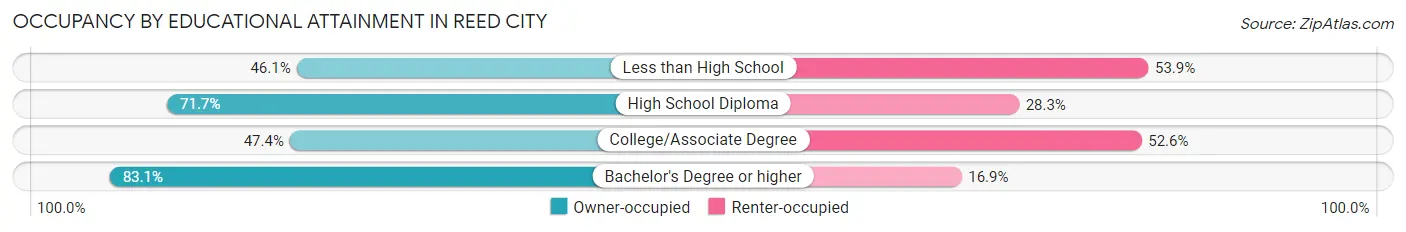
| Household Size | Owner-occupied | Renter-occupied |
| Less than High School | 53 (46.1%) | 62 (53.9%) |
| High School Diploma | 231 (71.7%) | 91 (28.3%) |
| College/Associate Degree | 157 (47.4%) | 174 (52.6%) |
| Bachelor's Degree or higher | 192 (83.1%) | 39 (16.9%) |
Occupancy by Age of Householder in Reed City
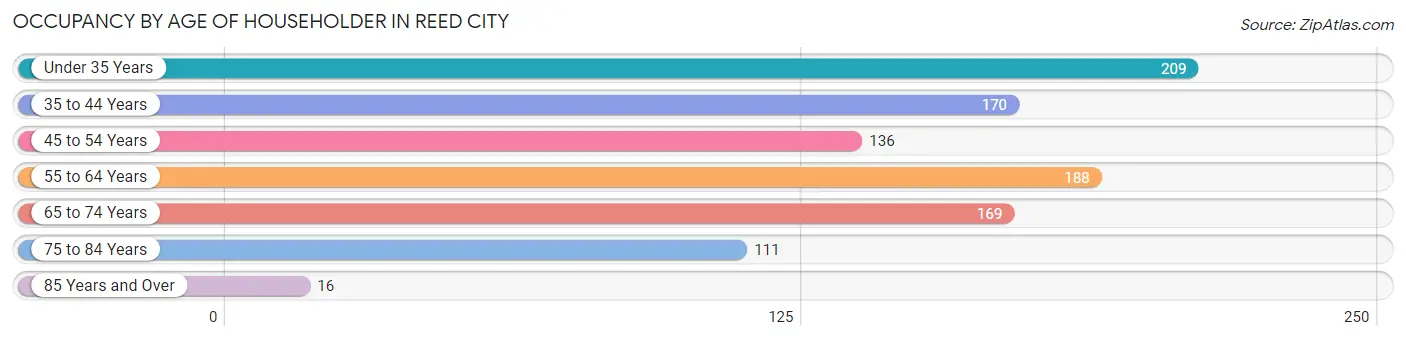
| Age Bracket | # Households | % Households |
| Under 35 Years | 209 | 20.9% |
| 35 to 44 Years | 170 | 17.0% |
| 45 to 54 Years | 136 | 13.6% |
| 55 to 64 Years | 188 | 18.8% |
| 65 to 74 Years | 169 | 16.9% |
| 75 to 84 Years | 111 | 11.1% |
| 85 Years and Over | 16 | 1.6% |
| Total | 999 | 100.0% |
Housing Finances in Reed City
Median Income by Occupancy in Reed City
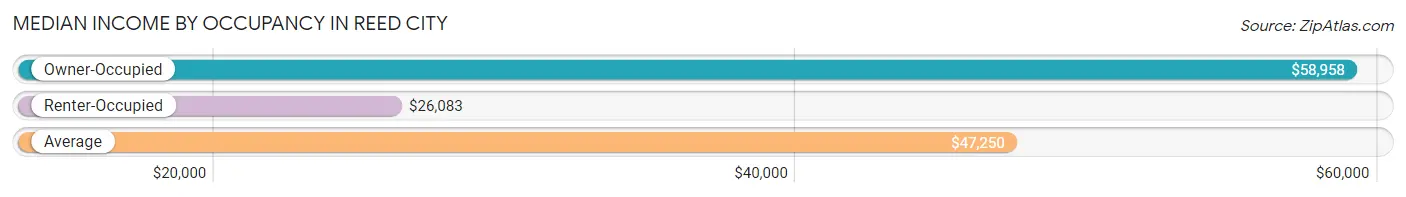
| Occupancy Type | # Households | Median Income |
| Owner-Occupied | 633 (63.4%) | $58,958 |
| Renter-Occupied | 366 (36.6%) | $26,083 |
| Average | 999 (100.0%) | $47,250 |
Occupancy by Householder Income Bracket in Reed City
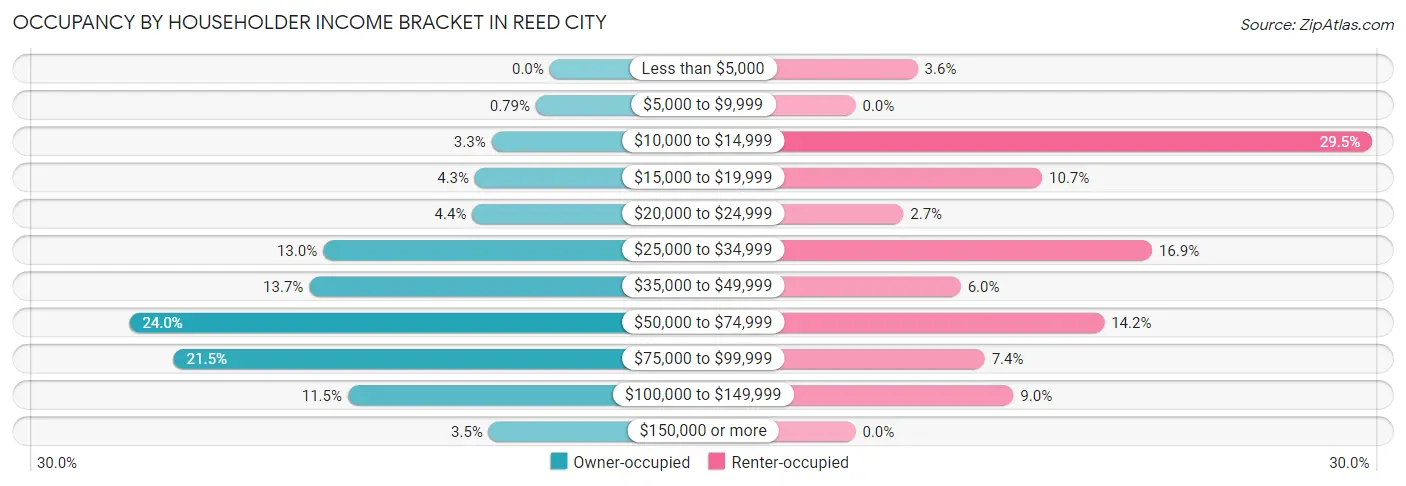
| Income Bracket | Owner-occupied | Renter-occupied |
| Less than $5,000 | 0 (0.0%) | 13 (3.5%) |
| $5,000 to $9,999 | 5 (0.8%) | 0 (0.0%) |
| $10,000 to $14,999 | 21 (3.3%) | 108 (29.5%) |
| $15,000 to $19,999 | 27 (4.3%) | 39 (10.7%) |
| $20,000 to $24,999 | 28 (4.4%) | 10 (2.7%) |
| $25,000 to $34,999 | 82 (13.0%) | 62 (16.9%) |
| $35,000 to $49,999 | 87 (13.7%) | 22 (6.0%) |
| $50,000 to $74,999 | 152 (24.0%) | 52 (14.2%) |
| $75,000 to $99,999 | 136 (21.5%) | 27 (7.4%) |
| $100,000 to $149,999 | 73 (11.5%) | 33 (9.0%) |
| $150,000 or more | 22 (3.5%) | 0 (0.0%) |
| Total | 633 (100.0%) | 366 (100.0%) |
Monthly Housing Cost Tiers in Reed City
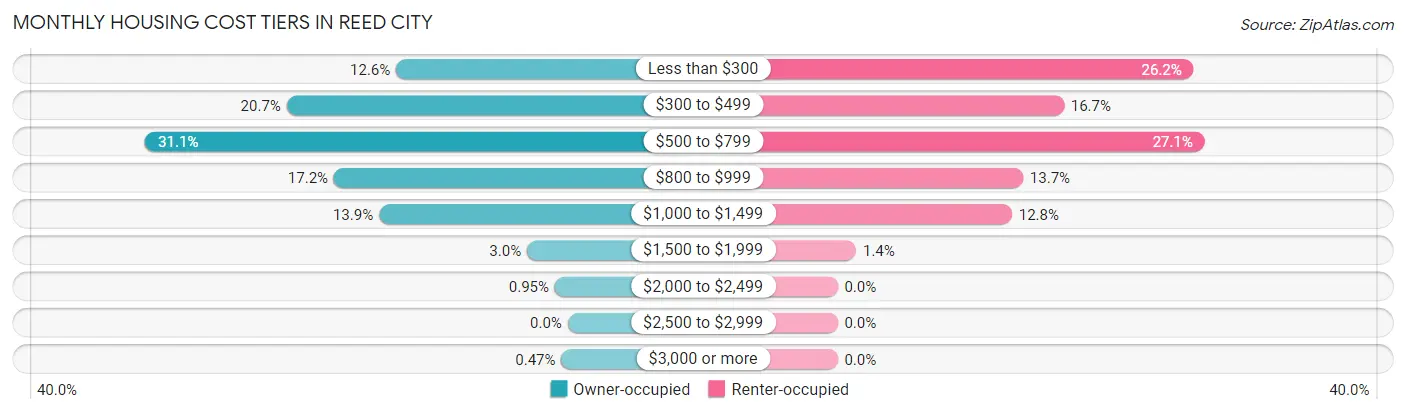
| Monthly Cost | Owner-occupied | Renter-occupied |
| Less than $300 | 80 (12.6%) | 96 (26.2%) |
| $300 to $499 | 131 (20.7%) | 61 (16.7%) |
| $500 to $799 | 197 (31.1%) | 99 (27.1%) |
| $800 to $999 | 109 (17.2%) | 50 (13.7%) |
| $1,000 to $1,499 | 88 (13.9%) | 47 (12.8%) |
| $1,500 to $1,999 | 19 (3.0%) | 5 (1.4%) |
| $2,000 to $2,499 | 6 (0.9%) | 0 (0.0%) |
| $2,500 to $2,999 | 0 (0.0%) | 0 (0.0%) |
| $3,000 or more | 3 (0.5%) | 0 (0.0%) |
| Total | 633 (100.0%) | 366 (100.0%) |
Physical Housing Characteristics in Reed City
Housing Structures in Reed City
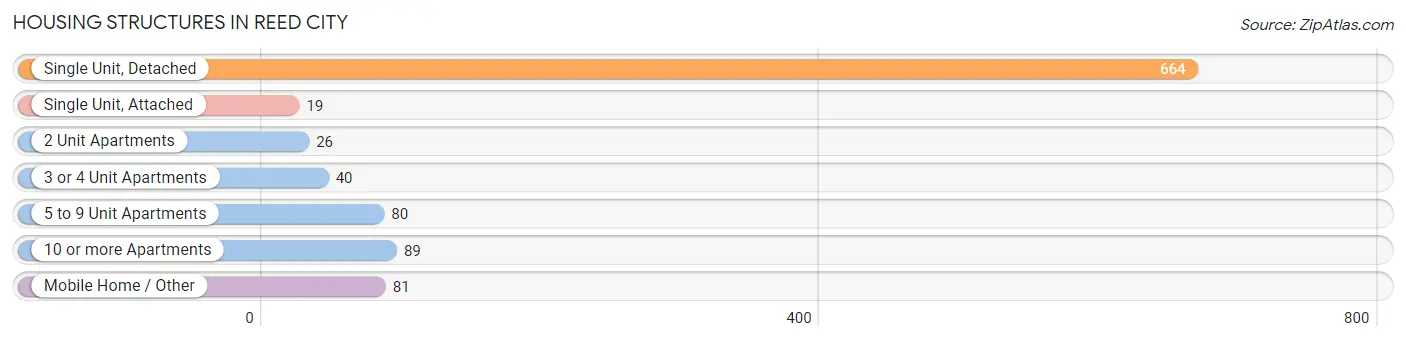
| Structure Type | # Housing Units | % Housing Units |
| Single Unit, Detached | 664 | 66.5% |
| Single Unit, Attached | 19 | 1.9% |
| 2 Unit Apartments | 26 | 2.6% |
| 3 or 4 Unit Apartments | 40 | 4.0% |
| 5 to 9 Unit Apartments | 80 | 8.0% |
| 10 or more Apartments | 89 | 8.9% |
| Mobile Home / Other | 81 | 8.1% |
| Total | 999 | 100.0% |
Housing Structures by Occupancy in Reed City
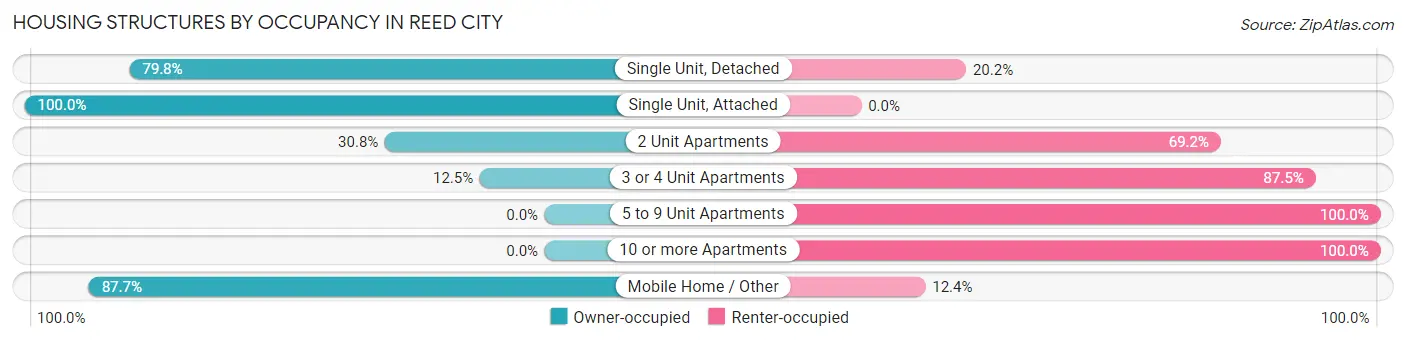
| Structure Type | Owner-occupied | Renter-occupied |
| Single Unit, Detached | 530 (79.8%) | 134 (20.2%) |
| Single Unit, Attached | 19 (100.0%) | 0 (0.0%) |
| 2 Unit Apartments | 8 (30.8%) | 18 (69.2%) |
| 3 or 4 Unit Apartments | 5 (12.5%) | 35 (87.5%) |
| 5 to 9 Unit Apartments | 0 (0.0%) | 80 (100.0%) |
| 10 or more Apartments | 0 (0.0%) | 89 (100.0%) |
| Mobile Home / Other | 71 (87.6%) | 10 (12.3%) |
| Total | 633 (63.4%) | 366 (36.6%) |
Housing Structures by Number of Rooms in Reed City
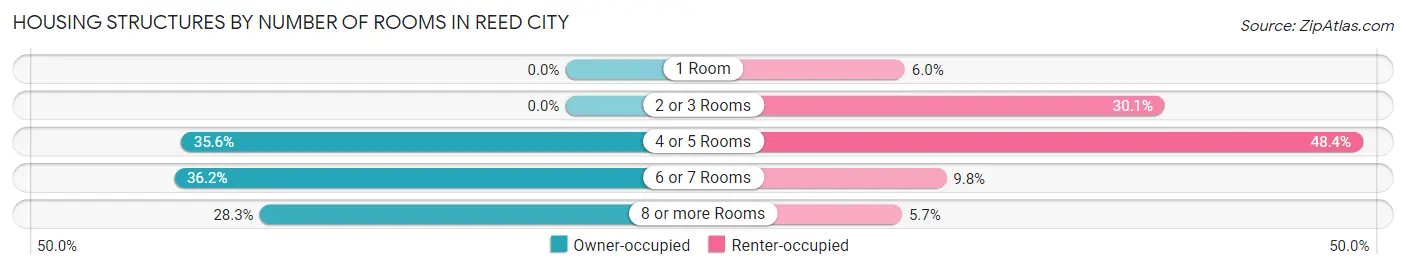
| Number of Rooms | Owner-occupied | Renter-occupied |
| 1 Room | 0 (0.0%) | 22 (6.0%) |
| 2 or 3 Rooms | 0 (0.0%) | 110 (30.0%) |
| 4 or 5 Rooms | 225 (35.5%) | 177 (48.4%) |
| 6 or 7 Rooms | 229 (36.2%) | 36 (9.8%) |
| 8 or more Rooms | 179 (28.3%) | 21 (5.7%) |
| Total | 633 (100.0%) | 366 (100.0%) |
Housing Structure by Heating Type in Reed City
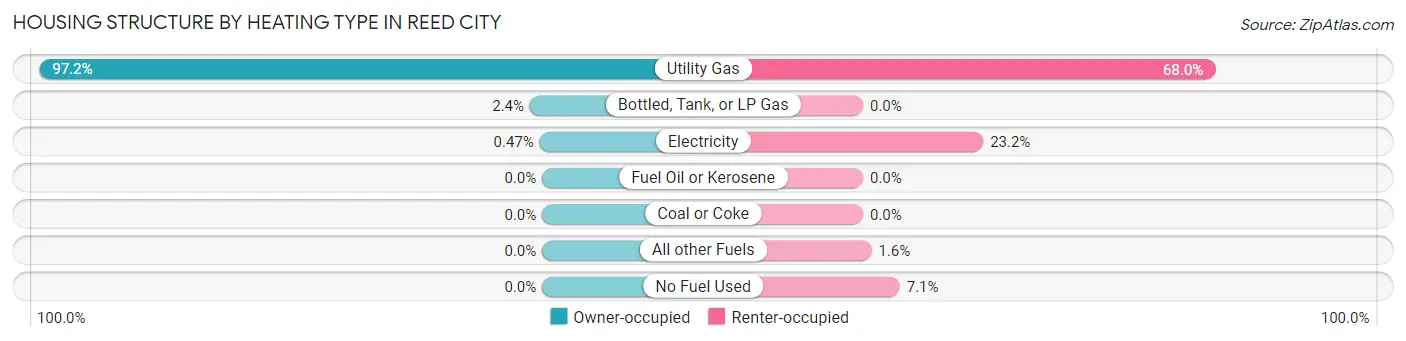
| Heating Type | Owner-occupied | Renter-occupied |
| Utility Gas | 615 (97.2%) | 249 (68.0%) |
| Bottled, Tank, or LP Gas | 15 (2.4%) | 0 (0.0%) |
| Electricity | 3 (0.5%) | 85 (23.2%) |
| Fuel Oil or Kerosene | 0 (0.0%) | 0 (0.0%) |
| Coal or Coke | 0 (0.0%) | 0 (0.0%) |
| All other Fuels | 0 (0.0%) | 6 (1.6%) |
| No Fuel Used | 0 (0.0%) | 26 (7.1%) |
| Total | 633 (100.0%) | 366 (100.0%) |
Household Vehicle Usage in Reed City
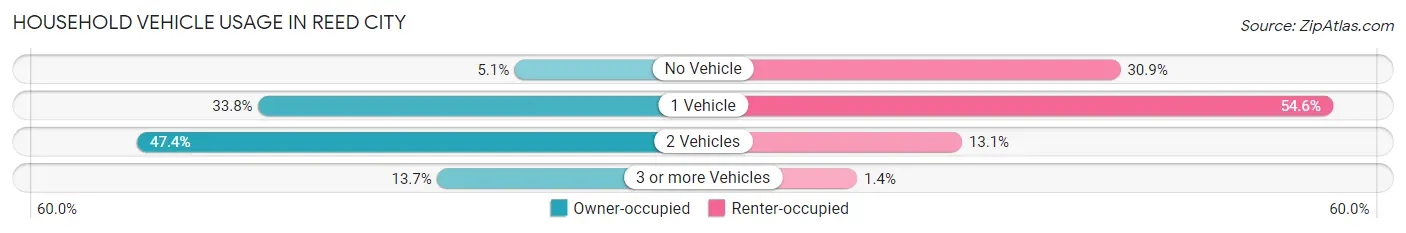
| Vehicles per Household | Owner-occupied | Renter-occupied |
| No Vehicle | 32 (5.1%) | 113 (30.9%) |
| 1 Vehicle | 214 (33.8%) | 200 (54.6%) |
| 2 Vehicles | 300 (47.4%) | 48 (13.1%) |
| 3 or more Vehicles | 87 (13.7%) | 5 (1.4%) |
| Total | 633 (100.0%) | 366 (100.0%) |
Real Estate & Mortgages in Reed City
Real Estate and Mortgage Overview in Reed City
| Characteristic | Without Mortgage | With Mortgage |
| Housing Units | 324 | 309 |
| Median Property Value | $93,300 | $107,000 |
| Median Household Income | $47,188 | $22 |
| Monthly Housing Costs | $423 | $3 |
| Real Estate Taxes | $1,356 | $0 |
Property Value by Mortgage Status in Reed City
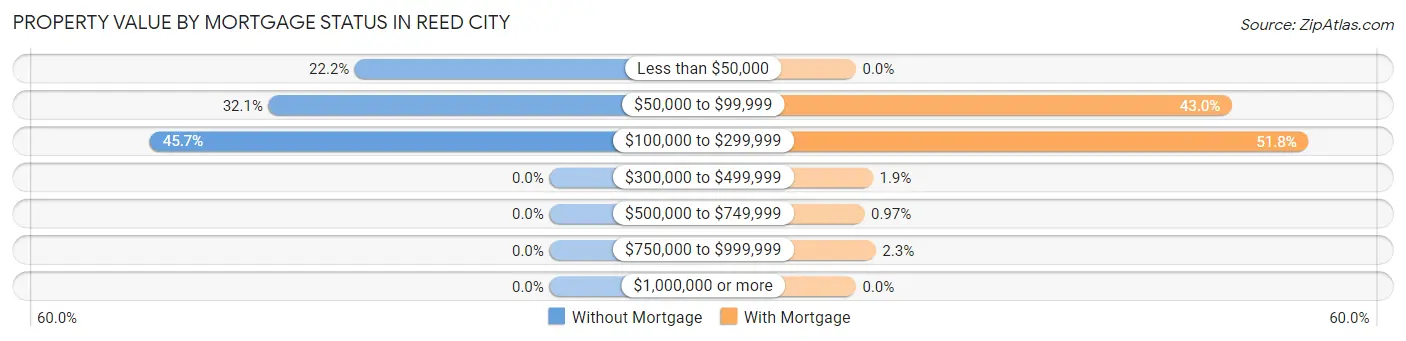
| Property Value | Without Mortgage | With Mortgage |
| Less than $50,000 | 72 (22.2%) | 0 (0.0%) |
| $50,000 to $99,999 | 104 (32.1%) | 133 (43.0%) |
| $100,000 to $299,999 | 148 (45.7%) | 160 (51.8%) |
| $300,000 to $499,999 | 0 (0.0%) | 6 (1.9%) |
| $500,000 to $749,999 | 0 (0.0%) | 3 (1.0%) |
| $750,000 to $999,999 | 0 (0.0%) | 7 (2.3%) |
| $1,000,000 or more | 0 (0.0%) | 0 (0.0%) |
| Total | 324 (100.0%) | 309 (100.0%) |
Household Income by Mortgage Status in Reed City
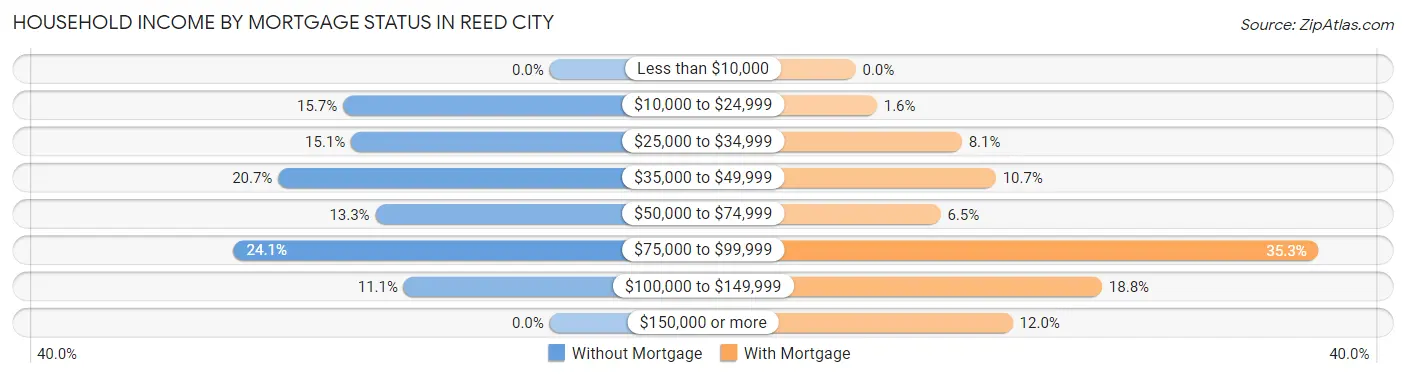
| Household Income | Without Mortgage | With Mortgage |
| Less than $10,000 | 0 (0.0%) | 0 (0.0%) |
| $10,000 to $24,999 | 51 (15.7%) | 5 (1.6%) |
| $25,000 to $34,999 | 49 (15.1%) | 25 (8.1%) |
| $35,000 to $49,999 | 67 (20.7%) | 33 (10.7%) |
| $50,000 to $74,999 | 43 (13.3%) | 20 (6.5%) |
| $75,000 to $99,999 | 78 (24.1%) | 109 (35.3%) |
| $100,000 to $149,999 | 36 (11.1%) | 58 (18.8%) |
| $150,000 or more | 0 (0.0%) | 37 (12.0%) |
| Total | 324 (100.0%) | 309 (100.0%) |
Property Value to Household Income Ratio in Reed City
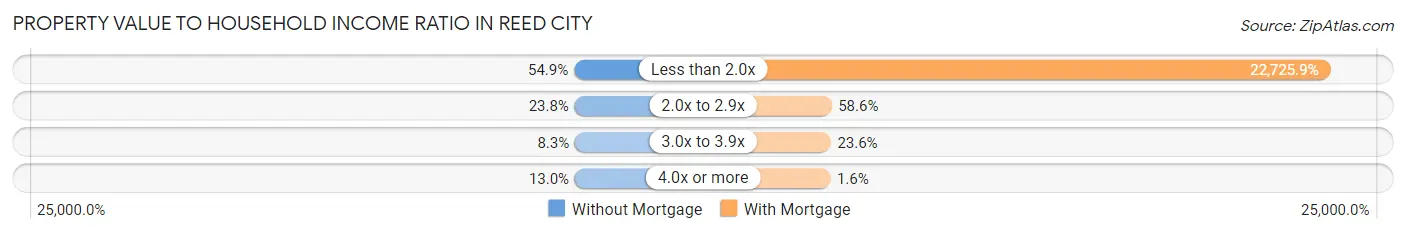
| Value-to-Income Ratio | Without Mortgage | With Mortgage |
| Less than 2.0x | 178 (54.9%) | 70,223 (22,725.9%) |
| 2.0x to 2.9x | 77 (23.8%) | 181 (58.6%) |
| 3.0x to 3.9x | 27 (8.3%) | 73 (23.6%) |
| 4.0x or more | 42 (13.0%) | 5 (1.6%) |
| Total | 324 (100.0%) | 309 (100.0%) |
Real Estate Taxes by Mortgage Status in Reed City
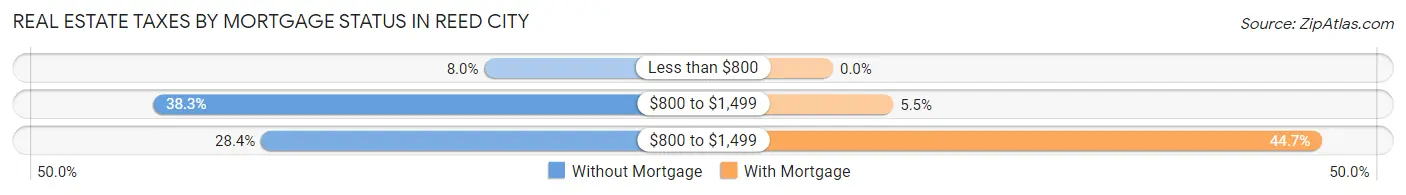
| Property Taxes | Without Mortgage | With Mortgage |
| Less than $800 | 26 (8.0%) | 0 (0.0%) |
| $800 to $1,499 | 124 (38.3%) | 17 (5.5%) |
| $800 to $1,499 | 92 (28.4%) | 138 (44.7%) |
| Total | 324 (100.0%) | 309 (100.0%) |
Health & Disability in Reed City
Health Insurance Coverage by Age in Reed City
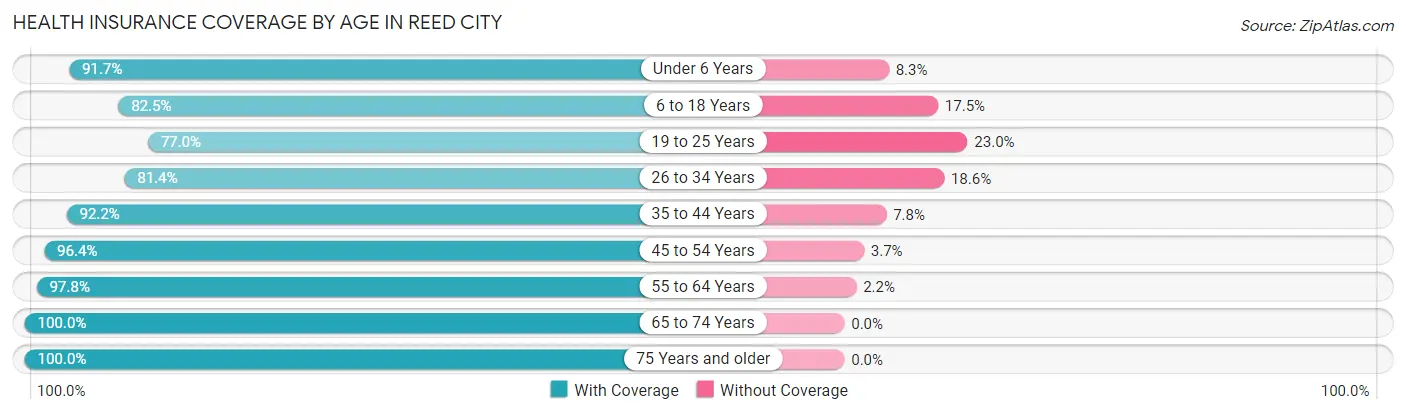
| Age Bracket | With Coverage | Without Coverage |
| Under 6 Years | 155 (91.7%) | 14 (8.3%) |
| 6 to 18 Years | 260 (82.5%) | 55 (17.5%) |
| 19 to 25 Years | 104 (77.0%) | 31 (23.0%) |
| 26 to 34 Years | 219 (81.4%) | 50 (18.6%) |
| 35 to 44 Years | 354 (92.2%) | 30 (7.8%) |
| 45 to 54 Years | 264 (96.4%) | 10 (3.6%) |
| 55 to 64 Years | 309 (97.8%) | 7 (2.2%) |
| 65 to 74 Years | 279 (100.0%) | 0 (0.0%) |
| 75 Years and older | 216 (100.0%) | 0 (0.0%) |
| Total | 2,160 (91.6%) | 197 (8.4%) |
Health Insurance Coverage by Citizenship Status in Reed City
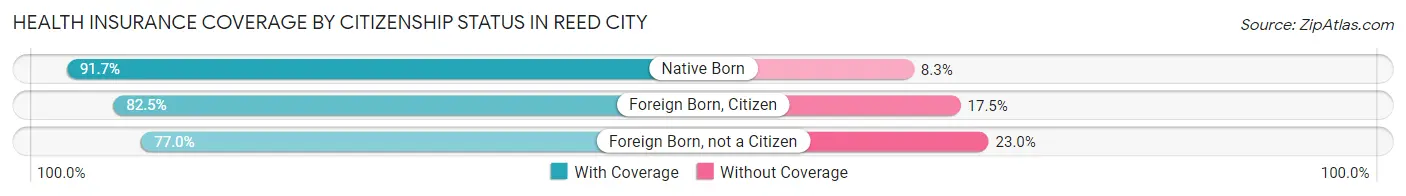
| Citizenship Status | With Coverage | Without Coverage |
| Native Born | 155 (91.7%) | 14 (8.3%) |
| Foreign Born, Citizen | 260 (82.5%) | 55 (17.5%) |
| Foreign Born, not a Citizen | 104 (77.0%) | 31 (23.0%) |
Health Insurance Coverage by Household Income in Reed City
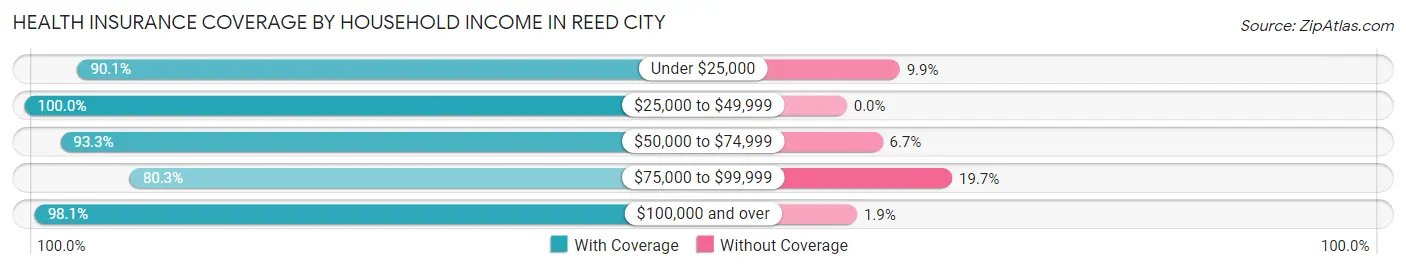
| Household Income | With Coverage | Without Coverage |
| Under $25,000 | 382 (90.1%) | 42 (9.9%) |
| $25,000 to $49,999 | 502 (100.0%) | 0 (0.0%) |
| $50,000 to $74,999 | 432 (93.3%) | 31 (6.7%) |
| $75,000 to $99,999 | 476 (80.3%) | 117 (19.7%) |
| $100,000 and over | 360 (98.1%) | 7 (1.9%) |
Public vs Private Health Insurance Coverage by Age in Reed City
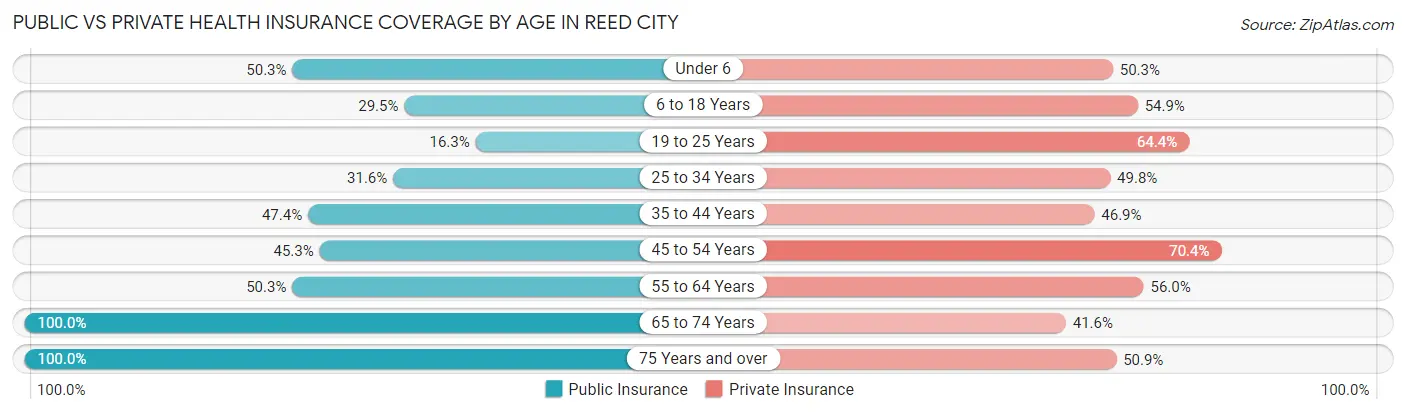
| Age Bracket | Public Insurance | Private Insurance |
| Under 6 | 85 (50.3%) | 85 (50.3%) |
| 6 to 18 Years | 93 (29.5%) | 173 (54.9%) |
| 19 to 25 Years | 22 (16.3%) | 87 (64.4%) |
| 25 to 34 Years | 85 (31.6%) | 134 (49.8%) |
| 35 to 44 Years | 182 (47.4%) | 180 (46.9%) |
| 45 to 54 Years | 124 (45.3%) | 193 (70.4%) |
| 55 to 64 Years | 159 (50.3%) | 177 (56.0%) |
| 65 to 74 Years | 279 (100.0%) | 116 (41.6%) |
| 75 Years and over | 216 (100.0%) | 110 (50.9%) |
| Total | 1,245 (52.8%) | 1,255 (53.2%) |
Disability Status by Sex by Age in Reed City
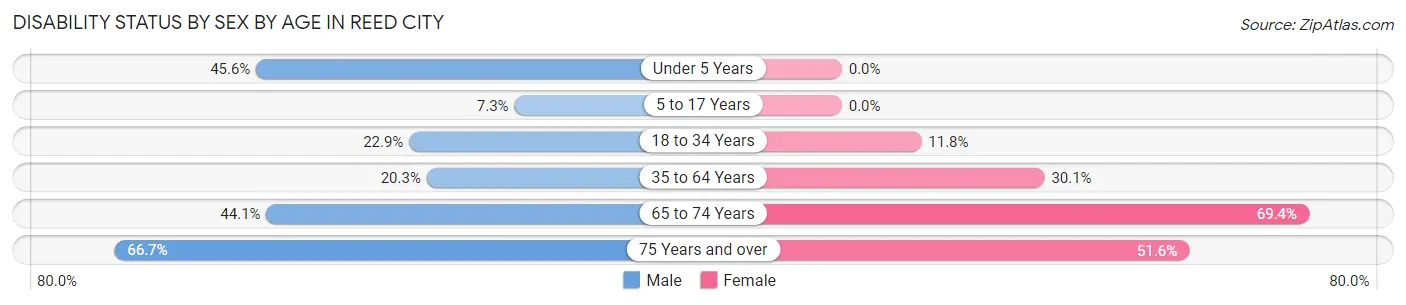
| Age Bracket | Male | Female |
| Under 5 Years | 26 (45.6%) | 0 (0.0%) |
| 5 to 17 Years | 17 (7.3%) | 0 (0.0%) |
| 18 to 34 Years | 38 (22.9%) | 30 (11.8%) |
| 35 to 64 Years | 85 (20.3%) | 167 (30.1%) |
| 65 to 74 Years | 41 (44.1%) | 129 (69.4%) |
| 75 Years and over | 38 (66.7%) | 82 (51.6%) |
Disability Class by Sex by Age in Reed City
Disability Class: Hearing Difficulty
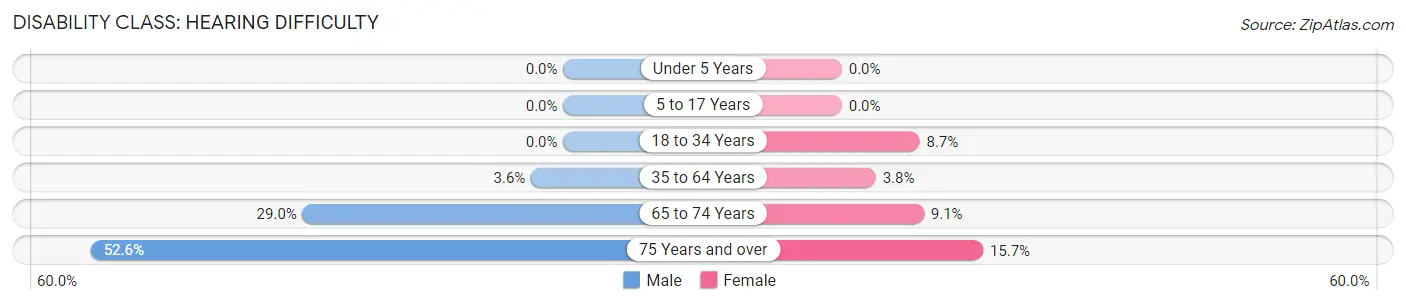
| Age Bracket | Male | Female |
| Under 5 Years | 0 (0.0%) | 0 (0.0%) |
| 5 to 17 Years | 0 (0.0%) | 0 (0.0%) |
| 18 to 34 Years | 0 (0.0%) | 22 (8.7%) |
| 35 to 64 Years | 15 (3.6%) | 21 (3.8%) |
| 65 to 74 Years | 27 (29.0%) | 17 (9.1%) |
| 75 Years and over | 30 (52.6%) | 25 (15.7%) |
Disability Class: Vision Difficulty
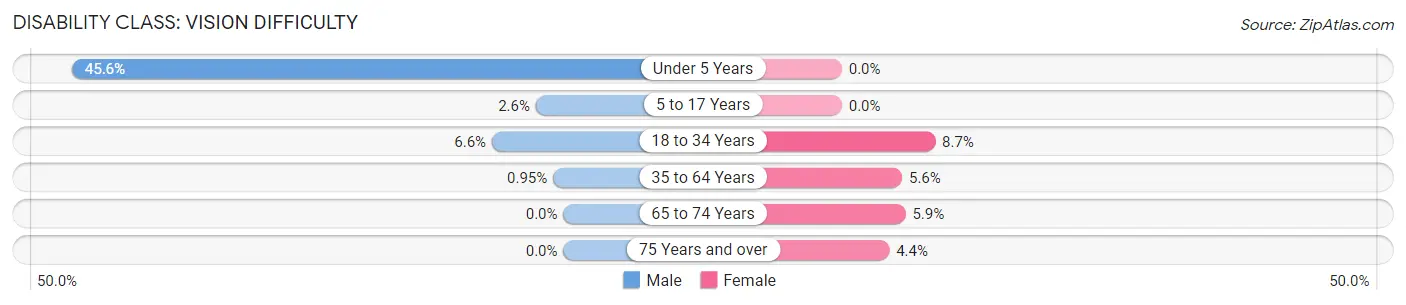
| Age Bracket | Male | Female |
| Under 5 Years | 26 (45.6%) | 0 (0.0%) |
| 5 to 17 Years | 6 (2.6%) | 0 (0.0%) |
| 18 to 34 Years | 11 (6.6%) | 22 (8.7%) |
| 35 to 64 Years | 4 (0.9%) | 31 (5.6%) |
| 65 to 74 Years | 0 (0.0%) | 11 (5.9%) |
| 75 Years and over | 0 (0.0%) | 7 (4.4%) |
Disability Class: Cognitive Difficulty
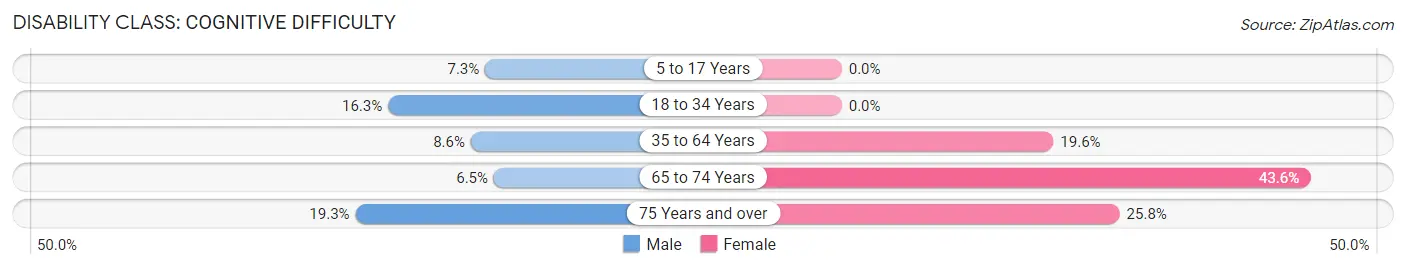
| Age Bracket | Male | Female |
| 5 to 17 Years | 17 (7.3%) | 0 (0.0%) |
| 18 to 34 Years | 27 (16.3%) | 0 (0.0%) |
| 35 to 64 Years | 36 (8.6%) | 109 (19.6%) |
| 65 to 74 Years | 6 (6.5%) | 81 (43.5%) |
| 75 Years and over | 11 (19.3%) | 41 (25.8%) |
Disability Class: Ambulatory Difficulty
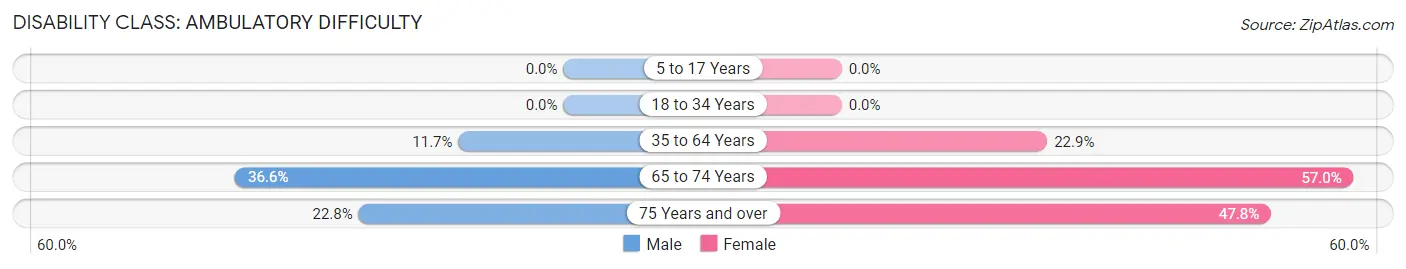
| Age Bracket | Male | Female |
| 5 to 17 Years | 0 (0.0%) | 0 (0.0%) |
| 18 to 34 Years | 0 (0.0%) | 0 (0.0%) |
| 35 to 64 Years | 49 (11.7%) | 127 (22.9%) |
| 65 to 74 Years | 34 (36.6%) | 106 (57.0%) |
| 75 Years and over | 13 (22.8%) | 76 (47.8%) |
Disability Class: Self-Care Difficulty
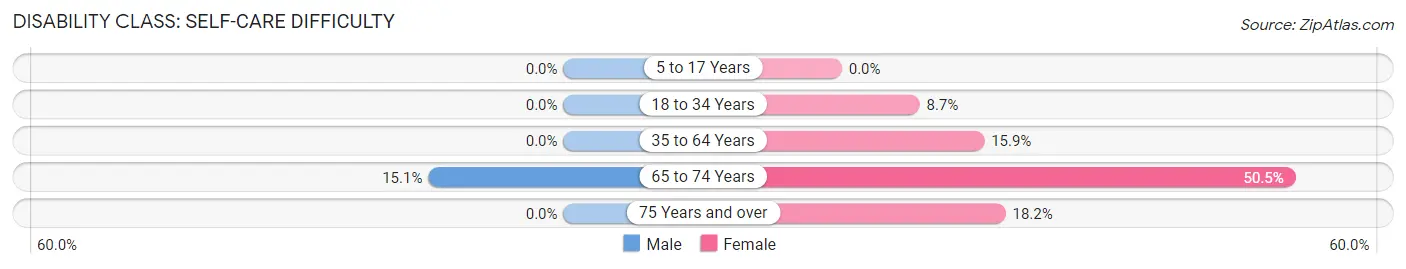
| Age Bracket | Male | Female |
| 5 to 17 Years | 0 (0.0%) | 0 (0.0%) |
| 18 to 34 Years | 0 (0.0%) | 22 (8.7%) |
| 35 to 64 Years | 0 (0.0%) | 88 (15.9%) |
| 65 to 74 Years | 14 (15.0%) | 94 (50.5%) |
| 75 Years and over | 0 (0.0%) | 29 (18.2%) |
Technology Access in Reed City
Computing Device Access in Reed City
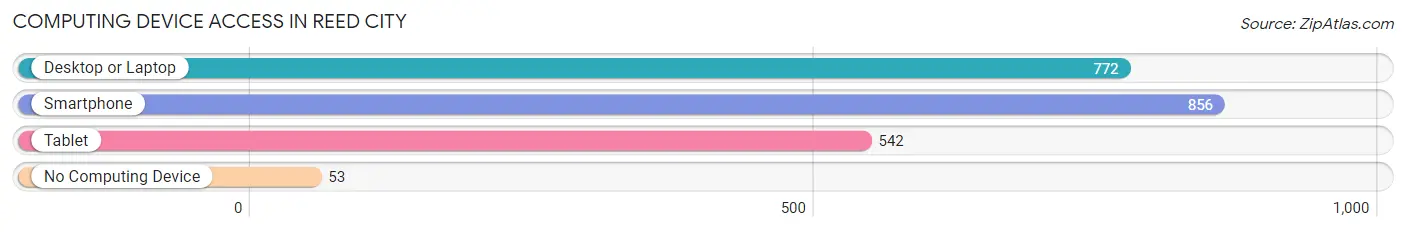
| Device Type | # Households | % Households |
| Desktop or Laptop | 772 | 77.3% |
| Smartphone | 856 | 85.7% |
| Tablet | 542 | 54.2% |
| No Computing Device | 53 | 5.3% |
| Total | 999 | 100.0% |
Internet Access in Reed City
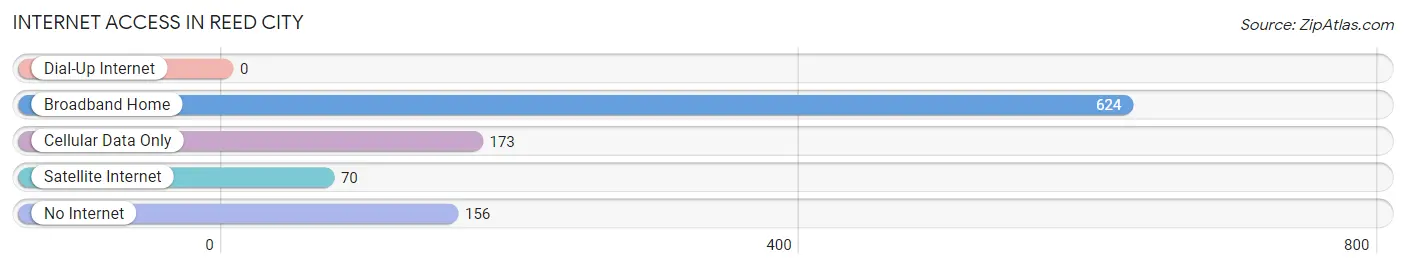
| Internet Type | # Households | % Households |
| Dial-Up Internet | 0 | 0.0% |
| Broadband Home | 624 | 62.5% |
| Cellular Data Only | 173 | 17.3% |
| Satellite Internet | 70 | 7.0% |
| No Internet | 156 | 15.6% |
| Total | 999 | 100.0% |
Reed City Summary
Reed City is a city located in Osceola County, Michigan, United States. The population was 2,845 at the 2010 census. It is the county seat of Osceola County.
History
Reed City was founded in 1871 by William Reed, a lumberman from New York. He purchased a large tract of land in the area and built a sawmill. The town was named after him. The first post office was established in 1872.
In 1873, the first school was built and the first church was organized. The first newspaper, the Reed City Clarion, was established in 1876.
In 1881, the first railroad line was built through Reed City, connecting it to Grand Rapids and Detroit. This allowed the town to become a major lumbering center.
In 1883 the first bank was established The first telephone line was installed in 1884
In 1887 the first fire department was organized The first electric lights were installed in 1889
In 1891 the first hospital was built The first library was established in 1895
In 1901 the first movie theater was opened The first public park was established in 1902
In 1906 the first automobile dealership was opened The first airport was built in 1910
In 1912 the first high school was built The first airport was built in 1914
In 1920 the first radio station was established The first airport was built in 1923
In 1927 the first airport was built The first airport was built in 1929
In 1933 the first airport was built The first airport was built in 1935
In 1940 the first airport was built The first airport was built in 1942
In 1945 the first airport was built The first airport was built in 1947
In 1950 the first airport was built The first airport was built in 1952
In 1955 the first airport was built The first airport was built in 1957
In 1960 the first airport was built The first airport was built in 1962
In 1965 the first airport was built The first airport was built in 1967
In 1970 the first airport was built The first airport was built in 1972
In 1975 the first airport was built The first airport was built in 1977
In 1980 the first airport was built The first airport was built in 1982
In 1985 the first airport was built The first airport was built in 1987
In 1990 the first airport was built The first airport was built in 1992
In 1995 the first airport was built The first airport was built in 1997
In 2000 the first airport was built The first airport was built in 2002
Geography
Reed City is located at 43°45′N 85°37′W (43.75, -85.62). According to the United States Census Bureau, the city has a total area of 2.2 square miles (5.7 km2), all land.
Economy
Reed City is a small city with a population of 2,845 people. The city is home to several businesses, including a grocery store, a hardware store, a bank, a pharmacy, a restaurant, and a few other small businesses. The city is also home to a few manufacturing companies, including a furniture manufacturer, a plastics manufacturer, and a metal fabrication company.
The city is also home to a few medical facilities, including a hospital, a clinic, and a few nursing homes.
Demographics
As of the census of 2010, there were 2,845 people, 1,093 households, and 717 families residing in the city. The population density was 1,279.2 people per square mile (493.2/km2). There were 1,183 housing units at an average density of 527.2 per square mile (203.6/km2). The racial makeup of the city was 95.2% White, 0.7% African American, 0.4% Native American, 0.3% Asian, 0.1% Pacific Islander, 1.3% from other races, and 2.1% from two or more races. Hispanic or Latino of any race were 3.2% of the population.
There were 1,093 households, out of which 33.2% had children under the age of 18 living with them, 48.2% were married couples living together, 13.2% had a female householder with no husband present, and 33.2% were non-families. 28.2% of all households were made up of individuals, and 12.2% had someone living alone who was 65 years of age or older. The average household size was 2.60 and the average family size was 3.17.
In the city, the population was spread out, with 28.2% under the age of 18, 8.2% from 18 to 24, 28.2% from 25 to 44, 21.2% from 45 to 64, and 14.2% who were 65 years of age or older. The median age was 36 years. For every 100 females, there were 95.2 males. For every 100 females age 18 and over, there were 91.2 males.
The median income for a household in the city was $33,750, and the median income for a family was $41,250. Males had a median income of $31,250 versus $21,250 for females. The per capita income for the city was $16,250. About 8.2% of families and 11.2% of the population were below the poverty line, including 14.2% of those under age 18 and 8.2% of those age 65 or over.
Common Questions
What is Per Capita Income in Reed City?
Per Capita income in Reed City is $25,693.
What is the Median Family Income in Reed City?
Median Family Income in Reed City is $56,989.
What is the Median Household income in Reed City?
Median Household Income in Reed City is $47,250.
What is Income or Wage Gap in Reed City?
Income or Wage Gap in Reed City is 33.5%.
Women in Reed City earn 66.5 cents for every dollar earned by a man.
What is Inequality or Gini Index in Reed City?
Inequality or Gini Index in Reed City is 0.42.
What is the Total Population of Reed City?
Total Population of Reed City is 2,481.
What is the Total Male Population of Reed City?
Total Male Population of Reed City is 1,104.
What is the Total Female Population of Reed City?
Total Female Population of Reed City is 1,377.
What is the Ratio of Males per 100 Females in Reed City?
There are 80.17 Males per 100 Females in Reed City.
What is the Ratio of Females per 100 Males in Reed City?
There are 124.73 Females per 100 Males in Reed City.
What is the Median Population Age in Reed City?
Median Population Age in Reed City is 43.0 Years.
What is the Average Family Size in Reed City
Average Family Size in Reed City is 2.9 People.
What is the Average Household Size in Reed City
Average Household Size in Reed City is 2.4 People.
How Large is the Labor Force in Reed City?
There are 1,032 People in the Labor Forcein in Reed City.
What is the Percentage of People in the Labor Force in Reed City?
50.4% of People are in the Labor Force in Reed City.
What is the Unemployment Rate in Reed City?
Unemployment Rate in Reed City is 8.9%.