Lake Linden, MI Map & Demographics
Lake Linden Map
Lake Linden Overview
$24,816
PER CAPITA INCOME
$53,914
AVG FAMILY INCOME
$43,021
AVG HOUSEHOLD INCOME
0.2%
WAGE / INCOME GAP [ % ]
99.8¢/ $1
WAGE / INCOME GAP [ $ ]
0.40
INEQUALITY / GINI INDEX
1,183
TOTAL POPULATION
575
MALE POPULATION
608
FEMALE POPULATION
94.57
MALES / 100 FEMALES
105.74
FEMALES / 100 MALES
39.3
MEDIAN AGE
2.8
AVG FAMILY SIZE
2.0
AVG HOUSEHOLD SIZE
617
LABOR FORCE [ PEOPLE ]
60.1%
PERCENT IN LABOR FORCE
10.0%
UNEMPLOYMENT RATE
Lake Linden Zip Codes
Lake Linden Area Codes
Income in Lake Linden
Income Overview in Lake Linden
Per Capita Income in Lake Linden is $24,816, while median incomes of families and households are $53,914 and $43,021 respectively.
| Characteristic | Number | Measure |
| Per Capita Income | 1,183 | $24,816 |
| Median Family Income | 295 | $53,914 |
| Mean Family Income | 295 | $64,148 |
| Median Household Income | 581 | $43,021 |
| Mean Household Income | 581 | $50,368 |
| Income Deficit | 295 | $0 |
| Wage / Income Gap (%) | 1,183 | 0.20% |
| Wage / Income Gap ($) | 1,183 | 99.80¢ per $1 |
| Gini / Inequality Index | 1,183 | 0.40 |
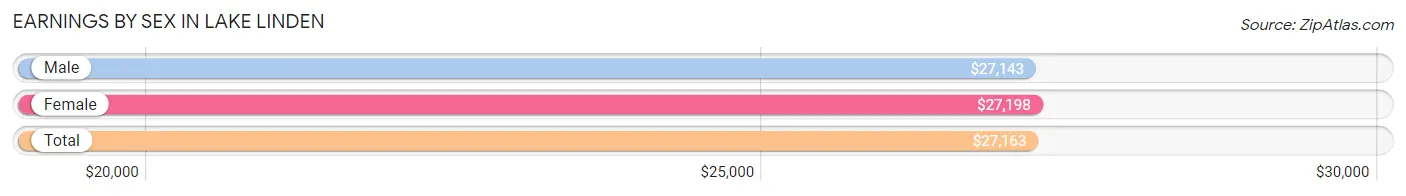
Earnings by Sex in Lake Linden
Average Earnings in Lake Linden are $27,163, $27,143 for men and $27,198 for women, a difference of 0.2%.
| Sex | Number | Average Earnings |
| Male | 294 (48.3%) | $27,143 |
| Female | 315 (51.7%) | $27,198 |
| Total | 609 (100.0%) | $27,163 |
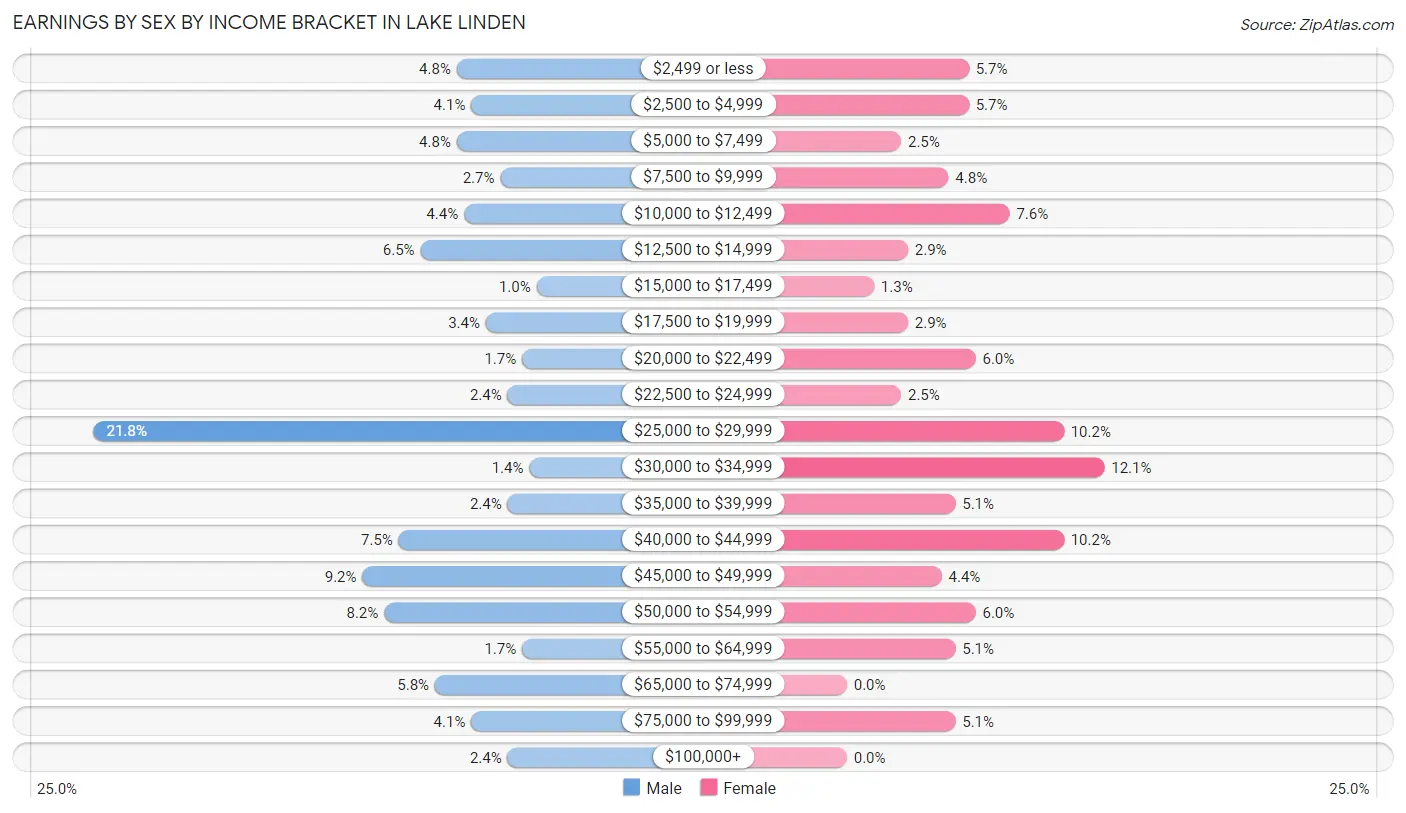
Earnings by Sex by Income Bracket in Lake Linden
The most common earnings brackets in Lake Linden are $25,000 to $29,999 for men (64 | 21.8%) and $30,000 to $34,999 for women (38 | 12.1%).
| Income | Male | Female |
| $2,499 or less | 14 (4.8%) | 18 (5.7%) |
| $2,500 to $4,999 | 12 (4.1%) | 18 (5.7%) |
| $5,000 to $7,499 | 14 (4.8%) | 8 (2.5%) |
| $7,500 to $9,999 | 8 (2.7%) | 15 (4.8%) |
| $10,000 to $12,499 | 13 (4.4%) | 24 (7.6%) |
| $12,500 to $14,999 | 19 (6.5%) | 9 (2.9%) |
| $15,000 to $17,499 | 3 (1.0%) | 4 (1.3%) |
| $17,500 to $19,999 | 10 (3.4%) | 9 (2.9%) |
| $20,000 to $22,499 | 5 (1.7%) | 19 (6.0%) |
| $22,500 to $24,999 | 7 (2.4%) | 8 (2.5%) |
| $25,000 to $29,999 | 64 (21.8%) | 32 (10.2%) |
| $30,000 to $34,999 | 4 (1.4%) | 38 (12.1%) |
| $35,000 to $39,999 | 7 (2.4%) | 16 (5.1%) |
| $40,000 to $44,999 | 22 (7.5%) | 32 (10.2%) |
| $45,000 to $49,999 | 27 (9.2%) | 14 (4.4%) |
| $50,000 to $54,999 | 24 (8.2%) | 19 (6.0%) |
| $55,000 to $64,999 | 5 (1.7%) | 16 (5.1%) |
| $65,000 to $74,999 | 17 (5.8%) | 0 (0.0%) |
| $75,000 to $99,999 | 12 (4.1%) | 16 (5.1%) |
| $100,000+ | 7 (2.4%) | 0 (0.0%) |
| Total | 294 (100.0%) | 315 (100.0%) |
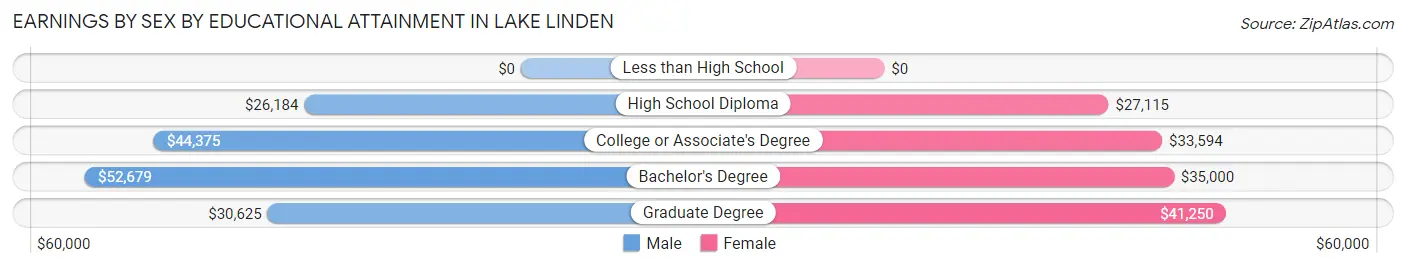
Earnings by Sex by Educational Attainment in Lake Linden
Average earnings in Lake Linden are $35,000 for men and $32,292 for women, a difference of 7.7%. Men with an educational attainment of bachelor's degree enjoy the highest average annual earnings of $52,679, while those with high school diploma education earn the least with $26,184. Women with an educational attainment of graduate degree earn the most with the average annual earnings of $41,250, while those with high school diploma education have the smallest earnings of $27,115.
| Educational Attainment | Male Income | Female Income |
| Less than High School | - | - |
| High School Diploma | $26,184 | $27,115 |
| College or Associate's Degree | $44,375 | $33,594 |
| Bachelor's Degree | $52,679 | $35,000 |
| Graduate Degree | $30,625 | $41,250 |
| Total | $35,000 | $32,292 |
Family Income in Lake Linden
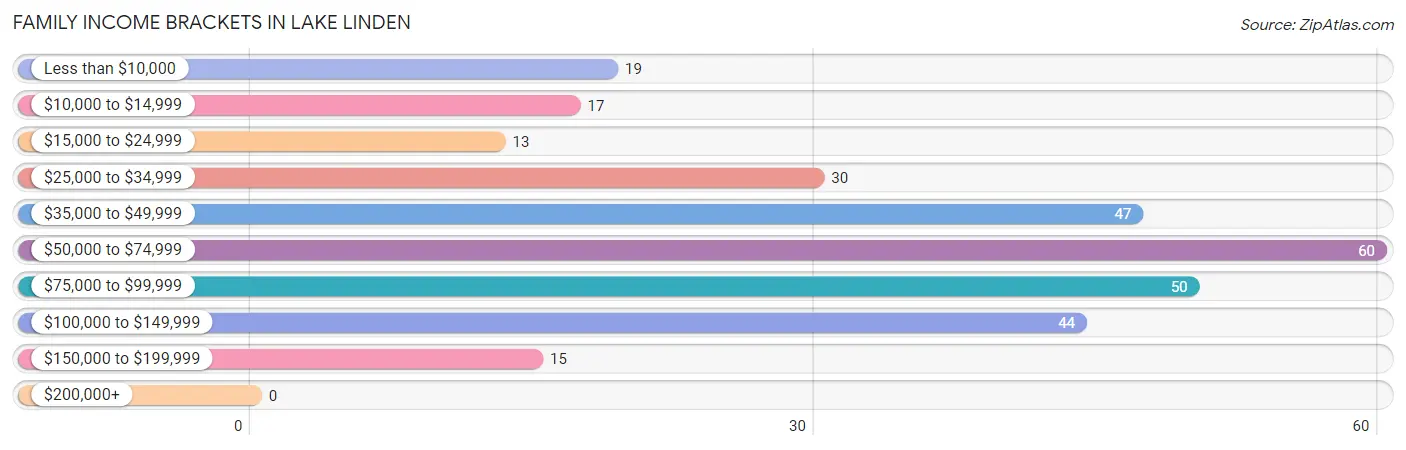
Family Income Brackets in Lake Linden
According to the Lake Linden family income data, there are 60 families falling into the $50,000 to $74,999 income range, which is the most common income bracket and makes up 20.3% of all families.
| Income Bracket | # Families | % Families |
| Less than $10,000 | 19 | 6.4% |
| $10,000 to $14,999 | 17 | 5.8% |
| $15,000 to $24,999 | 13 | 4.4% |
| $25,000 to $34,999 | 30 | 10.2% |
| $35,000 to $49,999 | 47 | 15.9% |
| $50,000 to $74,999 | 60 | 20.3% |
| $75,000 to $99,999 | 50 | 16.9% |
| $100,000 to $149,999 | 44 | 14.9% |
| $150,000 to $199,999 | 15 | 5.1% |
| $200,000+ | 0 | 0.0% |
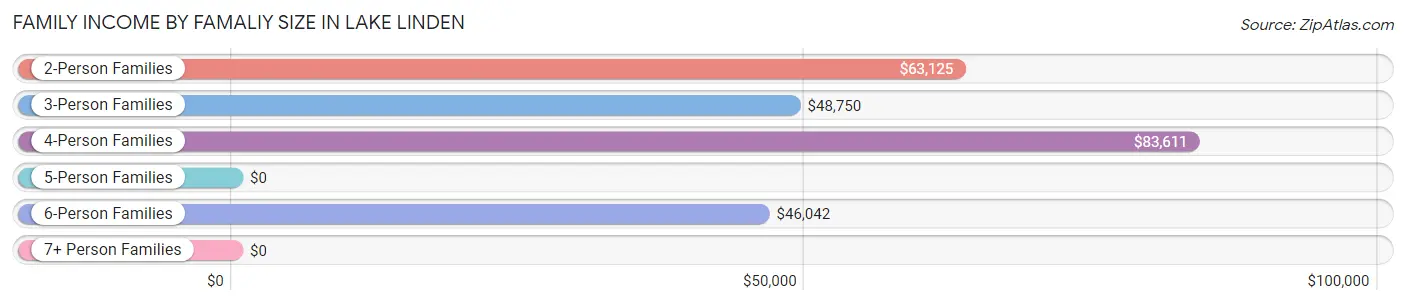
Family Income by Famaliy Size in Lake Linden
4-person families (28 | 9.5%) account for the highest median family income in Lake Linden with $83,611 per family, while 2-person families (169 | 57.3%) have the highest median income of $31,562 per family member.
| Income Bracket | # Families | Median Income |
| 2-Person Families | 169 (57.3%) | $63,125 |
| 3-Person Families | 80 (27.1%) | $48,750 |
| 4-Person Families | 28 (9.5%) | $83,611 |
| 5-Person Families | 5 (1.7%) | $0 |
| 6-Person Families | 13 (4.4%) | $46,042 |
| 7+ Person Families | 0 (0.0%) | $0 |
| Total | 295 (100.0%) | $53,914 |
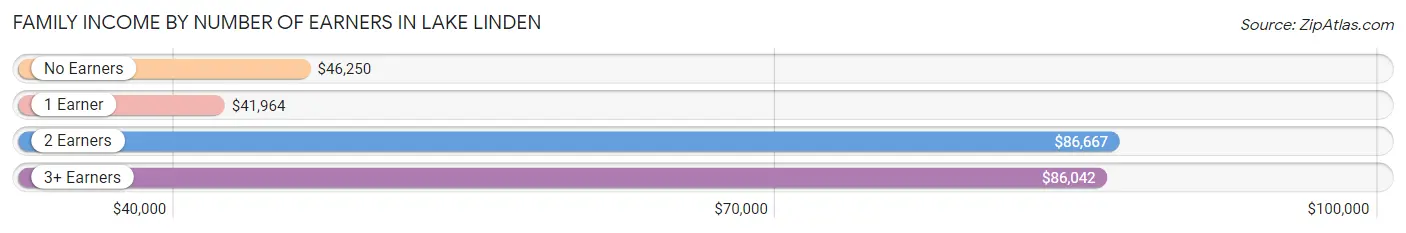
Family Income by Number of Earners in Lake Linden
The median family income in Lake Linden is $53,914, with families comprising 2 earners (102) having the highest median family income of $86,667, while families with 1 earner (103) have the lowest median family income of $41,964, accounting for 34.6% and 34.9% of families, respectively.
| Number of Earners | # Families | Median Income |
| No Earners | 67 (22.7%) | $46,250 |
| 1 Earner | 103 (34.9%) | $41,964 |
| 2 Earners | 102 (34.6%) | $86,667 |
| 3+ Earners | 23 (7.8%) | $86,042 |
| Total | 295 (100.0%) | $53,914 |
Household Income in Lake Linden
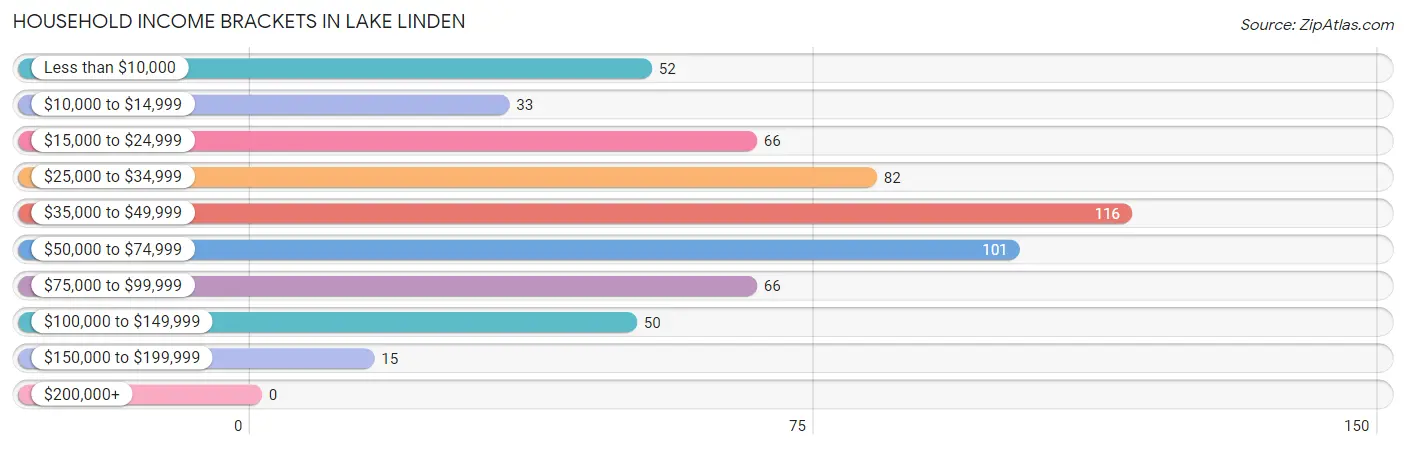
Household Income Brackets in Lake Linden
With 116 households falling in the category, the $35,000 to $49,999 income range is the most frequent in Lake Linden, accounting for 20.0% of all households.
| Income Bracket | # Households | % Households |
| Less than $10,000 | 52 | 9.0% |
| $10,000 to $14,999 | 33 | 5.7% |
| $15,000 to $24,999 | 66 | 11.4% |
| $25,000 to $34,999 | 82 | 14.1% |
| $35,000 to $49,999 | 116 | 20.0% |
| $50,000 to $74,999 | 101 | 17.4% |
| $75,000 to $99,999 | 66 | 11.4% |
| $100,000 to $149,999 | 50 | 8.6% |
| $150,000 to $199,999 | 15 | 2.6% |
| $200,000+ | 0 | 0.0% |
Household Income by Householder Age in Lake Linden
The median household income in Lake Linden is $43,021, with the highest median household income of $55,714 found in the 45 to 64 years age bracket for the primary householder. A total of 168 households (28.9%) fall into this category. Meanwhile, the 15 to 24 years age bracket for the primary householder has the lowest median household income of $0, with 39 households (6.7%) in this group.
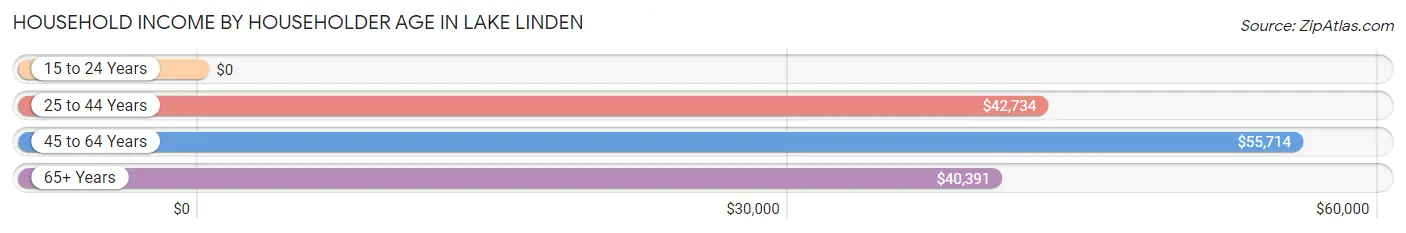
| Income Bracket | # Households | Median Income |
| 15 to 24 Years | 39 (6.7%) | $0 |
| 25 to 44 Years | 163 (28.1%) | $42,734 |
| 45 to 64 Years | 168 (28.9%) | $55,714 |
| 65+ Years | 211 (36.3%) | $40,391 |
| Total | 581 (100.0%) | $43,021 |
Poverty in Lake Linden
Income Below Poverty by Sex and Age in Lake Linden
With 16.2% poverty level for males and 20.0% for females among the residents of Lake Linden, under 5 year old males and 6 to 11 year old females are the most vulnerable to poverty, with 12 males (60.0%) and 14 females (70.0%) in their respective age groups living below the poverty level.
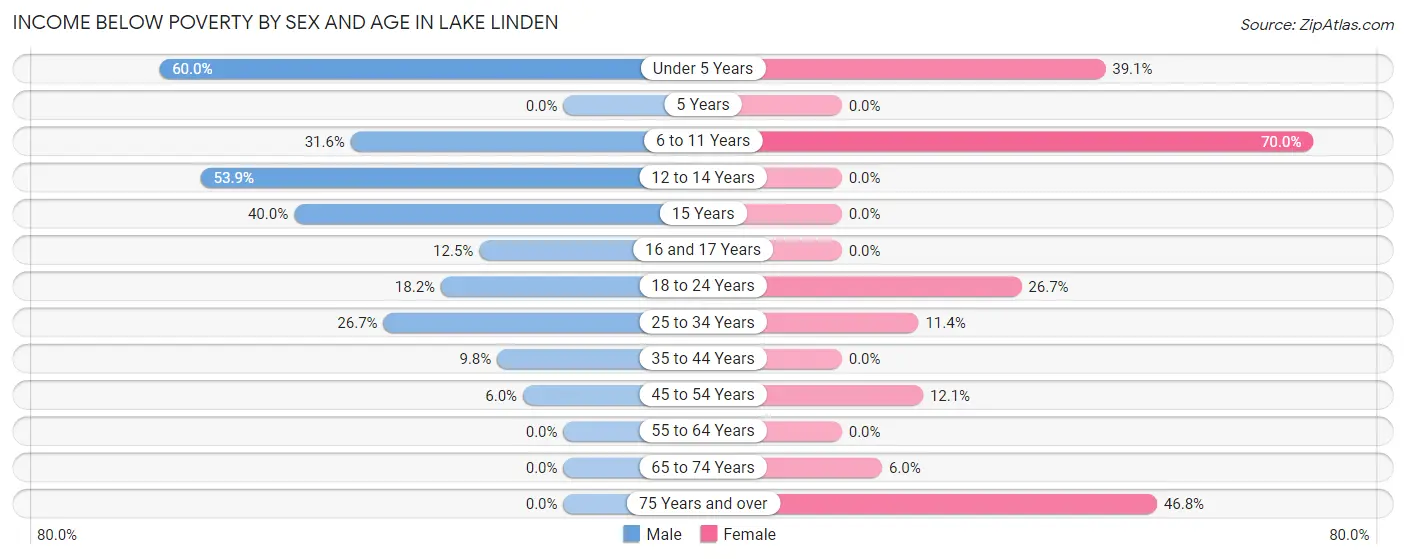
| Age Bracket | Male | Female |
| Under 5 Years | 12 (60.0%) | 9 (39.1%) |
| 5 Years | 0 (0.0%) | 0 (0.0%) |
| 6 to 11 Years | 6 (31.6%) | 14 (70.0%) |
| 12 to 14 Years | 7 (53.8%) | 0 (0.0%) |
| 15 Years | 12 (40.0%) | 0 (0.0%) |
| 16 and 17 Years | 6 (12.5%) | 0 (0.0%) |
| 18 to 24 Years | 10 (18.2%) | 24 (26.7%) |
| 25 to 34 Years | 31 (26.7%) | 9 (11.4%) |
| 35 to 44 Years | 6 (9.8%) | 0 (0.0%) |
| 45 to 54 Years | 3 (6.0%) | 10 (12.0%) |
| 55 to 64 Years | 0 (0.0%) | 0 (0.0%) |
| 65 to 74 Years | 0 (0.0%) | 4 (6.0%) |
| 75 Years and over | 0 (0.0%) | 51 (46.8%) |
| Total | 93 (16.2%) | 121 (20.0%) |
Income Above Poverty by Sex and Age in Lake Linden
According to the poverty statistics in Lake Linden, males aged 55 to 64 years and females aged 5 years are the age groups that are most secure financially, with 100.0% of males and 100.0% of females in these age groups living above the poverty line.
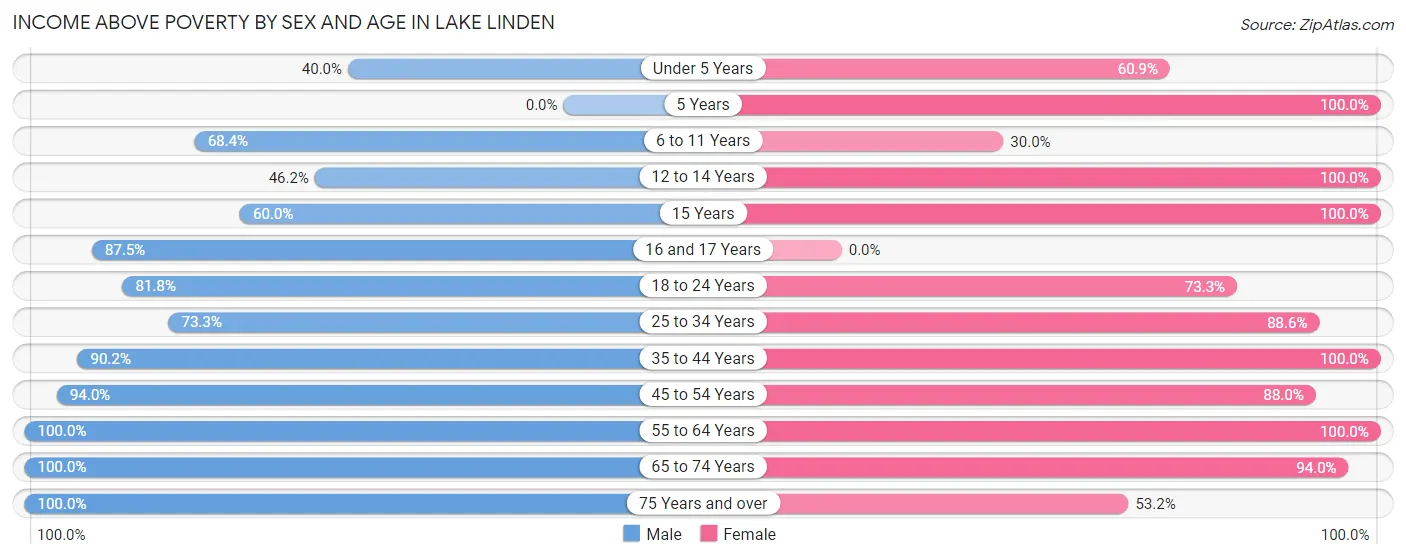
| Age Bracket | Male | Female |
| Under 5 Years | 8 (40.0%) | 14 (60.9%) |
| 5 Years | 0 (0.0%) | 4 (100.0%) |
| 6 to 11 Years | 13 (68.4%) | 6 (30.0%) |
| 12 to 14 Years | 6 (46.2%) | 14 (100.0%) |
| 15 Years | 18 (60.0%) | 11 (100.0%) |
| 16 and 17 Years | 42 (87.5%) | 0 (0.0%) |
| 18 to 24 Years | 45 (81.8%) | 66 (73.3%) |
| 25 to 34 Years | 85 (73.3%) | 70 (88.6%) |
| 35 to 44 Years | 55 (90.2%) | 45 (100.0%) |
| 45 to 54 Years | 47 (94.0%) | 73 (87.9%) |
| 55 to 64 Years | 62 (100.0%) | 60 (100.0%) |
| 65 to 74 Years | 40 (100.0%) | 63 (94.0%) |
| 75 Years and over | 61 (100.0%) | 58 (53.2%) |
| Total | 482 (83.8%) | 484 (80.0%) |
Income Below Poverty Among Married-Couple Families in Lake Linden
The poverty statistics for married-couple families in Lake Linden show that 2.4% or 5 of the total 208 families live below the poverty line. Families with 1 or 2 children have the highest poverty rate of 7.9%, comprising of 5 families. On the other hand, families with no children have the lowest poverty rate of 0.0%, which includes 0 families.
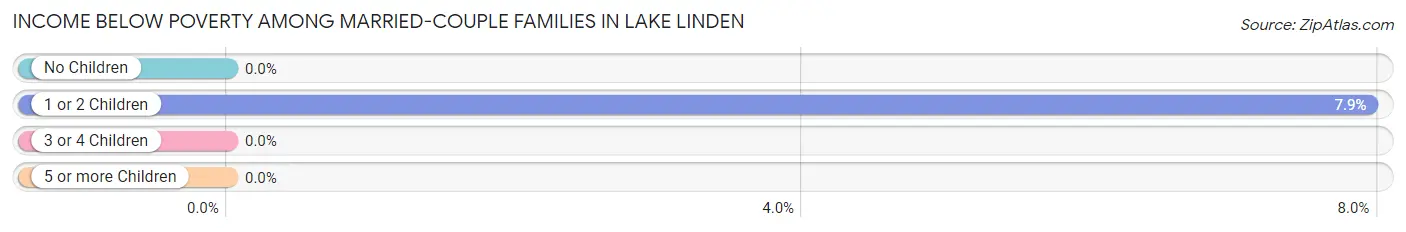
| Children | Above Poverty | Below Poverty |
| No Children | 139 (100.0%) | 0 (0.0%) |
| 1 or 2 Children | 58 (92.1%) | 5 (7.9%) |
| 3 or 4 Children | 6 (100.0%) | 0 (0.0%) |
| 5 or more Children | 0 (0.0%) | 0 (0.0%) |
| Total | 203 (97.6%) | 5 (2.4%) |
Income Below Poverty Among Single-Parent Households in Lake Linden
According to the poverty data in Lake Linden, 71.0% or 22 single-father households and 25.0% or 14 single-mother households are living below the poverty line. Among single-father households, those with 1 or 2 children have the highest poverty rate, with 22 households (100.0%) experiencing poverty. Likewise, among single-mother households, those with 3 or 4 children have the highest poverty rate, with 3 households (100.0%) falling below the poverty line.
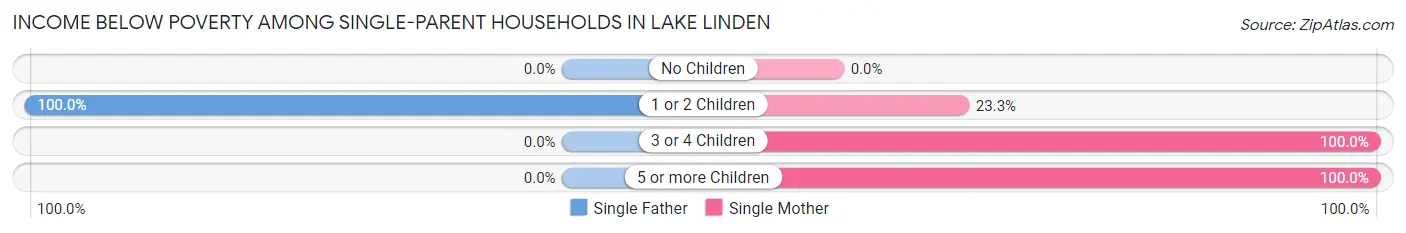
| Children | Single Father | Single Mother |
| No Children | 0 (0.0%) | 0 (0.0%) |
| 1 or 2 Children | 22 (100.0%) | 7 (23.3%) |
| 3 or 4 Children | 0 (0.0%) | 3 (100.0%) |
| 5 or more Children | 0 (0.0%) | 4 (100.0%) |
| Total | 22 (71.0%) | 14 (25.0%) |
Income Below Poverty Among Married-Couple vs Single-Parent Households in Lake Linden
The poverty data for Lake Linden shows that 5 of the married-couple family households (2.4%) and 36 of the single-parent households (41.4%) are living below the poverty level. Within the married-couple family households, those with 1 or 2 children have the highest poverty rate, with 5 households (7.9%) falling below the poverty line. Among the single-parent households, those with 3 or 4 children have the highest poverty rate, with 3 household (100.0%) living below poverty.
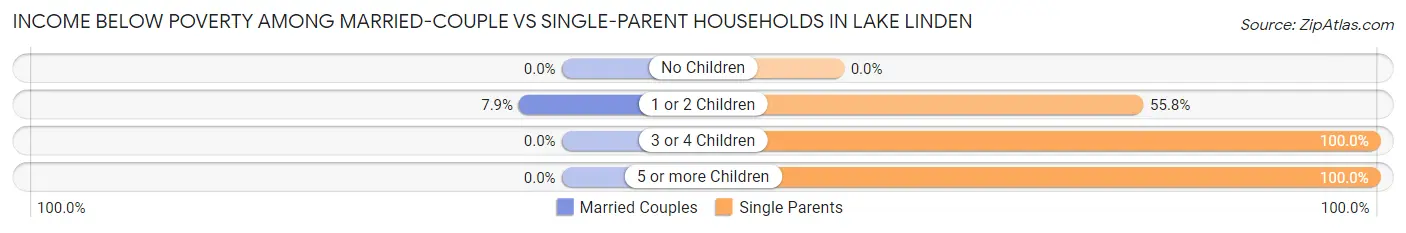
| Children | Married-Couple Families | Single-Parent Households |
| No Children | 0 (0.0%) | 0 (0.0%) |
| 1 or 2 Children | 5 (7.9%) | 29 (55.8%) |
| 3 or 4 Children | 0 (0.0%) | 3 (100.0%) |
| 5 or more Children | 0 (0.0%) | 4 (100.0%) |
| Total | 5 (2.4%) | 36 (41.4%) |
Race in Lake Linden
The most populous races in Lake Linden are White / Caucasian (1,124 | 95.0%), Hispanic or Latino (36 | 3.0%), and Two or more Races (25 | 2.1%).
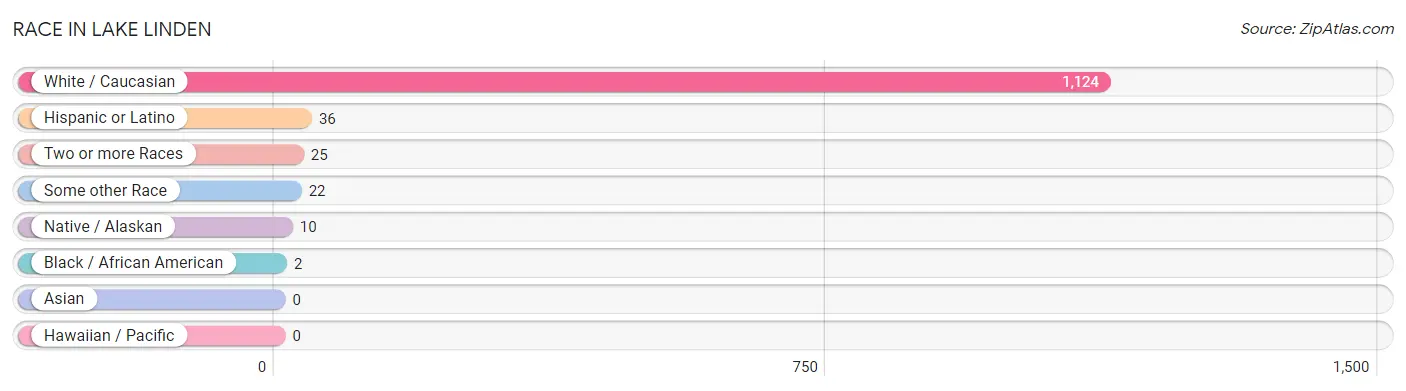
| Race | # Population | % Population |
| Asian | 0 | 0.0% |
| Black / African American | 2 | 0.2% |
| Hawaiian / Pacific | 0 | 0.0% |
| Hispanic or Latino | 36 | 3.0% |
| Native / Alaskan | 10 | 0.9% |
| White / Caucasian | 1,124 | 95.0% |
| Two or more Races | 25 | 2.1% |
| Some other Race | 22 | 1.9% |
| Total | 1,183 | 100.0% |
Ancestry in Lake Linden
The most populous ancestries reported in Lake Linden are Finnish (353 | 29.8%), German (219 | 18.5%), French (208 | 17.6%), French Canadian (141 | 11.9%), and English (118 | 10.0%), together accounting for 87.8% of all Lake Linden residents.
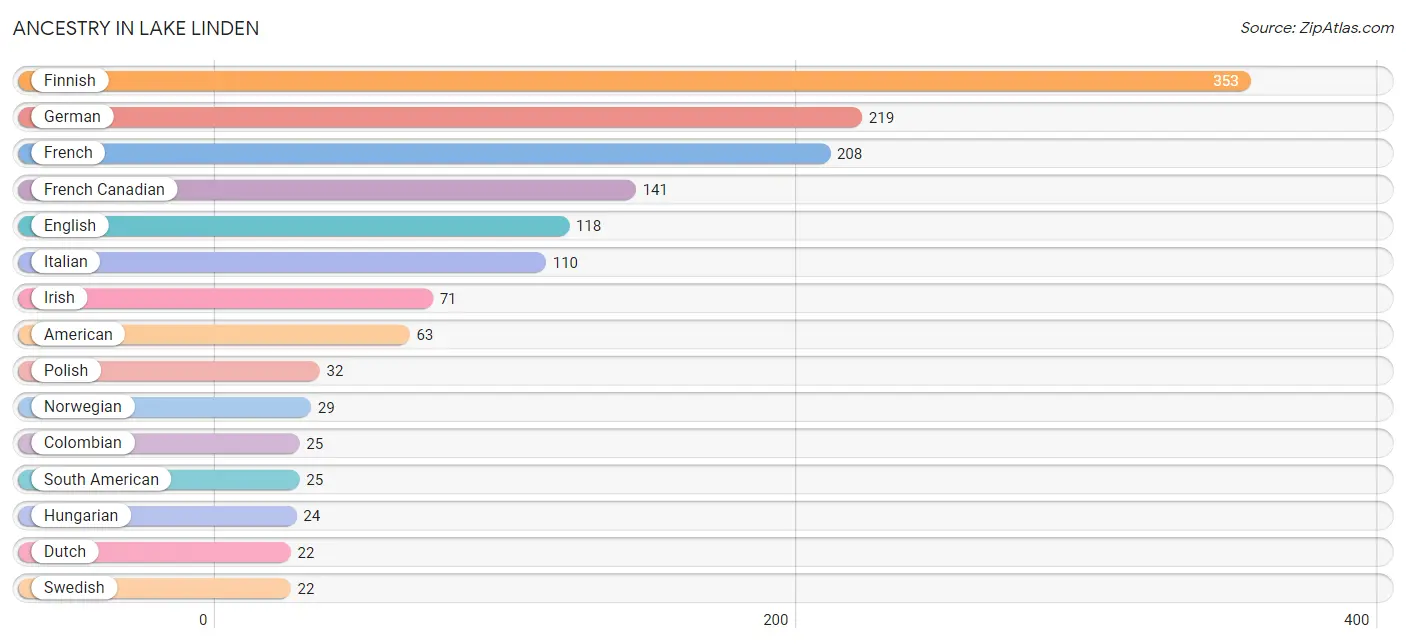
| Ancestry | # Population | % Population |
| American | 63 | 5.3% |
| Armenian | 2 | 0.2% |
| Austrian | 6 | 0.5% |
| Canadian | 4 | 0.3% |
| Chippewa | 10 | 0.9% |
| Colombian | 25 | 2.1% |
| Croatian | 12 | 1.0% |
| Czech | 17 | 1.4% |
| Dutch | 22 | 1.9% |
| English | 118 | 10.0% |
| European | 7 | 0.6% |
| Finnish | 353 | 29.8% |
| French | 208 | 17.6% |
| French Canadian | 141 | 11.9% |
| German | 219 | 18.5% |
| Hungarian | 24 | 2.0% |
| Irish | 71 | 6.0% |
| Italian | 110 | 9.3% |
| Lithuanian | 7 | 0.6% |
| Mexican | 11 | 0.9% |
| Northern European | 3 | 0.3% |
| Norwegian | 29 | 2.5% |
| Polish | 32 | 2.7% |
| Russian | 10 | 0.9% |
| Scandinavian | 9 | 0.8% |
| Scotch-Irish | 16 | 1.3% |
| Scottish | 8 | 0.7% |
| Sioux | 5 | 0.4% |
| Slovak | 3 | 0.3% |
| Slovene | 13 | 1.1% |
| South American | 25 | 2.1% |
| Swedish | 22 | 1.9% |
| Ukrainian | 5 | 0.4% | View All 33 Rows |
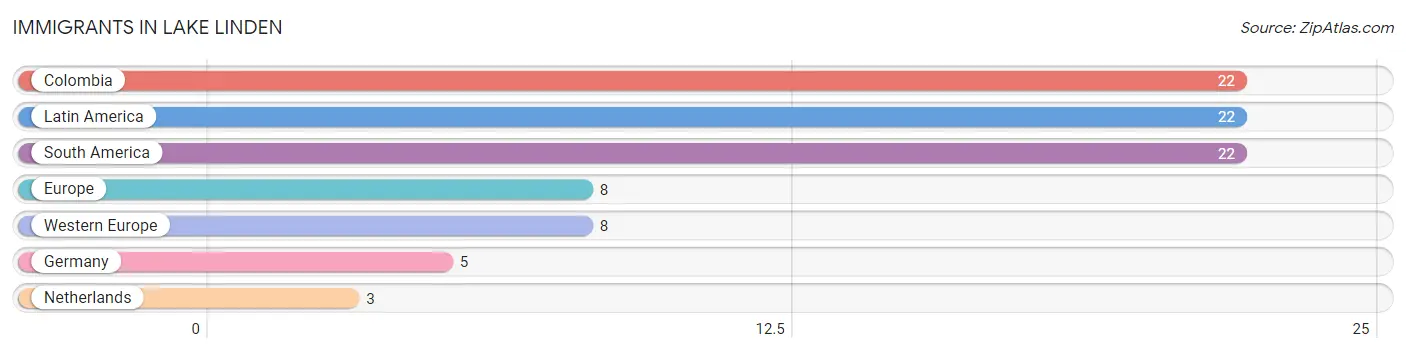
Immigrants in Lake Linden
The most numerous immigrant groups reported in Lake Linden came from Colombia (22 | 1.9%), Latin America (22 | 1.9%), South America (22 | 1.9%), Europe (8 | 0.7%), and Western Europe (8 | 0.7%), together accounting for 6.9% of all Lake Linden residents.
| Immigration Origin | # Population | % Population |
| Colombia | 22 | 1.9% |
| Europe | 8 | 0.7% |
| Germany | 5 | 0.4% |
| Latin America | 22 | 1.9% |
| Netherlands | 3 | 0.3% |
| South America | 22 | 1.9% |
| Western Europe | 8 | 0.7% | View All 7 Rows |
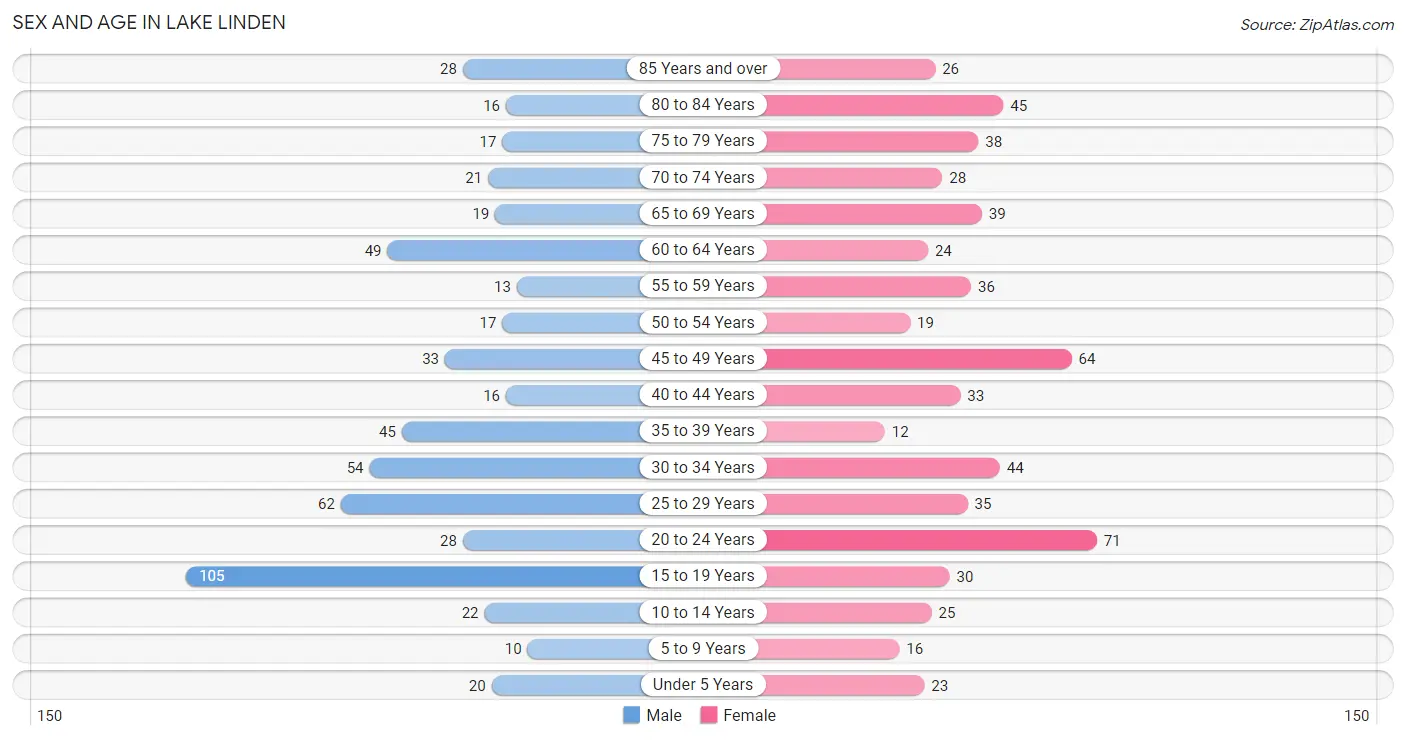
Sex and Age in Lake Linden
Sex and Age in Lake Linden
The most populous age groups in Lake Linden are 15 to 19 Years (105 | 18.3%) for men and 20 to 24 Years (71 | 11.7%) for women.
| Age Bracket | Male | Female |
| Under 5 Years | 20 (3.5%) | 23 (3.8%) |
| 5 to 9 Years | 10 (1.7%) | 16 (2.6%) |
| 10 to 14 Years | 22 (3.8%) | 25 (4.1%) |
| 15 to 19 Years | 105 (18.3%) | 30 (4.9%) |
| 20 to 24 Years | 28 (4.9%) | 71 (11.7%) |
| 25 to 29 Years | 62 (10.8%) | 35 (5.8%) |
| 30 to 34 Years | 54 (9.4%) | 44 (7.2%) |
| 35 to 39 Years | 45 (7.8%) | 12 (2.0%) |
| 40 to 44 Years | 16 (2.8%) | 33 (5.4%) |
| 45 to 49 Years | 33 (5.7%) | 64 (10.5%) |
| 50 to 54 Years | 17 (3.0%) | 19 (3.1%) |
| 55 to 59 Years | 13 (2.3%) | 36 (5.9%) |
| 60 to 64 Years | 49 (8.5%) | 24 (4.0%) |
| 65 to 69 Years | 19 (3.3%) | 39 (6.4%) |
| 70 to 74 Years | 21 (3.6%) | 28 (4.6%) |
| 75 to 79 Years | 17 (3.0%) | 38 (6.2%) |
| 80 to 84 Years | 16 (2.8%) | 45 (7.4%) |
| 85 Years and over | 28 (4.9%) | 26 (4.3%) |
| Total | 575 (100.0%) | 608 (100.0%) |
Families and Households in Lake Linden
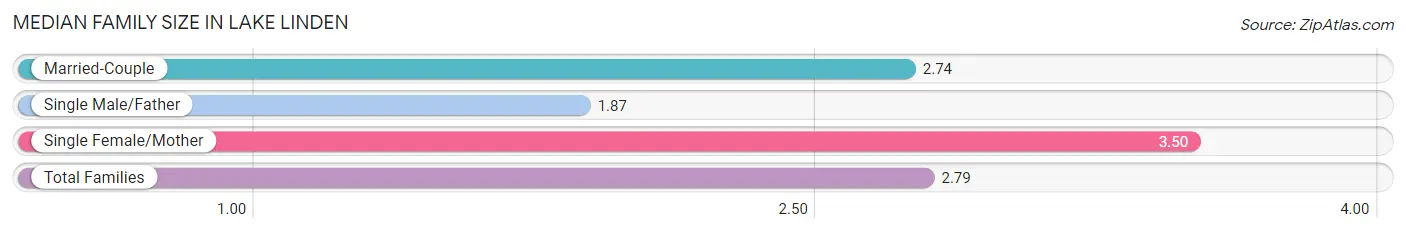
Median Family Size in Lake Linden
The median family size in Lake Linden is 2.79 persons per family, with single female/mother families (56 | 19.0%) accounting for the largest median family size of 3.5 persons per family. On the other hand, single male/father families (31 | 10.5%) represent the smallest median family size with 1.87 persons per family.
| Family Type | # Families | Family Size |
| Married-Couple | 208 (70.5%) | 2.74 |
| Single Male/Father | 31 (10.5%) | 1.87 |
| Single Female/Mother | 56 (19.0%) | 3.50 |
| Total Families | 295 (100.0%) | 2.79 |
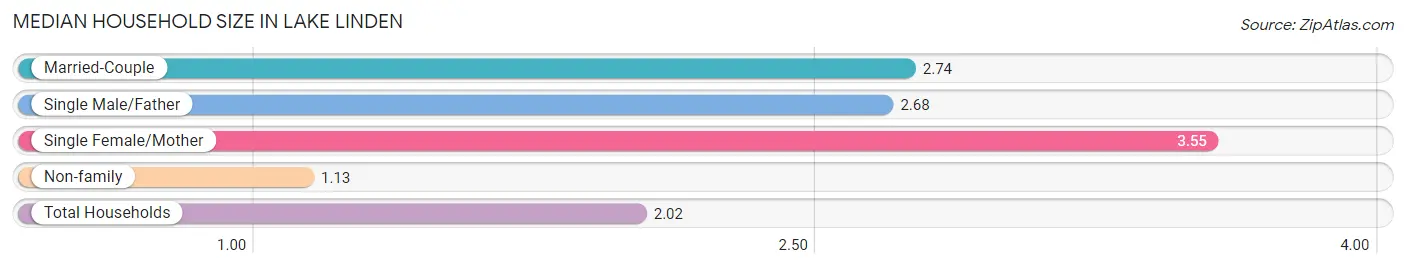
Median Household Size in Lake Linden
The median household size in Lake Linden is 2.02 persons per household, with single female/mother households (56 | 9.6%) accounting for the largest median household size of 3.55 persons per household. non-family households (286 | 49.2%) represent the smallest median household size with 1.13 persons per household.
| Household Type | # Households | Household Size |
| Married-Couple | 208 (35.8%) | 2.74 |
| Single Male/Father | 31 (5.3%) | 2.68 |
| Single Female/Mother | 56 (9.6%) | 3.55 |
| Non-family | 286 (49.2%) | 1.13 |
| Total Households | 581 (100.0%) | 2.02 |
Household Size by Marriage Status in Lake Linden
Out of a total of 581 households in Lake Linden, 295 (50.8%) are family households, while 286 (49.2%) are nonfamily households. The most numerous type of family households are 2-person households, comprising 152, and the most common type of nonfamily households are 1-person households, comprising 246.
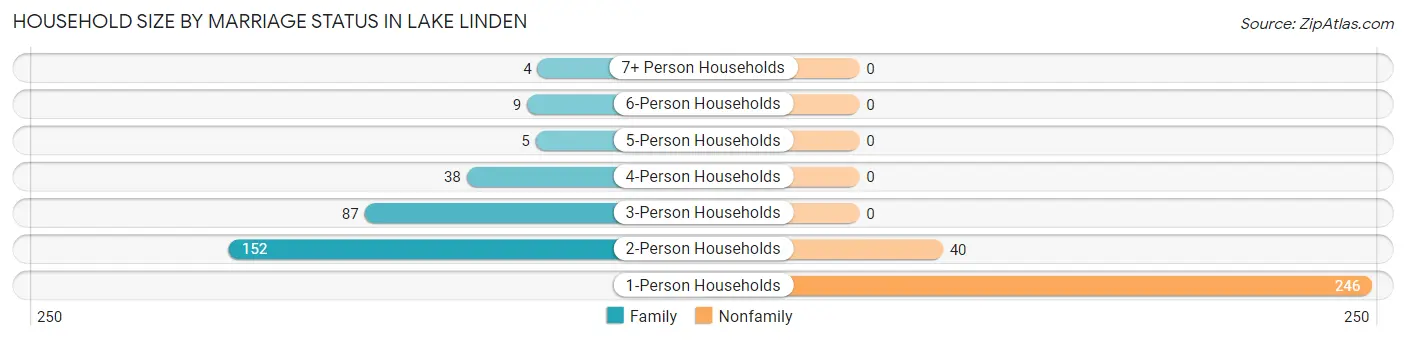
| Household Size | Family Households | Nonfamily Households |
| 1-Person Households | - | 246 (42.3%) |
| 2-Person Households | 152 (26.2%) | 40 (6.9%) |
| 3-Person Households | 87 (15.0%) | 0 (0.0%) |
| 4-Person Households | 38 (6.5%) | 0 (0.0%) |
| 5-Person Households | 5 (0.9%) | 0 (0.0%) |
| 6-Person Households | 9 (1.5%) | 0 (0.0%) |
| 7+ Person Households | 4 (0.7%) | 0 (0.0%) |
| Total | 295 (50.8%) | 286 (49.2%) |
Female Fertility in Lake Linden
Fertility by Age in Lake Linden
Average fertility rate in Lake Linden is 24.0 births per 1,000 women. Women in the age bracket of 20 to 34 years have the highest fertility rate with 47.0 births per 1,000 women. Women in the age bracket of 20 to 34 years acount for 100.0% of all women with births.
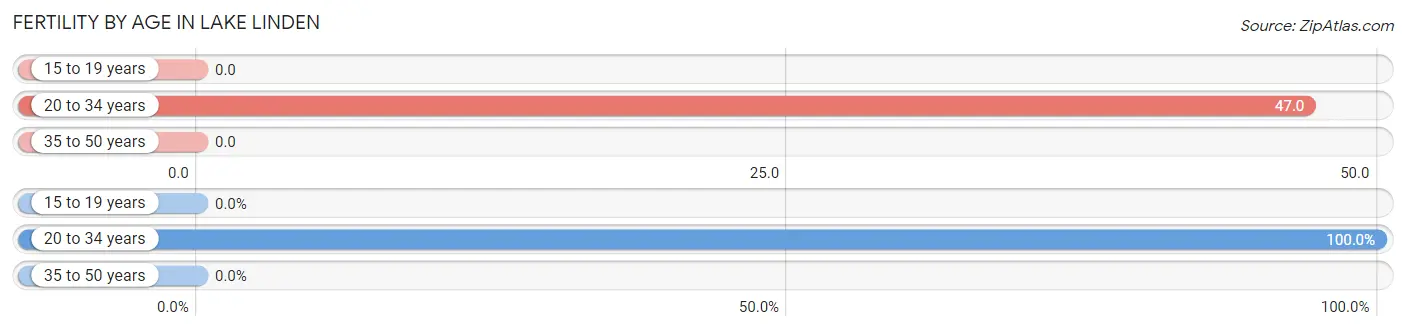
| Age Bracket | Women with Births | Births / 1,000 Women |
| 15 to 19 years | 0 (0.0%) | 0.0 |
| 20 to 34 years | 7 (100.0%) | 47.0 |
| 35 to 50 years | 0 (0.0%) | 0.0 |
| Total | 7 (100.0%) | 24.0 |
Fertility by Age by Marriage Status in Lake Linden
42.9% of women with births (7) in Lake Linden are married. The highest percentage of unmarried women with births falls into 20 to 34 years age bracket with 57.1% of them unmarried at the time of birth, while the lowest percentage of unmarried women with births belong to 20 to 34 years age bracket with 57.1% of them unmarried.
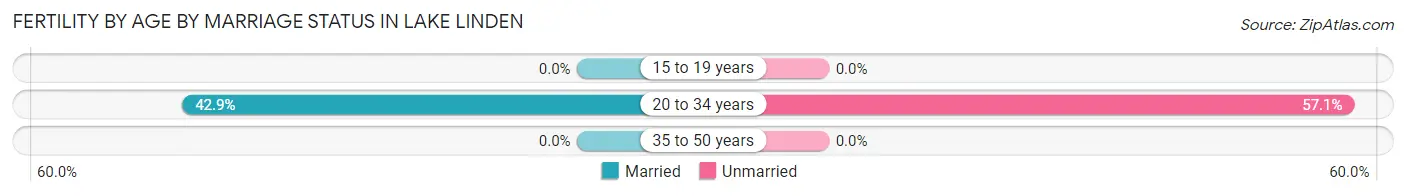
| Age Bracket | Married | Unmarried |
| 15 to 19 years | 0 (0.0%) | 0 (0.0%) |
| 20 to 34 years | 3 (42.9%) | 4 (57.1%) |
| 35 to 50 years | 0 (0.0%) | 0 (0.0%) |
| Total | 3 (42.9%) | 4 (57.1%) |
Fertility by Education in Lake Linden
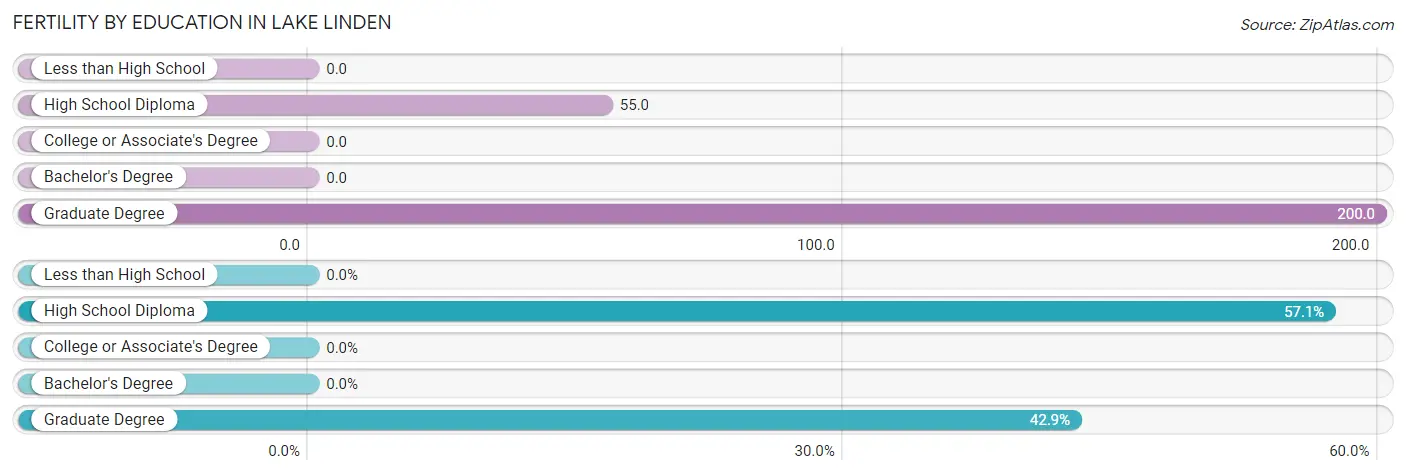
| Educational Attainment | Women with Births | Births / 1,000 Women |
| Less than High School | 0 (0.0%) | 0.0 |
| High School Diploma | 4 (57.1%) | 55.0 |
| College or Associate's Degree | 0 (0.0%) | 0.0 |
| Bachelor's Degree | 0 (0.0%) | 0.0 |
| Graduate Degree | 3 (42.9%) | 200.0 |
| Total | 7 (100.0%) | 24.0 |
Fertility by Education by Marriage Status in Lake Linden
57.1% of women with births in Lake Linden are unmarried. Women with the educational attainment of graduate degree are most likely to be married with 100.0% of them married at childbirth, while women with the educational attainment of high school diploma are least likely to be married with 100.0% of them unmarried at childbirth.
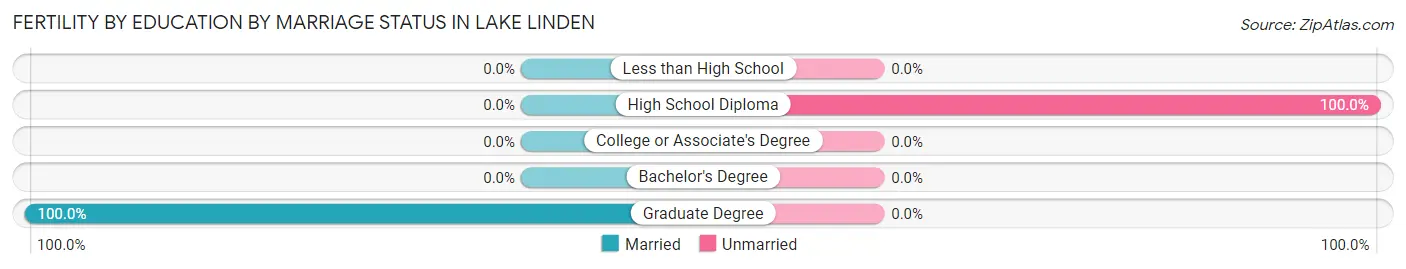
| Educational Attainment | Married | Unmarried |
| Less than High School | 0 (0.0%) | 0 (0.0%) |
| High School Diploma | 0 (0.0%) | 4 (100.0%) |
| College or Associate's Degree | 0 (0.0%) | 0 (0.0%) |
| Bachelor's Degree | 0 (0.0%) | 0 (0.0%) |
| Graduate Degree | 3 (100.0%) | 0 (0.0%) |
| Total | 3 (42.9%) | 4 (57.1%) |
Employment Characteristics in Lake Linden
Employment by Class of Employer in Lake Linden
Among the 555 employed individuals in Lake Linden, private company employees (337 | 60.7%), not-for-profit organizations (84 | 15.1%), and local government employees (46 | 8.3%) make up the most common classes of employment.
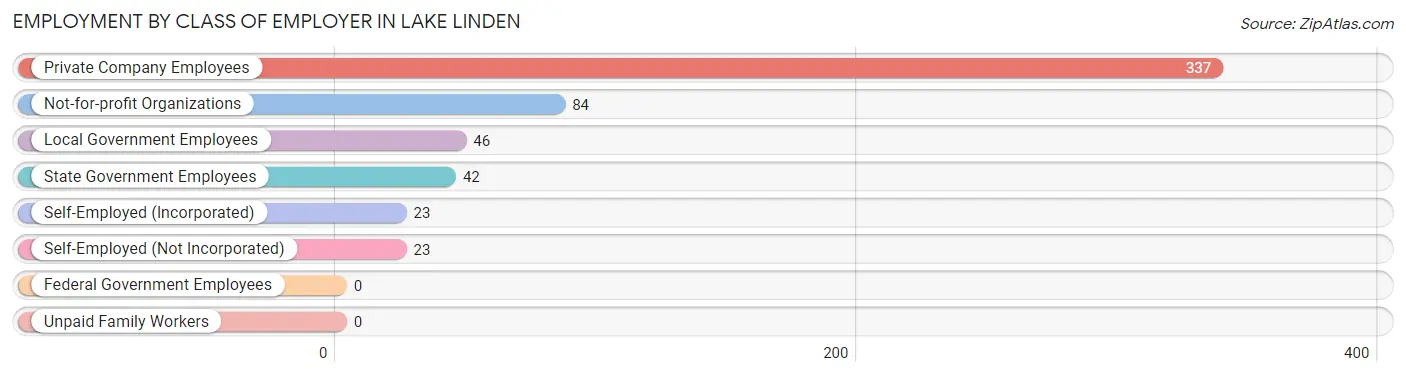
| Employer Class | # Employees | % Employees |
| Private Company Employees | 337 | 60.7% |
| Self-Employed (Incorporated) | 23 | 4.1% |
| Self-Employed (Not Incorporated) | 23 | 4.1% |
| Not-for-profit Organizations | 84 | 15.1% |
| Local Government Employees | 46 | 8.3% |
| State Government Employees | 42 | 7.6% |
| Federal Government Employees | 0 | 0.0% |
| Unpaid Family Workers | 0 | 0.0% |
| Total | 555 | 100.0% |
Employment Status by Age in Lake Linden
According to the labor force statistics for Lake Linden, out of the total population over 16 years of age (1,026), 60.1% or 617 individuals are in the labor force, with 10.0% or 62 of them unemployed. The age group with the highest labor force participation rate is 25 to 29 years, with 91.8% or 89 individuals in the labor force. Within the labor force, the 30 to 34 years age range has the highest percentage of unemployed individuals, with 38.6% or 22 of them being unemployed.
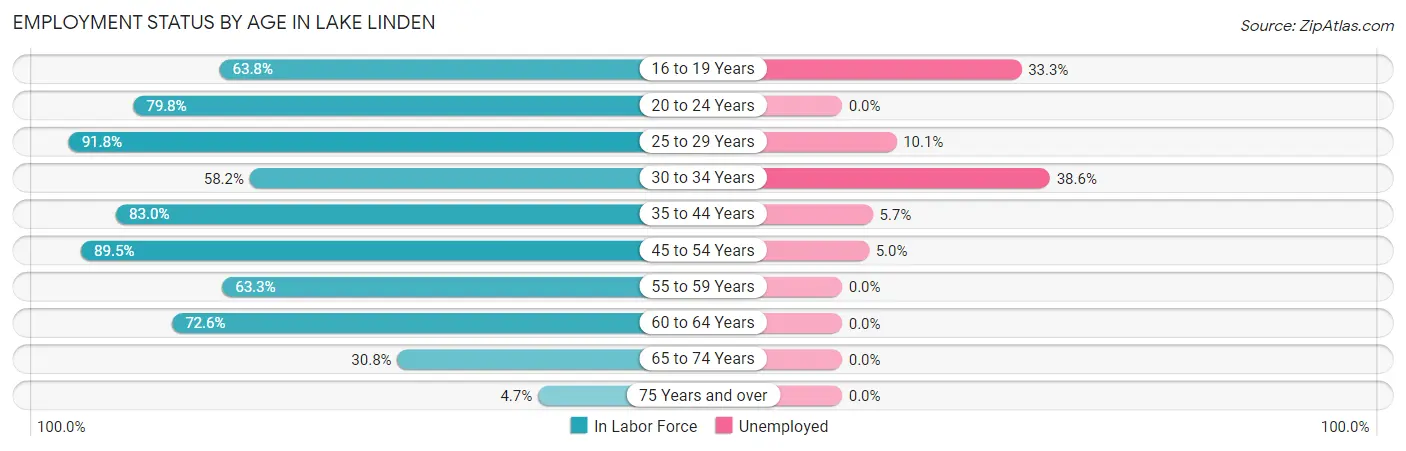
| Age Bracket | In Labor Force | Unemployed |
| 16 to 19 Years | 60 (63.8%) | 20 (33.3%) |
| 20 to 24 Years | 79 (79.8%) | 0 (0.0%) |
| 25 to 29 Years | 89 (91.8%) | 9 (10.1%) |
| 30 to 34 Years | 57 (58.2%) | 22 (38.6%) |
| 35 to 44 Years | 88 (83.0%) | 5 (5.7%) |
| 45 to 54 Years | 119 (89.5%) | 6 (5.0%) |
| 55 to 59 Years | 31 (63.3%) | 0 (0.0%) |
| 60 to 64 Years | 53 (72.6%) | 0 (0.0%) |
| 65 to 74 Years | 33 (30.8%) | 0 (0.0%) |
| 75 Years and over | 8 (4.7%) | 0 (0.0%) |
| Total | 617 (60.1%) | 62 (10.0%) |
Employment Status by Educational Attainment in Lake Linden
According to labor force statistics for Lake Linden, 78.6% of individuals (437) out of the total population between 25 and 64 years of age (556) are in the labor force, with 9.6% or 42 of them being unemployed. The group with the highest labor force participation rate are those with the educational attainment of bachelor's degree or higher, with 100.0% or 135 individuals in the labor force. Within the labor force, individuals with high school diploma education have the highest percentage of unemployment, with 14.3% or 22 of them being unemployed.
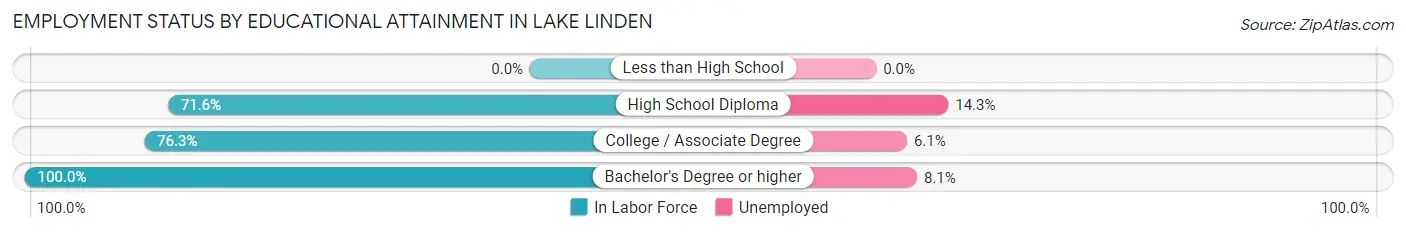
| Educational Attainment | In Labor Force | Unemployed |
| Less than High School | 0 (0.0%) | 0 (0.0%) |
| High School Diploma | 154 (71.6%) | 31 (14.3%) |
| College / Associate Degree | 148 (76.3%) | 12 (6.1%) |
| Bachelor's Degree or higher | 135 (100.0%) | 11 (8.1%) |
| Total | 437 (78.6%) | 53 (9.6%) |
Employment Occupations by Sex in Lake Linden
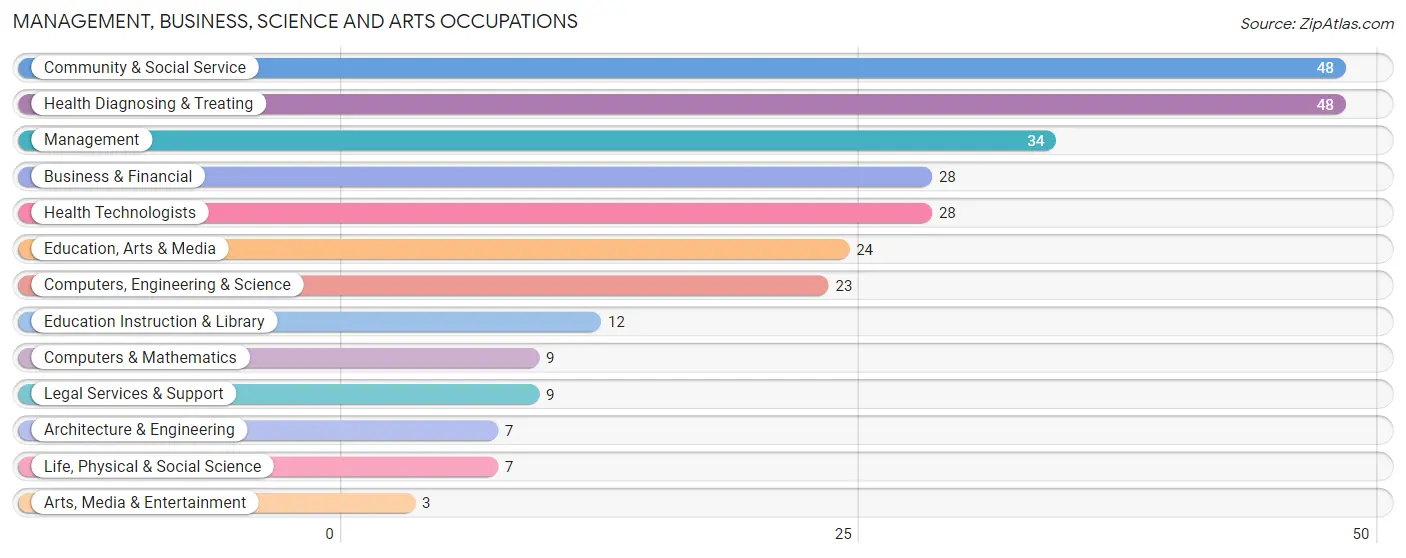
Management, Business, Science and Arts Occupations
The most common Management, Business, Science and Arts occupations in Lake Linden are Community & Social Service (48 | 8.6%), Health Diagnosing & Treating (48 | 8.6%), Management (34 | 6.1%), Business & Financial (28 | 5.1%), and Health Technologists (28 | 5.1%).
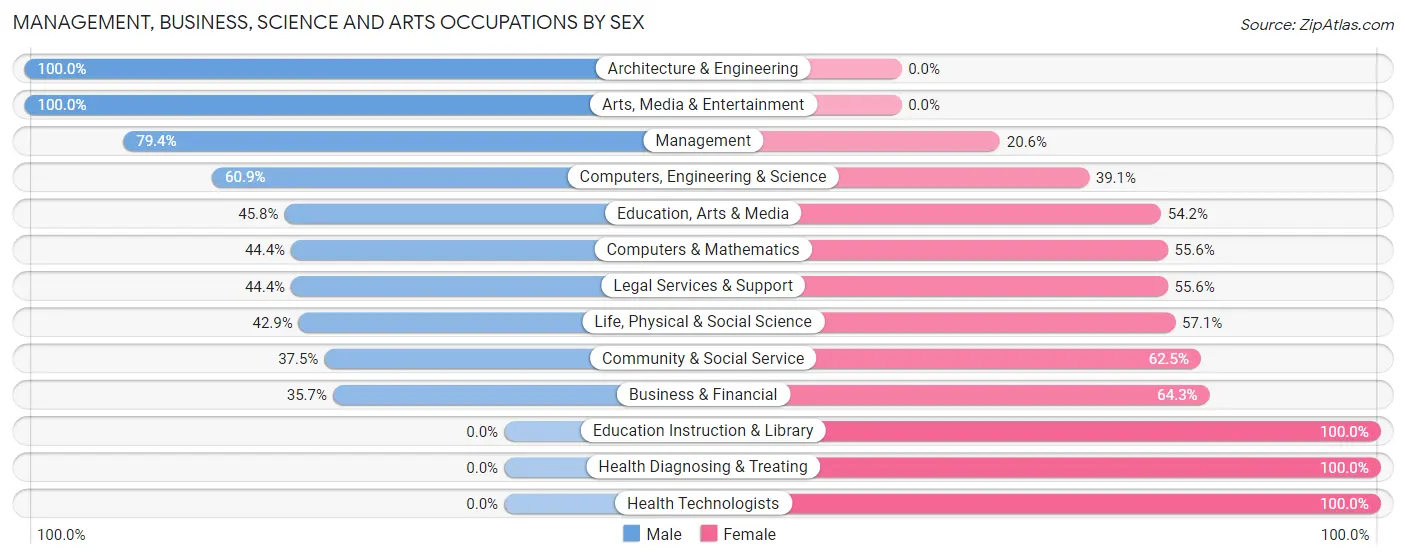
Management, Business, Science and Arts Occupations by Sex
Within the Management, Business, Science and Arts occupations in Lake Linden, the most male-oriented occupations are Architecture & Engineering (100.0%), Arts, Media & Entertainment (100.0%), and Management (79.4%), while the most female-oriented occupations are Education Instruction & Library (100.0%), Health Diagnosing & Treating (100.0%), and Health Technologists (100.0%).
| Occupation | Male | Female |
| Management | 27 (79.4%) | 7 (20.6%) |
| Business & Financial | 10 (35.7%) | 18 (64.3%) |
| Computers, Engineering & Science | 14 (60.9%) | 9 (39.1%) |
| Computers & Mathematics | 4 (44.4%) | 5 (55.6%) |
| Architecture & Engineering | 7 (100.0%) | 0 (0.0%) |
| Life, Physical & Social Science | 3 (42.9%) | 4 (57.1%) |
| Community & Social Service | 18 (37.5%) | 30 (62.5%) |
| Education, Arts & Media | 11 (45.8%) | 13 (54.2%) |
| Legal Services & Support | 4 (44.4%) | 5 (55.6%) |
| Education Instruction & Library | 0 (0.0%) | 12 (100.0%) |
| Arts, Media & Entertainment | 3 (100.0%) | 0 (0.0%) |
| Health Diagnosing & Treating | 0 (0.0%) | 48 (100.0%) |
| Health Technologists | 0 (0.0%) | 28 (100.0%) |
| Total (Category) | 69 (38.1%) | 112 (61.9%) |
| Total (Overall) | 267 (48.1%) | 288 (51.9%) |
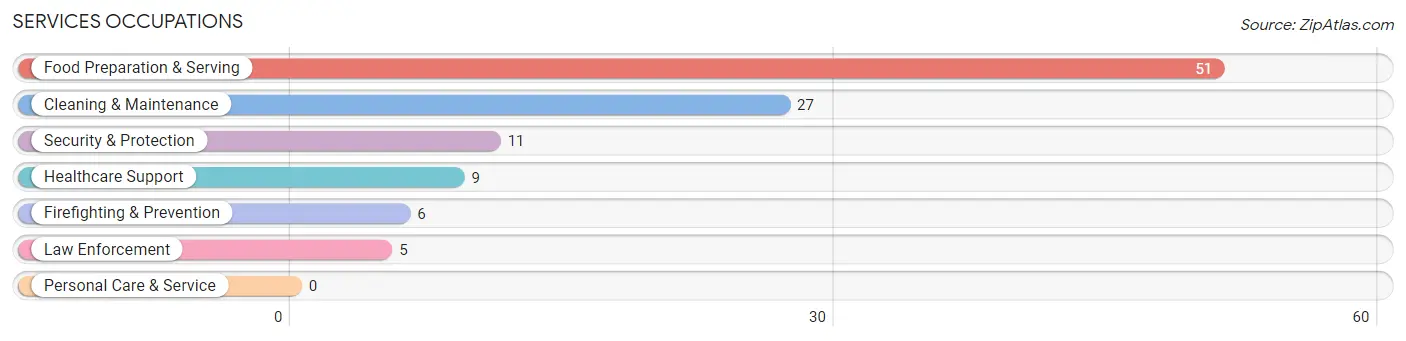
Services Occupations
The most common Services occupations in Lake Linden are Food Preparation & Serving (51 | 9.2%), Cleaning & Maintenance (27 | 4.9%), Security & Protection (11 | 2.0%), Healthcare Support (9 | 1.6%), and Firefighting & Prevention (6 | 1.1%).
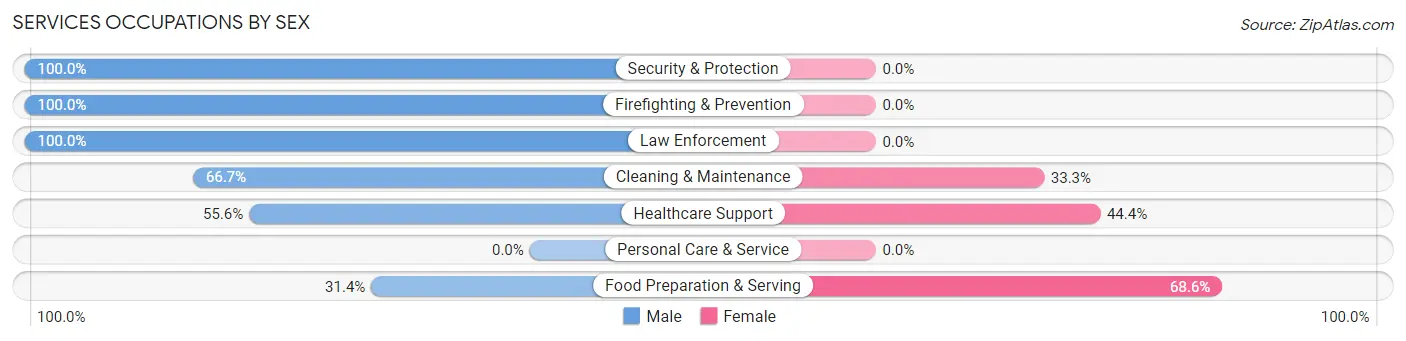
Services Occupations by Sex
Within the Services occupations in Lake Linden, the most male-oriented occupations are Security & Protection (100.0%), Firefighting & Prevention (100.0%), and Law Enforcement (100.0%), while the most female-oriented occupations are Food Preparation & Serving (68.6%), Healthcare Support (44.4%), and Cleaning & Maintenance (33.3%).
| Occupation | Male | Female |
| Healthcare Support | 5 (55.6%) | 4 (44.4%) |
| Security & Protection | 11 (100.0%) | 0 (0.0%) |
| Firefighting & Prevention | 6 (100.0%) | 0 (0.0%) |
| Law Enforcement | 5 (100.0%) | 0 (0.0%) |
| Food Preparation & Serving | 16 (31.4%) | 35 (68.6%) |
| Cleaning & Maintenance | 18 (66.7%) | 9 (33.3%) |
| Personal Care & Service | 0 (0.0%) | 0 (0.0%) |
| Total (Category) | 50 (51.0%) | 48 (49.0%) |
| Total (Overall) | 267 (48.1%) | 288 (51.9%) |
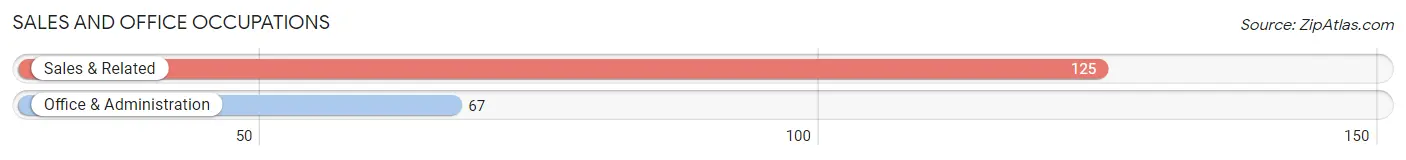
Sales and Office Occupations
The most common Sales and Office occupations in Lake Linden are Sales & Related (125 | 22.5%), and Office & Administration (67 | 12.1%).
Sales and Office Occupations by Sex
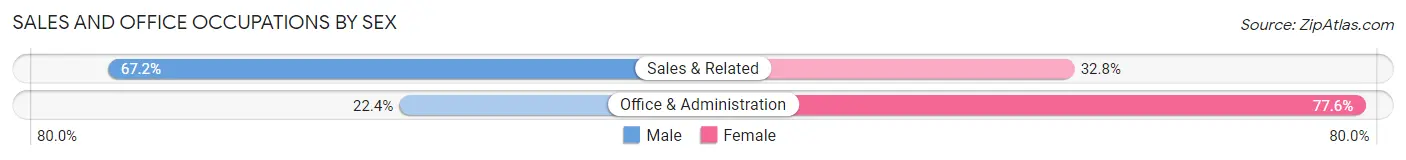
| Occupation | Male | Female |
| Sales & Related | 84 (67.2%) | 41 (32.8%) |
| Office & Administration | 15 (22.4%) | 52 (77.6%) |
| Total (Category) | 99 (51.6%) | 93 (48.4%) |
| Total (Overall) | 267 (48.1%) | 288 (51.9%) |
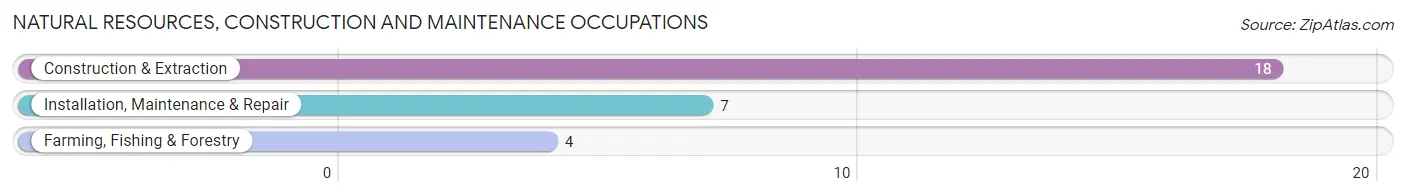
Natural Resources, Construction and Maintenance Occupations
The most common Natural Resources, Construction and Maintenance occupations in Lake Linden are Construction & Extraction (18 | 3.2%), Installation, Maintenance & Repair (7 | 1.3%), and Farming, Fishing & Forestry (4 | 0.7%).
Natural Resources, Construction and Maintenance Occupations by Sex
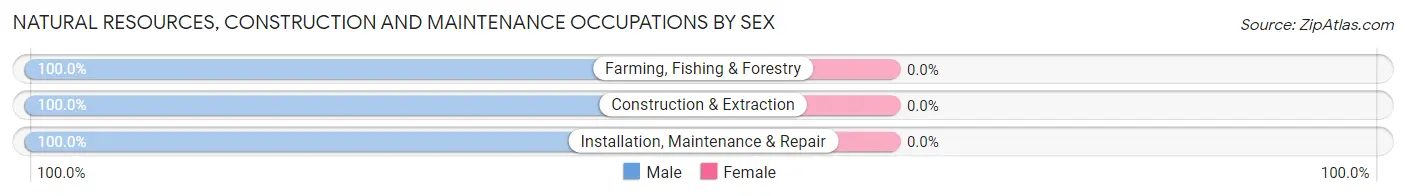
| Occupation | Male | Female |
| Farming, Fishing & Forestry | 4 (100.0%) | 0 (0.0%) |
| Construction & Extraction | 18 (100.0%) | 0 (0.0%) |
| Installation, Maintenance & Repair | 7 (100.0%) | 0 (0.0%) |
| Total (Category) | 29 (100.0%) | 0 (0.0%) |
| Total (Overall) | 267 (48.1%) | 288 (51.9%) |
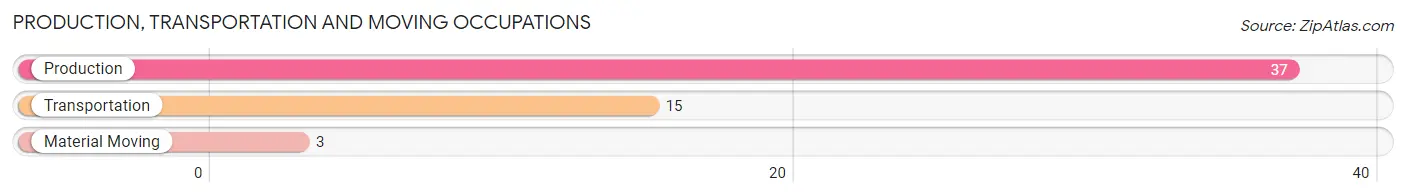
Production, Transportation and Moving Occupations
The most common Production, Transportation and Moving occupations in Lake Linden are Production (37 | 6.7%), Transportation (15 | 2.7%), and Material Moving (3 | 0.5%).
Production, Transportation and Moving Occupations by Sex
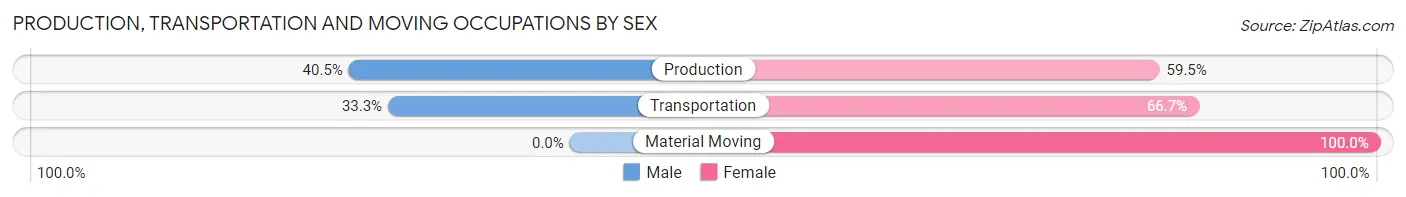
| Occupation | Male | Female |
| Production | 15 (40.5%) | 22 (59.5%) |
| Transportation | 5 (33.3%) | 10 (66.7%) |
| Material Moving | 0 (0.0%) | 3 (100.0%) |
| Total (Category) | 20 (36.4%) | 35 (63.6%) |
| Total (Overall) | 267 (48.1%) | 288 (51.9%) |
Employment Industries by Sex in Lake Linden
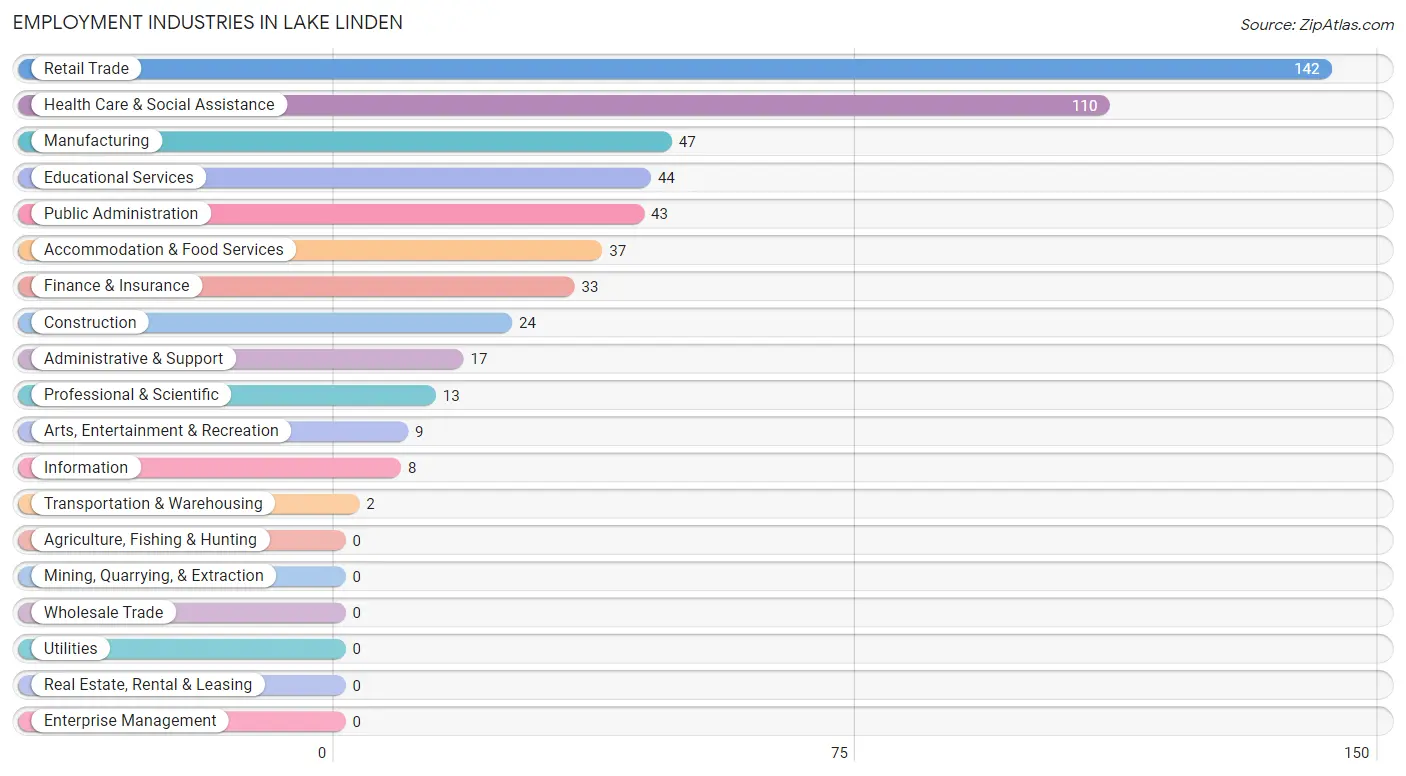
Employment Industries in Lake Linden
The major employment industries in Lake Linden include Retail Trade (142 | 25.6%), Health Care & Social Assistance (110 | 19.8%), Manufacturing (47 | 8.5%), Educational Services (44 | 7.9%), and Public Administration (43 | 7.7%).
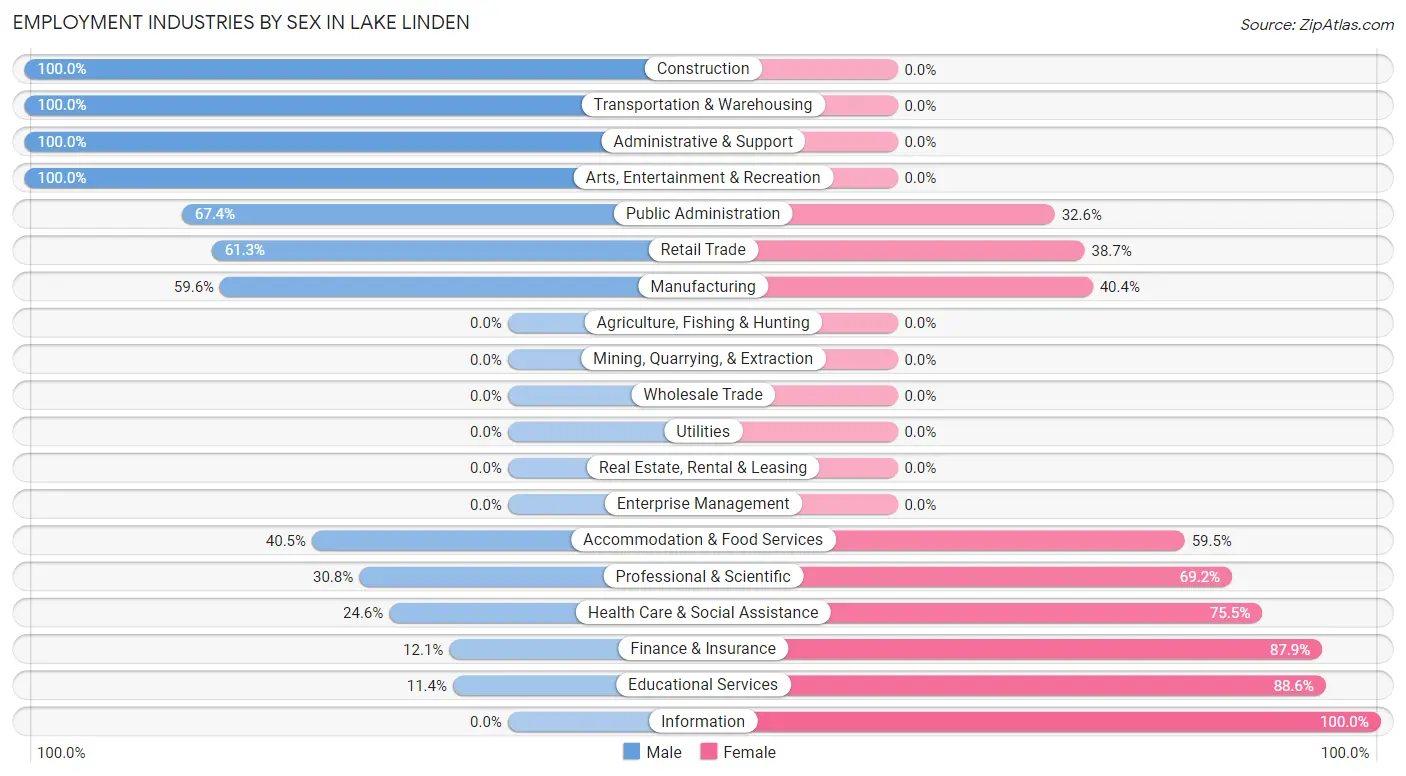
Employment Industries by Sex in Lake Linden
The Lake Linden industries that see more men than women are Construction (100.0%), Transportation & Warehousing (100.0%), and Administrative & Support (100.0%), whereas the industries that tend to have a higher number of women are Information (100.0%), Educational Services (88.6%), and Finance & Insurance (87.9%).
| Industry | Male | Female |
| Agriculture, Fishing & Hunting | 0 (0.0%) | 0 (0.0%) |
| Mining, Quarrying, & Extraction | 0 (0.0%) | 0 (0.0%) |
| Construction | 24 (100.0%) | 0 (0.0%) |
| Manufacturing | 28 (59.6%) | 19 (40.4%) |
| Wholesale Trade | 0 (0.0%) | 0 (0.0%) |
| Retail Trade | 87 (61.3%) | 55 (38.7%) |
| Transportation & Warehousing | 2 (100.0%) | 0 (0.0%) |
| Utilities | 0 (0.0%) | 0 (0.0%) |
| Information | 0 (0.0%) | 8 (100.0%) |
| Finance & Insurance | 4 (12.1%) | 29 (87.9%) |
| Real Estate, Rental & Leasing | 0 (0.0%) | 0 (0.0%) |
| Professional & Scientific | 4 (30.8%) | 9 (69.2%) |
| Enterprise Management | 0 (0.0%) | 0 (0.0%) |
| Administrative & Support | 17 (100.0%) | 0 (0.0%) |
| Educational Services | 5 (11.4%) | 39 (88.6%) |
| Health Care & Social Assistance | 27 (24.5%) | 83 (75.4%) |
| Arts, Entertainment & Recreation | 9 (100.0%) | 0 (0.0%) |
| Accommodation & Food Services | 15 (40.5%) | 22 (59.5%) |
| Public Administration | 29 (67.4%) | 14 (32.6%) |
| Total | 267 (48.1%) | 288 (51.9%) |
Education in Lake Linden
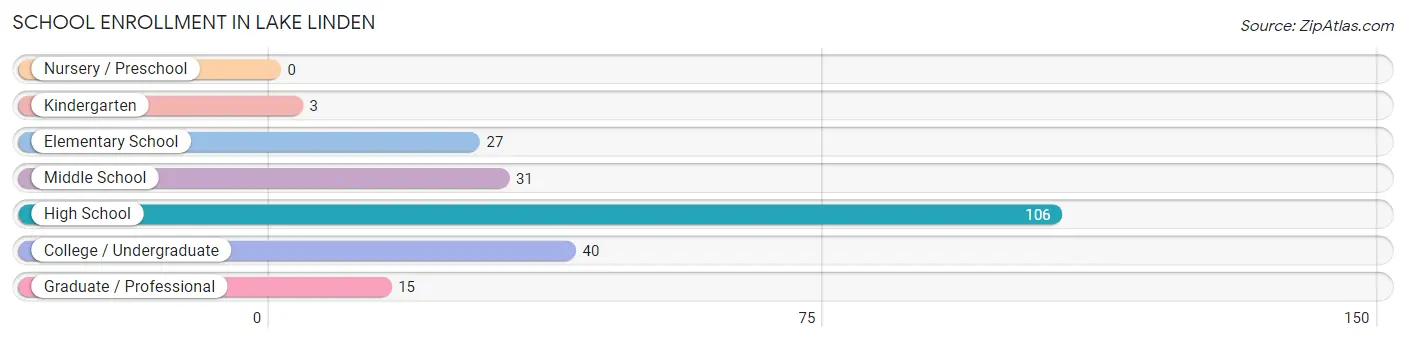
School Enrollment in Lake Linden
The most common levels of schooling among the 222 students in Lake Linden are high school (106 | 47.7%), college / undergraduate (40 | 18.0%), and middle school (31 | 14.0%).
| School Level | # Students | % Students |
| Nursery / Preschool | 0 | 0.0% |
| Kindergarten | 3 | 1.3% |
| Elementary School | 27 | 12.2% |
| Middle School | 31 | 14.0% |
| High School | 106 | 47.7% |
| College / Undergraduate | 40 | 18.0% |
| Graduate / Professional | 15 | 6.8% |
| Total | 222 | 100.0% |
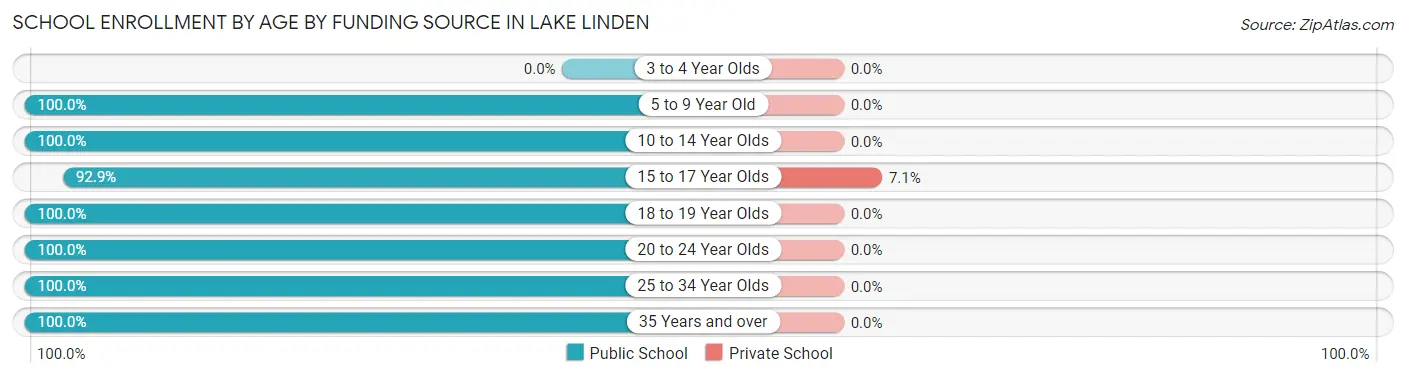
School Enrollment by Age by Funding Source in Lake Linden
Out of a total of 222 students who are enrolled in schools in Lake Linden, 6 (2.7%) attend a private institution, while the remaining 216 (97.3%) are enrolled in public schools. The age group of 15 to 17 year olds has the highest likelihood of being enrolled in private schools, with 6 (7.1% in the age bracket) enrolled. Conversely, the age group of 5 to 9 year old has the lowest likelihood of being enrolled in a private school, with 22 (100.0% in the age bracket) attending a public institution.
| Age Bracket | Public School | Private School |
| 3 to 4 Year Olds | 0 (0.0%) | 0 (0.0%) |
| 5 to 9 Year Old | 22 (100.0%) | 0 (0.0%) |
| 10 to 14 Year Olds | 39 (100.0%) | 0 (0.0%) |
| 15 to 17 Year Olds | 78 (92.9%) | 6 (7.1%) |
| 18 to 19 Year Olds | 39 (100.0%) | 0 (0.0%) |
| 20 to 24 Year Olds | 23 (100.0%) | 0 (0.0%) |
| 25 to 34 Year Olds | 7 (100.0%) | 0 (0.0%) |
| 35 Years and over | 8 (100.0%) | 0 (0.0%) |
| Total | 216 (97.3%) | 6 (2.7%) |
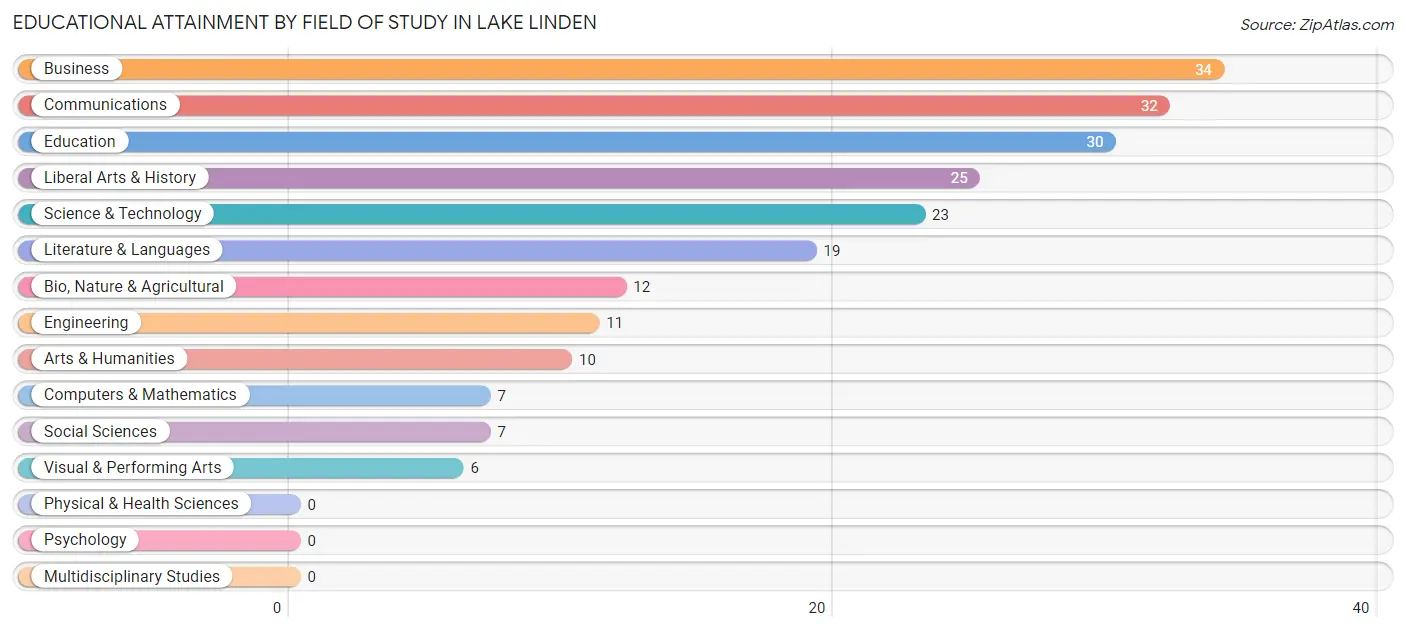
Educational Attainment by Field of Study in Lake Linden
Business (34 | 15.7%), communications (32 | 14.8%), education (30 | 13.9%), liberal arts & history (25 | 11.6%), and science & technology (23 | 10.6%) are the most common fields of study among 216 individuals in Lake Linden who have obtained a bachelor's degree or higher.
| Field of Study | # Graduates | % Graduates |
| Computers & Mathematics | 7 | 3.2% |
| Bio, Nature & Agricultural | 12 | 5.6% |
| Physical & Health Sciences | 0 | 0.0% |
| Psychology | 0 | 0.0% |
| Social Sciences | 7 | 3.2% |
| Engineering | 11 | 5.1% |
| Multidisciplinary Studies | 0 | 0.0% |
| Science & Technology | 23 | 10.6% |
| Business | 34 | 15.7% |
| Education | 30 | 13.9% |
| Literature & Languages | 19 | 8.8% |
| Liberal Arts & History | 25 | 11.6% |
| Visual & Performing Arts | 6 | 2.8% |
| Communications | 32 | 14.8% |
| Arts & Humanities | 10 | 4.6% |
| Total | 216 | 100.0% |
Transportation & Commute in Lake Linden
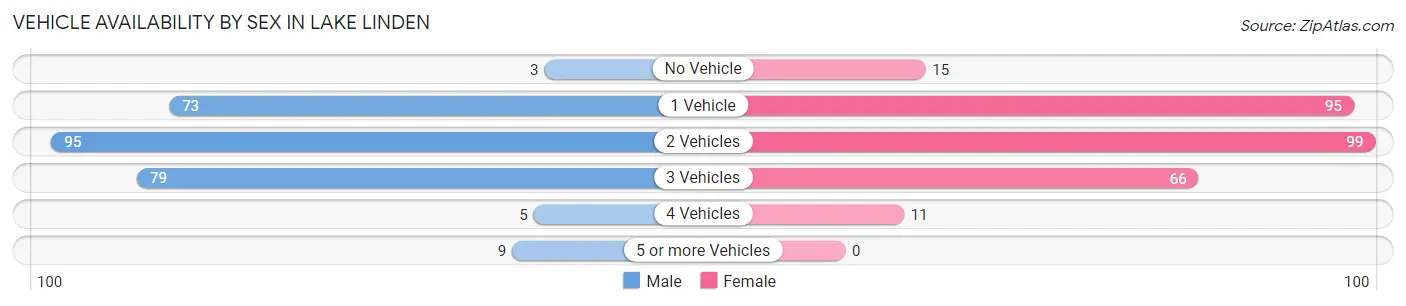
Vehicle Availability by Sex in Lake Linden
The most prevalent vehicle ownership categories in Lake Linden are males with 2 vehicles (95, accounting for 36.0%) and females with 2 vehicles (99, making up 33.2%).
| Vehicles Available | Male | Female |
| No Vehicle | 3 (1.1%) | 15 (5.2%) |
| 1 Vehicle | 73 (27.7%) | 95 (33.2%) |
| 2 Vehicles | 95 (36.0%) | 99 (34.6%) |
| 3 Vehicles | 79 (29.9%) | 66 (23.1%) |
| 4 Vehicles | 5 (1.9%) | 11 (3.8%) |
| 5 or more Vehicles | 9 (3.4%) | 0 (0.0%) |
| Total | 264 (100.0%) | 286 (100.0%) |
Commute Time in Lake Linden
The most frequently occuring commute durations in Lake Linden are 15 to 19 minutes (115 commuters, 21.9%), 10 to 14 minutes (102 commuters, 19.4%), and 20 to 24 minutes (93 commuters, 17.7%).
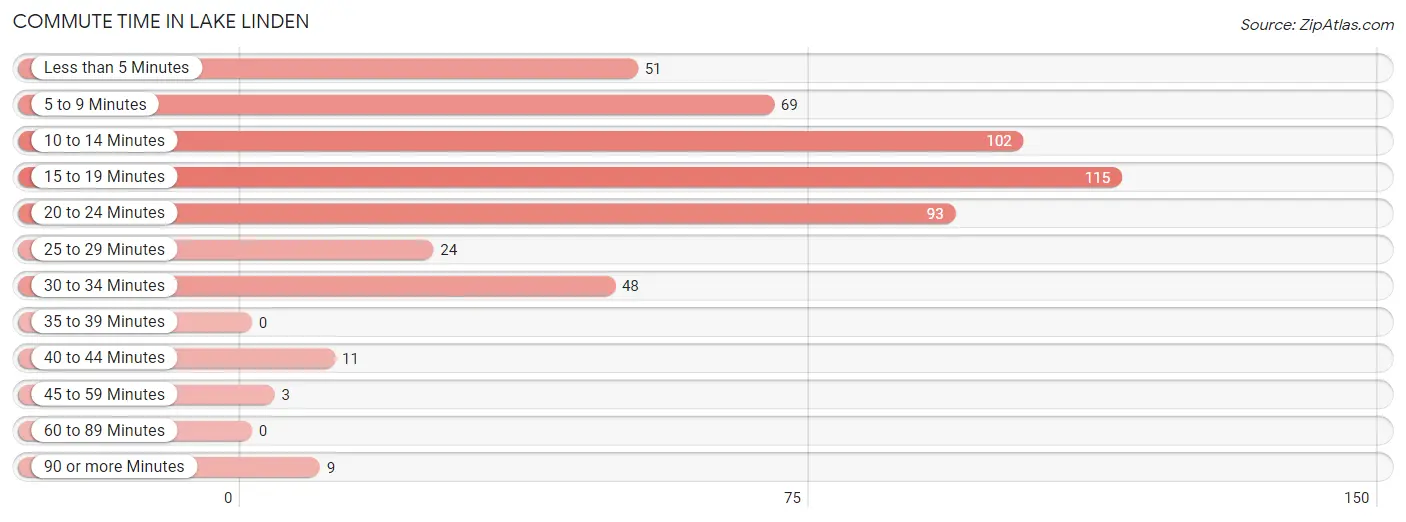
| Commute Time | # Commuters | % Commuters |
| Less than 5 Minutes | 51 | 9.7% |
| 5 to 9 Minutes | 69 | 13.1% |
| 10 to 14 Minutes | 102 | 19.4% |
| 15 to 19 Minutes | 115 | 21.9% |
| 20 to 24 Minutes | 93 | 17.7% |
| 25 to 29 Minutes | 24 | 4.6% |
| 30 to 34 Minutes | 48 | 9.1% |
| 35 to 39 Minutes | 0 | 0.0% |
| 40 to 44 Minutes | 11 | 2.1% |
| 45 to 59 Minutes | 3 | 0.6% |
| 60 to 89 Minutes | 0 | 0.0% |
| 90 or more Minutes | 9 | 1.7% |
Commute Time by Sex in Lake Linden
The most common commute times in Lake Linden are 15 to 19 minutes (62 commuters, 23.9%) for males and 20 to 24 minutes (56 commuters, 21.0%) for females.
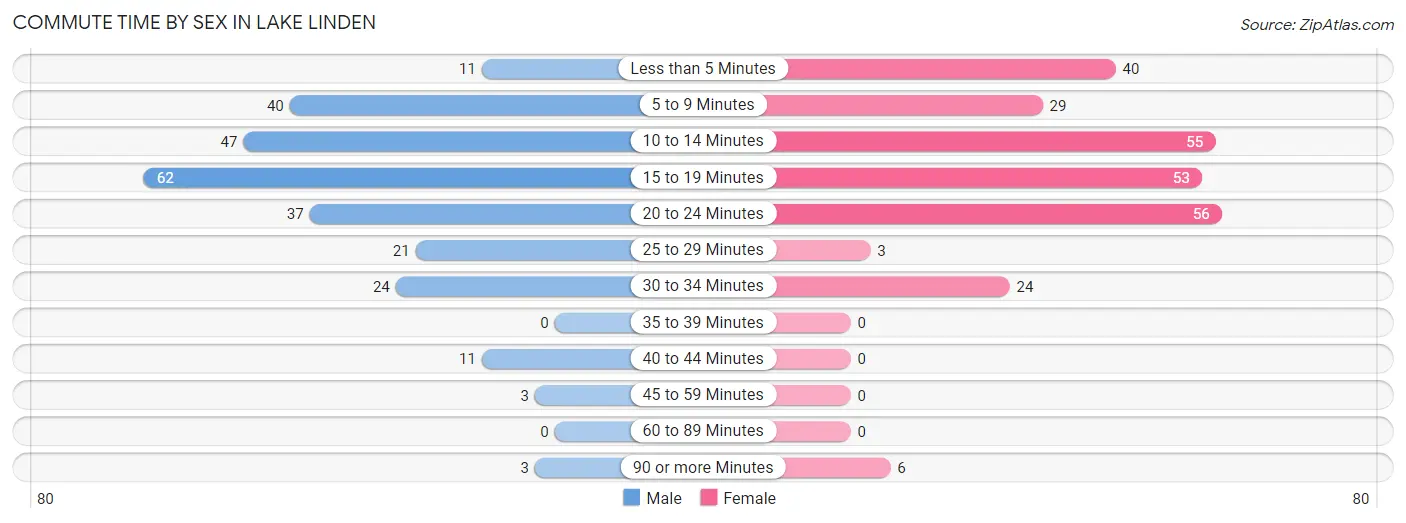
| Commute Time | Male | Female |
| Less than 5 Minutes | 11 (4.3%) | 40 (15.0%) |
| 5 to 9 Minutes | 40 (15.4%) | 29 (10.9%) |
| 10 to 14 Minutes | 47 (18.1%) | 55 (20.7%) |
| 15 to 19 Minutes | 62 (23.9%) | 53 (19.9%) |
| 20 to 24 Minutes | 37 (14.3%) | 56 (21.0%) |
| 25 to 29 Minutes | 21 (8.1%) | 3 (1.1%) |
| 30 to 34 Minutes | 24 (9.3%) | 24 (9.0%) |
| 35 to 39 Minutes | 0 (0.0%) | 0 (0.0%) |
| 40 to 44 Minutes | 11 (4.3%) | 0 (0.0%) |
| 45 to 59 Minutes | 3 (1.2%) | 0 (0.0%) |
| 60 to 89 Minutes | 0 (0.0%) | 0 (0.0%) |
| 90 or more Minutes | 3 (1.2%) | 6 (2.3%) |
Time of Departure to Work by Sex in Lake Linden
The most frequent times of departure to work in Lake Linden are 7:30 AM to 7:59 AM (49, 18.9%) for males and 7:30 AM to 7:59 AM (90, 33.8%) for females.
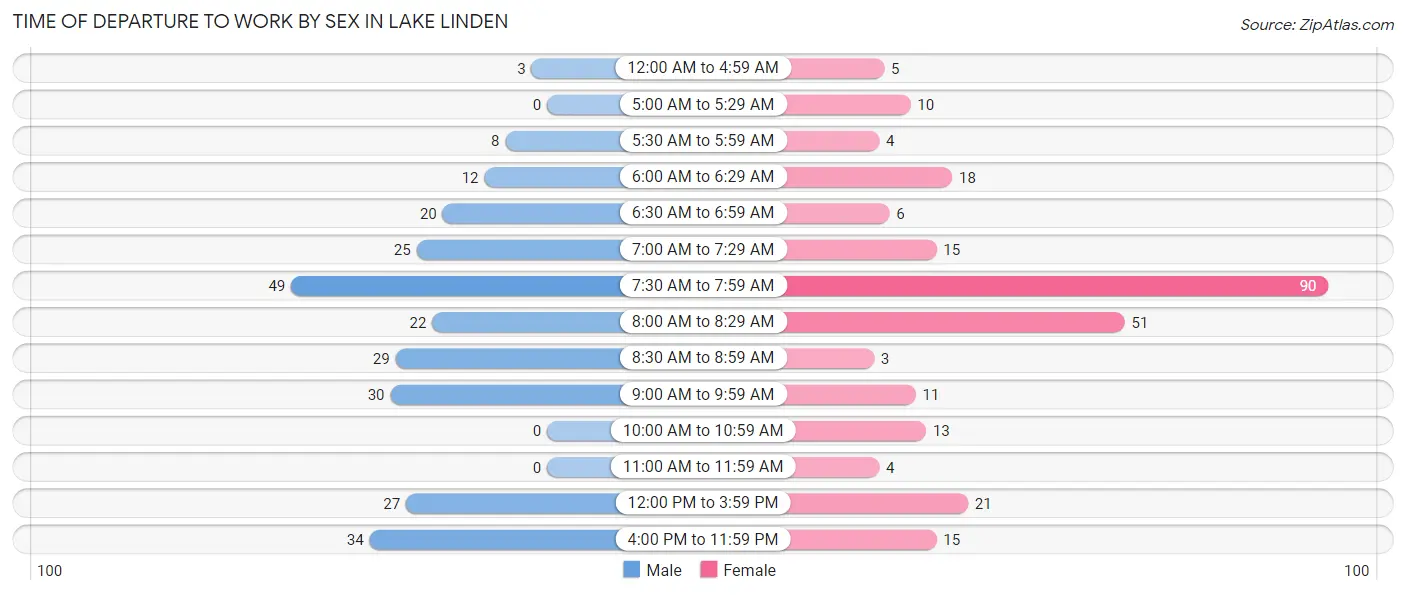
| Time of Departure | Male | Female |
| 12:00 AM to 4:59 AM | 3 (1.2%) | 5 (1.9%) |
| 5:00 AM to 5:29 AM | 0 (0.0%) | 10 (3.8%) |
| 5:30 AM to 5:59 AM | 8 (3.1%) | 4 (1.5%) |
| 6:00 AM to 6:29 AM | 12 (4.6%) | 18 (6.8%) |
| 6:30 AM to 6:59 AM | 20 (7.7%) | 6 (2.3%) |
| 7:00 AM to 7:29 AM | 25 (9.7%) | 15 (5.6%) |
| 7:30 AM to 7:59 AM | 49 (18.9%) | 90 (33.8%) |
| 8:00 AM to 8:29 AM | 22 (8.5%) | 51 (19.2%) |
| 8:30 AM to 8:59 AM | 29 (11.2%) | 3 (1.1%) |
| 9:00 AM to 9:59 AM | 30 (11.6%) | 11 (4.1%) |
| 10:00 AM to 10:59 AM | 0 (0.0%) | 13 (4.9%) |
| 11:00 AM to 11:59 AM | 0 (0.0%) | 4 (1.5%) |
| 12:00 PM to 3:59 PM | 27 (10.4%) | 21 (7.9%) |
| 4:00 PM to 11:59 PM | 34 (13.1%) | 15 (5.6%) |
| Total | 259 (100.0%) | 266 (100.0%) |
Housing Occupancy in Lake Linden
Occupancy by Ownership in Lake Linden
Of the total 581 dwellings in Lake Linden, owner-occupied units account for 348 (59.9%), while renter-occupied units make up 233 (40.1%).
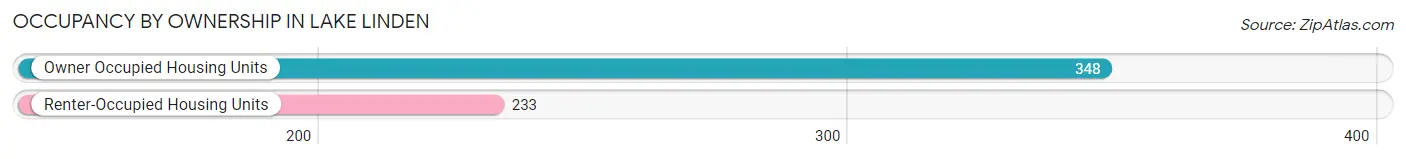
| Occupancy | # Housing Units | % Housing Units |
| Owner Occupied Housing Units | 348 | 59.9% |
| Renter-Occupied Housing Units | 233 | 40.1% |
| Total Occupied Housing Units | 581 | 100.0% |
Occupancy by Household Size in Lake Linden
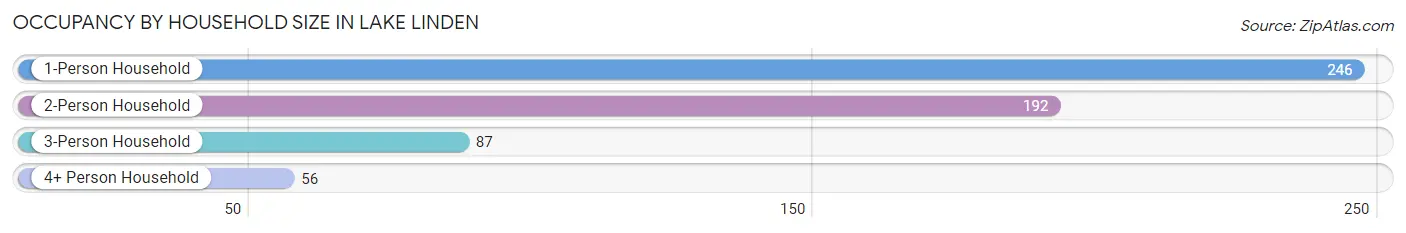
| Household Size | # Housing Units | % Housing Units |
| 1-Person Household | 246 | 42.3% |
| 2-Person Household | 192 | 33.1% |
| 3-Person Household | 87 | 15.0% |
| 4+ Person Household | 56 | 9.6% |
| Total Housing Units | 581 | 100.0% |
Occupancy by Ownership by Household Size in Lake Linden
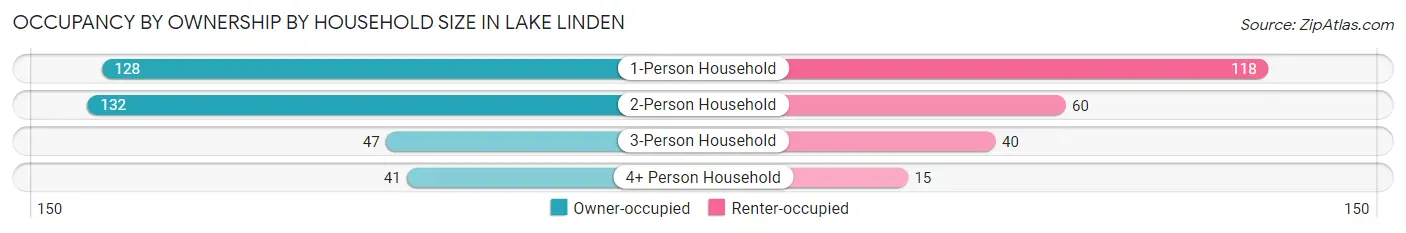
| Household Size | Owner-occupied | Renter-occupied |
| 1-Person Household | 128 (52.0%) | 118 (48.0%) |
| 2-Person Household | 132 (68.8%) | 60 (31.2%) |
| 3-Person Household | 47 (54.0%) | 40 (46.0%) |
| 4+ Person Household | 41 (73.2%) | 15 (26.8%) |
| Total Housing Units | 348 (59.9%) | 233 (40.1%) |
Occupancy by Educational Attainment in Lake Linden
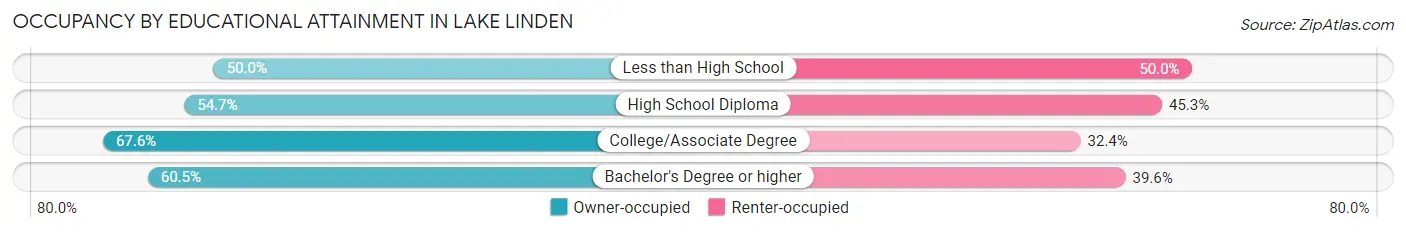
| Household Size | Owner-occupied | Renter-occupied |
| Less than High School | 13 (50.0%) | 13 (50.0%) |
| High School Diploma | 129 (54.7%) | 107 (45.3%) |
| College/Associate Degree | 125 (67.6%) | 60 (32.4%) |
| Bachelor's Degree or higher | 81 (60.5%) | 53 (39.6%) |
Occupancy by Age of Householder in Lake Linden
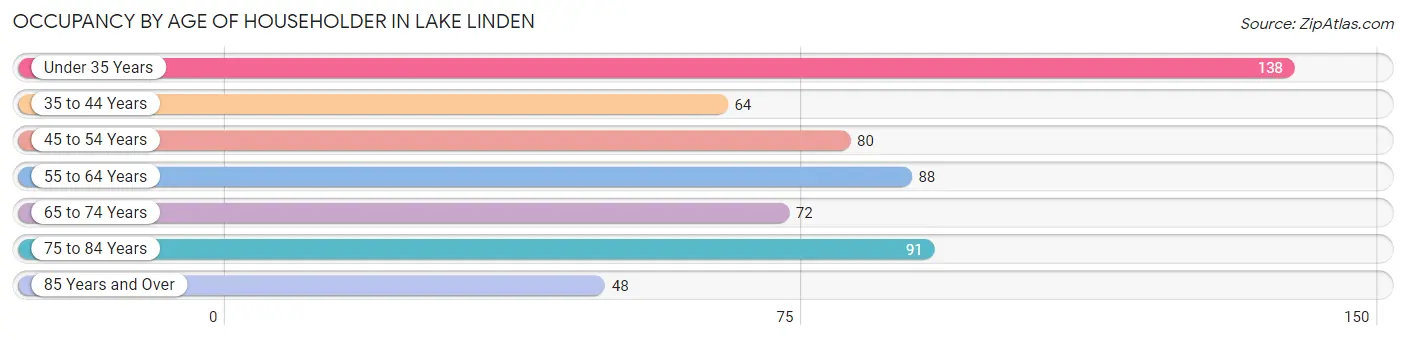
| Age Bracket | # Households | % Households |
| Under 35 Years | 138 | 23.7% |
| 35 to 44 Years | 64 | 11.0% |
| 45 to 54 Years | 80 | 13.8% |
| 55 to 64 Years | 88 | 15.1% |
| 65 to 74 Years | 72 | 12.4% |
| 75 to 84 Years | 91 | 15.7% |
| 85 Years and Over | 48 | 8.3% |
| Total | 581 | 100.0% |
Housing Finances in Lake Linden
Median Income by Occupancy in Lake Linden
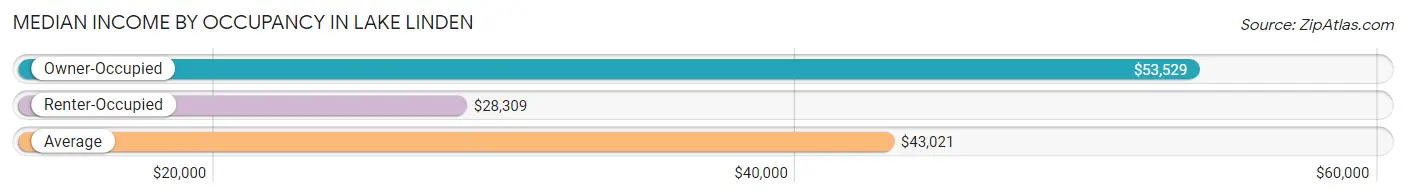
| Occupancy Type | # Households | Median Income |
| Owner-Occupied | 348 (59.9%) | $53,529 |
| Renter-Occupied | 233 (40.1%) | $28,309 |
| Average | 581 (100.0%) | $43,021 |
Occupancy by Householder Income Bracket in Lake Linden
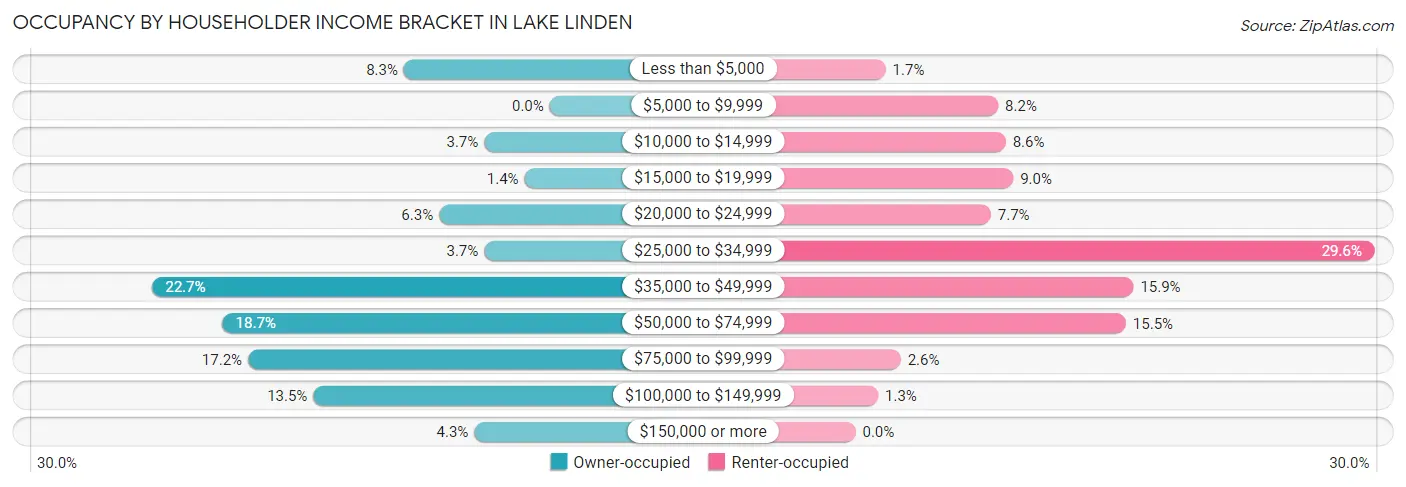
| Income Bracket | Owner-occupied | Renter-occupied |
| Less than $5,000 | 29 (8.3%) | 4 (1.7%) |
| $5,000 to $9,999 | 0 (0.0%) | 19 (8.2%) |
| $10,000 to $14,999 | 13 (3.7%) | 20 (8.6%) |
| $15,000 to $19,999 | 5 (1.4%) | 21 (9.0%) |
| $20,000 to $24,999 | 22 (6.3%) | 18 (7.7%) |
| $25,000 to $34,999 | 13 (3.7%) | 69 (29.6%) |
| $35,000 to $49,999 | 79 (22.7%) | 37 (15.9%) |
| $50,000 to $74,999 | 65 (18.7%) | 36 (15.4%) |
| $75,000 to $99,999 | 60 (17.2%) | 6 (2.6%) |
| $100,000 to $149,999 | 47 (13.5%) | 3 (1.3%) |
| $150,000 or more | 15 (4.3%) | 0 (0.0%) |
| Total | 348 (100.0%) | 233 (100.0%) |
Monthly Housing Cost Tiers in Lake Linden
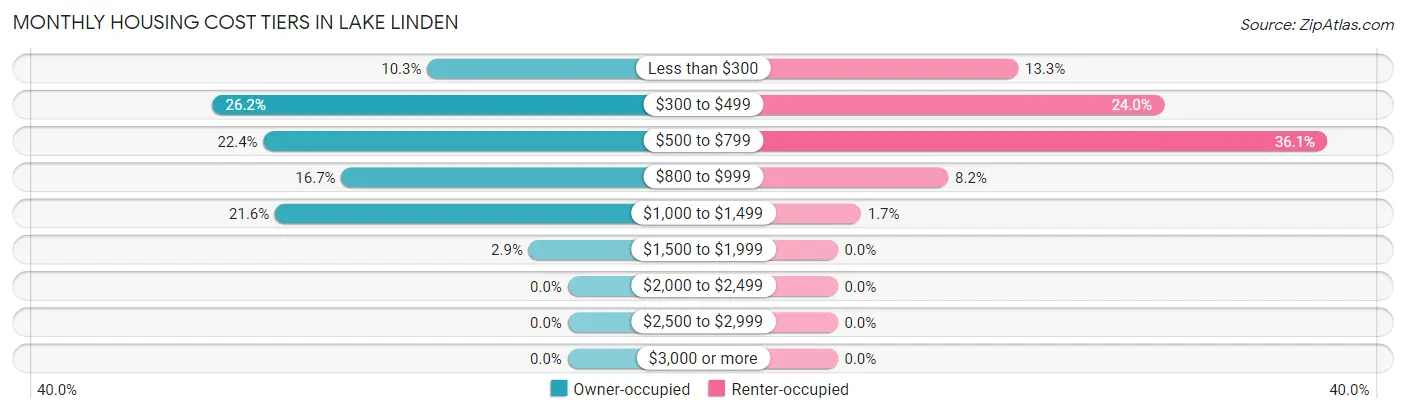
| Monthly Cost | Owner-occupied | Renter-occupied |
| Less than $300 | 36 (10.3%) | 31 (13.3%) |
| $300 to $499 | 91 (26.2%) | 56 (24.0%) |
| $500 to $799 | 78 (22.4%) | 84 (36.0%) |
| $800 to $999 | 58 (16.7%) | 19 (8.2%) |
| $1,000 to $1,499 | 75 (21.5%) | 4 (1.7%) |
| $1,500 to $1,999 | 10 (2.9%) | 0 (0.0%) |
| $2,000 to $2,499 | 0 (0.0%) | 0 (0.0%) |
| $2,500 to $2,999 | 0 (0.0%) | 0 (0.0%) |
| $3,000 or more | 0 (0.0%) | 0 (0.0%) |
| Total | 348 (100.0%) | 233 (100.0%) |
Physical Housing Characteristics in Lake Linden
Housing Structures in Lake Linden
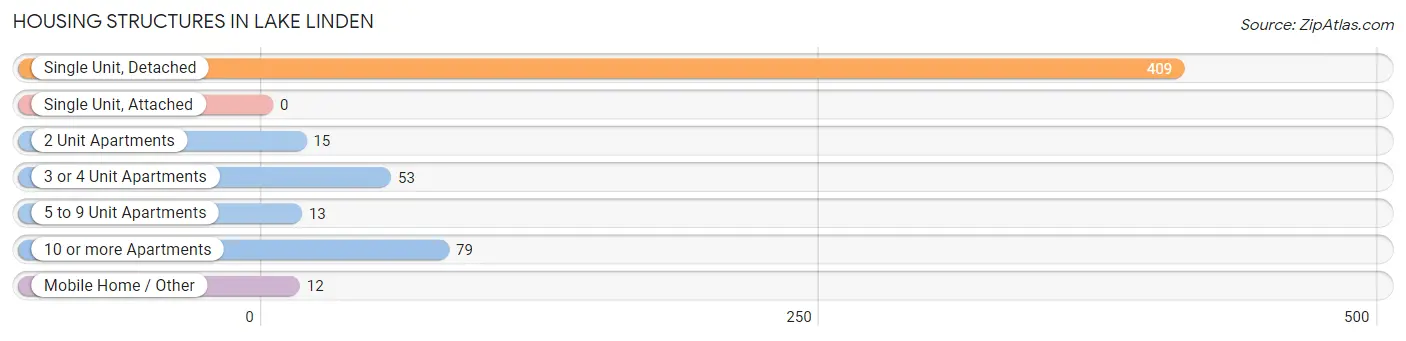
| Structure Type | # Housing Units | % Housing Units |
| Single Unit, Detached | 409 | 70.4% |
| Single Unit, Attached | 0 | 0.0% |
| 2 Unit Apartments | 15 | 2.6% |
| 3 or 4 Unit Apartments | 53 | 9.1% |
| 5 to 9 Unit Apartments | 13 | 2.2% |
| 10 or more Apartments | 79 | 13.6% |
| Mobile Home / Other | 12 | 2.1% |
| Total | 581 | 100.0% |
Housing Structures by Occupancy in Lake Linden
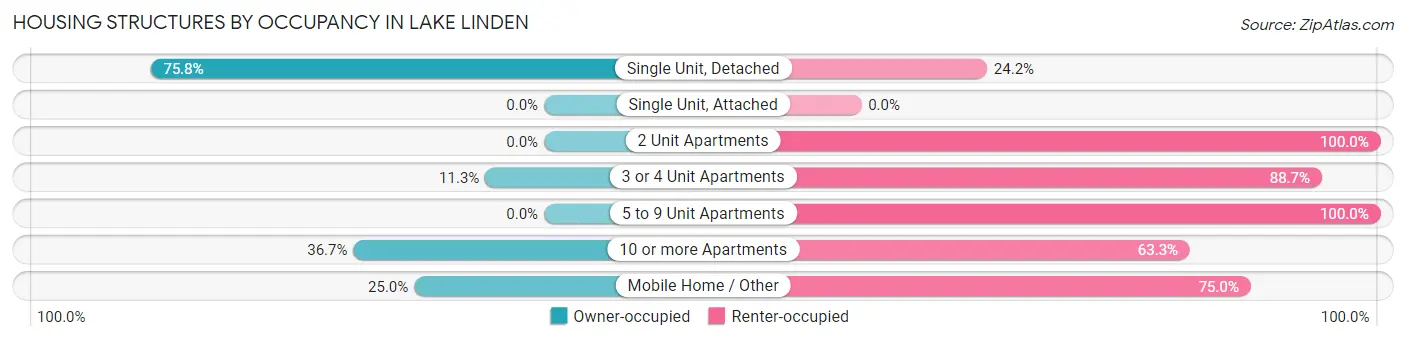
| Structure Type | Owner-occupied | Renter-occupied |
| Single Unit, Detached | 310 (75.8%) | 99 (24.2%) |
| Single Unit, Attached | 0 (0.0%) | 0 (0.0%) |
| 2 Unit Apartments | 0 (0.0%) | 15 (100.0%) |
| 3 or 4 Unit Apartments | 6 (11.3%) | 47 (88.7%) |
| 5 to 9 Unit Apartments | 0 (0.0%) | 13 (100.0%) |
| 10 or more Apartments | 29 (36.7%) | 50 (63.3%) |
| Mobile Home / Other | 3 (25.0%) | 9 (75.0%) |
| Total | 348 (59.9%) | 233 (40.1%) |
Housing Structures by Number of Rooms in Lake Linden
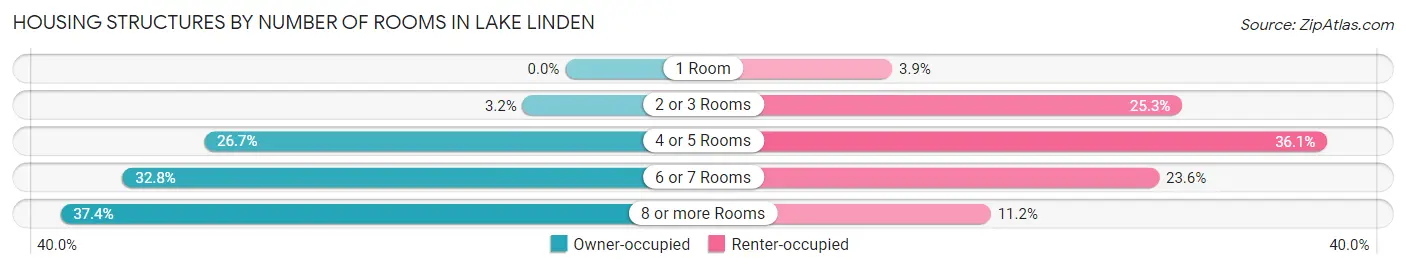
| Number of Rooms | Owner-occupied | Renter-occupied |
| 1 Room | 0 (0.0%) | 9 (3.9%) |
| 2 or 3 Rooms | 11 (3.2%) | 59 (25.3%) |
| 4 or 5 Rooms | 93 (26.7%) | 84 (36.0%) |
| 6 or 7 Rooms | 114 (32.8%) | 55 (23.6%) |
| 8 or more Rooms | 130 (37.4%) | 26 (11.2%) |
| Total | 348 (100.0%) | 233 (100.0%) |
Housing Structure by Heating Type in Lake Linden
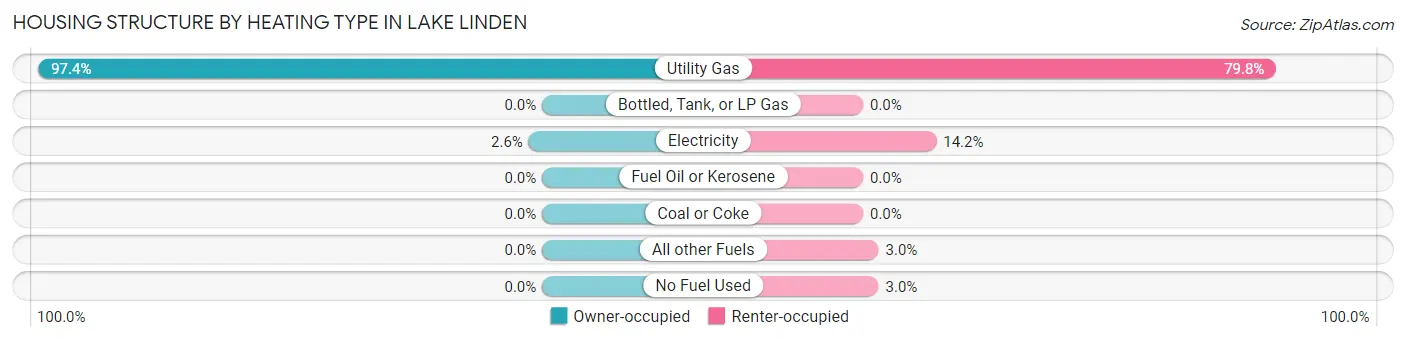
| Heating Type | Owner-occupied | Renter-occupied |
| Utility Gas | 339 (97.4%) | 186 (79.8%) |
| Bottled, Tank, or LP Gas | 0 (0.0%) | 0 (0.0%) |
| Electricity | 9 (2.6%) | 33 (14.2%) |
| Fuel Oil or Kerosene | 0 (0.0%) | 0 (0.0%) |
| Coal or Coke | 0 (0.0%) | 0 (0.0%) |
| All other Fuels | 0 (0.0%) | 7 (3.0%) |
| No Fuel Used | 0 (0.0%) | 7 (3.0%) |
| Total | 348 (100.0%) | 233 (100.0%) |
Household Vehicle Usage in Lake Linden
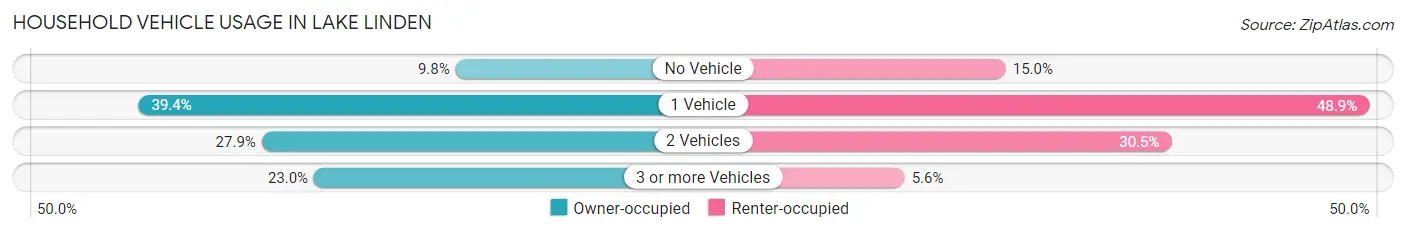
| Vehicles per Household | Owner-occupied | Renter-occupied |
| No Vehicle | 34 (9.8%) | 35 (15.0%) |
| 1 Vehicle | 137 (39.4%) | 114 (48.9%) |
| 2 Vehicles | 97 (27.9%) | 71 (30.5%) |
| 3 or more Vehicles | 80 (23.0%) | 13 (5.6%) |
| Total | 348 (100.0%) | 233 (100.0%) |
Real Estate & Mortgages in Lake Linden
Real Estate and Mortgage Overview in Lake Linden
| Characteristic | Without Mortgage | With Mortgage |
| Housing Units | 192 | 156 |
| Median Property Value | $68,500 | $98,900 |
| Median Household Income | $43,088 | $15 |
| Monthly Housing Costs | $450 | $0 |
| Real Estate Taxes | $1,300 | $0 |
Property Value by Mortgage Status in Lake Linden
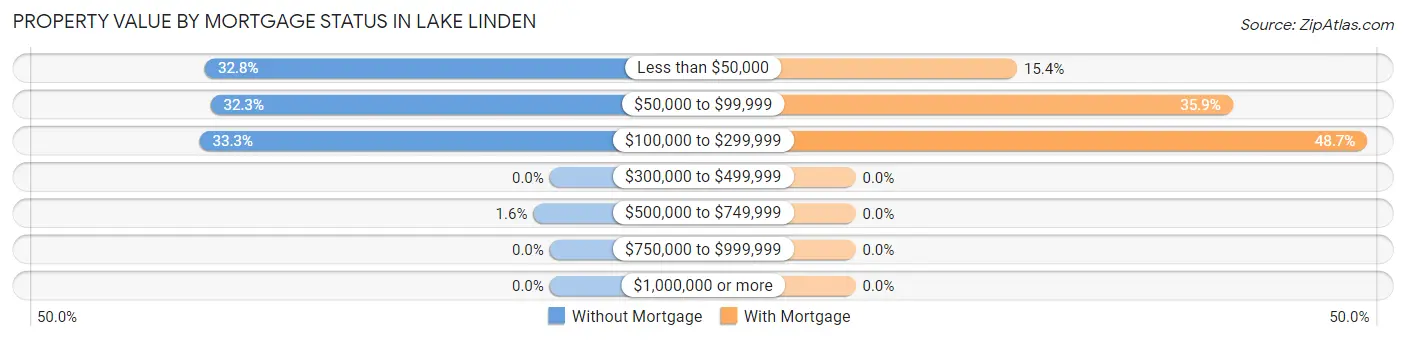
| Property Value | Without Mortgage | With Mortgage |
| Less than $50,000 | 63 (32.8%) | 24 (15.4%) |
| $50,000 to $99,999 | 62 (32.3%) | 56 (35.9%) |
| $100,000 to $299,999 | 64 (33.3%) | 76 (48.7%) |
| $300,000 to $499,999 | 0 (0.0%) | 0 (0.0%) |
| $500,000 to $749,999 | 3 (1.6%) | 0 (0.0%) |
| $750,000 to $999,999 | 0 (0.0%) | 0 (0.0%) |
| $1,000,000 or more | 0 (0.0%) | 0 (0.0%) |
| Total | 192 (100.0%) | 156 (100.0%) |
Household Income by Mortgage Status in Lake Linden
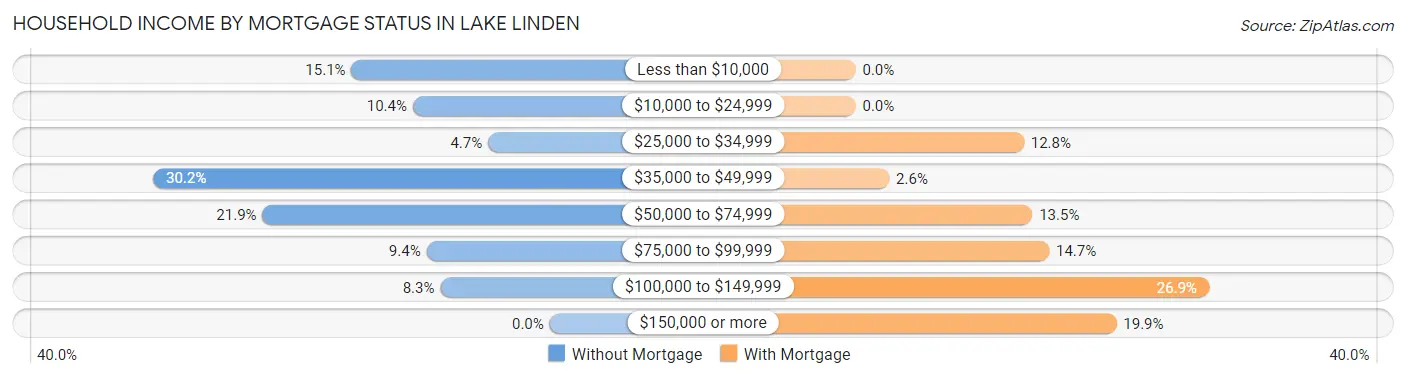
| Household Income | Without Mortgage | With Mortgage |
| Less than $10,000 | 29 (15.1%) | 0 (0.0%) |
| $10,000 to $24,999 | 20 (10.4%) | 0 (0.0%) |
| $25,000 to $34,999 | 9 (4.7%) | 20 (12.8%) |
| $35,000 to $49,999 | 58 (30.2%) | 4 (2.6%) |
| $50,000 to $74,999 | 42 (21.9%) | 21 (13.5%) |
| $75,000 to $99,999 | 18 (9.4%) | 23 (14.7%) |
| $100,000 to $149,999 | 16 (8.3%) | 42 (26.9%) |
| $150,000 or more | 0 (0.0%) | 31 (19.9%) |
| Total | 192 (100.0%) | 156 (100.0%) |
Property Value to Household Income Ratio in Lake Linden
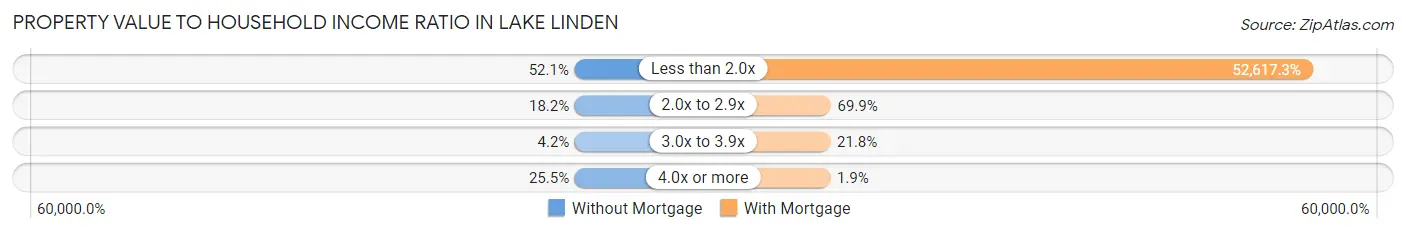
| Value-to-Income Ratio | Without Mortgage | With Mortgage |
| Less than 2.0x | 100 (52.1%) | 82,083 (52,617.3%) |
| 2.0x to 2.9x | 35 (18.2%) | 109 (69.9%) |
| 3.0x to 3.9x | 8 (4.2%) | 34 (21.8%) |
| 4.0x or more | 49 (25.5%) | 3 (1.9%) |
| Total | 192 (100.0%) | 156 (100.0%) |
Real Estate Taxes by Mortgage Status in Lake Linden
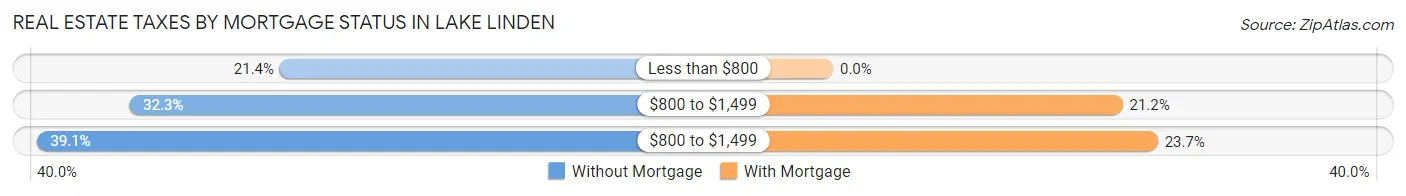
| Property Taxes | Without Mortgage | With Mortgage |
| Less than $800 | 41 (21.3%) | 0 (0.0%) |
| $800 to $1,499 | 62 (32.3%) | 33 (21.1%) |
| $800 to $1,499 | 75 (39.1%) | 37 (23.7%) |
| Total | 192 (100.0%) | 156 (100.0%) |
Health & Disability in Lake Linden
Health Insurance Coverage by Age in Lake Linden
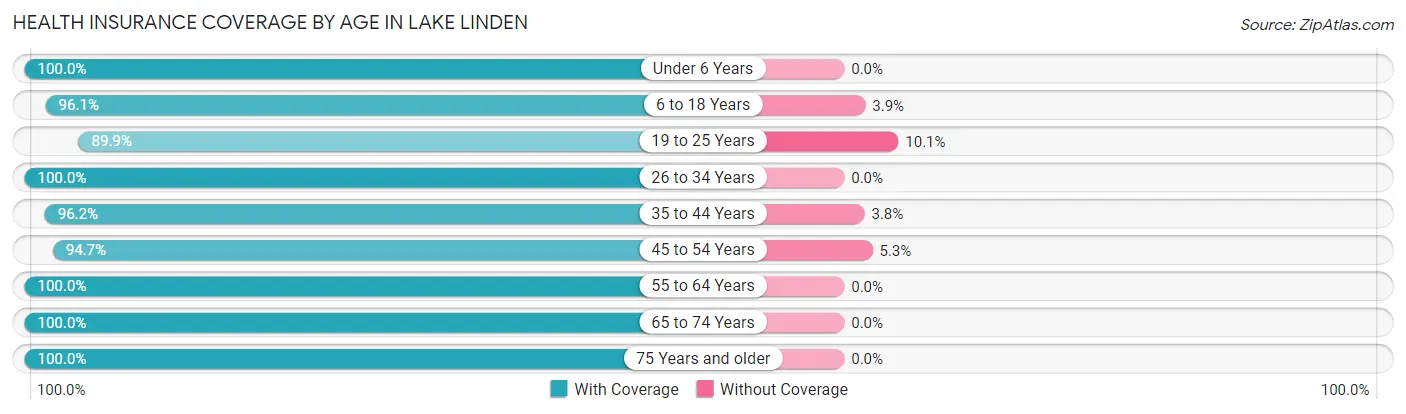
| Age Bracket | With Coverage | Without Coverage |
| Under 6 Years | 47 (100.0%) | 0 (0.0%) |
| 6 to 18 Years | 171 (96.1%) | 7 (3.9%) |
| 19 to 25 Years | 116 (89.9%) | 13 (10.1%) |
| 26 to 34 Years | 191 (100.0%) | 0 (0.0%) |
| 35 to 44 Years | 102 (96.2%) | 4 (3.8%) |
| 45 to 54 Years | 126 (94.7%) | 7 (5.3%) |
| 55 to 64 Years | 122 (100.0%) | 0 (0.0%) |
| 65 to 74 Years | 107 (100.0%) | 0 (0.0%) |
| 75 Years and older | 170 (100.0%) | 0 (0.0%) |
| Total | 1,152 (97.4%) | 31 (2.6%) |
Health Insurance Coverage by Citizenship Status in Lake Linden
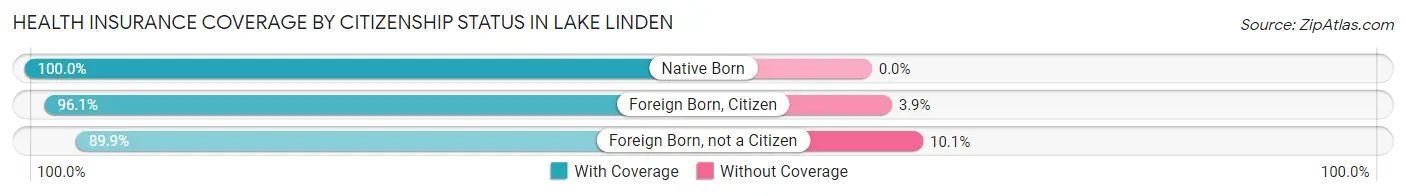
| Citizenship Status | With Coverage | Without Coverage |
| Native Born | 47 (100.0%) | 0 (0.0%) |
| Foreign Born, Citizen | 171 (96.1%) | 7 (3.9%) |
| Foreign Born, not a Citizen | 116 (89.9%) | 13 (10.1%) |
Health Insurance Coverage by Household Income in Lake Linden
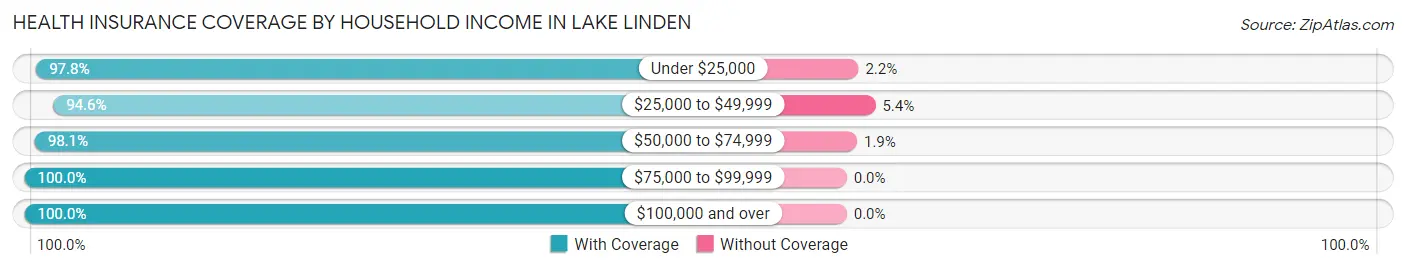
| Household Income | With Coverage | Without Coverage |
| Under $25,000 | 223 (97.8%) | 5 (2.2%) |
| $25,000 to $49,999 | 388 (94.6%) | 22 (5.4%) |
| $50,000 to $74,999 | 204 (98.1%) | 4 (1.9%) |
| $75,000 to $99,999 | 188 (100.0%) | 0 (0.0%) |
| $100,000 and over | 141 (100.0%) | 0 (0.0%) |
Public vs Private Health Insurance Coverage by Age in Lake Linden
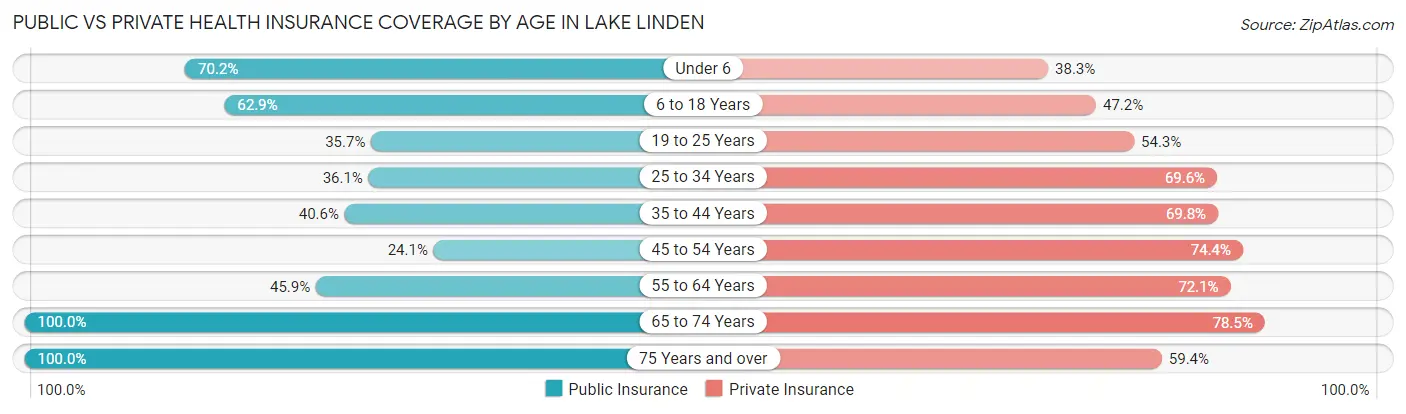
| Age Bracket | Public Insurance | Private Insurance |
| Under 6 | 33 (70.2%) | 18 (38.3%) |
| 6 to 18 Years | 112 (62.9%) | 84 (47.2%) |
| 19 to 25 Years | 46 (35.7%) | 70 (54.3%) |
| 25 to 34 Years | 69 (36.1%) | 133 (69.6%) |
| 35 to 44 Years | 43 (40.6%) | 74 (69.8%) |
| 45 to 54 Years | 32 (24.1%) | 99 (74.4%) |
| 55 to 64 Years | 56 (45.9%) | 88 (72.1%) |
| 65 to 74 Years | 107 (100.0%) | 84 (78.5%) |
| 75 Years and over | 170 (100.0%) | 101 (59.4%) |
| Total | 668 (56.5%) | 751 (63.5%) |
Disability Status by Sex by Age in Lake Linden
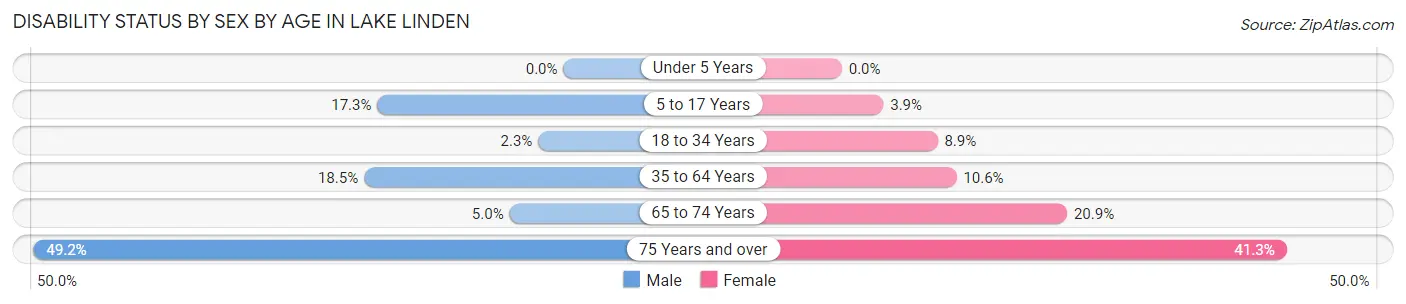
| Age Bracket | Male | Female |
| Under 5 Years | 0 (0.0%) | 0 (0.0%) |
| 5 to 17 Years | 19 (17.3%) | 2 (3.8%) |
| 18 to 34 Years | 4 (2.3%) | 15 (8.9%) |
| 35 to 64 Years | 32 (18.5%) | 20 (10.6%) |
| 65 to 74 Years | 2 (5.0%) | 14 (20.9%) |
| 75 Years and over | 30 (49.2%) | 45 (41.3%) |
Disability Class by Sex by Age in Lake Linden
Disability Class: Hearing Difficulty

| Age Bracket | Male | Female |
| Under 5 Years | 0 (0.0%) | 0 (0.0%) |
| 5 to 17 Years | 0 (0.0%) | 0 (0.0%) |
| 18 to 34 Years | 0 (0.0%) | 0 (0.0%) |
| 35 to 64 Years | 2 (1.2%) | 5 (2.7%) |
| 65 to 74 Years | 2 (5.0%) | 6 (9.0%) |
| 75 Years and over | 21 (34.4%) | 18 (16.5%) |
Disability Class: Vision Difficulty
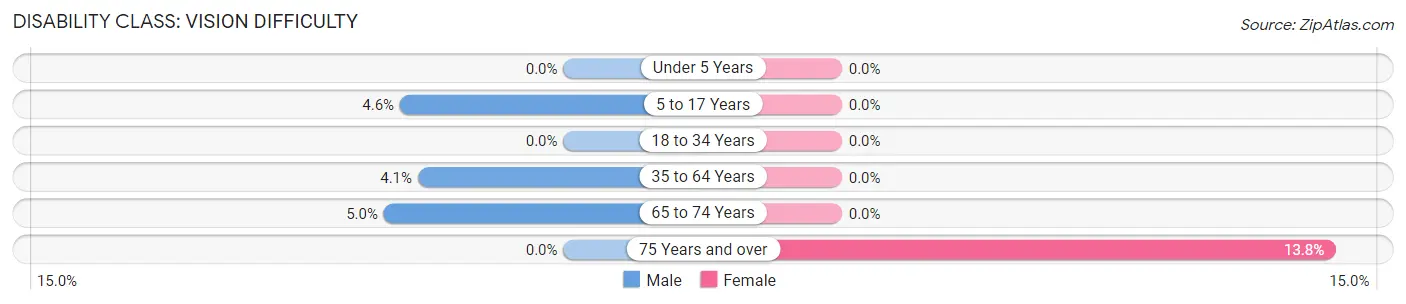
| Age Bracket | Male | Female |
| Under 5 Years | 0 (0.0%) | 0 (0.0%) |
| 5 to 17 Years | 5 (4.5%) | 0 (0.0%) |
| 18 to 34 Years | 0 (0.0%) | 0 (0.0%) |
| 35 to 64 Years | 7 (4.1%) | 0 (0.0%) |
| 65 to 74 Years | 2 (5.0%) | 0 (0.0%) |
| 75 Years and over | 0 (0.0%) | 15 (13.8%) |
Disability Class: Cognitive Difficulty
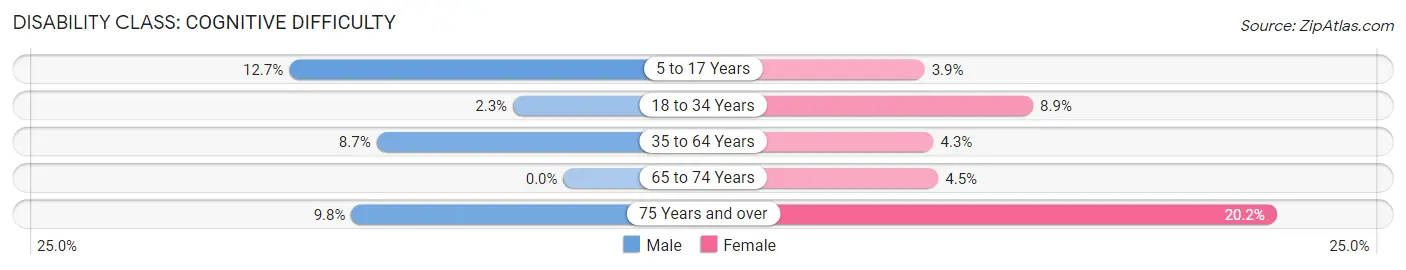
| Age Bracket | Male | Female |
| 5 to 17 Years | 14 (12.7%) | 2 (3.8%) |
| 18 to 34 Years | 4 (2.3%) | 15 (8.9%) |
| 35 to 64 Years | 15 (8.7%) | 8 (4.3%) |
| 65 to 74 Years | 0 (0.0%) | 3 (4.5%) |
| 75 Years and over | 6 (9.8%) | 22 (20.2%) |
Disability Class: Ambulatory Difficulty
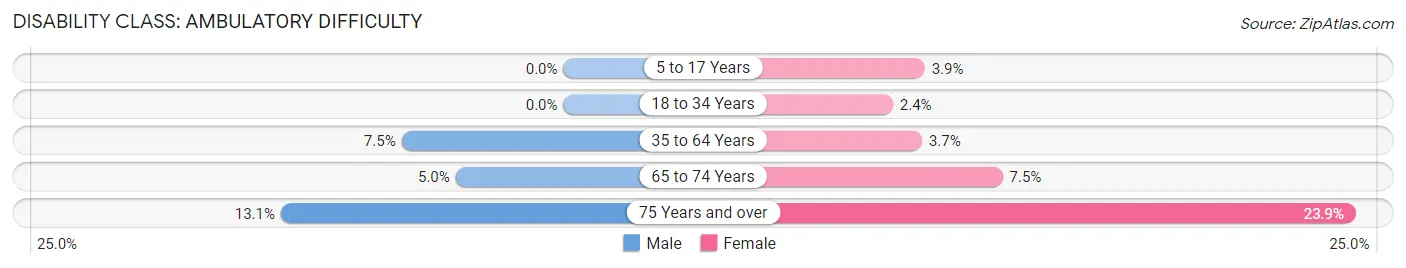
| Age Bracket | Male | Female |
| 5 to 17 Years | 0 (0.0%) | 2 (3.8%) |
| 18 to 34 Years | 0 (0.0%) | 4 (2.4%) |
| 35 to 64 Years | 13 (7.5%) | 7 (3.7%) |
| 65 to 74 Years | 2 (5.0%) | 5 (7.5%) |
| 75 Years and over | 8 (13.1%) | 26 (23.8%) |
Disability Class: Self-Care Difficulty
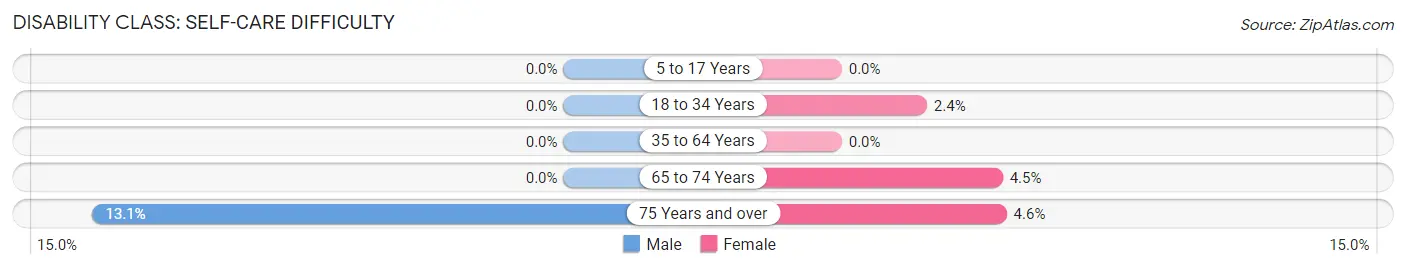
| Age Bracket | Male | Female |
| 5 to 17 Years | 0 (0.0%) | 0 (0.0%) |
| 18 to 34 Years | 0 (0.0%) | 4 (2.4%) |
| 35 to 64 Years | 0 (0.0%) | 0 (0.0%) |
| 65 to 74 Years | 0 (0.0%) | 3 (4.5%) |
| 75 Years and over | 8 (13.1%) | 5 (4.6%) |
Technology Access in Lake Linden
Computing Device Access in Lake Linden
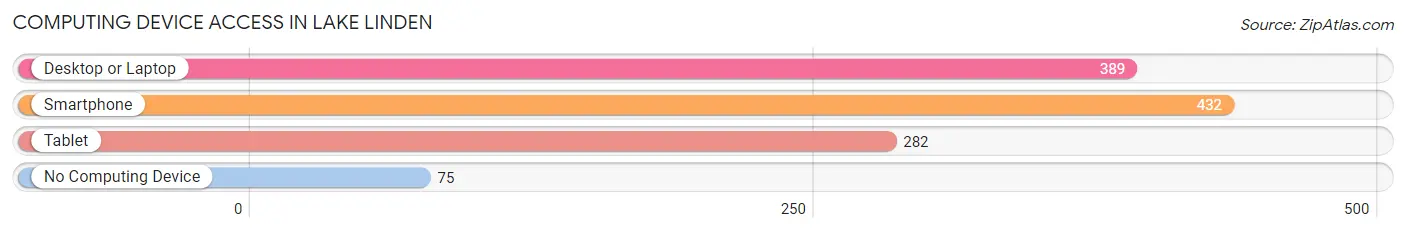
| Device Type | # Households | % Households |
| Desktop or Laptop | 389 | 66.9% |
| Smartphone | 432 | 74.4% |
| Tablet | 282 | 48.5% |
| No Computing Device | 75 | 12.9% |
| Total | 581 | 100.0% |
Internet Access in Lake Linden
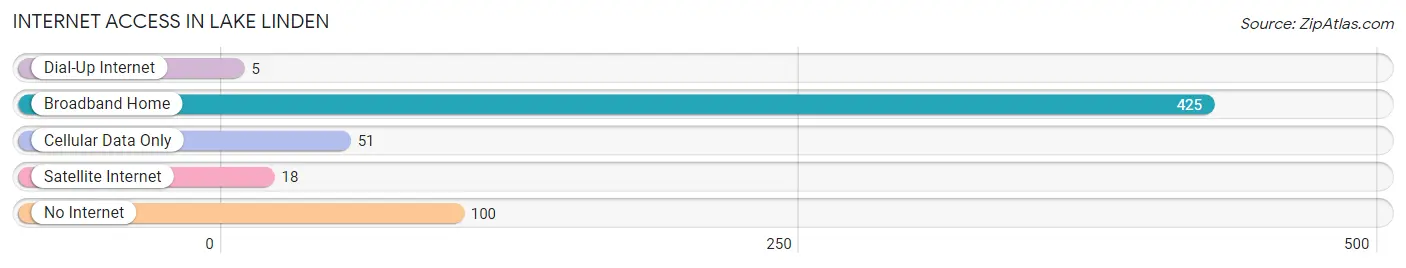
| Internet Type | # Households | % Households |
| Dial-Up Internet | 5 | 0.9% |
| Broadband Home | 425 | 73.2% |
| Cellular Data Only | 51 | 8.8% |
| Satellite Internet | 18 | 3.1% |
| No Internet | 100 | 17.2% |
| Total | 581 | 100.0% |
Lake Linden Summary
History
Lake Linden is a village located in Houghton County, Michigan. It is situated on Torch Lake, a part of the Keweenaw Waterway. The village was founded in 1875 by the Lake Linden Land Company, which was formed by a group of investors from the nearby city of Houghton. The village was named after the nearby lake, which was named after the Linden tree, a species of tree native to the area.
The village was originally a logging and mining town, and the first settlers were mostly Finnish immigrants. The village was home to a number of sawmills, and the lumber industry was the main source of income for the village. The village also had a number of small businesses, including a general store, a blacksmith shop, and a hotel.
The village was also home to a number of churches, including the Finnish Lutheran Church, the Finnish Methodist Church, and the Finnish Congregational Church. The village also had a number of schools, including the Lake Linden High School, which was established in 1891.
The village was also home to a number of cultural and recreational activities, including a baseball team, a band, and a theater. The village also had a number of parks, including the Lake Linden Park, which was established in 1891.
The village was also home to a number of industries, including a paper mill, a copper smelter, and a brickyard. The village was also home to a number of mines, including the Calumet and Hecla Mine, which was one of the largest copper mines in the world.
The village was also home to a number of cultural and recreational activities, including a baseball team, a band, and a theater. The village also had a number of parks, including the Lake Linden Park, which was established in 1891.
Geography
Lake Linden is located in Houghton County, Michigan. It is situated on Torch Lake, a part of the Keweenaw Waterway. The village is located on the south shore of Torch Lake, and is surrounded by the towns of Calumet, Hancock, and Laurium. The village is located approximately 25 miles south of the city of Houghton.
The village is located in a region of rolling hills and forests. The area is known for its scenic beauty, and is home to a number of lakes, rivers, and streams. The village is also home to a number of parks, including the Lake Linden Park, which was established in 1891.
Economy
The economy of Lake Linden is largely based on tourism and the service industry. The village is home to a number of restaurants, hotels, and other businesses that cater to tourists. The village is also home to a number of small businesses, including a general store, a blacksmith shop, and a hotel.
The village is also home to a number of industries, including a paper mill, a copper smelter, and a brickyard. The village is also home to a number of mines, including the Calumet and Hecla Mine, which was one of the largest copper mines in the world.
Demographics
As of the 2010 census, the population of Lake Linden was 1,845. The racial makeup of the village was 97.2% White, 0.3% African American, 0.2% Native American, 0.2% Asian, 0.1% Pacific Islander, 0.7% from other races, and 1.3% from two or more races. Hispanic or Latino of any race were 1.7% of the population.
The median income for a household in the village was $37,500, and the median income for a family was $45,000. The per capita income for the village was $19,845. About 11.2% of families and 14.2% of the population were below the poverty line, including 18.2% of those under age 18 and 8.3% of those age 65 or over.
Common Questions
What is Per Capita Income in Lake Linden?
Per Capita income in Lake Linden is $24,816.
What is the Median Family Income in Lake Linden?
Median Family Income in Lake Linden is $53,914.
What is the Median Household income in Lake Linden?
Median Household Income in Lake Linden is $43,021.
What is Income or Wage Gap in Lake Linden?
Income or Wage Gap in Lake Linden is 0.2%.
Women in Lake Linden earn 99.8 cents for every dollar earned by a man.
What is Inequality or Gini Index in Lake Linden?
Inequality or Gini Index in Lake Linden is 0.40.
What is the Total Population of Lake Linden?
Total Population of Lake Linden is 1,183.
What is the Total Male Population of Lake Linden?
Total Male Population of Lake Linden is 575.
What is the Total Female Population of Lake Linden?
Total Female Population of Lake Linden is 608.
What is the Ratio of Males per 100 Females in Lake Linden?
There are 94.57 Males per 100 Females in Lake Linden.
What is the Ratio of Females per 100 Males in Lake Linden?
There are 105.74 Females per 100 Males in Lake Linden.
What is the Median Population Age in Lake Linden?
Median Population Age in Lake Linden is 39.3 Years.
What is the Average Family Size in Lake Linden
Average Family Size in Lake Linden is 2.8 People.
What is the Average Household Size in Lake Linden
Average Household Size in Lake Linden is 2.0 People.
How Large is the Labor Force in Lake Linden?
There are 617 People in the Labor Forcein in Lake Linden.
What is the Percentage of People in the Labor Force in Lake Linden?
60.1% of People are in the Labor Force in Lake Linden.
What is the Unemployment Rate in Lake Linden?
Unemployment Rate in Lake Linden is 10.0%.