Calumet, MI Map & Demographics
Calumet Map
Calumet Overview
$20,114
PER CAPITA INCOME
$40,833
AVG FAMILY INCOME
$23,897
AVG HOUSEHOLD INCOME
62.2%
WAGE / INCOME GAP [ % ]
37.8¢/ $1
WAGE / INCOME GAP [ $ ]
$11,662
FAMILY INCOME DEFICIT
0.49
INEQUALITY / GINI INDEX
719
TOTAL POPULATION
389
MALE POPULATION
330
FEMALE POPULATION
117.88
MALES / 100 FEMALES
84.83
FEMALES / 100 MALES
36.0
MEDIAN AGE
2.5
AVG FAMILY SIZE
1.7
AVG HOUSEHOLD SIZE
299
LABOR FORCE [ PEOPLE ]
48.9%
PERCENT IN LABOR FORCE
19.4%
UNEMPLOYMENT RATE
Calumet Zip Codes
Calumet Area Codes
Income in Calumet
Income Overview in Calumet
Per Capita Income in Calumet is $20,114, while median incomes of families and households are $40,833 and $23,897 respectively.
| Characteristic | Number | Measure |
| Per Capita Income | 719 | $20,114 |
| Median Family Income | 156 | $40,833 |
| Mean Family Income | 156 | $44,969 |
| Median Household Income | 419 | $23,897 |
| Mean Household Income | 419 | $34,782 |
| Income Deficit | 156 | $11,662 |
| Wage / Income Gap (%) | 719 | 62.19% |
| Wage / Income Gap ($) | 719 | 37.81¢ per $1 |
| Gini / Inequality Index | 719 | 0.49 |
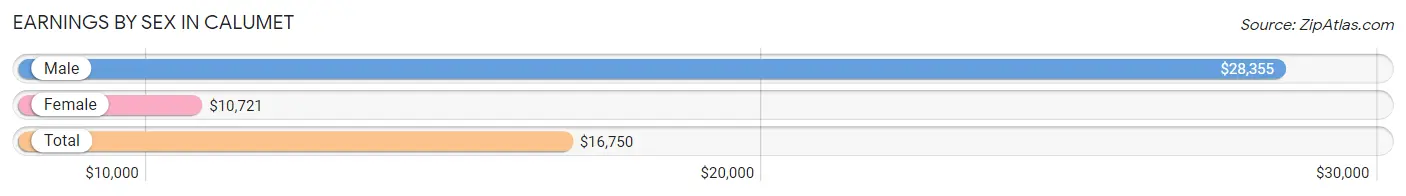
Earnings by Sex in Calumet
Average Earnings in Calumet are $16,750, $28,355 for men and $10,721 for women, a difference of 62.2%.
| Sex | Number | Average Earnings |
| Male | 195 (56.7%) | $28,355 |
| Female | 149 (43.3%) | $10,721 |
| Total | 344 (100.0%) | $16,750 |
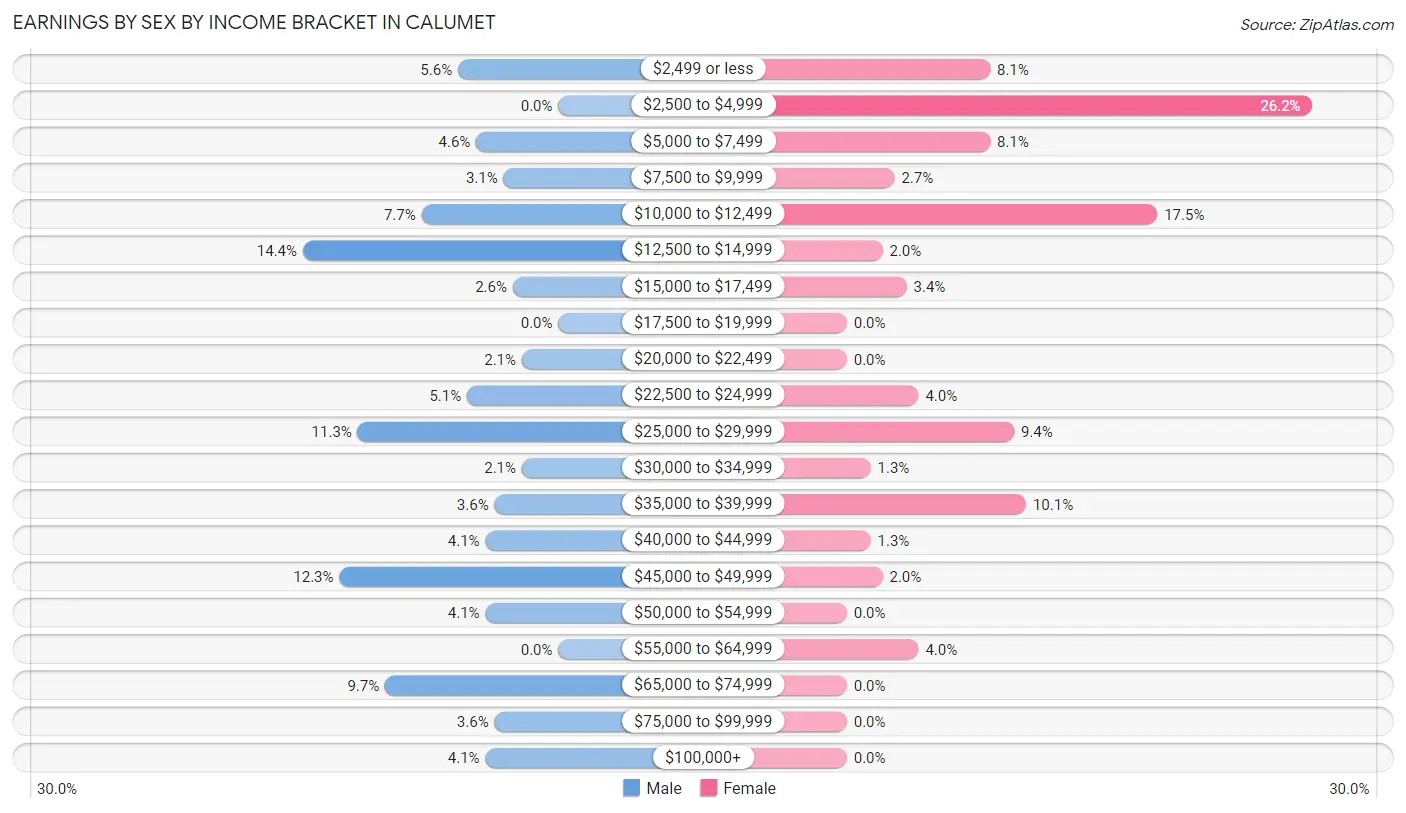
Earnings by Sex by Income Bracket in Calumet
The most common earnings brackets in Calumet are $12,500 to $14,999 for men (28 | 14.4%) and $2,500 to $4,999 for women (39 | 26.2%).
| Income | Male | Female |
| $2,499 or less | 11 (5.6%) | 12 (8.1%) |
| $2,500 to $4,999 | 0 (0.0%) | 39 (26.2%) |
| $5,000 to $7,499 | 9 (4.6%) | 12 (8.1%) |
| $7,500 to $9,999 | 6 (3.1%) | 4 (2.7%) |
| $10,000 to $12,499 | 15 (7.7%) | 26 (17.4%) |
| $12,500 to $14,999 | 28 (14.4%) | 3 (2.0%) |
| $15,000 to $17,499 | 5 (2.6%) | 5 (3.4%) |
| $17,500 to $19,999 | 0 (0.0%) | 0 (0.0%) |
| $20,000 to $22,499 | 4 (2.1%) | 0 (0.0%) |
| $22,500 to $24,999 | 10 (5.1%) | 6 (4.0%) |
| $25,000 to $29,999 | 22 (11.3%) | 14 (9.4%) |
| $30,000 to $34,999 | 4 (2.1%) | 2 (1.3%) |
| $35,000 to $39,999 | 7 (3.6%) | 15 (10.1%) |
| $40,000 to $44,999 | 8 (4.1%) | 2 (1.3%) |
| $45,000 to $49,999 | 24 (12.3%) | 3 (2.0%) |
| $50,000 to $54,999 | 8 (4.1%) | 0 (0.0%) |
| $55,000 to $64,999 | 0 (0.0%) | 6 (4.0%) |
| $65,000 to $74,999 | 19 (9.7%) | 0 (0.0%) |
| $75,000 to $99,999 | 7 (3.6%) | 0 (0.0%) |
| $100,000+ | 8 (4.1%) | 0 (0.0%) |
| Total | 195 (100.0%) | 149 (100.0%) |
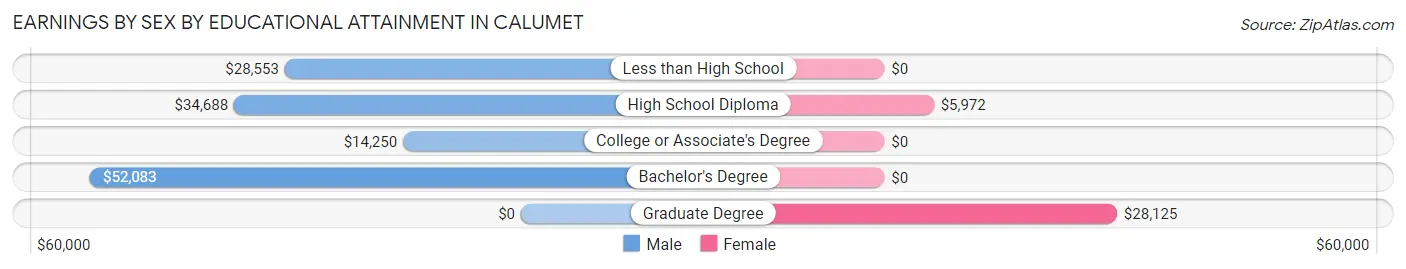
Earnings by Sex by Educational Attainment in Calumet
| Educational Attainment | Male Income | Female Income |
| Less than High School | $28,553 | $0 |
| High School Diploma | $34,688 | $5,972 |
| College or Associate's Degree | $14,250 | $0 |
| Bachelor's Degree | $52,083 | $0 |
| Graduate Degree | - | - |
| Total | $28,158 | $0 |
Family Income in Calumet
Family Income Brackets in Calumet
According to the Calumet family income data, there are 38 families falling into the less than $10,000 income range, which is the most common income bracket and makes up 24.4% of all families.
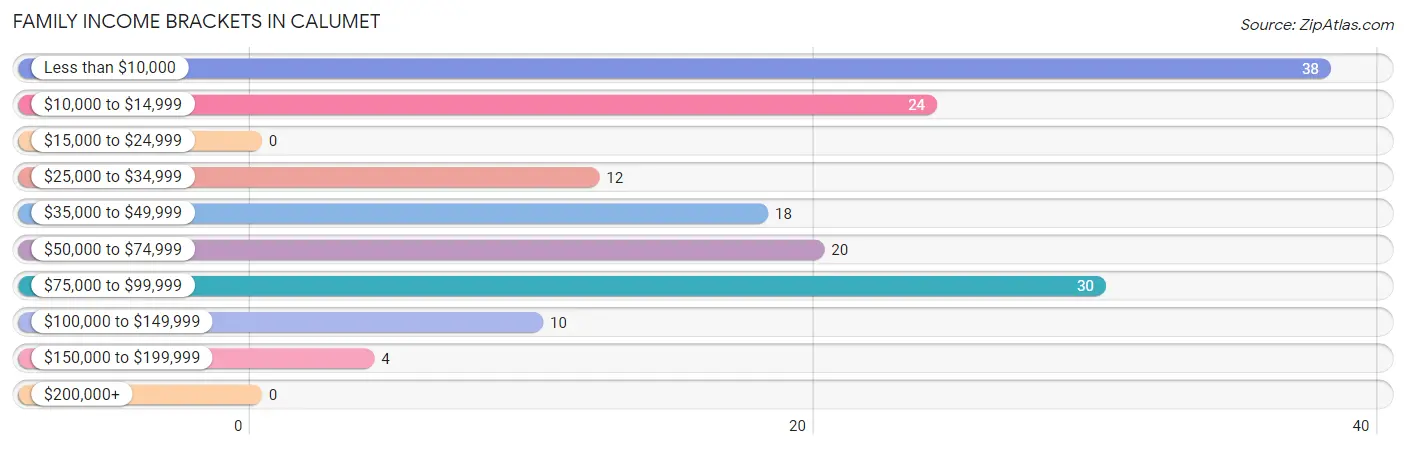
| Income Bracket | # Families | % Families |
| Less than $10,000 | 38 | 24.4% |
| $10,000 to $14,999 | 24 | 15.4% |
| $15,000 to $24,999 | 0 | 0.0% |
| $25,000 to $34,999 | 12 | 7.7% |
| $35,000 to $49,999 | 18 | 11.5% |
| $50,000 to $74,999 | 20 | 12.8% |
| $75,000 to $99,999 | 30 | 19.2% |
| $100,000 to $149,999 | 10 | 6.4% |
| $150,000 to $199,999 | 4 | 2.6% |
| $200,000+ | 0 | 0.0% |
Family Income by Famaliy Size in Calumet
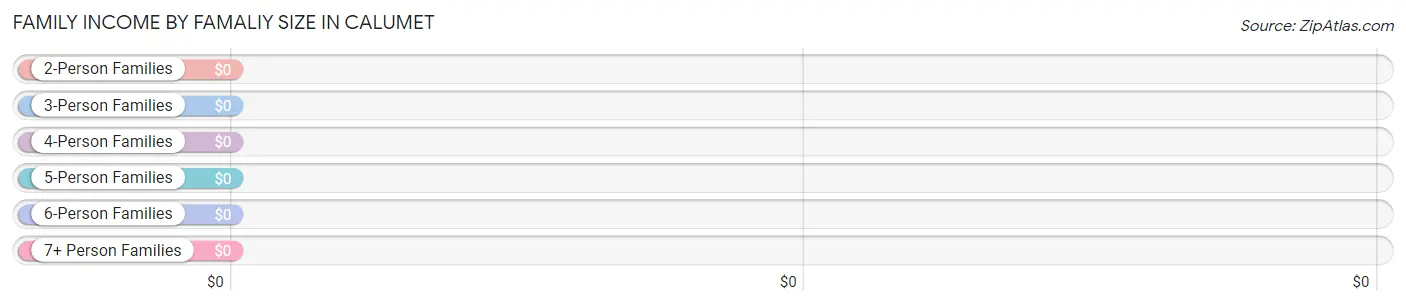
| Income Bracket | # Families | Median Income |
| 2-Person Families | 98 (62.8%) | $0 |
| 3-Person Families | 30 (19.2%) | $0 |
| 4-Person Families | 18 (11.5%) | $0 |
| 5-Person Families | 10 (6.4%) | $0 |
| 6-Person Families | 0 (0.0%) | $0 |
| 7+ Person Families | 0 (0.0%) | $0 |
| Total | 156 (100.0%) | $40,833 |
Family Income by Number of Earners in Calumet
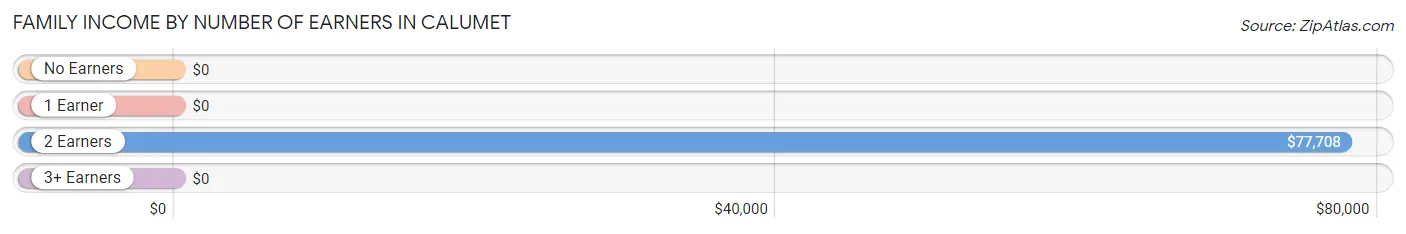
| Number of Earners | # Families | Median Income |
| No Earners | 57 (36.5%) | $0 |
| 1 Earner | 53 (34.0%) | $0 |
| 2 Earners | 41 (26.3%) | $77,708 |
| 3+ Earners | 5 (3.2%) | $0 |
| Total | 156 (100.0%) | $40,833 |
Household Income in Calumet
Household Income Brackets in Calumet
With 88 households falling in the category, the $10,000 to $14,999 income range is the most frequent in Calumet, accounting for 21.0% of all households.
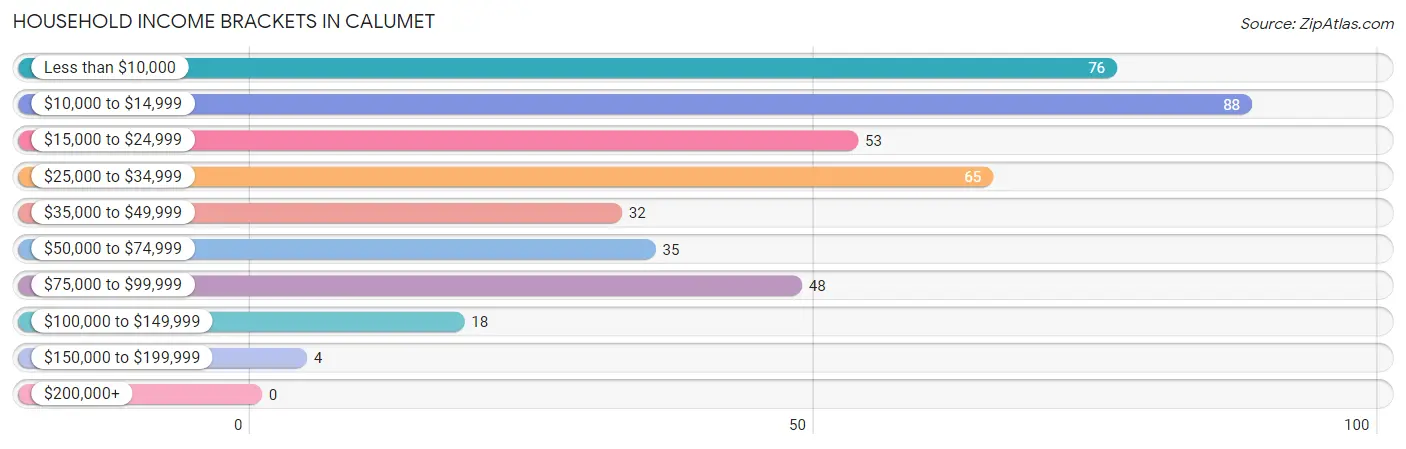
| Income Bracket | # Households | % Households |
| Less than $10,000 | 76 | 18.1% |
| $10,000 to $14,999 | 88 | 21.0% |
| $15,000 to $24,999 | 53 | 12.6% |
| $25,000 to $34,999 | 65 | 15.5% |
| $35,000 to $49,999 | 32 | 7.6% |
| $50,000 to $74,999 | 35 | 8.4% |
| $75,000 to $99,999 | 48 | 11.5% |
| $100,000 to $149,999 | 18 | 4.3% |
| $150,000 to $199,999 | 4 | 1.0% |
| $200,000+ | 0 | 0.0% |
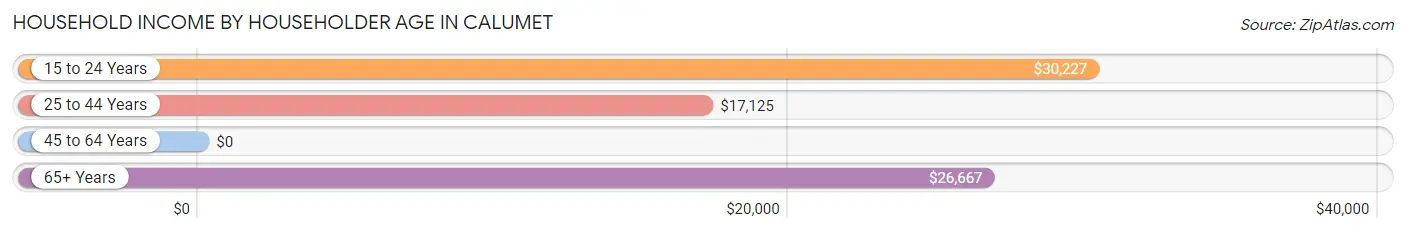
Household Income by Householder Age in Calumet
The median household income in Calumet is $23,897, with the highest median household income of $30,227 found in the 15 to 24 years age bracket for the primary householder. A total of 80 households (19.1%) fall into this category. Meanwhile, the 45 to 64 years age bracket for the primary householder has the lowest median household income of $0, with 142 households (33.9%) in this group.
| Income Bracket | # Households | Median Income |
| 15 to 24 Years | 80 (19.1%) | $30,227 |
| 25 to 44 Years | 91 (21.7%) | $17,125 |
| 45 to 64 Years | 142 (33.9%) | $0 |
| 65+ Years | 106 (25.3%) | $26,667 |
| Total | 419 (100.0%) | $23,897 |
Poverty in Calumet
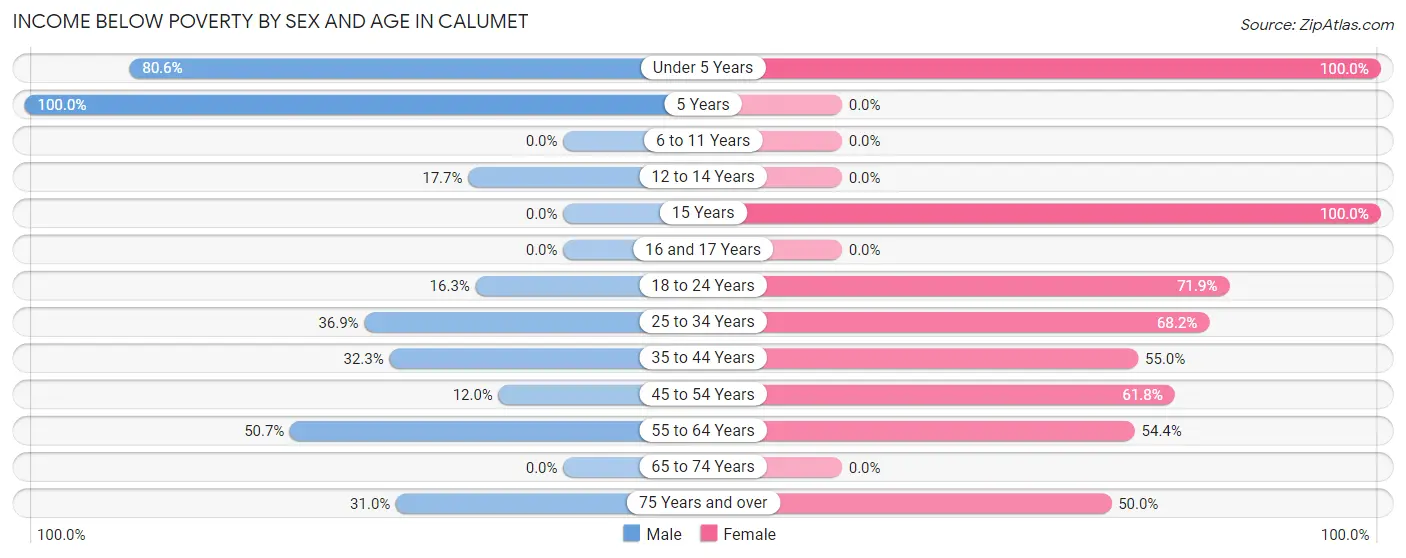
Income Below Poverty by Sex and Age in Calumet
With 31.9% poverty level for males and 56.7% for females among the residents of Calumet, 5 year old males and under 5 year old females are the most vulnerable to poverty, with 3 males (100.0%) and 18 females (100.0%) in their respective age groups living below the poverty level.
| Age Bracket | Male | Female |
| Under 5 Years | 29 (80.6%) | 18 (100.0%) |
| 5 Years | 3 (100.0%) | 0 (0.0%) |
| 6 to 11 Years | 0 (0.0%) | 0 (0.0%) |
| 12 to 14 Years | 3 (17.6%) | 0 (0.0%) |
| 15 Years | 0 (0.0%) | 3 (100.0%) |
| 16 and 17 Years | 0 (0.0%) | 0 (0.0%) |
| 18 to 24 Years | 7 (16.3%) | 64 (71.9%) |
| 25 to 34 Years | 24 (36.9%) | 30 (68.2%) |
| 35 to 44 Years | 10 (32.3%) | 11 (55.0%) |
| 45 to 54 Years | 3 (12.0%) | 21 (61.8%) |
| 55 to 64 Years | 36 (50.7%) | 25 (54.3%) |
| 65 to 74 Years | 0 (0.0%) | 0 (0.0%) |
| 75 Years and over | 9 (31.0%) | 15 (50.0%) |
| Total | 124 (31.9%) | 187 (56.7%) |
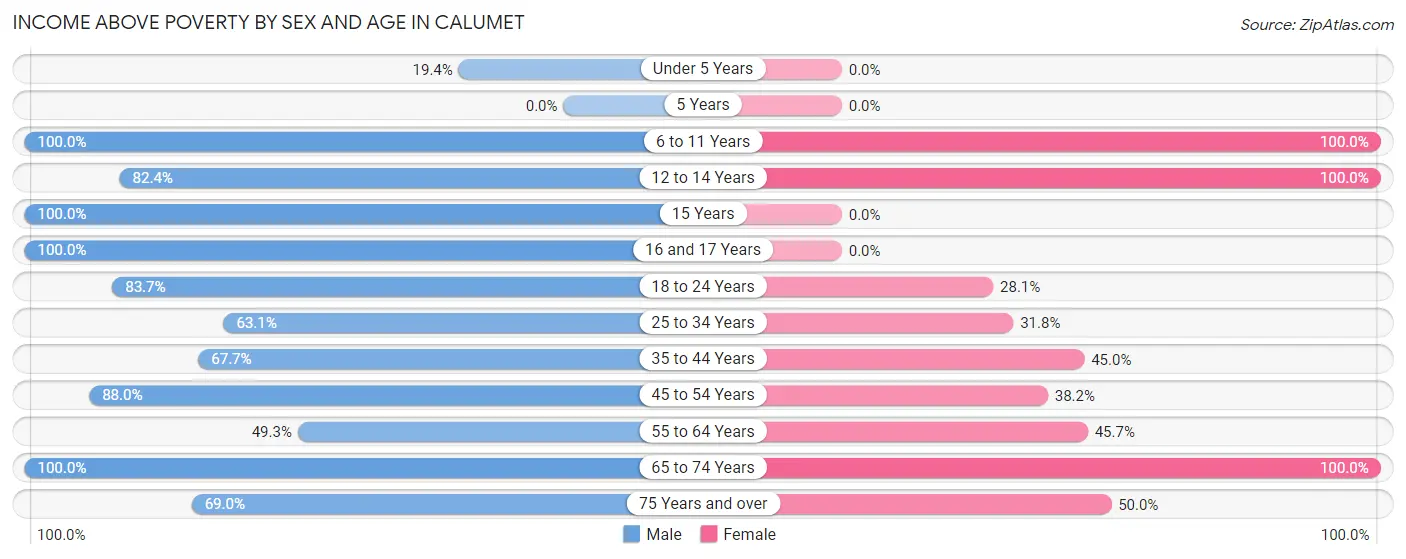
Income Above Poverty by Sex and Age in Calumet
According to the poverty statistics in Calumet, males aged 6 to 11 years and females aged 6 to 11 years are the age groups that are most secure financially, with 100.0% of males and 100.0% of females in these age groups living above the poverty line.
| Age Bracket | Male | Female |
| Under 5 Years | 7 (19.4%) | 0 (0.0%) |
| 5 Years | 0 (0.0%) | 0 (0.0%) |
| 6 to 11 Years | 12 (100.0%) | 5 (100.0%) |
| 12 to 14 Years | 14 (82.4%) | 10 (100.0%) |
| 15 Years | 4 (100.0%) | 0 (0.0%) |
| 16 and 17 Years | 4 (100.0%) | 0 (0.0%) |
| 18 to 24 Years | 36 (83.7%) | 25 (28.1%) |
| 25 to 34 Years | 41 (63.1%) | 14 (31.8%) |
| 35 to 44 Years | 21 (67.7%) | 9 (45.0%) |
| 45 to 54 Years | 22 (88.0%) | 13 (38.2%) |
| 55 to 64 Years | 35 (49.3%) | 21 (45.7%) |
| 65 to 74 Years | 49 (100.0%) | 31 (100.0%) |
| 75 Years and over | 20 (69.0%) | 15 (50.0%) |
| Total | 265 (68.1%) | 143 (43.3%) |
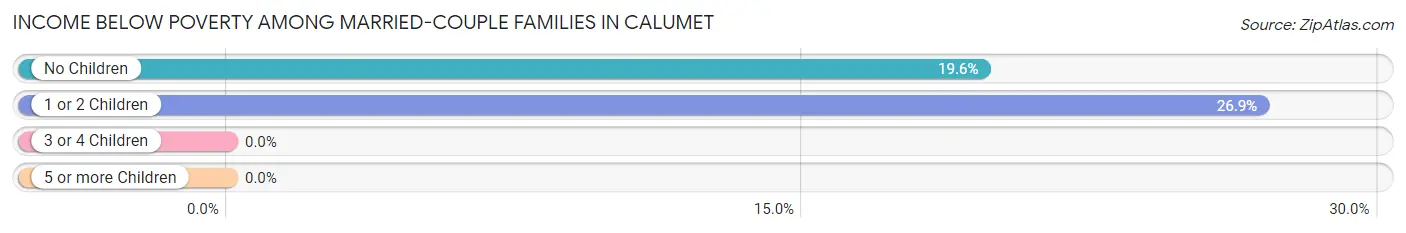
Income Below Poverty Among Married-Couple Families in Calumet
The poverty statistics for married-couple families in Calumet show that 20.0% or 18 of the total 90 families live below the poverty line. Families with 1 or 2 children have the highest poverty rate of 26.9%, comprising of 7 families. On the other hand, families with 3 or 4 children have the lowest poverty rate of 0.0%, which includes 0 families.
| Children | Above Poverty | Below Poverty |
| No Children | 45 (80.4%) | 11 (19.6%) |
| 1 or 2 Children | 19 (73.1%) | 7 (26.9%) |
| 3 or 4 Children | 8 (100.0%) | 0 (0.0%) |
| 5 or more Children | 0 (0.0%) | 0 (0.0%) |
| Total | 72 (80.0%) | 18 (20.0%) |
Income Below Poverty Among Single-Parent Households in Calumet
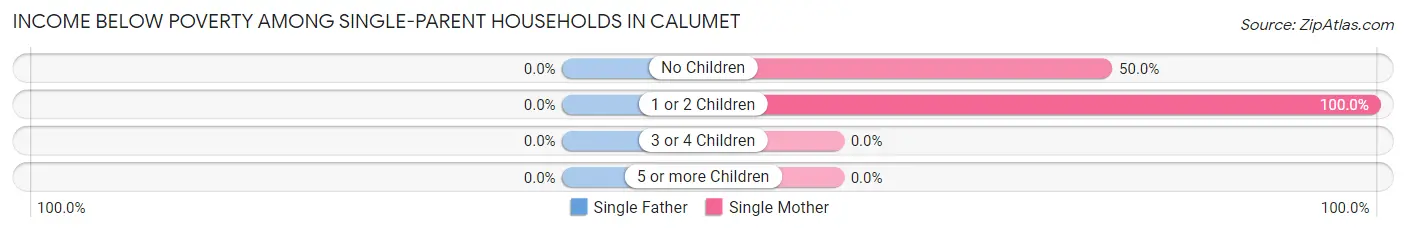
| Children | Single Father | Single Mother |
| No Children | 0 (0.0%) | 3 (50.0%) |
| 1 or 2 Children | 0 (0.0%) | 48 (100.0%) |
| 3 or 4 Children | 0 (0.0%) | 0 (0.0%) |
| 5 or more Children | 0 (0.0%) | 0 (0.0%) |
| Total | 0 (0.0%) | 51 (94.4%) |
Income Below Poverty Among Married-Couple vs Single-Parent Households in Calumet
The poverty data for Calumet shows that 18 of the married-couple family households (20.0%) and 51 of the single-parent households (77.3%) are living below the poverty level. Within the married-couple family households, those with 1 or 2 children have the highest poverty rate, with 7 households (26.9%) falling below the poverty line. Among the single-parent households, those with 1 or 2 children have the highest poverty rate, with 48 household (100.0%) living below poverty.
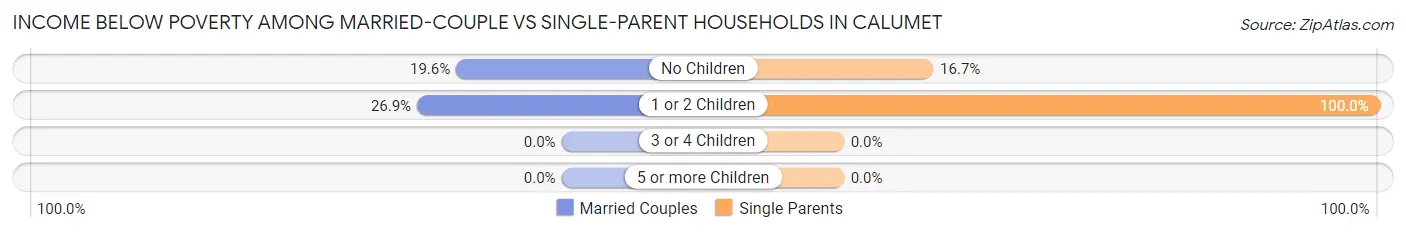
| Children | Married-Couple Families | Single-Parent Households |
| No Children | 11 (19.6%) | 3 (16.7%) |
| 1 or 2 Children | 7 (26.9%) | 48 (100.0%) |
| 3 or 4 Children | 0 (0.0%) | 0 (0.0%) |
| 5 or more Children | 0 (0.0%) | 0 (0.0%) |
| Total | 18 (20.0%) | 51 (77.3%) |
Race in Calumet
The most populous races in Calumet are White / Caucasian (662 | 92.1%), Two or more Races (36 | 5.0%), and Hispanic or Latino (27 | 3.8%).
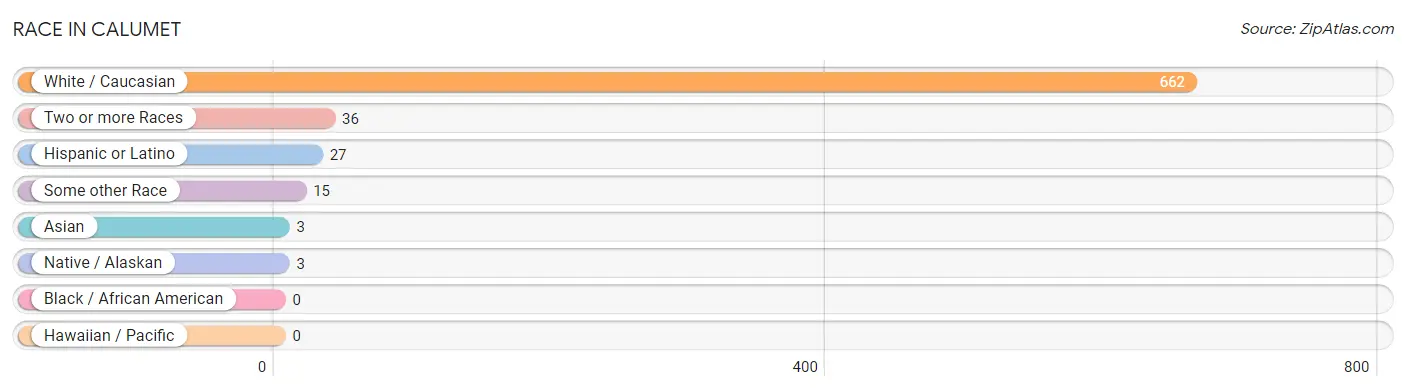
| Race | # Population | % Population |
| Asian | 3 | 0.4% |
| Black / African American | 0 | 0.0% |
| Hawaiian / Pacific | 0 | 0.0% |
| Hispanic or Latino | 27 | 3.8% |
| Native / Alaskan | 3 | 0.4% |
| White / Caucasian | 662 | 92.1% |
| Two or more Races | 36 | 5.0% |
| Some other Race | 15 | 2.1% |
| Total | 719 | 100.0% |
Ancestry in Calumet
The most populous ancestries reported in Calumet are Finnish (124 | 17.2%), German (106 | 14.7%), English (85 | 11.8%), American (68 | 9.5%), and Irish (60 | 8.3%), together accounting for 61.6% of all Calumet residents.
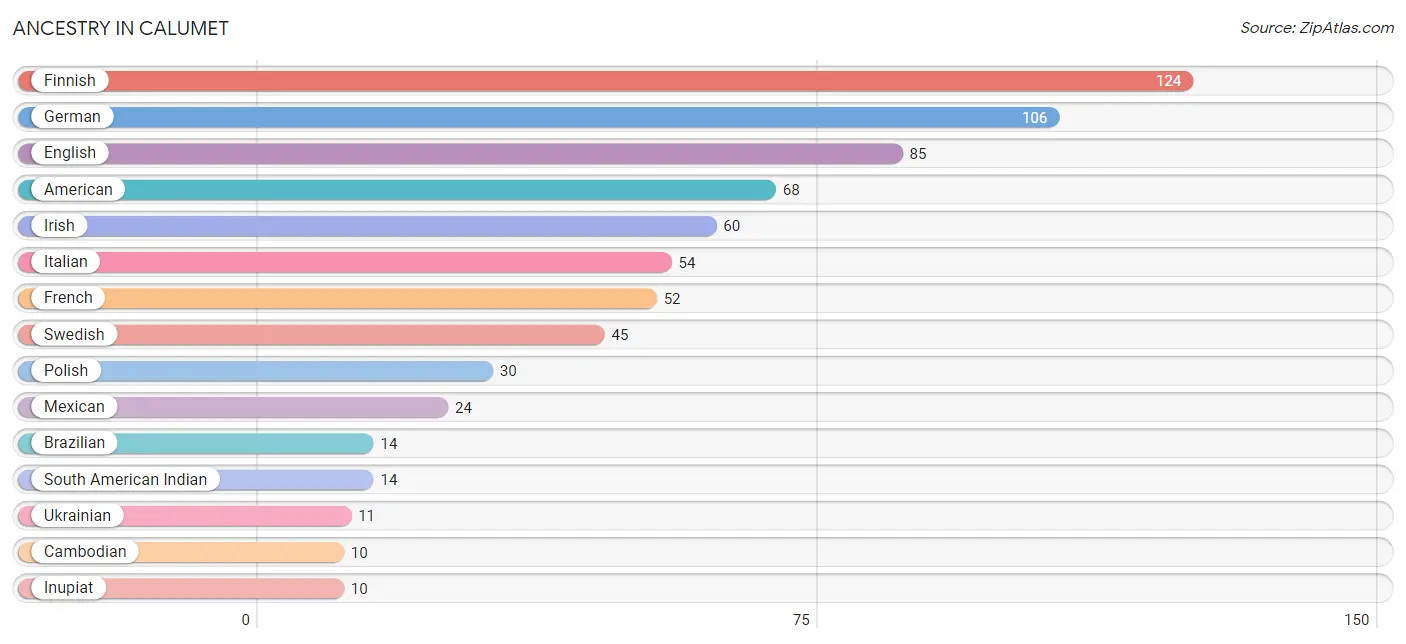
| Ancestry | # Population | % Population |
| American | 68 | 9.5% |
| Arab | 1 | 0.1% |
| Austrian | 3 | 0.4% |
| Belgian | 7 | 1.0% |
| Blackfeet | 4 | 0.6% |
| Brazilian | 14 | 1.9% |
| British | 4 | 0.6% |
| Cambodian | 10 | 1.4% |
| Chippewa | 3 | 0.4% |
| Croatian | 6 | 0.8% |
| Dutch | 9 | 1.3% |
| English | 85 | 11.8% |
| European | 5 | 0.7% |
| Finnish | 124 | 17.2% |
| French | 52 | 7.2% |
| French Canadian | 5 | 0.7% |
| German | 106 | 14.7% |
| Inupiat | 10 | 1.4% |
| Irish | 60 | 8.3% |
| Italian | 54 | 7.5% |
| Lebanese | 1 | 0.1% |
| Mexican | 24 | 3.3% |
| Norwegian | 10 | 1.4% |
| Pakistani | 3 | 0.4% |
| Polish | 30 | 4.2% |
| Portuguese | 4 | 0.6% |
| Puerto Rican | 3 | 0.4% |
| Russian | 10 | 1.4% |
| Scandinavian | 7 | 1.0% |
| Scotch-Irish | 3 | 0.4% |
| Scottish | 9 | 1.3% |
| Slovene | 5 | 0.7% |
| South African | 3 | 0.4% |
| South American Indian | 14 | 1.9% |
| Subsaharan African | 3 | 0.4% |
| Swedish | 45 | 6.3% |
| Ukrainian | 11 | 1.5% |
| Welsh | 4 | 0.6% |
| Yugoslavian | 9 | 1.3% | View All 39 Rows |
Immigrants in Calumet
The most numerous immigrant groups reported in Calumet came from Latin America (19 | 2.6%), Central America (15 | 2.1%), Europe (15 | 2.1%), Mexico (15 | 2.1%), and Germany (11 | 1.5%), together accounting for 10.4% of all Calumet residents.
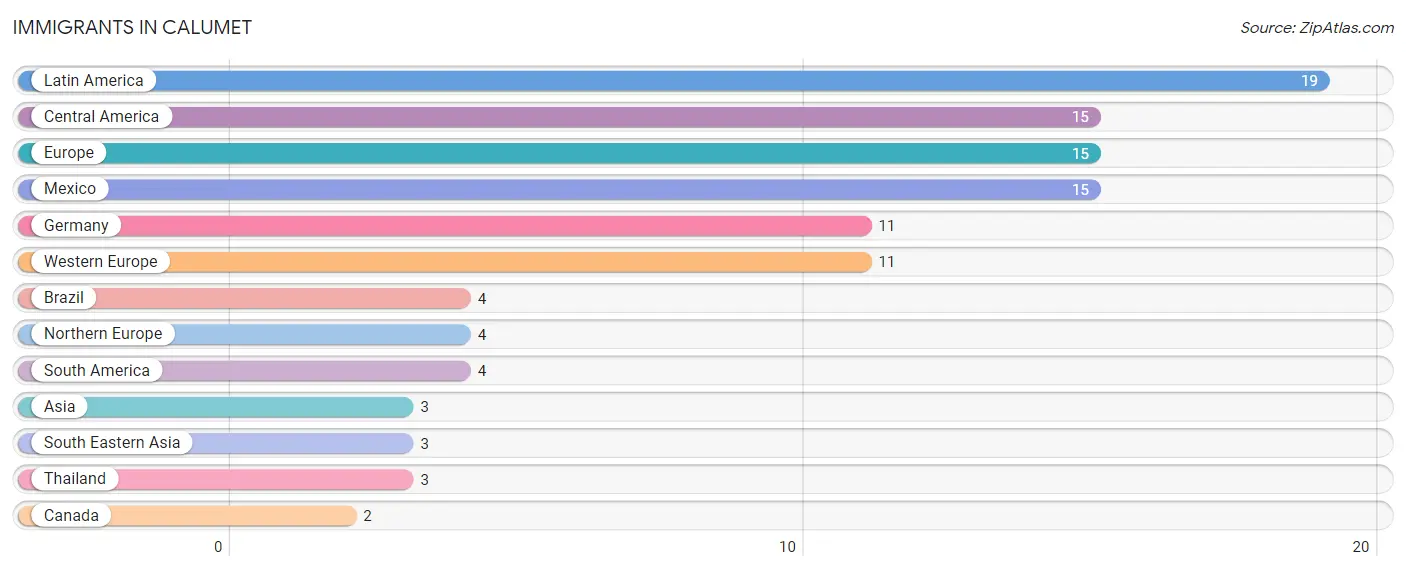
| Immigration Origin | # Population | % Population |
| Asia | 3 | 0.4% |
| Brazil | 4 | 0.6% |
| Canada | 2 | 0.3% |
| Central America | 15 | 2.1% |
| Europe | 15 | 2.1% |
| Germany | 11 | 1.5% |
| Latin America | 19 | 2.6% |
| Mexico | 15 | 2.1% |
| Northern Europe | 4 | 0.6% |
| South America | 4 | 0.6% |
| South Eastern Asia | 3 | 0.4% |
| Thailand | 3 | 0.4% |
| Western Europe | 11 | 1.5% | View All 13 Rows |
Sex and Age in Calumet
Sex and Age in Calumet
The most populous age groups in Calumet are 65 to 69 Years (40 | 10.3%) for men and 20 to 24 Years (51 | 15.4%) for women.
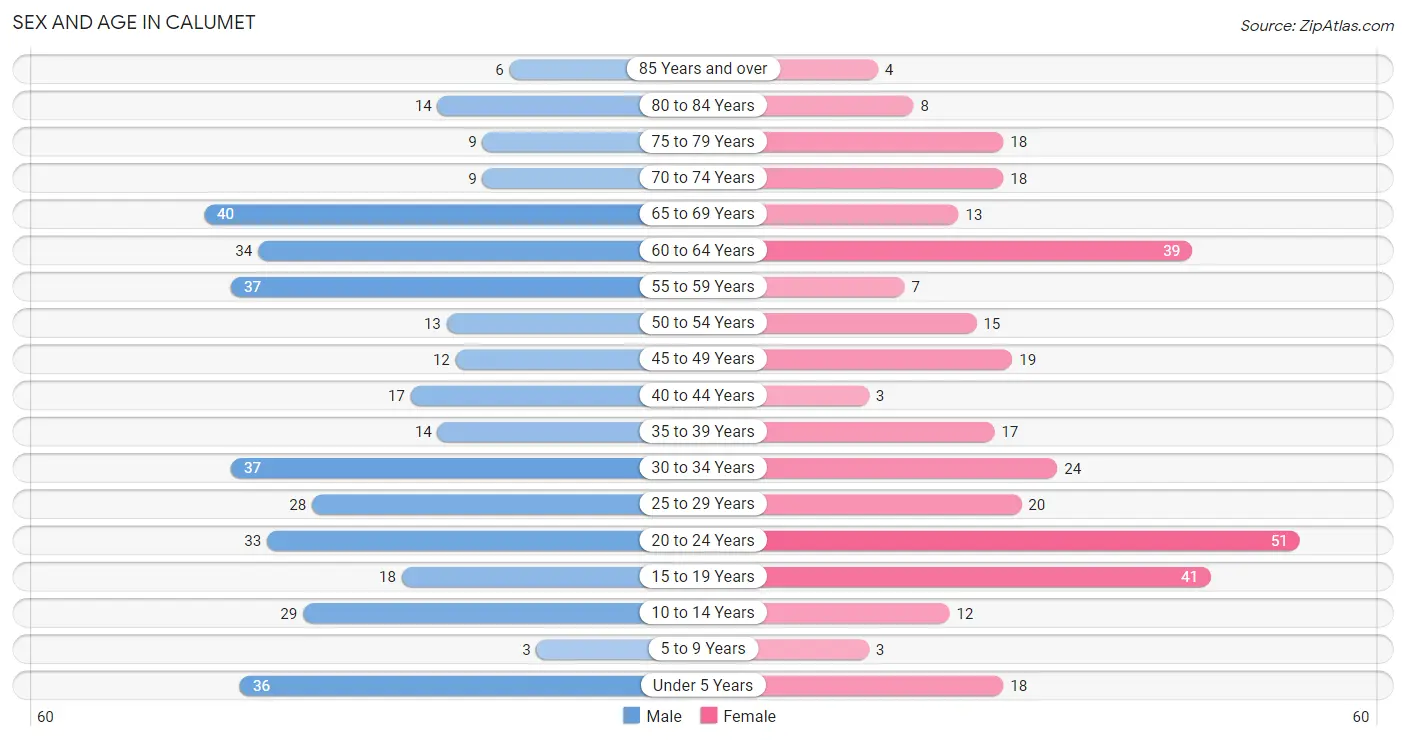
| Age Bracket | Male | Female |
| Under 5 Years | 36 (9.2%) | 18 (5.4%) |
| 5 to 9 Years | 3 (0.8%) | 3 (0.9%) |
| 10 to 14 Years | 29 (7.5%) | 12 (3.6%) |
| 15 to 19 Years | 18 (4.6%) | 41 (12.4%) |
| 20 to 24 Years | 33 (8.5%) | 51 (15.4%) |
| 25 to 29 Years | 28 (7.2%) | 20 (6.1%) |
| 30 to 34 Years | 37 (9.5%) | 24 (7.3%) |
| 35 to 39 Years | 14 (3.6%) | 17 (5.1%) |
| 40 to 44 Years | 17 (4.4%) | 3 (0.9%) |
| 45 to 49 Years | 12 (3.1%) | 19 (5.8%) |
| 50 to 54 Years | 13 (3.3%) | 15 (4.5%) |
| 55 to 59 Years | 37 (9.5%) | 7 (2.1%) |
| 60 to 64 Years | 34 (8.7%) | 39 (11.8%) |
| 65 to 69 Years | 40 (10.3%) | 13 (3.9%) |
| 70 to 74 Years | 9 (2.3%) | 18 (5.4%) |
| 75 to 79 Years | 9 (2.3%) | 18 (5.4%) |
| 80 to 84 Years | 14 (3.6%) | 8 (2.4%) |
| 85 Years and over | 6 (1.5%) | 4 (1.2%) |
| Total | 389 (100.0%) | 330 (100.0%) |
Families and Households in Calumet
Median Family Size in Calumet
The median family size in Calumet is 2.49 persons per family, with married-couple families (90 | 57.7%) accounting for the largest median family size of 2.71 persons per family. On the other hand, single male/father families (12 | 7.7%) represent the smallest median family size with 2.08 persons per family.
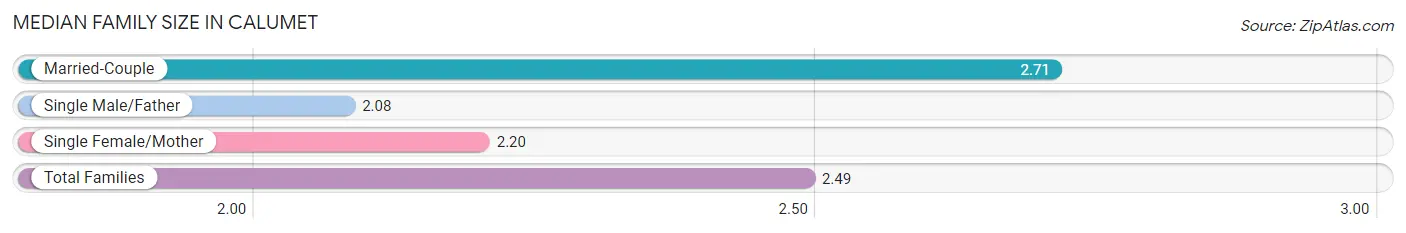
| Family Type | # Families | Family Size |
| Married-Couple | 90 (57.7%) | 2.71 |
| Single Male/Father | 12 (7.7%) | 2.08 |
| Single Female/Mother | 54 (34.6%) | 2.20 |
| Total Families | 156 (100.0%) | 2.49 |
Median Household Size in Calumet
The median household size in Calumet is 1.72 persons per household, with married-couple households (90 | 21.5%) accounting for the largest median household size of 2.71 persons per household. non-family households (263 | 62.8%) represent the smallest median household size with 1.19 persons per household.
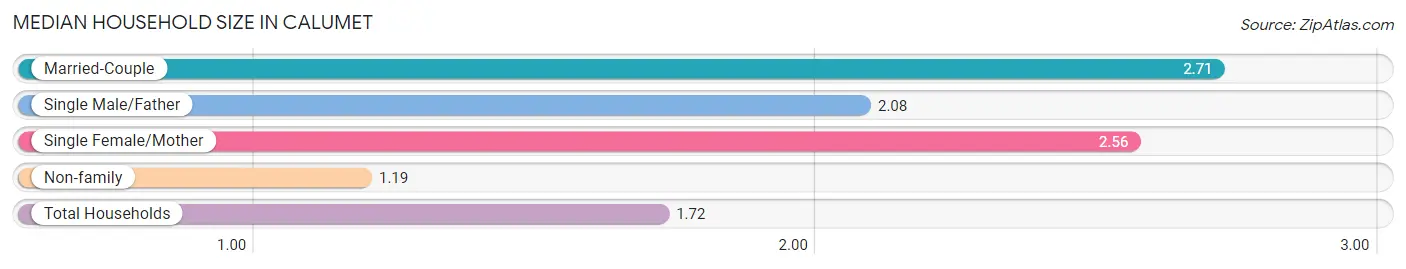
| Household Type | # Households | Household Size |
| Married-Couple | 90 (21.5%) | 2.71 |
| Single Male/Father | 12 (2.9%) | 2.08 |
| Single Female/Mother | 54 (12.9%) | 2.56 |
| Non-family | 263 (62.8%) | 1.19 |
| Total Households | 419 (100.0%) | 1.72 |
Household Size by Marriage Status in Calumet
Out of a total of 419 households in Calumet, 156 (37.2%) are family households, while 263 (62.8%) are nonfamily households. The most numerous type of family households are 2-person households, comprising 88, and the most common type of nonfamily households are 1-person households, comprising 211.
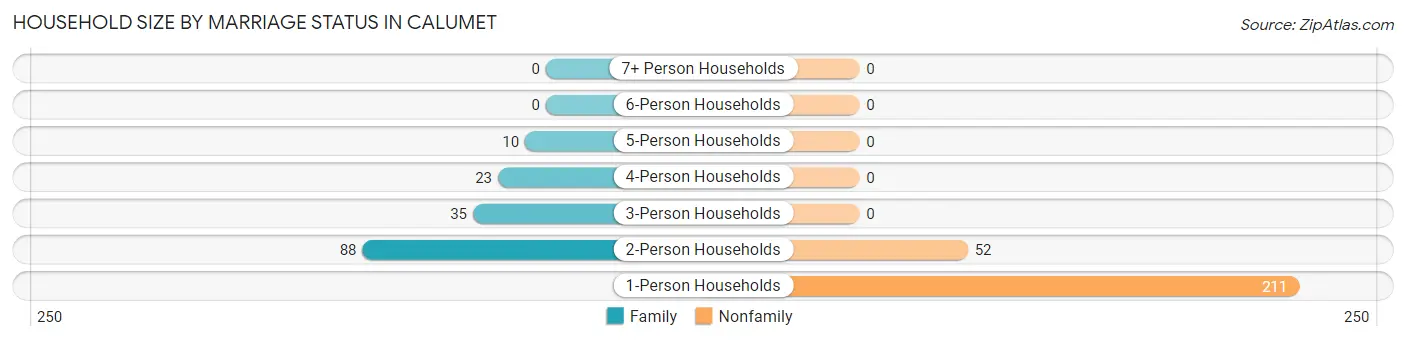
| Household Size | Family Households | Nonfamily Households |
| 1-Person Households | - | 211 (50.4%) |
| 2-Person Households | 88 (21.0%) | 52 (12.4%) |
| 3-Person Households | 35 (8.4%) | 0 (0.0%) |
| 4-Person Households | 23 (5.5%) | 0 (0.0%) |
| 5-Person Households | 10 (2.4%) | 0 (0.0%) |
| 6-Person Households | 0 (0.0%) | 0 (0.0%) |
| 7+ Person Households | 0 (0.0%) | 0 (0.0%) |
| Total | 156 (37.2%) | 263 (62.8%) |
Female Fertility in Calumet
Fertility by Age in Calumet
Average fertility rate in Calumet is 33.0 births per 1,000 women. Women in the age bracket of 20 to 34 years have the highest fertility rate with 63.0 births per 1,000 women. Women in the age bracket of 20 to 34 years acount for 100.0% of all women with births.
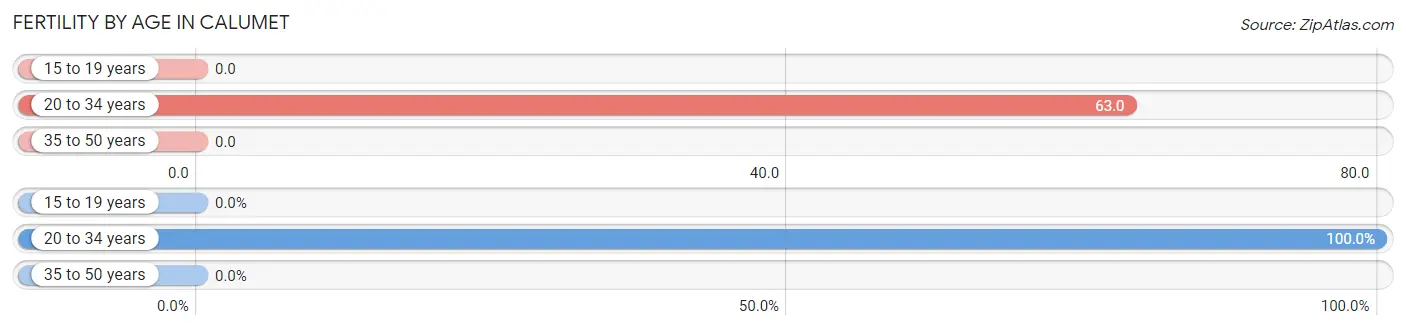
| Age Bracket | Women with Births | Births / 1,000 Women |
| 15 to 19 years | 0 (0.0%) | 0.0 |
| 20 to 34 years | 6 (100.0%) | 63.0 |
| 35 to 50 years | 0 (0.0%) | 0.0 |
| Total | 6 (100.0%) | 33.0 |
Fertility by Age by Marriage Status in Calumet
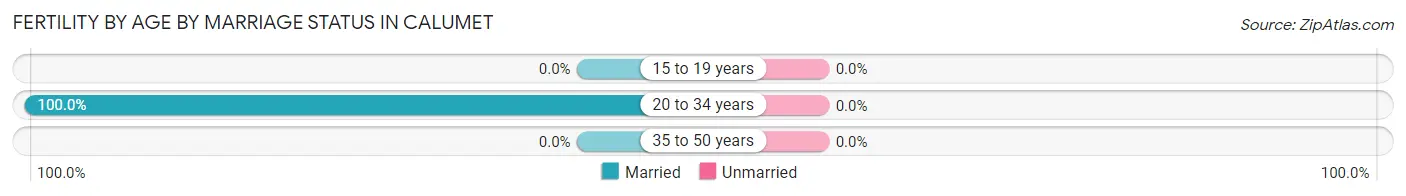
| Age Bracket | Married | Unmarried |
| 15 to 19 years | 0 (0.0%) | 0 (0.0%) |
| 20 to 34 years | 6 (100.0%) | 0 (0.0%) |
| 35 to 50 years | 0 (0.0%) | 0 (0.0%) |
| Total | 6 (100.0%) | 0 (0.0%) |
Fertility by Education in Calumet
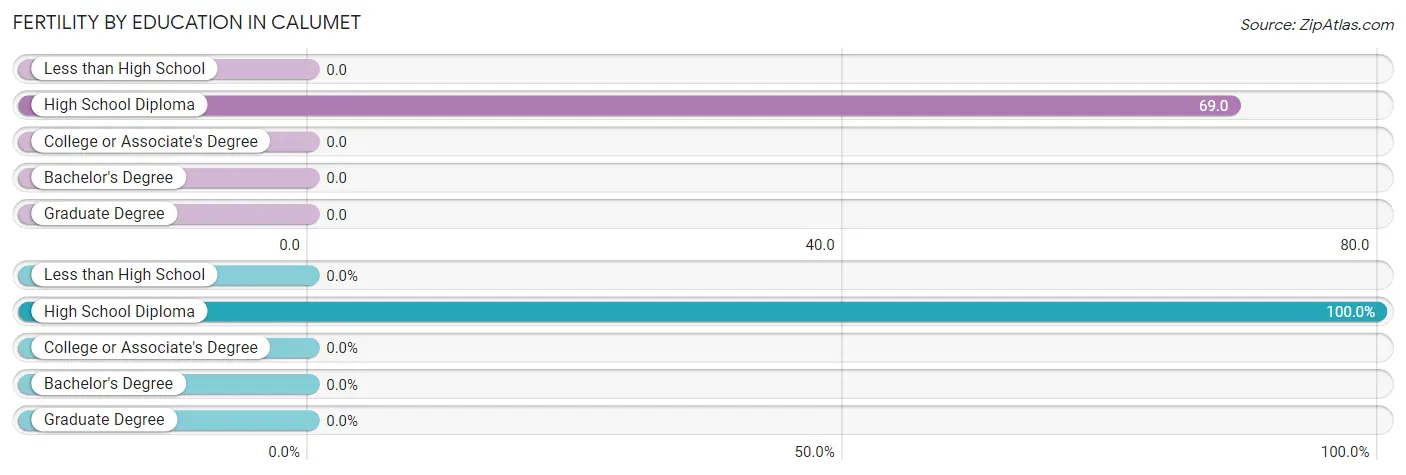
| Educational Attainment | Women with Births | Births / 1,000 Women |
| Less than High School | 0 (0.0%) | 0.0 |
| High School Diploma | 6 (100.0%) | 69.0 |
| College or Associate's Degree | 0 (0.0%) | 0.0 |
| Bachelor's Degree | 0 (0.0%) | 0.0 |
| Graduate Degree | 0 (0.0%) | 0.0 |
| Total | 6 (100.0%) | 33.0 |
Fertility by Education by Marriage Status in Calumet
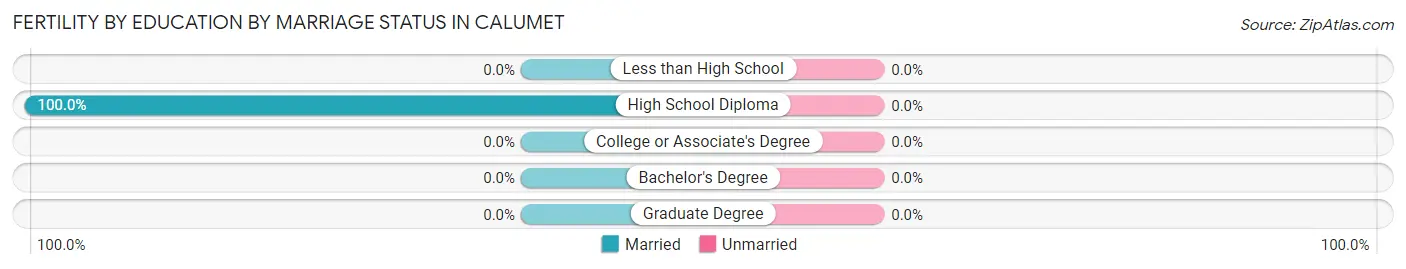
| Educational Attainment | Married | Unmarried |
| Less than High School | 0 (0.0%) | 0 (0.0%) |
| High School Diploma | 6 (100.0%) | 0 (0.0%) |
| College or Associate's Degree | 0 (0.0%) | 0 (0.0%) |
| Bachelor's Degree | 0 (0.0%) | 0 (0.0%) |
| Graduate Degree | 0 (0.0%) | 0 (0.0%) |
| Total | 6 (100.0%) | 0 (0.0%) |
Employment Characteristics in Calumet
Employment by Class of Employer in Calumet
Among the 238 employed individuals in Calumet, private company employees (184 | 77.3%), not-for-profit organizations (21 | 8.8%), and state government employees (16 | 6.7%) make up the most common classes of employment.
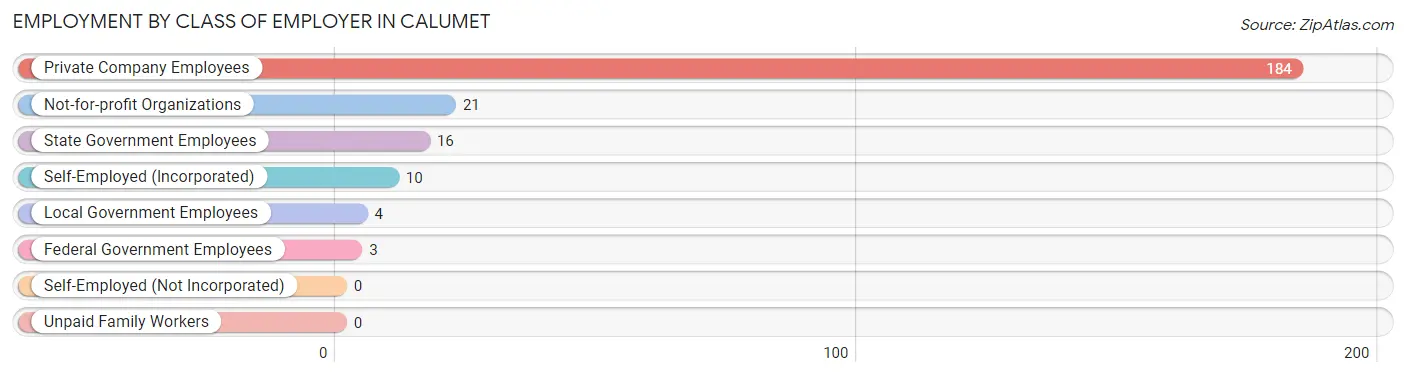
| Employer Class | # Employees | % Employees |
| Private Company Employees | 184 | 77.3% |
| Self-Employed (Incorporated) | 10 | 4.2% |
| Self-Employed (Not Incorporated) | 0 | 0.0% |
| Not-for-profit Organizations | 21 | 8.8% |
| Local Government Employees | 4 | 1.7% |
| State Government Employees | 16 | 6.7% |
| Federal Government Employees | 3 | 1.3% |
| Unpaid Family Workers | 0 | 0.0% |
| Total | 238 | 100.0% |
Employment Status by Age in Calumet
According to the labor force statistics for Calumet, out of the total population over 16 years of age (611), 48.9% or 299 individuals are in the labor force, with 19.4% or 58 of them unemployed. The age group with the highest labor force participation rate is 25 to 29 years, with 100.0% or 48 individuals in the labor force. Within the labor force, the 16 to 19 years age range has the highest percentage of unemployed individuals, with 89.2% or 33 of them being unemployed.
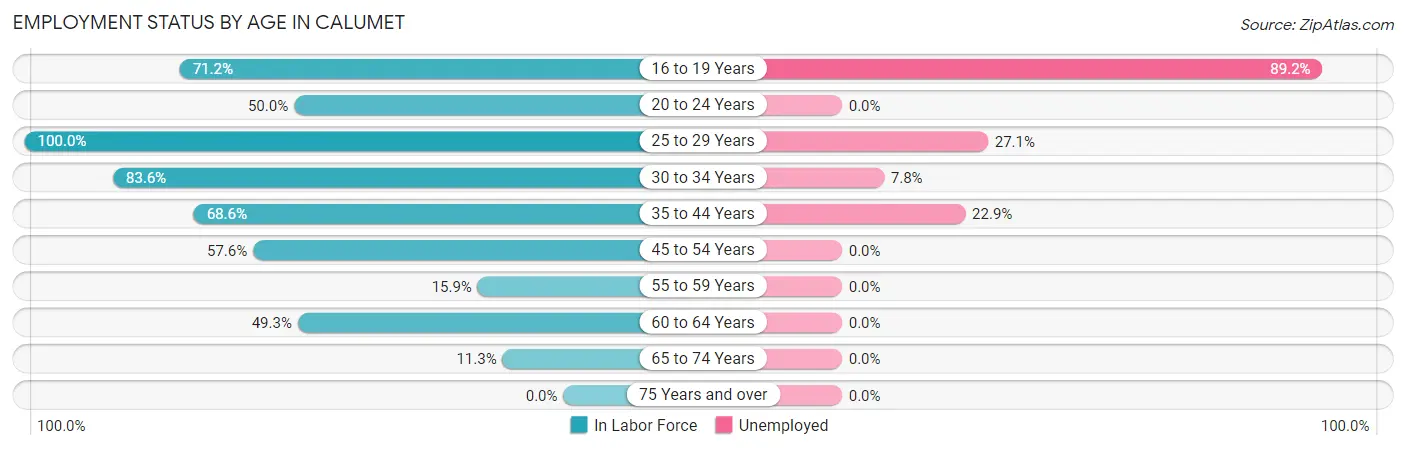
| Age Bracket | In Labor Force | Unemployed |
| 16 to 19 Years | 37 (71.2%) | 33 (89.2%) |
| 20 to 24 Years | 42 (50.0%) | 0 (0.0%) |
| 25 to 29 Years | 48 (100.0%) | 13 (27.1%) |
| 30 to 34 Years | 51 (83.6%) | 4 (7.8%) |
| 35 to 44 Years | 35 (68.6%) | 8 (22.9%) |
| 45 to 54 Years | 34 (57.6%) | 0 (0.0%) |
| 55 to 59 Years | 7 (15.9%) | 0 (0.0%) |
| 60 to 64 Years | 36 (49.3%) | 0 (0.0%) |
| 65 to 74 Years | 9 (11.3%) | 0 (0.0%) |
| 75 Years and over | 0 (0.0%) | 0 (0.0%) |
| Total | 299 (48.9%) | 58 (19.4%) |
Employment Status by Educational Attainment in Calumet
According to labor force statistics for Calumet, 62.8% of individuals (211) out of the total population between 25 and 64 years of age (336) are in the labor force, with 11.8% or 25 of them being unemployed. The group with the highest labor force participation rate are those with the educational attainment of bachelor's degree or higher, with 76.1% or 51 individuals in the labor force. Within the labor force, individuals with bachelor's degree or higher education have the highest percentage of unemployment, with 15.7% or 8 of them being unemployed.
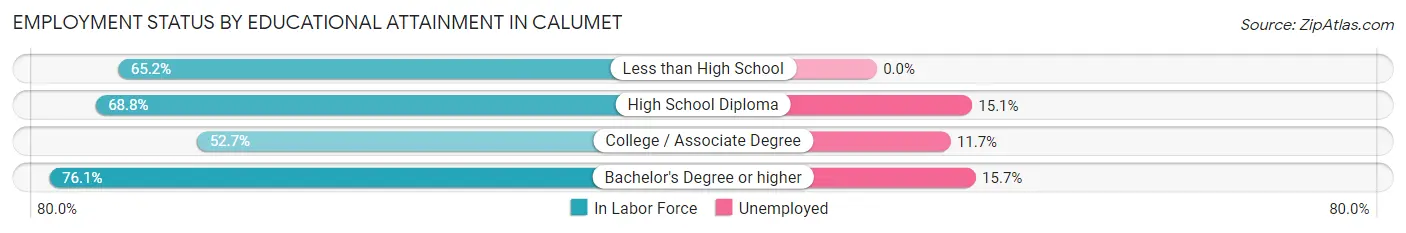
| Educational Attainment | In Labor Force | Unemployed |
| Less than High School | 30 (65.2%) | 0 (0.0%) |
| High School Diploma | 53 (68.8%) | 12 (15.1%) |
| College / Associate Degree | 77 (52.7%) | 17 (11.7%) |
| Bachelor's Degree or higher | 51 (76.1%) | 11 (15.7%) |
| Total | 211 (62.8%) | 40 (11.8%) |
Employment Occupations by Sex in Calumet
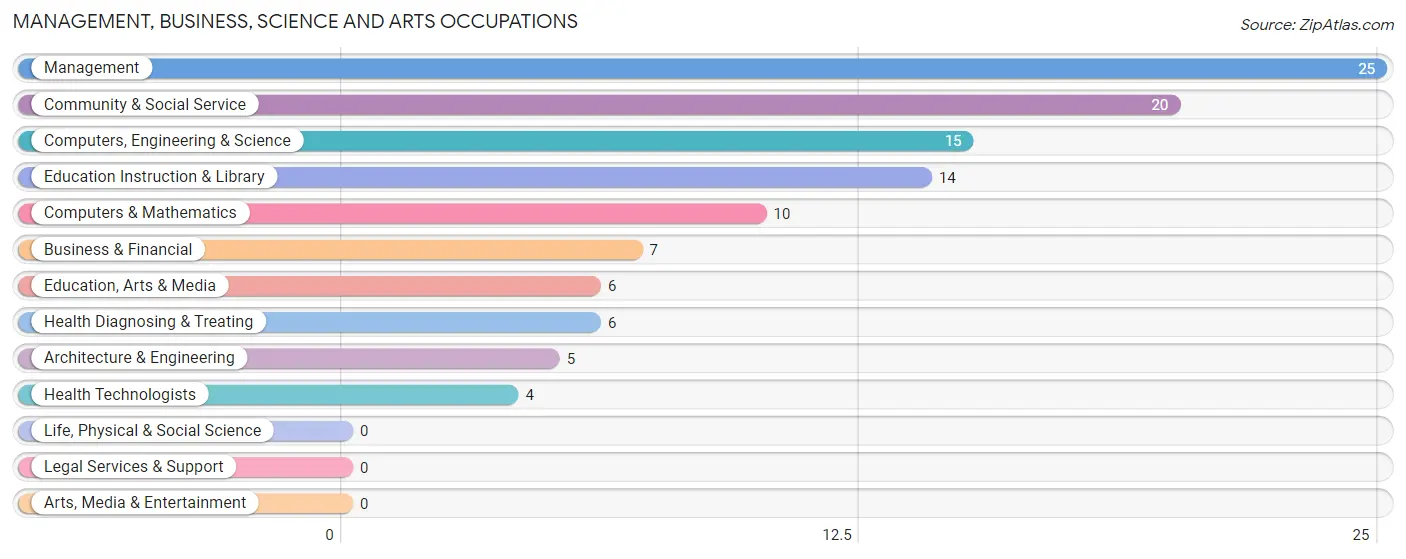
Management, Business, Science and Arts Occupations
The most common Management, Business, Science and Arts occupations in Calumet are Management (25 | 10.4%), Community & Social Service (20 | 8.3%), Computers, Engineering & Science (15 | 6.2%), Education Instruction & Library (14 | 5.8%), and Computers & Mathematics (10 | 4.2%).
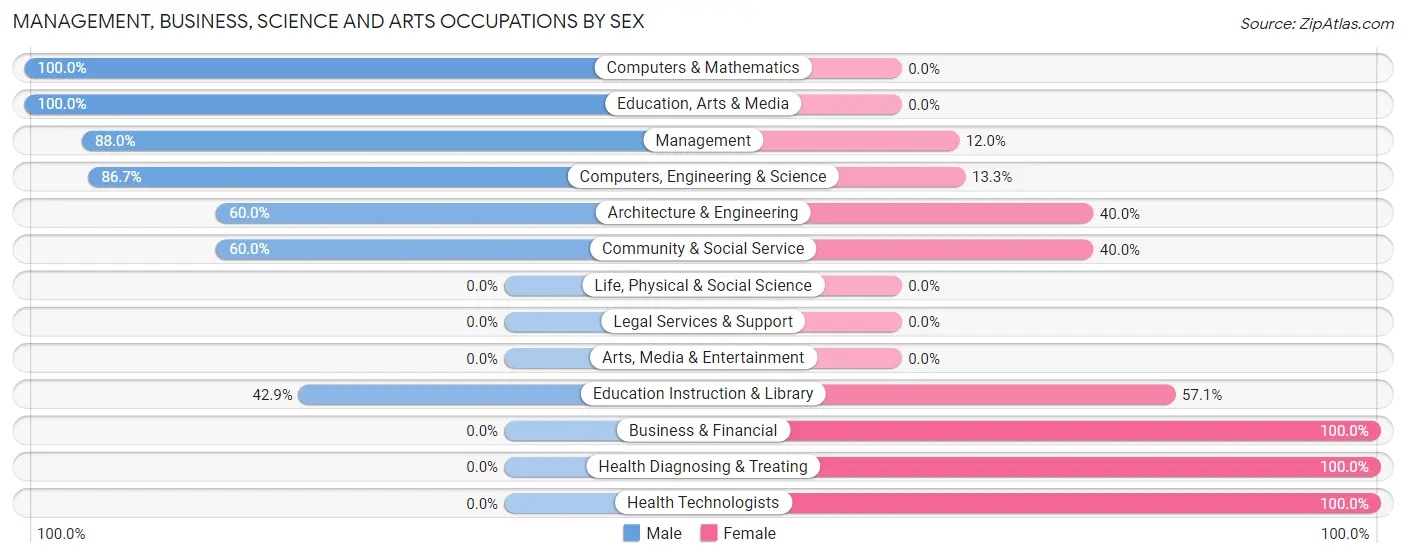
Management, Business, Science and Arts Occupations by Sex
Within the Management, Business, Science and Arts occupations in Calumet, the most male-oriented occupations are Computers & Mathematics (100.0%), Education, Arts & Media (100.0%), and Management (88.0%), while the most female-oriented occupations are Business & Financial (100.0%), Health Diagnosing & Treating (100.0%), and Health Technologists (100.0%).
| Occupation | Male | Female |
| Management | 22 (88.0%) | 3 (12.0%) |
| Business & Financial | 0 (0.0%) | 7 (100.0%) |
| Computers, Engineering & Science | 13 (86.7%) | 2 (13.3%) |
| Computers & Mathematics | 10 (100.0%) | 0 (0.0%) |
| Architecture & Engineering | 3 (60.0%) | 2 (40.0%) |
| Life, Physical & Social Science | 0 (0.0%) | 0 (0.0%) |
| Community & Social Service | 12 (60.0%) | 8 (40.0%) |
| Education, Arts & Media | 6 (100.0%) | 0 (0.0%) |
| Legal Services & Support | 0 (0.0%) | 0 (0.0%) |
| Education Instruction & Library | 6 (42.9%) | 8 (57.1%) |
| Arts, Media & Entertainment | 0 (0.0%) | 0 (0.0%) |
| Health Diagnosing & Treating | 0 (0.0%) | 6 (100.0%) |
| Health Technologists | 0 (0.0%) | 4 (100.0%) |
| Total (Category) | 47 (64.4%) | 26 (35.6%) |
| Total (Overall) | 168 (69.7%) | 73 (30.3%) |
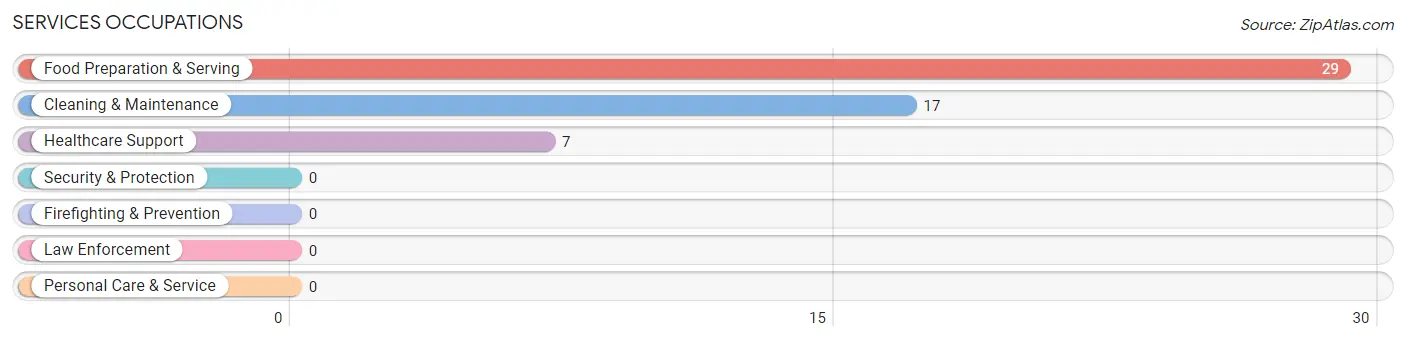
Services Occupations
The most common Services occupations in Calumet are Food Preparation & Serving (29 | 12.0%), Cleaning & Maintenance (17 | 7.0%), and Healthcare Support (7 | 2.9%).
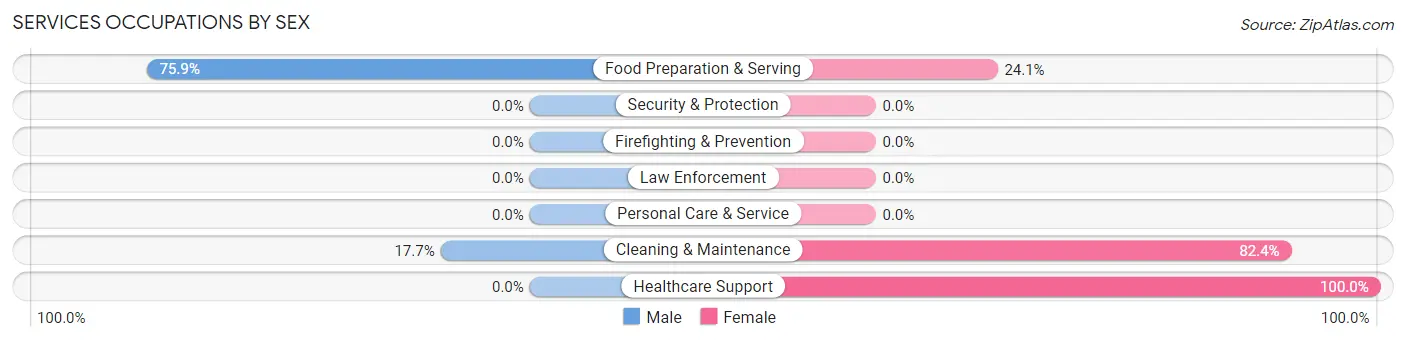
Services Occupations by Sex
Within the Services occupations in Calumet, the most male-oriented occupations are Food Preparation & Serving (75.9%), and Cleaning & Maintenance (17.6%), while the most female-oriented occupations are Healthcare Support (100.0%), Cleaning & Maintenance (82.4%), and Food Preparation & Serving (24.1%).
| Occupation | Male | Female |
| Healthcare Support | 0 (0.0%) | 7 (100.0%) |
| Security & Protection | 0 (0.0%) | 0 (0.0%) |
| Firefighting & Prevention | 0 (0.0%) | 0 (0.0%) |
| Law Enforcement | 0 (0.0%) | 0 (0.0%) |
| Food Preparation & Serving | 22 (75.9%) | 7 (24.1%) |
| Cleaning & Maintenance | 3 (17.6%) | 14 (82.4%) |
| Personal Care & Service | 0 (0.0%) | 0 (0.0%) |
| Total (Category) | 25 (47.2%) | 28 (52.8%) |
| Total (Overall) | 168 (69.7%) | 73 (30.3%) |
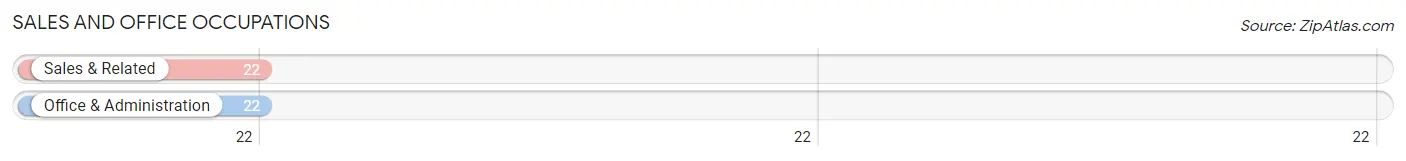
Sales and Office Occupations
The most common Sales and Office occupations in Calumet are Sales & Related (22 | 9.1%), and Office & Administration (22 | 9.1%).
Sales and Office Occupations by Sex
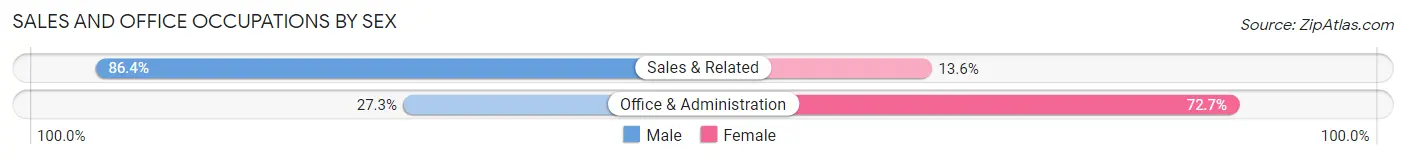
| Occupation | Male | Female |
| Sales & Related | 19 (86.4%) | 3 (13.6%) |
| Office & Administration | 6 (27.3%) | 16 (72.7%) |
| Total (Category) | 25 (56.8%) | 19 (43.2%) |
| Total (Overall) | 168 (69.7%) | 73 (30.3%) |
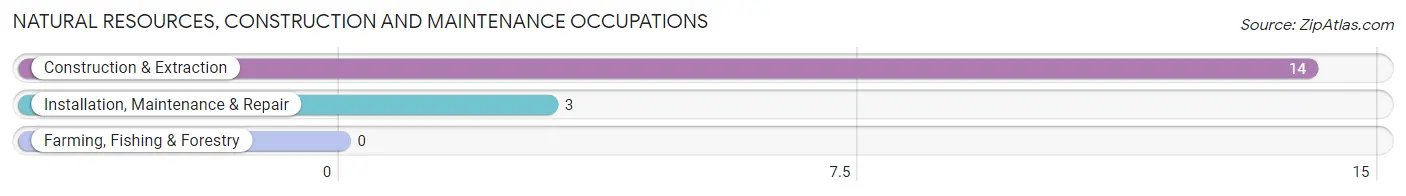
Natural Resources, Construction and Maintenance Occupations
The most common Natural Resources, Construction and Maintenance occupations in Calumet are Construction & Extraction (14 | 5.8%), and Installation, Maintenance & Repair (3 | 1.2%).
Natural Resources, Construction and Maintenance Occupations by Sex
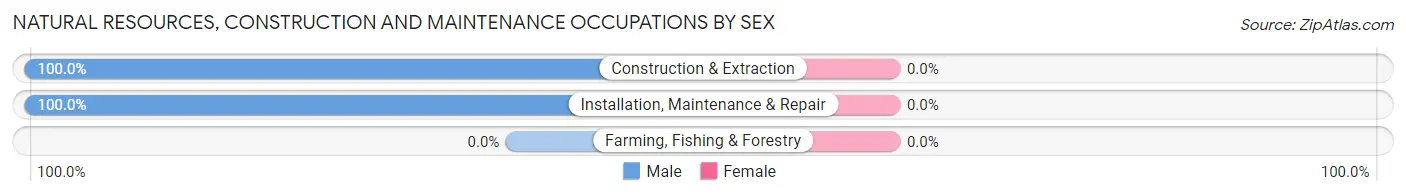
| Occupation | Male | Female |
| Farming, Fishing & Forestry | 0 (0.0%) | 0 (0.0%) |
| Construction & Extraction | 14 (100.0%) | 0 (0.0%) |
| Installation, Maintenance & Repair | 3 (100.0%) | 0 (0.0%) |
| Total (Category) | 17 (100.0%) | 0 (0.0%) |
| Total (Overall) | 168 (69.7%) | 73 (30.3%) |
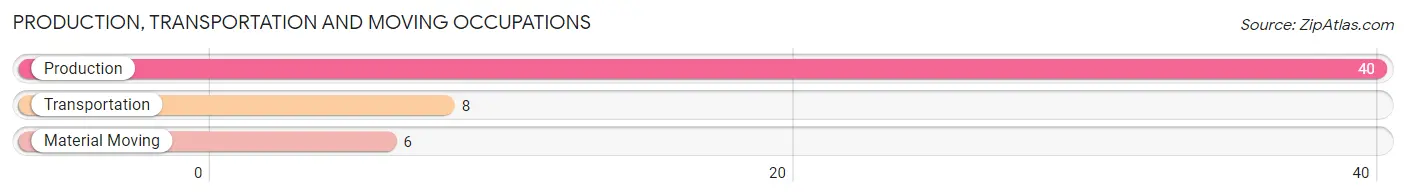
Production, Transportation and Moving Occupations
The most common Production, Transportation and Moving occupations in Calumet are Production (40 | 16.6%), Transportation (8 | 3.3%), and Material Moving (6 | 2.5%).
Production, Transportation and Moving Occupations by Sex
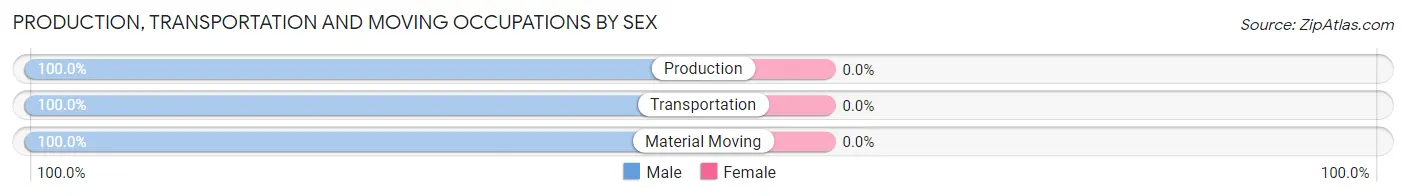
| Occupation | Male | Female |
| Production | 40 (100.0%) | 0 (0.0%) |
| Transportation | 8 (100.0%) | 0 (0.0%) |
| Material Moving | 6 (100.0%) | 0 (0.0%) |
| Total (Category) | 54 (100.0%) | 0 (0.0%) |
| Total (Overall) | 168 (69.7%) | 73 (30.3%) |
Employment Industries by Sex in Calumet
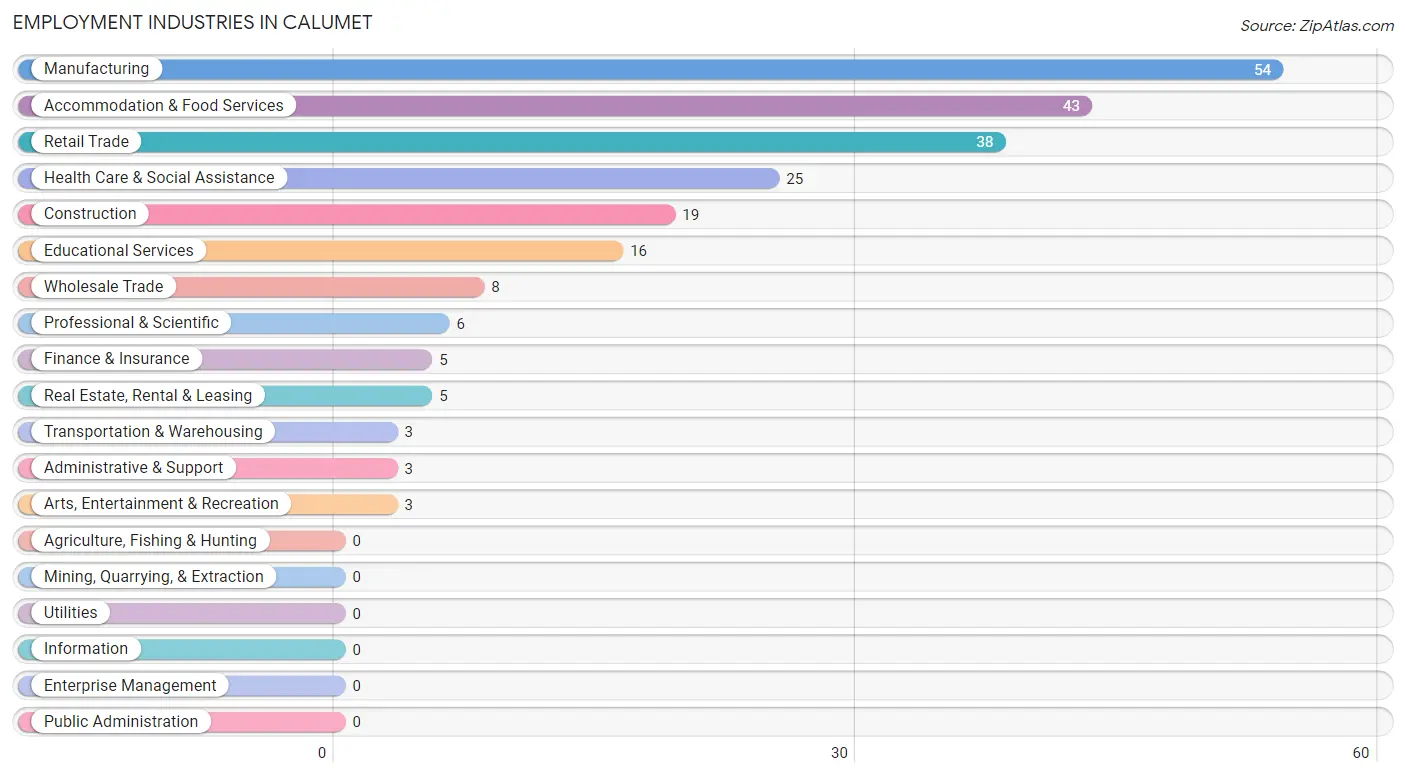
Employment Industries in Calumet
The major employment industries in Calumet include Manufacturing (54 | 22.4%), Accommodation & Food Services (43 | 17.8%), Retail Trade (38 | 15.8%), Health Care & Social Assistance (25 | 10.4%), and Construction (19 | 7.9%).
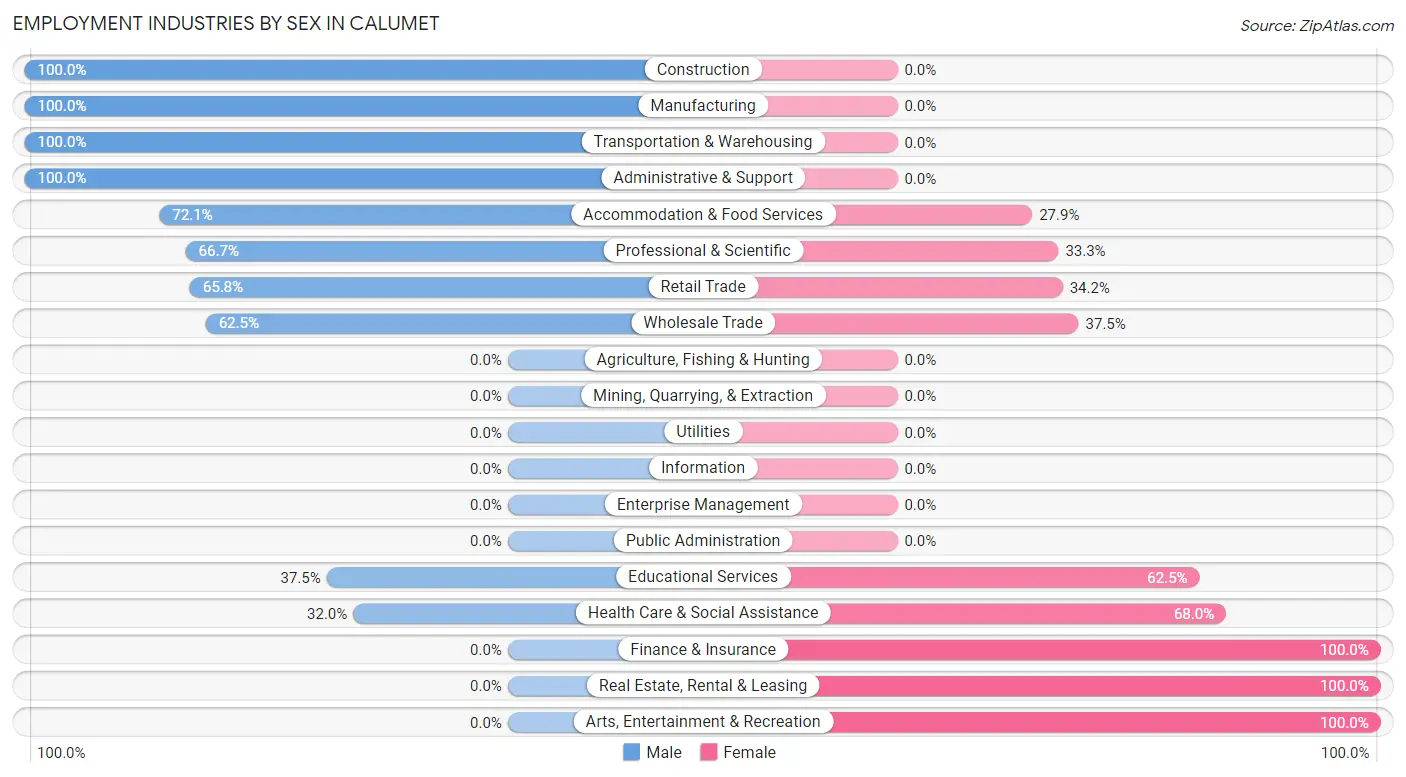
Employment Industries by Sex in Calumet
The Calumet industries that see more men than women are Construction (100.0%), Manufacturing (100.0%), and Transportation & Warehousing (100.0%), whereas the industries that tend to have a higher number of women are Finance & Insurance (100.0%), Real Estate, Rental & Leasing (100.0%), and Arts, Entertainment & Recreation (100.0%).
| Industry | Male | Female |
| Agriculture, Fishing & Hunting | 0 (0.0%) | 0 (0.0%) |
| Mining, Quarrying, & Extraction | 0 (0.0%) | 0 (0.0%) |
| Construction | 19 (100.0%) | 0 (0.0%) |
| Manufacturing | 54 (100.0%) | 0 (0.0%) |
| Wholesale Trade | 5 (62.5%) | 3 (37.5%) |
| Retail Trade | 25 (65.8%) | 13 (34.2%) |
| Transportation & Warehousing | 3 (100.0%) | 0 (0.0%) |
| Utilities | 0 (0.0%) | 0 (0.0%) |
| Information | 0 (0.0%) | 0 (0.0%) |
| Finance & Insurance | 0 (0.0%) | 5 (100.0%) |
| Real Estate, Rental & Leasing | 0 (0.0%) | 5 (100.0%) |
| Professional & Scientific | 4 (66.7%) | 2 (33.3%) |
| Enterprise Management | 0 (0.0%) | 0 (0.0%) |
| Administrative & Support | 3 (100.0%) | 0 (0.0%) |
| Educational Services | 6 (37.5%) | 10 (62.5%) |
| Health Care & Social Assistance | 8 (32.0%) | 17 (68.0%) |
| Arts, Entertainment & Recreation | 0 (0.0%) | 3 (100.0%) |
| Accommodation & Food Services | 31 (72.1%) | 12 (27.9%) |
| Public Administration | 0 (0.0%) | 0 (0.0%) |
| Total | 168 (69.7%) | 73 (30.3%) |
Education in Calumet
School Enrollment in Calumet
The most common levels of schooling among the 114 students in Calumet are college / undergraduate (26 | 22.8%), middle school (22 | 19.3%), and nursery / preschool (21 | 18.4%).
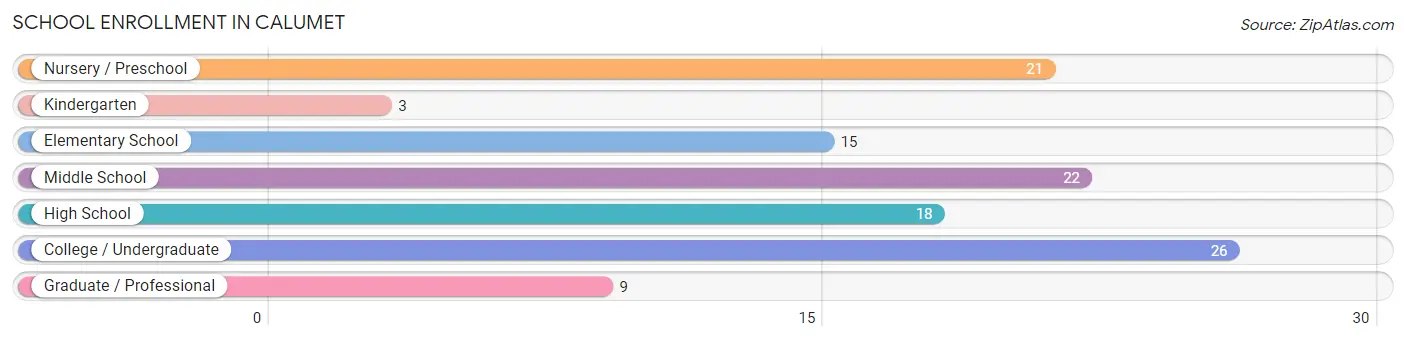
| School Level | # Students | % Students |
| Nursery / Preschool | 21 | 18.4% |
| Kindergarten | 3 | 2.6% |
| Elementary School | 15 | 13.2% |
| Middle School | 22 | 19.3% |
| High School | 18 | 15.8% |
| College / Undergraduate | 26 | 22.8% |
| Graduate / Professional | 9 | 7.9% |
| Total | 114 | 100.0% |
School Enrollment by Age by Funding Source in Calumet
Out of a total of 114 students who are enrolled in schools in Calumet, 7 (6.1%) attend a private institution, while the remaining 107 (93.9%) are enrolled in public schools. The age group of 20 to 24 year olds has the highest likelihood of being enrolled in private schools, with 7 (46.7% in the age bracket) enrolled. Conversely, the age group of 3 to 4 year olds has the lowest likelihood of being enrolled in a private school, with 21 (100.0% in the age bracket) attending a public institution.
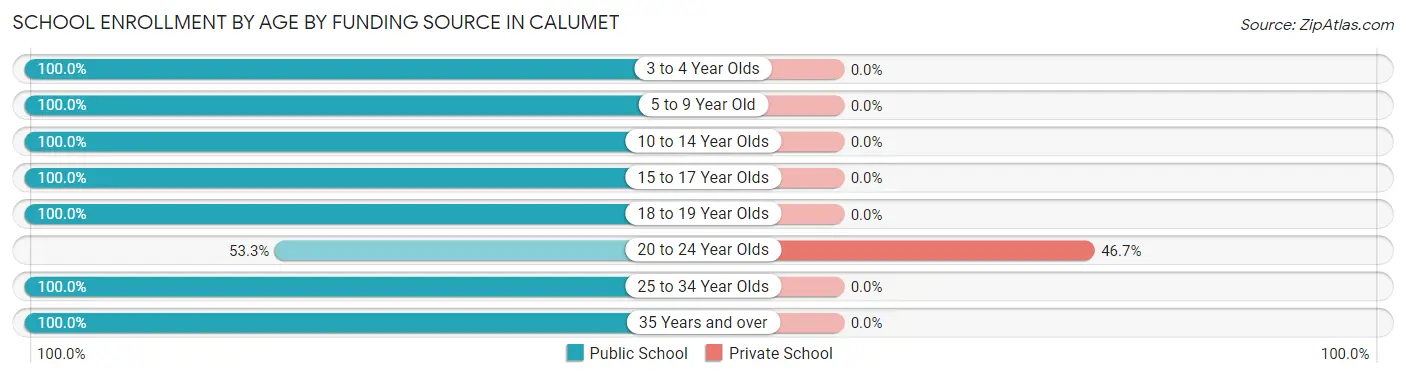
| Age Bracket | Public School | Private School |
| 3 to 4 Year Olds | 21 (100.0%) | 0 (0.0%) |
| 5 to 9 Year Old | 6 (100.0%) | 0 (0.0%) |
| 10 to 14 Year Olds | 41 (100.0%) | 0 (0.0%) |
| 15 to 17 Year Olds | 11 (100.0%) | 0 (0.0%) |
| 18 to 19 Year Olds | 5 (100.0%) | 0 (0.0%) |
| 20 to 24 Year Olds | 8 (53.3%) | 7 (46.7%) |
| 25 to 34 Year Olds | 13 (100.0%) | 0 (0.0%) |
| 35 Years and over | 2 (100.0%) | 0 (0.0%) |
| Total | 107 (93.9%) | 7 (6.1%) |
Educational Attainment by Field of Study in Calumet
Education (29 | 21.8%), engineering (25 | 18.8%), visual & performing arts (17 | 12.8%), liberal arts & history (11 | 8.3%), and literature & languages (10 | 7.5%) are the most common fields of study among 133 individuals in Calumet who have obtained a bachelor's degree or higher.
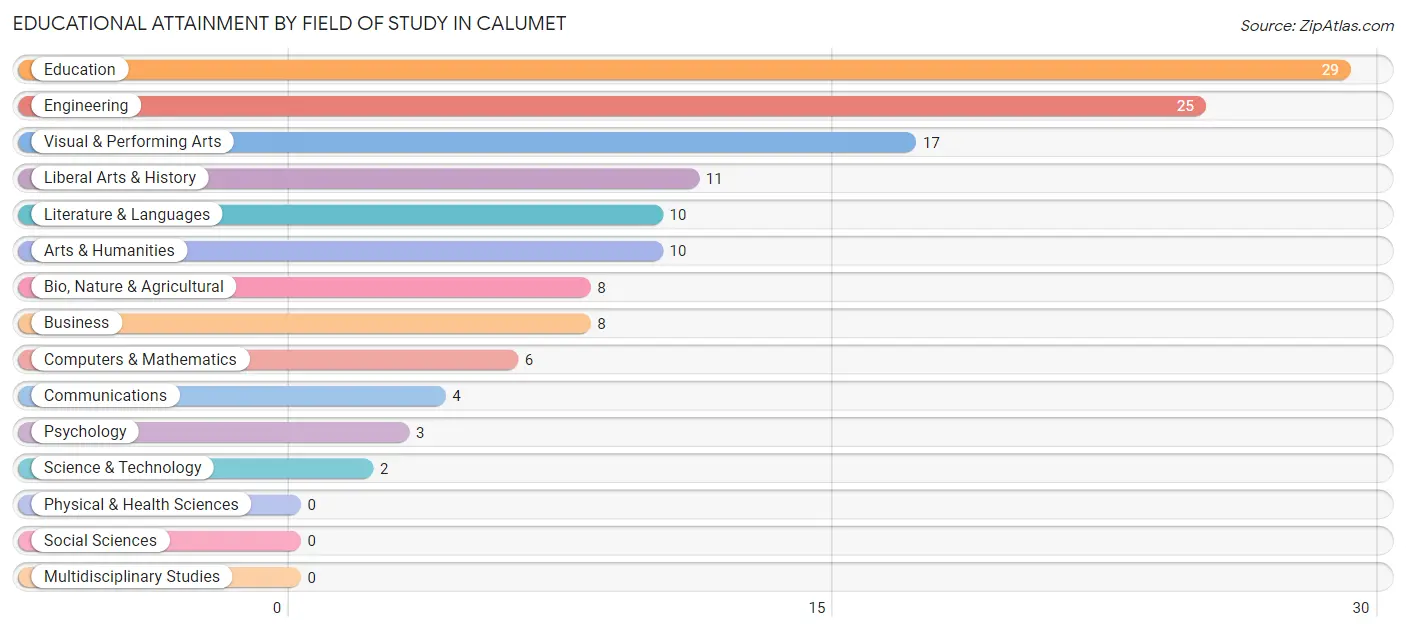
| Field of Study | # Graduates | % Graduates |
| Computers & Mathematics | 6 | 4.5% |
| Bio, Nature & Agricultural | 8 | 6.0% |
| Physical & Health Sciences | 0 | 0.0% |
| Psychology | 3 | 2.3% |
| Social Sciences | 0 | 0.0% |
| Engineering | 25 | 18.8% |
| Multidisciplinary Studies | 0 | 0.0% |
| Science & Technology | 2 | 1.5% |
| Business | 8 | 6.0% |
| Education | 29 | 21.8% |
| Literature & Languages | 10 | 7.5% |
| Liberal Arts & History | 11 | 8.3% |
| Visual & Performing Arts | 17 | 12.8% |
| Communications | 4 | 3.0% |
| Arts & Humanities | 10 | 7.5% |
| Total | 133 | 100.0% |
Transportation & Commute in Calumet
Vehicle Availability by Sex in Calumet
The most prevalent vehicle ownership categories in Calumet are males with 1 vehicle (73, accounting for 43.4%) and females with 1 vehicle (24, making up 104.3%).
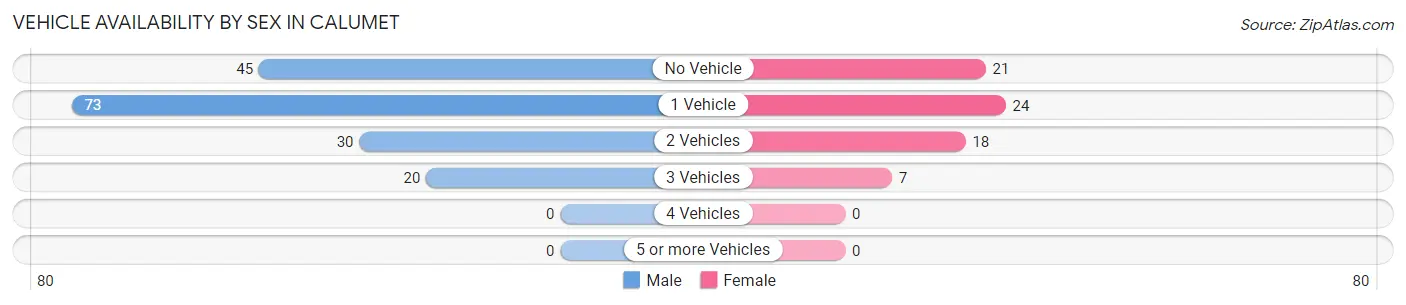
| Vehicles Available | Male | Female |
| No Vehicle | 45 (26.8%) | 21 (30.0%) |
| 1 Vehicle | 73 (43.4%) | 24 (34.3%) |
| 2 Vehicles | 30 (17.9%) | 18 (25.7%) |
| 3 Vehicles | 20 (11.9%) | 7 (10.0%) |
| 4 Vehicles | 0 (0.0%) | 0 (0.0%) |
| 5 or more Vehicles | 0 (0.0%) | 0 (0.0%) |
| Total | 168 (100.0%) | 70 (100.0%) |
Commute Time in Calumet
The most frequently occuring commute durations in Calumet are 5 to 9 minutes (74 commuters, 32.2%), 15 to 19 minutes (33 commuters, 14.3%), and less than 5 minutes (31 commuters, 13.5%).
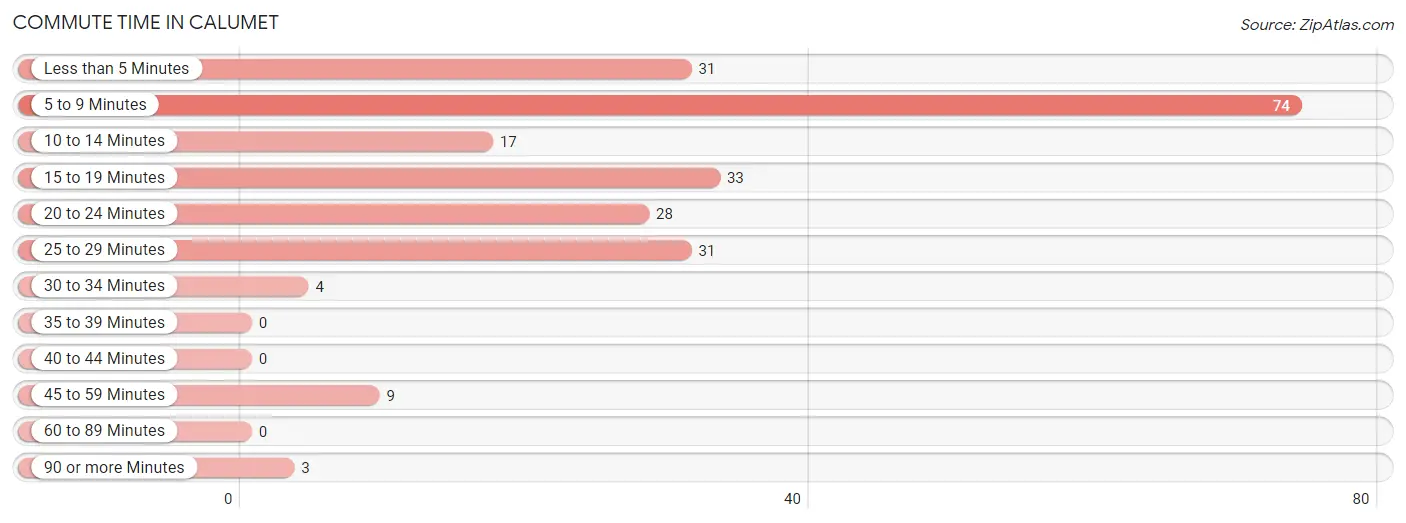
| Commute Time | # Commuters | % Commuters |
| Less than 5 Minutes | 31 | 13.5% |
| 5 to 9 Minutes | 74 | 32.2% |
| 10 to 14 Minutes | 17 | 7.4% |
| 15 to 19 Minutes | 33 | 14.3% |
| 20 to 24 Minutes | 28 | 12.2% |
| 25 to 29 Minutes | 31 | 13.5% |
| 30 to 34 Minutes | 4 | 1.7% |
| 35 to 39 Minutes | 0 | 0.0% |
| 40 to 44 Minutes | 0 | 0.0% |
| 45 to 59 Minutes | 9 | 3.9% |
| 60 to 89 Minutes | 0 | 0.0% |
| 90 or more Minutes | 3 | 1.3% |
Commute Time by Sex in Calumet
The most common commute times in Calumet are 5 to 9 minutes (56 commuters, 35.0%) for males and less than 5 minutes (22 commuters, 31.4%) for females.
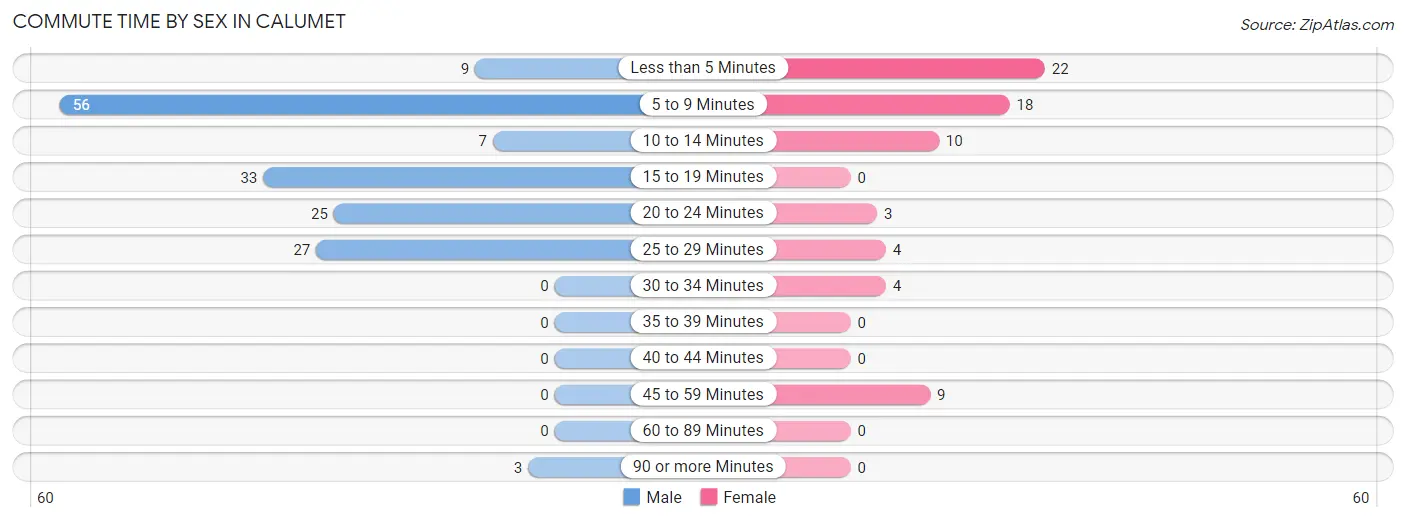
| Commute Time | Male | Female |
| Less than 5 Minutes | 9 (5.6%) | 22 (31.4%) |
| 5 to 9 Minutes | 56 (35.0%) | 18 (25.7%) |
| 10 to 14 Minutes | 7 (4.4%) | 10 (14.3%) |
| 15 to 19 Minutes | 33 (20.6%) | 0 (0.0%) |
| 20 to 24 Minutes | 25 (15.6%) | 3 (4.3%) |
| 25 to 29 Minutes | 27 (16.9%) | 4 (5.7%) |
| 30 to 34 Minutes | 0 (0.0%) | 4 (5.7%) |
| 35 to 39 Minutes | 0 (0.0%) | 0 (0.0%) |
| 40 to 44 Minutes | 0 (0.0%) | 0 (0.0%) |
| 45 to 59 Minutes | 0 (0.0%) | 9 (12.9%) |
| 60 to 89 Minutes | 0 (0.0%) | 0 (0.0%) |
| 90 or more Minutes | 3 (1.9%) | 0 (0.0%) |
Time of Departure to Work by Sex in Calumet
The most frequent times of departure to work in Calumet are 8:00 AM to 8:29 AM (54, 33.8%) for males and 9:00 AM to 9:59 AM (13, 18.6%) for females.
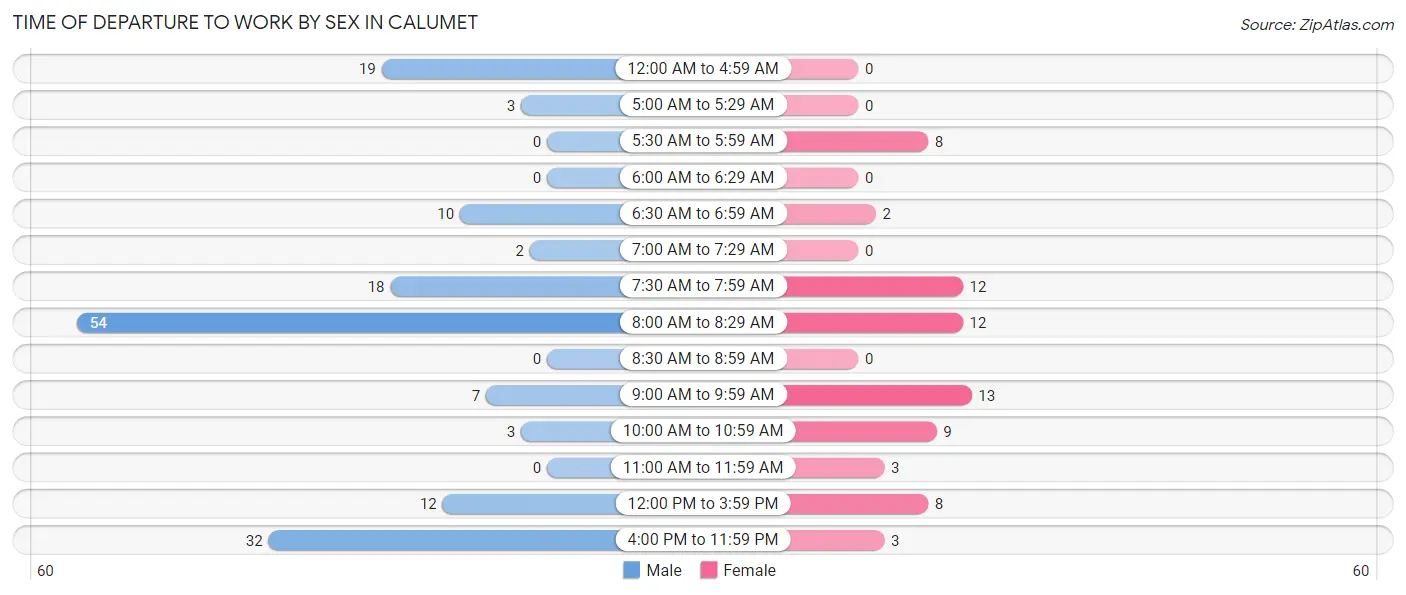
| Time of Departure | Male | Female |
| 12:00 AM to 4:59 AM | 19 (11.9%) | 0 (0.0%) |
| 5:00 AM to 5:29 AM | 3 (1.9%) | 0 (0.0%) |
| 5:30 AM to 5:59 AM | 0 (0.0%) | 8 (11.4%) |
| 6:00 AM to 6:29 AM | 0 (0.0%) | 0 (0.0%) |
| 6:30 AM to 6:59 AM | 10 (6.2%) | 2 (2.9%) |
| 7:00 AM to 7:29 AM | 2 (1.3%) | 0 (0.0%) |
| 7:30 AM to 7:59 AM | 18 (11.3%) | 12 (17.1%) |
| 8:00 AM to 8:29 AM | 54 (33.8%) | 12 (17.1%) |
| 8:30 AM to 8:59 AM | 0 (0.0%) | 0 (0.0%) |
| 9:00 AM to 9:59 AM | 7 (4.4%) | 13 (18.6%) |
| 10:00 AM to 10:59 AM | 3 (1.9%) | 9 (12.9%) |
| 11:00 AM to 11:59 AM | 0 (0.0%) | 3 (4.3%) |
| 12:00 PM to 3:59 PM | 12 (7.5%) | 8 (11.4%) |
| 4:00 PM to 11:59 PM | 32 (20.0%) | 3 (4.3%) |
| Total | 160 (100.0%) | 70 (100.0%) |
Housing Occupancy in Calumet
Occupancy by Ownership in Calumet
Of the total 419 dwellings in Calumet, owner-occupied units account for 112 (26.7%), while renter-occupied units make up 307 (73.3%).
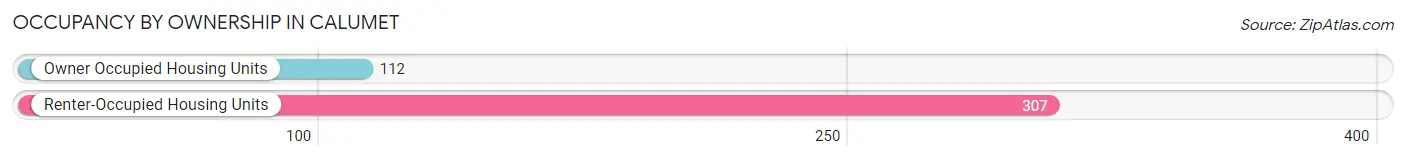
| Occupancy | # Housing Units | % Housing Units |
| Owner Occupied Housing Units | 112 | 26.7% |
| Renter-Occupied Housing Units | 307 | 73.3% |
| Total Occupied Housing Units | 419 | 100.0% |
Occupancy by Household Size in Calumet
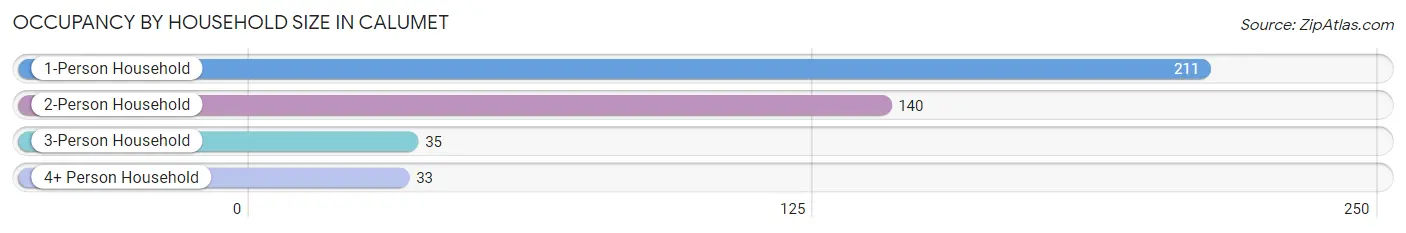
| Household Size | # Housing Units | % Housing Units |
| 1-Person Household | 211 | 50.4% |
| 2-Person Household | 140 | 33.4% |
| 3-Person Household | 35 | 8.4% |
| 4+ Person Household | 33 | 7.9% |
| Total Housing Units | 419 | 100.0% |
Occupancy by Ownership by Household Size in Calumet
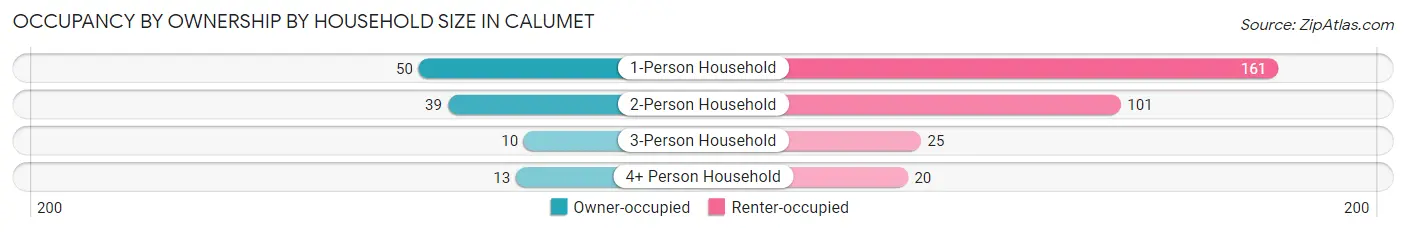
| Household Size | Owner-occupied | Renter-occupied |
| 1-Person Household | 50 (23.7%) | 161 (76.3%) |
| 2-Person Household | 39 (27.9%) | 101 (72.1%) |
| 3-Person Household | 10 (28.6%) | 25 (71.4%) |
| 4+ Person Household | 13 (39.4%) | 20 (60.6%) |
| Total Housing Units | 112 (26.7%) | 307 (73.3%) |
Occupancy by Educational Attainment in Calumet
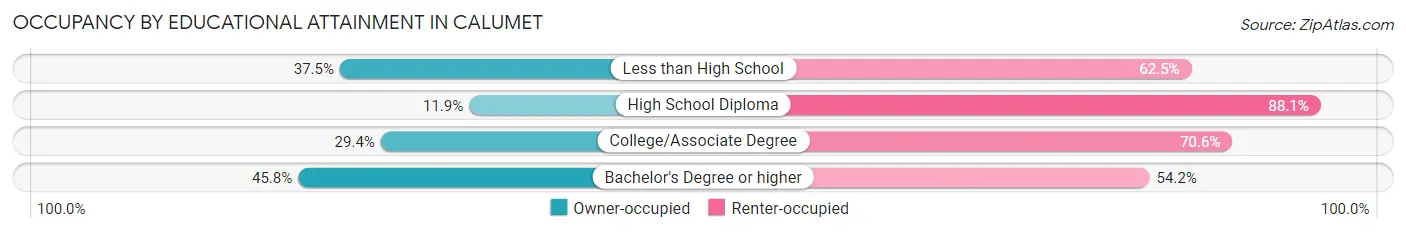
| Household Size | Owner-occupied | Renter-occupied |
| Less than High School | 15 (37.5%) | 25 (62.5%) |
| High School Diploma | 19 (11.9%) | 141 (88.1%) |
| College/Associate Degree | 40 (29.4%) | 96 (70.6%) |
| Bachelor's Degree or higher | 38 (45.8%) | 45 (54.2%) |
Occupancy by Age of Householder in Calumet
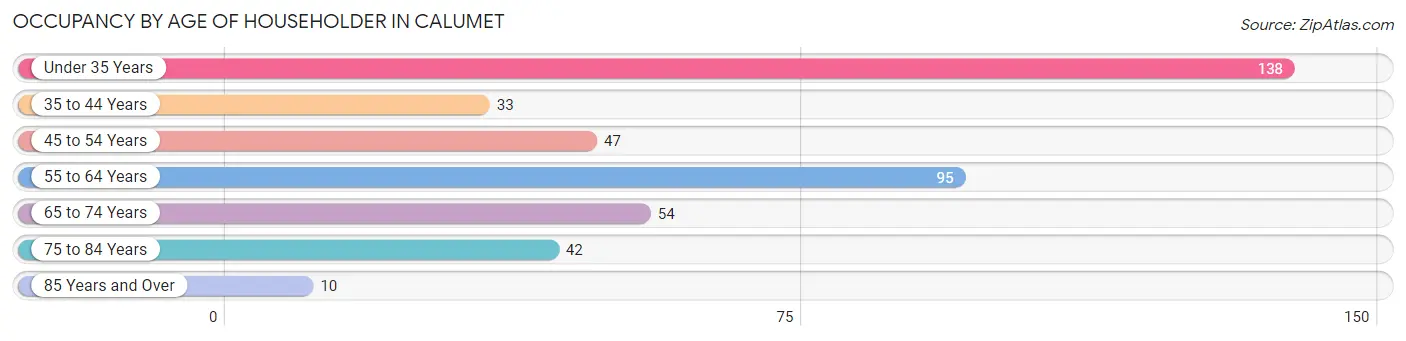
| Age Bracket | # Households | % Households |
| Under 35 Years | 138 | 32.9% |
| 35 to 44 Years | 33 | 7.9% |
| 45 to 54 Years | 47 | 11.2% |
| 55 to 64 Years | 95 | 22.7% |
| 65 to 74 Years | 54 | 12.9% |
| 75 to 84 Years | 42 | 10.0% |
| 85 Years and Over | 10 | 2.4% |
| Total | 419 | 100.0% |
Housing Finances in Calumet
Median Income by Occupancy in Calumet
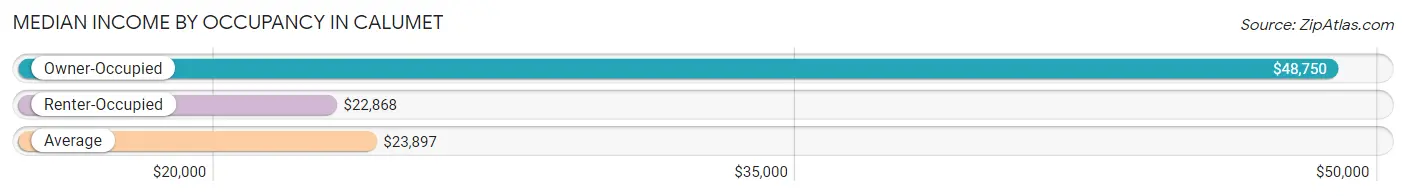
| Occupancy Type | # Households | Median Income |
| Owner-Occupied | 112 (26.7%) | $48,750 |
| Renter-Occupied | 307 (73.3%) | $22,868 |
| Average | 419 (100.0%) | $23,897 |
Occupancy by Householder Income Bracket in Calumet
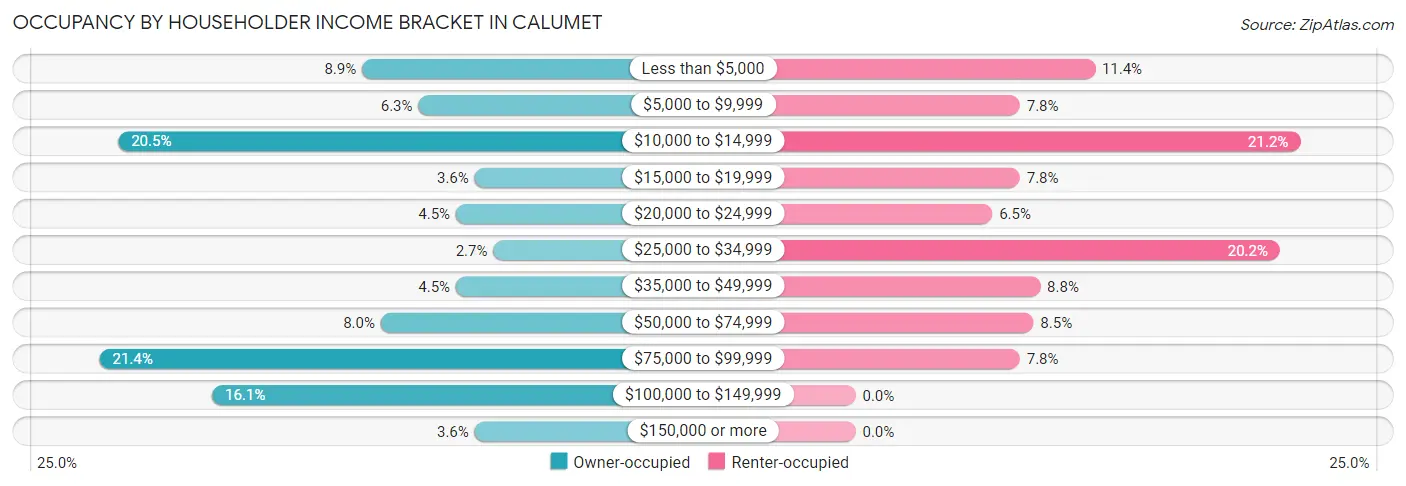
| Income Bracket | Owner-occupied | Renter-occupied |
| Less than $5,000 | 10 (8.9%) | 35 (11.4%) |
| $5,000 to $9,999 | 7 (6.2%) | 24 (7.8%) |
| $10,000 to $14,999 | 23 (20.5%) | 65 (21.2%) |
| $15,000 to $19,999 | 4 (3.6%) | 24 (7.8%) |
| $20,000 to $24,999 | 5 (4.5%) | 20 (6.5%) |
| $25,000 to $34,999 | 3 (2.7%) | 62 (20.2%) |
| $35,000 to $49,999 | 5 (4.5%) | 27 (8.8%) |
| $50,000 to $74,999 | 9 (8.0%) | 26 (8.5%) |
| $75,000 to $99,999 | 24 (21.4%) | 24 (7.8%) |
| $100,000 to $149,999 | 18 (16.1%) | 0 (0.0%) |
| $150,000 or more | 4 (3.6%) | 0 (0.0%) |
| Total | 112 (100.0%) | 307 (100.0%) |
Monthly Housing Cost Tiers in Calumet
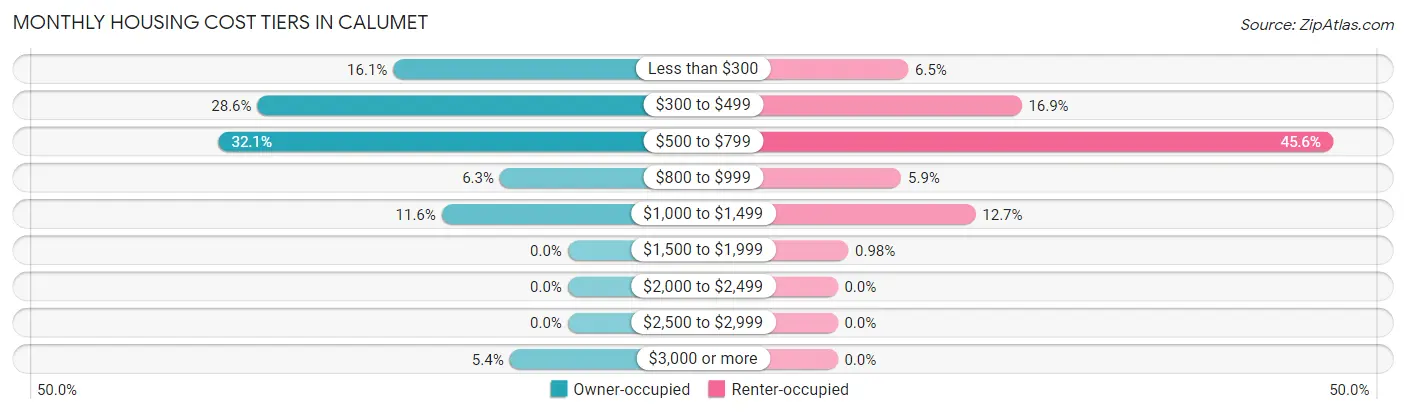
| Monthly Cost | Owner-occupied | Renter-occupied |
| Less than $300 | 18 (16.1%) | 20 (6.5%) |
| $300 to $499 | 32 (28.6%) | 52 (16.9%) |
| $500 to $799 | 36 (32.1%) | 140 (45.6%) |
| $800 to $999 | 7 (6.2%) | 18 (5.9%) |
| $1,000 to $1,499 | 13 (11.6%) | 39 (12.7%) |
| $1,500 to $1,999 | 0 (0.0%) | 3 (1.0%) |
| $2,000 to $2,499 | 0 (0.0%) | 0 (0.0%) |
| $2,500 to $2,999 | 0 (0.0%) | 0 (0.0%) |
| $3,000 or more | 6 (5.4%) | 0 (0.0%) |
| Total | 112 (100.0%) | 307 (100.0%) |
Physical Housing Characteristics in Calumet
Housing Structures in Calumet
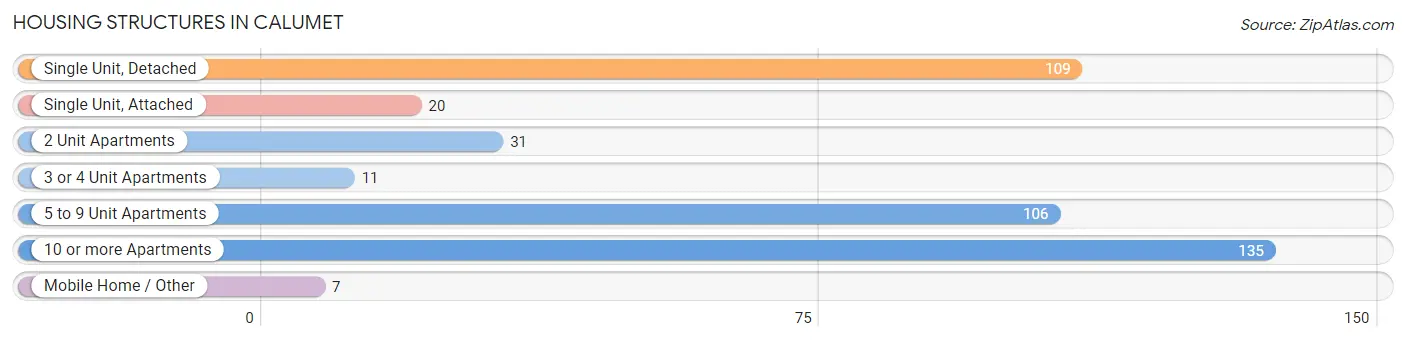
| Structure Type | # Housing Units | % Housing Units |
| Single Unit, Detached | 109 | 26.0% |
| Single Unit, Attached | 20 | 4.8% |
| 2 Unit Apartments | 31 | 7.4% |
| 3 or 4 Unit Apartments | 11 | 2.6% |
| 5 to 9 Unit Apartments | 106 | 25.3% |
| 10 or more Apartments | 135 | 32.2% |
| Mobile Home / Other | 7 | 1.7% |
| Total | 419 | 100.0% |
Housing Structures by Occupancy in Calumet
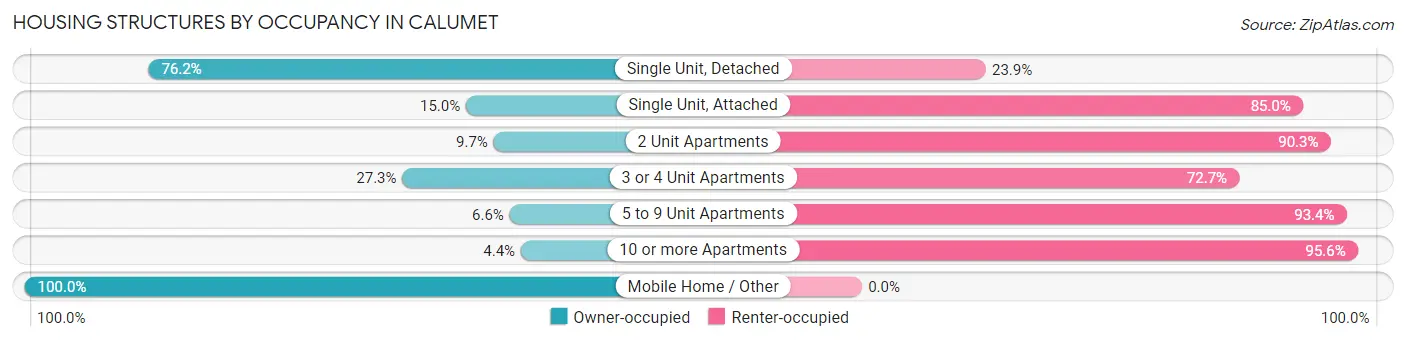
| Structure Type | Owner-occupied | Renter-occupied |
| Single Unit, Detached | 83 (76.1%) | 26 (23.8%) |
| Single Unit, Attached | 3 (15.0%) | 17 (85.0%) |
| 2 Unit Apartments | 3 (9.7%) | 28 (90.3%) |
| 3 or 4 Unit Apartments | 3 (27.3%) | 8 (72.7%) |
| 5 to 9 Unit Apartments | 7 (6.6%) | 99 (93.4%) |
| 10 or more Apartments | 6 (4.4%) | 129 (95.6%) |
| Mobile Home / Other | 7 (100.0%) | 0 (0.0%) |
| Total | 112 (26.7%) | 307 (73.3%) |
Housing Structures by Number of Rooms in Calumet
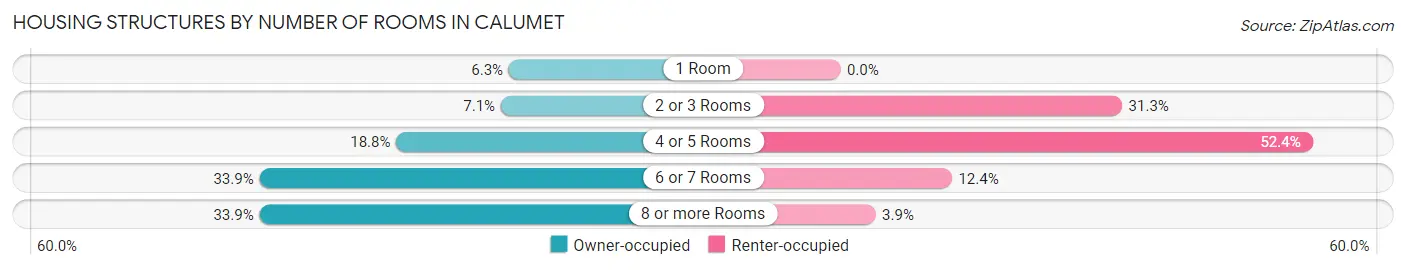
| Number of Rooms | Owner-occupied | Renter-occupied |
| 1 Room | 7 (6.2%) | 0 (0.0%) |
| 2 or 3 Rooms | 8 (7.1%) | 96 (31.3%) |
| 4 or 5 Rooms | 21 (18.8%) | 161 (52.4%) |
| 6 or 7 Rooms | 38 (33.9%) | 38 (12.4%) |
| 8 or more Rooms | 38 (33.9%) | 12 (3.9%) |
| Total | 112 (100.0%) | 307 (100.0%) |
Housing Structure by Heating Type in Calumet
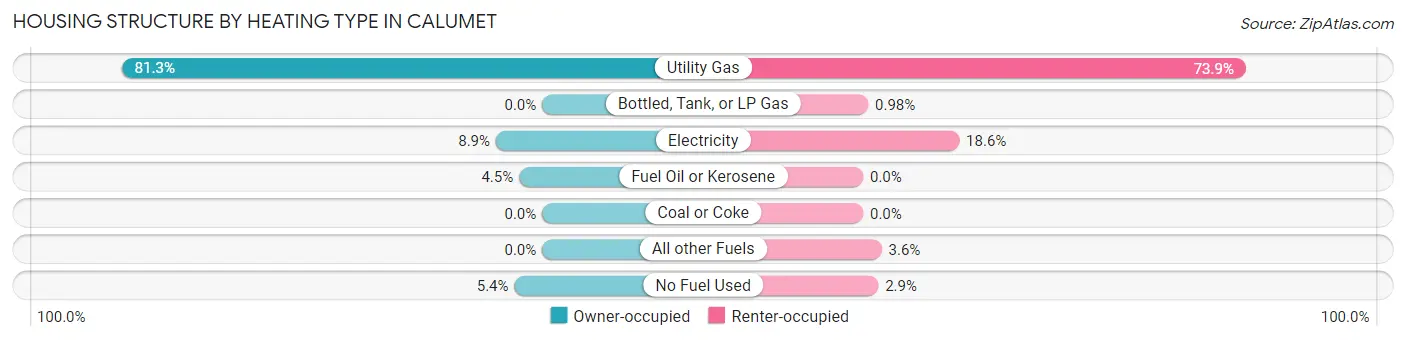
| Heating Type | Owner-occupied | Renter-occupied |
| Utility Gas | 91 (81.2%) | 227 (73.9%) |
| Bottled, Tank, or LP Gas | 0 (0.0%) | 3 (1.0%) |
| Electricity | 10 (8.9%) | 57 (18.6%) |
| Fuel Oil or Kerosene | 5 (4.5%) | 0 (0.0%) |
| Coal or Coke | 0 (0.0%) | 0 (0.0%) |
| All other Fuels | 0 (0.0%) | 11 (3.6%) |
| No Fuel Used | 6 (5.4%) | 9 (2.9%) |
| Total | 112 (100.0%) | 307 (100.0%) |
Household Vehicle Usage in Calumet
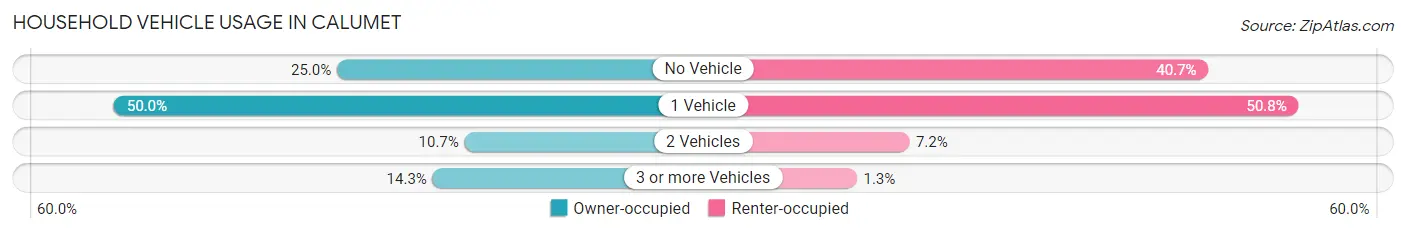
| Vehicles per Household | Owner-occupied | Renter-occupied |
| No Vehicle | 28 (25.0%) | 125 (40.7%) |
| 1 Vehicle | 56 (50.0%) | 156 (50.8%) |
| 2 Vehicles | 12 (10.7%) | 22 (7.2%) |
| 3 or more Vehicles | 16 (14.3%) | 4 (1.3%) |
| Total | 112 (100.0%) | 307 (100.0%) |
Real Estate & Mortgages in Calumet
Real Estate and Mortgage Overview in Calumet
| Characteristic | Without Mortgage | With Mortgage |
| Housing Units | 75 | 37 |
| Median Property Value | $62,100 | $95,600 |
| Median Household Income | - | - |
| Monthly Housing Costs | $447 | $6 |
| Real Estate Taxes | $1,141 | $2 |
Property Value by Mortgage Status in Calumet
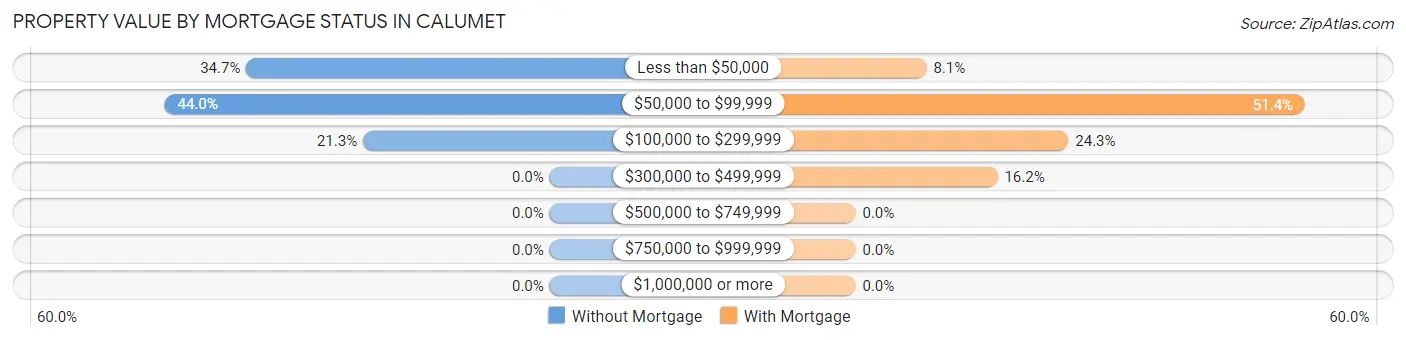
| Property Value | Without Mortgage | With Mortgage |
| Less than $50,000 | 26 (34.7%) | 3 (8.1%) |
| $50,000 to $99,999 | 33 (44.0%) | 19 (51.3%) |
| $100,000 to $299,999 | 16 (21.3%) | 9 (24.3%) |
| $300,000 to $499,999 | 0 (0.0%) | 6 (16.2%) |
| $500,000 to $749,999 | 0 (0.0%) | 0 (0.0%) |
| $750,000 to $999,999 | 0 (0.0%) | 0 (0.0%) |
| $1,000,000 or more | 0 (0.0%) | 0 (0.0%) |
| Total | 75 (100.0%) | 37 (100.0%) |
Household Income by Mortgage Status in Calumet
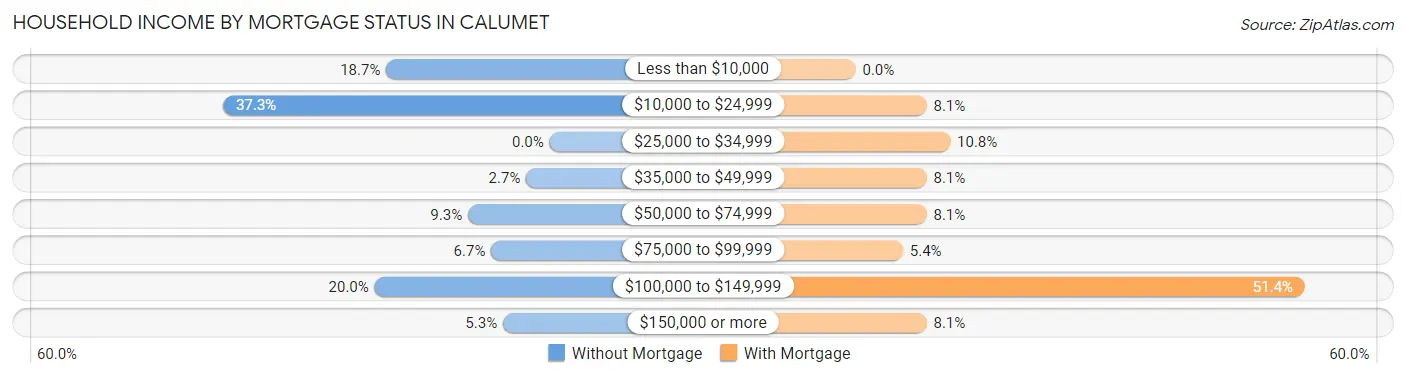
| Household Income | Without Mortgage | With Mortgage |
| Less than $10,000 | 14 (18.7%) | 0 (0.0%) |
| $10,000 to $24,999 | 28 (37.3%) | 3 (8.1%) |
| $25,000 to $34,999 | 0 (0.0%) | 4 (10.8%) |
| $35,000 to $49,999 | 2 (2.7%) | 3 (8.1%) |
| $50,000 to $74,999 | 7 (9.3%) | 3 (8.1%) |
| $75,000 to $99,999 | 5 (6.7%) | 2 (5.4%) |
| $100,000 to $149,999 | 15 (20.0%) | 19 (51.3%) |
| $150,000 or more | 4 (5.3%) | 3 (8.1%) |
| Total | 75 (100.0%) | 37 (100.0%) |
Property Value to Household Income Ratio in Calumet
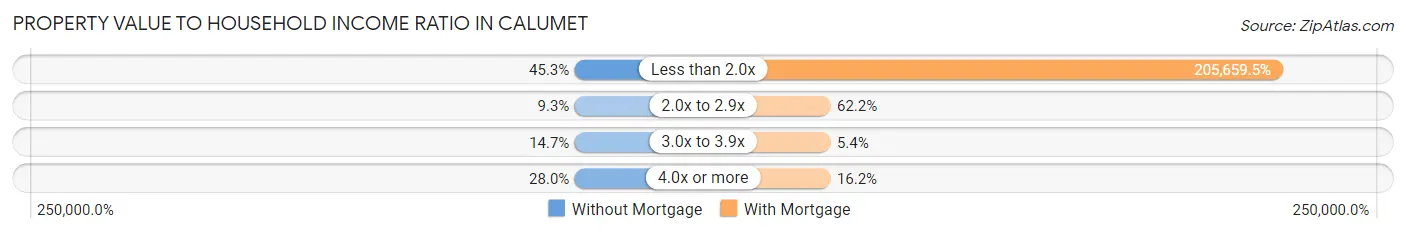
| Value-to-Income Ratio | Without Mortgage | With Mortgage |
| Less than 2.0x | 34 (45.3%) | 76,094 (205,659.5%) |
| 2.0x to 2.9x | 7 (9.3%) | 23 (62.2%) |
| 3.0x to 3.9x | 11 (14.7%) | 2 (5.4%) |
| 4.0x or more | 21 (28.0%) | 6 (16.2%) |
| Total | 75 (100.0%) | 37 (100.0%) |
Real Estate Taxes by Mortgage Status in Calumet
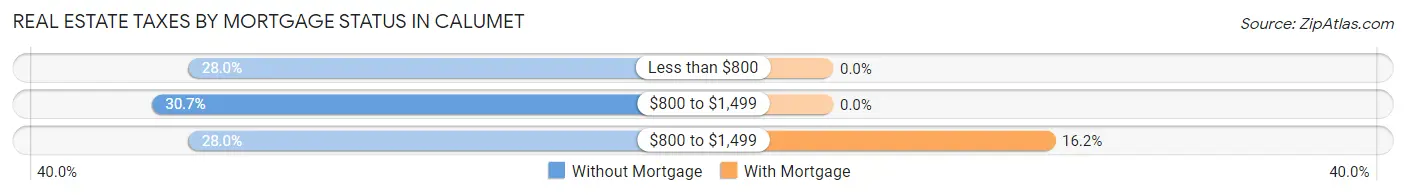
| Property Taxes | Without Mortgage | With Mortgage |
| Less than $800 | 21 (28.0%) | 0 (0.0%) |
| $800 to $1,499 | 23 (30.7%) | 0 (0.0%) |
| $800 to $1,499 | 21 (28.0%) | 6 (16.2%) |
| Total | 75 (100.0%) | 37 (100.0%) |
Health & Disability in Calumet
Health Insurance Coverage by Age in Calumet
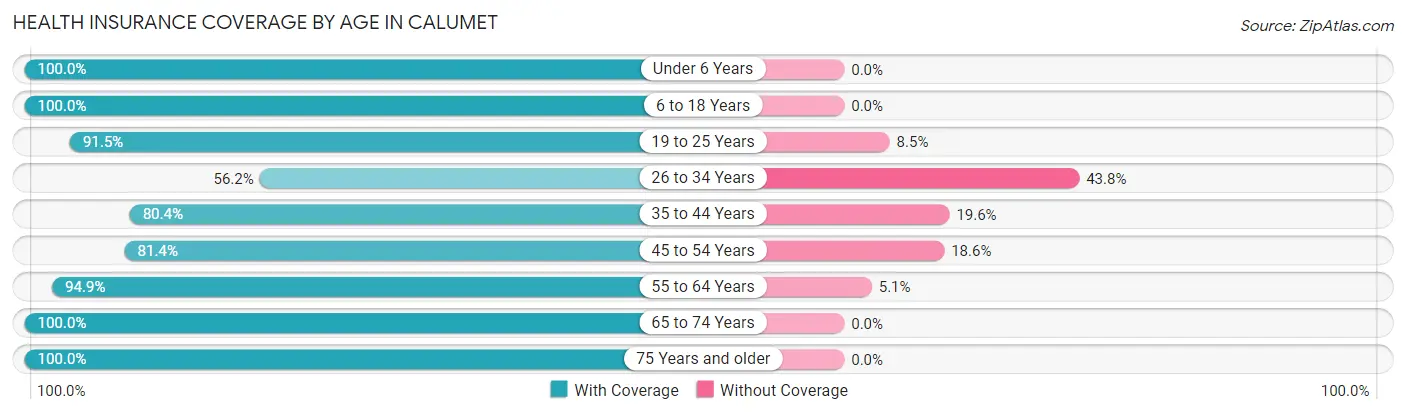
| Age Bracket | With Coverage | Without Coverage |
| Under 6 Years | 57 (100.0%) | 0 (0.0%) |
| 6 to 18 Years | 61 (100.0%) | 0 (0.0%) |
| 19 to 25 Years | 119 (91.5%) | 11 (8.5%) |
| 26 to 34 Years | 59 (56.2%) | 46 (43.8%) |
| 35 to 44 Years | 41 (80.4%) | 10 (19.6%) |
| 45 to 54 Years | 48 (81.4%) | 11 (18.6%) |
| 55 to 64 Years | 111 (94.9%) | 6 (5.1%) |
| 65 to 74 Years | 80 (100.0%) | 0 (0.0%) |
| 75 Years and older | 59 (100.0%) | 0 (0.0%) |
| Total | 635 (88.3%) | 84 (11.7%) |
Health Insurance Coverage by Citizenship Status in Calumet
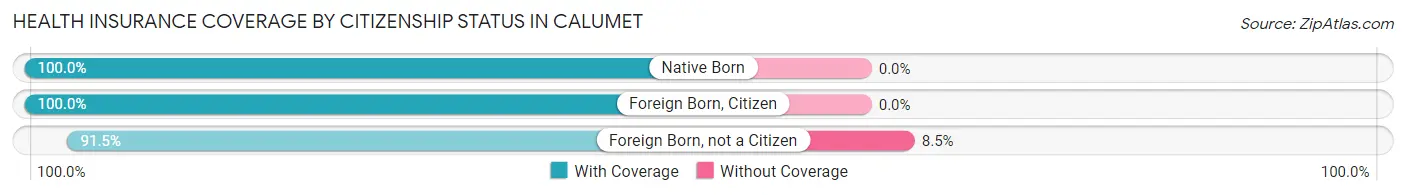
| Citizenship Status | With Coverage | Without Coverage |
| Native Born | 57 (100.0%) | 0 (0.0%) |
| Foreign Born, Citizen | 61 (100.0%) | 0 (0.0%) |
| Foreign Born, not a Citizen | 119 (91.5%) | 11 (8.5%) |
Health Insurance Coverage by Household Income in Calumet
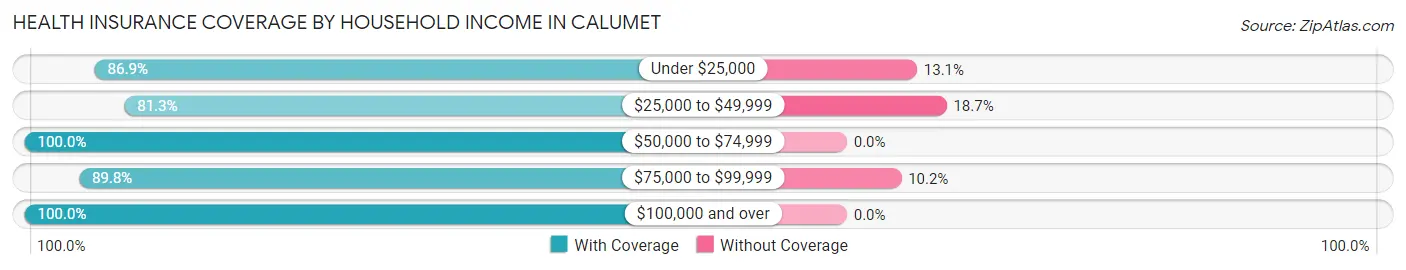
| Household Income | With Coverage | Without Coverage |
| Under $25,000 | 258 (86.9%) | 39 (13.1%) |
| $25,000 to $49,999 | 148 (81.3%) | 34 (18.7%) |
| $50,000 to $74,999 | 70 (100.0%) | 0 (0.0%) |
| $75,000 to $99,999 | 97 (89.8%) | 11 (10.2%) |
| $100,000 and over | 62 (100.0%) | 0 (0.0%) |
Public vs Private Health Insurance Coverage by Age in Calumet
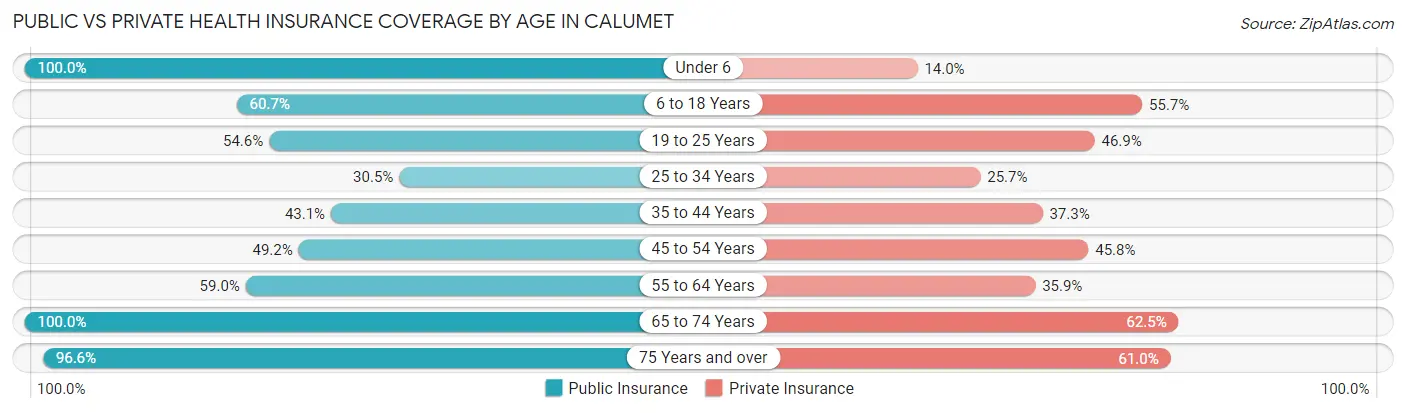
| Age Bracket | Public Insurance | Private Insurance |
| Under 6 | 57 (100.0%) | 8 (14.0%) |
| 6 to 18 Years | 37 (60.7%) | 34 (55.7%) |
| 19 to 25 Years | 71 (54.6%) | 61 (46.9%) |
| 25 to 34 Years | 32 (30.5%) | 27 (25.7%) |
| 35 to 44 Years | 22 (43.1%) | 19 (37.2%) |
| 45 to 54 Years | 29 (49.1%) | 27 (45.8%) |
| 55 to 64 Years | 69 (59.0%) | 42 (35.9%) |
| 65 to 74 Years | 80 (100.0%) | 50 (62.5%) |
| 75 Years and over | 57 (96.6%) | 36 (61.0%) |
| Total | 454 (63.1%) | 304 (42.3%) |
Disability Status by Sex by Age in Calumet
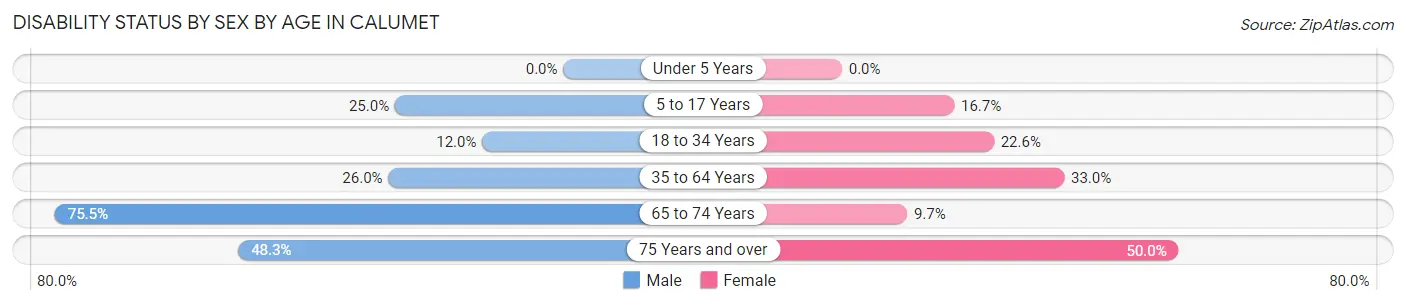
| Age Bracket | Male | Female |
| Under 5 Years | 0 (0.0%) | 0 (0.0%) |
| 5 to 17 Years | 10 (25.0%) | 3 (16.7%) |
| 18 to 34 Years | 13 (12.0%) | 30 (22.6%) |
| 35 to 64 Years | 33 (26.0%) | 33 (33.0%) |
| 65 to 74 Years | 37 (75.5%) | 3 (9.7%) |
| 75 Years and over | 14 (48.3%) | 15 (50.0%) |
Disability Class by Sex by Age in Calumet
Disability Class: Hearing Difficulty
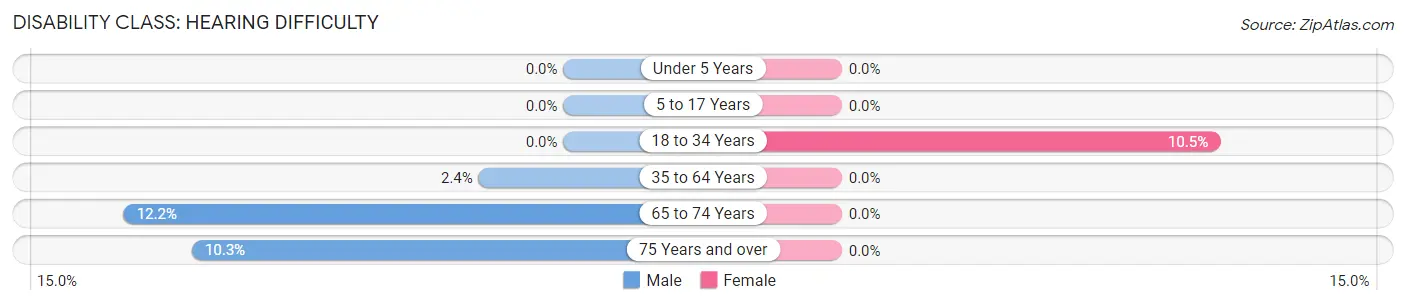
| Age Bracket | Male | Female |
| Under 5 Years | 0 (0.0%) | 0 (0.0%) |
| 5 to 17 Years | 0 (0.0%) | 0 (0.0%) |
| 18 to 34 Years | 0 (0.0%) | 14 (10.5%) |
| 35 to 64 Years | 3 (2.4%) | 0 (0.0%) |
| 65 to 74 Years | 6 (12.2%) | 0 (0.0%) |
| 75 Years and over | 3 (10.3%) | 0 (0.0%) |
Disability Class: Vision Difficulty
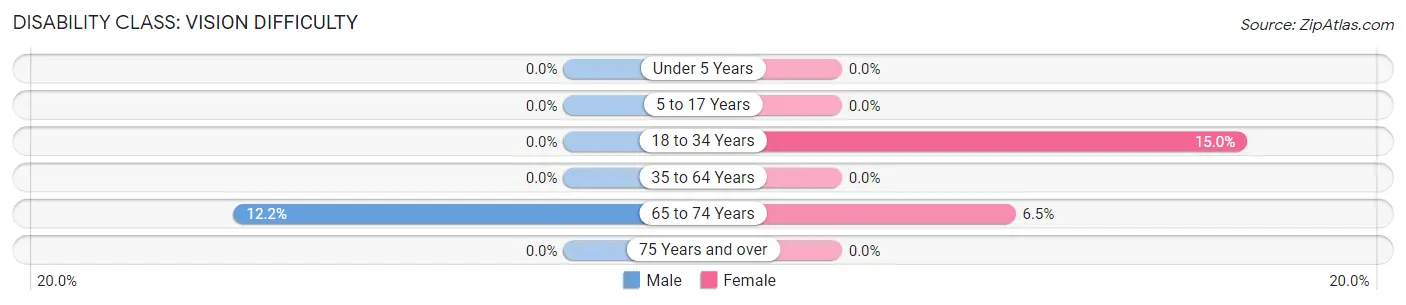
| Age Bracket | Male | Female |
| Under 5 Years | 0 (0.0%) | 0 (0.0%) |
| 5 to 17 Years | 0 (0.0%) | 0 (0.0%) |
| 18 to 34 Years | 0 (0.0%) | 20 (15.0%) |
| 35 to 64 Years | 0 (0.0%) | 0 (0.0%) |
| 65 to 74 Years | 6 (12.2%) | 2 (6.5%) |
| 75 Years and over | 0 (0.0%) | 0 (0.0%) |
Disability Class: Cognitive Difficulty
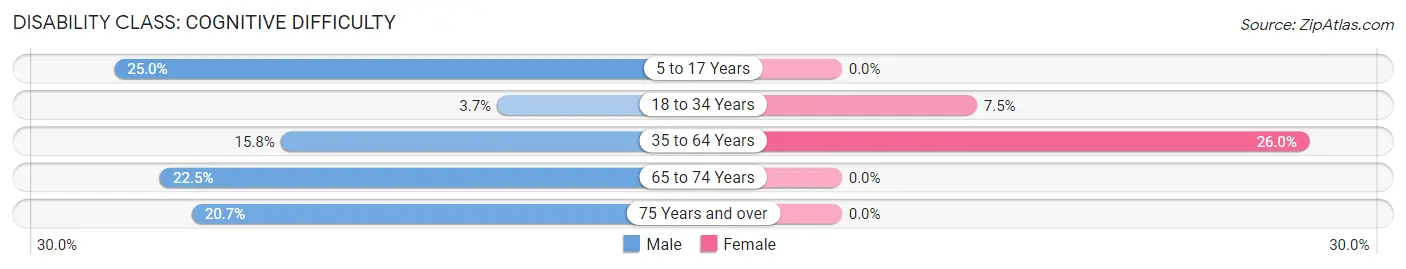
| Age Bracket | Male | Female |
| 5 to 17 Years | 10 (25.0%) | 0 (0.0%) |
| 18 to 34 Years | 4 (3.7%) | 10 (7.5%) |
| 35 to 64 Years | 20 (15.8%) | 26 (26.0%) |
| 65 to 74 Years | 11 (22.5%) | 0 (0.0%) |
| 75 Years and over | 6 (20.7%) | 0 (0.0%) |
Disability Class: Ambulatory Difficulty
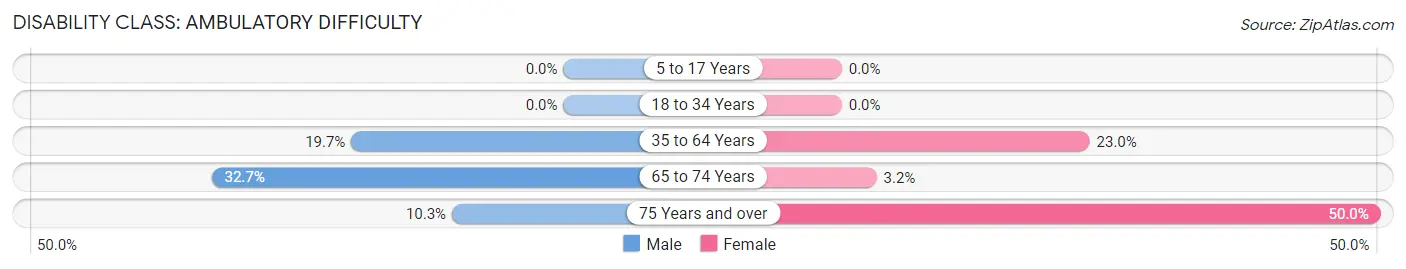
| Age Bracket | Male | Female |
| 5 to 17 Years | 0 (0.0%) | 0 (0.0%) |
| 18 to 34 Years | 0 (0.0%) | 0 (0.0%) |
| 35 to 64 Years | 25 (19.7%) | 23 (23.0%) |
| 65 to 74 Years | 16 (32.7%) | 1 (3.2%) |
| 75 Years and over | 3 (10.3%) | 15 (50.0%) |
Disability Class: Self-Care Difficulty
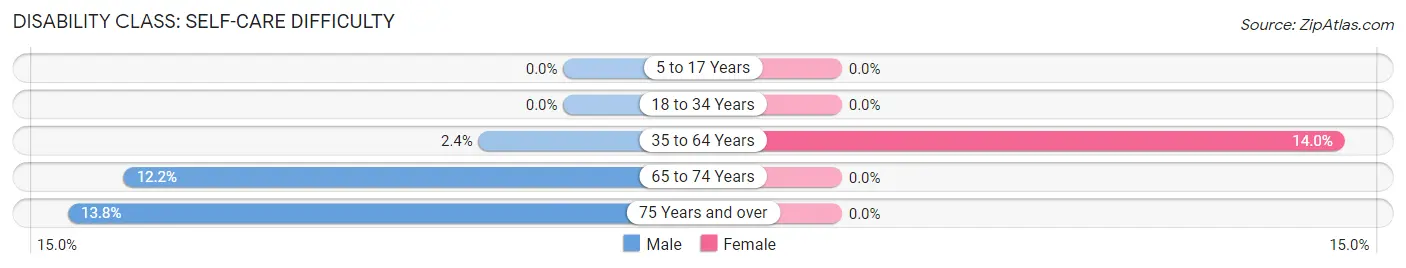
| Age Bracket | Male | Female |
| 5 to 17 Years | 0 (0.0%) | 0 (0.0%) |
| 18 to 34 Years | 0 (0.0%) | 0 (0.0%) |
| 35 to 64 Years | 3 (2.4%) | 14 (14.0%) |
| 65 to 74 Years | 6 (12.2%) | 0 (0.0%) |
| 75 Years and over | 4 (13.8%) | 0 (0.0%) |
Technology Access in Calumet
Computing Device Access in Calumet
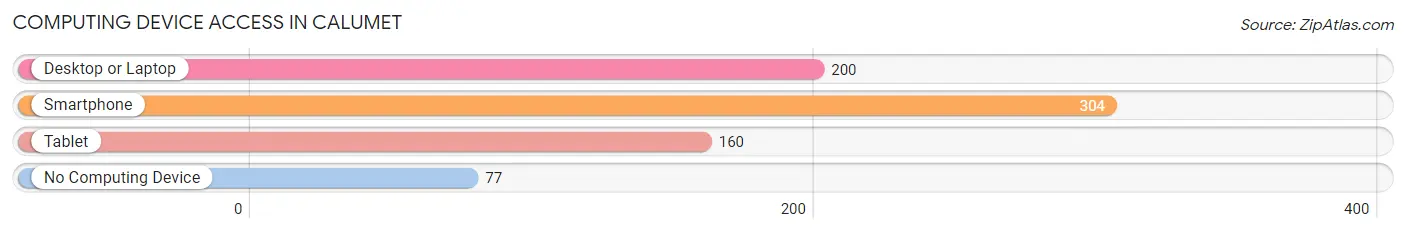
| Device Type | # Households | % Households |
| Desktop or Laptop | 200 | 47.7% |
| Smartphone | 304 | 72.6% |
| Tablet | 160 | 38.2% |
| No Computing Device | 77 | 18.4% |
| Total | 419 | 100.0% |
Internet Access in Calumet
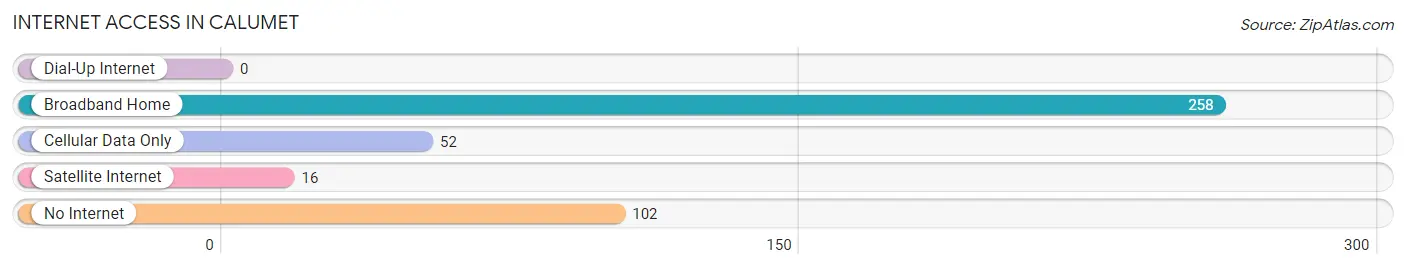
| Internet Type | # Households | % Households |
| Dial-Up Internet | 0 | 0.0% |
| Broadband Home | 258 | 61.6% |
| Cellular Data Only | 52 | 12.4% |
| Satellite Internet | 16 | 3.8% |
| No Internet | 102 | 24.3% |
| Total | 419 | 100.0% |
Calumet Summary
Calumet, Michigan is a small town located in the Upper Peninsula of Michigan. It is situated in Houghton County, and is part of the Keweenaw Peninsula. The town is located on the shore of Lake Superior, and is home to a population of just over 1,000 people.
History
Calumet was first settled in 1864 by miners who were looking for copper. The town was originally called Red Jacket, after the Ojibwe chief who had signed the Treaty of La Pointe in 1842. The town was renamed Calumet in 1867, after the ceremonial peace pipe used by Native Americans.
The town quickly grew as the copper mining industry flourished. By the late 19th century, Calumet was the largest city in the Upper Peninsula, with a population of over 10,000 people. The town was home to a variety of businesses, including banks, hotels, and stores.
The copper mining industry began to decline in the early 20th century, and the population of Calumet began to decline as well. By the 1950s, the population had dropped to just over 1,000 people.
Geography
Calumet is located in the Upper Peninsula of Michigan, in Houghton County. It is situated on the shore of Lake Superior, and is part of the Keweenaw Peninsula. The town is surrounded by forests and lakes, and is home to a variety of wildlife.
The climate in Calumet is typical of the Upper Peninsula, with cold winters and warm summers. The average temperature in January is around 10°F, and the average temperature in July is around 70°F.
Economy
Calumet’s economy is largely based on tourism. The town is home to a variety of attractions, including the Calumet Theatre, the Calumet Colosseum, and the Calumet Art Center. The town also hosts a variety of festivals throughout the year, including the Copper Country Music Festival and the Calumet Arts and Crafts Festival.
The town is also home to a variety of small businesses, including restaurants, shops, and galleries. The town is also home to a number of manufacturing companies, including a paper mill and a copper smelter.
Demographics
As of the 2010 census, the population of Calumet was 1,074. The racial makeup of the town was 97.2% White, 0.7% Native American, 0.3% Asian, 0.2% African American, and 1.6% from other races. The median household income was $37,917, and the median family income was $45,938.
The town is home to a variety of religious denominations, including Catholic, Lutheran, and Methodist. The town is also home to a variety of cultural organizations, including the Calumet Arts and Crafts Association and the Calumet Historical Society.
Conclusion
Calumet, Michigan is a small town located in the Upper Peninsula of Michigan. It is situated on the shore of Lake Superior, and is home to a population of just over 1,000 people. The town’s economy is largely based on tourism, and it is home to a variety of attractions, businesses, and cultural organizations. The town is also home to a variety of religious denominations, and the racial makeup of the town is predominantly White.
Common Questions
What is Per Capita Income in Calumet?
Per Capita income in Calumet is $20,114.
What is the Median Family Income in Calumet?
Median Family Income in Calumet is $40,833.
What is the Median Household income in Calumet?
Median Household Income in Calumet is $23,897.
What is Income or Wage Gap in Calumet?
Income or Wage Gap in Calumet is 62.2%.
Women in Calumet earn 37.8 cents for every dollar earned by a man.
What is Family Income Deficit in Calumet?
Family Income Deficit in Calumet is $11,662.
Families that are below poverty line in Calumet earn $11,662 less on average than the poverty threshold level.
What is Inequality or Gini Index in Calumet?
Inequality or Gini Index in Calumet is 0.49.
What is the Total Population of Calumet?
Total Population of Calumet is 719.
What is the Total Male Population of Calumet?
Total Male Population of Calumet is 389.
What is the Total Female Population of Calumet?
Total Female Population of Calumet is 330.
What is the Ratio of Males per 100 Females in Calumet?
There are 117.88 Males per 100 Females in Calumet.
What is the Ratio of Females per 100 Males in Calumet?
There are 84.83 Females per 100 Males in Calumet.
What is the Median Population Age in Calumet?
Median Population Age in Calumet is 36.0 Years.
What is the Average Family Size in Calumet
Average Family Size in Calumet is 2.5 People.
What is the Average Household Size in Calumet
Average Household Size in Calumet is 1.7 People.
How Large is the Labor Force in Calumet?
There are 299 People in the Labor Forcein in Calumet.
What is the Percentage of People in the Labor Force in Calumet?
48.9% of People are in the Labor Force in Calumet.
What is the Unemployment Rate in Calumet?
Unemployment Rate in Calumet is 19.4%.