Lakeview, MI Map & Demographics
Lakeview Map
Lakeview Overview
$21,510
PER CAPITA INCOME
$41,477
AVG FAMILY INCOME
$29,956
AVG HOUSEHOLD INCOME
13.1%
WAGE / INCOME GAP [ % ]
86.9¢/ $1
WAGE / INCOME GAP [ $ ]
0.48
INEQUALITY / GINI INDEX
1,027
TOTAL POPULATION
537
MALE POPULATION
490
FEMALE POPULATION
109.59
MALES / 100 FEMALES
91.25
FEMALES / 100 MALES
31.8
MEDIAN AGE
2.9
AVG FAMILY SIZE
2.5
AVG HOUSEHOLD SIZE
390
LABOR FORCE [ PEOPLE ]
47.4%
PERCENT IN LABOR FORCE
14.4%
UNEMPLOYMENT RATE
Lakeview Zip Codes
Lakeview Area Codes
Income in Lakeview
Income Overview in Lakeview
Per Capita Income in Lakeview is $21,510, while median incomes of families and households are $41,477 and $29,956 respectively.
| Characteristic | Number | Measure |
| Per Capita Income | 1,027 | $21,510 |
| Median Family Income | 253 | $41,477 |
| Mean Family Income | 253 | $61,148 |
| Median Household Income | 394 | $29,956 |
| Mean Household Income | 394 | $52,130 |
| Income Deficit | 253 | $0 |
| Wage / Income Gap (%) | 1,027 | 13.10% |
| Wage / Income Gap ($) | 1,027 | 86.90¢ per $1 |
| Gini / Inequality Index | 1,027 | 0.48 |
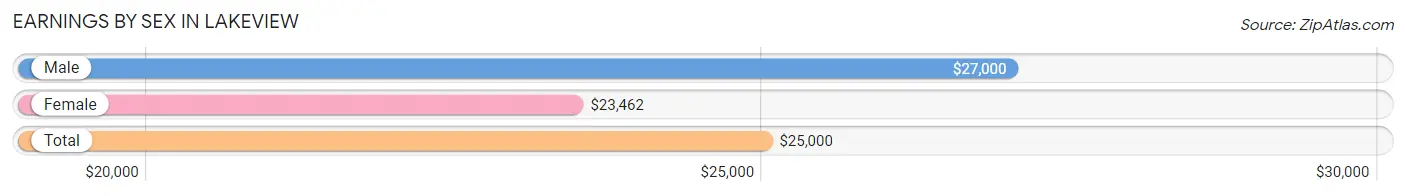
Earnings by Sex in Lakeview
Average Earnings in Lakeview are $25,000, $27,000 for men and $23,462 for women, a difference of 13.1%.
| Sex | Number | Average Earnings |
| Male | 268 (64.4%) | $27,000 |
| Female | 148 (35.6%) | $23,462 |
| Total | 416 (100.0%) | $25,000 |
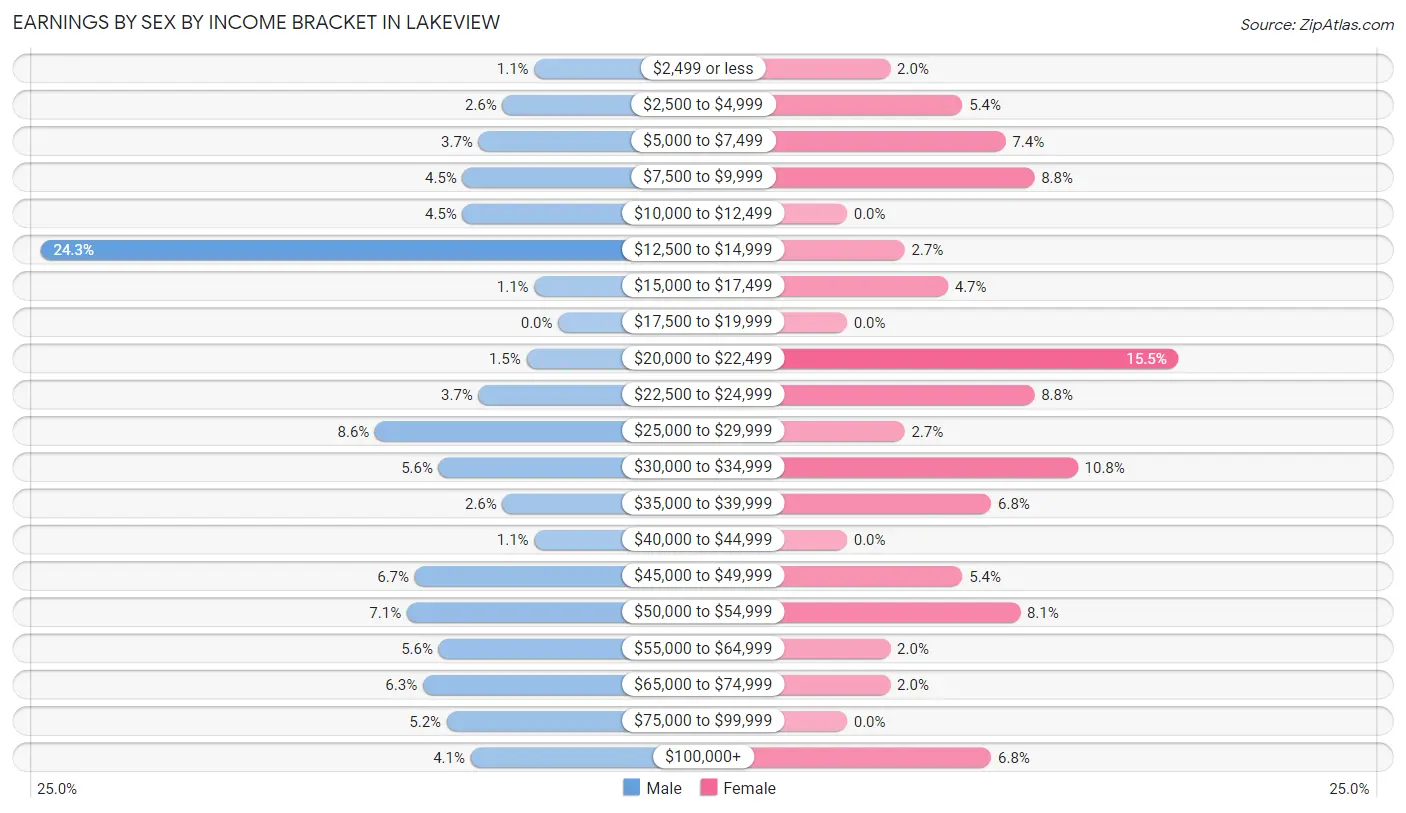
Earnings by Sex by Income Bracket in Lakeview
The most common earnings brackets in Lakeview are $12,500 to $14,999 for men (65 | 24.2%) and $20,000 to $22,499 for women (23 | 15.5%).
| Income | Male | Female |
| $2,499 or less | 3 (1.1%) | 3 (2.0%) |
| $2,500 to $4,999 | 7 (2.6%) | 8 (5.4%) |
| $5,000 to $7,499 | 10 (3.7%) | 11 (7.4%) |
| $7,500 to $9,999 | 12 (4.5%) | 13 (8.8%) |
| $10,000 to $12,499 | 12 (4.5%) | 0 (0.0%) |
| $12,500 to $14,999 | 65 (24.2%) | 4 (2.7%) |
| $15,000 to $17,499 | 3 (1.1%) | 7 (4.7%) |
| $17,500 to $19,999 | 0 (0.0%) | 0 (0.0%) |
| $20,000 to $22,499 | 4 (1.5%) | 23 (15.5%) |
| $22,500 to $24,999 | 10 (3.7%) | 13 (8.8%) |
| $25,000 to $29,999 | 23 (8.6%) | 4 (2.7%) |
| $30,000 to $34,999 | 15 (5.6%) | 16 (10.8%) |
| $35,000 to $39,999 | 7 (2.6%) | 10 (6.8%) |
| $40,000 to $44,999 | 3 (1.1%) | 0 (0.0%) |
| $45,000 to $49,999 | 18 (6.7%) | 8 (5.4%) |
| $50,000 to $54,999 | 19 (7.1%) | 12 (8.1%) |
| $55,000 to $64,999 | 15 (5.6%) | 3 (2.0%) |
| $65,000 to $74,999 | 17 (6.3%) | 3 (2.0%) |
| $75,000 to $99,999 | 14 (5.2%) | 0 (0.0%) |
| $100,000+ | 11 (4.1%) | 10 (6.8%) |
| Total | 268 (100.0%) | 148 (100.0%) |
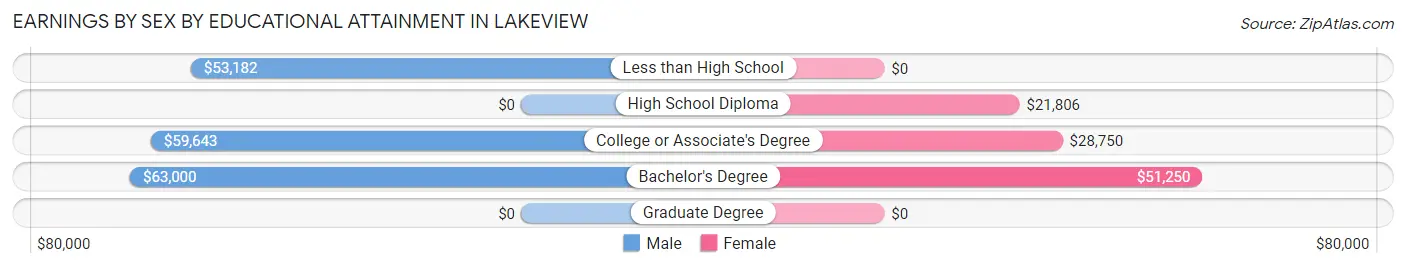
Earnings by Sex by Educational Attainment in Lakeview
Average earnings in Lakeview are $33,250 for men and $32,788 for women, a difference of 1.4%. Men with an educational attainment of bachelor's degree enjoy the highest average annual earnings of $63,000, while those with less than high school education earn the least with $53,182. Women with an educational attainment of bachelor's degree earn the most with the average annual earnings of $51,250, while those with high school diploma education have the smallest earnings of $21,806.
| Educational Attainment | Male Income | Female Income |
| Less than High School | $53,182 | $0 |
| High School Diploma | - | - |
| College or Associate's Degree | $59,643 | $28,750 |
| Bachelor's Degree | $63,000 | $51,250 |
| Graduate Degree | - | - |
| Total | $33,250 | $32,788 |
Family Income in Lakeview
Family Income Brackets in Lakeview
According to the Lakeview family income data, there are 64 families falling into the $25,000 to $34,999 income range, which is the most common income bracket and makes up 25.3% of all families. Conversely, the $150,000 to $199,999 income bracket is the least frequent group with only 6 families (2.4%) belonging to this category.

| Income Bracket | # Families | % Families |
| Less than $10,000 | 20 | 7.9% |
| $10,000 to $14,999 | 12 | 4.7% |
| $15,000 to $24,999 | 15 | 5.9% |
| $25,000 to $34,999 | 64 | 25.3% |
| $35,000 to $49,999 | 30 | 11.9% |
| $50,000 to $74,999 | 37 | 14.6% |
| $75,000 to $99,999 | 30 | 11.9% |
| $100,000 to $149,999 | 27 | 10.7% |
| $150,000 to $199,999 | 6 | 2.4% |
| $200,000+ | 12 | 4.7% |
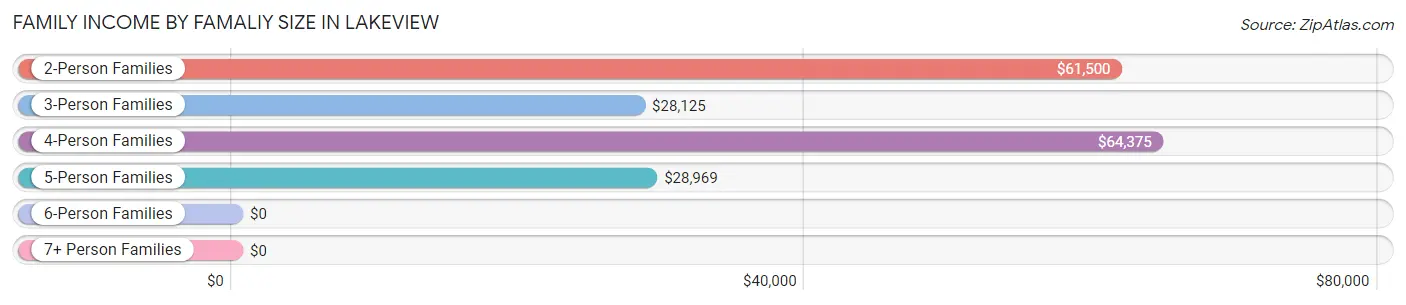
Family Income by Famaliy Size in Lakeview
4-person families (42 | 16.6%) account for the highest median family income in Lakeview with $64,375 per family, while 2-person families (98 | 38.7%) have the highest median income of $30,750 per family member.
| Income Bracket | # Families | Median Income |
| 2-Person Families | 98 (38.7%) | $61,500 |
| 3-Person Families | 63 (24.9%) | $28,125 |
| 4-Person Families | 42 (16.6%) | $64,375 |
| 5-Person Families | 47 (18.6%) | $28,969 |
| 6-Person Families | 0 (0.0%) | $0 |
| 7+ Person Families | 3 (1.2%) | $0 |
| Total | 253 (100.0%) | $41,477 |
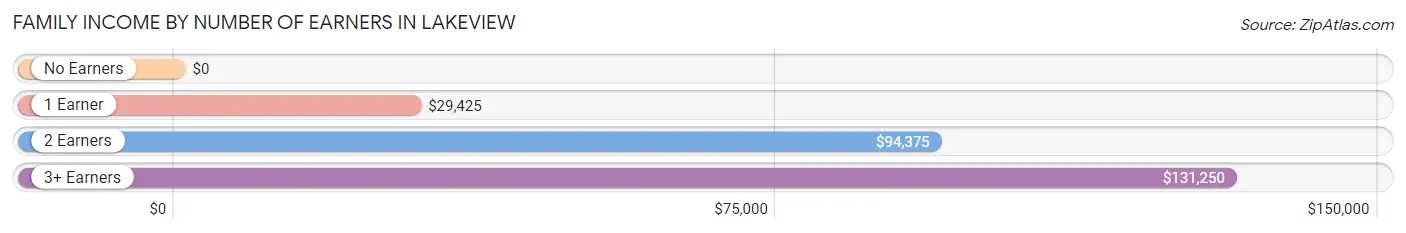
Family Income by Number of Earners in Lakeview
| Number of Earners | # Families | Median Income |
| No Earners | 62 (24.5%) | $0 |
| 1 Earner | 119 (47.0%) | $29,425 |
| 2 Earners | 55 (21.7%) | $94,375 |
| 3+ Earners | 17 (6.7%) | $131,250 |
| Total | 253 (100.0%) | $41,477 |
Household Income in Lakeview
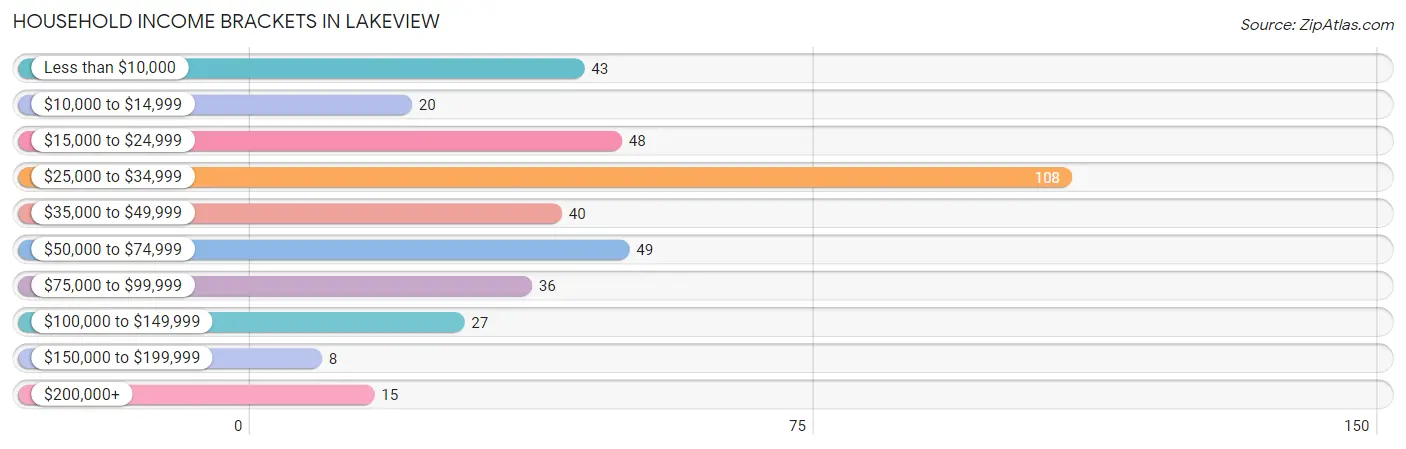
Household Income Brackets in Lakeview
With 108 households falling in the category, the $25,000 to $34,999 income range is the most frequent in Lakeview, accounting for 27.4% of all households. In contrast, only 8 households (2.0%) fall into the $150,000 to $199,999 income bracket, making it the least populous group.
| Income Bracket | # Households | % Households |
| Less than $10,000 | 43 | 10.9% |
| $10,000 to $14,999 | 20 | 5.1% |
| $15,000 to $24,999 | 48 | 12.2% |
| $25,000 to $34,999 | 108 | 27.4% |
| $35,000 to $49,999 | 40 | 10.2% |
| $50,000 to $74,999 | 49 | 12.4% |
| $75,000 to $99,999 | 36 | 9.1% |
| $100,000 to $149,999 | 27 | 6.9% |
| $150,000 to $199,999 | 8 | 2.0% |
| $200,000+ | 15 | 3.8% |
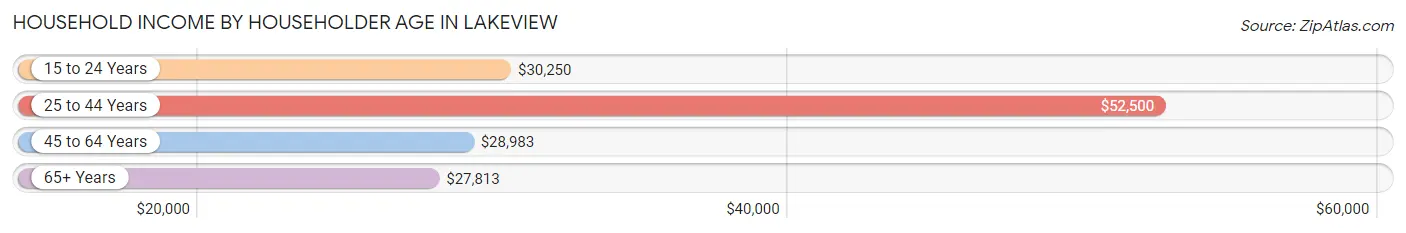
Household Income by Householder Age in Lakeview
The median household income in Lakeview is $29,956, with the highest median household income of $52,500 found in the 25 to 44 years age bracket for the primary householder. A total of 110 households (27.9%) fall into this category. Meanwhile, the 65+ years age bracket for the primary householder has the lowest median household income of $27,813, with 111 households (28.2%) in this group.
| Income Bracket | # Households | Median Income |
| 15 to 24 Years | 30 (7.6%) | $30,250 |
| 25 to 44 Years | 110 (27.9%) | $52,500 |
| 45 to 64 Years | 143 (36.3%) | $28,983 |
| 65+ Years | 111 (28.2%) | $27,813 |
| Total | 394 (100.0%) | $29,956 |
Poverty in Lakeview
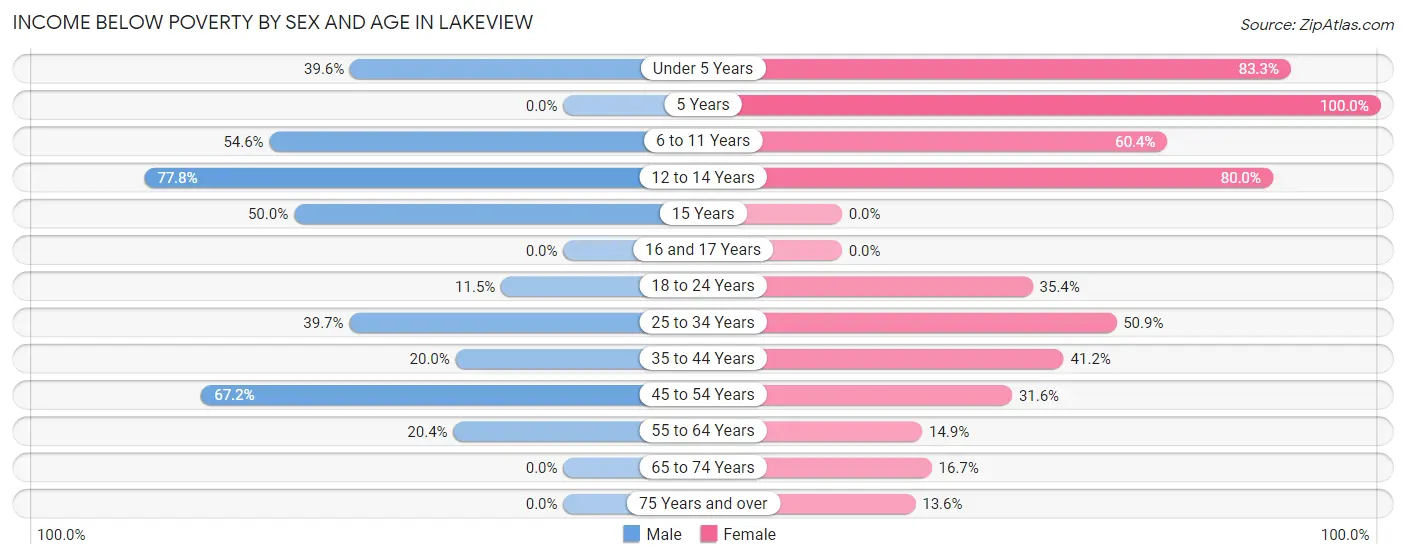
Income Below Poverty by Sex and Age in Lakeview
With 32.3% poverty level for males and 35.2% for females among the residents of Lakeview, 12 to 14 year old males and 5 year old females are the most vulnerable to poverty, with 7 males (77.8%) and 10 females (100.0%) in their respective age groups living below the poverty level.
| Age Bracket | Male | Female |
| Under 5 Years | 19 (39.6%) | 10 (83.3%) |
| 5 Years | 0 (0.0%) | 10 (100.0%) |
| 6 to 11 Years | 18 (54.5%) | 29 (60.4%) |
| 12 to 14 Years | 7 (77.8%) | 12 (80.0%) |
| 15 Years | 3 (50.0%) | 0 (0.0%) |
| 16 and 17 Years | 0 (0.0%) | 0 (0.0%) |
| 18 to 24 Years | 9 (11.5%) | 17 (35.4%) |
| 25 to 34 Years | 56 (39.7%) | 27 (50.9%) |
| 35 to 44 Years | 6 (20.0%) | 14 (41.2%) |
| 45 to 54 Years | 43 (67.2%) | 18 (31.6%) |
| 55 to 64 Years | 10 (20.4%) | 7 (14.9%) |
| 65 to 74 Years | 0 (0.0%) | 12 (16.7%) |
| 75 Years and over | 0 (0.0%) | 6 (13.6%) |
| Total | 171 (32.3%) | 162 (35.2%) |
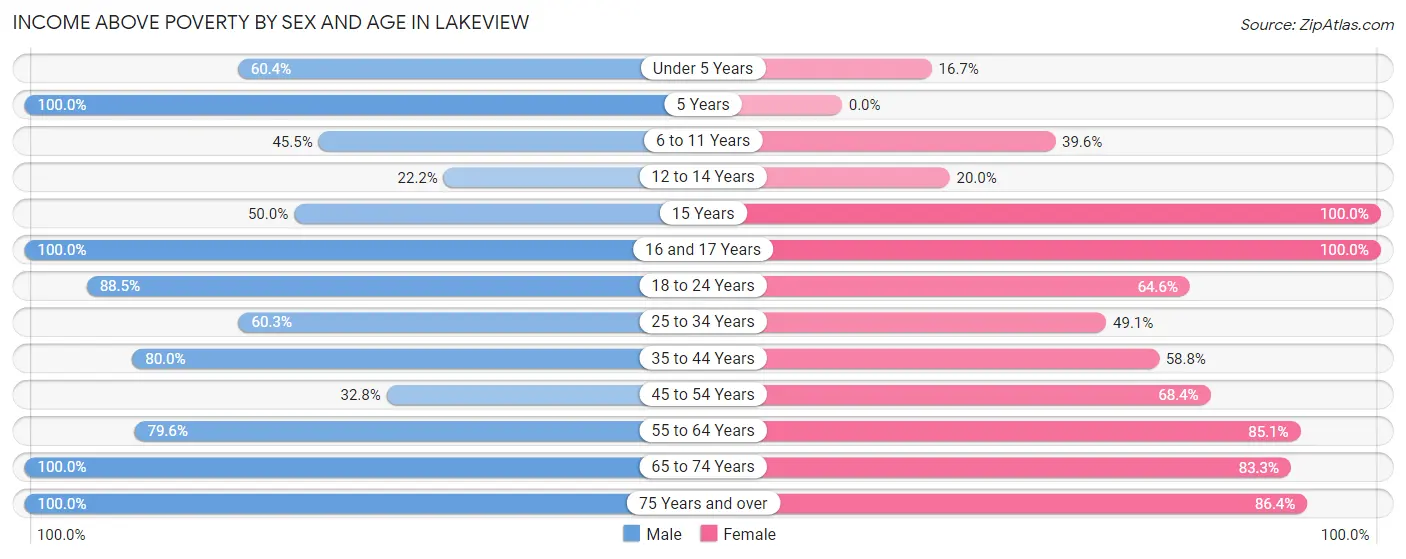
Income Above Poverty by Sex and Age in Lakeview
According to the poverty statistics in Lakeview, males aged 5 years and females aged 15 years are the age groups that are most secure financially, with 100.0% of males and 100.0% of females in these age groups living above the poverty line.
| Age Bracket | Male | Female |
| Under 5 Years | 29 (60.4%) | 2 (16.7%) |
| 5 Years | 13 (100.0%) | 0 (0.0%) |
| 6 to 11 Years | 15 (45.5%) | 19 (39.6%) |
| 12 to 14 Years | 2 (22.2%) | 3 (20.0%) |
| 15 Years | 3 (50.0%) | 3 (100.0%) |
| 16 and 17 Years | 3 (100.0%) | 17 (100.0%) |
| 18 to 24 Years | 69 (88.5%) | 31 (64.6%) |
| 25 to 34 Years | 85 (60.3%) | 26 (49.1%) |
| 35 to 44 Years | 24 (80.0%) | 20 (58.8%) |
| 45 to 54 Years | 21 (32.8%) | 39 (68.4%) |
| 55 to 64 Years | 39 (79.6%) | 40 (85.1%) |
| 65 to 74 Years | 37 (100.0%) | 60 (83.3%) |
| 75 Years and over | 19 (100.0%) | 38 (86.4%) |
| Total | 359 (67.7%) | 298 (64.8%) |
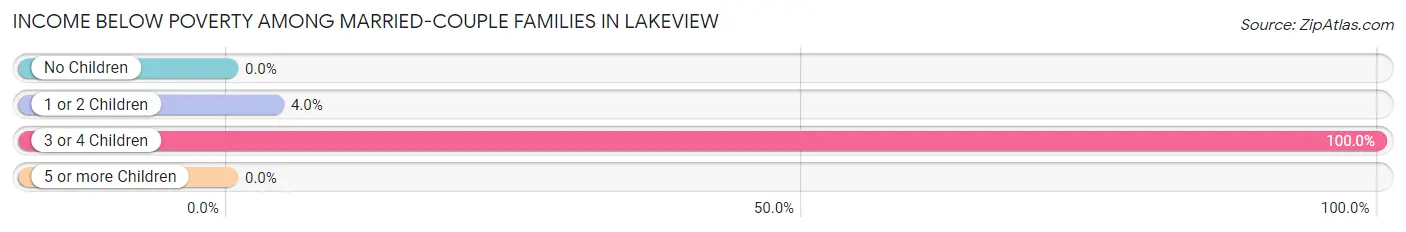
Income Below Poverty Among Married-Couple Families in Lakeview
The poverty statistics for married-couple families in Lakeview show that 22.1% or 42 of the total 190 families live below the poverty line. Families with 3 or 4 children have the highest poverty rate of 100.0%, comprising of 40 families. On the other hand, families with no children have the lowest poverty rate of 0.0%, which includes 0 families.
| Children | Above Poverty | Below Poverty |
| No Children | 97 (100.0%) | 0 (0.0%) |
| 1 or 2 Children | 48 (96.0%) | 2 (4.0%) |
| 3 or 4 Children | 0 (0.0%) | 40 (100.0%) |
| 5 or more Children | 3 (100.0%) | 0 (0.0%) |
| Total | 148 (77.9%) | 42 (22.1%) |
Income Below Poverty Among Single-Parent Households in Lakeview
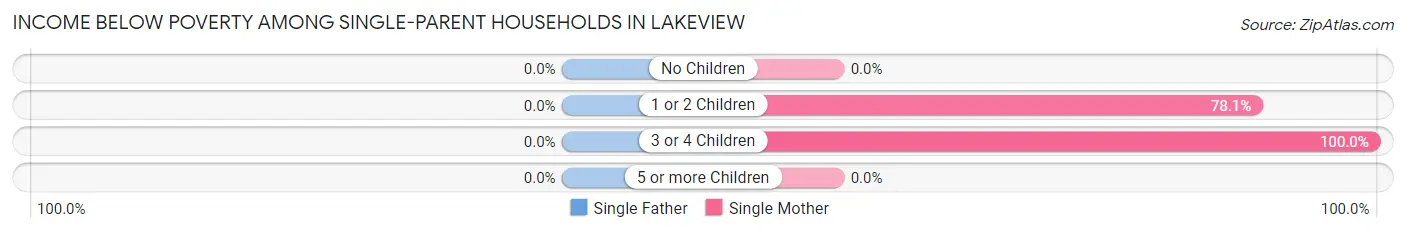
| Children | Single Father | Single Mother |
| No Children | 0 (0.0%) | 0 (0.0%) |
| 1 or 2 Children | 0 (0.0%) | 25 (78.1%) |
| 3 or 4 Children | 0 (0.0%) | 9 (100.0%) |
| 5 or more Children | 0 (0.0%) | 0 (0.0%) |
| Total | 0 (0.0%) | 34 (80.9%) |
Income Below Poverty Among Married-Couple vs Single-Parent Households in Lakeview
The poverty data for Lakeview shows that 42 of the married-couple family households (22.1%) and 34 of the single-parent households (54.0%) are living below the poverty level. Within the married-couple family households, those with 3 or 4 children have the highest poverty rate, with 40 households (100.0%) falling below the poverty line. Among the single-parent households, those with 3 or 4 children have the highest poverty rate, with 9 household (100.0%) living below poverty.
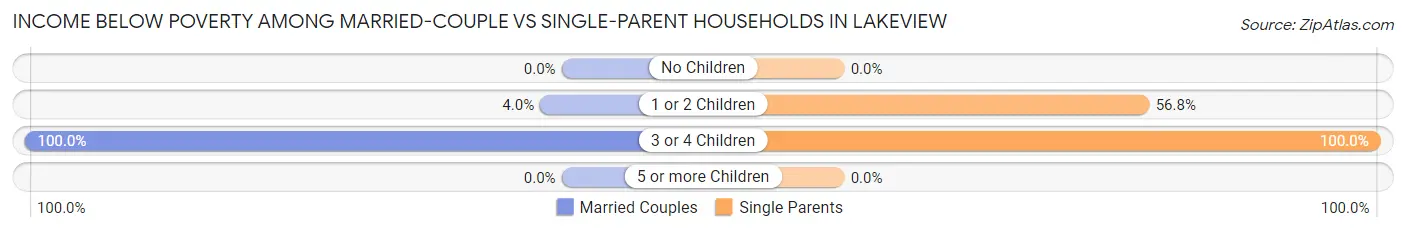
| Children | Married-Couple Families | Single-Parent Households |
| No Children | 0 (0.0%) | 0 (0.0%) |
| 1 or 2 Children | 2 (4.0%) | 25 (56.8%) |
| 3 or 4 Children | 40 (100.0%) | 9 (100.0%) |
| 5 or more Children | 0 (0.0%) | 0 (0.0%) |
| Total | 42 (22.1%) | 34 (54.0%) |
Race in Lakeview
The most populous races in Lakeview are White / Caucasian (825 | 80.3%), Black / African American (124 | 12.1%), and Hispanic or Latino (98 | 9.5%).
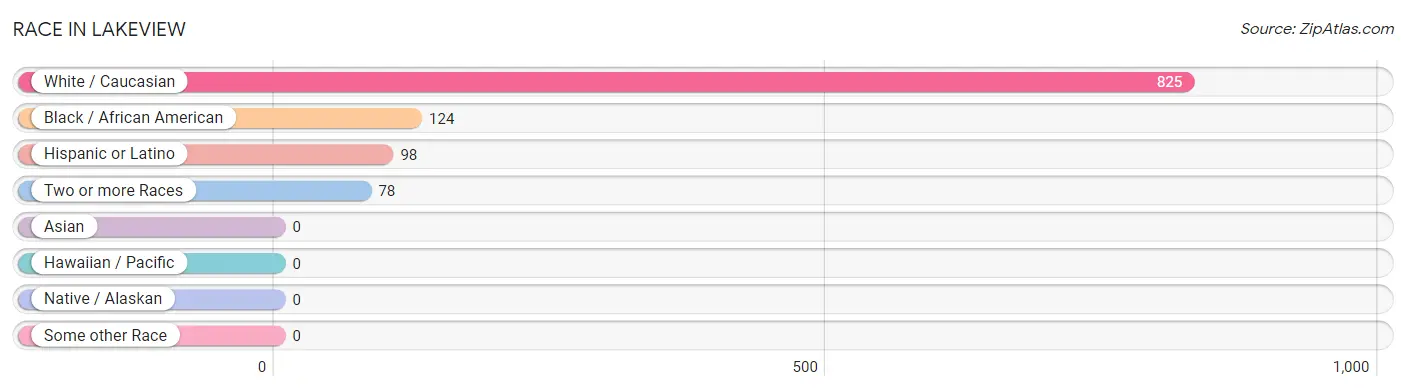
| Race | # Population | % Population |
| Asian | 0 | 0.0% |
| Black / African American | 124 | 12.1% |
| Hawaiian / Pacific | 0 | 0.0% |
| Hispanic or Latino | 98 | 9.5% |
| Native / Alaskan | 0 | 0.0% |
| White / Caucasian | 825 | 80.3% |
| Two or more Races | 78 | 7.6% |
| Some other Race | 0 | 0.0% |
| Total | 1,027 | 100.0% |
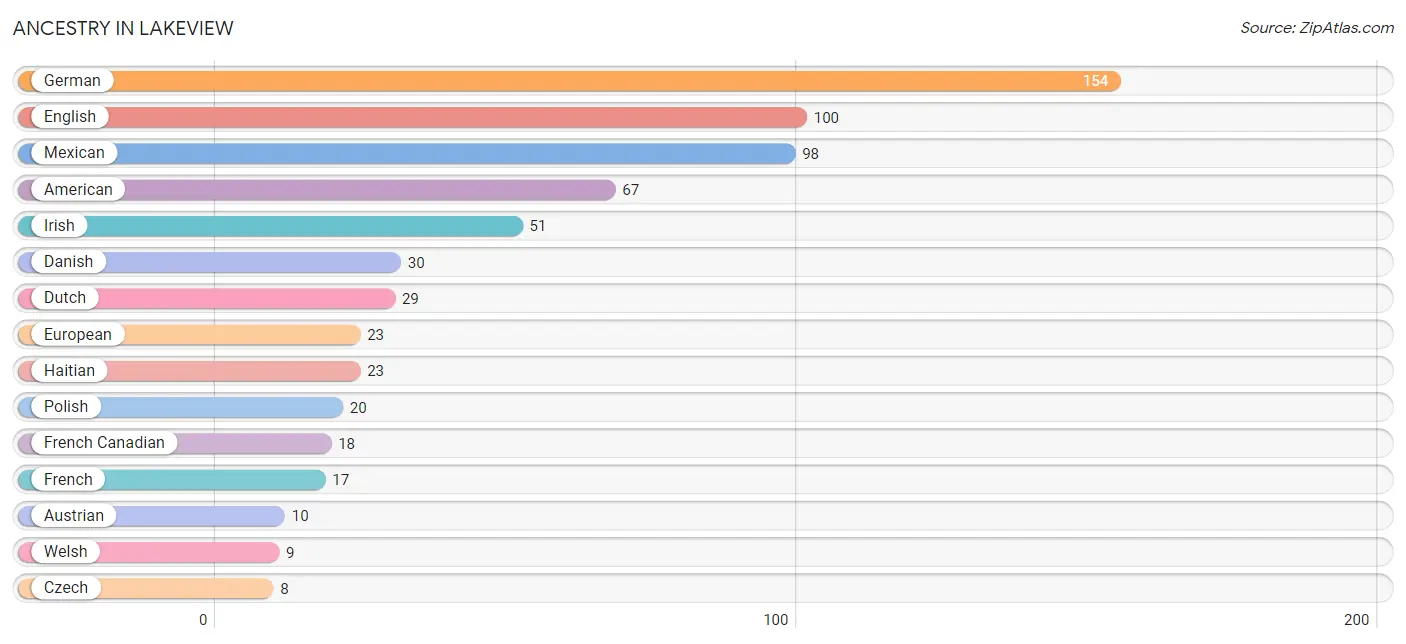
Ancestry in Lakeview
The most populous ancestries reported in Lakeview are German (154 | 15.0%), English (100 | 9.7%), Mexican (98 | 9.5%), American (67 | 6.5%), and Irish (51 | 5.0%), together accounting for 45.8% of all Lakeview residents.
| Ancestry | # Population | % Population |
| African | 3 | 0.3% |
| American | 67 | 6.5% |
| Austrian | 10 | 1.0% |
| British | 1 | 0.1% |
| Cherokee | 3 | 0.3% |
| Cree | 3 | 0.3% |
| Czech | 8 | 0.8% |
| Danish | 30 | 2.9% |
| Dutch | 29 | 2.8% |
| English | 100 | 9.7% |
| European | 23 | 2.2% |
| French | 17 | 1.7% |
| French American Indian | 3 | 0.3% |
| French Canadian | 18 | 1.8% |
| German | 154 | 15.0% |
| Haitian | 23 | 2.2% |
| Irish | 51 | 5.0% |
| Italian | 8 | 0.8% |
| Mexican | 98 | 9.5% |
| Navajo | 3 | 0.3% |
| Norwegian | 4 | 0.4% |
| Polish | 20 | 1.9% |
| Subsaharan African | 3 | 0.3% |
| Swedish | 7 | 0.7% |
| Swiss | 6 | 0.6% |
| Welsh | 9 | 0.9% | View All 26 Rows |
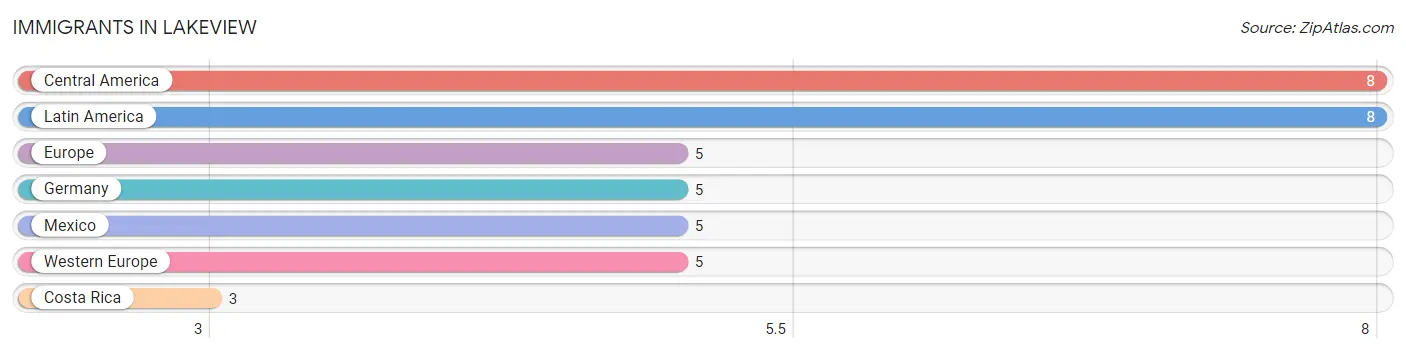
Immigrants in Lakeview
The most numerous immigrant groups reported in Lakeview came from Central America (8 | 0.8%), Latin America (8 | 0.8%), Europe (5 | 0.5%), Germany (5 | 0.5%), and Mexico (5 | 0.5%), together accounting for 3.0% of all Lakeview residents.
| Immigration Origin | # Population | % Population |
| Central America | 8 | 0.8% |
| Costa Rica | 3 | 0.3% |
| Europe | 5 | 0.5% |
| Germany | 5 | 0.5% |
| Latin America | 8 | 0.8% |
| Mexico | 5 | 0.5% |
| Western Europe | 5 | 0.5% | View All 7 Rows |
Sex and Age in Lakeview
Sex and Age in Lakeview
The most populous age groups in Lakeview are 30 to 34 Years (99 | 18.4%) for men and 70 to 74 Years (55 | 11.2%) for women.
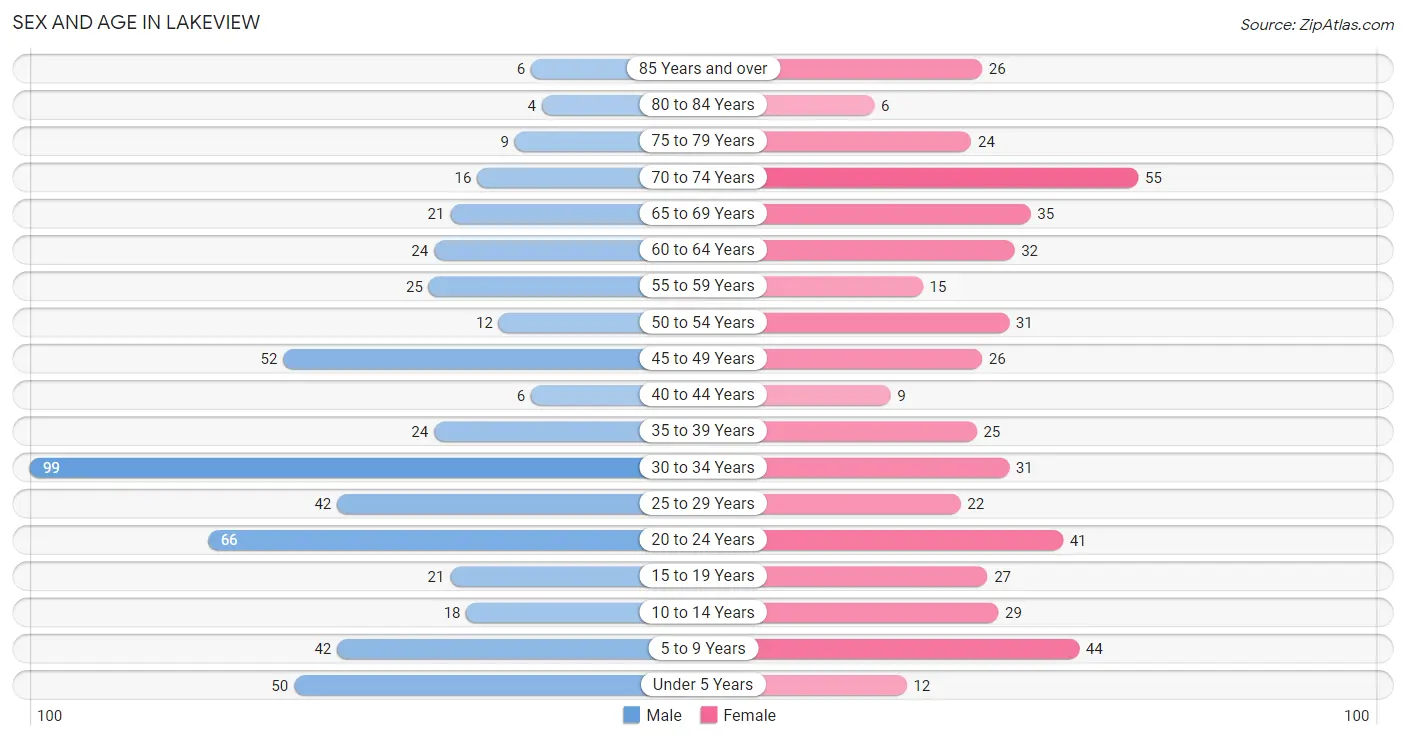
| Age Bracket | Male | Female |
| Under 5 Years | 50 (9.3%) | 12 (2.5%) |
| 5 to 9 Years | 42 (7.8%) | 44 (9.0%) |
| 10 to 14 Years | 18 (3.4%) | 29 (5.9%) |
| 15 to 19 Years | 21 (3.9%) | 27 (5.5%) |
| 20 to 24 Years | 66 (12.3%) | 41 (8.4%) |
| 25 to 29 Years | 42 (7.8%) | 22 (4.5%) |
| 30 to 34 Years | 99 (18.4%) | 31 (6.3%) |
| 35 to 39 Years | 24 (4.5%) | 25 (5.1%) |
| 40 to 44 Years | 6 (1.1%) | 9 (1.8%) |
| 45 to 49 Years | 52 (9.7%) | 26 (5.3%) |
| 50 to 54 Years | 12 (2.2%) | 31 (6.3%) |
| 55 to 59 Years | 25 (4.7%) | 15 (3.1%) |
| 60 to 64 Years | 24 (4.5%) | 32 (6.5%) |
| 65 to 69 Years | 21 (3.9%) | 35 (7.1%) |
| 70 to 74 Years | 16 (3.0%) | 55 (11.2%) |
| 75 to 79 Years | 9 (1.7%) | 24 (4.9%) |
| 80 to 84 Years | 4 (0.7%) | 6 (1.2%) |
| 85 Years and over | 6 (1.1%) | 26 (5.3%) |
| Total | 537 (100.0%) | 490 (100.0%) |
Families and Households in Lakeview
Median Family Size in Lakeview
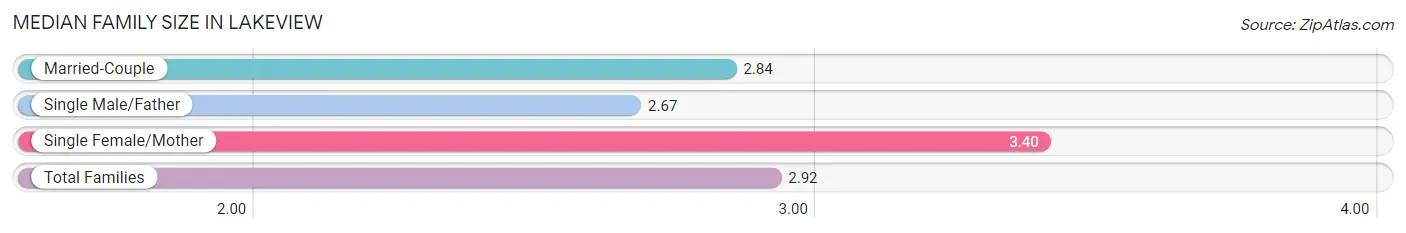
The median family size in Lakeview is 2.92 persons per family, with single female/mother families (42 | 16.6%) accounting for the largest median family size of 3.4 persons per family. On the other hand, single male/father families (21 | 8.3%) represent the smallest median family size with 2.67 persons per family.
| Family Type | # Families | Family Size |
| Married-Couple | 190 (75.1%) | 2.84 |
| Single Male/Father | 21 (8.3%) | 2.67 |
| Single Female/Mother | 42 (16.6%) | 3.40 |
| Total Families | 253 (100.0%) | 2.92 |
Median Household Size in Lakeview
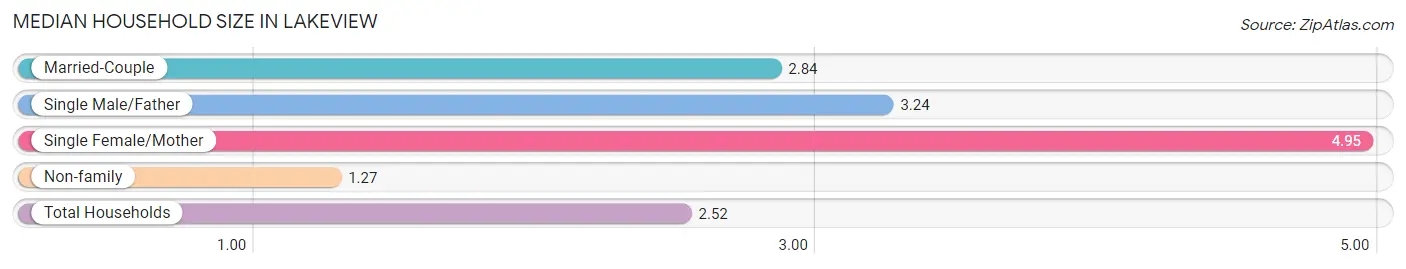
The median household size in Lakeview is 2.52 persons per household, with single female/mother households (42 | 10.7%) accounting for the largest median household size of 4.95 persons per household. non-family households (141 | 35.8%) represent the smallest median household size with 1.27 persons per household.
| Household Type | # Households | Household Size |
| Married-Couple | 190 (48.2%) | 2.84 |
| Single Male/Father | 21 (5.3%) | 3.24 |
| Single Female/Mother | 42 (10.7%) | 4.95 |
| Non-family | 141 (35.8%) | 1.27 |
| Total Households | 394 (100.0%) | 2.52 |
Household Size by Marriage Status in Lakeview
Out of a total of 394 households in Lakeview, 253 (64.2%) are family households, while 141 (35.8%) are nonfamily households. The most numerous type of family households are 2-person households, comprising 95, and the most common type of nonfamily households are 1-person households, comprising 127.
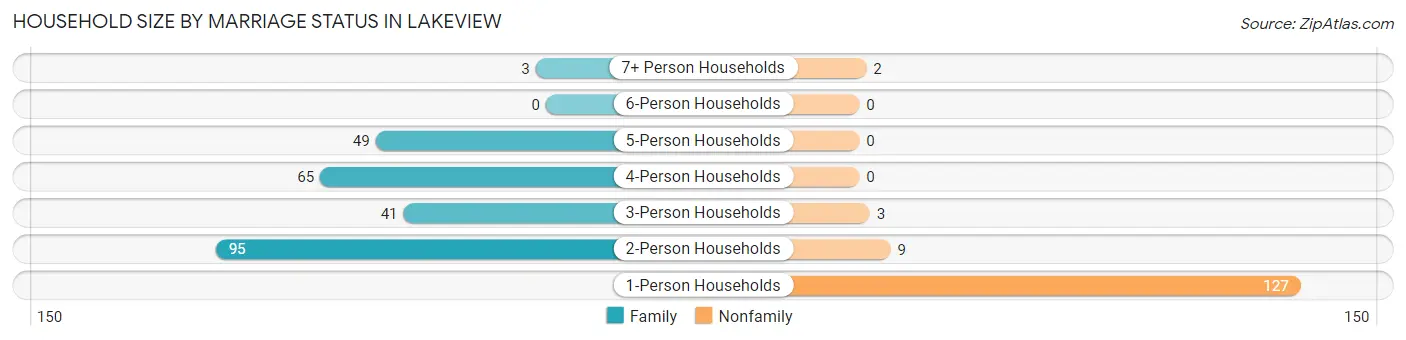
| Household Size | Family Households | Nonfamily Households |
| 1-Person Households | - | 127 (32.2%) |
| 2-Person Households | 95 (24.1%) | 9 (2.3%) |
| 3-Person Households | 41 (10.4%) | 3 (0.8%) |
| 4-Person Households | 65 (16.5%) | 0 (0.0%) |
| 5-Person Households | 49 (12.4%) | 0 (0.0%) |
| 6-Person Households | 0 (0.0%) | 0 (0.0%) |
| 7+ Person Households | 3 (0.8%) | 2 (0.5%) |
| Total | 253 (64.2%) | 141 (35.8%) |
Female Fertility in Lakeview
Fertility by Age in Lakeview
Average fertility rate in Lakeview is 98.0 births per 1,000 women. Women in the age bracket of 20 to 34 years have the highest fertility rate with 191.0 births per 1,000 women. Women in the age bracket of 20 to 34 years acount for 100.0% of all women with births.
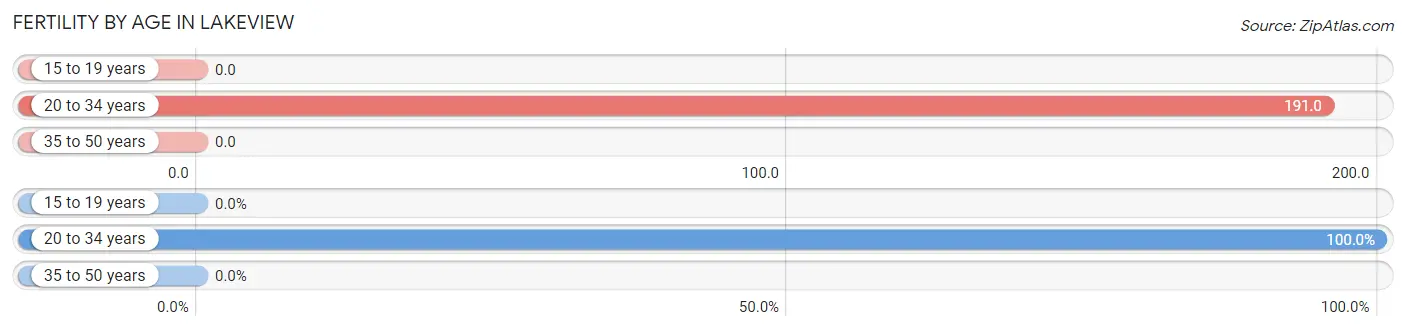
| Age Bracket | Women with Births | Births / 1,000 Women |
| 15 to 19 years | 0 (0.0%) | 0.0 |
| 20 to 34 years | 18 (100.0%) | 191.0 |
| 35 to 50 years | 0 (0.0%) | 0.0 |
| Total | 18 (100.0%) | 98.0 |
Fertility by Age by Marriage Status in Lakeview
61.1% of women with births (18) in Lakeview are married. The highest percentage of unmarried women with births falls into 20 to 34 years age bracket with 38.9% of them unmarried at the time of birth, while the lowest percentage of unmarried women with births belong to 20 to 34 years age bracket with 38.9% of them unmarried.
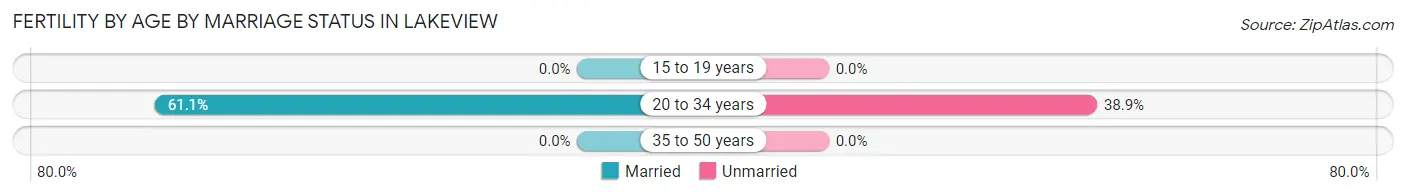
| Age Bracket | Married | Unmarried |
| 15 to 19 years | 0 (0.0%) | 0 (0.0%) |
| 20 to 34 years | 11 (61.1%) | 7 (38.9%) |
| 35 to 50 years | 0 (0.0%) | 0 (0.0%) |
| Total | 11 (61.1%) | 7 (38.9%) |
Fertility by Education in Lakeview
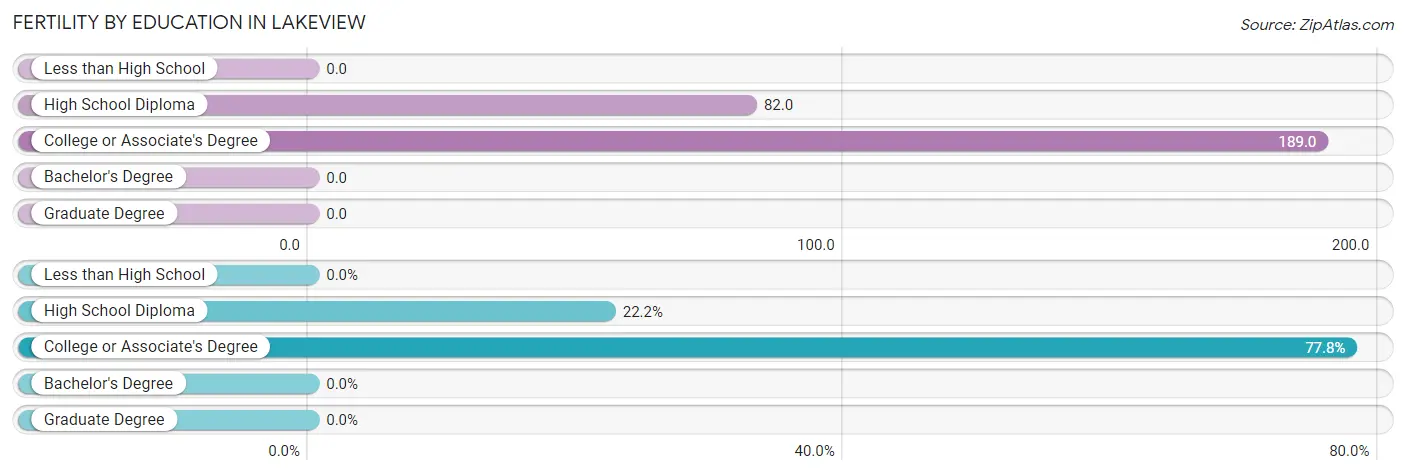
| Educational Attainment | Women with Births | Births / 1,000 Women |
| Less than High School | 0 (0.0%) | 0.0 |
| High School Diploma | 4 (22.2%) | 82.0 |
| College or Associate's Degree | 14 (77.8%) | 189.0 |
| Bachelor's Degree | 0 (0.0%) | 0.0 |
| Graduate Degree | 0 (0.0%) | 0.0 |
| Total | 18 (100.0%) | 98.0 |
Fertility by Education by Marriage Status in Lakeview
38.9% of women with births in Lakeview are unmarried. Women with the educational attainment of high school diploma are most likely to be married with 100.0% of them married at childbirth, while women with the educational attainment of college or associate's degree are least likely to be married with 50.0% of them unmarried at childbirth.
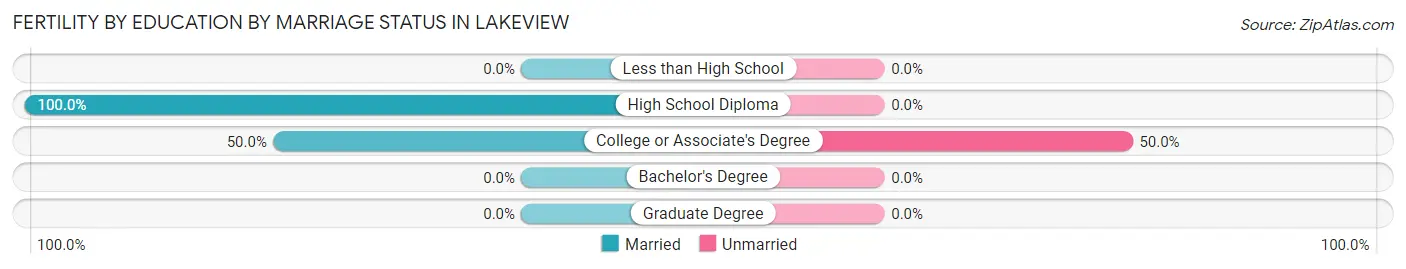
| Educational Attainment | Married | Unmarried |
| Less than High School | 0 (0.0%) | 0 (0.0%) |
| High School Diploma | 4 (100.0%) | 0 (0.0%) |
| College or Associate's Degree | 7 (50.0%) | 7 (50.0%) |
| Bachelor's Degree | 0 (0.0%) | 0 (0.0%) |
| Graduate Degree | 0 (0.0%) | 0 (0.0%) |
| Total | 11 (61.1%) | 7 (38.9%) |
Employment Characteristics in Lakeview
Employment by Class of Employer in Lakeview
Among the 331 employed individuals in Lakeview, private company employees (240 | 72.5%), not-for-profit organizations (32 | 9.7%), and self-employed (not incorporated) (31 | 9.4%) make up the most common classes of employment.
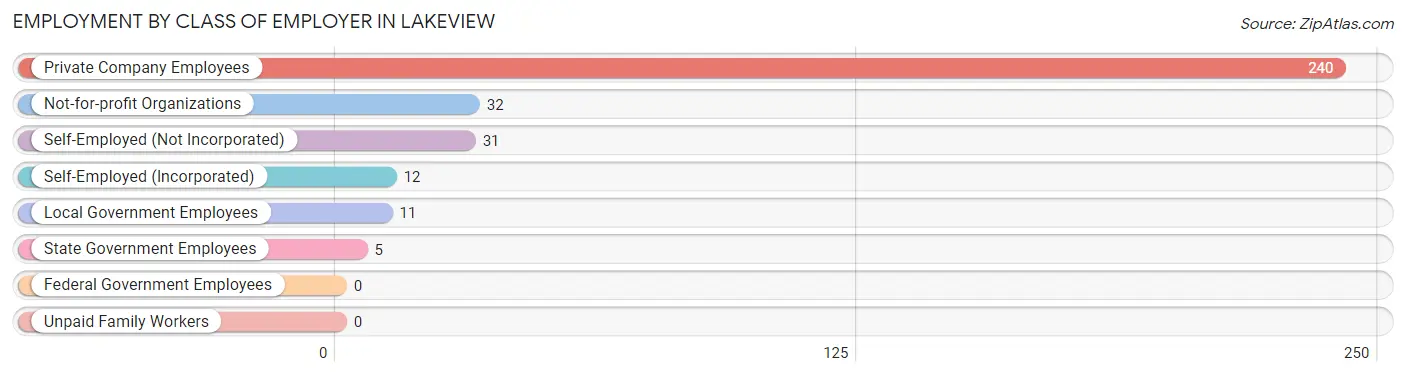
| Employer Class | # Employees | % Employees |
| Private Company Employees | 240 | 72.5% |
| Self-Employed (Incorporated) | 12 | 3.6% |
| Self-Employed (Not Incorporated) | 31 | 9.4% |
| Not-for-profit Organizations | 32 | 9.7% |
| Local Government Employees | 11 | 3.3% |
| State Government Employees | 5 | 1.5% |
| Federal Government Employees | 0 | 0.0% |
| Unpaid Family Workers | 0 | 0.0% |
| Total | 331 | 100.0% |
Employment Status by Age in Lakeview
According to the labor force statistics for Lakeview, out of the total population over 16 years of age (823), 47.4% or 390 individuals are in the labor force, with 14.4% or 56 of them unemployed. The age group with the highest labor force participation rate is 30 to 34 years, with 80.0% or 104 individuals in the labor force. Within the labor force, the 30 to 34 years age range has the highest percentage of unemployed individuals, with 53.8% or 56 of them being unemployed.
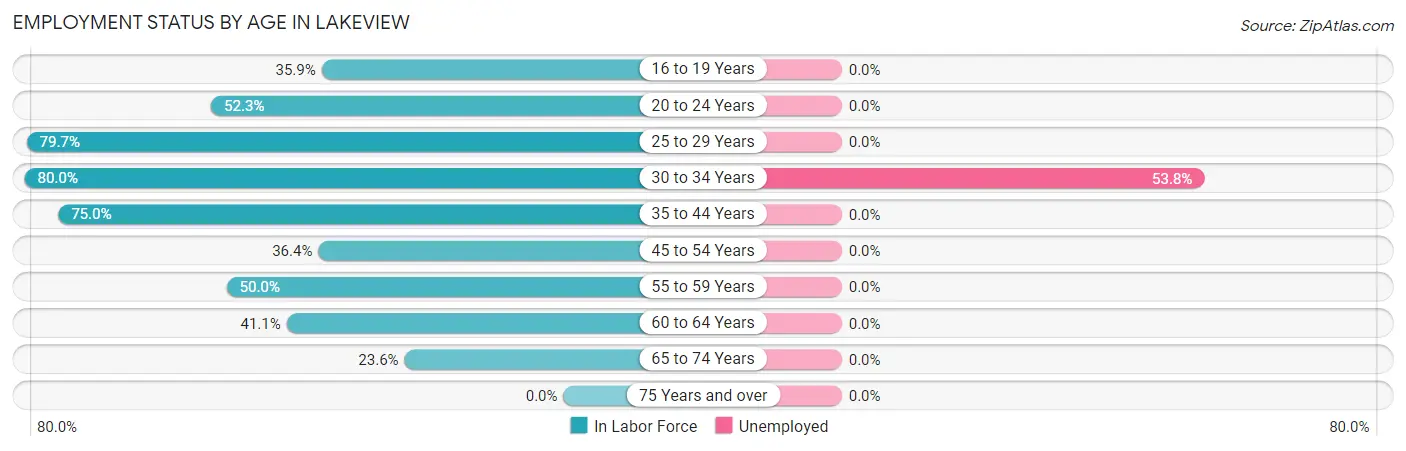
| Age Bracket | In Labor Force | Unemployed |
| 16 to 19 Years | 14 (35.9%) | 0 (0.0%) |
| 20 to 24 Years | 56 (52.3%) | 0 (0.0%) |
| 25 to 29 Years | 51 (79.7%) | 0 (0.0%) |
| 30 to 34 Years | 104 (80.0%) | 56 (53.8%) |
| 35 to 44 Years | 48 (75.0%) | 0 (0.0%) |
| 45 to 54 Years | 44 (36.4%) | 0 (0.0%) |
| 55 to 59 Years | 20 (50.0%) | 0 (0.0%) |
| 60 to 64 Years | 23 (41.1%) | 0 (0.0%) |
| 65 to 74 Years | 30 (23.6%) | 0 (0.0%) |
| 75 Years and over | 0 (0.0%) | 0 (0.0%) |
| Total | 390 (47.4%) | 56 (14.4%) |
Employment Status by Educational Attainment in Lakeview
According to labor force statistics for Lakeview, 61.1% of individuals (290) out of the total population between 25 and 64 years of age (475) are in the labor force, with 19.3% or 56 of them being unemployed. The group with the highest labor force participation rate are those with the educational attainment of college / associate degree, with 79.7% or 94 individuals in the labor force. Within the labor force, individuals with high school diploma education have the highest percentage of unemployment, with 46.3% or 56 of them being unemployed.
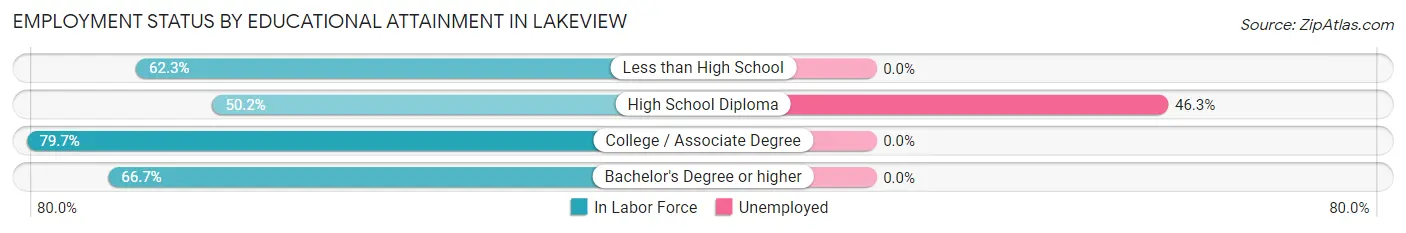
| Educational Attainment | In Labor Force | Unemployed |
| Less than High School | 33 (62.3%) | 0 (0.0%) |
| High School Diploma | 121 (50.2%) | 112 (46.3%) |
| College / Associate Degree | 94 (79.7%) | 0 (0.0%) |
| Bachelor's Degree or higher | 42 (66.7%) | 0 (0.0%) |
| Total | 290 (61.1%) | 92 (19.3%) |
Employment Occupations by Sex in Lakeview
Management, Business, Science and Arts Occupations
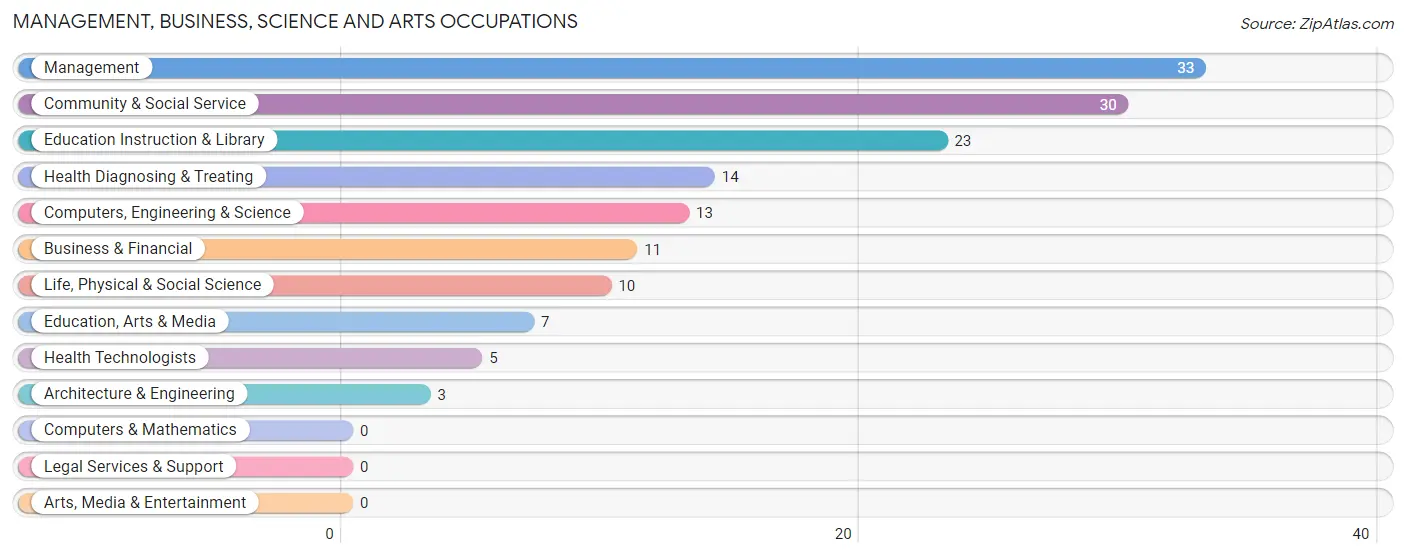
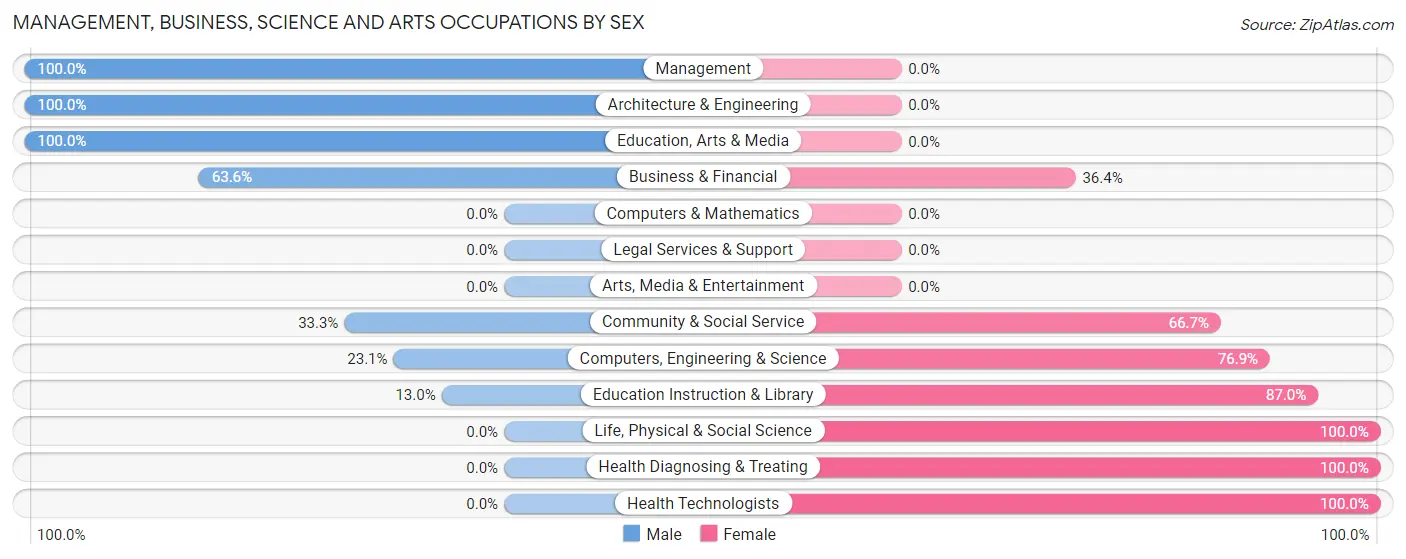
The most common Management, Business, Science and Arts occupations in Lakeview are Management (33 | 9.9%), Community & Social Service (30 | 9.0%), Education Instruction & Library (23 | 6.9%), Health Diagnosing & Treating (14 | 4.2%), and Computers, Engineering & Science (13 | 3.9%).
Management, Business, Science and Arts Occupations by Sex
Within the Management, Business, Science and Arts occupations in Lakeview, the most male-oriented occupations are Management (100.0%), Architecture & Engineering (100.0%), and Education, Arts & Media (100.0%), while the most female-oriented occupations are Life, Physical & Social Science (100.0%), Health Diagnosing & Treating (100.0%), and Health Technologists (100.0%).
| Occupation | Male | Female |
| Management | 33 (100.0%) | 0 (0.0%) |
| Business & Financial | 7 (63.6%) | 4 (36.4%) |
| Computers, Engineering & Science | 3 (23.1%) | 10 (76.9%) |
| Computers & Mathematics | 0 (0.0%) | 0 (0.0%) |
| Architecture & Engineering | 3 (100.0%) | 0 (0.0%) |
| Life, Physical & Social Science | 0 (0.0%) | 10 (100.0%) |
| Community & Social Service | 10 (33.3%) | 20 (66.7%) |
| Education, Arts & Media | 7 (100.0%) | 0 (0.0%) |
| Legal Services & Support | 0 (0.0%) | 0 (0.0%) |
| Education Instruction & Library | 3 (13.0%) | 20 (87.0%) |
| Arts, Media & Entertainment | 0 (0.0%) | 0 (0.0%) |
| Health Diagnosing & Treating | 0 (0.0%) | 14 (100.0%) |
| Health Technologists | 0 (0.0%) | 5 (100.0%) |
| Total (Category) | 53 (52.5%) | 48 (47.5%) |
| Total (Overall) | 191 (57.2%) | 143 (42.8%) |
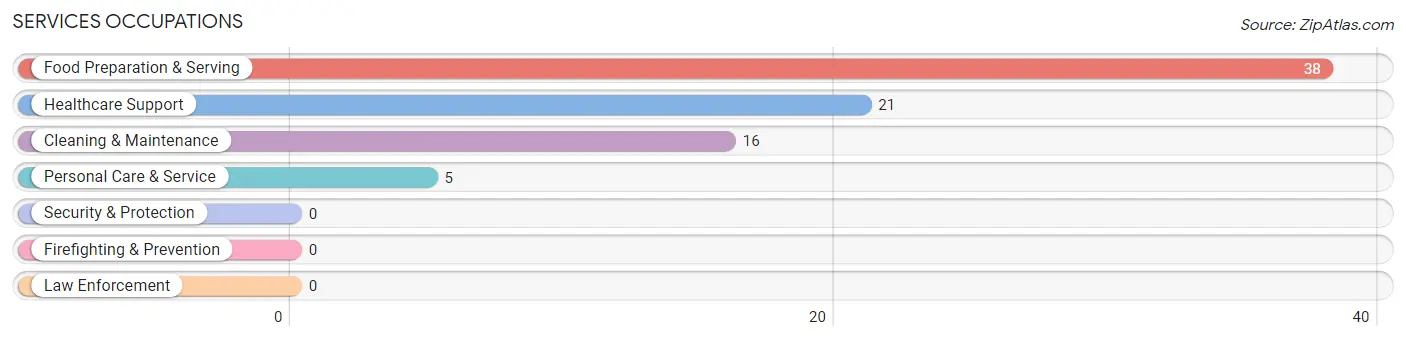
Services Occupations
The most common Services occupations in Lakeview are Food Preparation & Serving (38 | 11.4%), Healthcare Support (21 | 6.3%), Cleaning & Maintenance (16 | 4.8%), and Personal Care & Service (5 | 1.5%).
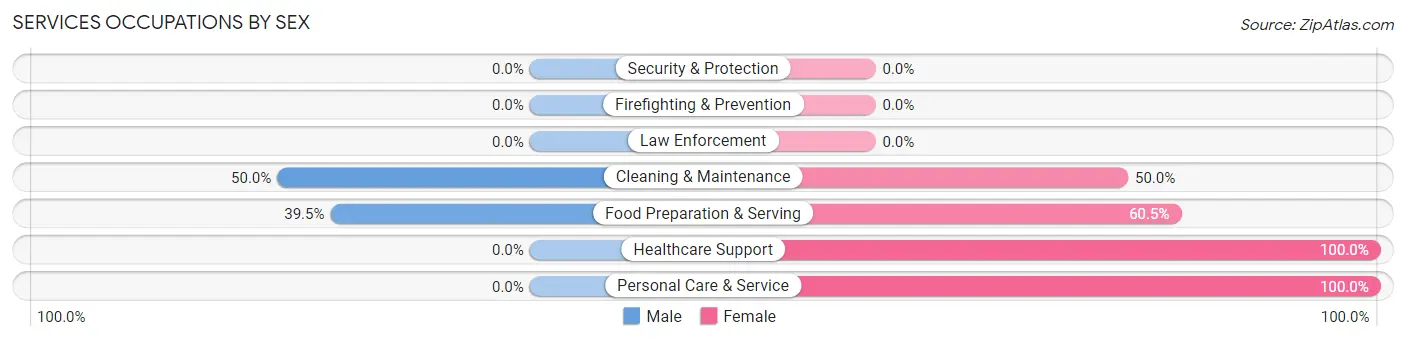
Services Occupations by Sex
Within the Services occupations in Lakeview, the most male-oriented occupations are Cleaning & Maintenance (50.0%), and Food Preparation & Serving (39.5%), while the most female-oriented occupations are Healthcare Support (100.0%), Personal Care & Service (100.0%), and Food Preparation & Serving (60.5%).
| Occupation | Male | Female |
| Healthcare Support | 0 (0.0%) | 21 (100.0%) |
| Security & Protection | 0 (0.0%) | 0 (0.0%) |
| Firefighting & Prevention | 0 (0.0%) | 0 (0.0%) |
| Law Enforcement | 0 (0.0%) | 0 (0.0%) |
| Food Preparation & Serving | 15 (39.5%) | 23 (60.5%) |
| Cleaning & Maintenance | 8 (50.0%) | 8 (50.0%) |
| Personal Care & Service | 0 (0.0%) | 5 (100.0%) |
| Total (Category) | 23 (28.7%) | 57 (71.3%) |
| Total (Overall) | 191 (57.2%) | 143 (42.8%) |
Sales and Office Occupations
The most common Sales and Office occupations in Lakeview are Office & Administration (26 | 7.8%), and Sales & Related (25 | 7.5%).

Sales and Office Occupations by Sex

| Occupation | Male | Female |
| Sales & Related | 22 (88.0%) | 3 (12.0%) |
| Office & Administration | 0 (0.0%) | 26 (100.0%) |
| Total (Category) | 22 (43.1%) | 29 (56.9%) |
| Total (Overall) | 191 (57.2%) | 143 (42.8%) |
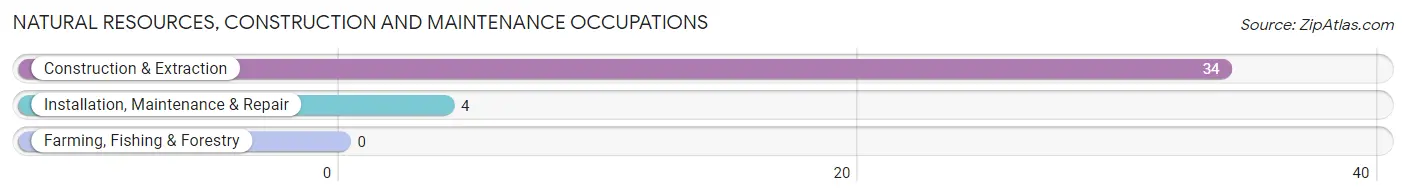
Natural Resources, Construction and Maintenance Occupations
The most common Natural Resources, Construction and Maintenance occupations in Lakeview are Construction & Extraction (34 | 10.2%), and Installation, Maintenance & Repair (4 | 1.2%).
Natural Resources, Construction and Maintenance Occupations by Sex

| Occupation | Male | Female |
| Farming, Fishing & Forestry | 0 (0.0%) | 0 (0.0%) |
| Construction & Extraction | 34 (100.0%) | 0 (0.0%) |
| Installation, Maintenance & Repair | 4 (100.0%) | 0 (0.0%) |
| Total (Category) | 38 (100.0%) | 0 (0.0%) |
| Total (Overall) | 191 (57.2%) | 143 (42.8%) |
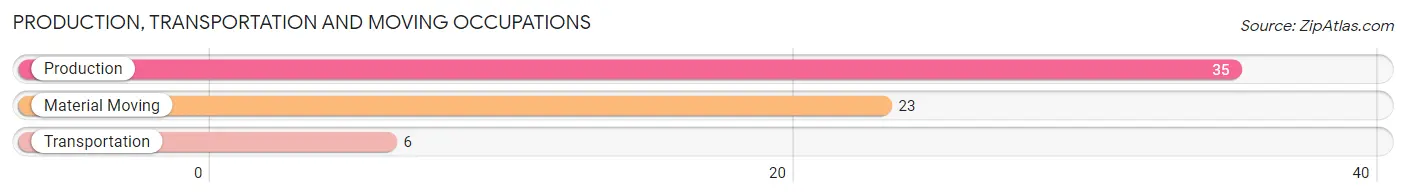
Production, Transportation and Moving Occupations
The most common Production, Transportation and Moving occupations in Lakeview are Production (35 | 10.5%), Material Moving (23 | 6.9%), and Transportation (6 | 1.8%).
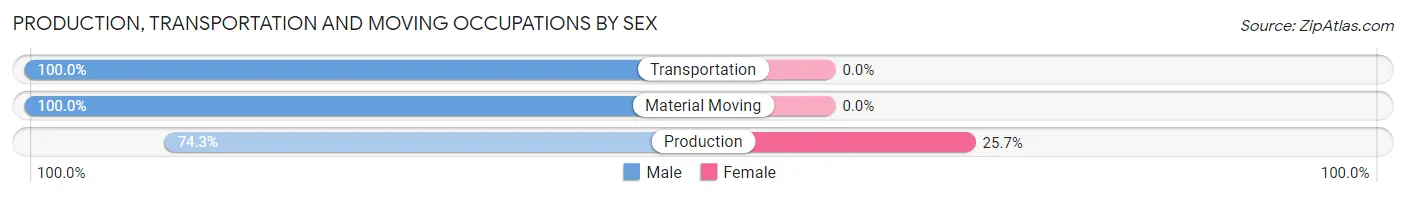
Production, Transportation and Moving Occupations by Sex
| Occupation | Male | Female |
| Production | 26 (74.3%) | 9 (25.7%) |
| Transportation | 6 (100.0%) | 0 (0.0%) |
| Material Moving | 23 (100.0%) | 0 (0.0%) |
| Total (Category) | 55 (85.9%) | 9 (14.1%) |
| Total (Overall) | 191 (57.2%) | 143 (42.8%) |
Employment Industries by Sex in Lakeview
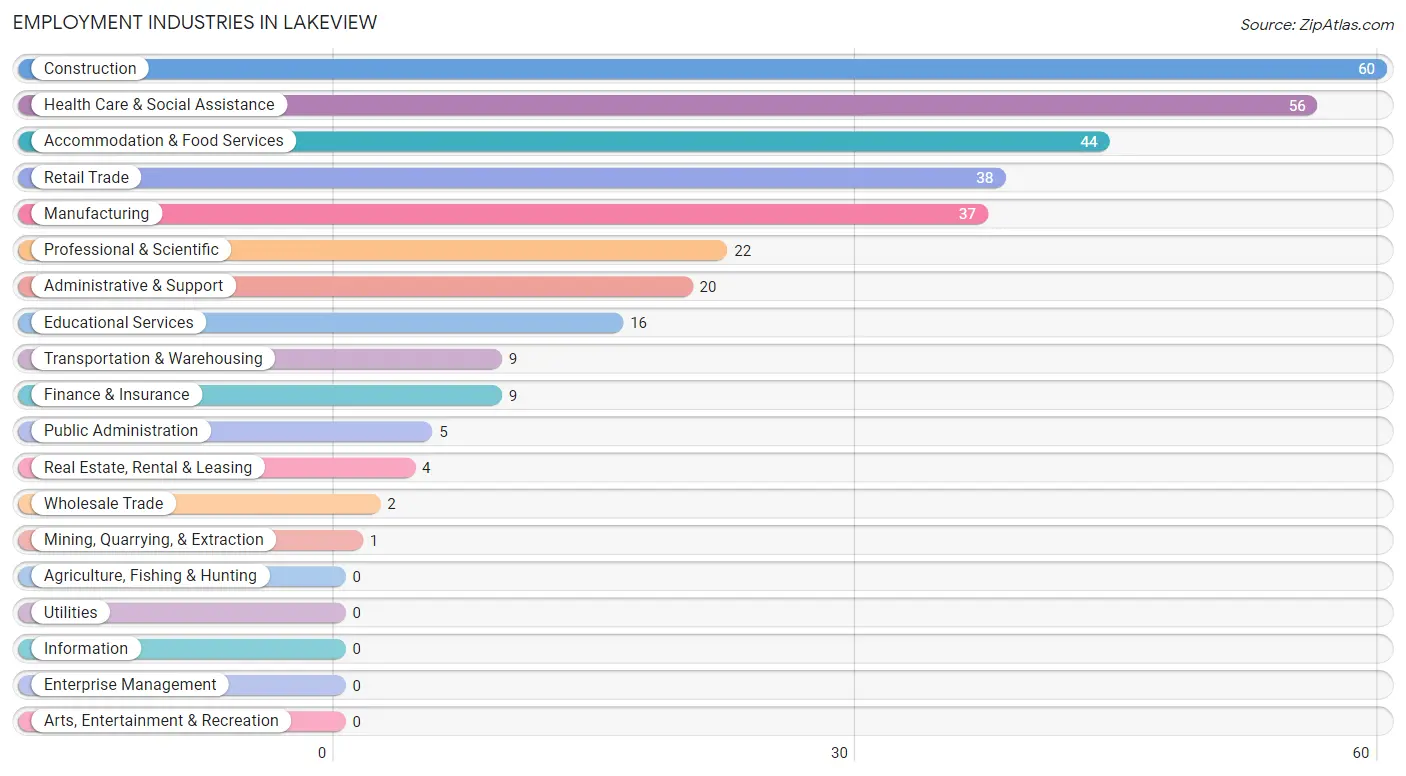
Employment Industries in Lakeview
The major employment industries in Lakeview include Construction (60 | 18.0%), Health Care & Social Assistance (56 | 16.8%), Accommodation & Food Services (44 | 13.2%), Retail Trade (38 | 11.4%), and Manufacturing (37 | 11.1%).
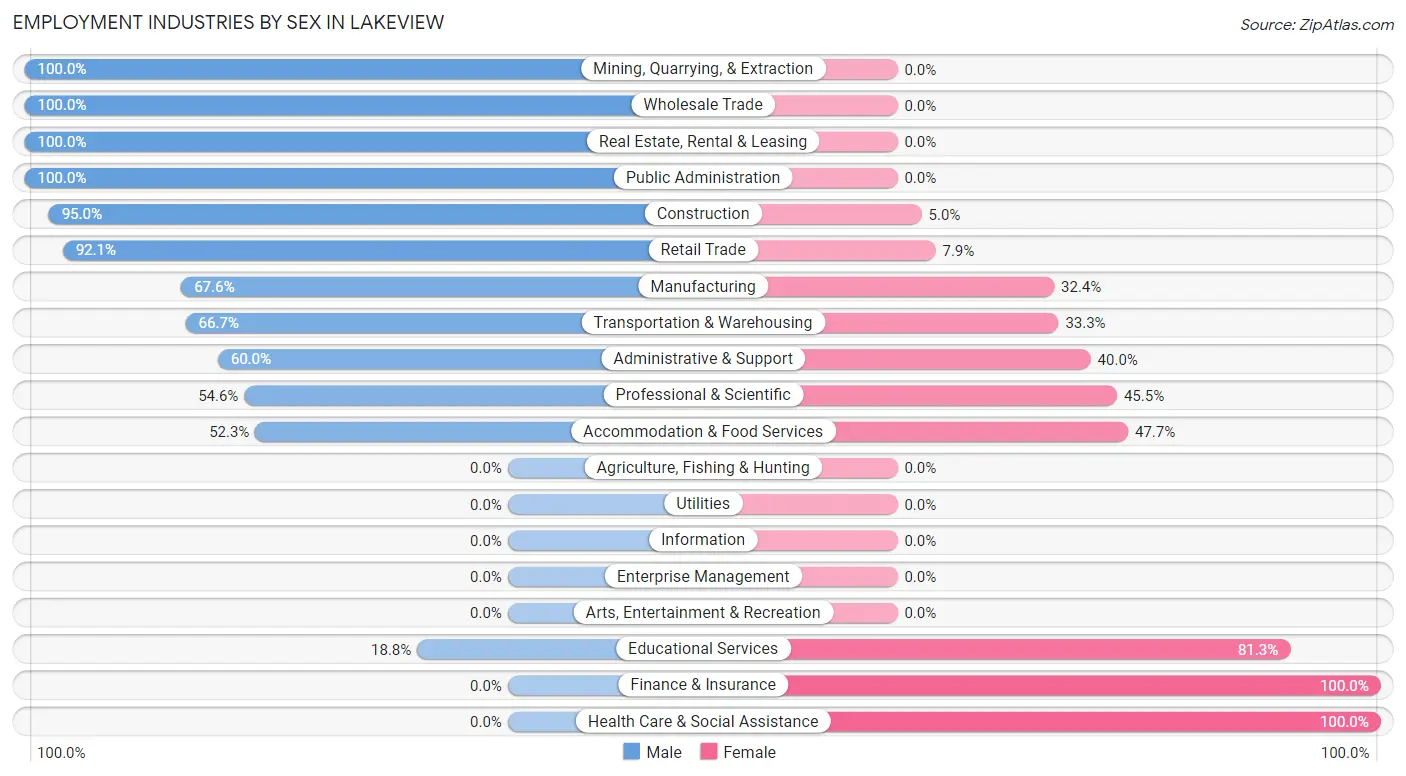
Employment Industries by Sex in Lakeview
The Lakeview industries that see more men than women are Mining, Quarrying, & Extraction (100.0%), Wholesale Trade (100.0%), and Real Estate, Rental & Leasing (100.0%), whereas the industries that tend to have a higher number of women are Finance & Insurance (100.0%), Health Care & Social Assistance (100.0%), and Educational Services (81.2%).
| Industry | Male | Female |
| Agriculture, Fishing & Hunting | 0 (0.0%) | 0 (0.0%) |
| Mining, Quarrying, & Extraction | 1 (100.0%) | 0 (0.0%) |
| Construction | 57 (95.0%) | 3 (5.0%) |
| Manufacturing | 25 (67.6%) | 12 (32.4%) |
| Wholesale Trade | 2 (100.0%) | 0 (0.0%) |
| Retail Trade | 35 (92.1%) | 3 (7.9%) |
| Transportation & Warehousing | 6 (66.7%) | 3 (33.3%) |
| Utilities | 0 (0.0%) | 0 (0.0%) |
| Information | 0 (0.0%) | 0 (0.0%) |
| Finance & Insurance | 0 (0.0%) | 9 (100.0%) |
| Real Estate, Rental & Leasing | 4 (100.0%) | 0 (0.0%) |
| Professional & Scientific | 12 (54.5%) | 10 (45.5%) |
| Enterprise Management | 0 (0.0%) | 0 (0.0%) |
| Administrative & Support | 12 (60.0%) | 8 (40.0%) |
| Educational Services | 3 (18.8%) | 13 (81.2%) |
| Health Care & Social Assistance | 0 (0.0%) | 56 (100.0%) |
| Arts, Entertainment & Recreation | 0 (0.0%) | 0 (0.0%) |
| Accommodation & Food Services | 23 (52.3%) | 21 (47.7%) |
| Public Administration | 5 (100.0%) | 0 (0.0%) |
| Total | 191 (57.2%) | 143 (42.8%) |
Education in Lakeview
School Enrollment in Lakeview
The most common levels of schooling among the 205 students in Lakeview are elementary school (65 | 31.7%), middle school (40 | 19.5%), and high school (34 | 16.6%).
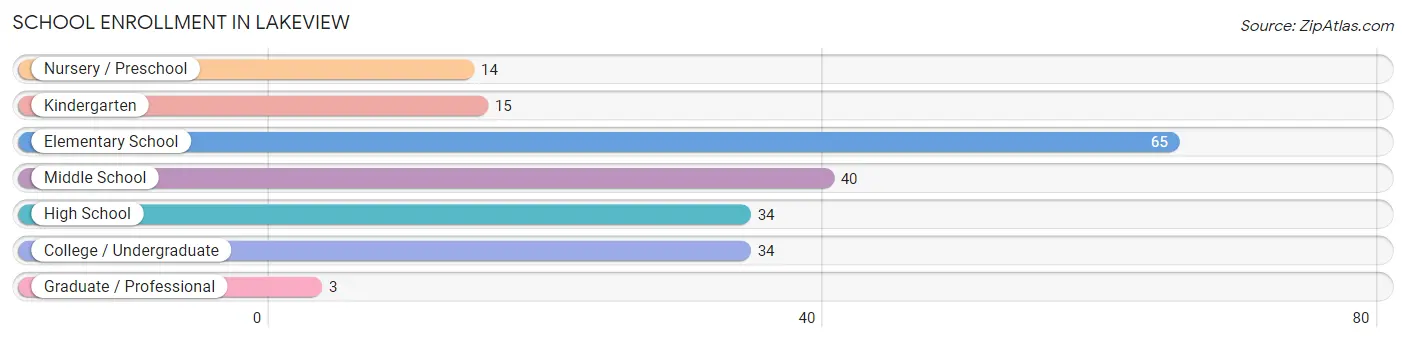
| School Level | # Students | % Students |
| Nursery / Preschool | 14 | 6.8% |
| Kindergarten | 15 | 7.3% |
| Elementary School | 65 | 31.7% |
| Middle School | 40 | 19.5% |
| High School | 34 | 16.6% |
| College / Undergraduate | 34 | 16.6% |
| Graduate / Professional | 3 | 1.5% |
| Total | 205 | 100.0% |
School Enrollment by Age by Funding Source in Lakeview
Out of a total of 205 students who are enrolled in schools in Lakeview, 3 (1.5%) attend a private institution, while the remaining 202 (98.5%) are enrolled in public schools. The age group of 25 to 34 year olds has the highest likelihood of being enrolled in private schools, with 3 (30.0% in the age bracket) enrolled. Conversely, the age group of 3 to 4 year olds has the lowest likelihood of being enrolled in a private school, with 7 (100.0% in the age bracket) attending a public institution.
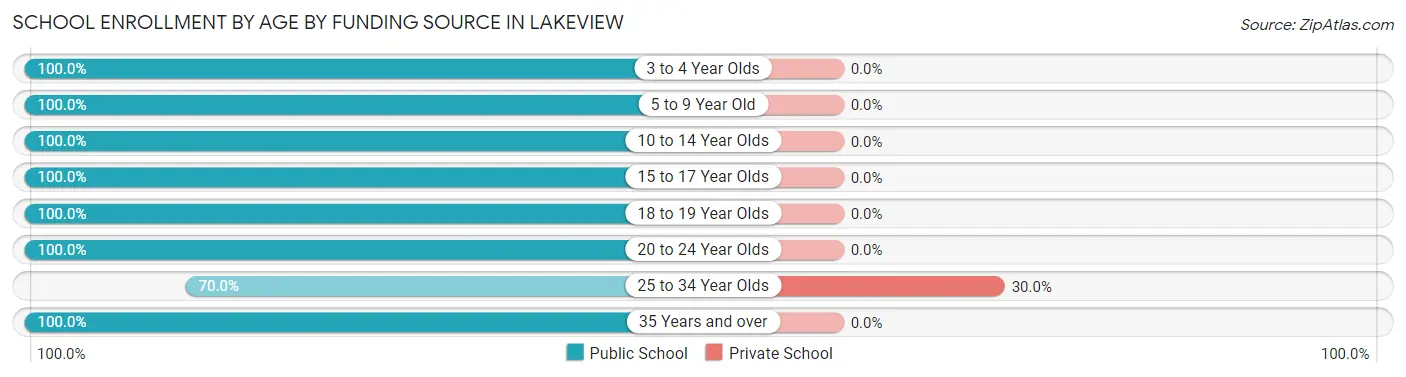
| Age Bracket | Public School | Private School |
| 3 to 4 Year Olds | 7 (100.0%) | 0 (0.0%) |
| 5 to 9 Year Old | 80 (100.0%) | 0 (0.0%) |
| 10 to 14 Year Olds | 47 (100.0%) | 0 (0.0%) |
| 15 to 17 Year Olds | 29 (100.0%) | 0 (0.0%) |
| 18 to 19 Year Olds | 10 (100.0%) | 0 (0.0%) |
| 20 to 24 Year Olds | 19 (100.0%) | 0 (0.0%) |
| 25 to 34 Year Olds | 7 (70.0%) | 3 (30.0%) |
| 35 Years and over | 3 (100.0%) | 0 (0.0%) |
| Total | 202 (98.5%) | 3 (1.5%) |
Educational Attainment by Field of Study in Lakeview
Education (42 | 50.0%), physical & health sciences (13 | 15.5%), engineering (8 | 9.5%), business (7 | 8.3%), and social sciences (3 | 3.6%) are the most common fields of study among 84 individuals in Lakeview who have obtained a bachelor's degree or higher.
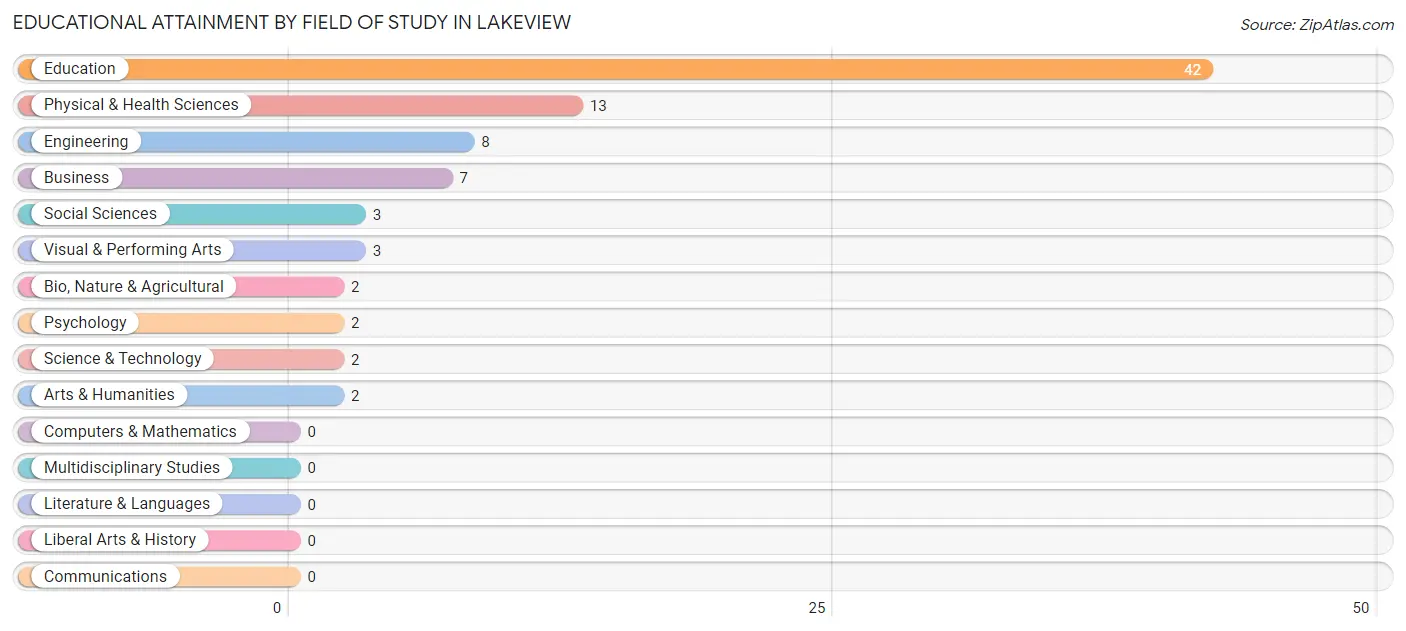
| Field of Study | # Graduates | % Graduates |
| Computers & Mathematics | 0 | 0.0% |
| Bio, Nature & Agricultural | 2 | 2.4% |
| Physical & Health Sciences | 13 | 15.5% |
| Psychology | 2 | 2.4% |
| Social Sciences | 3 | 3.6% |
| Engineering | 8 | 9.5% |
| Multidisciplinary Studies | 0 | 0.0% |
| Science & Technology | 2 | 2.4% |
| Business | 7 | 8.3% |
| Education | 42 | 50.0% |
| Literature & Languages | 0 | 0.0% |
| Liberal Arts & History | 0 | 0.0% |
| Visual & Performing Arts | 3 | 3.6% |
| Communications | 0 | 0.0% |
| Arts & Humanities | 2 | 2.4% |
| Total | 84 | 100.0% |
Transportation & Commute in Lakeview
Vehicle Availability by Sex in Lakeview
The most prevalent vehicle ownership categories in Lakeview are males with 2 vehicles (73, accounting for 38.2%) and females with 2 vehicles (50, making up 52.1%).
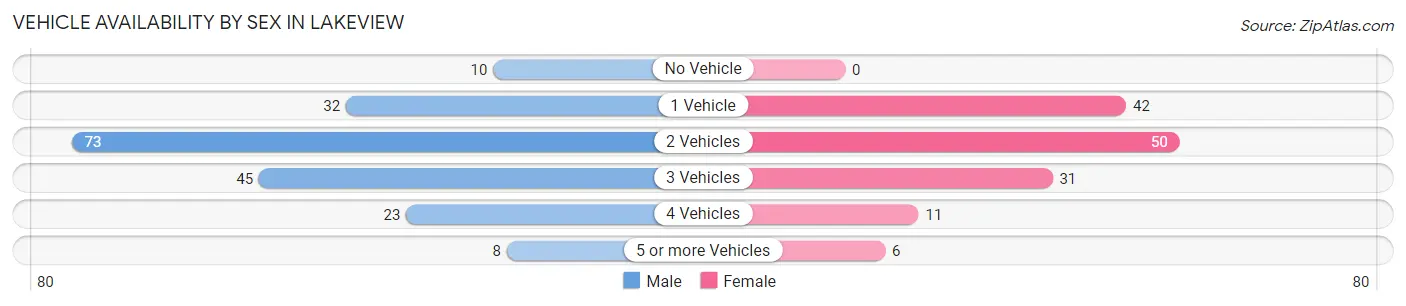
| Vehicles Available | Male | Female |
| No Vehicle | 10 (5.2%) | 0 (0.0%) |
| 1 Vehicle | 32 (16.8%) | 42 (30.0%) |
| 2 Vehicles | 73 (38.2%) | 50 (35.7%) |
| 3 Vehicles | 45 (23.6%) | 31 (22.1%) |
| 4 Vehicles | 23 (12.0%) | 11 (7.9%) |
| 5 or more Vehicles | 8 (4.2%) | 6 (4.3%) |
| Total | 191 (100.0%) | 140 (100.0%) |
Commute Time in Lakeview
The most frequently occuring commute durations in Lakeview are 5 to 9 minutes (77 commuters, 25.3%), 40 to 44 minutes (38 commuters, 12.5%), and 30 to 34 minutes (36 commuters, 11.8%).
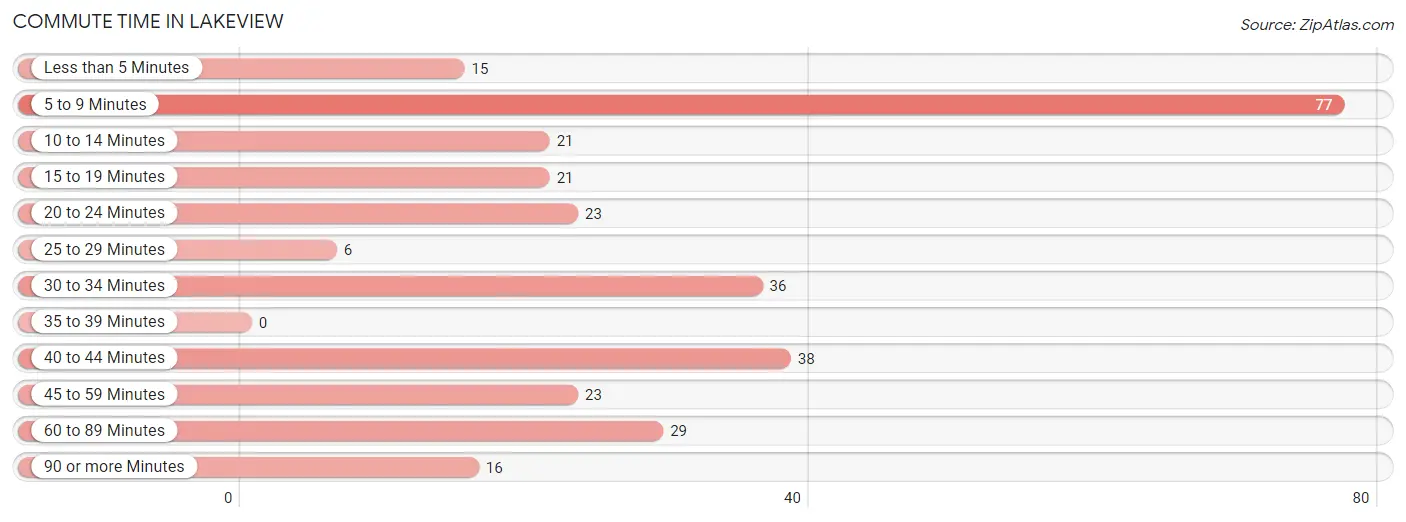
| Commute Time | # Commuters | % Commuters |
| Less than 5 Minutes | 15 | 4.9% |
| 5 to 9 Minutes | 77 | 25.3% |
| 10 to 14 Minutes | 21 | 6.9% |
| 15 to 19 Minutes | 21 | 6.9% |
| 20 to 24 Minutes | 23 | 7.5% |
| 25 to 29 Minutes | 6 | 2.0% |
| 30 to 34 Minutes | 36 | 11.8% |
| 35 to 39 Minutes | 0 | 0.0% |
| 40 to 44 Minutes | 38 | 12.5% |
| 45 to 59 Minutes | 23 | 7.5% |
| 60 to 89 Minutes | 29 | 9.5% |
| 90 or more Minutes | 16 | 5.2% |
Commute Time by Sex in Lakeview
The most common commute times in Lakeview are 5 to 9 minutes (49 commuters, 28.8%) for males and 40 to 44 minutes (38 commuters, 28.1%) for females.
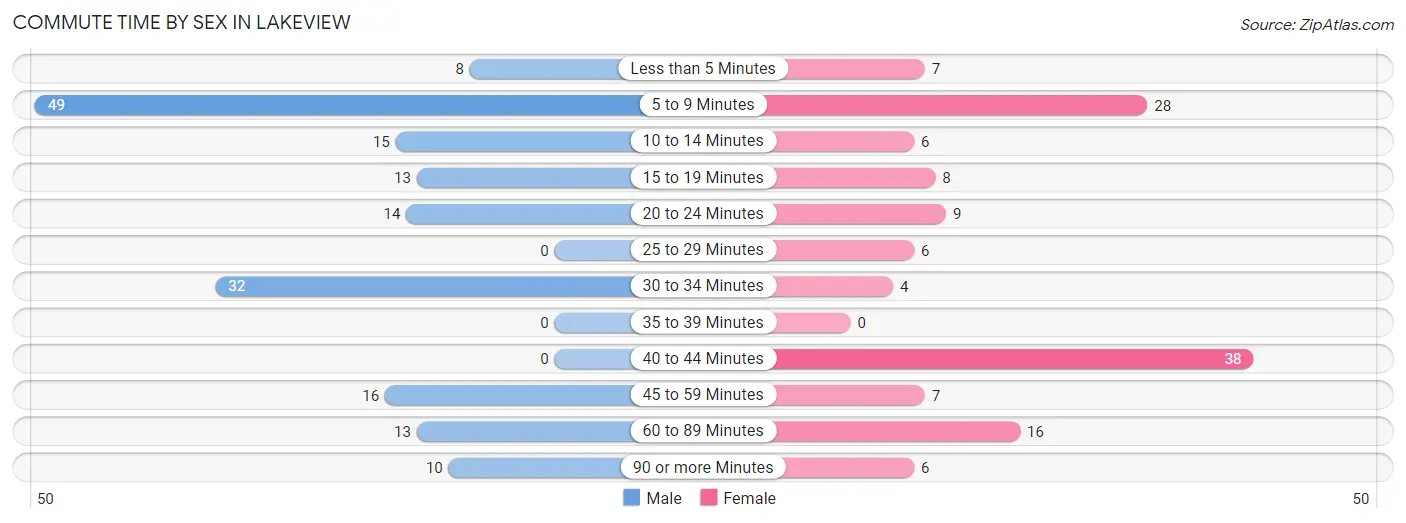
| Commute Time | Male | Female |
| Less than 5 Minutes | 8 (4.7%) | 7 (5.2%) |
| 5 to 9 Minutes | 49 (28.8%) | 28 (20.7%) |
| 10 to 14 Minutes | 15 (8.8%) | 6 (4.4%) |
| 15 to 19 Minutes | 13 (7.6%) | 8 (5.9%) |
| 20 to 24 Minutes | 14 (8.2%) | 9 (6.7%) |
| 25 to 29 Minutes | 0 (0.0%) | 6 (4.4%) |
| 30 to 34 Minutes | 32 (18.8%) | 4 (3.0%) |
| 35 to 39 Minutes | 0 (0.0%) | 0 (0.0%) |
| 40 to 44 Minutes | 0 (0.0%) | 38 (28.1%) |
| 45 to 59 Minutes | 16 (9.4%) | 7 (5.2%) |
| 60 to 89 Minutes | 13 (7.6%) | 16 (11.8%) |
| 90 or more Minutes | 10 (5.9%) | 6 (4.4%) |
Time of Departure to Work by Sex in Lakeview
The most frequent times of departure to work in Lakeview are 9:00 AM to 9:59 AM (29, 17.1%) for males and 7:30 AM to 7:59 AM (26, 19.3%) for females.
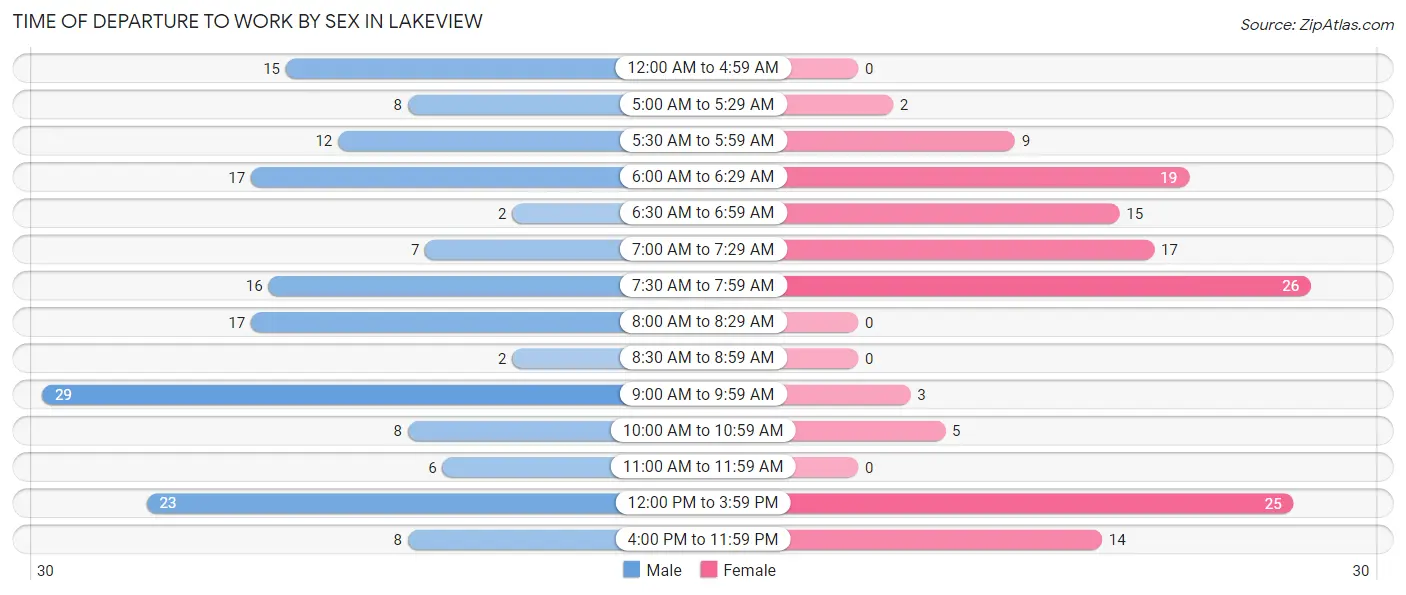
| Time of Departure | Male | Female |
| 12:00 AM to 4:59 AM | 15 (8.8%) | 0 (0.0%) |
| 5:00 AM to 5:29 AM | 8 (4.7%) | 2 (1.5%) |
| 5:30 AM to 5:59 AM | 12 (7.1%) | 9 (6.7%) |
| 6:00 AM to 6:29 AM | 17 (10.0%) | 19 (14.1%) |
| 6:30 AM to 6:59 AM | 2 (1.2%) | 15 (11.1%) |
| 7:00 AM to 7:29 AM | 7 (4.1%) | 17 (12.6%) |
| 7:30 AM to 7:59 AM | 16 (9.4%) | 26 (19.3%) |
| 8:00 AM to 8:29 AM | 17 (10.0%) | 0 (0.0%) |
| 8:30 AM to 8:59 AM | 2 (1.2%) | 0 (0.0%) |
| 9:00 AM to 9:59 AM | 29 (17.1%) | 3 (2.2%) |
| 10:00 AM to 10:59 AM | 8 (4.7%) | 5 (3.7%) |
| 11:00 AM to 11:59 AM | 6 (3.5%) | 0 (0.0%) |
| 12:00 PM to 3:59 PM | 23 (13.5%) | 25 (18.5%) |
| 4:00 PM to 11:59 PM | 8 (4.7%) | 14 (10.4%) |
| Total | 170 (100.0%) | 135 (100.0%) |
Housing Occupancy in Lakeview
Occupancy by Ownership in Lakeview
Of the total 394 dwellings in Lakeview, owner-occupied units account for 236 (59.9%), while renter-occupied units make up 158 (40.1%).
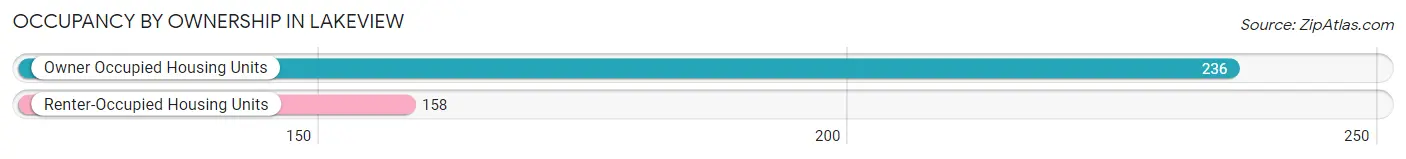
| Occupancy | # Housing Units | % Housing Units |
| Owner Occupied Housing Units | 236 | 59.9% |
| Renter-Occupied Housing Units | 158 | 40.1% |
| Total Occupied Housing Units | 394 | 100.0% |
Occupancy by Household Size in Lakeview
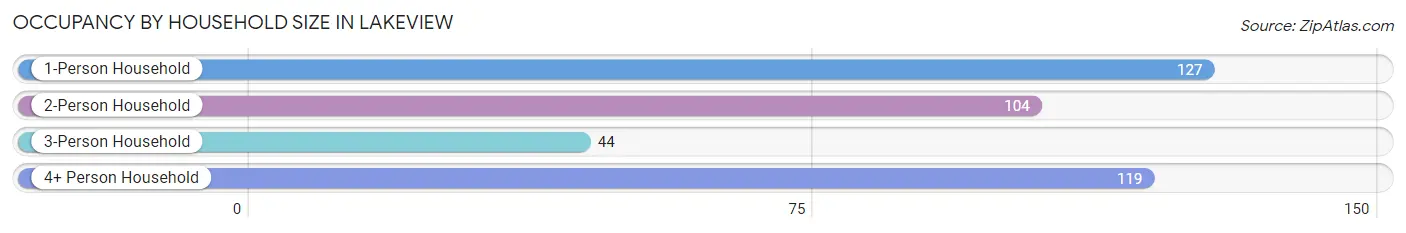
| Household Size | # Housing Units | % Housing Units |
| 1-Person Household | 127 | 32.2% |
| 2-Person Household | 104 | 26.4% |
| 3-Person Household | 44 | 11.2% |
| 4+ Person Household | 119 | 30.2% |
| Total Housing Units | 394 | 100.0% |
Occupancy by Ownership by Household Size in Lakeview
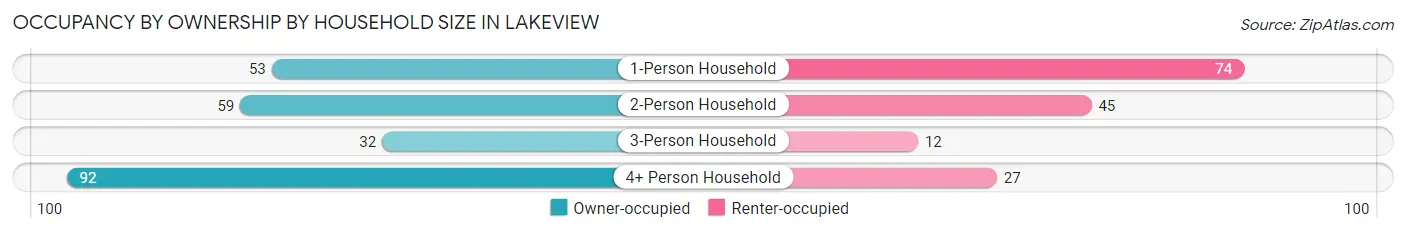
| Household Size | Owner-occupied | Renter-occupied |
| 1-Person Household | 53 (41.7%) | 74 (58.3%) |
| 2-Person Household | 59 (56.7%) | 45 (43.3%) |
| 3-Person Household | 32 (72.7%) | 12 (27.3%) |
| 4+ Person Household | 92 (77.3%) | 27 (22.7%) |
| Total Housing Units | 236 (59.9%) | 158 (40.1%) |
Occupancy by Educational Attainment in Lakeview
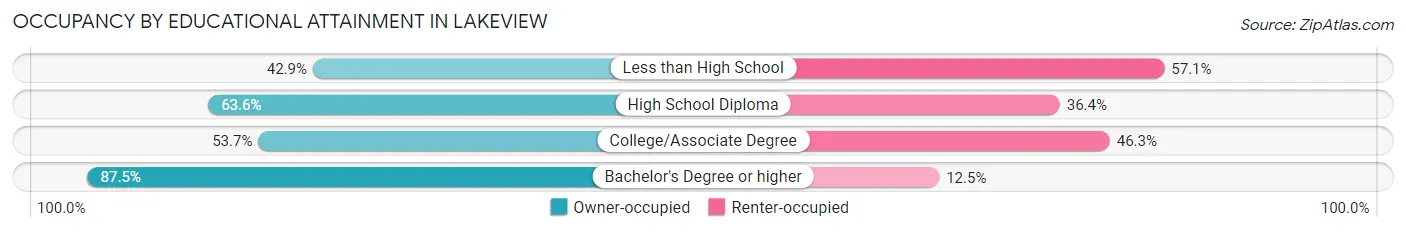
| Household Size | Owner-occupied | Renter-occupied |
| Less than High School | 18 (42.9%) | 24 (57.1%) |
| High School Diploma | 117 (63.6%) | 67 (36.4%) |
| College/Associate Degree | 73 (53.7%) | 63 (46.3%) |
| Bachelor's Degree or higher | 28 (87.5%) | 4 (12.5%) |
Occupancy by Age of Householder in Lakeview
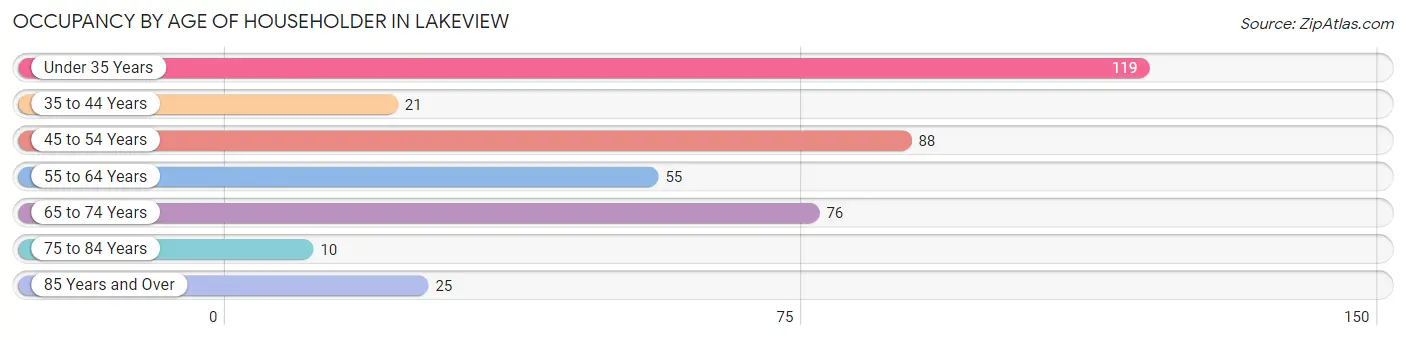
| Age Bracket | # Households | % Households |
| Under 35 Years | 119 | 30.2% |
| 35 to 44 Years | 21 | 5.3% |
| 45 to 54 Years | 88 | 22.3% |
| 55 to 64 Years | 55 | 14.0% |
| 65 to 74 Years | 76 | 19.3% |
| 75 to 84 Years | 10 | 2.5% |
| 85 Years and Over | 25 | 6.4% |
| Total | 394 | 100.0% |
Housing Finances in Lakeview
Median Income by Occupancy in Lakeview
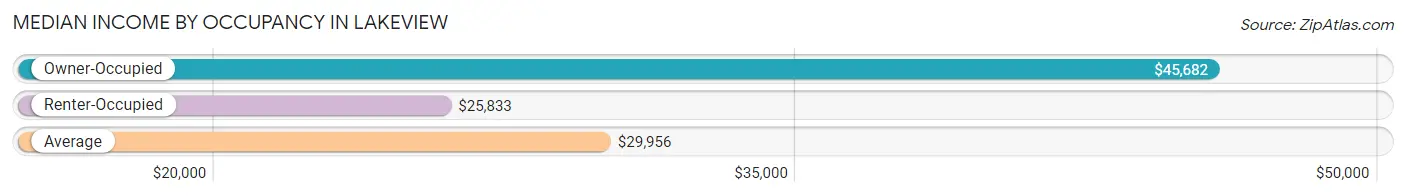
| Occupancy Type | # Households | Median Income |
| Owner-Occupied | 236 (59.9%) | $45,682 |
| Renter-Occupied | 158 (40.1%) | $25,833 |
| Average | 394 (100.0%) | $29,956 |
Occupancy by Householder Income Bracket in Lakeview
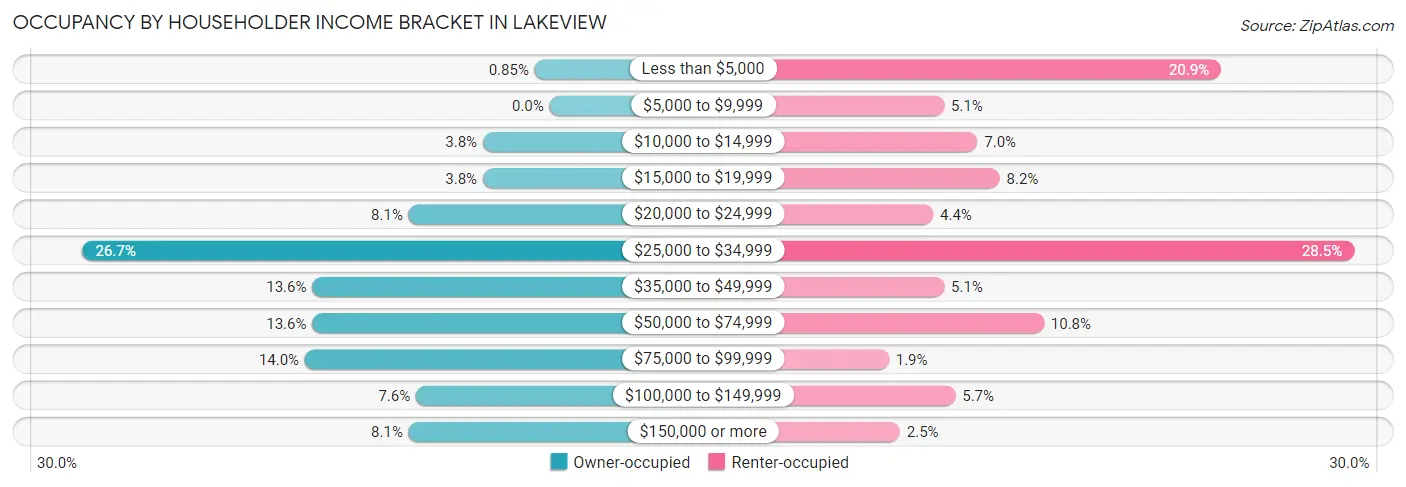
| Income Bracket | Owner-occupied | Renter-occupied |
| Less than $5,000 | 2 (0.9%) | 33 (20.9%) |
| $5,000 to $9,999 | 0 (0.0%) | 8 (5.1%) |
| $10,000 to $14,999 | 9 (3.8%) | 11 (7.0%) |
| $15,000 to $19,999 | 9 (3.8%) | 13 (8.2%) |
| $20,000 to $24,999 | 19 (8.1%) | 7 (4.4%) |
| $25,000 to $34,999 | 63 (26.7%) | 45 (28.5%) |
| $35,000 to $49,999 | 32 (13.6%) | 8 (5.1%) |
| $50,000 to $74,999 | 32 (13.6%) | 17 (10.8%) |
| $75,000 to $99,999 | 33 (14.0%) | 3 (1.9%) |
| $100,000 to $149,999 | 18 (7.6%) | 9 (5.7%) |
| $150,000 or more | 19 (8.1%) | 4 (2.5%) |
| Total | 236 (100.0%) | 158 (100.0%) |
Monthly Housing Cost Tiers in Lakeview
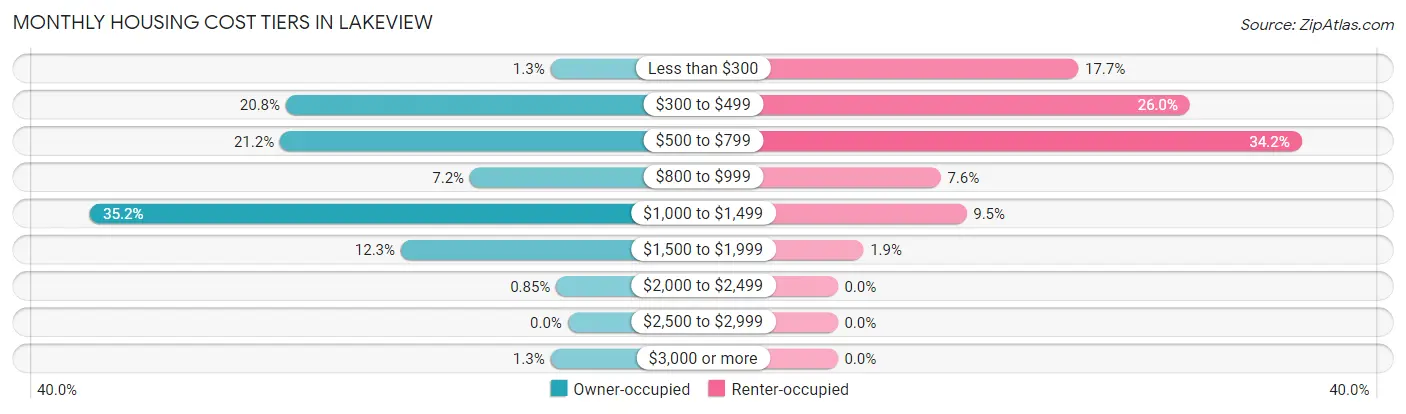
| Monthly Cost | Owner-occupied | Renter-occupied |
| Less than $300 | 3 (1.3%) | 28 (17.7%) |
| $300 to $499 | 49 (20.8%) | 41 (26.0%) |
| $500 to $799 | 50 (21.2%) | 54 (34.2%) |
| $800 to $999 | 17 (7.2%) | 12 (7.6%) |
| $1,000 to $1,499 | 83 (35.2%) | 15 (9.5%) |
| $1,500 to $1,999 | 29 (12.3%) | 3 (1.9%) |
| $2,000 to $2,499 | 2 (0.9%) | 0 (0.0%) |
| $2,500 to $2,999 | 0 (0.0%) | 0 (0.0%) |
| $3,000 or more | 3 (1.3%) | 0 (0.0%) |
| Total | 236 (100.0%) | 158 (100.0%) |
Physical Housing Characteristics in Lakeview
Housing Structures in Lakeview
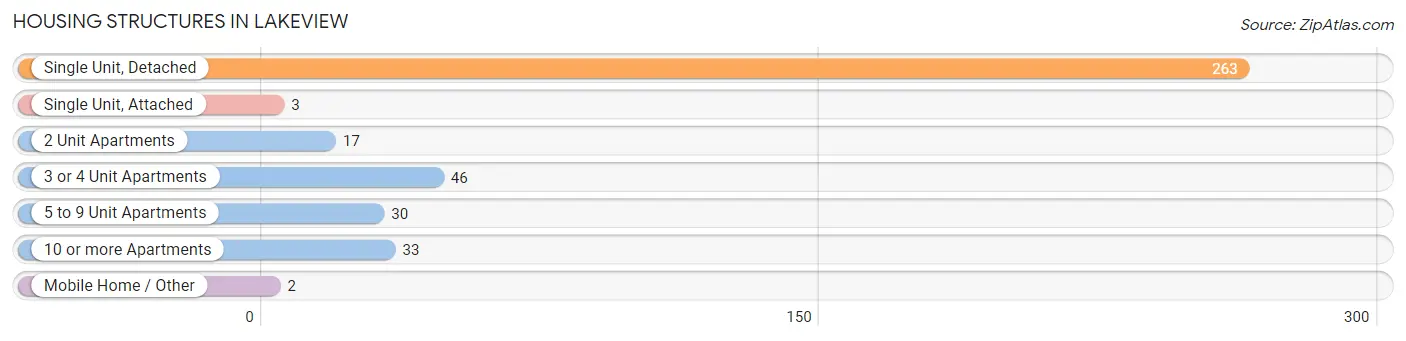
| Structure Type | # Housing Units | % Housing Units |
| Single Unit, Detached | 263 | 66.7% |
| Single Unit, Attached | 3 | 0.8% |
| 2 Unit Apartments | 17 | 4.3% |
| 3 or 4 Unit Apartments | 46 | 11.7% |
| 5 to 9 Unit Apartments | 30 | 7.6% |
| 10 or more Apartments | 33 | 8.4% |
| Mobile Home / Other | 2 | 0.5% |
| Total | 394 | 100.0% |
Housing Structures by Occupancy in Lakeview
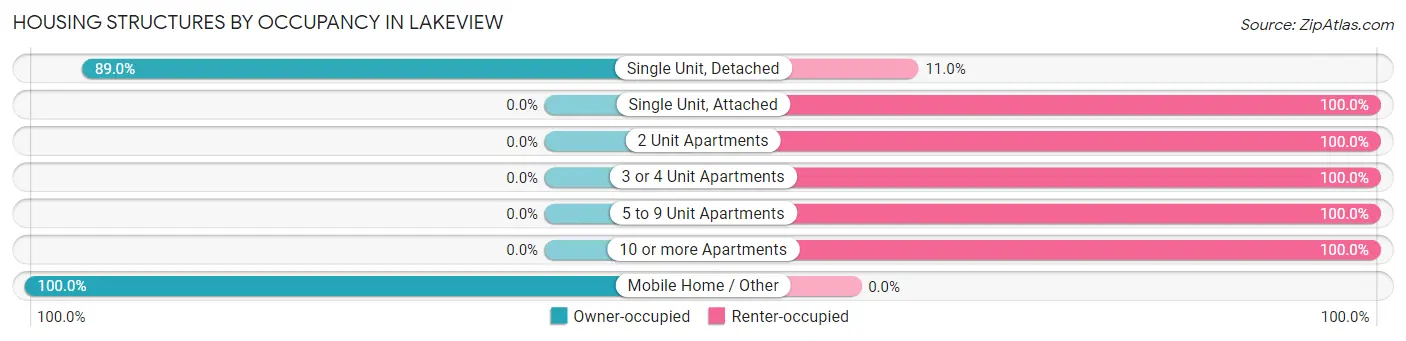
| Structure Type | Owner-occupied | Renter-occupied |
| Single Unit, Detached | 234 (89.0%) | 29 (11.0%) |
| Single Unit, Attached | 0 (0.0%) | 3 (100.0%) |
| 2 Unit Apartments | 0 (0.0%) | 17 (100.0%) |
| 3 or 4 Unit Apartments | 0 (0.0%) | 46 (100.0%) |
| 5 to 9 Unit Apartments | 0 (0.0%) | 30 (100.0%) |
| 10 or more Apartments | 0 (0.0%) | 33 (100.0%) |
| Mobile Home / Other | 2 (100.0%) | 0 (0.0%) |
| Total | 236 (59.9%) | 158 (40.1%) |
Housing Structures by Number of Rooms in Lakeview
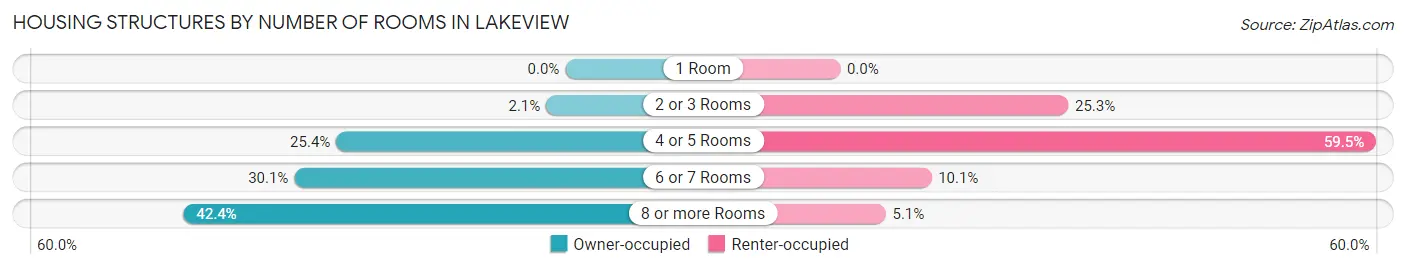
| Number of Rooms | Owner-occupied | Renter-occupied |
| 1 Room | 0 (0.0%) | 0 (0.0%) |
| 2 or 3 Rooms | 5 (2.1%) | 40 (25.3%) |
| 4 or 5 Rooms | 60 (25.4%) | 94 (59.5%) |
| 6 or 7 Rooms | 71 (30.1%) | 16 (10.1%) |
| 8 or more Rooms | 100 (42.4%) | 8 (5.1%) |
| Total | 236 (100.0%) | 158 (100.0%) |
Housing Structure by Heating Type in Lakeview
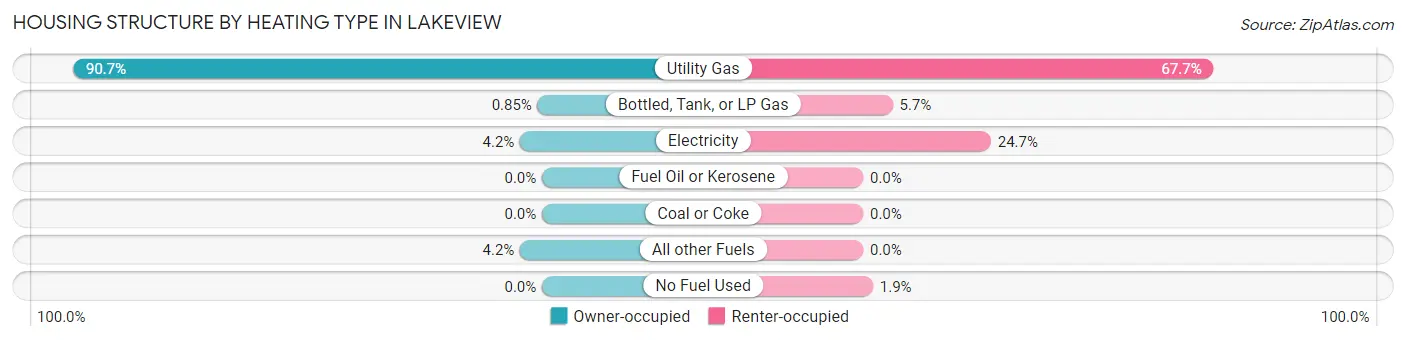
| Heating Type | Owner-occupied | Renter-occupied |
| Utility Gas | 214 (90.7%) | 107 (67.7%) |
| Bottled, Tank, or LP Gas | 2 (0.9%) | 9 (5.7%) |
| Electricity | 10 (4.2%) | 39 (24.7%) |
| Fuel Oil or Kerosene | 0 (0.0%) | 0 (0.0%) |
| Coal or Coke | 0 (0.0%) | 0 (0.0%) |
| All other Fuels | 10 (4.2%) | 0 (0.0%) |
| No Fuel Used | 0 (0.0%) | 3 (1.9%) |
| Total | 236 (100.0%) | 158 (100.0%) |
Household Vehicle Usage in Lakeview
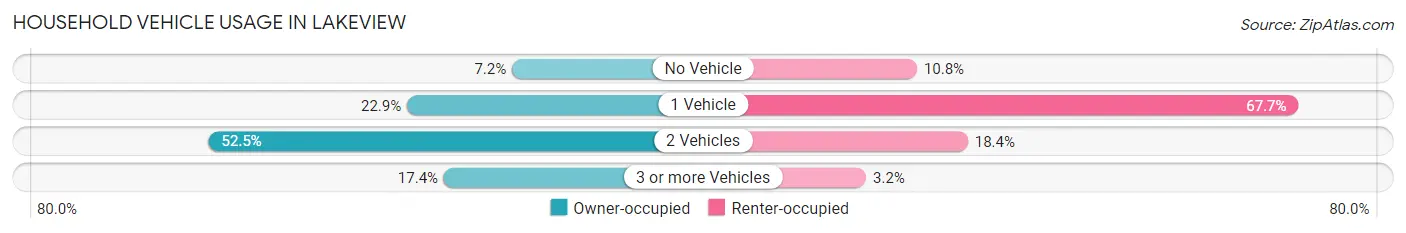
| Vehicles per Household | Owner-occupied | Renter-occupied |
| No Vehicle | 17 (7.2%) | 17 (10.8%) |
| 1 Vehicle | 54 (22.9%) | 107 (67.7%) |
| 2 Vehicles | 124 (52.5%) | 29 (18.3%) |
| 3 or more Vehicles | 41 (17.4%) | 5 (3.2%) |
| Total | 236 (100.0%) | 158 (100.0%) |
Real Estate & Mortgages in Lakeview
Real Estate and Mortgage Overview in Lakeview
| Characteristic | Without Mortgage | With Mortgage |
| Housing Units | 93 | 143 |
| Median Property Value | $107,600 | $153,000 |
| Median Household Income | $39,464 | $10 |
| Monthly Housing Costs | $485 | $3 |
| Real Estate Taxes | $1,720 | $0 |
Property Value by Mortgage Status in Lakeview
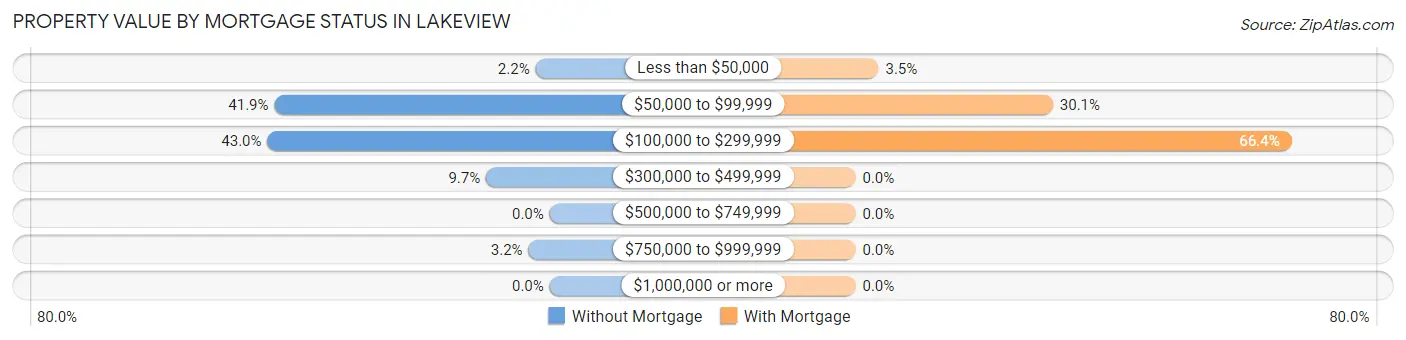
| Property Value | Without Mortgage | With Mortgage |
| Less than $50,000 | 2 (2.1%) | 5 (3.5%) |
| $50,000 to $99,999 | 39 (41.9%) | 43 (30.1%) |
| $100,000 to $299,999 | 40 (43.0%) | 95 (66.4%) |
| $300,000 to $499,999 | 9 (9.7%) | 0 (0.0%) |
| $500,000 to $749,999 | 0 (0.0%) | 0 (0.0%) |
| $750,000 to $999,999 | 3 (3.2%) | 0 (0.0%) |
| $1,000,000 or more | 0 (0.0%) | 0 (0.0%) |
| Total | 93 (100.0%) | 143 (100.0%) |
Household Income by Mortgage Status in Lakeview
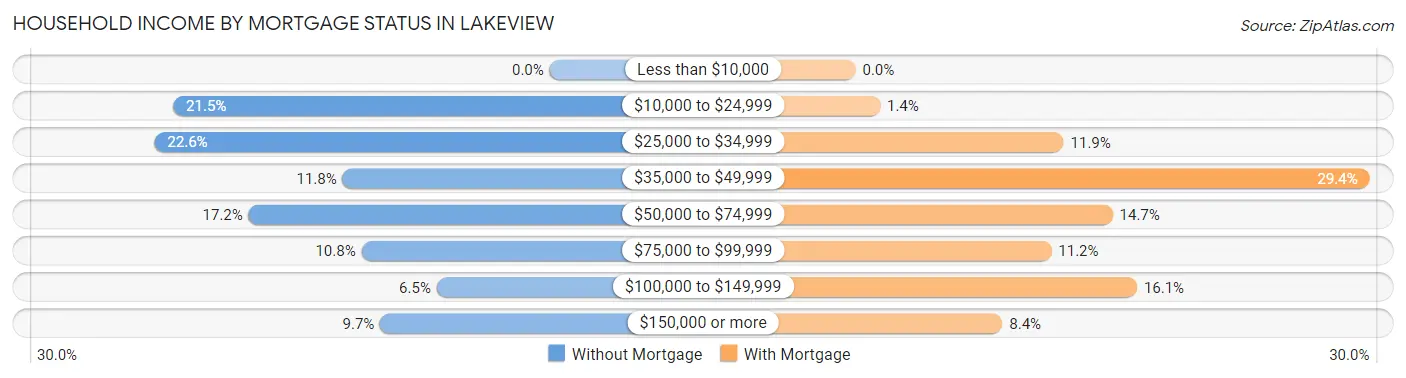
| Household Income | Without Mortgage | With Mortgage |
| Less than $10,000 | 0 (0.0%) | 0 (0.0%) |
| $10,000 to $24,999 | 20 (21.5%) | 2 (1.4%) |
| $25,000 to $34,999 | 21 (22.6%) | 17 (11.9%) |
| $35,000 to $49,999 | 11 (11.8%) | 42 (29.4%) |
| $50,000 to $74,999 | 16 (17.2%) | 21 (14.7%) |
| $75,000 to $99,999 | 10 (10.7%) | 16 (11.2%) |
| $100,000 to $149,999 | 6 (6.5%) | 23 (16.1%) |
| $150,000 or more | 9 (9.7%) | 12 (8.4%) |
| Total | 93 (100.0%) | 143 (100.0%) |
Property Value to Household Income Ratio in Lakeview
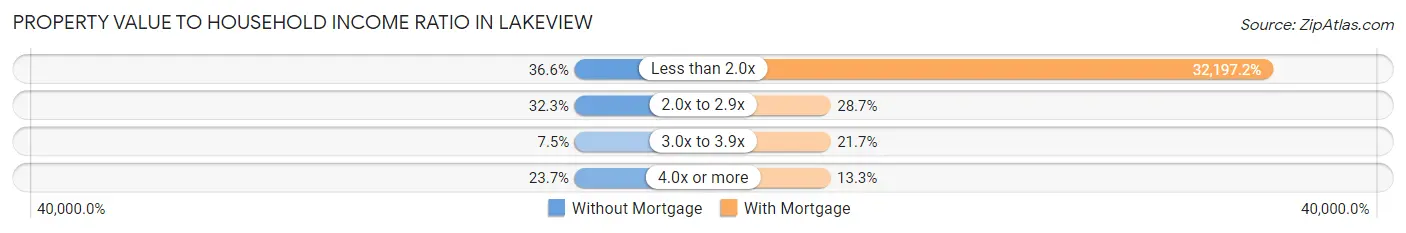
| Value-to-Income Ratio | Without Mortgage | With Mortgage |
| Less than 2.0x | 34 (36.6%) | 46,042 (32,197.2%) |
| 2.0x to 2.9x | 30 (32.3%) | 41 (28.7%) |
| 3.0x to 3.9x | 7 (7.5%) | 31 (21.7%) |
| 4.0x or more | 22 (23.7%) | 19 (13.3%) |
| Total | 93 (100.0%) | 143 (100.0%) |
Real Estate Taxes by Mortgage Status in Lakeview
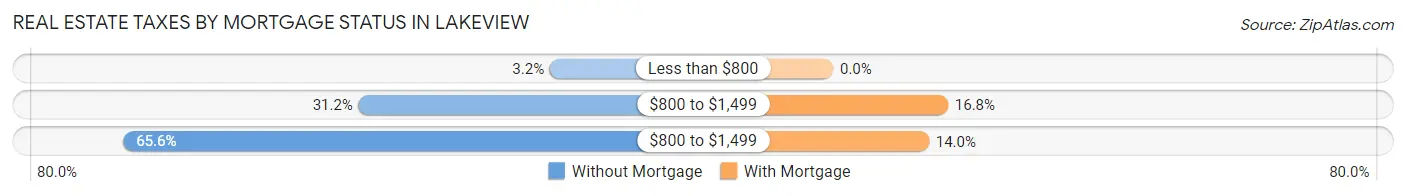
| Property Taxes | Without Mortgage | With Mortgage |
| Less than $800 | 3 (3.2%) | 0 (0.0%) |
| $800 to $1,499 | 29 (31.2%) | 24 (16.8%) |
| $800 to $1,499 | 61 (65.6%) | 20 (14.0%) |
| Total | 93 (100.0%) | 143 (100.0%) |
Health & Disability in Lakeview
Health Insurance Coverage by Age in Lakeview
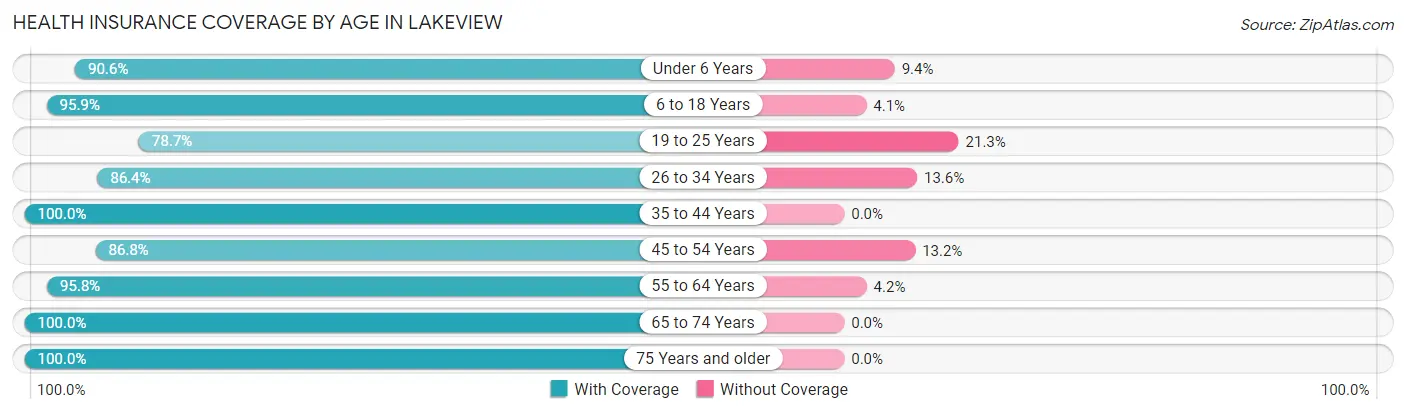
| Age Bracket | With Coverage | Without Coverage |
| Under 6 Years | 77 (90.6%) | 8 (9.4%) |
| 6 to 18 Years | 140 (95.9%) | 6 (4.1%) |
| 19 to 25 Years | 107 (78.7%) | 29 (21.3%) |
| 26 to 34 Years | 153 (86.4%) | 24 (13.6%) |
| 35 to 44 Years | 64 (100.0%) | 0 (0.0%) |
| 45 to 54 Years | 105 (86.8%) | 16 (13.2%) |
| 55 to 64 Years | 92 (95.8%) | 4 (4.2%) |
| 65 to 74 Years | 109 (100.0%) | 0 (0.0%) |
| 75 Years and older | 63 (100.0%) | 0 (0.0%) |
| Total | 910 (91.3%) | 87 (8.7%) |
Health Insurance Coverage by Citizenship Status in Lakeview
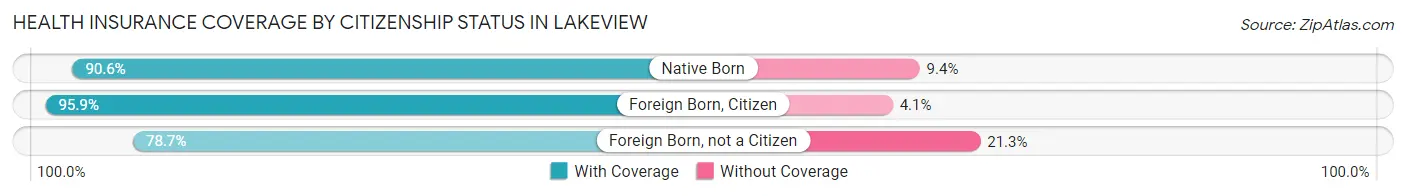
| Citizenship Status | With Coverage | Without Coverage |
| Native Born | 77 (90.6%) | 8 (9.4%) |
| Foreign Born, Citizen | 140 (95.9%) | 6 (4.1%) |
| Foreign Born, not a Citizen | 107 (78.7%) | 29 (21.3%) |
Health Insurance Coverage by Household Income in Lakeview
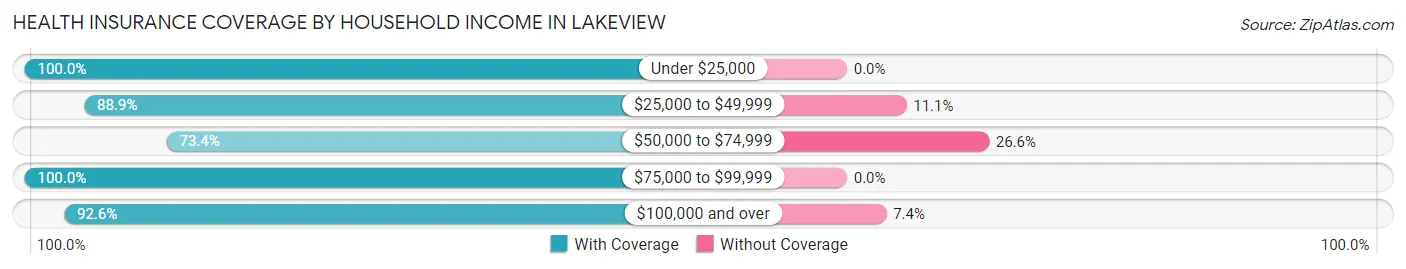
| Household Income | With Coverage | Without Coverage |
| Under $25,000 | 195 (100.0%) | 0 (0.0%) |
| $25,000 to $49,999 | 359 (88.9%) | 45 (11.1%) |
| $50,000 to $74,999 | 80 (73.4%) | 29 (26.6%) |
| $75,000 to $99,999 | 110 (100.0%) | 0 (0.0%) |
| $100,000 and over | 163 (92.6%) | 13 (7.4%) |
Public vs Private Health Insurance Coverage by Age in Lakeview
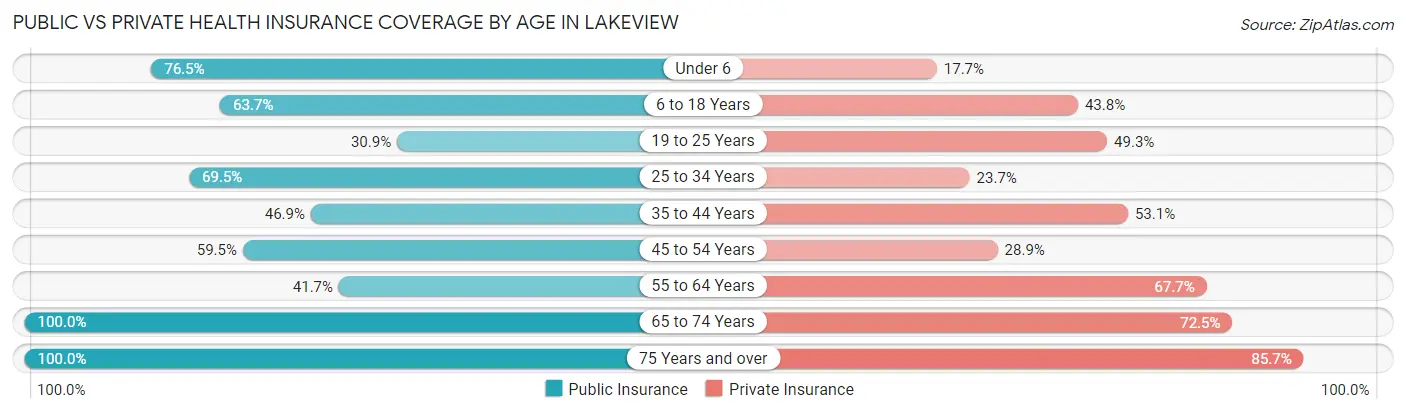
| Age Bracket | Public Insurance | Private Insurance |
| Under 6 | 65 (76.5%) | 15 (17.6%) |
| 6 to 18 Years | 93 (63.7%) | 64 (43.8%) |
| 19 to 25 Years | 42 (30.9%) | 67 (49.3%) |
| 25 to 34 Years | 123 (69.5%) | 42 (23.7%) |
| 35 to 44 Years | 30 (46.9%) | 34 (53.1%) |
| 45 to 54 Years | 72 (59.5%) | 35 (28.9%) |
| 55 to 64 Years | 40 (41.7%) | 65 (67.7%) |
| 65 to 74 Years | 109 (100.0%) | 79 (72.5%) |
| 75 Years and over | 63 (100.0%) | 54 (85.7%) |
| Total | 637 (63.9%) | 455 (45.6%) |
Disability Status by Sex by Age in Lakeview
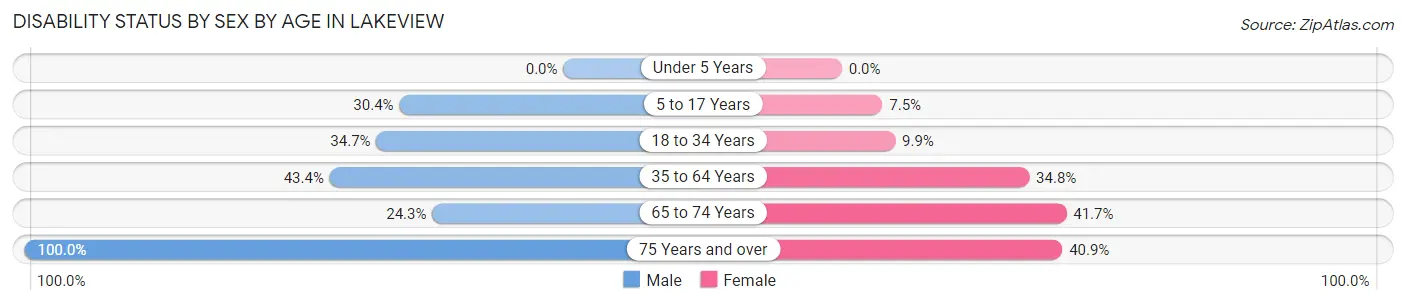
| Age Bracket | Male | Female |
| Under 5 Years | 0 (0.0%) | 0 (0.0%) |
| 5 to 17 Years | 21 (30.4%) | 7 (7.5%) |
| 18 to 34 Years | 76 (34.7%) | 10 (9.9%) |
| 35 to 64 Years | 62 (43.4%) | 48 (34.8%) |
| 65 to 74 Years | 9 (24.3%) | 30 (41.7%) |
| 75 Years and over | 19 (100.0%) | 18 (40.9%) |
Disability Class by Sex by Age in Lakeview
Disability Class: Hearing Difficulty
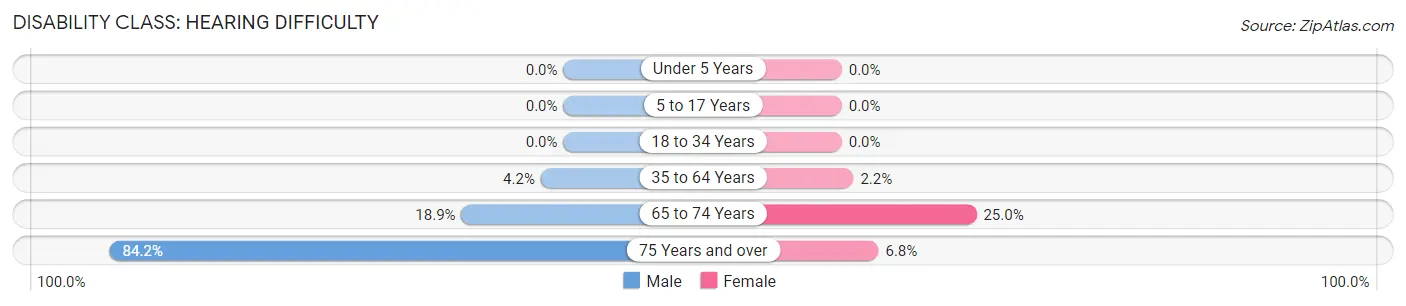
| Age Bracket | Male | Female |
| Under 5 Years | 0 (0.0%) | 0 (0.0%) |
| 5 to 17 Years | 0 (0.0%) | 0 (0.0%) |
| 18 to 34 Years | 0 (0.0%) | 0 (0.0%) |
| 35 to 64 Years | 6 (4.2%) | 3 (2.2%) |
| 65 to 74 Years | 7 (18.9%) | 18 (25.0%) |
| 75 Years and over | 16 (84.2%) | 3 (6.8%) |
Disability Class: Vision Difficulty
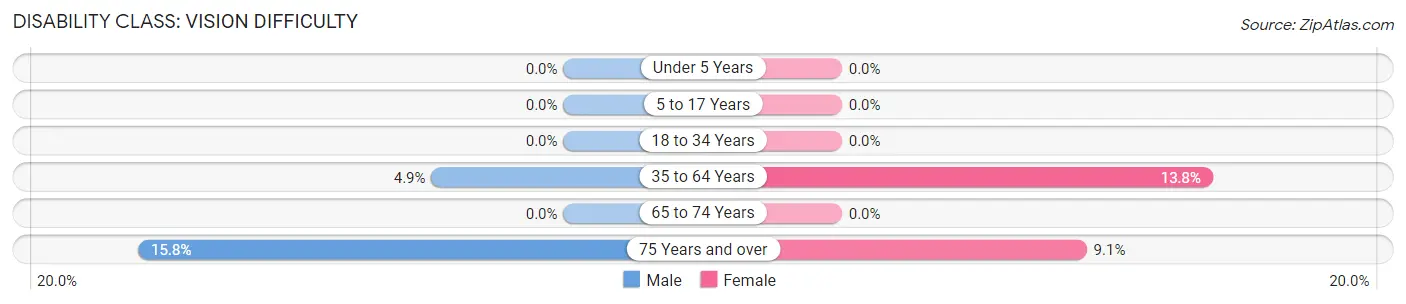
| Age Bracket | Male | Female |
| Under 5 Years | 0 (0.0%) | 0 (0.0%) |
| 5 to 17 Years | 0 (0.0%) | 0 (0.0%) |
| 18 to 34 Years | 0 (0.0%) | 0 (0.0%) |
| 35 to 64 Years | 7 (4.9%) | 19 (13.8%) |
| 65 to 74 Years | 0 (0.0%) | 0 (0.0%) |
| 75 Years and over | 3 (15.8%) | 4 (9.1%) |
Disability Class: Cognitive Difficulty
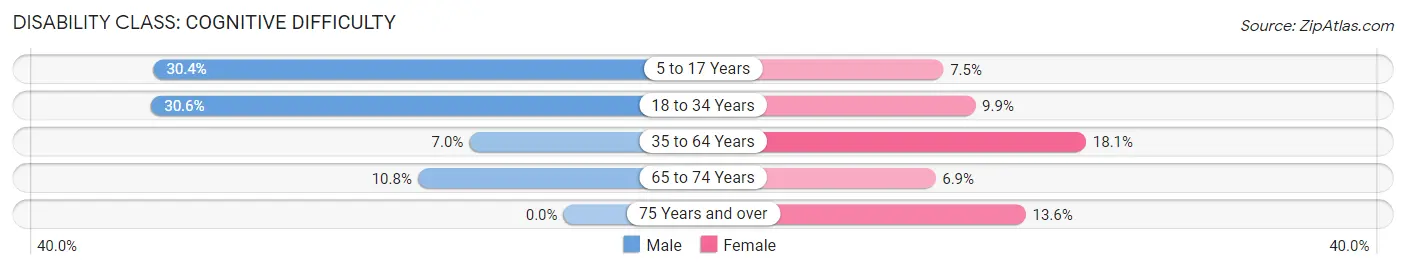
| Age Bracket | Male | Female |
| 5 to 17 Years | 21 (30.4%) | 7 (7.5%) |
| 18 to 34 Years | 67 (30.6%) | 10 (9.9%) |
| 35 to 64 Years | 10 (7.0%) | 25 (18.1%) |
| 65 to 74 Years | 4 (10.8%) | 5 (6.9%) |
| 75 Years and over | 0 (0.0%) | 6 (13.6%) |
Disability Class: Ambulatory Difficulty
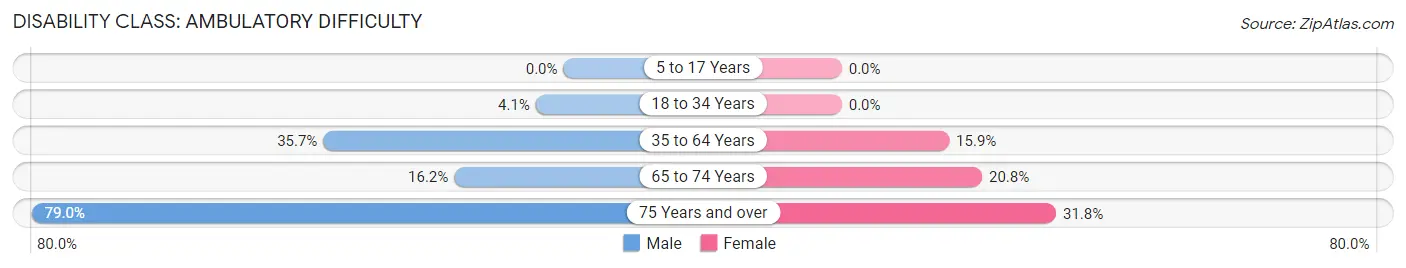
| Age Bracket | Male | Female |
| 5 to 17 Years | 0 (0.0%) | 0 (0.0%) |
| 18 to 34 Years | 9 (4.1%) | 0 (0.0%) |
| 35 to 64 Years | 51 (35.7%) | 22 (15.9%) |
| 65 to 74 Years | 6 (16.2%) | 15 (20.8%) |
| 75 Years and over | 15 (78.9%) | 14 (31.8%) |
Disability Class: Self-Care Difficulty
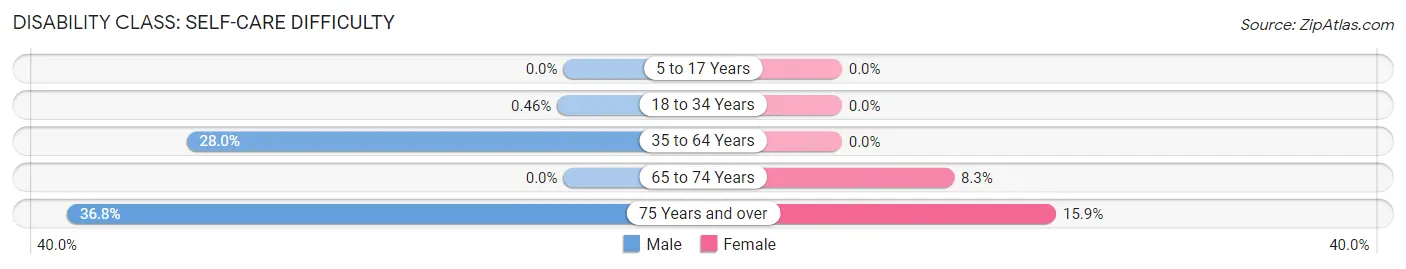
| Age Bracket | Male | Female |
| 5 to 17 Years | 0 (0.0%) | 0 (0.0%) |
| 18 to 34 Years | 1 (0.5%) | 0 (0.0%) |
| 35 to 64 Years | 40 (28.0%) | 0 (0.0%) |
| 65 to 74 Years | 0 (0.0%) | 6 (8.3%) |
| 75 Years and over | 7 (36.8%) | 7 (15.9%) |
Technology Access in Lakeview
Computing Device Access in Lakeview
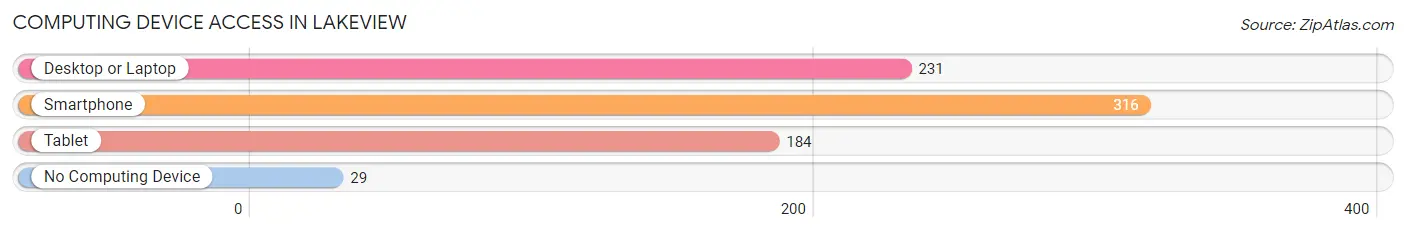
| Device Type | # Households | % Households |
| Desktop or Laptop | 231 | 58.6% |
| Smartphone | 316 | 80.2% |
| Tablet | 184 | 46.7% |
| No Computing Device | 29 | 7.4% |
| Total | 394 | 100.0% |
Internet Access in Lakeview
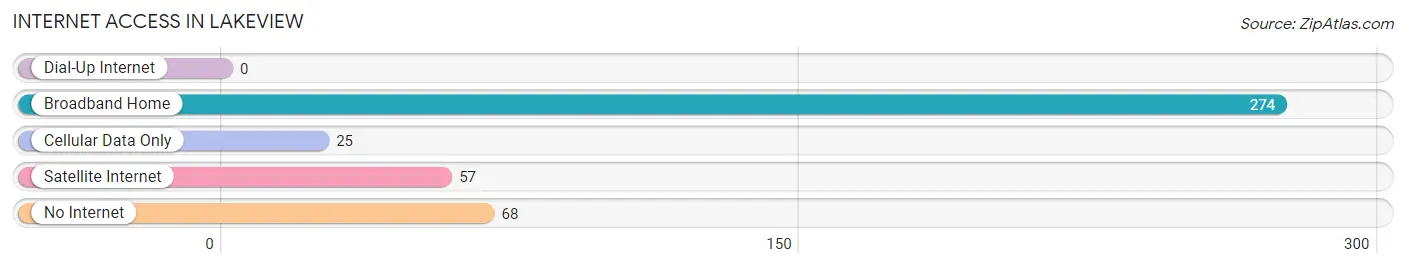
| Internet Type | # Households | % Households |
| Dial-Up Internet | 0 | 0.0% |
| Broadband Home | 274 | 69.5% |
| Cellular Data Only | 25 | 6.4% |
| Satellite Internet | 57 | 14.5% |
| No Internet | 68 | 17.3% |
| Total | 394 | 100.0% |
Lakeview Summary
History
The area now known as Lakeview, Michigan was first settled in the early 1800s by a group of pioneers from New York. The area was originally known as "Big Rapids" due to its proximity to the Grand River. The first settlers were mostly farmers and loggers, and the area was largely rural until the late 1800s.
In 1871, the village of Lakeview was officially incorporated. The village was named for its proximity to the lake, which was a popular spot for fishing and swimming. The village quickly grew, and by the early 1900s, it had become a popular tourist destination. The village was home to several hotels, restaurants, and other businesses catering to tourists.
In the 1920s, the village began to experience a period of growth and development. The village was connected to the rest of Michigan by the Grand Rapids and Indiana Railroad, and the village was also connected to the rest of the country by the Pere Marquette Railroad. This allowed for increased trade and commerce, and the village began to experience a period of prosperity.
The village continued to grow throughout the 20th century, and by the year 2000, it had a population of over 2,000 people. The village is now home to several businesses, including a grocery store, a hardware store, and several restaurants.
Geography
Lakeview is located in Montcalm County, Michigan, in the central part of the state. The village is situated on the banks of the Grand River, and is surrounded by rolling hills and farmland. The village is located approximately 30 miles north of Grand Rapids, and is about an hour and a half drive from Detroit.
The village is located in a temperate climate, with hot summers and cold winters. The average temperature in the summer is around 75 degrees Fahrenheit, and the average temperature in the winter is around 25 degrees Fahrenheit. The village receives an average of 40 inches of precipitation per year.
Economy
The economy of Lakeview is largely based on agriculture and tourism. The village is home to several farms, which produce a variety of crops, including corn, soybeans, and wheat. The village is also home to several restaurants, hotels, and other businesses catering to tourists.
The village is also home to several manufacturing companies, including a furniture factory and a plastics factory. These companies provide employment for many of the village's residents.
Demographics
As of the 2010 census, the population of Lakeview was 2,093. The village is predominantly white, with 92.3% of the population identifying as white. The village is also home to a small Hispanic population, with 4.3% of the population identifying as Hispanic or Latino.
The median household income in Lakeview is $41,944, and the median home value is $90,000. The village has a poverty rate of 16.3%, and the unemployment rate is 6.2%. The village is home to several churches, and the village is served by the Lakeview Public Schools.
Common Questions
What is Per Capita Income in Lakeview?
Per Capita income in Lakeview is $21,510.
What is the Median Family Income in Lakeview?
Median Family Income in Lakeview is $41,477.
What is the Median Household income in Lakeview?
Median Household Income in Lakeview is $29,956.
What is Income or Wage Gap in Lakeview?
Income or Wage Gap in Lakeview is 13.1%.
Women in Lakeview earn 86.9 cents for every dollar earned by a man.
What is Inequality or Gini Index in Lakeview?
Inequality or Gini Index in Lakeview is 0.48.
What is the Total Population of Lakeview?
Total Population of Lakeview is 1,027.
What is the Total Male Population of Lakeview?
Total Male Population of Lakeview is 537.
What is the Total Female Population of Lakeview?
Total Female Population of Lakeview is 490.
What is the Ratio of Males per 100 Females in Lakeview?
There are 109.59 Males per 100 Females in Lakeview.
What is the Ratio of Females per 100 Males in Lakeview?
There are 91.25 Females per 100 Males in Lakeview.
What is the Median Population Age in Lakeview?
Median Population Age in Lakeview is 31.8 Years.
What is the Average Family Size in Lakeview
Average Family Size in Lakeview is 2.9 People.
What is the Average Household Size in Lakeview
Average Household Size in Lakeview is 2.5 People.
How Large is the Labor Force in Lakeview?
There are 390 People in the Labor Forcein in Lakeview.
What is the Percentage of People in the Labor Force in Lakeview?
47.4% of People are in the Labor Force in Lakeview.
What is the Unemployment Rate in Lakeview?
Unemployment Rate in Lakeview is 14.4%.