Vermontville, MI Map & Demographics
Vermontville Map
Vermontville Overview
$25,553
PER CAPITA INCOME
$61,250
AVG FAMILY INCOME
$46,797
AVG HOUSEHOLD INCOME
8.5%
WAGE / INCOME GAP [ % ]
91.5¢/ $1
WAGE / INCOME GAP [ $ ]
0.40
INEQUALITY / GINI INDEX
717
TOTAL POPULATION
352
MALE POPULATION
365
FEMALE POPULATION
96.44
MALES / 100 FEMALES
103.69
FEMALES / 100 MALES
34.5
MEDIAN AGE
3.1
AVG FAMILY SIZE
2.5
AVG HOUSEHOLD SIZE
345
LABOR FORCE [ PEOPLE ]
63.7%
PERCENT IN LABOR FORCE
6.1%
UNEMPLOYMENT RATE
Vermontville Zip Codes
Vermontville Area Codes
Income in Vermontville
Income Overview in Vermontville
Per Capita Income in Vermontville is $25,553, while median incomes of families and households are $61,250 and $46,797 respectively.
| Characteristic | Number | Measure |
| Per Capita Income | 717 | $25,553 |
| Median Family Income | 176 | $61,250 |
| Mean Family Income | 176 | $71,634 |
| Median Household Income | 293 | $46,797 |
| Mean Household Income | 293 | $60,484 |
| Income Deficit | 176 | $0 |
| Wage / Income Gap (%) | 717 | 8.54% |
| Wage / Income Gap ($) | 717 | 91.46¢ per $1 |
| Gini / Inequality Index | 717 | 0.40 |
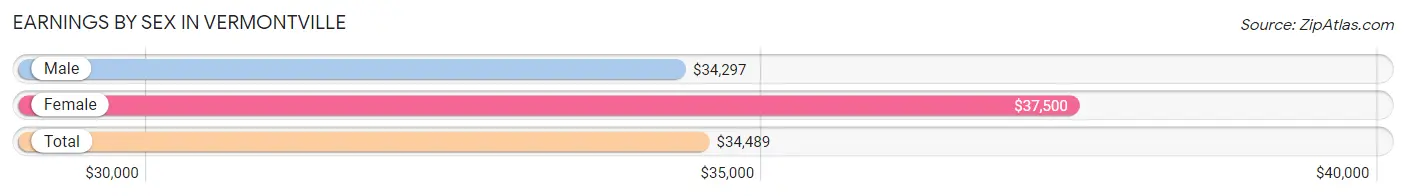
Earnings by Sex in Vermontville
Average Earnings in Vermontville are $34,489, $34,297 for men and $37,500 for women, a difference of 8.5%.
| Sex | Number | Average Earnings |
| Male | 179 (51.0%) | $34,297 |
| Female | 172 (49.0%) | $37,500 |
| Total | 351 (100.0%) | $34,489 |
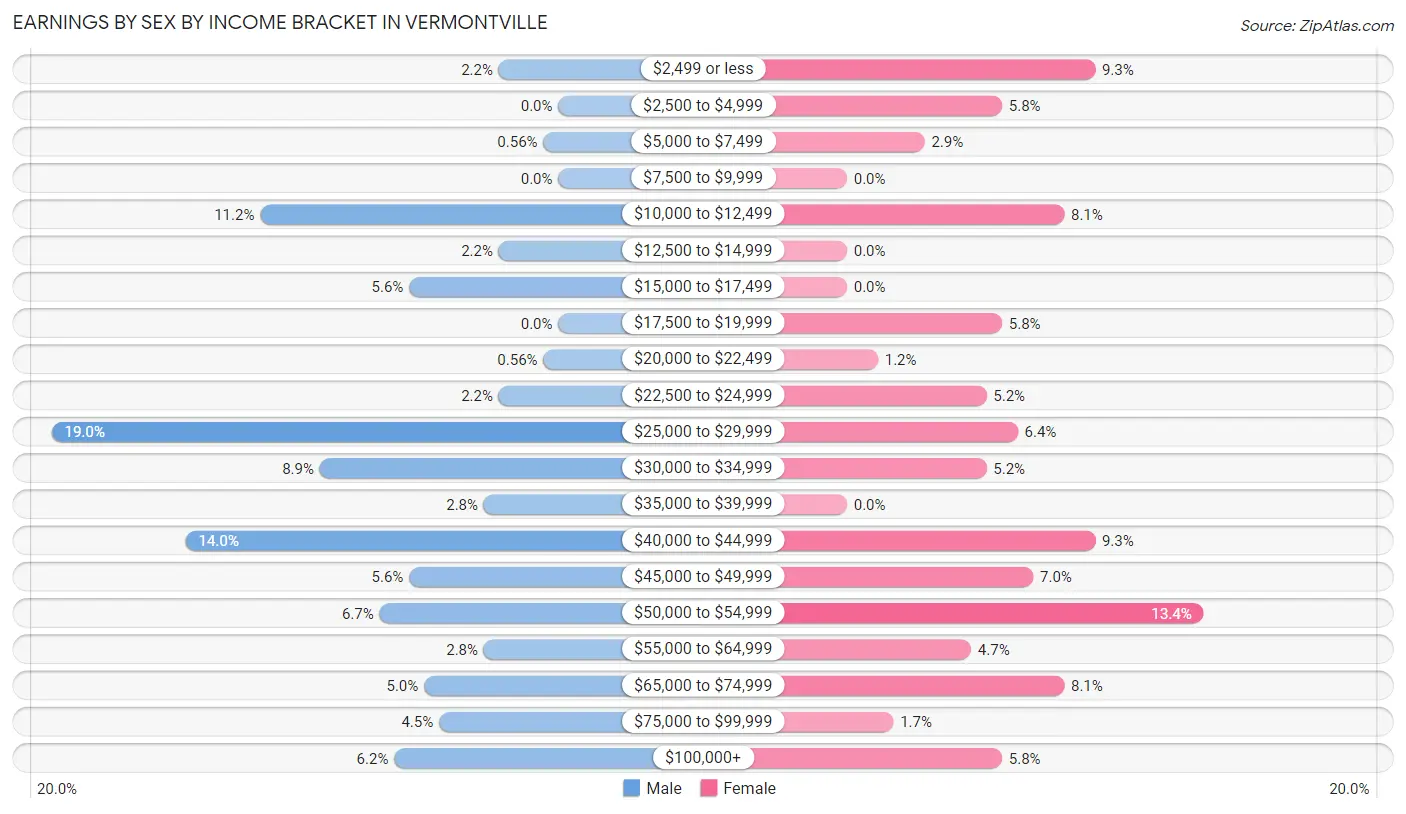
Earnings by Sex by Income Bracket in Vermontville
The most common earnings brackets in Vermontville are $25,000 to $29,999 for men (34 | 19.0%) and $50,000 to $54,999 for women (23 | 13.4%).
| Income | Male | Female |
| $2,499 or less | 4 (2.2%) | 16 (9.3%) |
| $2,500 to $4,999 | 0 (0.0%) | 10 (5.8%) |
| $5,000 to $7,499 | 1 (0.6%) | 5 (2.9%) |
| $7,500 to $9,999 | 0 (0.0%) | 0 (0.0%) |
| $10,000 to $12,499 | 20 (11.2%) | 14 (8.1%) |
| $12,500 to $14,999 | 4 (2.2%) | 0 (0.0%) |
| $15,000 to $17,499 | 10 (5.6%) | 0 (0.0%) |
| $17,500 to $19,999 | 0 (0.0%) | 10 (5.8%) |
| $20,000 to $22,499 | 1 (0.6%) | 2 (1.2%) |
| $22,500 to $24,999 | 4 (2.2%) | 9 (5.2%) |
| $25,000 to $29,999 | 34 (19.0%) | 11 (6.4%) |
| $30,000 to $34,999 | 16 (8.9%) | 9 (5.2%) |
| $35,000 to $39,999 | 5 (2.8%) | 0 (0.0%) |
| $40,000 to $44,999 | 25 (14.0%) | 16 (9.3%) |
| $45,000 to $49,999 | 10 (5.6%) | 12 (7.0%) |
| $50,000 to $54,999 | 12 (6.7%) | 23 (13.4%) |
| $55,000 to $64,999 | 5 (2.8%) | 8 (4.6%) |
| $65,000 to $74,999 | 9 (5.0%) | 14 (8.1%) |
| $75,000 to $99,999 | 8 (4.5%) | 3 (1.7%) |
| $100,000+ | 11 (6.1%) | 10 (5.8%) |
| Total | 179 (100.0%) | 172 (100.0%) |
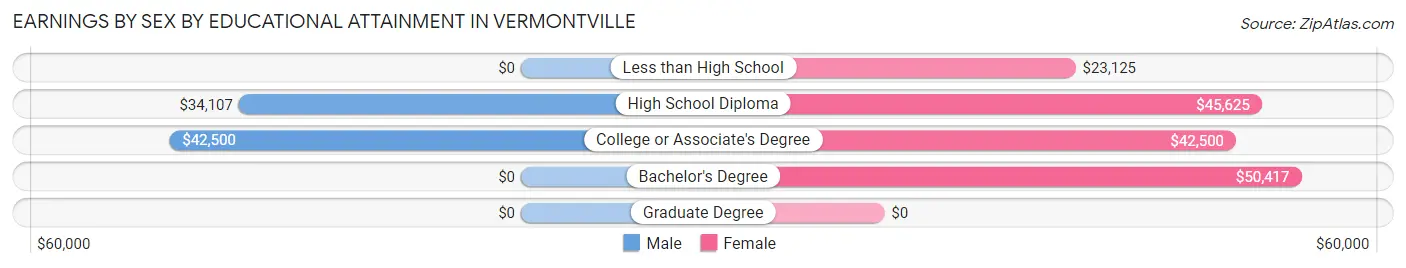
Earnings by Sex by Educational Attainment in Vermontville
Average earnings in Vermontville are $34,808 for men and $42,321 for women, a difference of 17.7%. Men with an educational attainment of college or associate's degree enjoy the highest average annual earnings of $42,500, while those with high school diploma education earn the least with $34,107. Women with an educational attainment of bachelor's degree earn the most with the average annual earnings of $50,417, while those with less than high school education have the smallest earnings of $23,125.
| Educational Attainment | Male Income | Female Income |
| Less than High School | - | - |
| High School Diploma | $34,107 | $45,625 |
| College or Associate's Degree | $42,500 | $42,500 |
| Bachelor's Degree | - | - |
| Graduate Degree | - | - |
| Total | $34,808 | $42,321 |
Family Income in Vermontville
Family Income Brackets in Vermontville
According to the Vermontville family income data, there are 38 families falling into the $50,000 to $74,999 income range, which is the most common income bracket and makes up 21.6% of all families. Conversely, the $10,000 to $14,999 income bracket is the least frequent group with only 2 families (1.1%) belonging to this category.
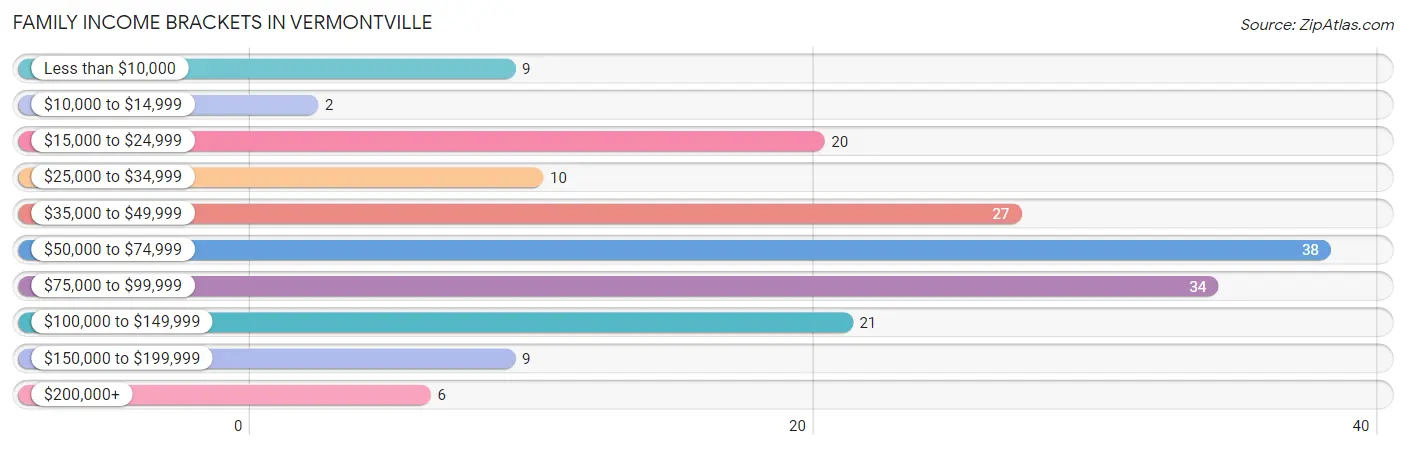
| Income Bracket | # Families | % Families |
| Less than $10,000 | 9 | 5.1% |
| $10,000 to $14,999 | 2 | 1.1% |
| $15,000 to $24,999 | 20 | 11.4% |
| $25,000 to $34,999 | 10 | 5.7% |
| $35,000 to $49,999 | 27 | 15.3% |
| $50,000 to $74,999 | 38 | 21.6% |
| $75,000 to $99,999 | 34 | 19.3% |
| $100,000 to $149,999 | 21 | 11.9% |
| $150,000 to $199,999 | 9 | 5.1% |
| $200,000+ | 6 | 3.4% |
Family Income by Famaliy Size in Vermontville
2-person families (79 | 44.9%) account for the highest median family income in Vermontville with $63,281 per family, while 2-person families (79 | 44.9%) have the highest median income of $31,640 per family member.
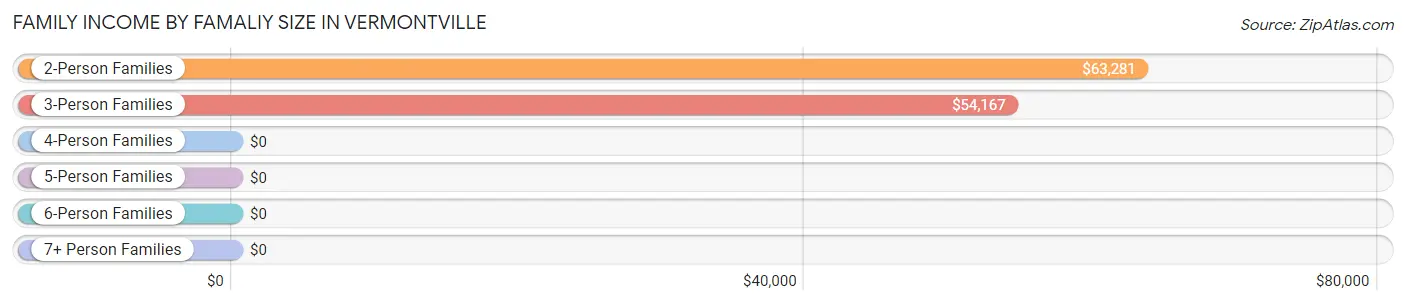
| Income Bracket | # Families | Median Income |
| 2-Person Families | 79 (44.9%) | $63,281 |
| 3-Person Families | 34 (19.3%) | $54,167 |
| 4-Person Families | 39 (22.2%) | $0 |
| 5-Person Families | 19 (10.8%) | $0 |
| 6-Person Families | 5 (2.8%) | $0 |
| 7+ Person Families | 0 (0.0%) | $0 |
| Total | 176 (100.0%) | $61,250 |
Family Income by Number of Earners in Vermontville
The median family income in Vermontville is $61,250, with families comprising 3+ earners (11) having the highest median family income of $142,813, while families with 1 earner (75) have the lowest median family income of $40,625, accounting for 6.2% and 42.6% of families, respectively.
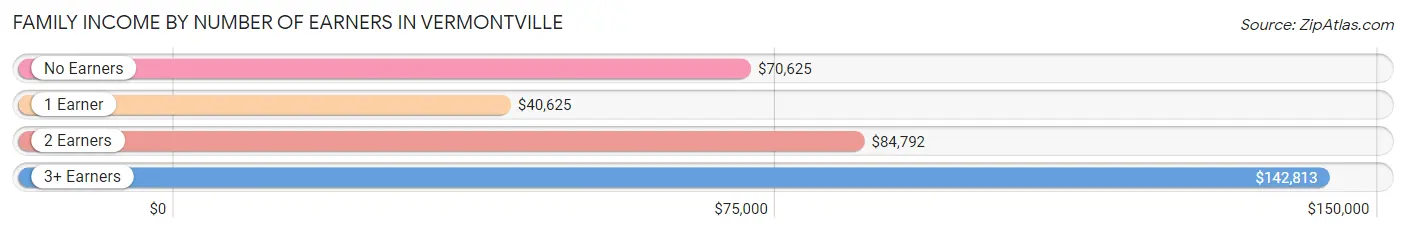
| Number of Earners | # Families | Median Income |
| No Earners | 11 (6.2%) | $70,625 |
| 1 Earner | 75 (42.6%) | $40,625 |
| 2 Earners | 79 (44.9%) | $84,792 |
| 3+ Earners | 11 (6.2%) | $142,813 |
| Total | 176 (100.0%) | $61,250 |
Household Income in Vermontville
Household Income Brackets in Vermontville
With 60 households falling in the category, the $25,000 to $34,999 income range is the most frequent in Vermontville, accounting for 20.5% of all households. In contrast, only 8 households (2.7%) fall into the $10,000 to $14,999 income bracket, making it the least populous group.
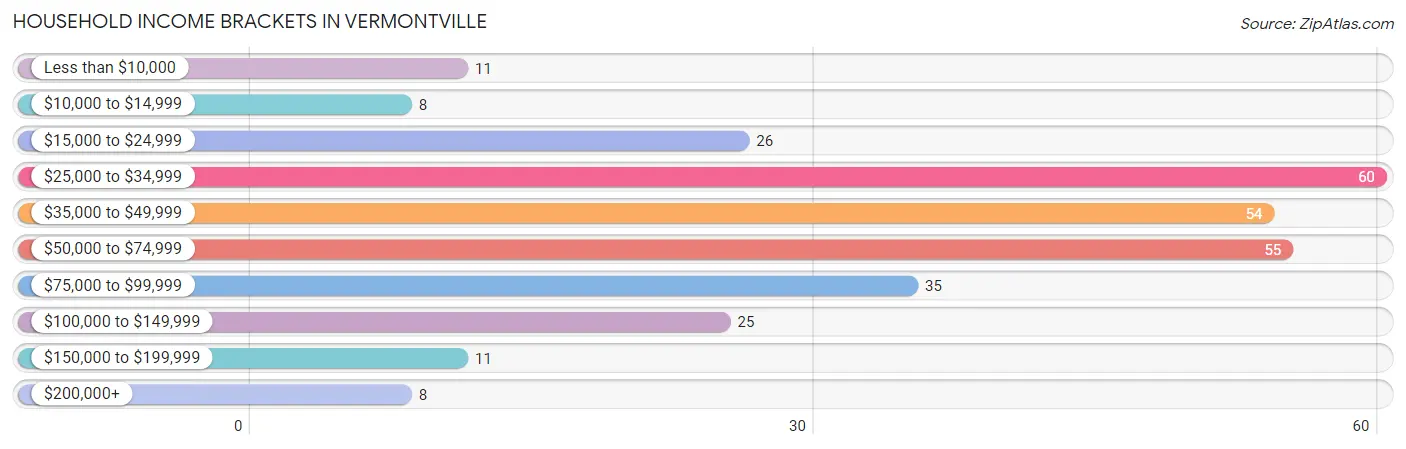
| Income Bracket | # Households | % Households |
| Less than $10,000 | 11 | 3.8% |
| $10,000 to $14,999 | 8 | 2.7% |
| $15,000 to $24,999 | 26 | 8.9% |
| $25,000 to $34,999 | 60 | 20.5% |
| $35,000 to $49,999 | 54 | 18.4% |
| $50,000 to $74,999 | 55 | 18.8% |
| $75,000 to $99,999 | 35 | 11.9% |
| $100,000 to $149,999 | 25 | 8.5% |
| $150,000 to $199,999 | 11 | 3.8% |
| $200,000+ | 8 | 2.7% |
Household Income by Householder Age in Vermontville
The median household income in Vermontville is $46,797, with the highest median household income of $54,375 found in the 25 to 44 years age bracket for the primary householder. A total of 92 households (31.4%) fall into this category. Meanwhile, the 65+ years age bracket for the primary householder has the lowest median household income of $27,230, with 86 households (29.3%) in this group.
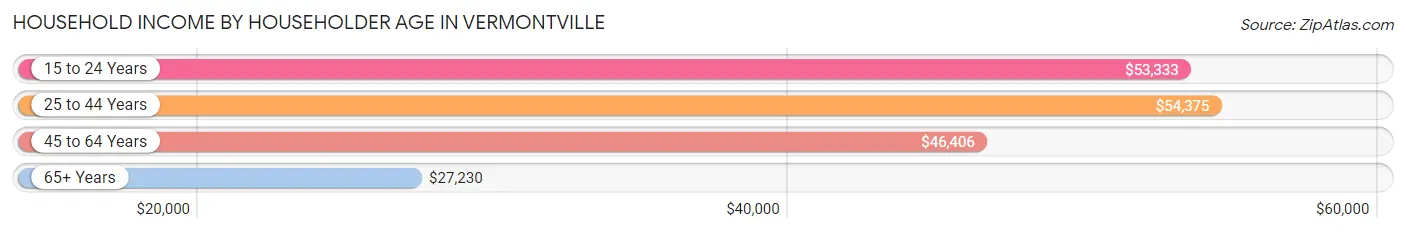
| Income Bracket | # Households | Median Income |
| 15 to 24 Years | 10 (3.4%) | $53,333 |
| 25 to 44 Years | 92 (31.4%) | $54,375 |
| 45 to 64 Years | 105 (35.8%) | $46,406 |
| 65+ Years | 86 (29.3%) | $27,230 |
| Total | 293 (100.0%) | $46,797 |
Poverty in Vermontville
Income Below Poverty by Sex and Age in Vermontville
With 20.6% poverty level for males and 23.6% for females among the residents of Vermontville, 15 year old males and 12 to 14 year old females are the most vulnerable to poverty, with 2 males (100.0%) and 3 females (100.0%) in their respective age groups living below the poverty level.
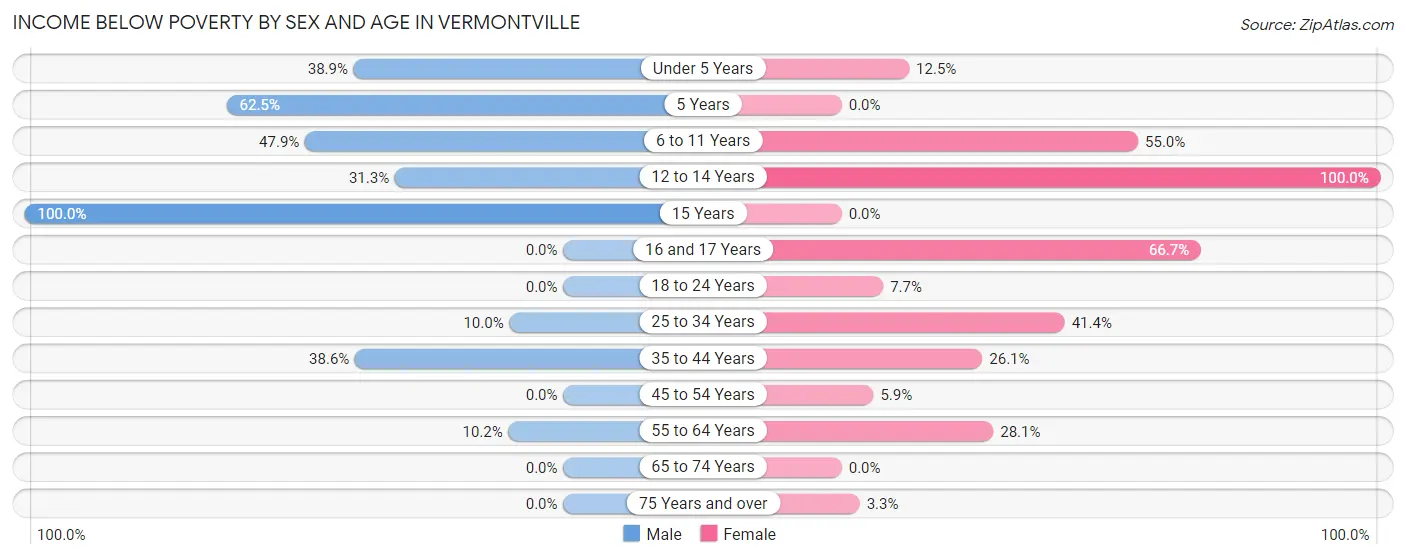
| Age Bracket | Male | Female |
| Under 5 Years | 7 (38.9%) | 2 (12.5%) |
| 5 Years | 5 (62.5%) | 0 (0.0%) |
| 6 to 11 Years | 23 (47.9%) | 22 (55.0%) |
| 12 to 14 Years | 5 (31.2%) | 3 (100.0%) |
| 15 Years | 2 (100.0%) | 0 (0.0%) |
| 16 and 17 Years | 0 (0.0%) | 8 (66.7%) |
| 18 to 24 Years | 0 (0.0%) | 2 (7.7%) |
| 25 to 34 Years | 7 (10.0%) | 24 (41.4%) |
| 35 to 44 Years | 17 (38.6%) | 12 (26.1%) |
| 45 to 54 Years | 0 (0.0%) | 2 (5.9%) |
| 55 to 64 Years | 6 (10.2%) | 9 (28.1%) |
| 65 to 74 Years | 0 (0.0%) | 0 (0.0%) |
| 75 Years and over | 0 (0.0%) | 2 (3.3%) |
| Total | 72 (20.6%) | 86 (23.6%) |
Income Above Poverty by Sex and Age in Vermontville
According to the poverty statistics in Vermontville, males aged 16 and 17 years and females aged 5 years are the age groups that are most secure financially, with 100.0% of males and 100.0% of females in these age groups living above the poverty line.
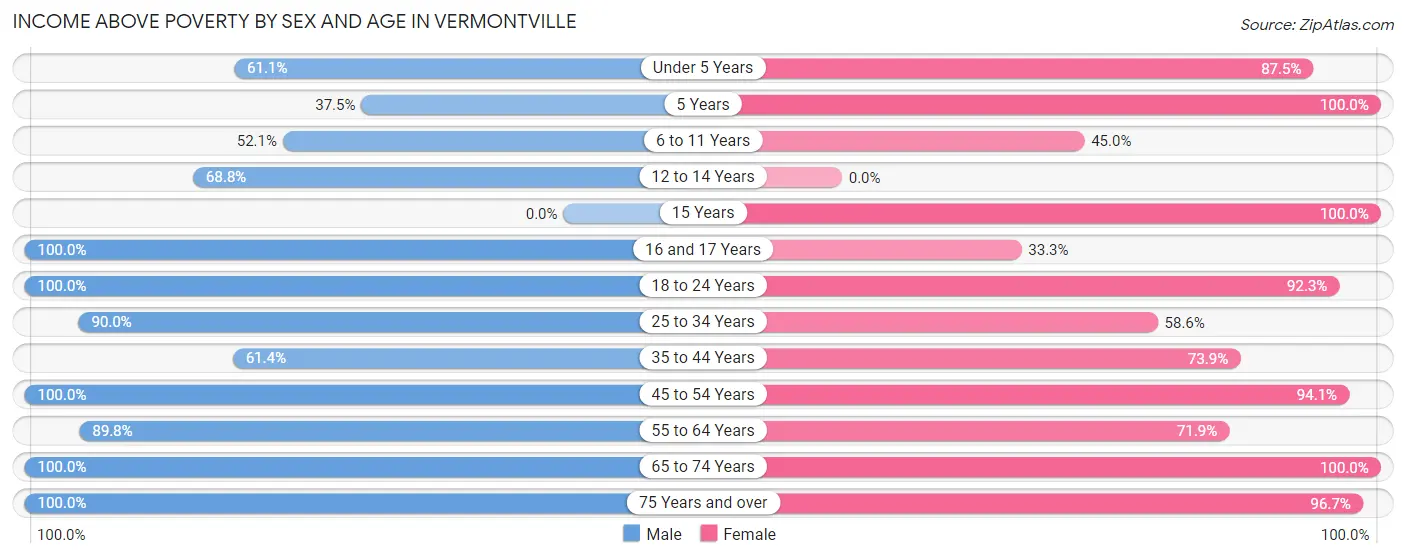
| Age Bracket | Male | Female |
| Under 5 Years | 11 (61.1%) | 14 (87.5%) |
| 5 Years | 3 (37.5%) | 16 (100.0%) |
| 6 to 11 Years | 25 (52.1%) | 18 (45.0%) |
| 12 to 14 Years | 11 (68.8%) | 0 (0.0%) |
| 15 Years | 0 (0.0%) | 5 (100.0%) |
| 16 and 17 Years | 6 (100.0%) | 4 (33.3%) |
| 18 to 24 Years | 18 (100.0%) | 24 (92.3%) |
| 25 to 34 Years | 63 (90.0%) | 34 (58.6%) |
| 35 to 44 Years | 27 (61.4%) | 34 (73.9%) |
| 45 to 54 Years | 27 (100.0%) | 32 (94.1%) |
| 55 to 64 Years | 53 (89.8%) | 23 (71.9%) |
| 65 to 74 Years | 23 (100.0%) | 17 (100.0%) |
| 75 Years and over | 10 (100.0%) | 58 (96.7%) |
| Total | 277 (79.4%) | 279 (76.4%) |
Income Below Poverty Among Married-Couple Families in Vermontville
The poverty statistics for married-couple families in Vermontville show that 5.0% or 5 of the total 101 families live below the poverty line. Families with 3 or 4 children have the highest poverty rate of 42.9%, comprising of 3 families. On the other hand, families with 1 or 2 children have the lowest poverty rate of 0.0%, which includes 0 families.
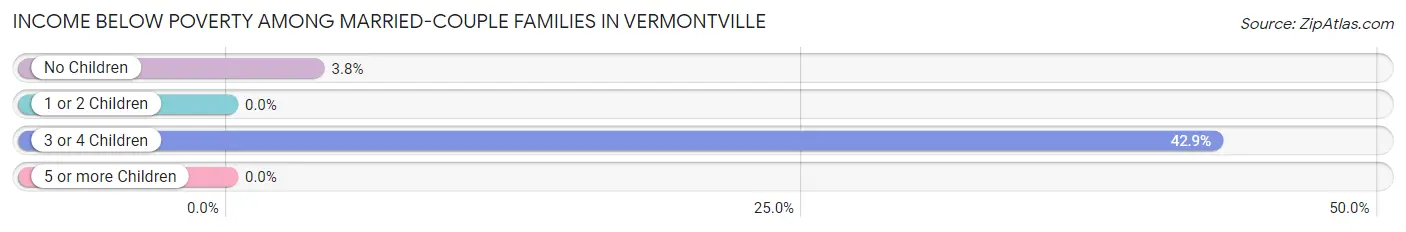
| Children | Above Poverty | Below Poverty |
| No Children | 51 (96.2%) | 2 (3.8%) |
| 1 or 2 Children | 41 (100.0%) | 0 (0.0%) |
| 3 or 4 Children | 4 (57.1%) | 3 (42.9%) |
| 5 or more Children | 0 (0.0%) | 0 (0.0%) |
| Total | 96 (95.1%) | 5 (5.0%) |
Income Below Poverty Among Single-Parent Households in Vermontville
According to the poverty data in Vermontville, 9.5% or 2 single-father households and 48.1% or 26 single-mother households are living below the poverty line. Among single-father households, those with 1 or 2 children have the highest poverty rate, with 2 households (16.7%) experiencing poverty. Likewise, among single-mother households, those with 3 or 4 children have the highest poverty rate, with 14 households (82.4%) falling below the poverty line.
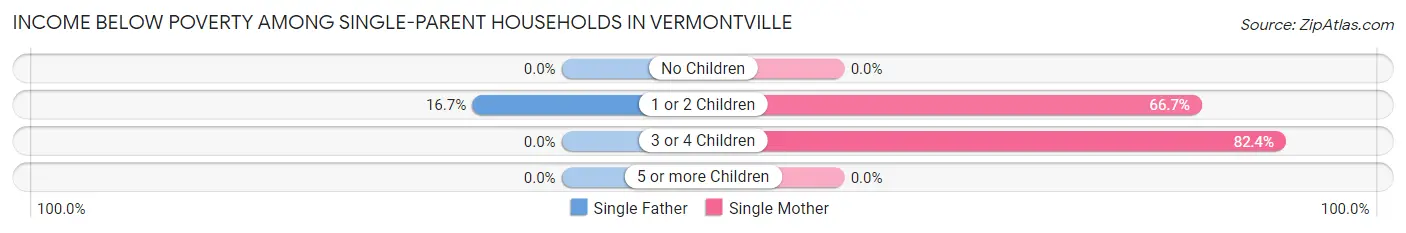
| Children | Single Father | Single Mother |
| No Children | 0 (0.0%) | 0 (0.0%) |
| 1 or 2 Children | 2 (16.7%) | 12 (66.7%) |
| 3 or 4 Children | 0 (0.0%) | 14 (82.4%) |
| 5 or more Children | 0 (0.0%) | 0 (0.0%) |
| Total | 2 (9.5%) | 26 (48.1%) |
Income Below Poverty Among Married-Couple vs Single-Parent Households in Vermontville
The poverty data for Vermontville shows that 5 of the married-couple family households (5.0%) and 28 of the single-parent households (37.3%) are living below the poverty level. Within the married-couple family households, those with 3 or 4 children have the highest poverty rate, with 3 households (42.9%) falling below the poverty line. Among the single-parent households, those with 3 or 4 children have the highest poverty rate, with 14 household (82.4%) living below poverty.
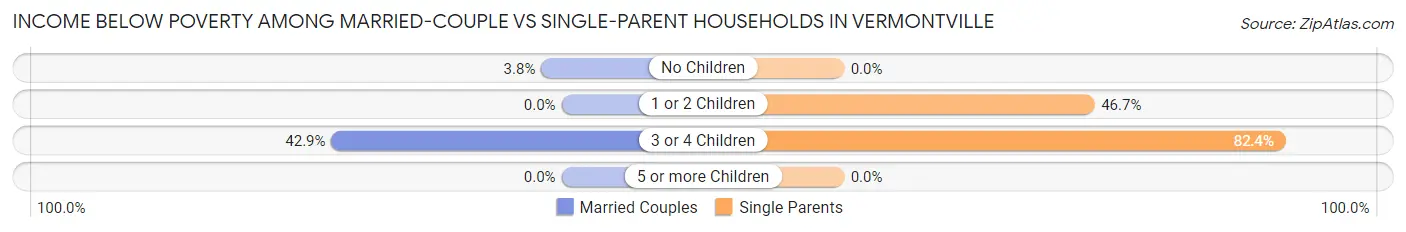
| Children | Married-Couple Families | Single-Parent Households |
| No Children | 2 (3.8%) | 0 (0.0%) |
| 1 or 2 Children | 0 (0.0%) | 14 (46.7%) |
| 3 or 4 Children | 3 (42.9%) | 14 (82.4%) |
| 5 or more Children | 0 (0.0%) | 0 (0.0%) |
| Total | 5 (5.0%) | 28 (37.3%) |
Race in Vermontville
The most populous races in Vermontville are White / Caucasian (661 | 92.2%), Hispanic or Latino (81 | 11.3%), and Some other Race (33 | 4.6%).
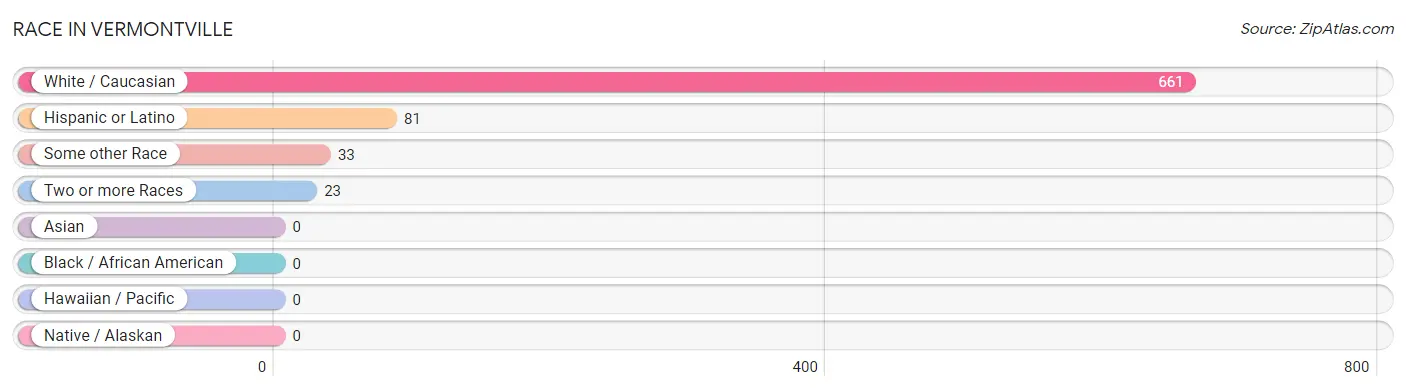
| Race | # Population | % Population |
| Asian | 0 | 0.0% |
| Black / African American | 0 | 0.0% |
| Hawaiian / Pacific | 0 | 0.0% |
| Hispanic or Latino | 81 | 11.3% |
| Native / Alaskan | 0 | 0.0% |
| White / Caucasian | 661 | 92.2% |
| Two or more Races | 23 | 3.2% |
| Some other Race | 33 | 4.6% |
| Total | 717 | 100.0% |
Ancestry in Vermontville
The most populous ancestries reported in Vermontville are German (150 | 20.9%), English (98 | 13.7%), Mexican (81 | 11.3%), American (48 | 6.7%), and Irish (33 | 4.6%), together accounting for 57.2% of all Vermontville residents.
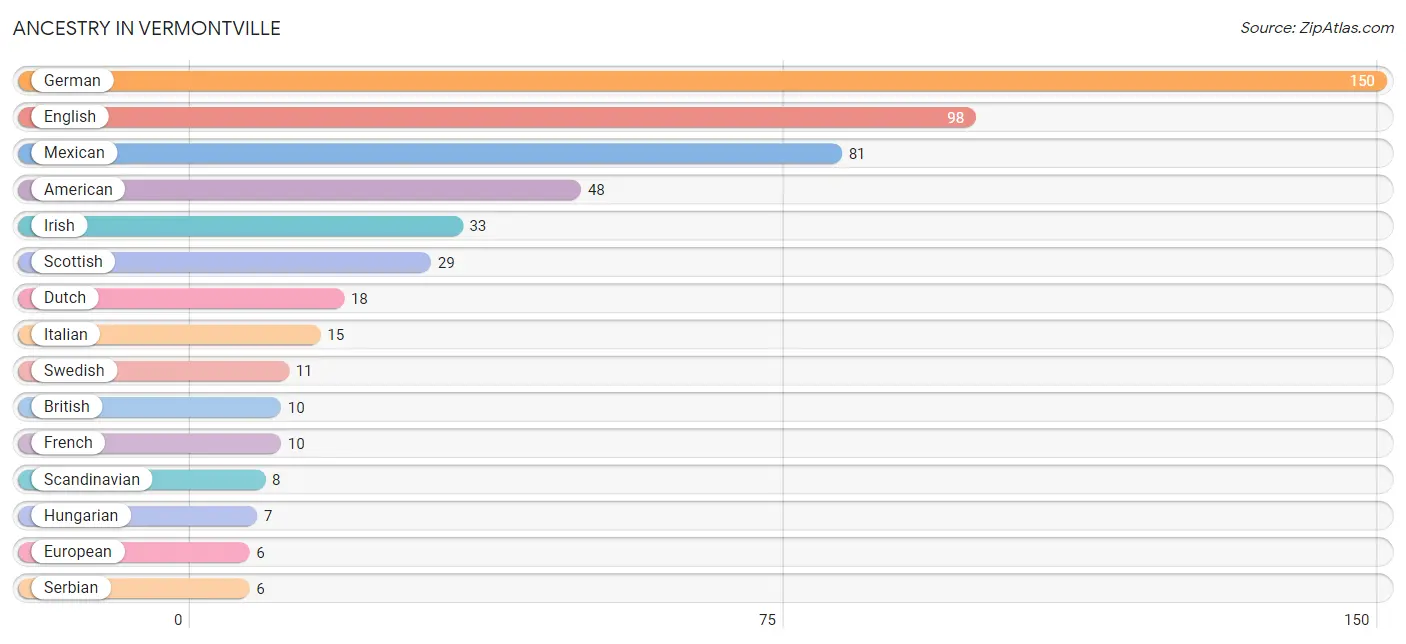
| Ancestry | # Population | % Population |
| American | 48 | 6.7% |
| British | 10 | 1.4% |
| Cherokee | 4 | 0.6% |
| Choctaw | 4 | 0.6% |
| Danish | 2 | 0.3% |
| Dutch | 18 | 2.5% |
| English | 98 | 13.7% |
| European | 6 | 0.8% |
| Finnish | 1 | 0.1% |
| French | 10 | 1.4% |
| French Canadian | 2 | 0.3% |
| German | 150 | 20.9% |
| Greek | 3 | 0.4% |
| Hungarian | 7 | 1.0% |
| Indian (Asian) | 1 | 0.1% |
| Irish | 33 | 4.6% |
| Italian | 15 | 2.1% |
| Korean | 1 | 0.1% |
| Mexican | 81 | 11.3% |
| Native Hawaiian | 1 | 0.1% |
| Norwegian | 2 | 0.3% |
| Polish | 3 | 0.4% |
| Russian | 2 | 0.3% |
| Scandinavian | 8 | 1.1% |
| Scotch-Irish | 3 | 0.4% |
| Scottish | 29 | 4.0% |
| Serbian | 6 | 0.8% |
| Swedish | 11 | 1.5% | View All 28 Rows |
Immigrants in Vermontville
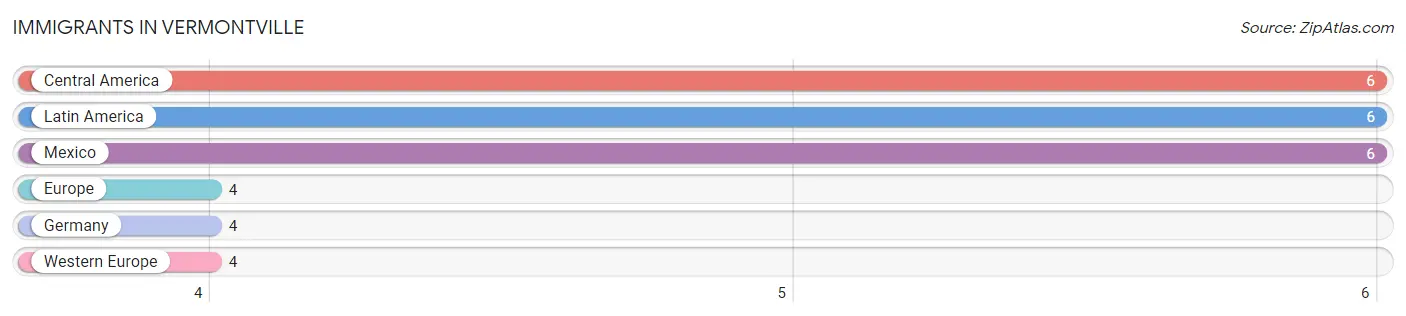
The most numerous immigrant groups reported in Vermontville came from Central America (6 | 0.8%), Latin America (6 | 0.8%), Mexico (6 | 0.8%), Europe (4 | 0.6%), and Germany (4 | 0.6%), together accounting for 3.6% of all Vermontville residents.
| Immigration Origin | # Population | % Population |
| Central America | 6 | 0.8% |
| Europe | 4 | 0.6% |
| Germany | 4 | 0.6% |
| Latin America | 6 | 0.8% |
| Mexico | 6 | 0.8% |
| Western Europe | 4 | 0.6% | View All 6 Rows |
Sex and Age in Vermontville
Sex and Age in Vermontville
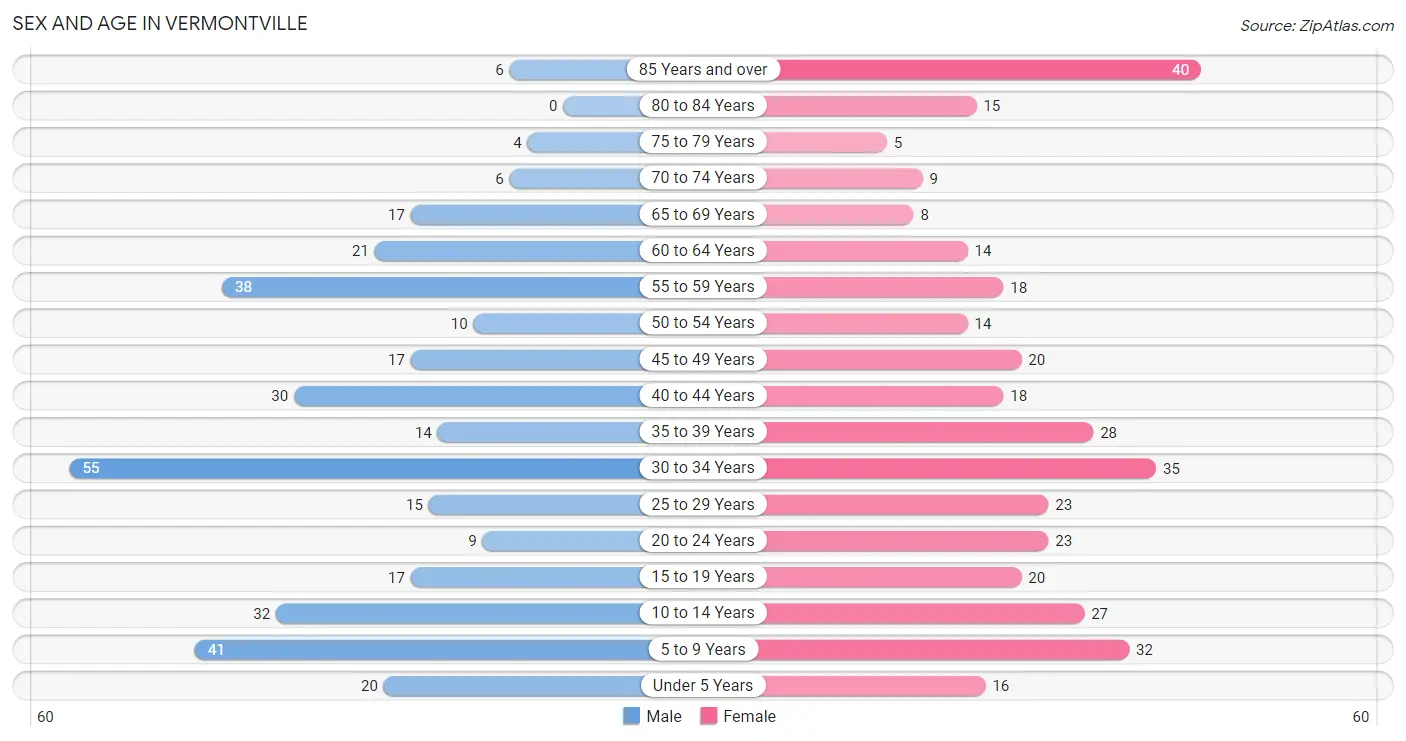
The most populous age groups in Vermontville are 30 to 34 Years (55 | 15.6%) for men and 85 Years and over (40 | 11.0%) for women.
| Age Bracket | Male | Female |
| Under 5 Years | 20 (5.7%) | 16 (4.4%) |
| 5 to 9 Years | 41 (11.7%) | 32 (8.8%) |
| 10 to 14 Years | 32 (9.1%) | 27 (7.4%) |
| 15 to 19 Years | 17 (4.8%) | 20 (5.5%) |
| 20 to 24 Years | 9 (2.6%) | 23 (6.3%) |
| 25 to 29 Years | 15 (4.3%) | 23 (6.3%) |
| 30 to 34 Years | 55 (15.6%) | 35 (9.6%) |
| 35 to 39 Years | 14 (4.0%) | 28 (7.7%) |
| 40 to 44 Years | 30 (8.5%) | 18 (4.9%) |
| 45 to 49 Years | 17 (4.8%) | 20 (5.5%) |
| 50 to 54 Years | 10 (2.8%) | 14 (3.8%) |
| 55 to 59 Years | 38 (10.8%) | 18 (4.9%) |
| 60 to 64 Years | 21 (6.0%) | 14 (3.8%) |
| 65 to 69 Years | 17 (4.8%) | 8 (2.2%) |
| 70 to 74 Years | 6 (1.7%) | 9 (2.5%) |
| 75 to 79 Years | 4 (1.1%) | 5 (1.4%) |
| 80 to 84 Years | 0 (0.0%) | 15 (4.1%) |
| 85 Years and over | 6 (1.7%) | 40 (11.0%) |
| Total | 352 (100.0%) | 365 (100.0%) |
Families and Households in Vermontville
Median Family Size in Vermontville
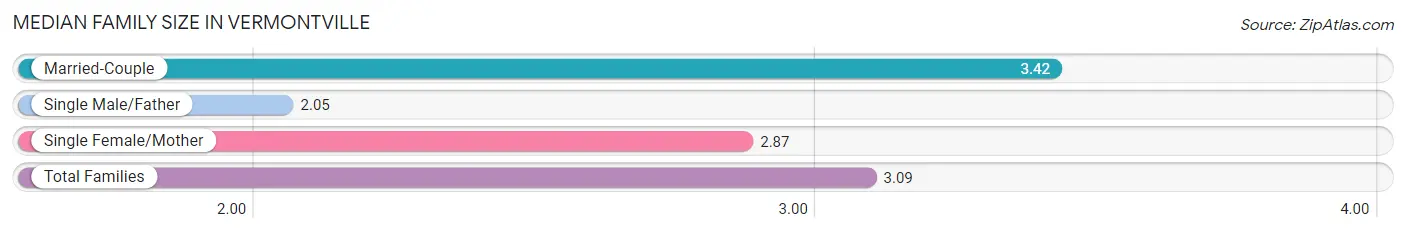
The median family size in Vermontville is 3.09 persons per family, with married-couple families (101 | 57.4%) accounting for the largest median family size of 3.42 persons per family. On the other hand, single male/father families (21 | 11.9%) represent the smallest median family size with 2.05 persons per family.
| Family Type | # Families | Family Size |
| Married-Couple | 101 (57.4%) | 3.42 |
| Single Male/Father | 21 (11.9%) | 2.05 |
| Single Female/Mother | 54 (30.7%) | 2.87 |
| Total Families | 176 (100.0%) | 3.09 |
Median Household Size in Vermontville
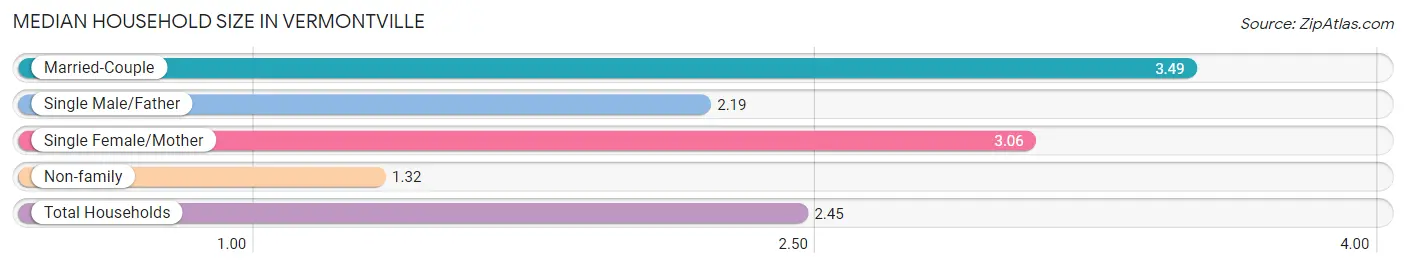
The median household size in Vermontville is 2.45 persons per household, with married-couple households (101 | 34.5%) accounting for the largest median household size of 3.49 persons per household. non-family households (117 | 39.9%) represent the smallest median household size with 1.32 persons per household.
| Household Type | # Households | Household Size |
| Married-Couple | 101 (34.5%) | 3.49 |
| Single Male/Father | 21 (7.2%) | 2.19 |
| Single Female/Mother | 54 (18.4%) | 3.06 |
| Non-family | 117 (39.9%) | 1.32 |
| Total Households | 293 (100.0%) | 2.45 |
Household Size by Marriage Status in Vermontville
Out of a total of 293 households in Vermontville, 176 (60.1%) are family households, while 117 (39.9%) are nonfamily households. The most numerous type of family households are 2-person households, comprising 72, and the most common type of nonfamily households are 1-person households, comprising 91.
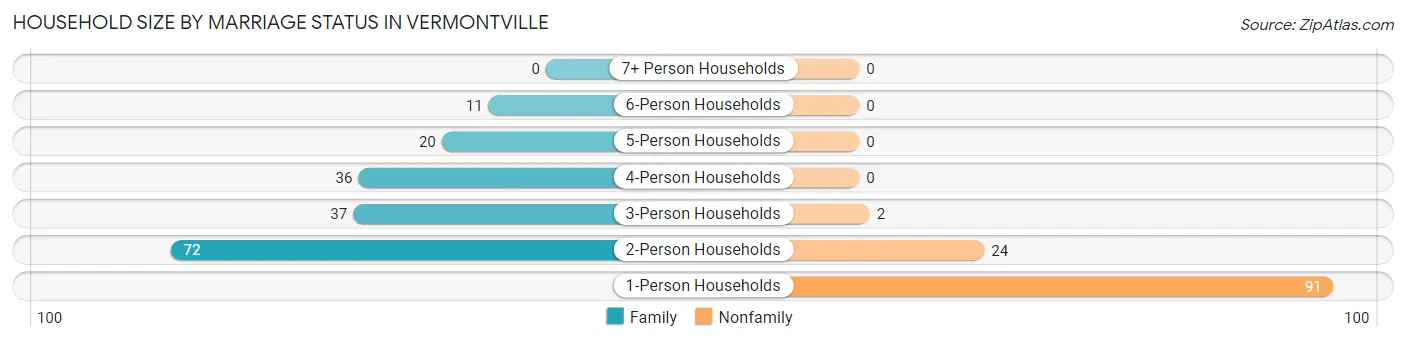
| Household Size | Family Households | Nonfamily Households |
| 1-Person Households | - | 91 (31.1%) |
| 2-Person Households | 72 (24.6%) | 24 (8.2%) |
| 3-Person Households | 37 (12.6%) | 2 (0.7%) |
| 4-Person Households | 36 (12.3%) | 0 (0.0%) |
| 5-Person Households | 20 (6.8%) | 0 (0.0%) |
| 6-Person Households | 11 (3.7%) | 0 (0.0%) |
| 7+ Person Households | 0 (0.0%) | 0 (0.0%) |
| Total | 176 (60.1%) | 117 (39.9%) |
Female Fertility in Vermontville
Fertility by Age in Vermontville
Average fertility rate in Vermontville is 94.0 births per 1,000 women. Women in the age bracket of 20 to 34 years have the highest fertility rate with 148.0 births per 1,000 women. Women in the age bracket of 20 to 34 years acount for 75.0% of all women with births.
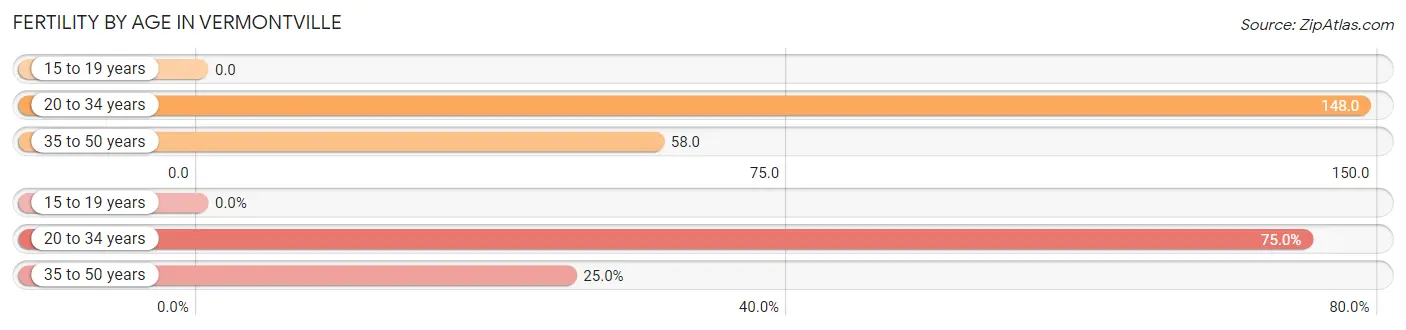
| Age Bracket | Women with Births | Births / 1,000 Women |
| 15 to 19 years | 0 (0.0%) | 0.0 |
| 20 to 34 years | 12 (75.0%) | 148.0 |
| 35 to 50 years | 4 (25.0%) | 58.0 |
| Total | 16 (100.0%) | 94.0 |
Fertility by Age by Marriage Status in Vermontville
81.2% of women with births (16) in Vermontville are married. The highest percentage of unmarried women with births falls into 20 to 34 years age bracket with 25.0% of them unmarried at the time of birth, while the lowest percentage of unmarried women with births belong to 35 to 50 years age bracket with 0.0% of them unmarried.
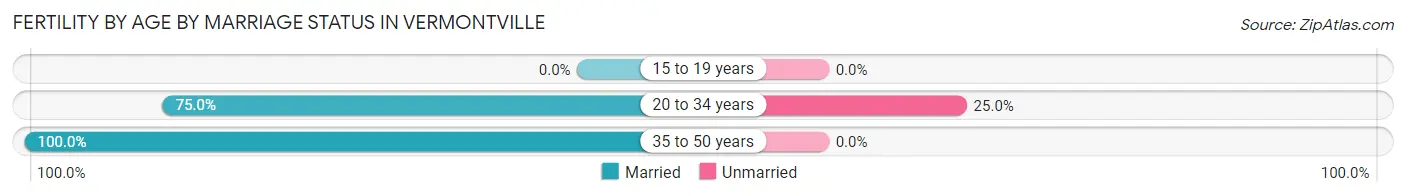
| Age Bracket | Married | Unmarried |
| 15 to 19 years | 0 (0.0%) | 0 (0.0%) |
| 20 to 34 years | 9 (75.0%) | 3 (25.0%) |
| 35 to 50 years | 4 (100.0%) | 0 (0.0%) |
| Total | 13 (81.2%) | 3 (18.8%) |
Fertility by Education in Vermontville
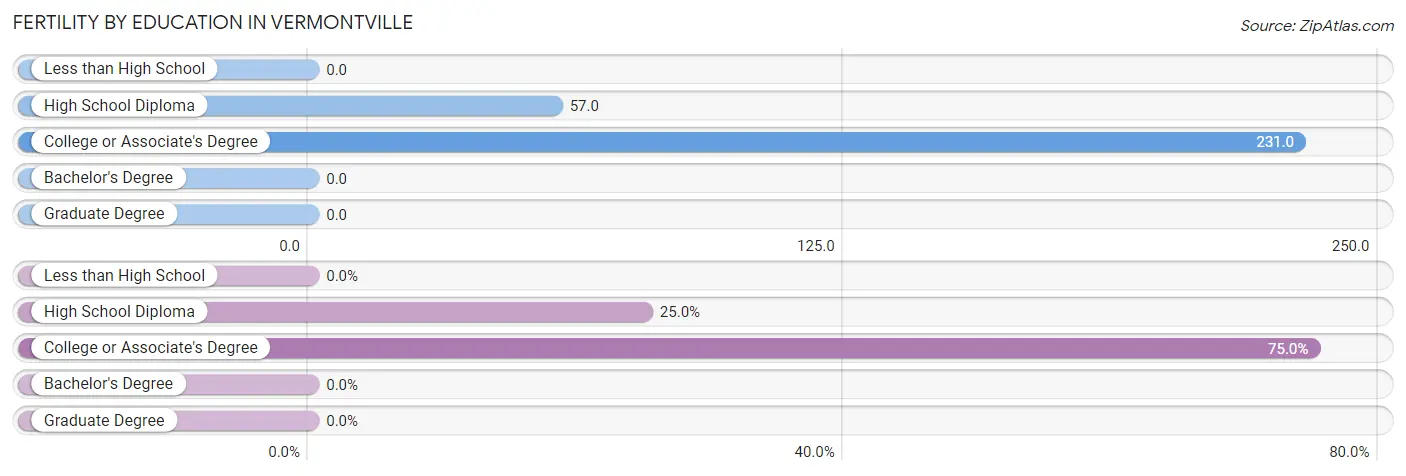
| Educational Attainment | Women with Births | Births / 1,000 Women |
| Less than High School | 0 (0.0%) | 0.0 |
| High School Diploma | 4 (25.0%) | 57.0 |
| College or Associate's Degree | 12 (75.0%) | 231.0 |
| Bachelor's Degree | 0 (0.0%) | 0.0 |
| Graduate Degree | 0 (0.0%) | 0.0 |
| Total | 16 (100.0%) | 94.0 |
Fertility by Education by Marriage Status in Vermontville
18.8% of women with births in Vermontville are unmarried. Women with the educational attainment of high school diploma are most likely to be married with 100.0% of them married at childbirth, while women with the educational attainment of college or associate's degree are least likely to be married with 25.0% of them unmarried at childbirth.
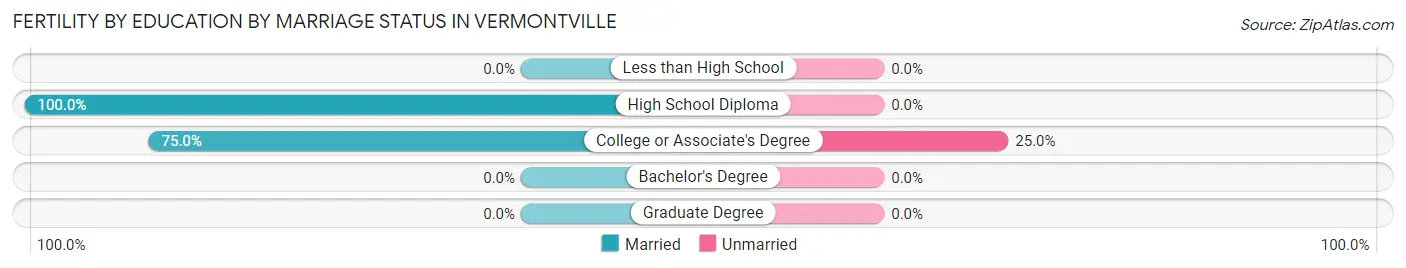
| Educational Attainment | Married | Unmarried |
| Less than High School | 0 (0.0%) | 0 (0.0%) |
| High School Diploma | 4 (100.0%) | 0 (0.0%) |
| College or Associate's Degree | 9 (75.0%) | 3 (25.0%) |
| Bachelor's Degree | 0 (0.0%) | 0 (0.0%) |
| Graduate Degree | 0 (0.0%) | 0 (0.0%) |
| Total | 13 (81.2%) | 3 (18.8%) |
Employment Characteristics in Vermontville
Employment by Class of Employer in Vermontville
Among the 317 employed individuals in Vermontville, private company employees (240 | 75.7%), not-for-profit organizations (30 | 9.5%), and state government employees (16 | 5.1%) make up the most common classes of employment.
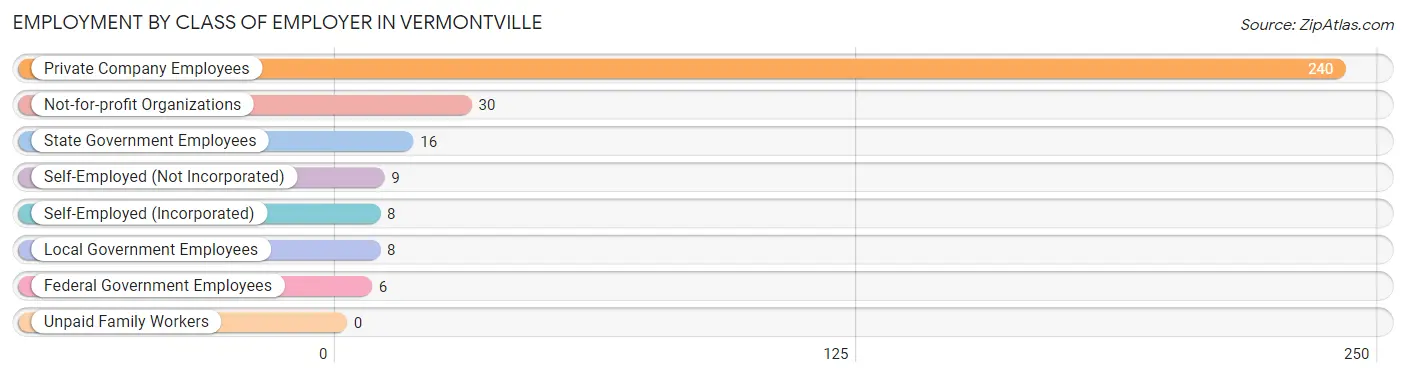
| Employer Class | # Employees | % Employees |
| Private Company Employees | 240 | 75.7% |
| Self-Employed (Incorporated) | 8 | 2.5% |
| Self-Employed (Not Incorporated) | 9 | 2.8% |
| Not-for-profit Organizations | 30 | 9.5% |
| Local Government Employees | 8 | 2.5% |
| State Government Employees | 16 | 5.1% |
| Federal Government Employees | 6 | 1.9% |
| Unpaid Family Workers | 0 | 0.0% |
| Total | 317 | 100.0% |
Employment Status by Age in Vermontville
According to the labor force statistics for Vermontville, out of the total population over 16 years of age (542), 63.7% or 345 individuals are in the labor force, with 6.1% or 21 of them unemployed. The age group with the highest labor force participation rate is 20 to 24 years, with 100.0% or 32 individuals in the labor force. Within the labor force, the 55 to 59 years age range has the highest percentage of unemployed individuals, with 21.9% or 7 of them being unemployed.
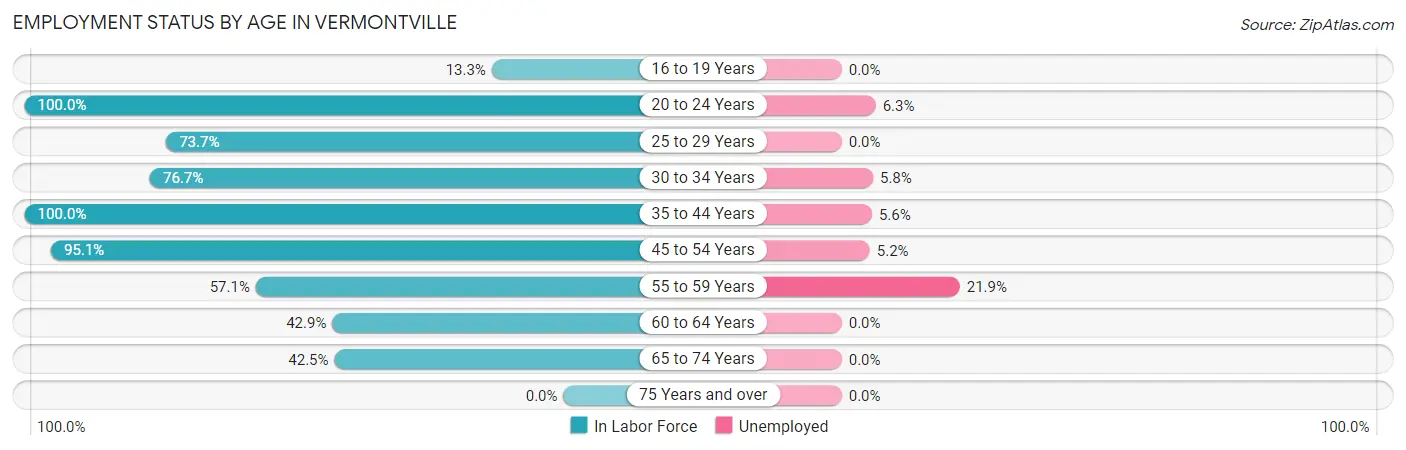
| Age Bracket | In Labor Force | Unemployed |
| 16 to 19 Years | 4 (13.3%) | 0 (0.0%) |
| 20 to 24 Years | 32 (100.0%) | 2 (6.3%) |
| 25 to 29 Years | 28 (73.7%) | 0 (0.0%) |
| 30 to 34 Years | 69 (76.7%) | 4 (5.8%) |
| 35 to 44 Years | 90 (100.0%) | 5 (5.6%) |
| 45 to 54 Years | 58 (95.1%) | 3 (5.2%) |
| 55 to 59 Years | 32 (57.1%) | 7 (21.9%) |
| 60 to 64 Years | 15 (42.9%) | 0 (0.0%) |
| 65 to 74 Years | 17 (42.5%) | 0 (0.0%) |
| 75 Years and over | 0 (0.0%) | 0 (0.0%) |
| Total | 345 (63.7%) | 21 (6.1%) |
Employment Status by Educational Attainment in Vermontville
According to labor force statistics for Vermontville, 78.9% of individuals (292) out of the total population between 25 and 64 years of age (370) are in the labor force, with 6.5% or 19 of them being unemployed. The group with the highest labor force participation rate are those with the educational attainment of less than high school, with 94.7% or 36 individuals in the labor force. Within the labor force, individuals with high school diploma education have the highest percentage of unemployment, with 9.4% or 12 of them being unemployed.
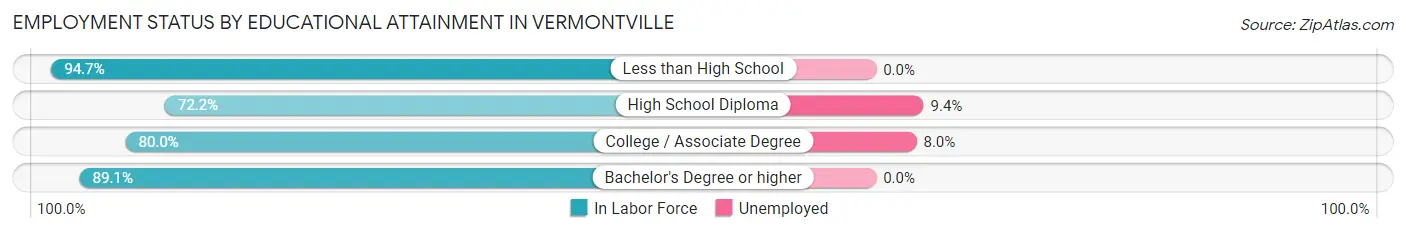
| Educational Attainment | In Labor Force | Unemployed |
| Less than High School | 36 (94.7%) | 0 (0.0%) |
| High School Diploma | 127 (72.2%) | 17 (9.4%) |
| College / Associate Degree | 88 (80.0%) | 9 (8.0%) |
| Bachelor's Degree or higher | 41 (89.1%) | 0 (0.0%) |
| Total | 292 (78.9%) | 24 (6.5%) |
Employment Occupations by Sex in Vermontville
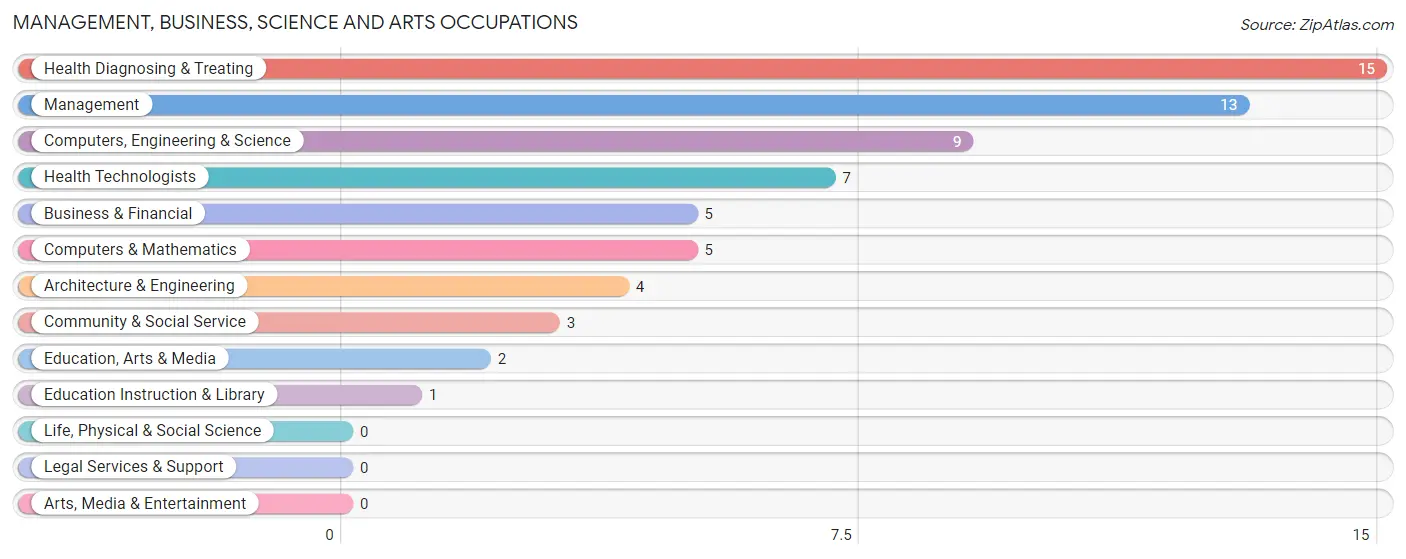
Management, Business, Science and Arts Occupations
The most common Management, Business, Science and Arts occupations in Vermontville are Health Diagnosing & Treating (15 | 4.6%), Management (13 | 4.0%), Computers, Engineering & Science (9 | 2.8%), Health Technologists (7 | 2.2%), and Business & Financial (5 | 1.5%).
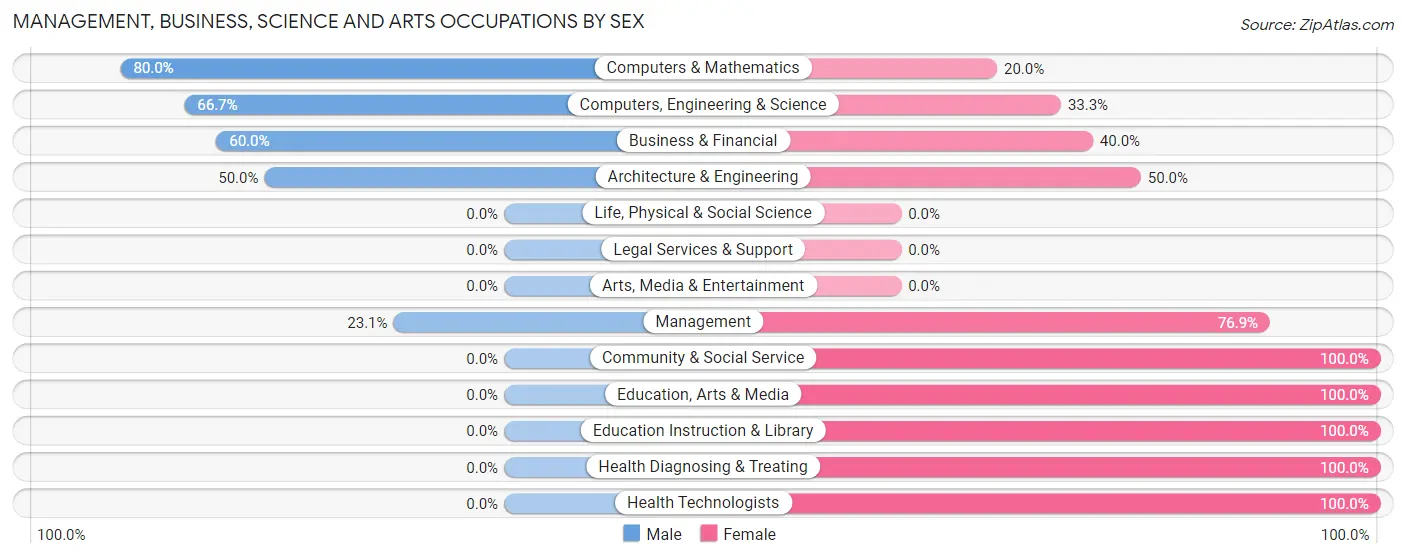
Management, Business, Science and Arts Occupations by Sex
Within the Management, Business, Science and Arts occupations in Vermontville, the most male-oriented occupations are Computers & Mathematics (80.0%), Computers, Engineering & Science (66.7%), and Business & Financial (60.0%), while the most female-oriented occupations are Community & Social Service (100.0%), Education, Arts & Media (100.0%), and Education Instruction & Library (100.0%).
| Occupation | Male | Female |
| Management | 3 (23.1%) | 10 (76.9%) |
| Business & Financial | 3 (60.0%) | 2 (40.0%) |
| Computers, Engineering & Science | 6 (66.7%) | 3 (33.3%) |
| Computers & Mathematics | 4 (80.0%) | 1 (20.0%) |
| Architecture & Engineering | 2 (50.0%) | 2 (50.0%) |
| Life, Physical & Social Science | 0 (0.0%) | 0 (0.0%) |
| Community & Social Service | 0 (0.0%) | 3 (100.0%) |
| Education, Arts & Media | 0 (0.0%) | 2 (100.0%) |
| Legal Services & Support | 0 (0.0%) | 0 (0.0%) |
| Education Instruction & Library | 0 (0.0%) | 1 (100.0%) |
| Arts, Media & Entertainment | 0 (0.0%) | 0 (0.0%) |
| Health Diagnosing & Treating | 0 (0.0%) | 15 (100.0%) |
| Health Technologists | 0 (0.0%) | 7 (100.0%) |
| Total (Category) | 12 (26.7%) | 33 (73.3%) |
| Total (Overall) | 165 (50.9%) | 159 (49.1%) |
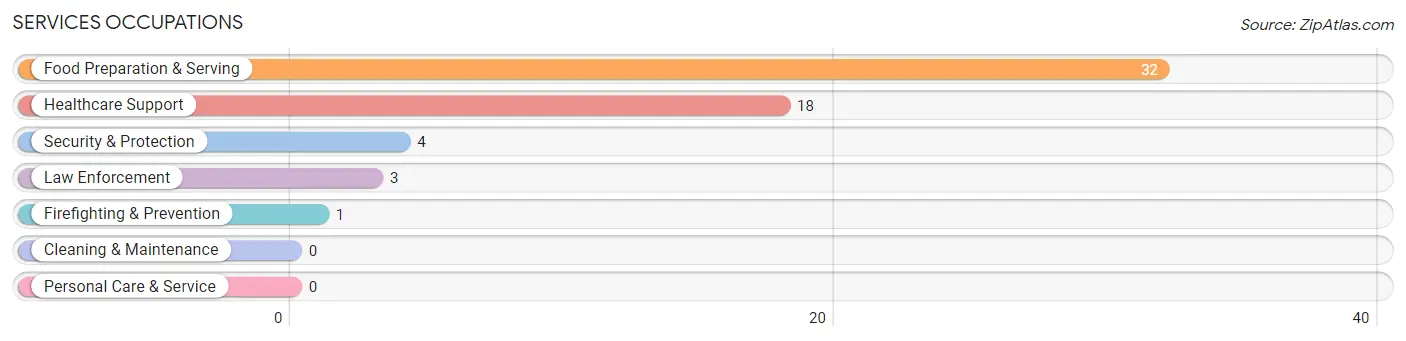
Services Occupations
The most common Services occupations in Vermontville are Food Preparation & Serving (32 | 9.9%), Healthcare Support (18 | 5.6%), Security & Protection (4 | 1.2%), Law Enforcement (3 | 0.9%), and Firefighting & Prevention (1 | 0.3%).
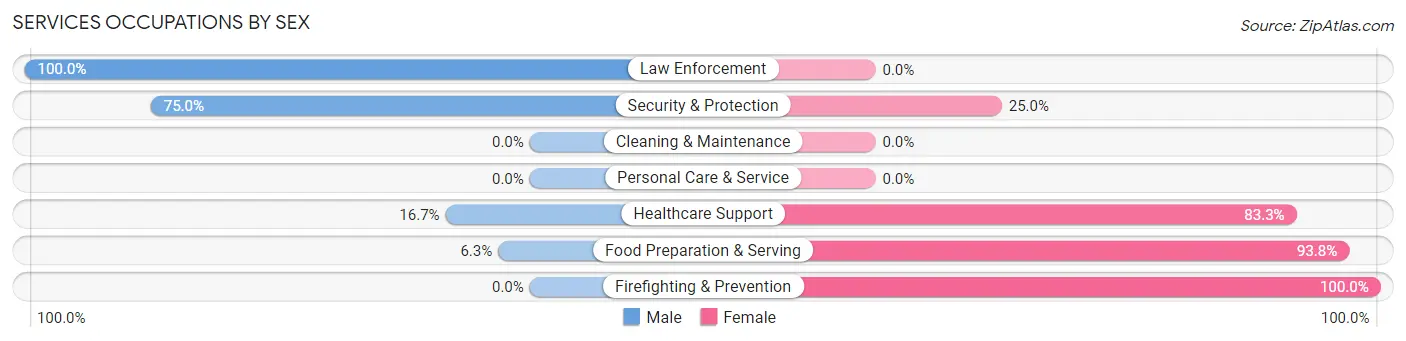
Services Occupations by Sex
Within the Services occupations in Vermontville, the most male-oriented occupations are Law Enforcement (100.0%), Security & Protection (75.0%), and Healthcare Support (16.7%), while the most female-oriented occupations are Firefighting & Prevention (100.0%), Food Preparation & Serving (93.8%), and Healthcare Support (83.3%).
| Occupation | Male | Female |
| Healthcare Support | 3 (16.7%) | 15 (83.3%) |
| Security & Protection | 3 (75.0%) | 1 (25.0%) |
| Firefighting & Prevention | 0 (0.0%) | 1 (100.0%) |
| Law Enforcement | 3 (100.0%) | 0 (0.0%) |
| Food Preparation & Serving | 2 (6.2%) | 30 (93.8%) |
| Cleaning & Maintenance | 0 (0.0%) | 0 (0.0%) |
| Personal Care & Service | 0 (0.0%) | 0 (0.0%) |
| Total (Category) | 8 (14.8%) | 46 (85.2%) |
| Total (Overall) | 165 (50.9%) | 159 (49.1%) |
Sales and Office Occupations
The most common Sales and Office occupations in Vermontville are Office & Administration (50 | 15.4%), and Sales & Related (35 | 10.8%).
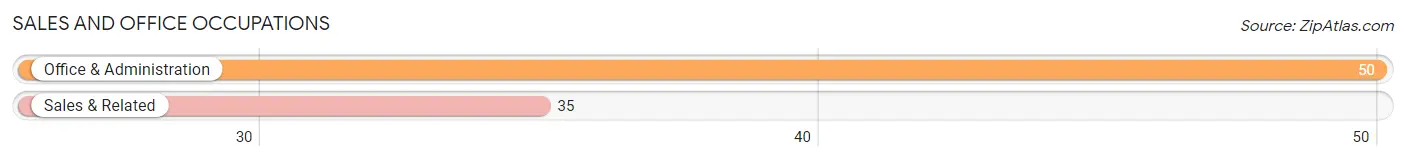
Sales and Office Occupations by Sex
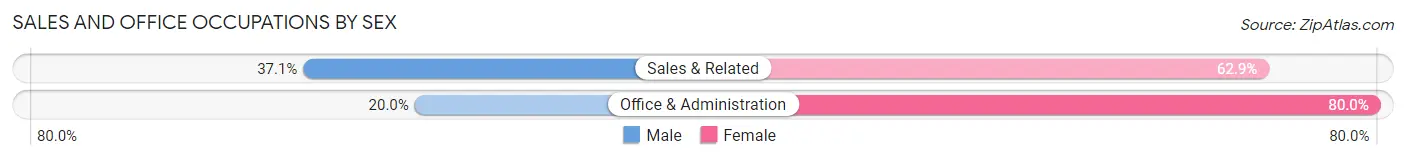
| Occupation | Male | Female |
| Sales & Related | 13 (37.1%) | 22 (62.9%) |
| Office & Administration | 10 (20.0%) | 40 (80.0%) |
| Total (Category) | 23 (27.1%) | 62 (72.9%) |
| Total (Overall) | 165 (50.9%) | 159 (49.1%) |
Natural Resources, Construction and Maintenance Occupations
The most common Natural Resources, Construction and Maintenance occupations in Vermontville are Installation, Maintenance & Repair (12 | 3.7%), Construction & Extraction (11 | 3.4%), and Farming, Fishing & Forestry (6 | 1.8%).

Natural Resources, Construction and Maintenance Occupations by Sex
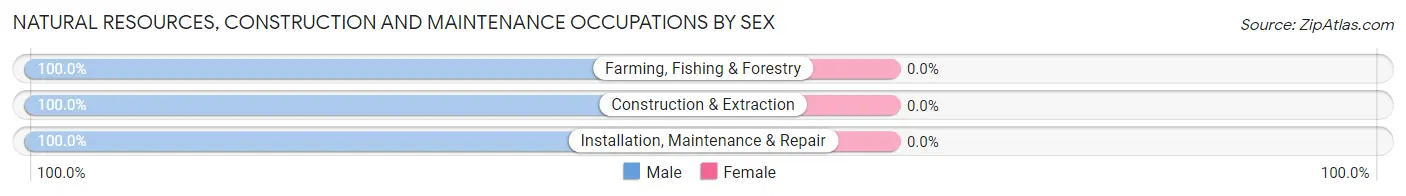
| Occupation | Male | Female |
| Farming, Fishing & Forestry | 6 (100.0%) | 0 (0.0%) |
| Construction & Extraction | 11 (100.0%) | 0 (0.0%) |
| Installation, Maintenance & Repair | 12 (100.0%) | 0 (0.0%) |
| Total (Category) | 29 (100.0%) | 0 (0.0%) |
| Total (Overall) | 165 (50.9%) | 159 (49.1%) |
Production, Transportation and Moving Occupations
The most common Production, Transportation and Moving occupations in Vermontville are Production (46 | 14.2%), Transportation (46 | 14.2%), and Material Moving (19 | 5.9%).
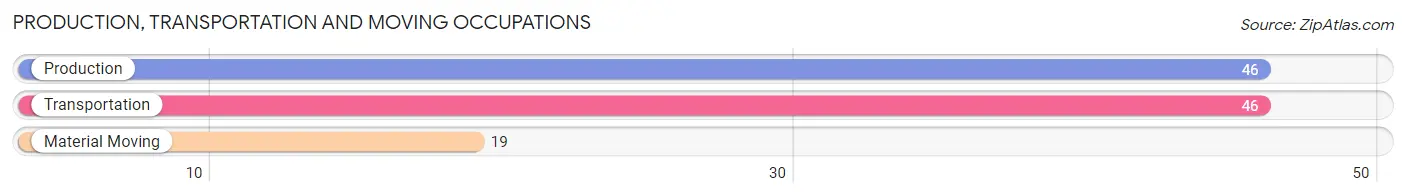
Production, Transportation and Moving Occupations by Sex
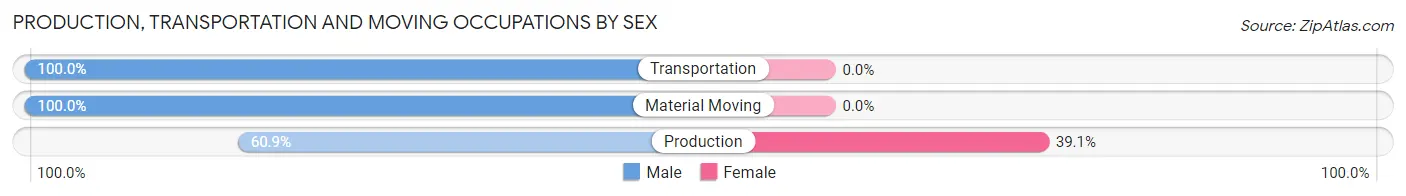
| Occupation | Male | Female |
| Production | 28 (60.9%) | 18 (39.1%) |
| Transportation | 46 (100.0%) | 0 (0.0%) |
| Material Moving | 19 (100.0%) | 0 (0.0%) |
| Total (Category) | 93 (83.8%) | 18 (16.2%) |
| Total (Overall) | 165 (50.9%) | 159 (49.1%) |
Employment Industries by Sex in Vermontville
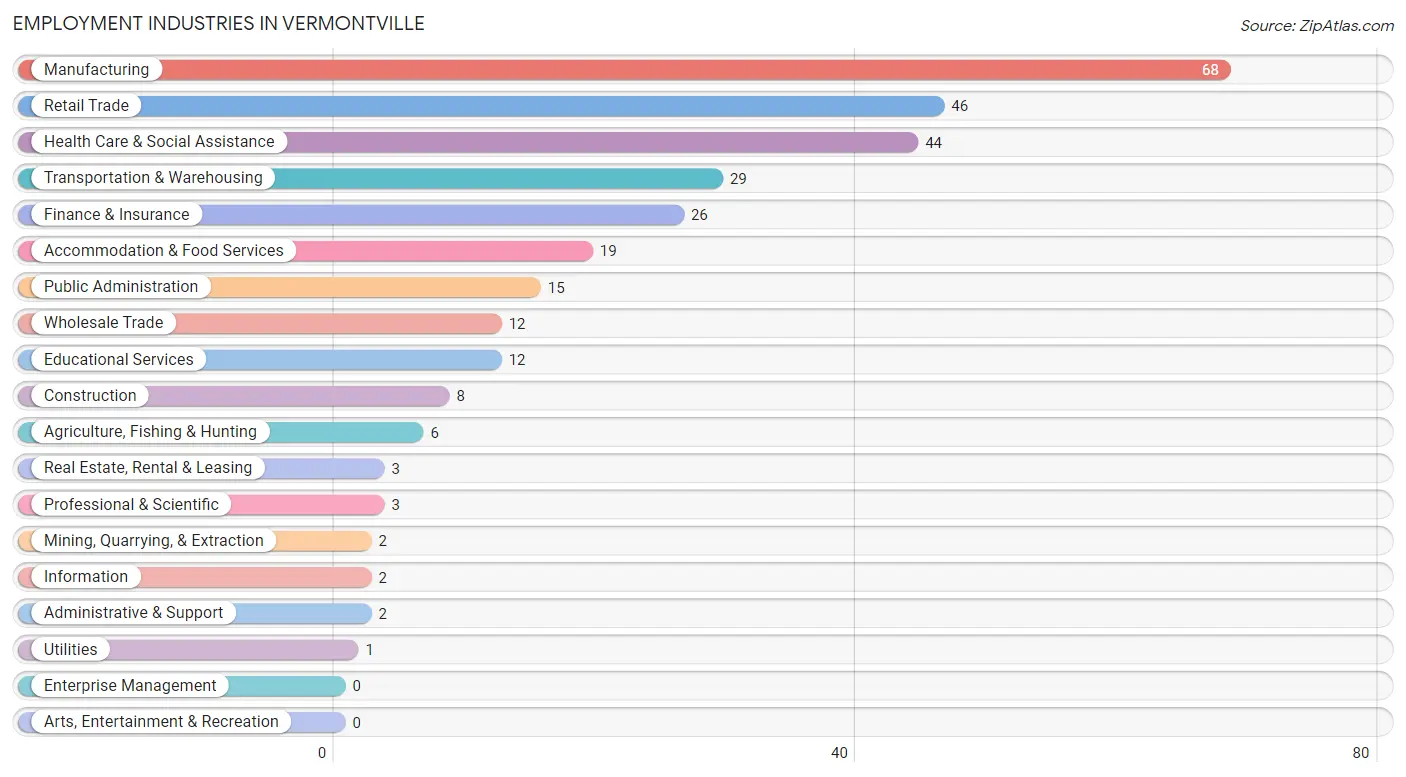
Employment Industries in Vermontville
The major employment industries in Vermontville include Manufacturing (68 | 21.0%), Retail Trade (46 | 14.2%), Health Care & Social Assistance (44 | 13.6%), Transportation & Warehousing (29 | 8.9%), and Finance & Insurance (26 | 8.0%).
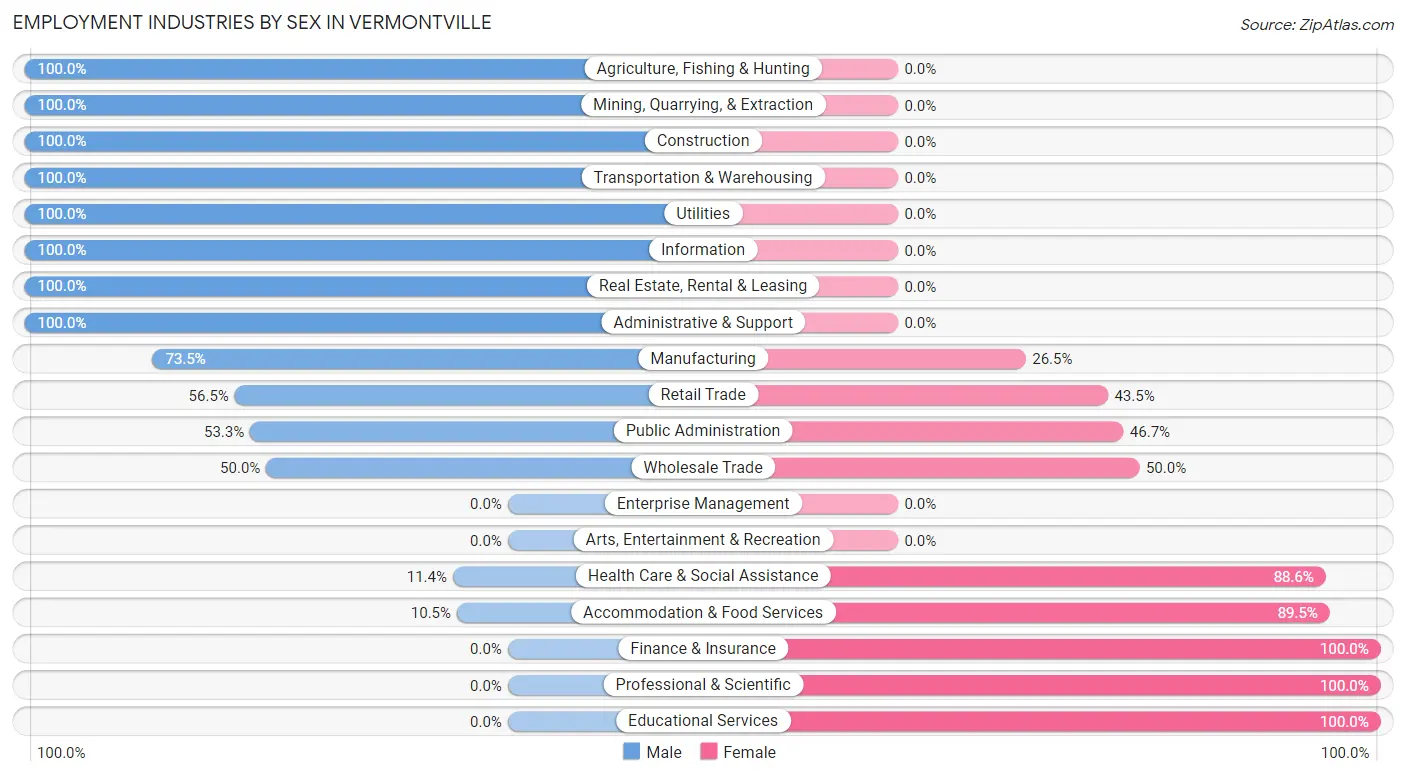
Employment Industries by Sex in Vermontville
The Vermontville industries that see more men than women are Agriculture, Fishing & Hunting (100.0%), Mining, Quarrying, & Extraction (100.0%), and Construction (100.0%), whereas the industries that tend to have a higher number of women are Finance & Insurance (100.0%), Professional & Scientific (100.0%), and Educational Services (100.0%).
| Industry | Male | Female |
| Agriculture, Fishing & Hunting | 6 (100.0%) | 0 (0.0%) |
| Mining, Quarrying, & Extraction | 2 (100.0%) | 0 (0.0%) |
| Construction | 8 (100.0%) | 0 (0.0%) |
| Manufacturing | 50 (73.5%) | 18 (26.5%) |
| Wholesale Trade | 6 (50.0%) | 6 (50.0%) |
| Retail Trade | 26 (56.5%) | 20 (43.5%) |
| Transportation & Warehousing | 29 (100.0%) | 0 (0.0%) |
| Utilities | 1 (100.0%) | 0 (0.0%) |
| Information | 2 (100.0%) | 0 (0.0%) |
| Finance & Insurance | 0 (0.0%) | 26 (100.0%) |
| Real Estate, Rental & Leasing | 3 (100.0%) | 0 (0.0%) |
| Professional & Scientific | 0 (0.0%) | 3 (100.0%) |
| Enterprise Management | 0 (0.0%) | 0 (0.0%) |
| Administrative & Support | 2 (100.0%) | 0 (0.0%) |
| Educational Services | 0 (0.0%) | 12 (100.0%) |
| Health Care & Social Assistance | 5 (11.4%) | 39 (88.6%) |
| Arts, Entertainment & Recreation | 0 (0.0%) | 0 (0.0%) |
| Accommodation & Food Services | 2 (10.5%) | 17 (89.5%) |
| Public Administration | 8 (53.3%) | 7 (46.7%) |
| Total | 165 (50.9%) | 159 (49.1%) |
Education in Vermontville
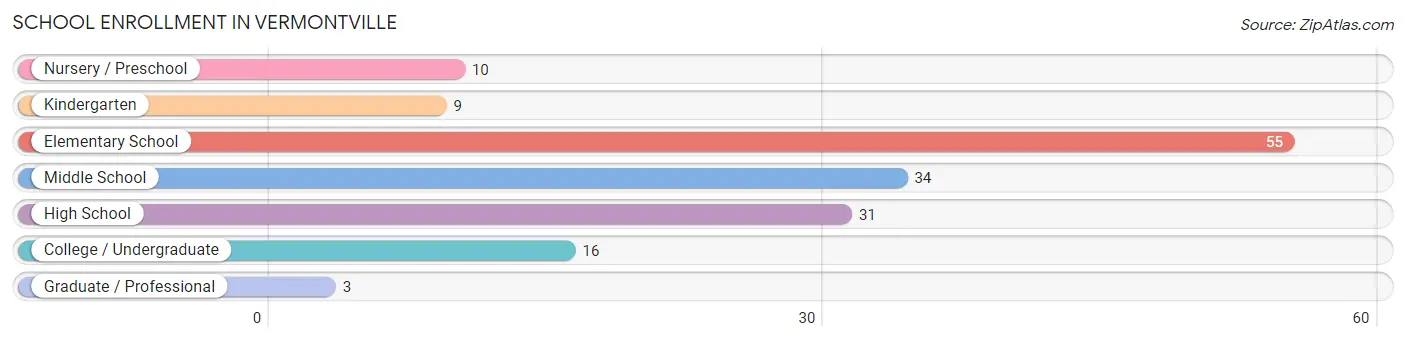
School Enrollment in Vermontville
The most common levels of schooling among the 158 students in Vermontville are elementary school (55 | 34.8%), middle school (34 | 21.5%), and high school (31 | 19.6%).
| School Level | # Students | % Students |
| Nursery / Preschool | 10 | 6.3% |
| Kindergarten | 9 | 5.7% |
| Elementary School | 55 | 34.8% |
| Middle School | 34 | 21.5% |
| High School | 31 | 19.6% |
| College / Undergraduate | 16 | 10.1% |
| Graduate / Professional | 3 | 1.9% |
| Total | 158 | 100.0% |
School Enrollment by Age by Funding Source in Vermontville
Out of a total of 158 students who are enrolled in schools in Vermontville, 15 (9.5%) attend a private institution, while the remaining 143 (90.5%) are enrolled in public schools. The age group of 18 to 19 year olds has the highest likelihood of being enrolled in private schools, with 3 (33.3% in the age bracket) enrolled. Conversely, the age group of 3 to 4 year olds has the lowest likelihood of being enrolled in a private school, with 5 (100.0% in the age bracket) attending a public institution.
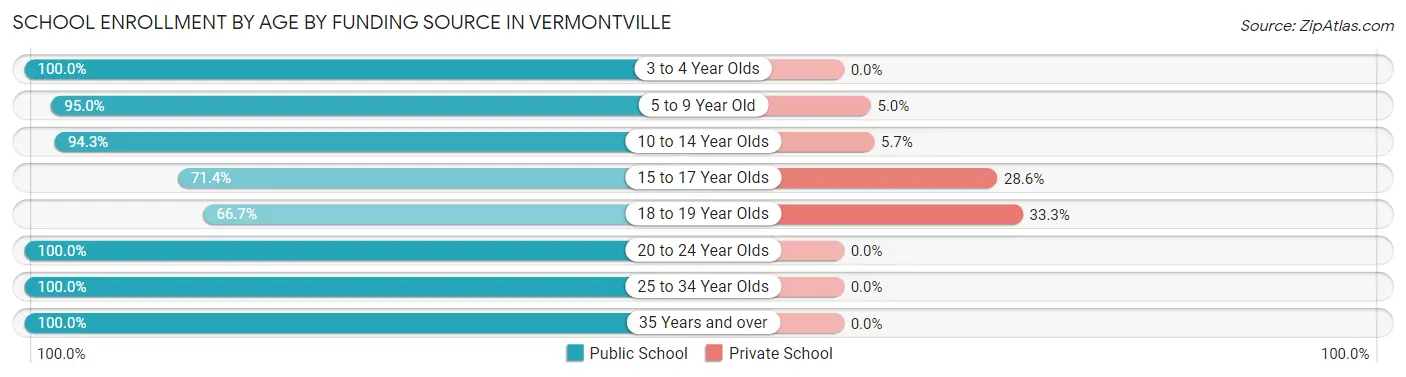
| Age Bracket | Public School | Private School |
| 3 to 4 Year Olds | 5 (100.0%) | 0 (0.0%) |
| 5 to 9 Year Old | 57 (95.0%) | 3 (5.0%) |
| 10 to 14 Year Olds | 50 (94.3%) | 3 (5.7%) |
| 15 to 17 Year Olds | 15 (71.4%) | 6 (28.6%) |
| 18 to 19 Year Olds | 6 (66.7%) | 3 (33.3%) |
| 20 to 24 Year Olds | 4 (100.0%) | 0 (0.0%) |
| 25 to 34 Year Olds | 3 (100.0%) | 0 (0.0%) |
| 35 Years and over | 3 (100.0%) | 0 (0.0%) |
| Total | 143 (90.5%) | 15 (9.5%) |
Educational Attainment by Field of Study in Vermontville
Computers & mathematics (17 | 34.7%), science & technology (12 | 24.5%), business (10 | 20.4%), physical & health sciences (4 | 8.2%), and liberal arts & history (3 | 6.1%) are the most common fields of study among 49 individuals in Vermontville who have obtained a bachelor's degree or higher.
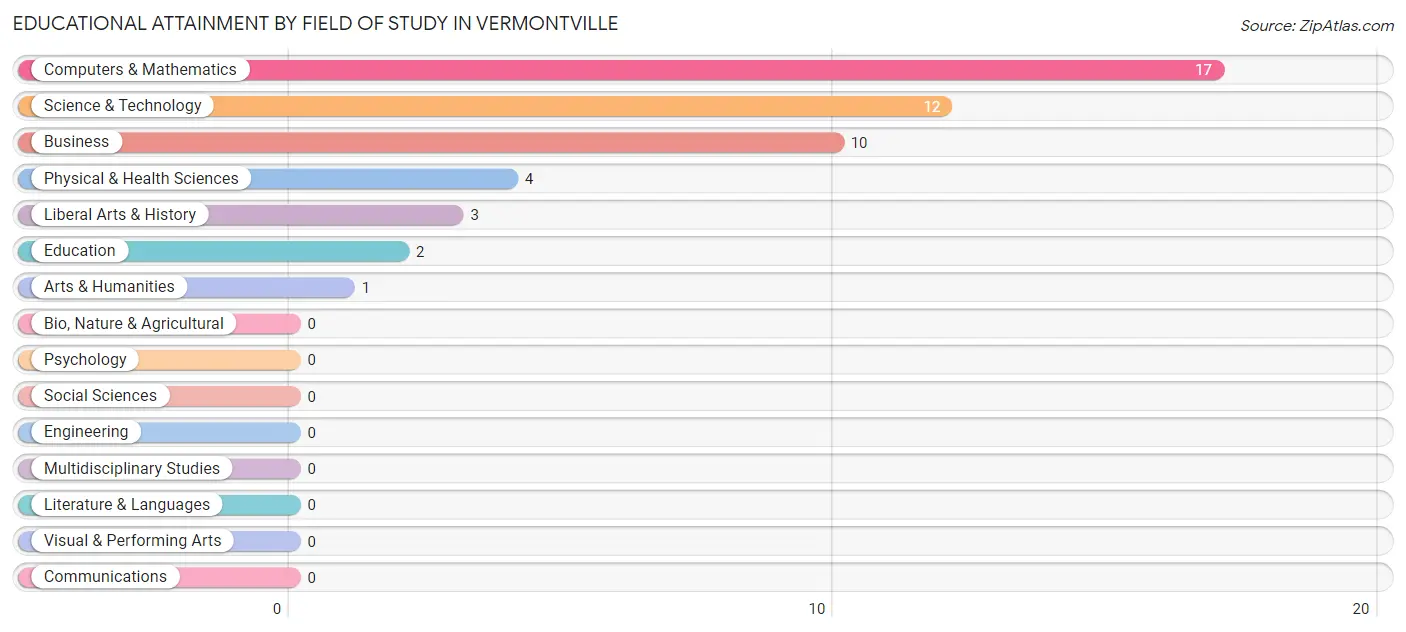
| Field of Study | # Graduates | % Graduates |
| Computers & Mathematics | 17 | 34.7% |
| Bio, Nature & Agricultural | 0 | 0.0% |
| Physical & Health Sciences | 4 | 8.2% |
| Psychology | 0 | 0.0% |
| Social Sciences | 0 | 0.0% |
| Engineering | 0 | 0.0% |
| Multidisciplinary Studies | 0 | 0.0% |
| Science & Technology | 12 | 24.5% |
| Business | 10 | 20.4% |
| Education | 2 | 4.1% |
| Literature & Languages | 0 | 0.0% |
| Liberal Arts & History | 3 | 6.1% |
| Visual & Performing Arts | 0 | 0.0% |
| Communications | 0 | 0.0% |
| Arts & Humanities | 1 | 2.0% |
| Total | 49 | 100.0% |
Transportation & Commute in Vermontville
Vehicle Availability by Sex in Vermontville
The most prevalent vehicle ownership categories in Vermontville are males with 2 vehicles (76, accounting for 47.2%) and females with 2 vehicles (83, making up 48.7%).
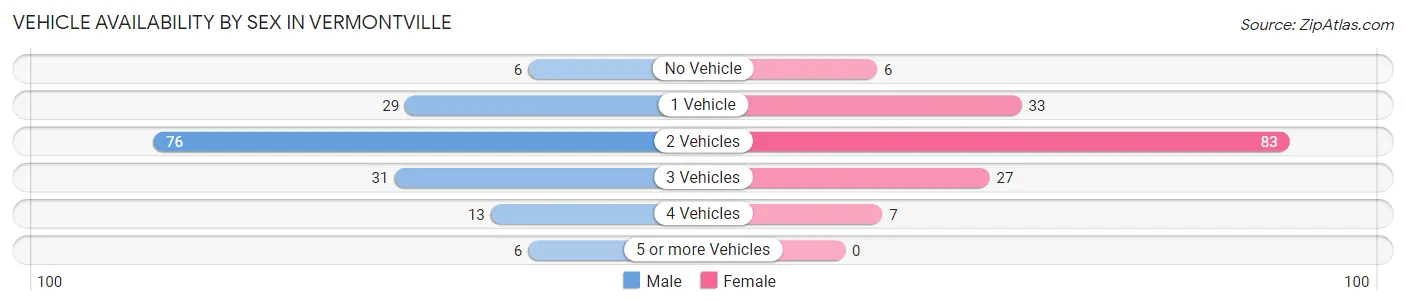
| Vehicles Available | Male | Female |
| No Vehicle | 6 (3.7%) | 6 (3.8%) |
| 1 Vehicle | 29 (18.0%) | 33 (21.1%) |
| 2 Vehicles | 76 (47.2%) | 83 (53.2%) |
| 3 Vehicles | 31 (19.3%) | 27 (17.3%) |
| 4 Vehicles | 13 (8.1%) | 7 (4.5%) |
| 5 or more Vehicles | 6 (3.7%) | 0 (0.0%) |
| Total | 161 (100.0%) | 156 (100.0%) |
Commute Time in Vermontville
The most frequently occuring commute durations in Vermontville are 20 to 24 minutes (89 commuters, 30.0%), 30 to 34 minutes (43 commuters, 14.5%), and 10 to 14 minutes (31 commuters, 10.4%).
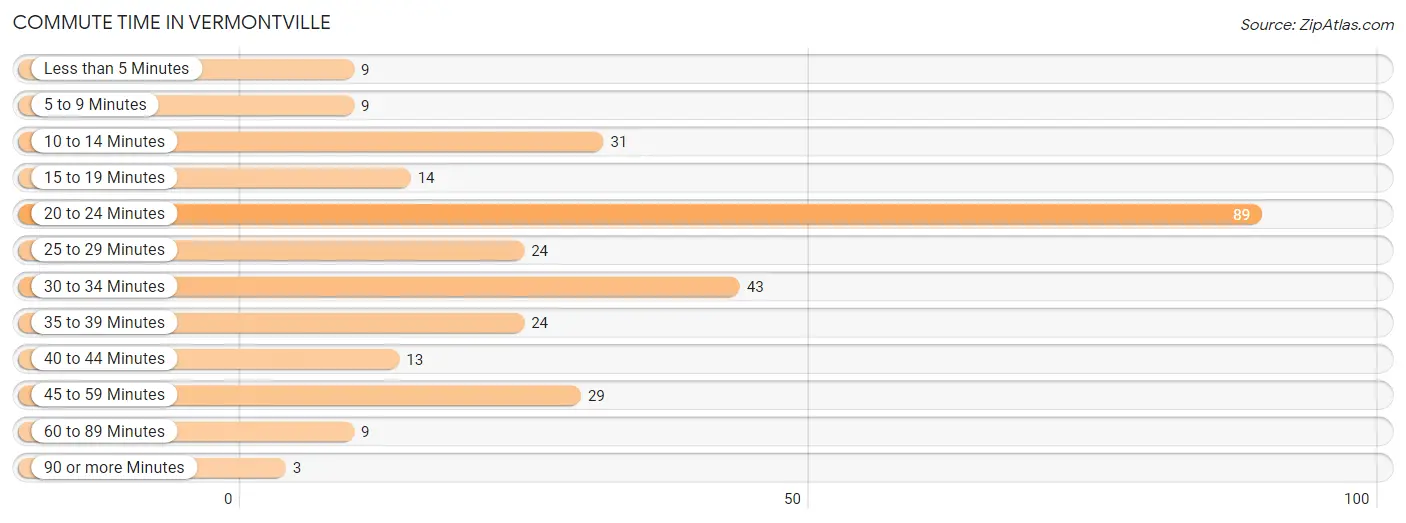
| Commute Time | # Commuters | % Commuters |
| Less than 5 Minutes | 9 | 3.0% |
| 5 to 9 Minutes | 9 | 3.0% |
| 10 to 14 Minutes | 31 | 10.4% |
| 15 to 19 Minutes | 14 | 4.7% |
| 20 to 24 Minutes | 89 | 30.0% |
| 25 to 29 Minutes | 24 | 8.1% |
| 30 to 34 Minutes | 43 | 14.5% |
| 35 to 39 Minutes | 24 | 8.1% |
| 40 to 44 Minutes | 13 | 4.4% |
| 45 to 59 Minutes | 29 | 9.8% |
| 60 to 89 Minutes | 9 | 3.0% |
| 90 or more Minutes | 3 | 1.0% |
Commute Time by Sex in Vermontville
The most common commute times in Vermontville are 20 to 24 minutes (48 commuters, 31.2%) for males and 20 to 24 minutes (41 commuters, 28.7%) for females.
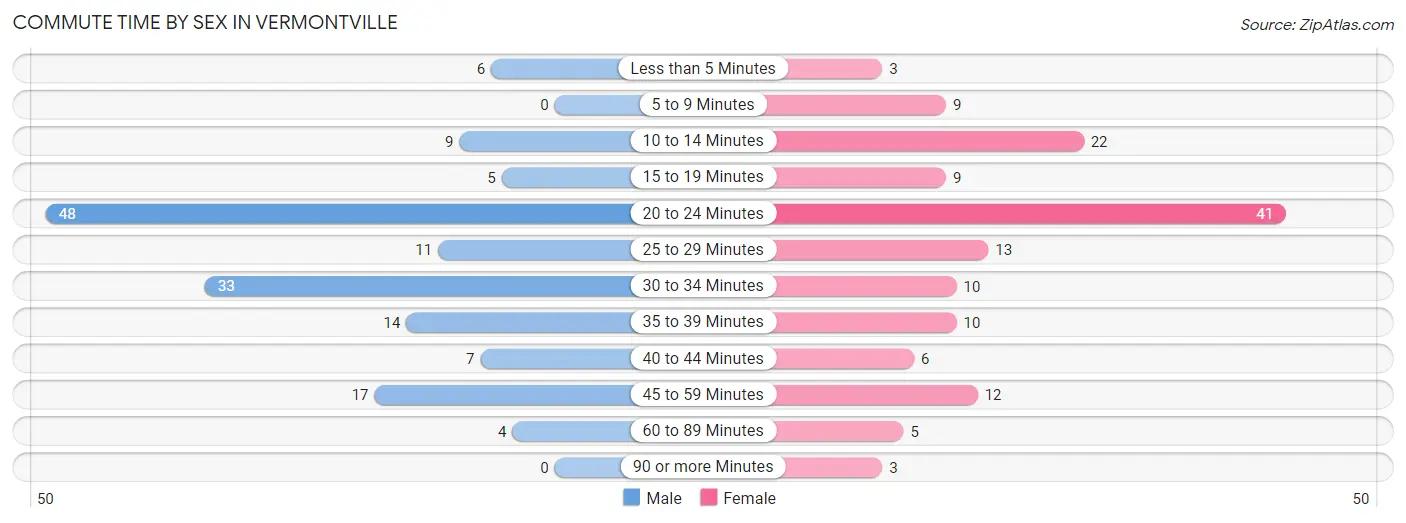
| Commute Time | Male | Female |
| Less than 5 Minutes | 6 (3.9%) | 3 (2.1%) |
| 5 to 9 Minutes | 0 (0.0%) | 9 (6.3%) |
| 10 to 14 Minutes | 9 (5.8%) | 22 (15.4%) |
| 15 to 19 Minutes | 5 (3.3%) | 9 (6.3%) |
| 20 to 24 Minutes | 48 (31.2%) | 41 (28.7%) |
| 25 to 29 Minutes | 11 (7.1%) | 13 (9.1%) |
| 30 to 34 Minutes | 33 (21.4%) | 10 (7.0%) |
| 35 to 39 Minutes | 14 (9.1%) | 10 (7.0%) |
| 40 to 44 Minutes | 7 (4.5%) | 6 (4.2%) |
| 45 to 59 Minutes | 17 (11.0%) | 12 (8.4%) |
| 60 to 89 Minutes | 4 (2.6%) | 5 (3.5%) |
| 90 or more Minutes | 0 (0.0%) | 3 (2.1%) |
Time of Departure to Work by Sex in Vermontville
The most frequent times of departure to work in Vermontville are 6:00 AM to 6:29 AM (56, 36.4%) for males and 7:00 AM to 7:29 AM (23, 16.1%) for females.
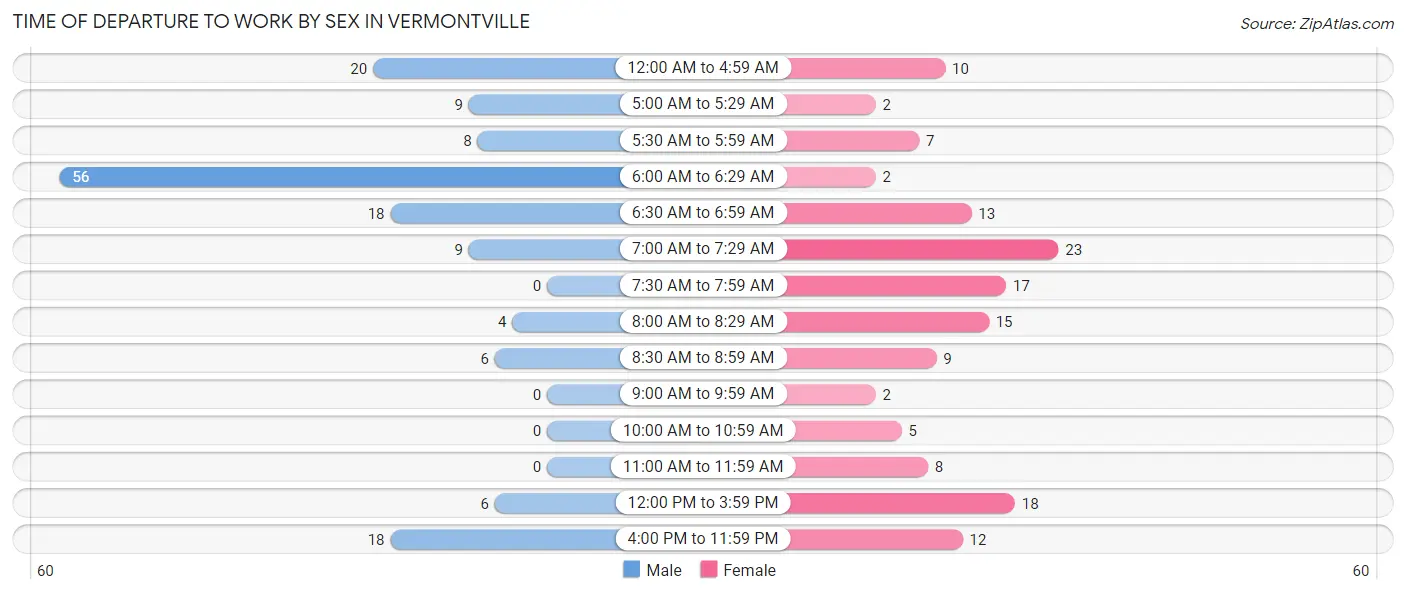
| Time of Departure | Male | Female |
| 12:00 AM to 4:59 AM | 20 (13.0%) | 10 (7.0%) |
| 5:00 AM to 5:29 AM | 9 (5.8%) | 2 (1.4%) |
| 5:30 AM to 5:59 AM | 8 (5.2%) | 7 (4.9%) |
| 6:00 AM to 6:29 AM | 56 (36.4%) | 2 (1.4%) |
| 6:30 AM to 6:59 AM | 18 (11.7%) | 13 (9.1%) |
| 7:00 AM to 7:29 AM | 9 (5.8%) | 23 (16.1%) |
| 7:30 AM to 7:59 AM | 0 (0.0%) | 17 (11.9%) |
| 8:00 AM to 8:29 AM | 4 (2.6%) | 15 (10.5%) |
| 8:30 AM to 8:59 AM | 6 (3.9%) | 9 (6.3%) |
| 9:00 AM to 9:59 AM | 0 (0.0%) | 2 (1.4%) |
| 10:00 AM to 10:59 AM | 0 (0.0%) | 5 (3.5%) |
| 11:00 AM to 11:59 AM | 0 (0.0%) | 8 (5.6%) |
| 12:00 PM to 3:59 PM | 6 (3.9%) | 18 (12.6%) |
| 4:00 PM to 11:59 PM | 18 (11.7%) | 12 (8.4%) |
| Total | 154 (100.0%) | 143 (100.0%) |
Housing Occupancy in Vermontville
Occupancy by Ownership in Vermontville
Of the total 293 dwellings in Vermontville, owner-occupied units account for 197 (67.2%), while renter-occupied units make up 96 (32.8%).
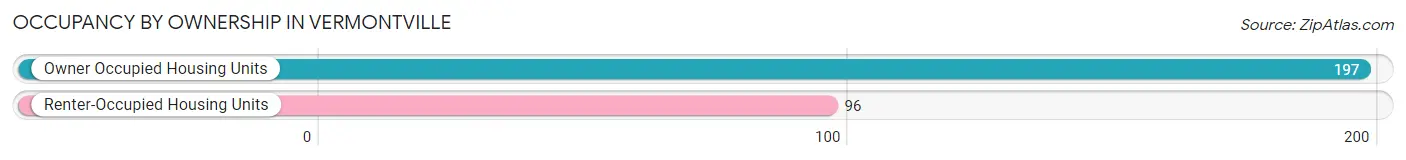
| Occupancy | # Housing Units | % Housing Units |
| Owner Occupied Housing Units | 197 | 67.2% |
| Renter-Occupied Housing Units | 96 | 32.8% |
| Total Occupied Housing Units | 293 | 100.0% |
Occupancy by Household Size in Vermontville
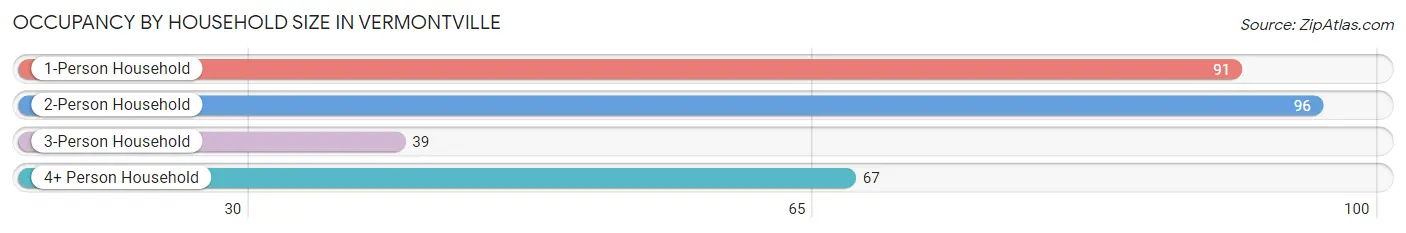
| Household Size | # Housing Units | % Housing Units |
| 1-Person Household | 91 | 31.1% |
| 2-Person Household | 96 | 32.8% |
| 3-Person Household | 39 | 13.3% |
| 4+ Person Household | 67 | 22.9% |
| Total Housing Units | 293 | 100.0% |
Occupancy by Ownership by Household Size in Vermontville
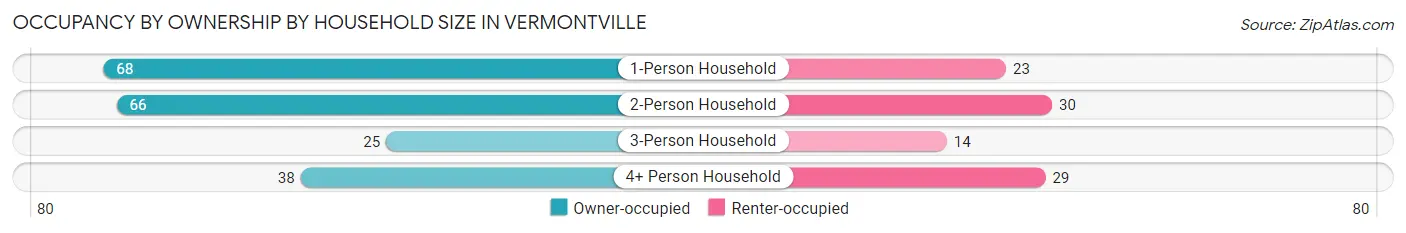
| Household Size | Owner-occupied | Renter-occupied |
| 1-Person Household | 68 (74.7%) | 23 (25.3%) |
| 2-Person Household | 66 (68.8%) | 30 (31.2%) |
| 3-Person Household | 25 (64.1%) | 14 (35.9%) |
| 4+ Person Household | 38 (56.7%) | 29 (43.3%) |
| Total Housing Units | 197 (67.2%) | 96 (32.8%) |
Occupancy by Educational Attainment in Vermontville
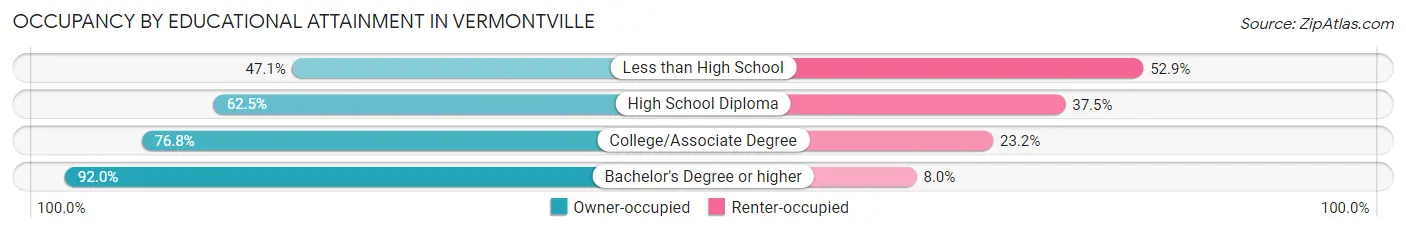
| Household Size | Owner-occupied | Renter-occupied |
| Less than High School | 16 (47.1%) | 18 (52.9%) |
| High School Diploma | 95 (62.5%) | 57 (37.5%) |
| College/Associate Degree | 63 (76.8%) | 19 (23.2%) |
| Bachelor's Degree or higher | 23 (92.0%) | 2 (8.0%) |
Occupancy by Age of Householder in Vermontville
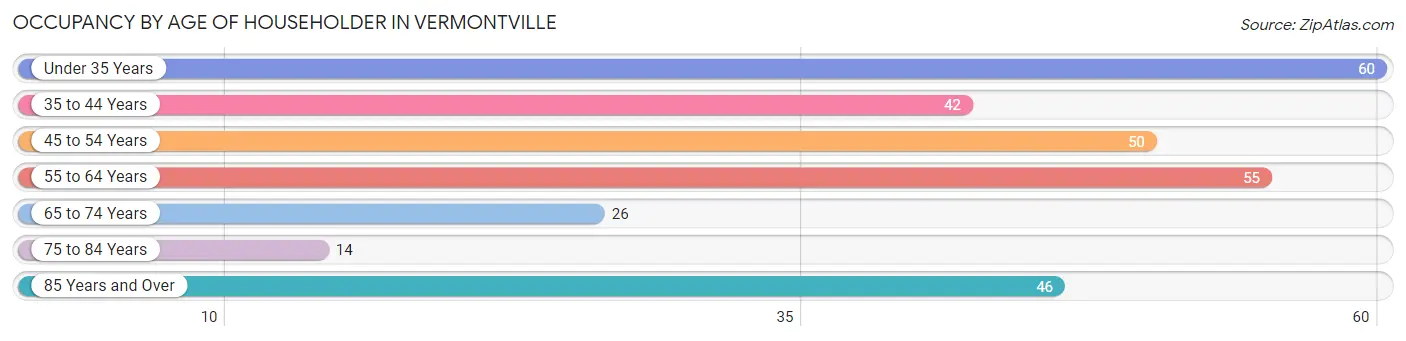
| Age Bracket | # Households | % Households |
| Under 35 Years | 60 | 20.5% |
| 35 to 44 Years | 42 | 14.3% |
| 45 to 54 Years | 50 | 17.1% |
| 55 to 64 Years | 55 | 18.8% |
| 65 to 74 Years | 26 | 8.9% |
| 75 to 84 Years | 14 | 4.8% |
| 85 Years and Over | 46 | 15.7% |
| Total | 293 | 100.0% |
Housing Finances in Vermontville
Median Income by Occupancy in Vermontville
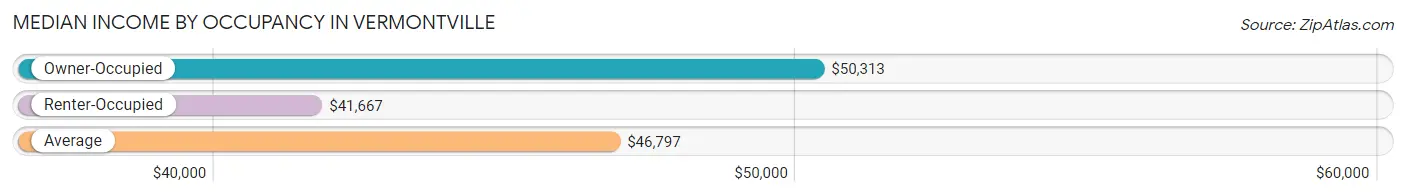
| Occupancy Type | # Households | Median Income |
| Owner-Occupied | 197 (67.2%) | $50,313 |
| Renter-Occupied | 96 (32.8%) | $41,667 |
| Average | 293 (100.0%) | $46,797 |
Occupancy by Householder Income Bracket in Vermontville
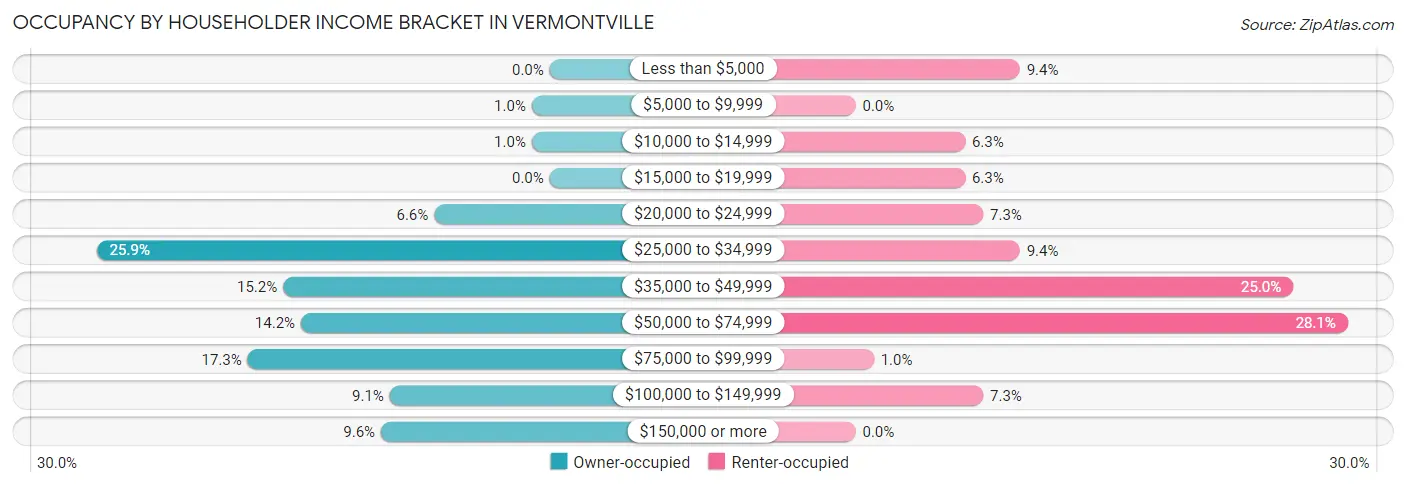
| Income Bracket | Owner-occupied | Renter-occupied |
| Less than $5,000 | 0 (0.0%) | 9 (9.4%) |
| $5,000 to $9,999 | 2 (1.0%) | 0 (0.0%) |
| $10,000 to $14,999 | 2 (1.0%) | 6 (6.2%) |
| $15,000 to $19,999 | 0 (0.0%) | 6 (6.2%) |
| $20,000 to $24,999 | 13 (6.6%) | 7 (7.3%) |
| $25,000 to $34,999 | 51 (25.9%) | 9 (9.4%) |
| $35,000 to $49,999 | 30 (15.2%) | 24 (25.0%) |
| $50,000 to $74,999 | 28 (14.2%) | 27 (28.1%) |
| $75,000 to $99,999 | 34 (17.3%) | 1 (1.0%) |
| $100,000 to $149,999 | 18 (9.1%) | 7 (7.3%) |
| $150,000 or more | 19 (9.6%) | 0 (0.0%) |
| Total | 197 (100.0%) | 96 (100.0%) |
Monthly Housing Cost Tiers in Vermontville
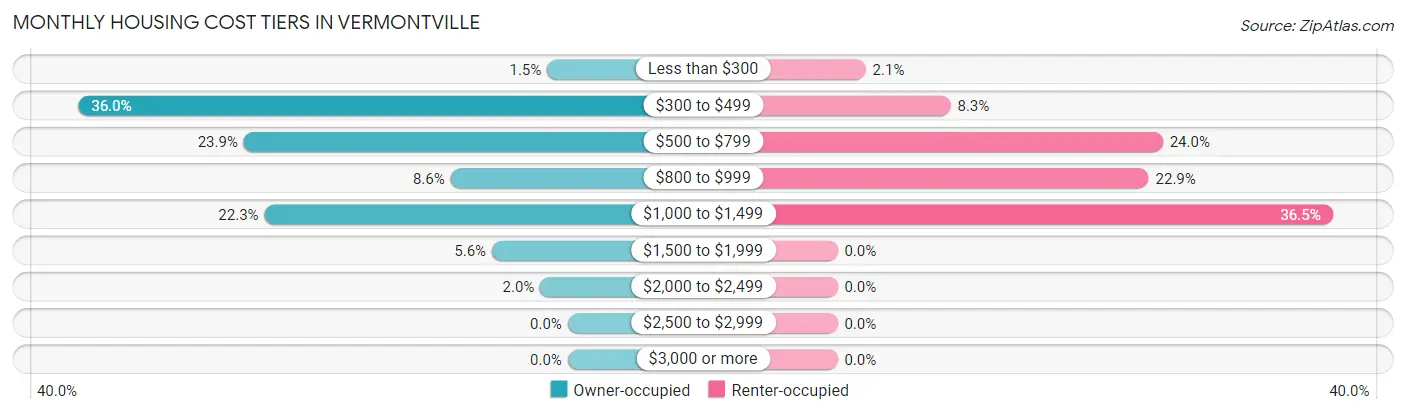
| Monthly Cost | Owner-occupied | Renter-occupied |
| Less than $300 | 3 (1.5%) | 2 (2.1%) |
| $300 to $499 | 71 (36.0%) | 8 (8.3%) |
| $500 to $799 | 47 (23.9%) | 23 (24.0%) |
| $800 to $999 | 17 (8.6%) | 22 (22.9%) |
| $1,000 to $1,499 | 44 (22.3%) | 35 (36.5%) |
| $1,500 to $1,999 | 11 (5.6%) | 0 (0.0%) |
| $2,000 to $2,499 | 4 (2.0%) | 0 (0.0%) |
| $2,500 to $2,999 | 0 (0.0%) | 0 (0.0%) |
| $3,000 or more | 0 (0.0%) | 0 (0.0%) |
| Total | 197 (100.0%) | 96 (100.0%) |
Physical Housing Characteristics in Vermontville
Housing Structures in Vermontville
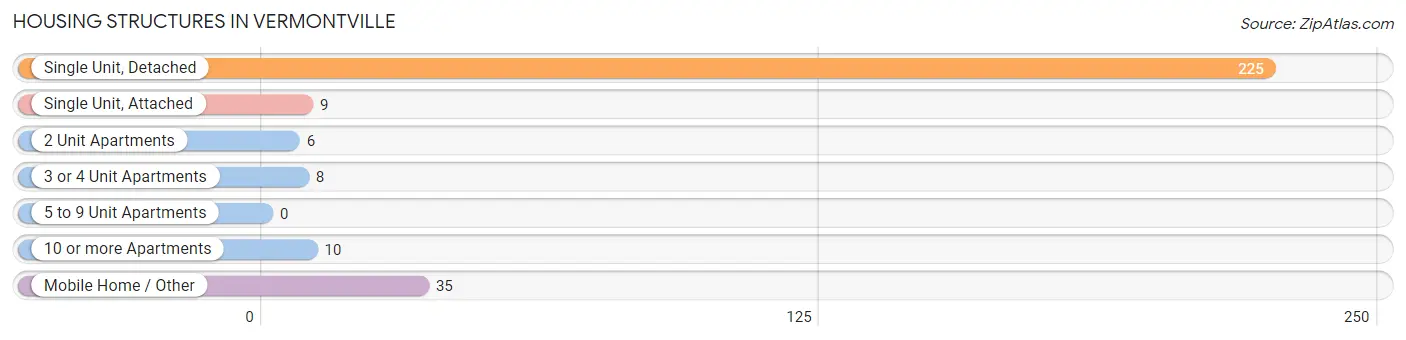
| Structure Type | # Housing Units | % Housing Units |
| Single Unit, Detached | 225 | 76.8% |
| Single Unit, Attached | 9 | 3.1% |
| 2 Unit Apartments | 6 | 2.1% |
| 3 or 4 Unit Apartments | 8 | 2.7% |
| 5 to 9 Unit Apartments | 0 | 0.0% |
| 10 or more Apartments | 10 | 3.4% |
| Mobile Home / Other | 35 | 11.9% |
| Total | 293 | 100.0% |
Housing Structures by Occupancy in Vermontville
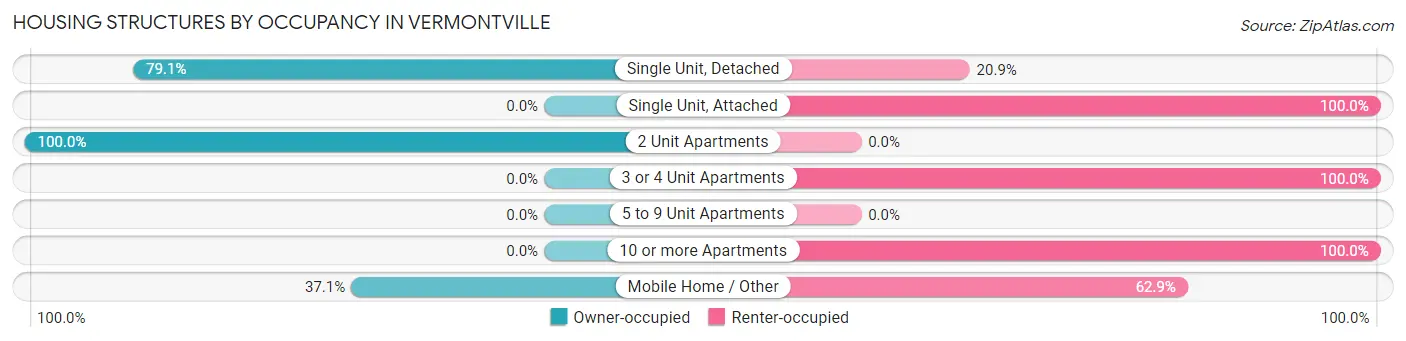
| Structure Type | Owner-occupied | Renter-occupied |
| Single Unit, Detached | 178 (79.1%) | 47 (20.9%) |
| Single Unit, Attached | 0 (0.0%) | 9 (100.0%) |
| 2 Unit Apartments | 6 (100.0%) | 0 (0.0%) |
| 3 or 4 Unit Apartments | 0 (0.0%) | 8 (100.0%) |
| 5 to 9 Unit Apartments | 0 (0.0%) | 0 (0.0%) |
| 10 or more Apartments | 0 (0.0%) | 10 (100.0%) |
| Mobile Home / Other | 13 (37.1%) | 22 (62.9%) |
| Total | 197 (67.2%) | 96 (32.8%) |
Housing Structures by Number of Rooms in Vermontville
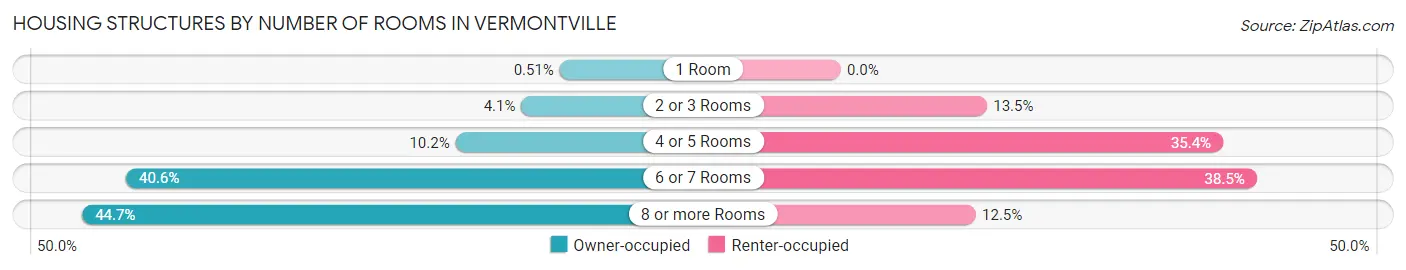
| Number of Rooms | Owner-occupied | Renter-occupied |
| 1 Room | 1 (0.5%) | 0 (0.0%) |
| 2 or 3 Rooms | 8 (4.1%) | 13 (13.5%) |
| 4 or 5 Rooms | 20 (10.2%) | 34 (35.4%) |
| 6 or 7 Rooms | 80 (40.6%) | 37 (38.5%) |
| 8 or more Rooms | 88 (44.7%) | 12 (12.5%) |
| Total | 197 (100.0%) | 96 (100.0%) |
Housing Structure by Heating Type in Vermontville
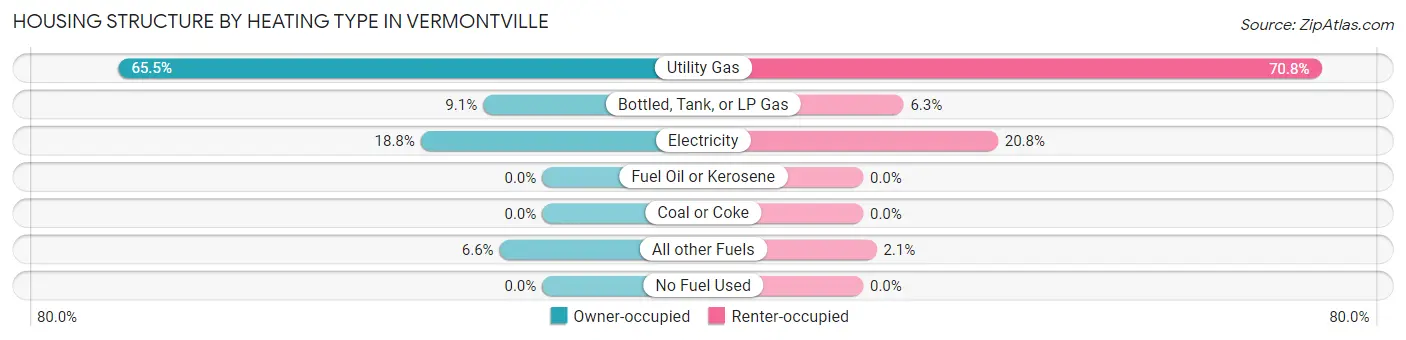
| Heating Type | Owner-occupied | Renter-occupied |
| Utility Gas | 129 (65.5%) | 68 (70.8%) |
| Bottled, Tank, or LP Gas | 18 (9.1%) | 6 (6.2%) |
| Electricity | 37 (18.8%) | 20 (20.8%) |
| Fuel Oil or Kerosene | 0 (0.0%) | 0 (0.0%) |
| Coal or Coke | 0 (0.0%) | 0 (0.0%) |
| All other Fuels | 13 (6.6%) | 2 (2.1%) |
| No Fuel Used | 0 (0.0%) | 0 (0.0%) |
| Total | 197 (100.0%) | 96 (100.0%) |
Household Vehicle Usage in Vermontville
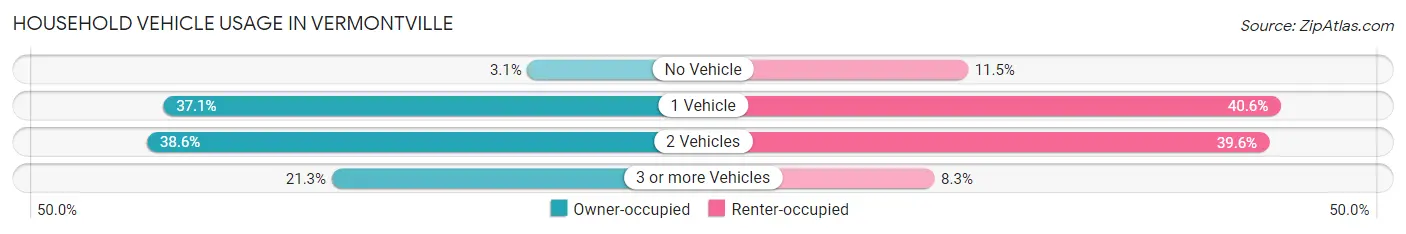
| Vehicles per Household | Owner-occupied | Renter-occupied |
| No Vehicle | 6 (3.0%) | 11 (11.5%) |
| 1 Vehicle | 73 (37.1%) | 39 (40.6%) |
| 2 Vehicles | 76 (38.6%) | 38 (39.6%) |
| 3 or more Vehicles | 42 (21.3%) | 8 (8.3%) |
| Total | 197 (100.0%) | 96 (100.0%) |
Real Estate & Mortgages in Vermontville
Real Estate and Mortgage Overview in Vermontville
| Characteristic | Without Mortgage | With Mortgage |
| Housing Units | 106 | 91 |
| Median Property Value | $106,600 | $147,300 |
| Median Household Income | $33,750 | $17 |
| Monthly Housing Costs | $460 | $0 |
| Real Estate Taxes | $2,157 | $17 |
Property Value by Mortgage Status in Vermontville
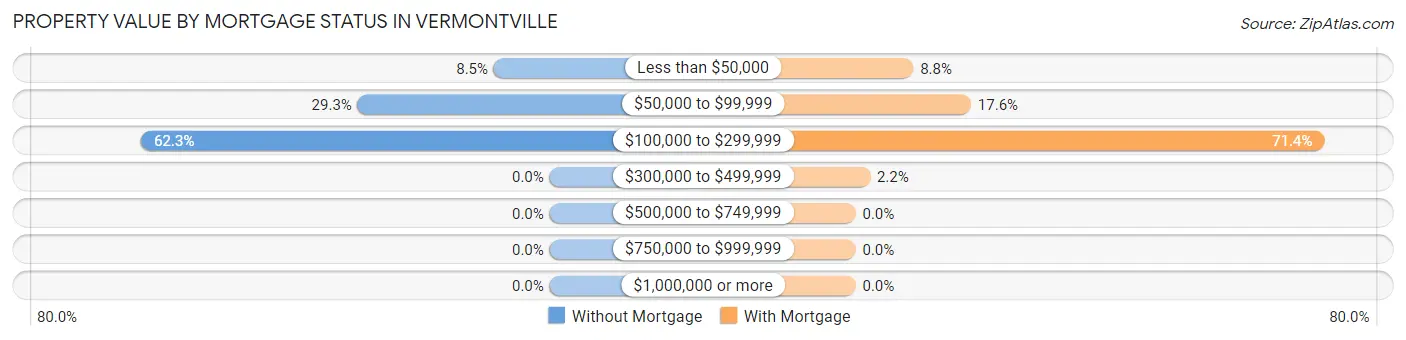
| Property Value | Without Mortgage | With Mortgage |
| Less than $50,000 | 9 (8.5%) | 8 (8.8%) |
| $50,000 to $99,999 | 31 (29.2%) | 16 (17.6%) |
| $100,000 to $299,999 | 66 (62.3%) | 65 (71.4%) |
| $300,000 to $499,999 | 0 (0.0%) | 2 (2.2%) |
| $500,000 to $749,999 | 0 (0.0%) | 0 (0.0%) |
| $750,000 to $999,999 | 0 (0.0%) | 0 (0.0%) |
| $1,000,000 or more | 0 (0.0%) | 0 (0.0%) |
| Total | 106 (100.0%) | 91 (100.0%) |
Household Income by Mortgage Status in Vermontville
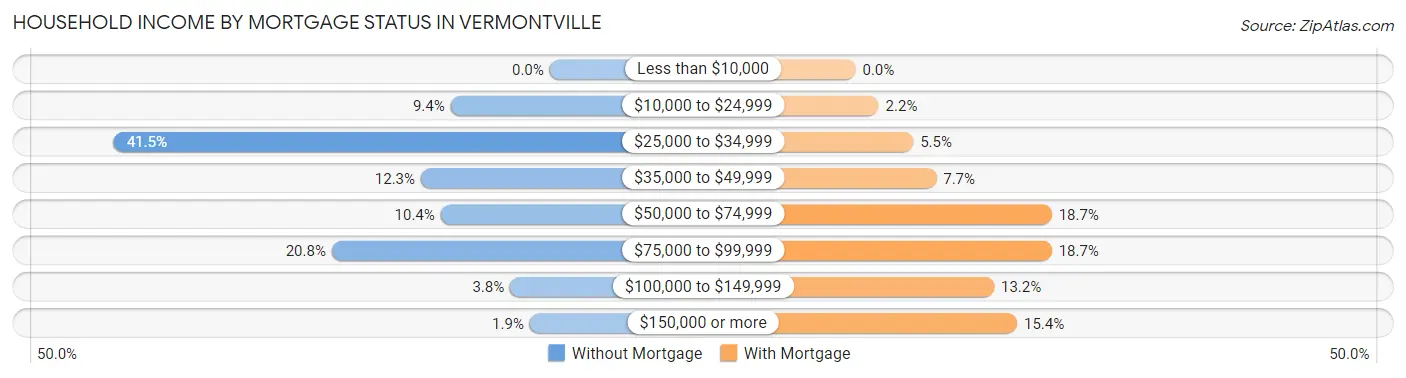
| Household Income | Without Mortgage | With Mortgage |
| Less than $10,000 | 0 (0.0%) | 0 (0.0%) |
| $10,000 to $24,999 | 10 (9.4%) | 2 (2.2%) |
| $25,000 to $34,999 | 44 (41.5%) | 5 (5.5%) |
| $35,000 to $49,999 | 13 (12.3%) | 7 (7.7%) |
| $50,000 to $74,999 | 11 (10.4%) | 17 (18.7%) |
| $75,000 to $99,999 | 22 (20.7%) | 17 (18.7%) |
| $100,000 to $149,999 | 4 (3.8%) | 12 (13.2%) |
| $150,000 or more | 2 (1.9%) | 14 (15.4%) |
| Total | 106 (100.0%) | 91 (100.0%) |
Property Value to Household Income Ratio in Vermontville
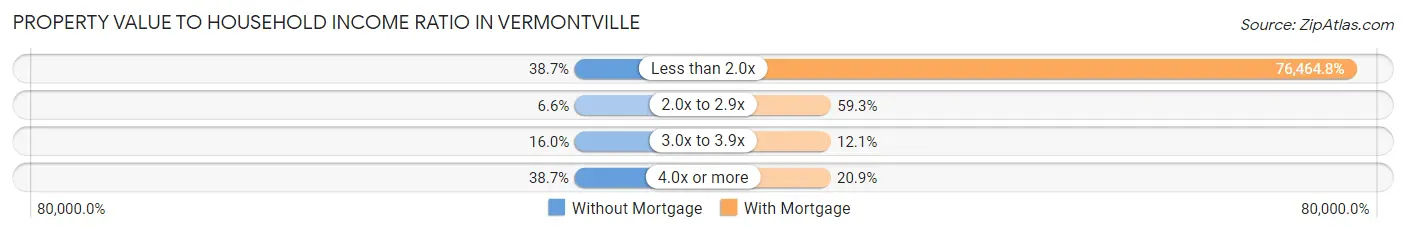
| Value-to-Income Ratio | Without Mortgage | With Mortgage |
| Less than 2.0x | 41 (38.7%) | 69,583 (76,464.8%) |
| 2.0x to 2.9x | 7 (6.6%) | 54 (59.3%) |
| 3.0x to 3.9x | 17 (16.0%) | 11 (12.1%) |
| 4.0x or more | 41 (38.7%) | 19 (20.9%) |
| Total | 106 (100.0%) | 91 (100.0%) |
Real Estate Taxes by Mortgage Status in Vermontville
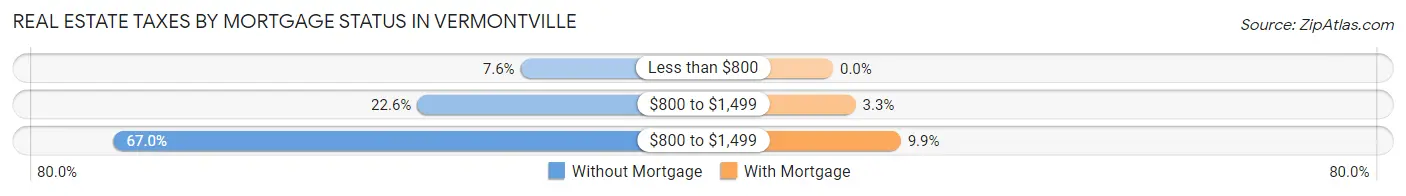
| Property Taxes | Without Mortgage | With Mortgage |
| Less than $800 | 8 (7.5%) | 0 (0.0%) |
| $800 to $1,499 | 24 (22.6%) | 3 (3.3%) |
| $800 to $1,499 | 71 (67.0%) | 9 (9.9%) |
| Total | 106 (100.0%) | 91 (100.0%) |
Health & Disability in Vermontville
Health Insurance Coverage by Age in Vermontville
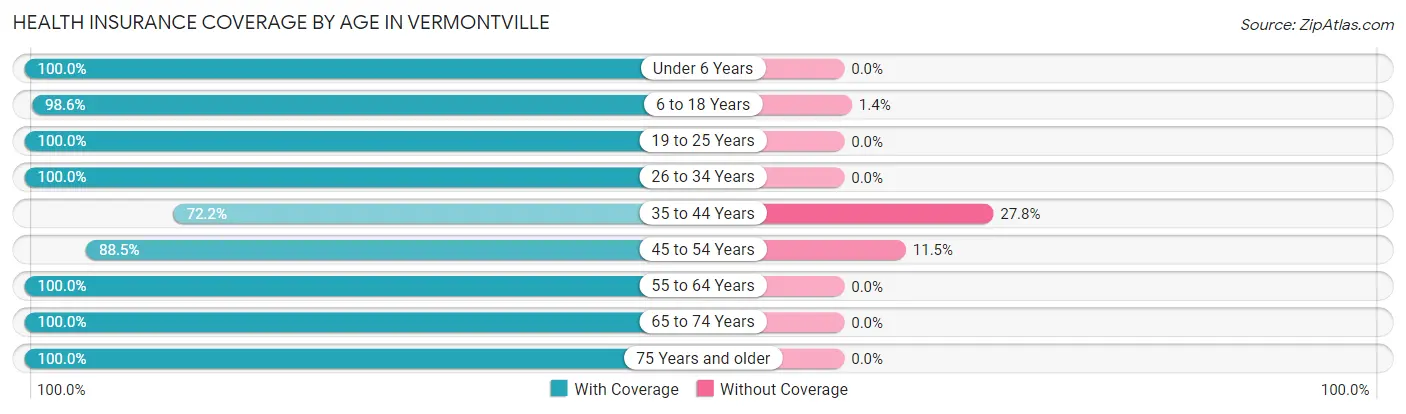
| Age Bracket | With Coverage | Without Coverage |
| Under 6 Years | 60 (100.0%) | 0 (0.0%) |
| 6 to 18 Years | 139 (98.6%) | 2 (1.4%) |
| 19 to 25 Years | 40 (100.0%) | 0 (0.0%) |
| 26 to 34 Years | 124 (100.0%) | 0 (0.0%) |
| 35 to 44 Years | 65 (72.2%) | 25 (27.8%) |
| 45 to 54 Years | 54 (88.5%) | 7 (11.5%) |
| 55 to 64 Years | 91 (100.0%) | 0 (0.0%) |
| 65 to 74 Years | 40 (100.0%) | 0 (0.0%) |
| 75 Years and older | 70 (100.0%) | 0 (0.0%) |
| Total | 683 (95.3%) | 34 (4.7%) |
Health Insurance Coverage by Citizenship Status in Vermontville
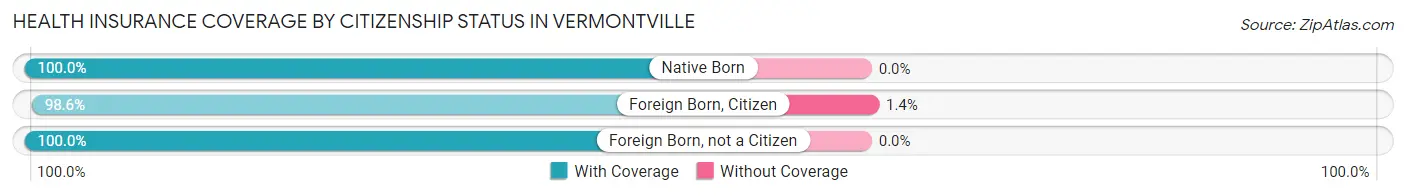
| Citizenship Status | With Coverage | Without Coverage |
| Native Born | 60 (100.0%) | 0 (0.0%) |
| Foreign Born, Citizen | 139 (98.6%) | 2 (1.4%) |
| Foreign Born, not a Citizen | 40 (100.0%) | 0 (0.0%) |
Health Insurance Coverage by Household Income in Vermontville
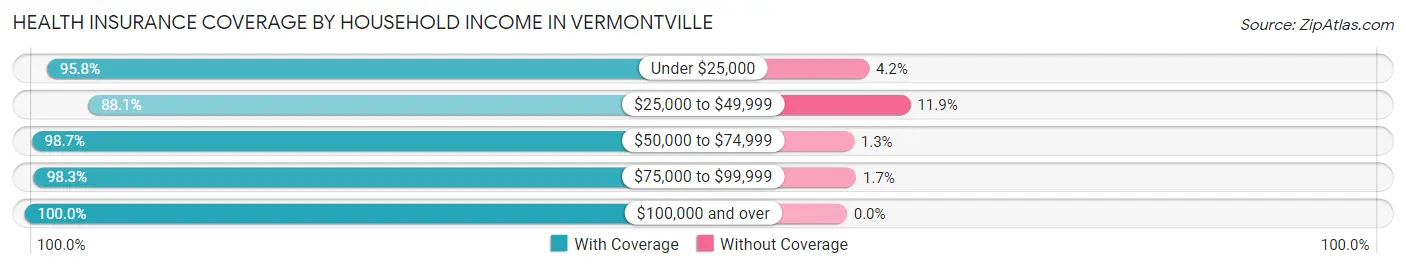
| Household Income | With Coverage | Without Coverage |
| Under $25,000 | 92 (95.8%) | 4 (4.2%) |
| $25,000 to $49,999 | 192 (88.1%) | 26 (11.9%) |
| $50,000 to $74,999 | 150 (98.7%) | 2 (1.3%) |
| $75,000 to $99,999 | 113 (98.3%) | 2 (1.7%) |
| $100,000 and over | 136 (100.0%) | 0 (0.0%) |
Public vs Private Health Insurance Coverage by Age in Vermontville
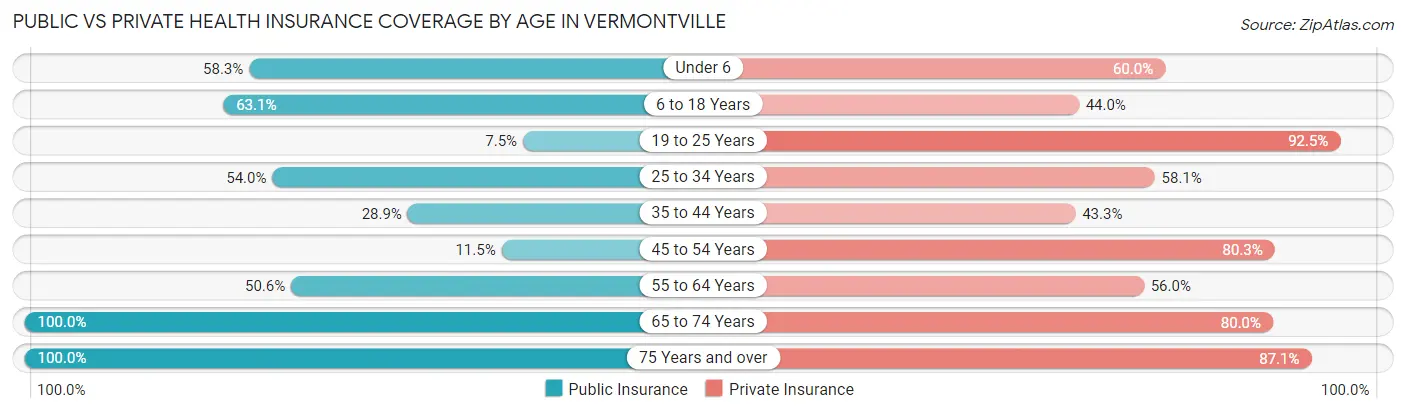
| Age Bracket | Public Insurance | Private Insurance |
| Under 6 | 35 (58.3%) | 36 (60.0%) |
| 6 to 18 Years | 89 (63.1%) | 62 (44.0%) |
| 19 to 25 Years | 3 (7.5%) | 37 (92.5%) |
| 25 to 34 Years | 67 (54.0%) | 72 (58.1%) |
| 35 to 44 Years | 26 (28.9%) | 39 (43.3%) |
| 45 to 54 Years | 7 (11.5%) | 49 (80.3%) |
| 55 to 64 Years | 46 (50.5%) | 51 (56.0%) |
| 65 to 74 Years | 40 (100.0%) | 32 (80.0%) |
| 75 Years and over | 70 (100.0%) | 61 (87.1%) |
| Total | 383 (53.4%) | 439 (61.2%) |
Disability Status by Sex by Age in Vermontville
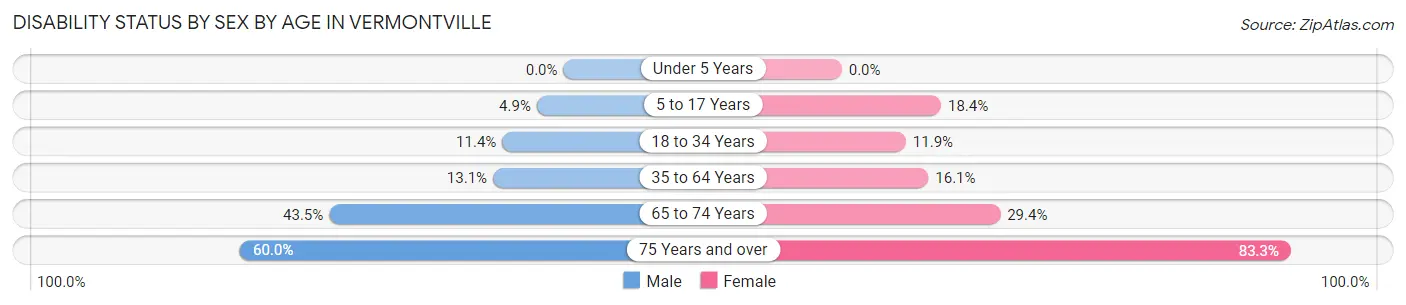
| Age Bracket | Male | Female |
| Under 5 Years | 0 (0.0%) | 0 (0.0%) |
| 5 to 17 Years | 4 (4.9%) | 14 (18.4%) |
| 18 to 34 Years | 10 (11.4%) | 10 (11.9%) |
| 35 to 64 Years | 17 (13.1%) | 18 (16.1%) |
| 65 to 74 Years | 10 (43.5%) | 5 (29.4%) |
| 75 Years and over | 6 (60.0%) | 50 (83.3%) |
Disability Class by Sex by Age in Vermontville
Disability Class: Hearing Difficulty
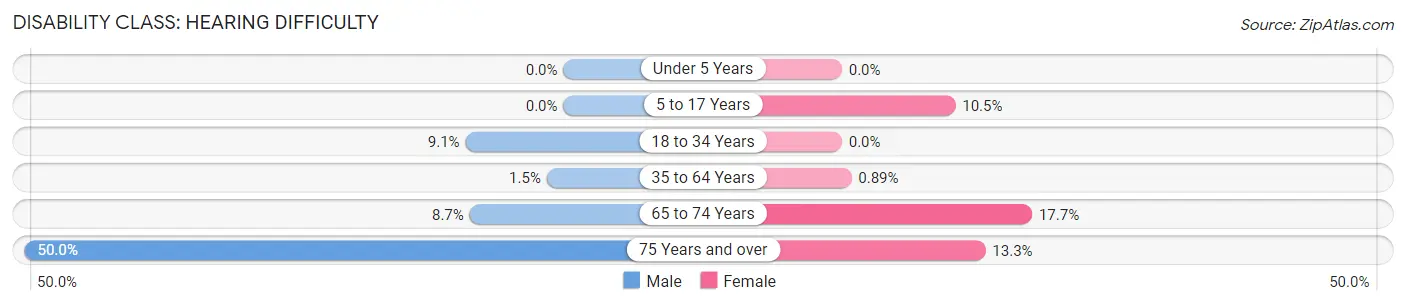
| Age Bracket | Male | Female |
| Under 5 Years | 0 (0.0%) | 0 (0.0%) |
| 5 to 17 Years | 0 (0.0%) | 8 (10.5%) |
| 18 to 34 Years | 8 (9.1%) | 0 (0.0%) |
| 35 to 64 Years | 2 (1.5%) | 1 (0.9%) |
| 65 to 74 Years | 2 (8.7%) | 3 (17.6%) |
| 75 Years and over | 5 (50.0%) | 8 (13.3%) |
Disability Class: Vision Difficulty
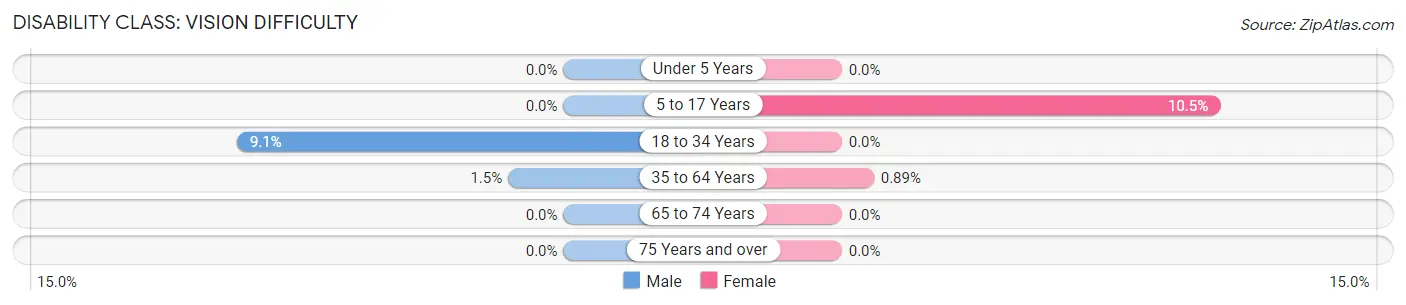
| Age Bracket | Male | Female |
| Under 5 Years | 0 (0.0%) | 0 (0.0%) |
| 5 to 17 Years | 0 (0.0%) | 8 (10.5%) |
| 18 to 34 Years | 8 (9.1%) | 0 (0.0%) |
| 35 to 64 Years | 2 (1.5%) | 1 (0.9%) |
| 65 to 74 Years | 0 (0.0%) | 0 (0.0%) |
| 75 Years and over | 0 (0.0%) | 0 (0.0%) |
Disability Class: Cognitive Difficulty
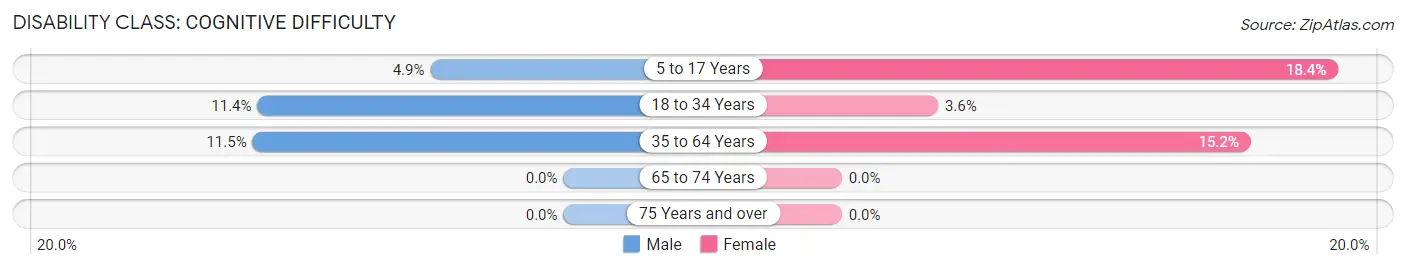
| Age Bracket | Male | Female |
| 5 to 17 Years | 4 (4.9%) | 14 (18.4%) |
| 18 to 34 Years | 10 (11.4%) | 3 (3.6%) |
| 35 to 64 Years | 15 (11.5%) | 17 (15.2%) |
| 65 to 74 Years | 0 (0.0%) | 0 (0.0%) |
| 75 Years and over | 0 (0.0%) | 0 (0.0%) |
Disability Class: Ambulatory Difficulty
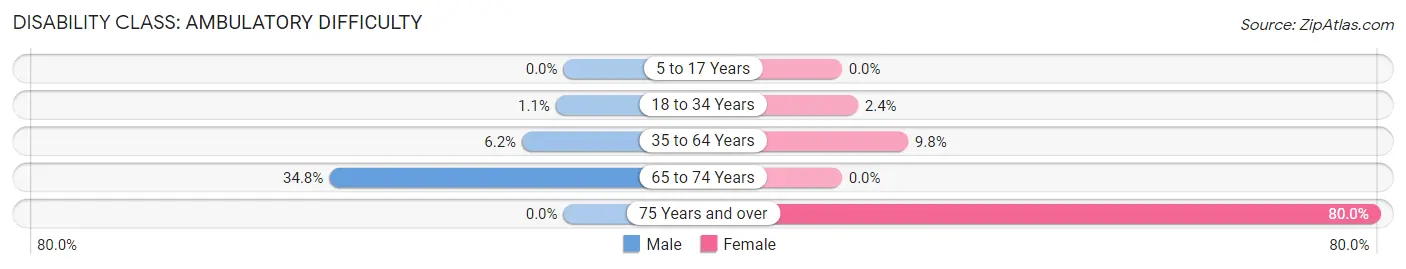
| Age Bracket | Male | Female |
| 5 to 17 Years | 0 (0.0%) | 0 (0.0%) |
| 18 to 34 Years | 1 (1.1%) | 2 (2.4%) |
| 35 to 64 Years | 8 (6.1%) | 11 (9.8%) |
| 65 to 74 Years | 8 (34.8%) | 0 (0.0%) |
| 75 Years and over | 0 (0.0%) | 48 (80.0%) |
Disability Class: Self-Care Difficulty
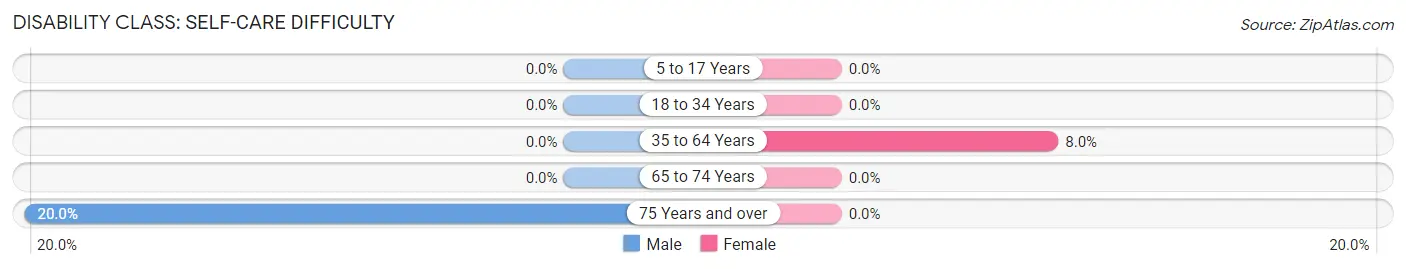
| Age Bracket | Male | Female |
| 5 to 17 Years | 0 (0.0%) | 0 (0.0%) |
| 18 to 34 Years | 0 (0.0%) | 0 (0.0%) |
| 35 to 64 Years | 0 (0.0%) | 9 (8.0%) |
| 65 to 74 Years | 0 (0.0%) | 0 (0.0%) |
| 75 Years and over | 2 (20.0%) | 0 (0.0%) |
Technology Access in Vermontville
Computing Device Access in Vermontville
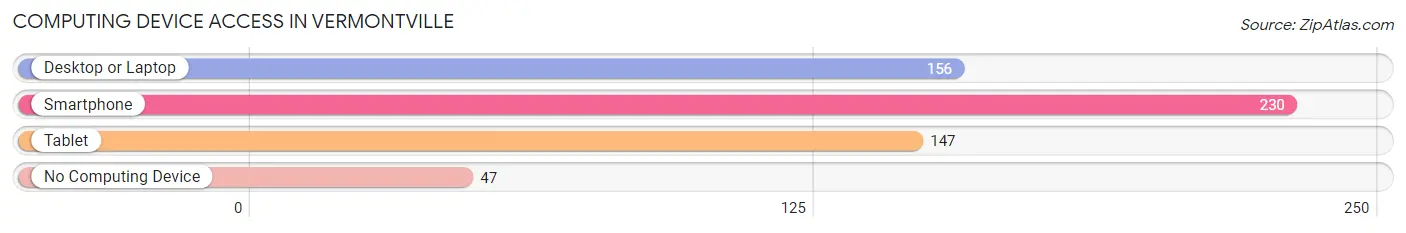
| Device Type | # Households | % Households |
| Desktop or Laptop | 156 | 53.2% |
| Smartphone | 230 | 78.5% |
| Tablet | 147 | 50.2% |
| No Computing Device | 47 | 16.0% |
| Total | 293 | 100.0% |
Internet Access in Vermontville
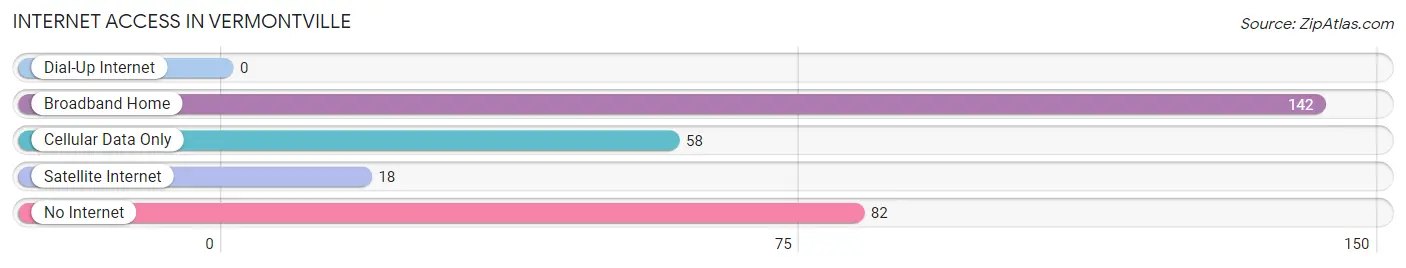
| Internet Type | # Households | % Households |
| Dial-Up Internet | 0 | 0.0% |
| Broadband Home | 142 | 48.5% |
| Cellular Data Only | 58 | 19.8% |
| Satellite Internet | 18 | 6.1% |
| No Internet | 82 | 28.0% |
| Total | 293 | 100.0% |
Vermontville Summary
Vermontville is a small village located in the central part of Michigan, in Eaton County. It is situated on the banks of the Grand River, about 20 miles east of Lansing, the state capital. The village has a population of about 1,000 people, and is part of the Grand Rapids-Wyoming Metropolitan Statistical Area.
History
Vermontville was founded in 1836 by a group of settlers from Vermont. The village was named after the state of Vermont, and was originally known as “Vermont Settlement”. The settlers were attracted to the area by the abundance of timber and the potential for farming. The village was incorporated in 1867, and the first post office was established in 1868.
In the late 19th century, Vermontville was a thriving agricultural community. The village was home to several sawmills, gristmills, and a woolen mill. The village also had a number of stores, a hotel, and a blacksmith shop.
In the early 20th century, the village began to decline as the timber industry declined and the population shifted to larger cities. The village was hit hard by the Great Depression, and many of the businesses closed. The village was also affected by the decline of the railroad industry, as the Grand Rapids and Indiana Railroad stopped running through the village in the 1950s.
Geography
Vermontville is located in the central part of Michigan, in Eaton County. The village is situated on the banks of the Grand River, about 20 miles east of Lansing, the state capital. The village is surrounded by rolling hills and farmland, and is located in the Grand River Valley.
The climate in Vermontville is typical of the Midwest, with cold winters and hot, humid summers. The average annual temperature is around 50 degrees Fahrenheit, and the average annual precipitation is around 35 inches.
Economy
Vermontville’s economy is largely based on agriculture. The village is home to several farms, and the surrounding area is known for its production of corn, soybeans, and wheat. The village also has a number of small businesses, including a grocery store, a hardware store, and a few restaurants.
The village is also home to a number of manufacturing companies, including a plastics manufacturer and a metal fabrication company. The village is also home to a number of small service businesses, such as auto repair shops and a printing company.
Demographics
As of the 2010 census, the population of Vermontville was 1,037. The population is predominantly white (97.2%), with a small percentage of African Americans (1.2%) and Hispanics (1.1%). The median household income is $41,250, and the median home value is $90,000. The village has a high rate of homeownership (83.3%), and the unemployment rate is 4.2%.
Vermontville is a small, rural village with a rich history and a strong sense of community. The village is home to a number of small businesses, and the surrounding area is known for its agricultural production. The village is also home to a number of manufacturing companies, and the population is predominantly white.
Common Questions
What is Per Capita Income in Vermontville?
Per Capita income in Vermontville is $25,553.
What is the Median Family Income in Vermontville?
Median Family Income in Vermontville is $61,250.
What is the Median Household income in Vermontville?
Median Household Income in Vermontville is $46,797.
What is Income or Wage Gap in Vermontville?
Income or Wage Gap in Vermontville is 8.5%.
Women in Vermontville earn 91.5 cents for every dollar earned by a man.
What is Inequality or Gini Index in Vermontville?
Inequality or Gini Index in Vermontville is 0.40.
What is the Total Population of Vermontville?
Total Population of Vermontville is 717.
What is the Total Male Population of Vermontville?
Total Male Population of Vermontville is 352.
What is the Total Female Population of Vermontville?
Total Female Population of Vermontville is 365.
What is the Ratio of Males per 100 Females in Vermontville?
There are 96.44 Males per 100 Females in Vermontville.
What is the Ratio of Females per 100 Males in Vermontville?
There are 103.69 Females per 100 Males in Vermontville.
What is the Median Population Age in Vermontville?
Median Population Age in Vermontville is 34.5 Years.
What is the Average Family Size in Vermontville
Average Family Size in Vermontville is 3.1 People.
What is the Average Household Size in Vermontville
Average Household Size in Vermontville is 2.5 People.
How Large is the Labor Force in Vermontville?
There are 345 People in the Labor Forcein in Vermontville.
What is the Percentage of People in the Labor Force in Vermontville?
63.7% of People are in the Labor Force in Vermontville.
What is the Unemployment Rate in Vermontville?
Unemployment Rate in Vermontville is 6.1%.