Allen, MI Map & Demographics
Allen Map
Allen Overview
$23,642
PER CAPITA INCOME
$52,500
AVG FAMILY INCOME
$52,083
AVG HOUSEHOLD INCOME
5.2%
WAGE / INCOME GAP [ % ]
94.8¢/ $1
WAGE / INCOME GAP [ $ ]
0.31
INEQUALITY / GINI INDEX
213
TOTAL POPULATION
107
MALE POPULATION
106
FEMALE POPULATION
100.94
MALES / 100 FEMALES
99.07
FEMALES / 100 MALES
36.6
MEDIAN AGE
3.7
AVG FAMILY SIZE
2.6
AVG HOUSEHOLD SIZE
93
LABOR FORCE [ PEOPLE ]
57.8%
PERCENT IN LABOR FORCE
24.7%
UNEMPLOYMENT RATE
Allen Zip Codes
Allen Area Codes
Income in Allen
Income Overview in Allen
Per Capita Income in Allen is $23,642, while median incomes of families and households are $52,500 and $52,083 respectively.
| Characteristic | Number | Measure |
| Per Capita Income | 213 | $23,642 |
| Median Family Income | 44 | $52,500 |
| Mean Family Income | 44 | $61,395 |
| Median Household Income | 83 | $52,083 |
| Mean Household Income | 83 | $58,427 |
| Income Deficit | 44 | $0 |
| Wage / Income Gap (%) | 213 | 5.20% |
| Wage / Income Gap ($) | 213 | 94.80¢ per $1 |
| Gini / Inequality Index | 213 | 0.31 |
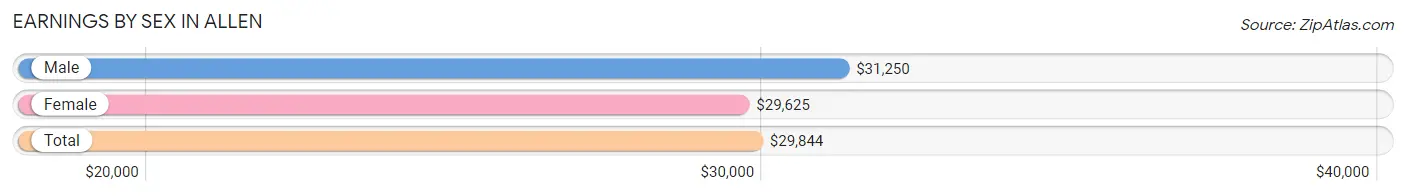
Earnings by Sex in Allen
Average Earnings in Allen are $29,844, $31,250 for men and $29,625 for women, a difference of 5.2%.
| Sex | Number | Average Earnings |
| Male | 61 (59.8%) | $31,250 |
| Female | 41 (40.2%) | $29,625 |
| Total | 102 (100.0%) | $29,844 |
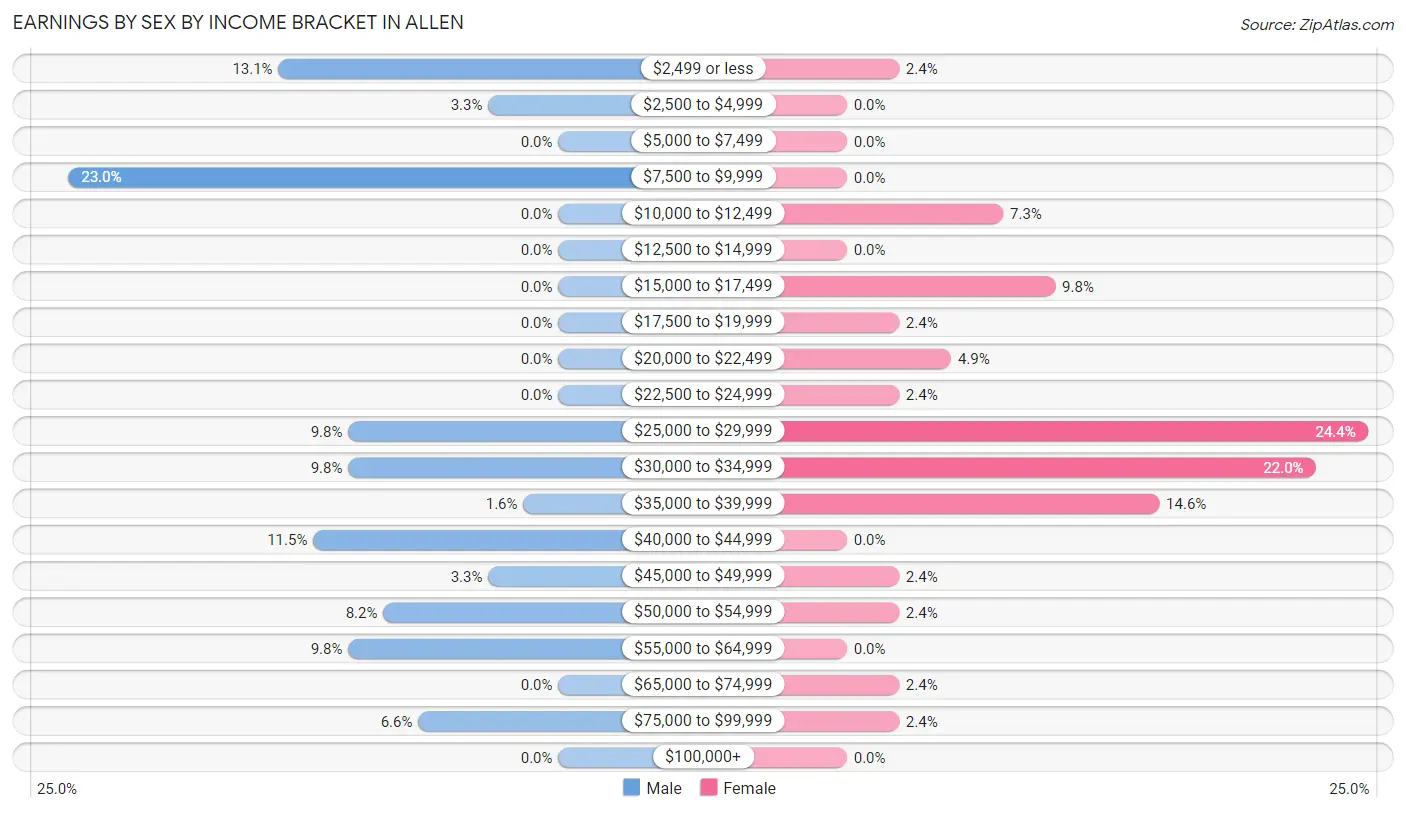
Earnings by Sex by Income Bracket in Allen
The most common earnings brackets in Allen are $7,500 to $9,999 for men (14 | 23.0%) and $25,000 to $29,999 for women (10 | 24.4%).
| Income | Male | Female |
| $2,499 or less | 8 (13.1%) | 1 (2.4%) |
| $2,500 to $4,999 | 2 (3.3%) | 0 (0.0%) |
| $5,000 to $7,499 | 0 (0.0%) | 0 (0.0%) |
| $7,500 to $9,999 | 14 (23.0%) | 0 (0.0%) |
| $10,000 to $12,499 | 0 (0.0%) | 3 (7.3%) |
| $12,500 to $14,999 | 0 (0.0%) | 0 (0.0%) |
| $15,000 to $17,499 | 0 (0.0%) | 4 (9.8%) |
| $17,500 to $19,999 | 0 (0.0%) | 1 (2.4%) |
| $20,000 to $22,499 | 0 (0.0%) | 2 (4.9%) |
| $22,500 to $24,999 | 0 (0.0%) | 1 (2.4%) |
| $25,000 to $29,999 | 6 (9.8%) | 10 (24.4%) |
| $30,000 to $34,999 | 6 (9.8%) | 9 (22.0%) |
| $35,000 to $39,999 | 1 (1.6%) | 6 (14.6%) |
| $40,000 to $44,999 | 7 (11.5%) | 0 (0.0%) |
| $45,000 to $49,999 | 2 (3.3%) | 1 (2.4%) |
| $50,000 to $54,999 | 5 (8.2%) | 1 (2.4%) |
| $55,000 to $64,999 | 6 (9.8%) | 0 (0.0%) |
| $65,000 to $74,999 | 0 (0.0%) | 1 (2.4%) |
| $75,000 to $99,999 | 4 (6.6%) | 1 (2.4%) |
| $100,000+ | 0 (0.0%) | 0 (0.0%) |
| Total | 61 (100.0%) | 41 (100.0%) |
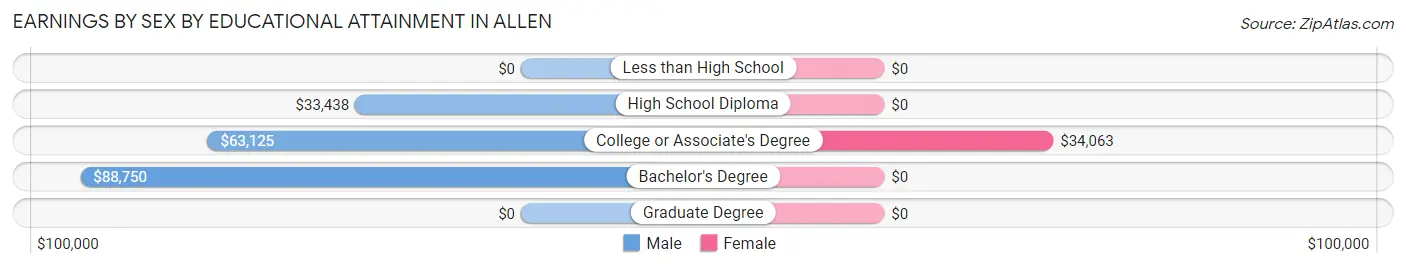
Earnings by Sex by Educational Attainment in Allen
Average earnings in Allen are $32,500 for men and $29,688 for women, a difference of 8.6%. Men with an educational attainment of bachelor's degree enjoy the highest average annual earnings of $88,750, while those with high school diploma education earn the least with $33,438. Women with an educational attainment of college or associate's degree earn the most with the average annual earnings of $34,063, while those with college or associate's degree education have the smallest earnings of $34,063.
| Educational Attainment | Male Income | Female Income |
| Less than High School | - | - |
| High School Diploma | $33,438 | $0 |
| College or Associate's Degree | $63,125 | $34,063 |
| Bachelor's Degree | $88,750 | $0 |
| Graduate Degree | - | - |
| Total | $32,500 | $29,688 |
Family Income in Allen
Family Income Brackets in Allen
According to the Allen family income data, there are 14 families falling into the $35,000 to $49,999 income range, which is the most common income bracket and makes up 31.8% of all families.
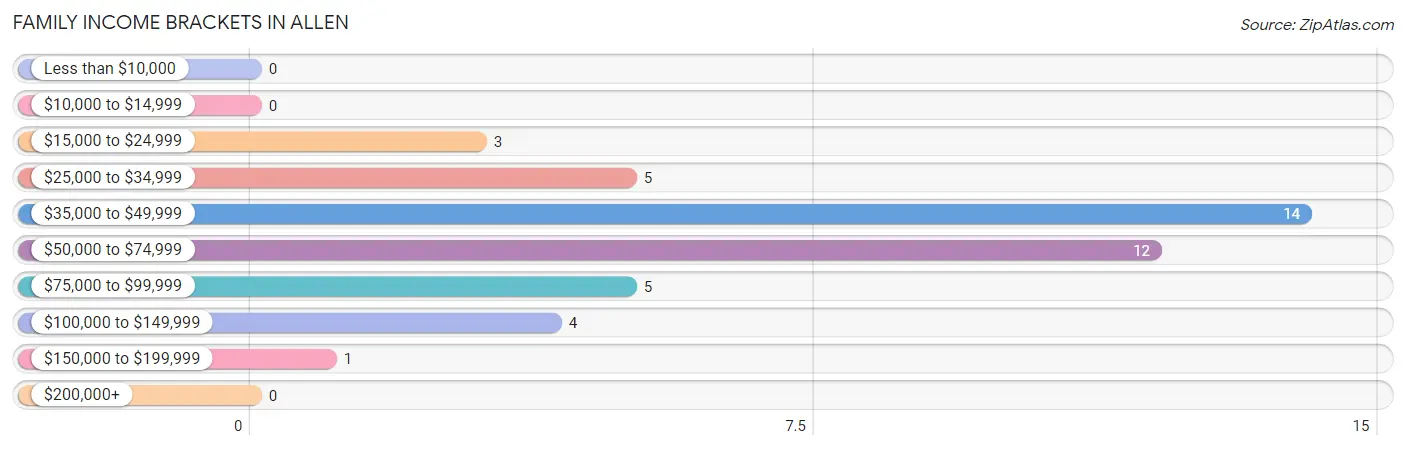
| Income Bracket | # Families | % Families |
| Less than $10,000 | 0 | 0.0% |
| $10,000 to $14,999 | 0 | 0.0% |
| $15,000 to $24,999 | 3 | 6.8% |
| $25,000 to $34,999 | 5 | 11.4% |
| $35,000 to $49,999 | 14 | 31.8% |
| $50,000 to $74,999 | 12 | 27.3% |
| $75,000 to $99,999 | 5 | 11.4% |
| $100,000 to $149,999 | 4 | 9.1% |
| $150,000 to $199,999 | 1 | 2.3% |
| $200,000+ | 0 | 0.0% |
Family Income by Famaliy Size in Allen
2-person families (20 | 45.5%) account for the highest median family income in Allen with $58,750 per family, while 2-person families (20 | 45.5%) have the highest median income of $29,375 per family member.
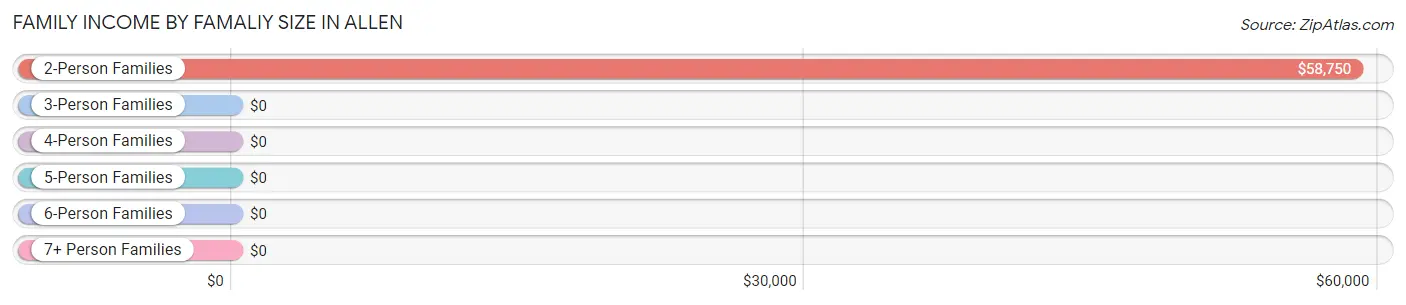
| Income Bracket | # Families | Median Income |
| 2-Person Families | 20 (45.5%) | $58,750 |
| 3-Person Families | 12 (27.3%) | $0 |
| 4-Person Families | 2 (4.5%) | $0 |
| 5-Person Families | 5 (11.4%) | $0 |
| 6-Person Families | 0 (0.0%) | $0 |
| 7+ Person Families | 5 (11.4%) | $0 |
| Total | 44 (100.0%) | $52,500 |
Family Income by Number of Earners in Allen
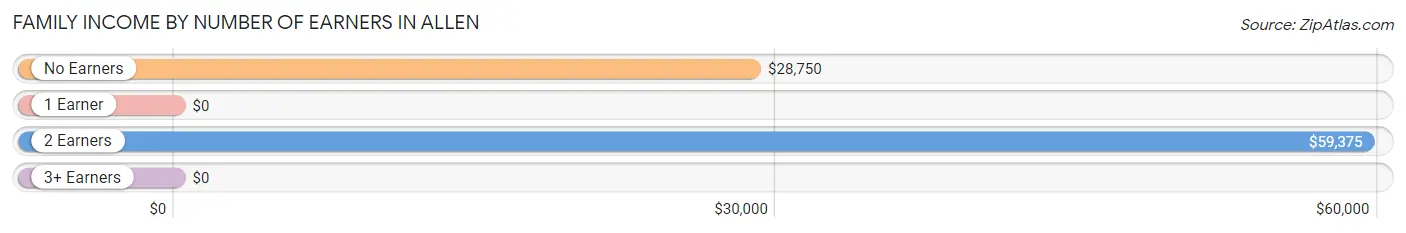
| Number of Earners | # Families | Median Income |
| No Earners | 5 (11.4%) | $28,750 |
| 1 Earner | 9 (20.4%) | $0 |
| 2 Earners | 29 (65.9%) | $59,375 |
| 3+ Earners | 1 (2.3%) | $0 |
| Total | 44 (100.0%) | $52,500 |
Household Income in Allen
Household Income Brackets in Allen
With 20 households falling in the category, the $50,000 to $74,999 income range is the most frequent in Allen, accounting for 24.1% of all households.
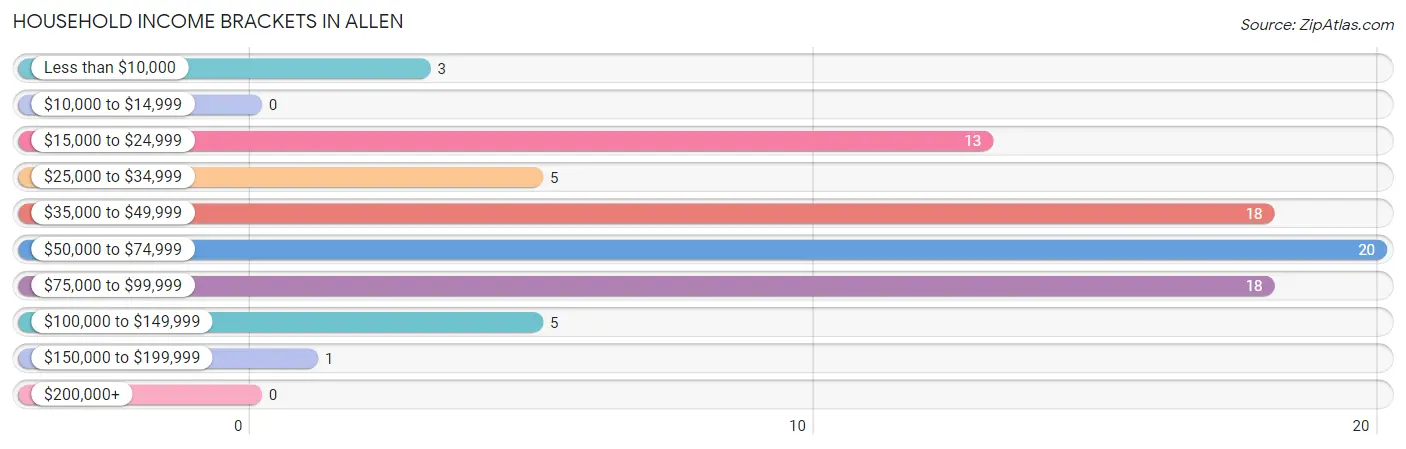
| Income Bracket | # Households | % Households |
| Less than $10,000 | 3 | 3.6% |
| $10,000 to $14,999 | 0 | 0.0% |
| $15,000 to $24,999 | 13 | 15.7% |
| $25,000 to $34,999 | 5 | 6.0% |
| $35,000 to $49,999 | 18 | 21.7% |
| $50,000 to $74,999 | 20 | 24.1% |
| $75,000 to $99,999 | 18 | 21.7% |
| $100,000 to $149,999 | 5 | 6.0% |
| $150,000 to $199,999 | 1 | 1.2% |
| $200,000+ | 0 | 0.0% |
Household Income by Householder Age in Allen
The median household income in Allen is $52,083, with the highest median household income of $58,750 found in the 25 to 44 years age bracket for the primary householder. A total of 13 households (15.7%) fall into this category. Meanwhile, the 15 to 24 years age bracket for the primary householder has the lowest median household income of $0, with 7 households (8.4%) in this group.
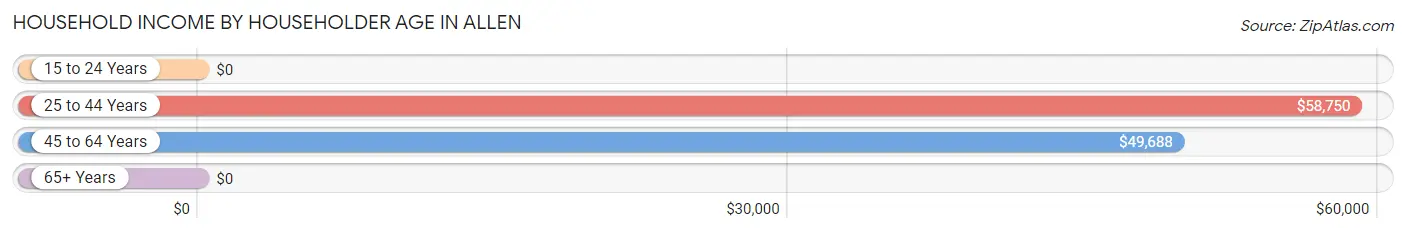
| Income Bracket | # Households | Median Income |
| 15 to 24 Years | 7 (8.4%) | $0 |
| 25 to 44 Years | 13 (15.7%) | $58,750 |
| 45 to 64 Years | 30 (36.1%) | $49,688 |
| 65+ Years | 33 (39.8%) | $0 |
| Total | 83 (100.0%) | $52,083 |
Poverty in Allen
Income Below Poverty by Sex and Age in Allen
With 18.7% poverty level for males and 28.3% for females among the residents of Allen, 12 to 14 year old males and under 5 year old females are the most vulnerable to poverty, with 4 males (100.0%) and 5 females (50.0%) in their respective age groups living below the poverty level.
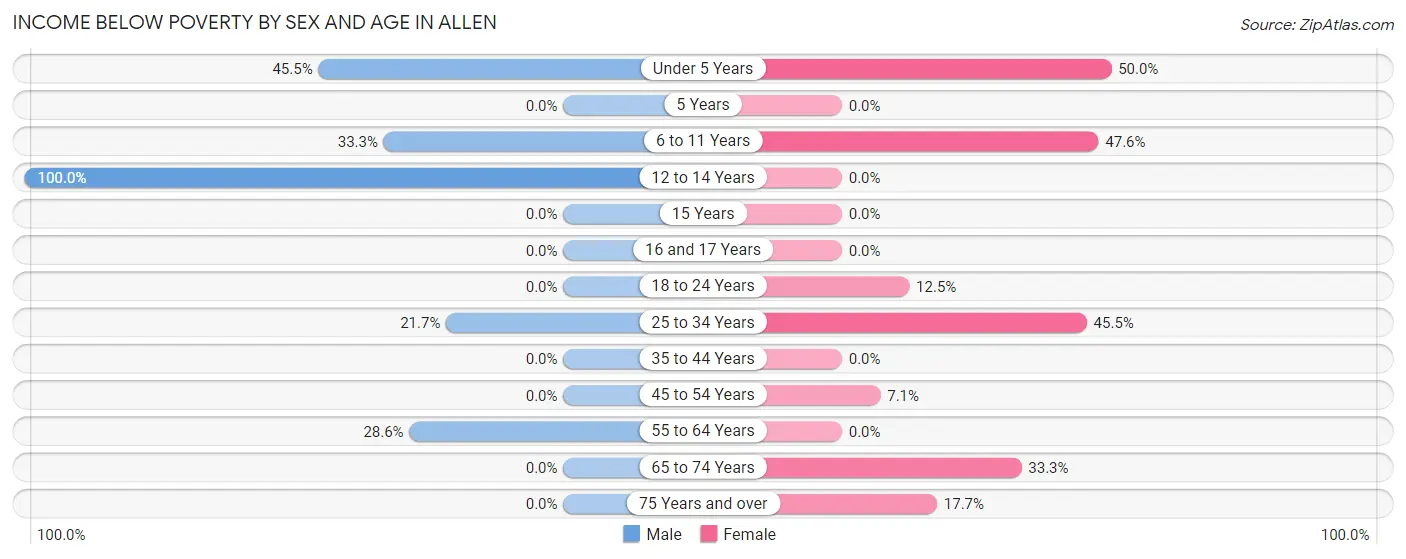
| Age Bracket | Male | Female |
| Under 5 Years | 5 (45.5%) | 5 (50.0%) |
| 5 Years | 0 (0.0%) | 0 (0.0%) |
| 6 to 11 Years | 2 (33.3%) | 10 (47.6%) |
| 12 to 14 Years | 4 (100.0%) | 0 (0.0%) |
| 15 Years | 0 (0.0%) | 0 (0.0%) |
| 16 and 17 Years | 0 (0.0%) | 0 (0.0%) |
| 18 to 24 Years | 0 (0.0%) | 1 (12.5%) |
| 25 to 34 Years | 5 (21.7%) | 5 (45.5%) |
| 35 to 44 Years | 0 (0.0%) | 0 (0.0%) |
| 45 to 54 Years | 0 (0.0%) | 1 (7.1%) |
| 55 to 64 Years | 4 (28.6%) | 0 (0.0%) |
| 65 to 74 Years | 0 (0.0%) | 5 (33.3%) |
| 75 Years and over | 0 (0.0%) | 3 (17.6%) |
| Total | 20 (18.7%) | 30 (28.3%) |
Income Above Poverty by Sex and Age in Allen
According to the poverty statistics in Allen, males aged 18 to 24 years and females aged 35 to 44 years are the age groups that are most secure financially, with 100.0% of males and 100.0% of females in these age groups living above the poverty line.
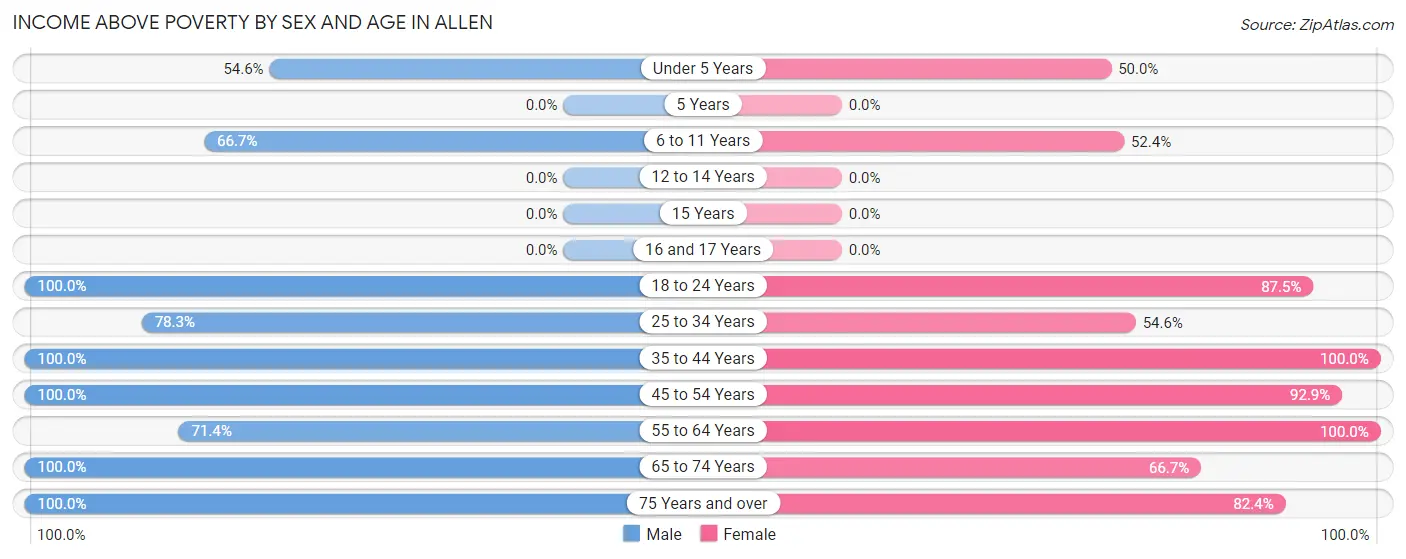
| Age Bracket | Male | Female |
| Under 5 Years | 6 (54.5%) | 5 (50.0%) |
| 5 Years | 0 (0.0%) | 0 (0.0%) |
| 6 to 11 Years | 4 (66.7%) | 11 (52.4%) |
| 12 to 14 Years | 0 (0.0%) | 0 (0.0%) |
| 15 Years | 0 (0.0%) | 0 (0.0%) |
| 16 and 17 Years | 0 (0.0%) | 0 (0.0%) |
| 18 to 24 Years | 7 (100.0%) | 7 (87.5%) |
| 25 to 34 Years | 18 (78.3%) | 6 (54.5%) |
| 35 to 44 Years | 7 (100.0%) | 3 (100.0%) |
| 45 to 54 Years | 20 (100.0%) | 13 (92.9%) |
| 55 to 64 Years | 10 (71.4%) | 7 (100.0%) |
| 65 to 74 Years | 10 (100.0%) | 10 (66.7%) |
| 75 Years and over | 5 (100.0%) | 14 (82.4%) |
| Total | 87 (81.3%) | 76 (71.7%) |
Income Below Poverty Among Married-Couple Families in Allen
The poverty statistics for married-couple families in Allen show that 12.5% or 5 of the total 40 families live below the poverty line. Families with 5 or more children have the highest poverty rate of 100.0%, comprising of 5 families. On the other hand, families with no children have the lowest poverty rate of 0.0%, which includes 0 families.
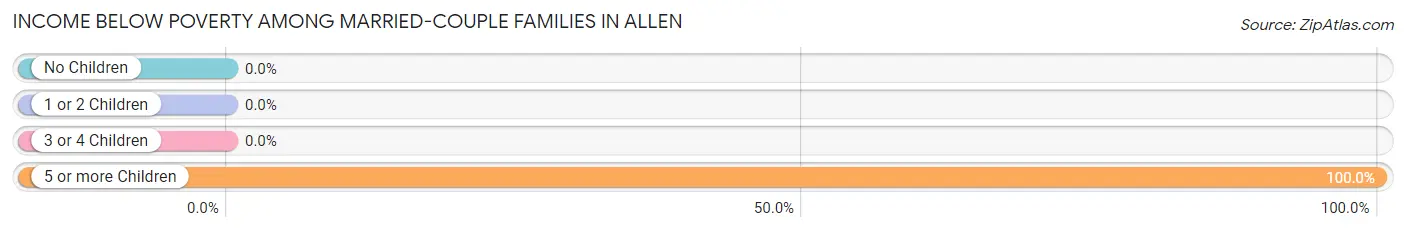
| Children | Above Poverty | Below Poverty |
| No Children | 28 (100.0%) | 0 (0.0%) |
| 1 or 2 Children | 2 (100.0%) | 0 (0.0%) |
| 3 or 4 Children | 5 (100.0%) | 0 (0.0%) |
| 5 or more Children | 0 (0.0%) | 5 (100.0%) |
| Total | 35 (87.5%) | 5 (12.5%) |
Income Below Poverty Among Single-Parent Households in Allen
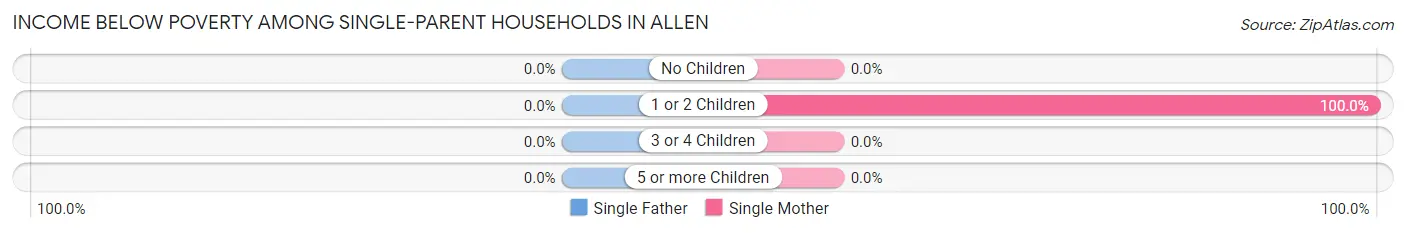
| Children | Single Father | Single Mother |
| No Children | 0 (0.0%) | 0 (0.0%) |
| 1 or 2 Children | 0 (0.0%) | 1 (100.0%) |
| 3 or 4 Children | 0 (0.0%) | 0 (0.0%) |
| 5 or more Children | 0 (0.0%) | 0 (0.0%) |
| Total | 0 (0.0%) | 1 (100.0%) |
Income Below Poverty Among Married-Couple vs Single-Parent Households in Allen
The poverty data for Allen shows that 5 of the married-couple family households (12.5%) and 1 of the single-parent households (25.0%) are living below the poverty level. Within the married-couple family households, those with 5 or more children have the highest poverty rate, with 5 households (100.0%) falling below the poverty line. Among the single-parent households, those with 1 or 2 children have the highest poverty rate, with 1 household (100.0%) living below poverty.
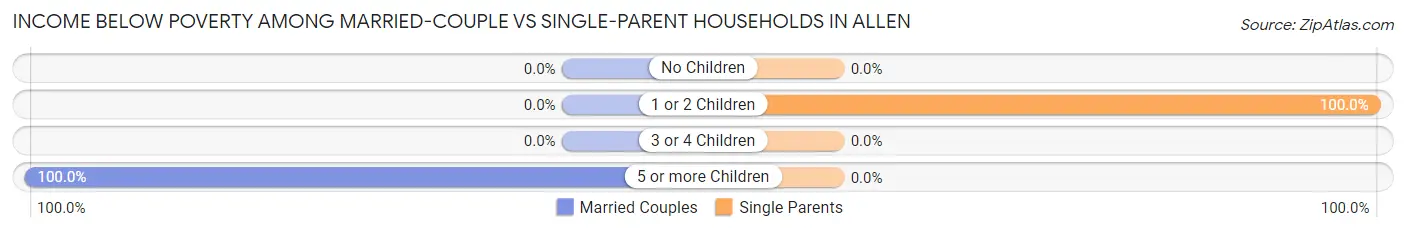
| Children | Married-Couple Families | Single-Parent Households |
| No Children | 0 (0.0%) | 0 (0.0%) |
| 1 or 2 Children | 0 (0.0%) | 1 (100.0%) |
| 3 or 4 Children | 0 (0.0%) | 0 (0.0%) |
| 5 or more Children | 5 (100.0%) | 0 (0.0%) |
| Total | 5 (12.5%) | 1 (25.0%) |
Race in Allen
The most populous races in Allen are White / Caucasian (204 | 95.8%), Hispanic or Latino (9 | 4.2%), and Two or more Races (8 | 3.8%).
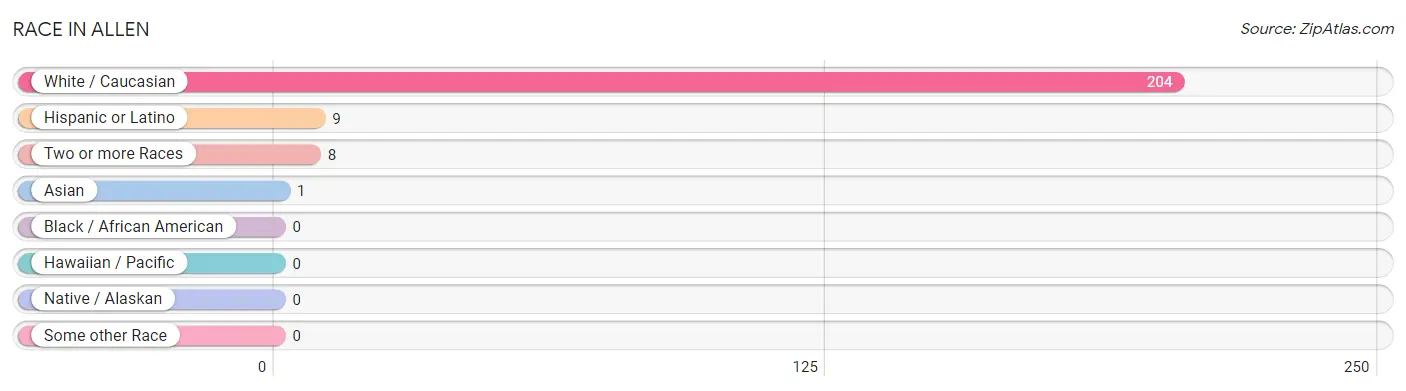
| Race | # Population | % Population |
| Asian | 1 | 0.5% |
| Black / African American | 0 | 0.0% |
| Hawaiian / Pacific | 0 | 0.0% |
| Hispanic or Latino | 9 | 4.2% |
| Native / Alaskan | 0 | 0.0% |
| White / Caucasian | 204 | 95.8% |
| Two or more Races | 8 | 3.8% |
| Some other Race | 0 | 0.0% |
| Total | 213 | 100.0% |
Ancestry in Allen
The most populous ancestries reported in Allen are German (45 | 21.1%), English (21 | 9.9%), Irish (20 | 9.4%), French (15 | 7.0%), and Dutch (14 | 6.6%), together accounting for 54.0% of all Allen residents.
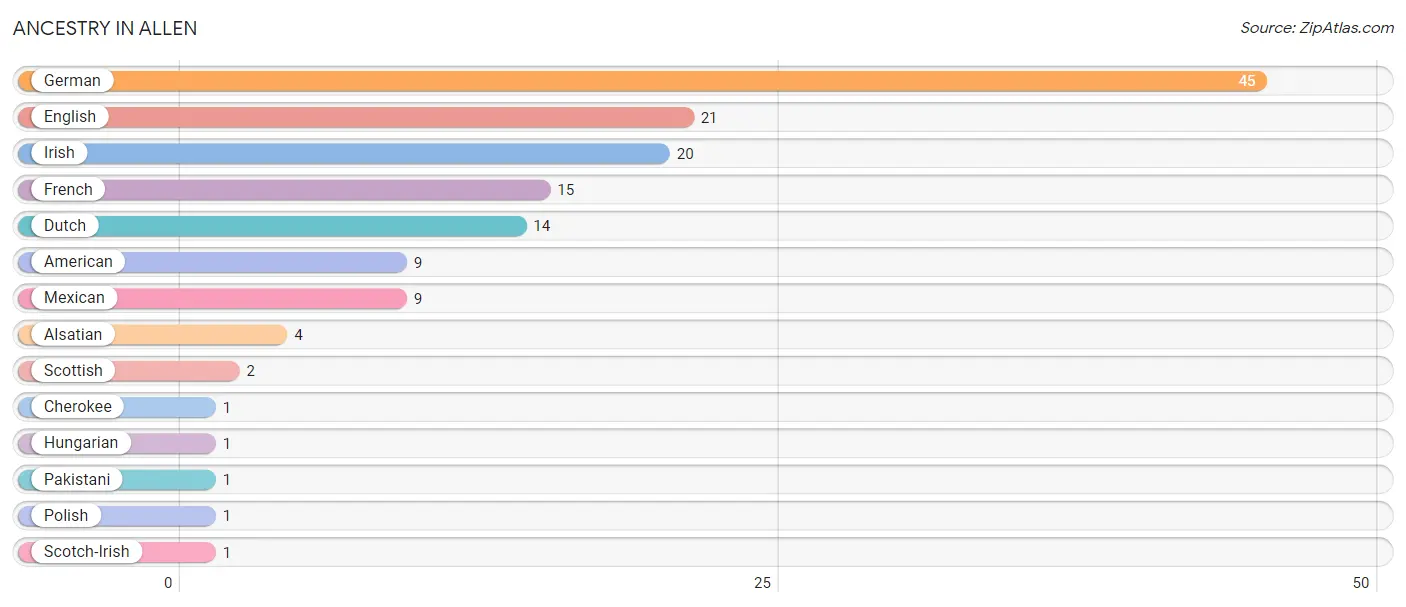
| Ancestry | # Population | % Population |
| Alsatian | 4 | 1.9% |
| American | 9 | 4.2% |
| Cherokee | 1 | 0.5% |
| Dutch | 14 | 6.6% |
| English | 21 | 9.9% |
| French | 15 | 7.0% |
| German | 45 | 21.1% |
| Hungarian | 1 | 0.5% |
| Irish | 20 | 9.4% |
| Mexican | 9 | 4.2% |
| Pakistani | 1 | 0.5% |
| Polish | 1 | 0.5% |
| Scotch-Irish | 1 | 0.5% |
| Scottish | 2 | 0.9% | View All 14 Rows |
Immigrants in Allen
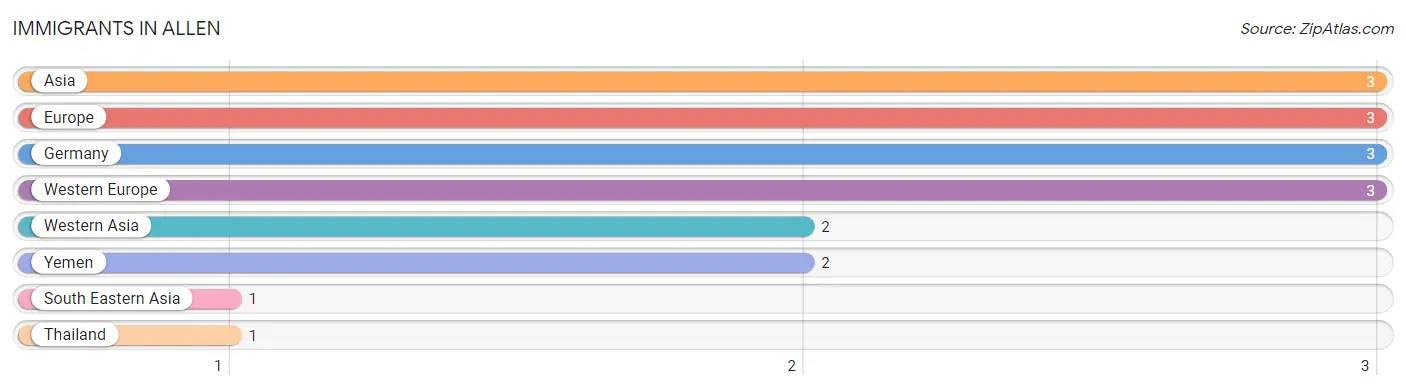
The most numerous immigrant groups reported in Allen came from Asia (3 | 1.4%), Europe (3 | 1.4%), Germany (3 | 1.4%), Western Europe (3 | 1.4%), and Western Asia (2 | 0.9%), together accounting for 6.6% of all Allen residents.
| Immigration Origin | # Population | % Population |
| Asia | 3 | 1.4% |
| Europe | 3 | 1.4% |
| Germany | 3 | 1.4% |
| South Eastern Asia | 1 | 0.5% |
| Thailand | 1 | 0.5% |
| Western Asia | 2 | 0.9% |
| Western Europe | 3 | 1.4% |
| Yemen | 2 | 0.9% | View All 8 Rows |
Sex and Age in Allen
Sex and Age in Allen
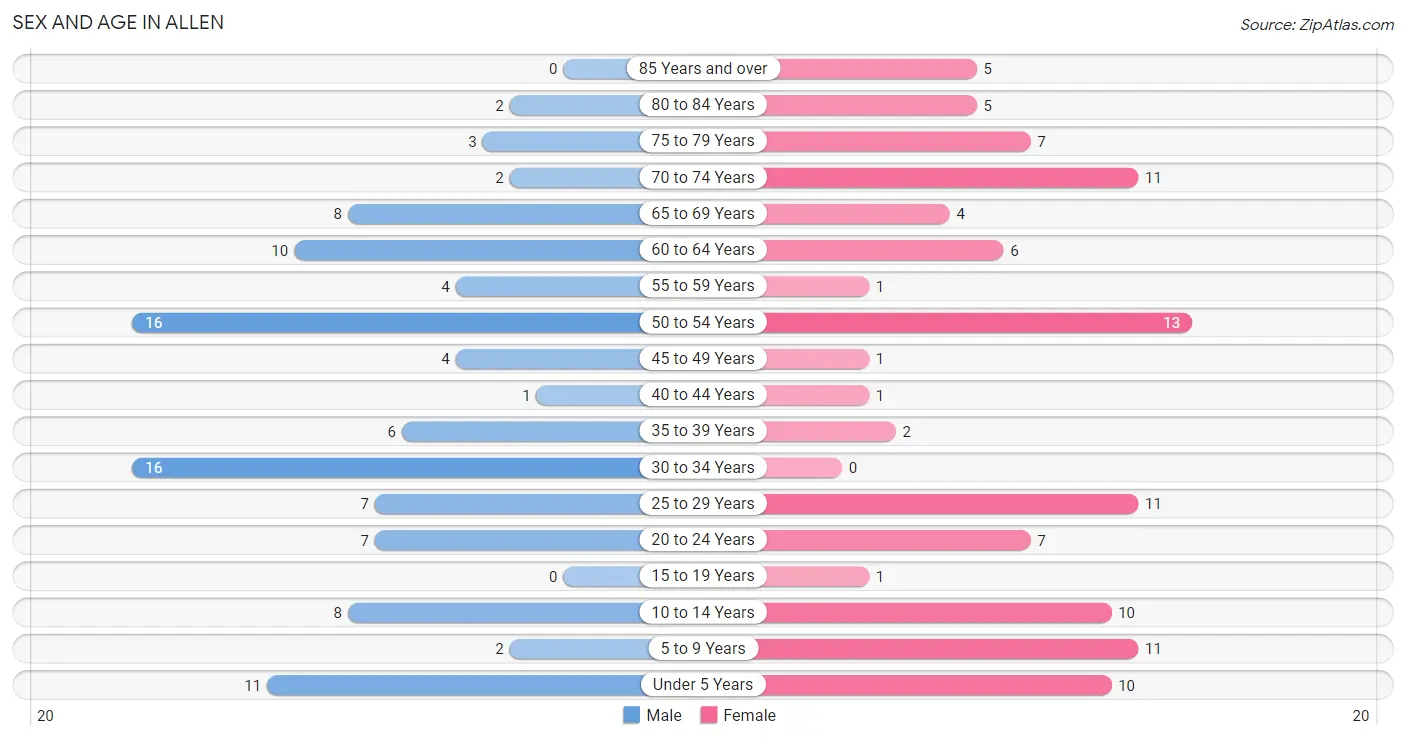
The most populous age groups in Allen are 30 to 34 Years (16 | 14.9%) for men and 50 to 54 Years (13 | 12.3%) for women.
| Age Bracket | Male | Female |
| Under 5 Years | 11 (10.3%) | 10 (9.4%) |
| 5 to 9 Years | 2 (1.9%) | 11 (10.4%) |
| 10 to 14 Years | 8 (7.5%) | 10 (9.4%) |
| 15 to 19 Years | 0 (0.0%) | 1 (0.9%) |
| 20 to 24 Years | 7 (6.5%) | 7 (6.6%) |
| 25 to 29 Years | 7 (6.5%) | 11 (10.4%) |
| 30 to 34 Years | 16 (14.9%) | 0 (0.0%) |
| 35 to 39 Years | 6 (5.6%) | 2 (1.9%) |
| 40 to 44 Years | 1 (0.9%) | 1 (0.9%) |
| 45 to 49 Years | 4 (3.7%) | 1 (0.9%) |
| 50 to 54 Years | 16 (14.9%) | 13 (12.3%) |
| 55 to 59 Years | 4 (3.7%) | 1 (0.9%) |
| 60 to 64 Years | 10 (9.3%) | 6 (5.7%) |
| 65 to 69 Years | 8 (7.5%) | 4 (3.8%) |
| 70 to 74 Years | 2 (1.9%) | 11 (10.4%) |
| 75 to 79 Years | 3 (2.8%) | 7 (6.6%) |
| 80 to 84 Years | 2 (1.9%) | 5 (4.7%) |
| 85 Years and over | 0 (0.0%) | 5 (4.7%) |
| Total | 107 (100.0%) | 106 (100.0%) |
Families and Households in Allen
Median Family Size in Allen
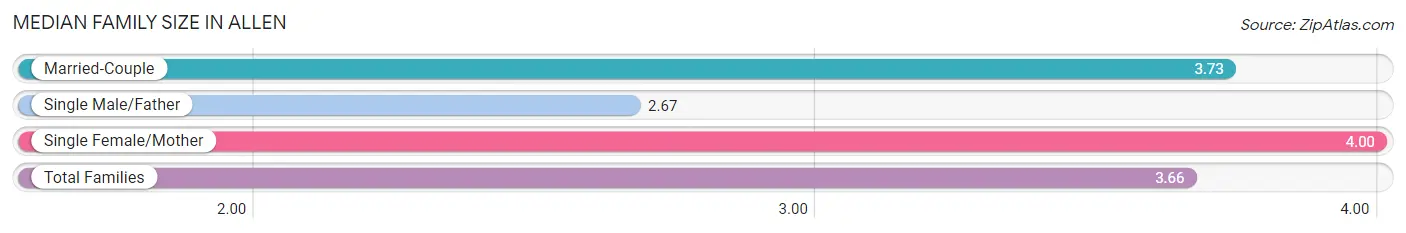
The median family size in Allen is 3.66 persons per family, with single female/mother families (1 | 2.3%) accounting for the largest median family size of 4 persons per family. On the other hand, single male/father families (3 | 6.8%) represent the smallest median family size with 2.67 persons per family.
| Family Type | # Families | Family Size |
| Married-Couple | 40 (90.9%) | 3.73 |
| Single Male/Father | 3 (6.8%) | 2.67 |
| Single Female/Mother | 1 (2.3%) | 4.00 |
| Total Families | 44 (100.0%) | 3.66 |
Median Household Size in Allen
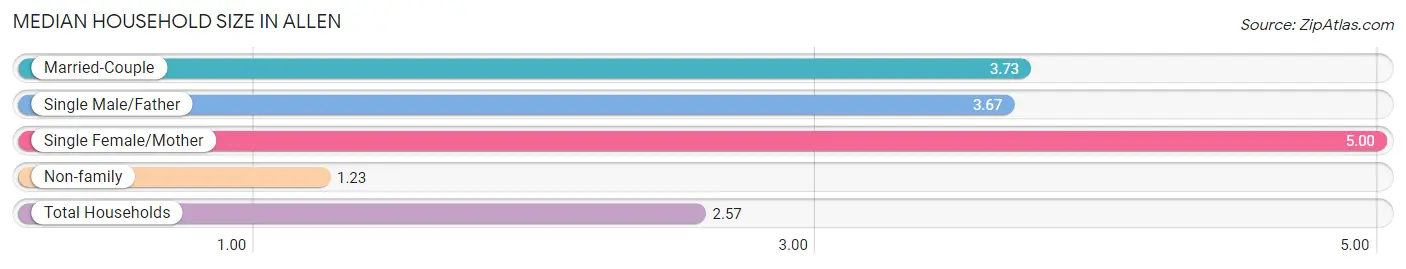
The median household size in Allen is 2.57 persons per household, with single female/mother households (1 | 1.2%) accounting for the largest median household size of 5 persons per household. non-family households (39 | 47.0%) represent the smallest median household size with 1.23 persons per household.
| Household Type | # Households | Household Size |
| Married-Couple | 40 (48.2%) | 3.73 |
| Single Male/Father | 3 (3.6%) | 3.67 |
| Single Female/Mother | 1 (1.2%) | 5.00 |
| Non-family | 39 (47.0%) | 1.23 |
| Total Households | 83 (100.0%) | 2.57 |
Household Size by Marriage Status in Allen
Out of a total of 83 households in Allen, 44 (53.0%) are family households, while 39 (47.0%) are nonfamily households. The most numerous type of family households are 2-person households, comprising 18, and the most common type of nonfamily households are 1-person households, comprising 34.
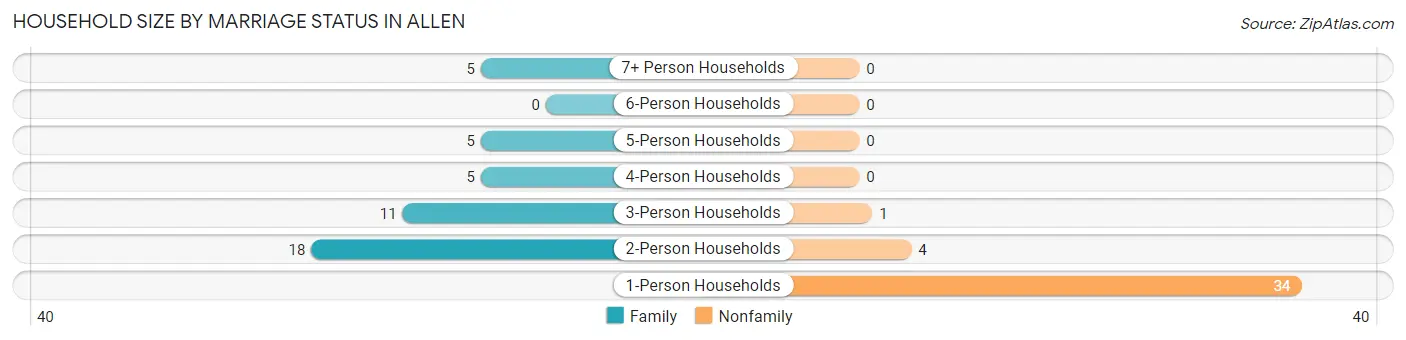
| Household Size | Family Households | Nonfamily Households |
| 1-Person Households | - | 34 (41.0%) |
| 2-Person Households | 18 (21.7%) | 4 (4.8%) |
| 3-Person Households | 11 (13.3%) | 1 (1.2%) |
| 4-Person Households | 5 (6.0%) | 0 (0.0%) |
| 5-Person Households | 5 (6.0%) | 0 (0.0%) |
| 6-Person Households | 0 (0.0%) | 0 (0.0%) |
| 7+ Person Households | 5 (6.0%) | 0 (0.0%) |
| Total | 44 (53.0%) | 39 (47.0%) |
Female Fertility in Allen
Fertility by Age in Allen
| Age Bracket | Women with Births | Births / 1,000 Women |
| 15 to 19 years | 0 (0.0%) | 0.0 |
| 20 to 34 years | 0 (0.0%) | 0.0 |
| 35 to 50 years | 0 (0.0%) | 0.0 |
| Total | 0 (0.0%) | 0.0 |
Fertility by Age by Marriage Status in Allen
| Age Bracket | Married | Unmarried |
| 15 to 19 years | 0 (0.0%) | 0 (0.0%) |
| 20 to 34 years | 0 (0.0%) | 0 (0.0%) |
| 35 to 50 years | 0 (0.0%) | 0 (0.0%) |
| Total | 0 (0.0%) | 0 (0.0%) |
Fertility by Education in Allen
| Educational Attainment | Women with Births | Births / 1,000 Women |
| Less than High School | 0 (0.0%) | 0.0 |
| High School Diploma | 0 (0.0%) | 0.0 |
| College or Associate's Degree | 0 (0.0%) | 0.0 |
| Bachelor's Degree | 0 (0.0%) | 0.0 |
| Graduate Degree | 0 (0.0%) | 0.0 |
| Total | 0 (0.0%) | 0.0 |
Fertility by Education by Marriage Status in Allen
| Educational Attainment | Married | Unmarried |
| Less than High School | 0 (0.0%) | 0 (0.0%) |
| High School Diploma | 0 (0.0%) | 0 (0.0%) |
| College or Associate's Degree | 0 (0.0%) | 0 (0.0%) |
| Bachelor's Degree | 0 (0.0%) | 0 (0.0%) |
| Graduate Degree | 0 (0.0%) | 0 (0.0%) |
| Total | 0 (0.0%) | 0 (0.0%) |
Employment Characteristics in Allen
Employment by Class of Employer in Allen
Among the 69 employed individuals in Allen, private company employees (58 | 84.1%), self-employed (not incorporated) (4 | 5.8%), and not-for-profit organizations (4 | 5.8%) make up the most common classes of employment.
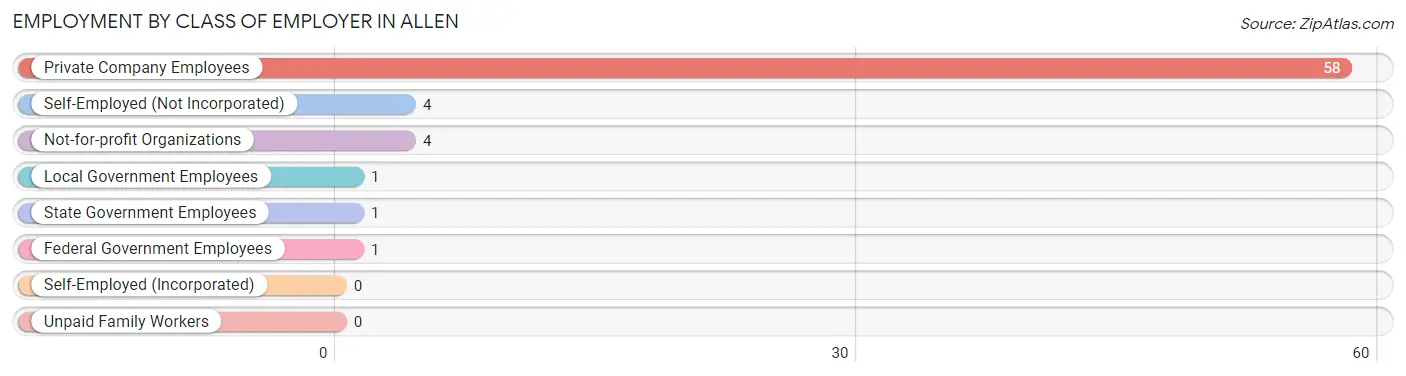
| Employer Class | # Employees | % Employees |
| Private Company Employees | 58 | 84.1% |
| Self-Employed (Incorporated) | 0 | 0.0% |
| Self-Employed (Not Incorporated) | 4 | 5.8% |
| Not-for-profit Organizations | 4 | 5.8% |
| Local Government Employees | 1 | 1.5% |
| State Government Employees | 1 | 1.5% |
| Federal Government Employees | 1 | 1.5% |
| Unpaid Family Workers | 0 | 0.0% |
| Total | 69 | 100.0% |
Employment Status by Age in Allen
According to the labor force statistics for Allen, out of the total population over 16 years of age (161), 57.8% or 93 individuals are in the labor force, with 24.7% or 23 of them unemployed. The age group with the highest labor force participation rate is 20 to 24 years, with 100.0% or 14 individuals in the labor force. Within the labor force, the 30 to 34 years age range has the highest percentage of unemployed individuals, with 83.3% or 5 of them being unemployed.
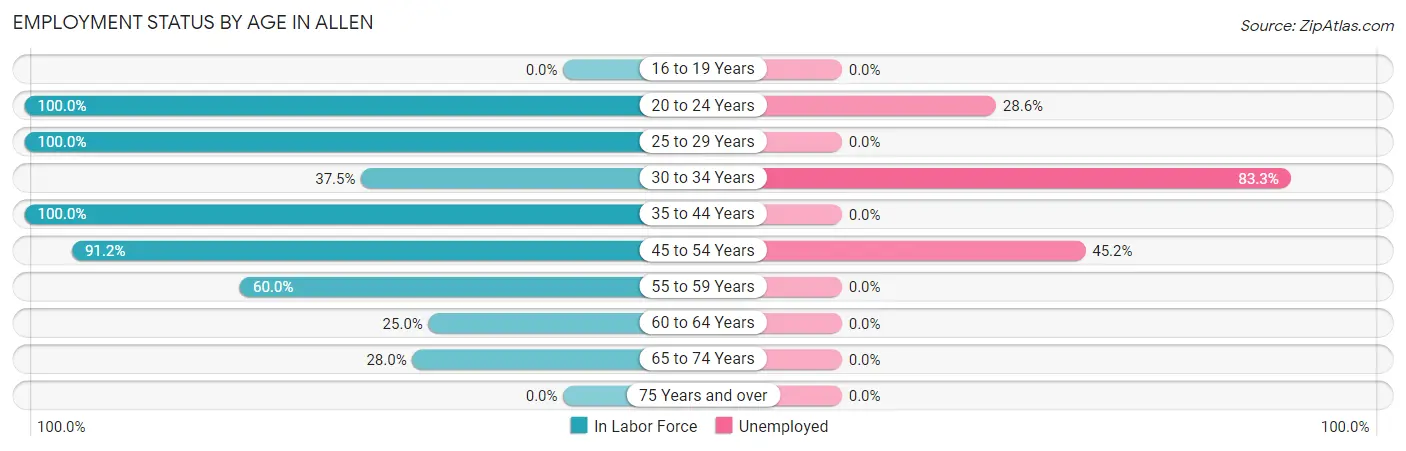
| Age Bracket | In Labor Force | Unemployed |
| 16 to 19 Years | 0 (0.0%) | 0 (0.0%) |
| 20 to 24 Years | 14 (100.0%) | 4 (28.6%) |
| 25 to 29 Years | 18 (100.0%) | 0 (0.0%) |
| 30 to 34 Years | 6 (37.5%) | 5 (83.3%) |
| 35 to 44 Years | 10 (100.0%) | 0 (0.0%) |
| 45 to 54 Years | 31 (91.2%) | 14 (45.2%) |
| 55 to 59 Years | 3 (60.0%) | 0 (0.0%) |
| 60 to 64 Years | 4 (25.0%) | 0 (0.0%) |
| 65 to 74 Years | 7 (28.0%) | 0 (0.0%) |
| 75 Years and over | 0 (0.0%) | 0 (0.0%) |
| Total | 93 (57.8%) | 23 (24.7%) |
Employment Status by Educational Attainment in Allen
According to labor force statistics for Allen, 72.7% of individuals (72) out of the total population between 25 and 64 years of age (99) are in the labor force, with 26.4% or 19 of them being unemployed. The group with the highest labor force participation rate are those with the educational attainment of bachelor's degree or higher, with 100.0% or 6 individuals in the labor force. Within the labor force, individuals with less than high school education have the highest percentage of unemployment, with 63.6% or 14 of them being unemployed.
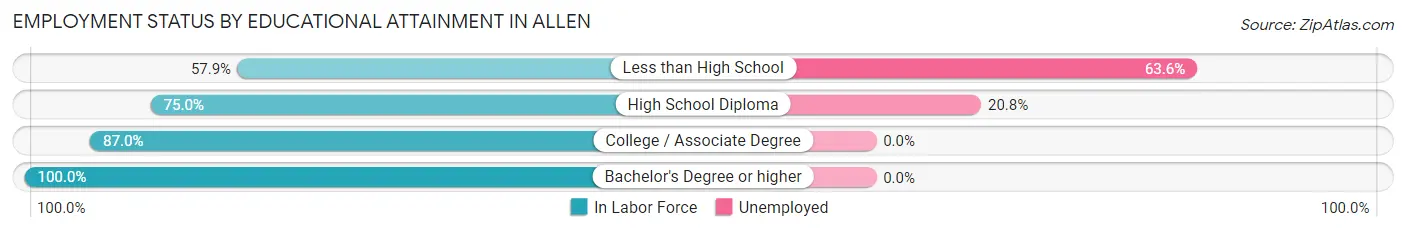
| Educational Attainment | In Labor Force | Unemployed |
| Less than High School | 22 (57.9%) | 24 (63.6%) |
| High School Diploma | 24 (75.0%) | 7 (20.8%) |
| College / Associate Degree | 20 (87.0%) | 0 (0.0%) |
| Bachelor's Degree or higher | 6 (100.0%) | 0 (0.0%) |
| Total | 72 (72.7%) | 26 (26.4%) |
Employment Occupations by Sex in Allen
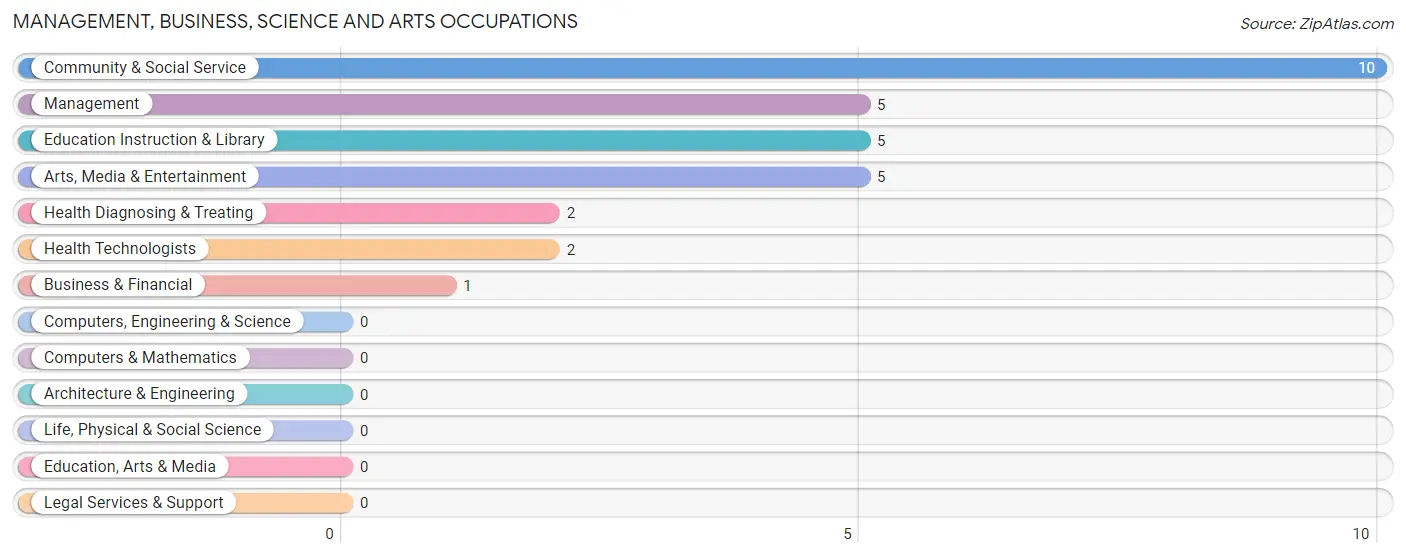
Management, Business, Science and Arts Occupations
The most common Management, Business, Science and Arts occupations in Allen are Community & Social Service (10 | 14.3%), Management (5 | 7.1%), Education Instruction & Library (5 | 7.1%), Arts, Media & Entertainment (5 | 7.1%), and Health Diagnosing & Treating (2 | 2.9%).
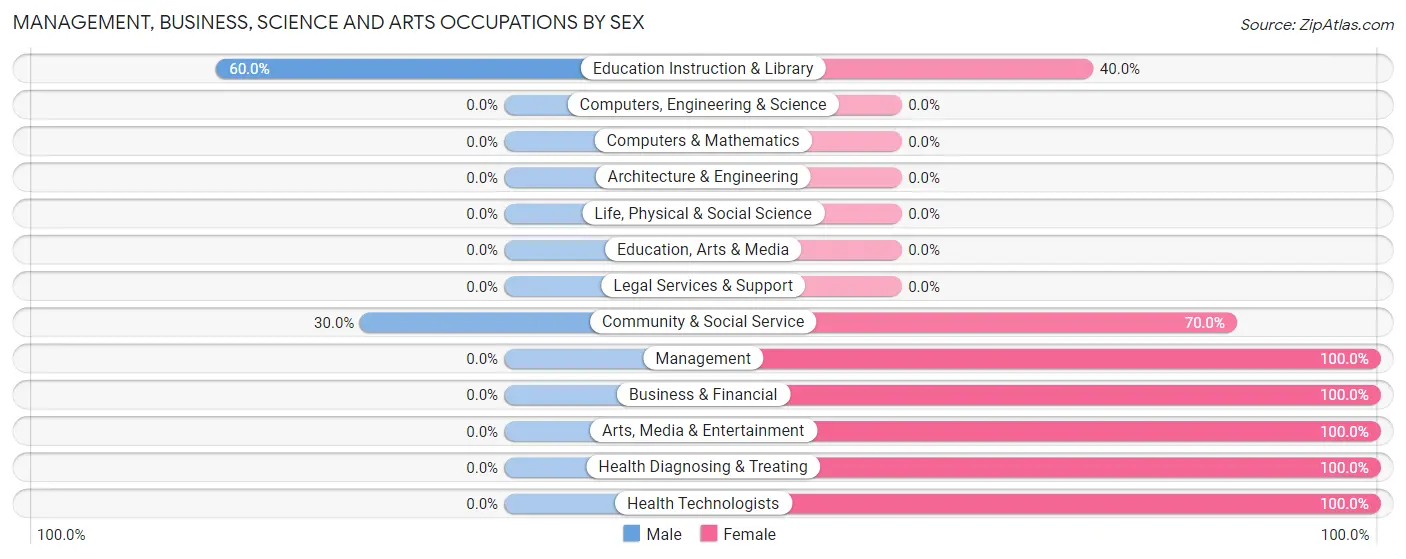
Management, Business, Science and Arts Occupations by Sex
Within the Management, Business, Science and Arts occupations in Allen, the most male-oriented occupations are Education Instruction & Library (60.0%), and Community & Social Service (30.0%), while the most female-oriented occupations are Management (100.0%), Business & Financial (100.0%), and Arts, Media & Entertainment (100.0%).
| Occupation | Male | Female |
| Management | 0 (0.0%) | 5 (100.0%) |
| Business & Financial | 0 (0.0%) | 1 (100.0%) |
| Computers, Engineering & Science | 0 (0.0%) | 0 (0.0%) |
| Computers & Mathematics | 0 (0.0%) | 0 (0.0%) |
| Architecture & Engineering | 0 (0.0%) | 0 (0.0%) |
| Life, Physical & Social Science | 0 (0.0%) | 0 (0.0%) |
| Community & Social Service | 3 (30.0%) | 7 (70.0%) |
| Education, Arts & Media | 0 (0.0%) | 0 (0.0%) |
| Legal Services & Support | 0 (0.0%) | 0 (0.0%) |
| Education Instruction & Library | 3 (60.0%) | 2 (40.0%) |
| Arts, Media & Entertainment | 0 (0.0%) | 5 (100.0%) |
| Health Diagnosing & Treating | 0 (0.0%) | 2 (100.0%) |
| Health Technologists | 0 (0.0%) | 2 (100.0%) |
| Total (Category) | 3 (16.7%) | 15 (83.3%) |
| Total (Overall) | 30 (42.9%) | 40 (57.1%) |
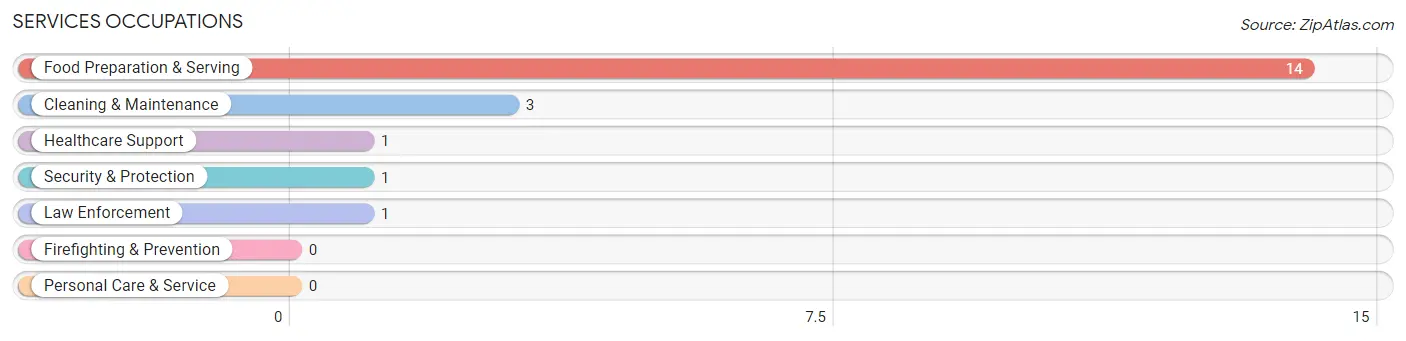
Services Occupations
The most common Services occupations in Allen are Food Preparation & Serving (14 | 20.0%), Cleaning & Maintenance (3 | 4.3%), Healthcare Support (1 | 1.4%), Security & Protection (1 | 1.4%), and Law Enforcement (1 | 1.4%).
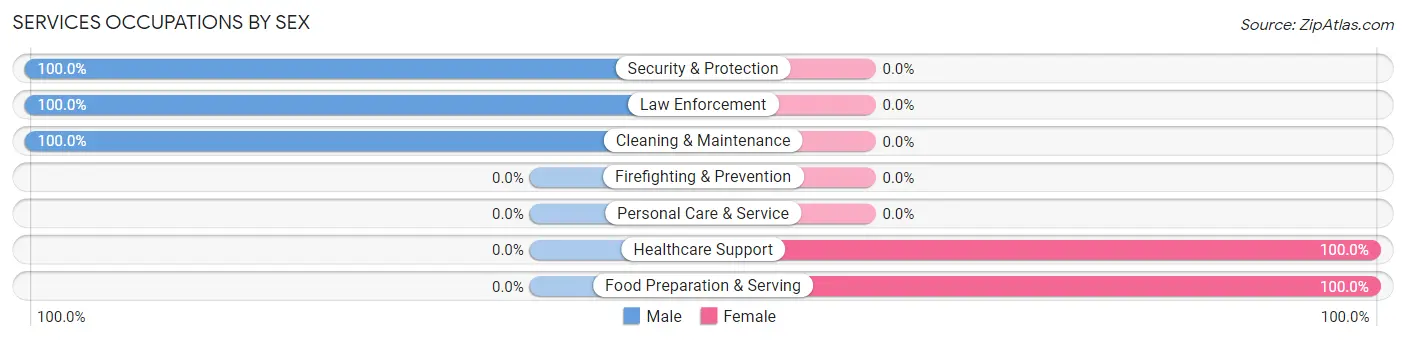
Services Occupations by Sex
Within the Services occupations in Allen, the most male-oriented occupations are Security & Protection (100.0%), Law Enforcement (100.0%), and Cleaning & Maintenance (100.0%), while the most female-oriented occupations are Healthcare Support (100.0%), and Food Preparation & Serving (100.0%).
| Occupation | Male | Female |
| Healthcare Support | 0 (0.0%) | 1 (100.0%) |
| Security & Protection | 1 (100.0%) | 0 (0.0%) |
| Firefighting & Prevention | 0 (0.0%) | 0 (0.0%) |
| Law Enforcement | 1 (100.0%) | 0 (0.0%) |
| Food Preparation & Serving | 0 (0.0%) | 14 (100.0%) |
| Cleaning & Maintenance | 3 (100.0%) | 0 (0.0%) |
| Personal Care & Service | 0 (0.0%) | 0 (0.0%) |
| Total (Category) | 4 (21.0%) | 15 (78.9%) |
| Total (Overall) | 30 (42.9%) | 40 (57.1%) |
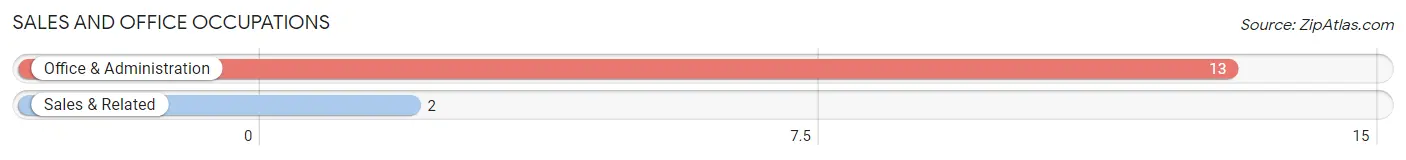
Sales and Office Occupations
The most common Sales and Office occupations in Allen are Office & Administration (13 | 18.6%), and Sales & Related (2 | 2.9%).
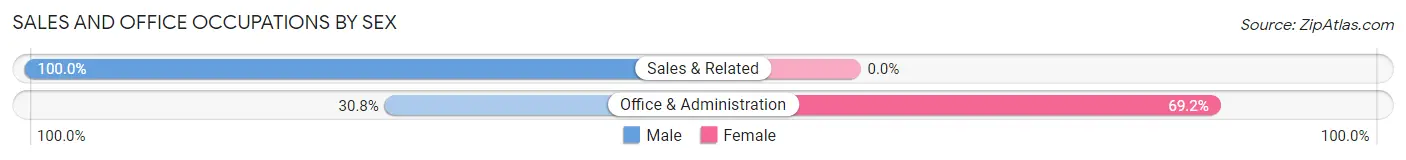
Sales and Office Occupations by Sex
| Occupation | Male | Female |
| Sales & Related | 2 (100.0%) | 0 (0.0%) |
| Office & Administration | 4 (30.8%) | 9 (69.2%) |
| Total (Category) | 6 (40.0%) | 9 (60.0%) |
| Total (Overall) | 30 (42.9%) | 40 (57.1%) |
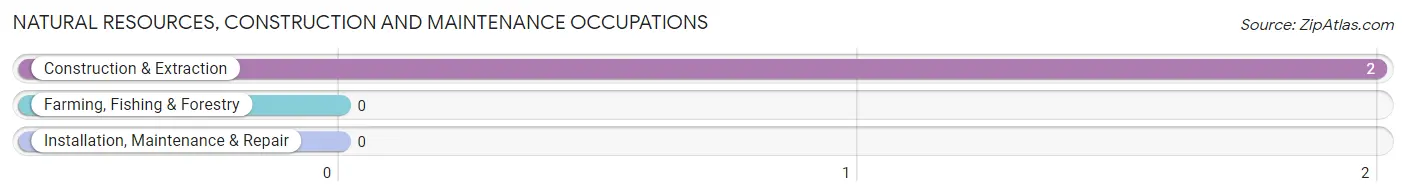
Natural Resources, Construction and Maintenance Occupations
The most common Natural Resources, Construction and Maintenance occupations in Allen are , and Construction & Extraction (2 | 2.9%).
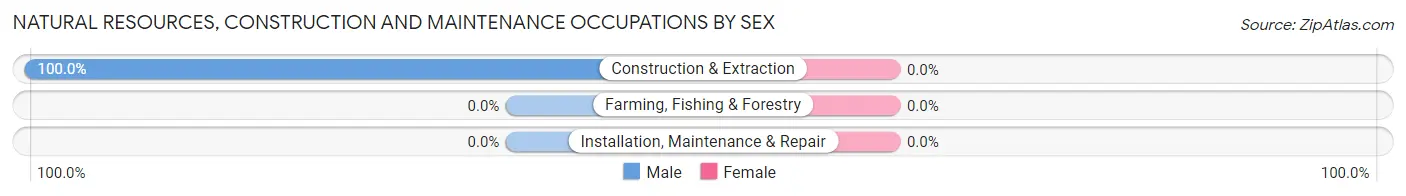
Natural Resources, Construction and Maintenance Occupations by Sex
| Occupation | Male | Female |
| Farming, Fishing & Forestry | 0 (0.0%) | 0 (0.0%) |
| Construction & Extraction | 2 (100.0%) | 0 (0.0%) |
| Installation, Maintenance & Repair | 0 (0.0%) | 0 (0.0%) |
| Total (Category) | 2 (100.0%) | 0 (0.0%) |
| Total (Overall) | 30 (42.9%) | 40 (57.1%) |
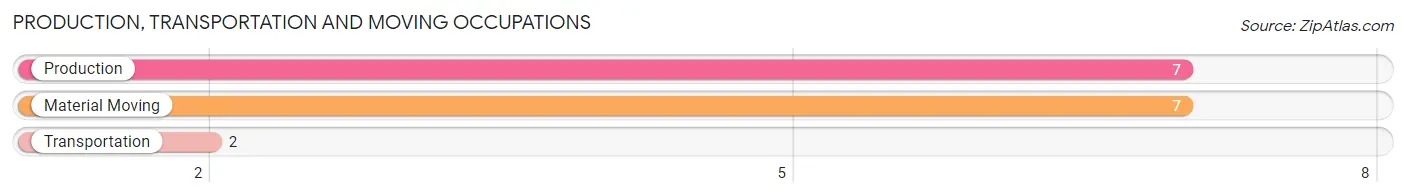
Production, Transportation and Moving Occupations
The most common Production, Transportation and Moving occupations in Allen are Production (7 | 10.0%), Material Moving (7 | 10.0%), and Transportation (2 | 2.9%).
Production, Transportation and Moving Occupations by Sex
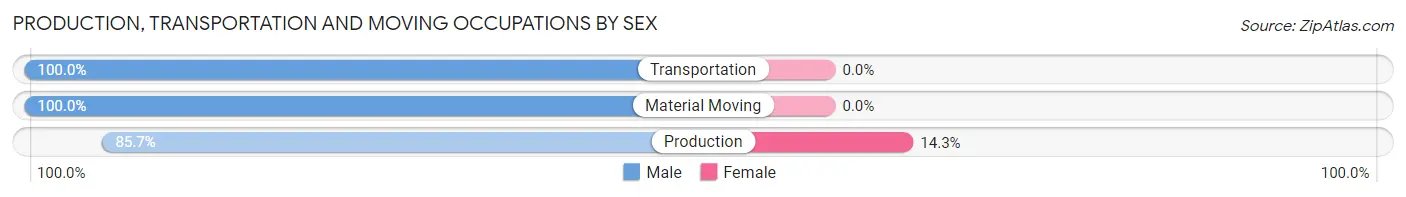
| Occupation | Male | Female |
| Production | 6 (85.7%) | 1 (14.3%) |
| Transportation | 2 (100.0%) | 0 (0.0%) |
| Material Moving | 7 (100.0%) | 0 (0.0%) |
| Total (Category) | 15 (93.8%) | 1 (6.2%) |
| Total (Overall) | 30 (42.9%) | 40 (57.1%) |
Employment Industries by Sex in Allen
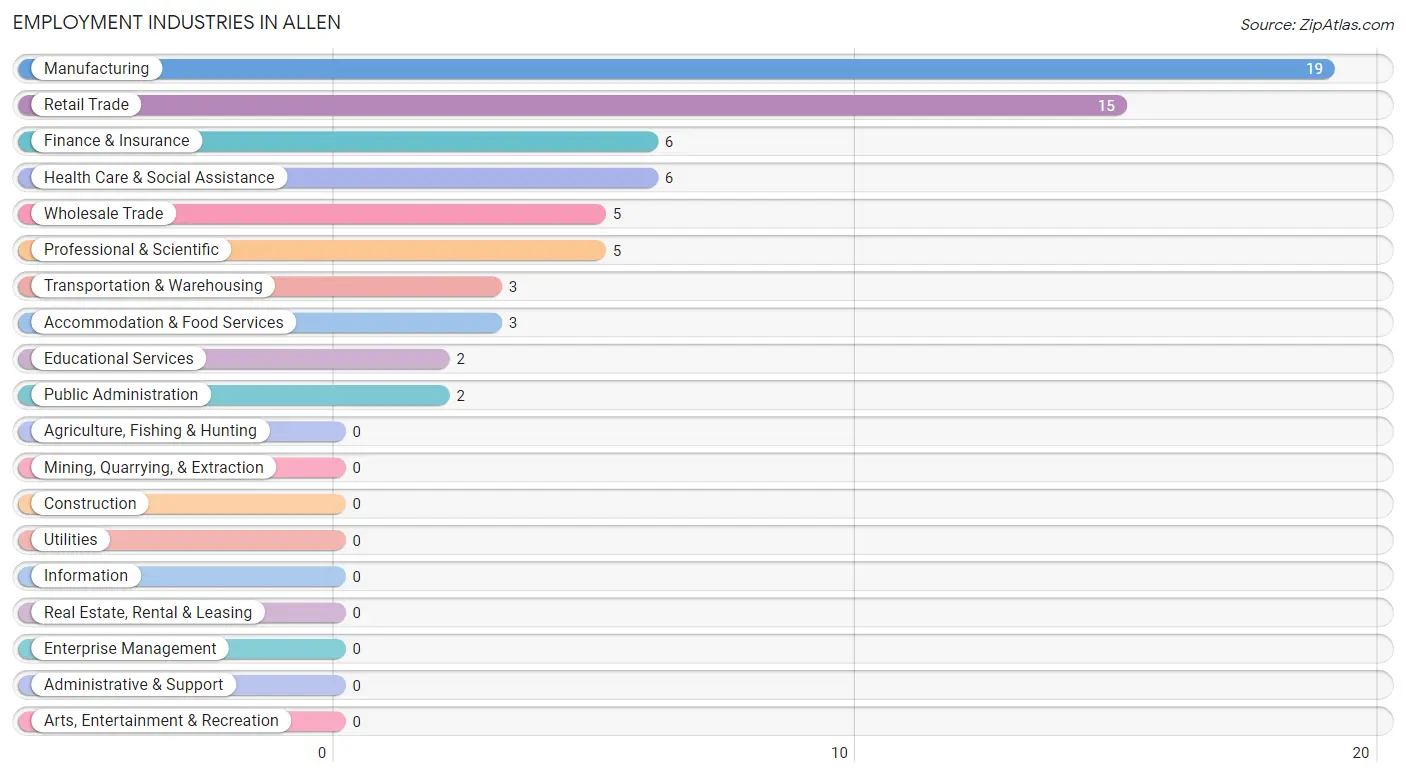
Employment Industries in Allen
The major employment industries in Allen include Manufacturing (19 | 27.1%), Retail Trade (15 | 21.4%), Finance & Insurance (6 | 8.6%), Health Care & Social Assistance (6 | 8.6%), and Wholesale Trade (5 | 7.1%).
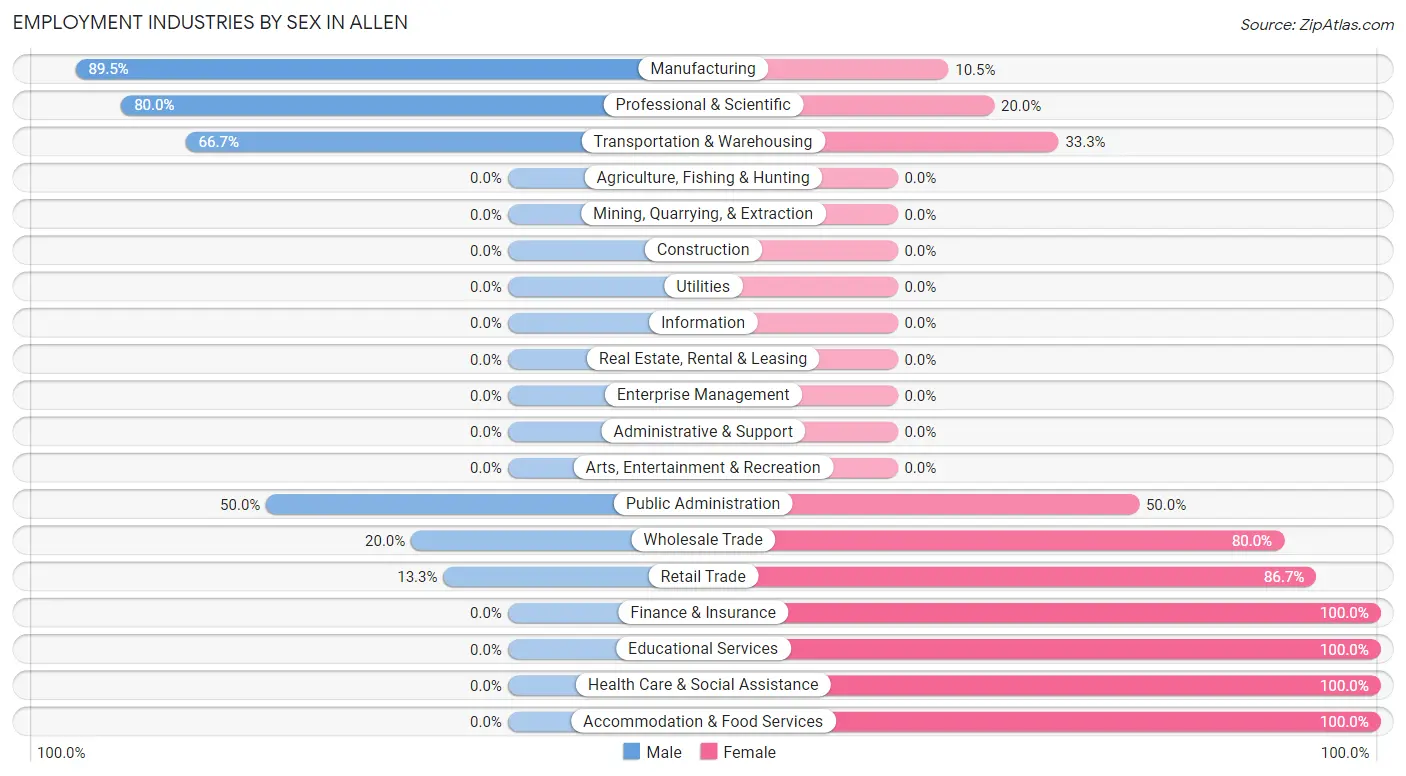
Employment Industries by Sex in Allen
The Allen industries that see more men than women are Manufacturing (89.5%), Professional & Scientific (80.0%), and Transportation & Warehousing (66.7%), whereas the industries that tend to have a higher number of women are Finance & Insurance (100.0%), Educational Services (100.0%), and Health Care & Social Assistance (100.0%).
| Industry | Male | Female |
| Agriculture, Fishing & Hunting | 0 (0.0%) | 0 (0.0%) |
| Mining, Quarrying, & Extraction | 0 (0.0%) | 0 (0.0%) |
| Construction | 0 (0.0%) | 0 (0.0%) |
| Manufacturing | 17 (89.5%) | 2 (10.5%) |
| Wholesale Trade | 1 (20.0%) | 4 (80.0%) |
| Retail Trade | 2 (13.3%) | 13 (86.7%) |
| Transportation & Warehousing | 2 (66.7%) | 1 (33.3%) |
| Utilities | 0 (0.0%) | 0 (0.0%) |
| Information | 0 (0.0%) | 0 (0.0%) |
| Finance & Insurance | 0 (0.0%) | 6 (100.0%) |
| Real Estate, Rental & Leasing | 0 (0.0%) | 0 (0.0%) |
| Professional & Scientific | 4 (80.0%) | 1 (20.0%) |
| Enterprise Management | 0 (0.0%) | 0 (0.0%) |
| Administrative & Support | 0 (0.0%) | 0 (0.0%) |
| Educational Services | 0 (0.0%) | 2 (100.0%) |
| Health Care & Social Assistance | 0 (0.0%) | 6 (100.0%) |
| Arts, Entertainment & Recreation | 0 (0.0%) | 0 (0.0%) |
| Accommodation & Food Services | 0 (0.0%) | 3 (100.0%) |
| Public Administration | 1 (50.0%) | 1 (50.0%) |
| Total | 30 (42.9%) | 40 (57.1%) |
Education in Allen
School Enrollment in Allen
The most common levels of schooling among the 50 students in Allen are elementary school (16 | 32.0%), middle school (15 | 30.0%), and college / undergraduate (10 | 20.0%).
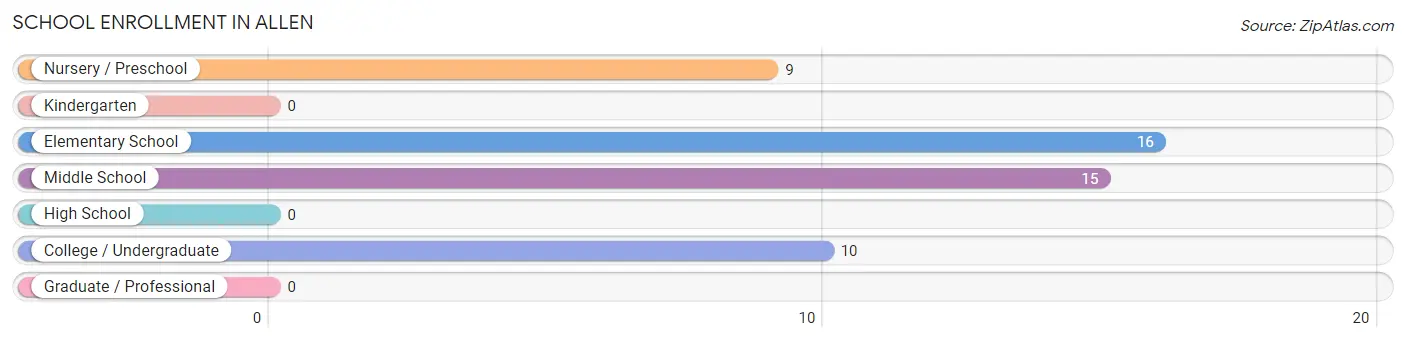
| School Level | # Students | % Students |
| Nursery / Preschool | 9 | 18.0% |
| Kindergarten | 0 | 0.0% |
| Elementary School | 16 | 32.0% |
| Middle School | 15 | 30.0% |
| High School | 0 | 0.0% |
| College / Undergraduate | 10 | 20.0% |
| Graduate / Professional | 0 | 0.0% |
| Total | 50 | 100.0% |
School Enrollment by Age by Funding Source in Allen
Out of a total of 50 students who are enrolled in schools in Allen, 5 (10.0%) attend a private institution, while the remaining 45 (90.0%) are enrolled in public schools. The age group of 35 years and over has the highest likelihood of being enrolled in private schools, with 1 (100.0% in the age bracket) enrolled. Conversely, the age group of 3 to 4 year olds has the lowest likelihood of being enrolled in a private school, with 9 (100.0% in the age bracket) attending a public institution.
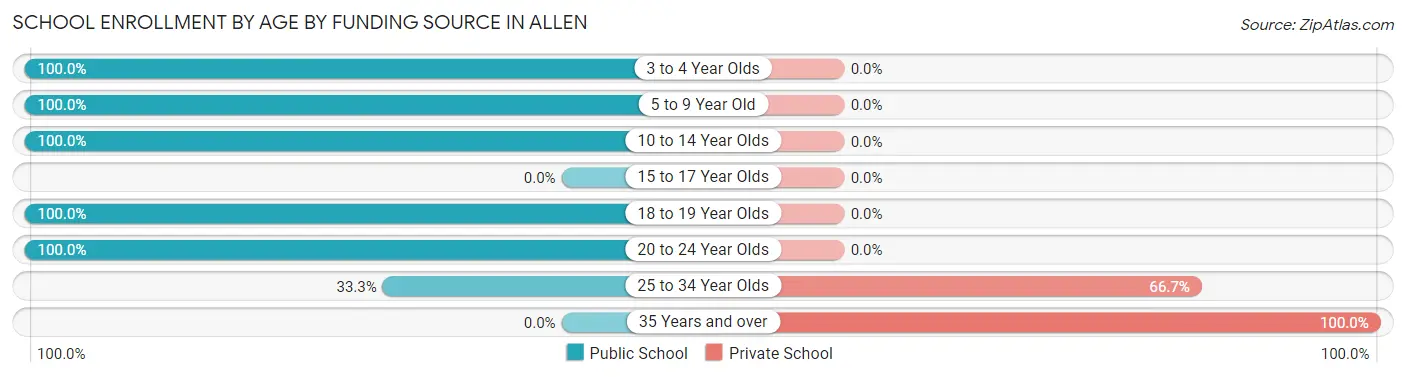
| Age Bracket | Public School | Private School |
| 3 to 4 Year Olds | 9 (100.0%) | 0 (0.0%) |
| 5 to 9 Year Old | 13 (100.0%) | 0 (0.0%) |
| 10 to 14 Year Olds | 18 (100.0%) | 0 (0.0%) |
| 15 to 17 Year Olds | 0 (0.0%) | 0 (0.0%) |
| 18 to 19 Year Olds | 1 (100.0%) | 0 (0.0%) |
| 20 to 24 Year Olds | 2 (100.0%) | 0 (0.0%) |
| 25 to 34 Year Olds | 2 (33.3%) | 4 (66.7%) |
| 35 Years and over | 0 (0.0%) | 1 (100.0%) |
| Total | 45 (90.0%) | 5 (10.0%) |
Educational Attainment by Field of Study in Allen
Business (4 | 28.6%), visual & performing arts (4 | 28.6%), education (2 | 14.3%), bio, nature & agricultural (1 | 7.1%), and science & technology (1 | 7.1%) are the most common fields of study among 14 individuals in Allen who have obtained a bachelor's degree or higher.
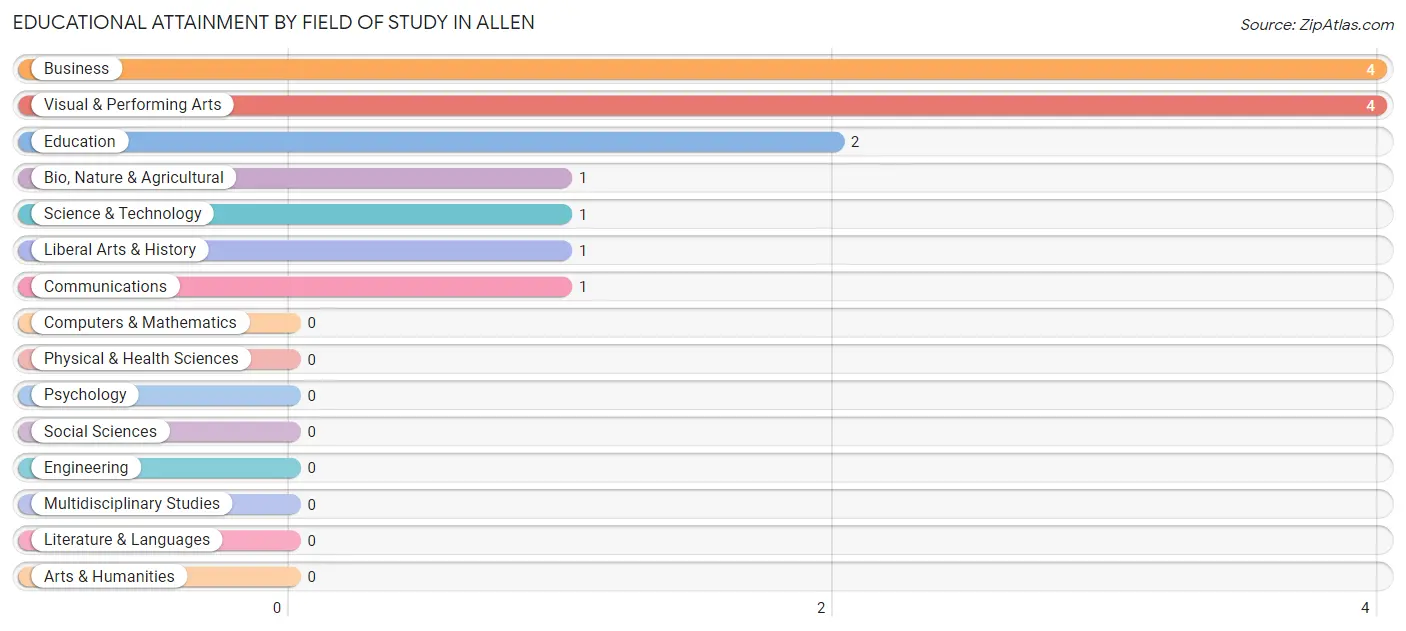
| Field of Study | # Graduates | % Graduates |
| Computers & Mathematics | 0 | 0.0% |
| Bio, Nature & Agricultural | 1 | 7.1% |
| Physical & Health Sciences | 0 | 0.0% |
| Psychology | 0 | 0.0% |
| Social Sciences | 0 | 0.0% |
| Engineering | 0 | 0.0% |
| Multidisciplinary Studies | 0 | 0.0% |
| Science & Technology | 1 | 7.1% |
| Business | 4 | 28.6% |
| Education | 2 | 14.3% |
| Literature & Languages | 0 | 0.0% |
| Liberal Arts & History | 1 | 7.1% |
| Visual & Performing Arts | 4 | 28.6% |
| Communications | 1 | 7.1% |
| Arts & Humanities | 0 | 0.0% |
| Total | 14 | 100.0% |
Transportation & Commute in Allen
Vehicle Availability by Sex in Allen
The most prevalent vehicle ownership categories in Allen are males with 2 vehicles (15, accounting for 50.0%) and females with 2 vehicles (21, making up 38.5%).
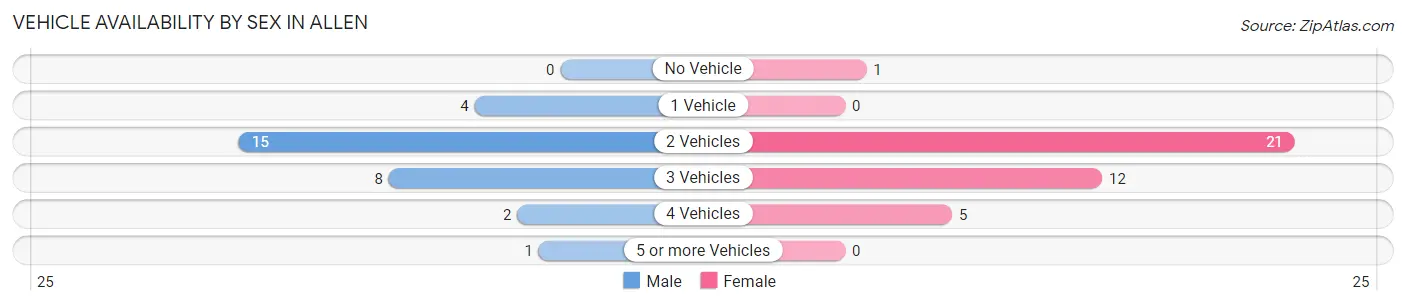
| Vehicles Available | Male | Female |
| No Vehicle | 0 (0.0%) | 1 (2.6%) |
| 1 Vehicle | 4 (13.3%) | 0 (0.0%) |
| 2 Vehicles | 15 (50.0%) | 21 (53.8%) |
| 3 Vehicles | 8 (26.7%) | 12 (30.8%) |
| 4 Vehicles | 2 (6.7%) | 5 (12.8%) |
| 5 or more Vehicles | 1 (3.3%) | 0 (0.0%) |
| Total | 30 (100.0%) | 39 (100.0%) |
Commute Time in Allen
The most frequently occuring commute durations in Allen are 5 to 9 minutes (20 commuters, 29.4%), 15 to 19 minutes (15 commuters, 22.1%), and 20 to 24 minutes (12 commuters, 17.6%).
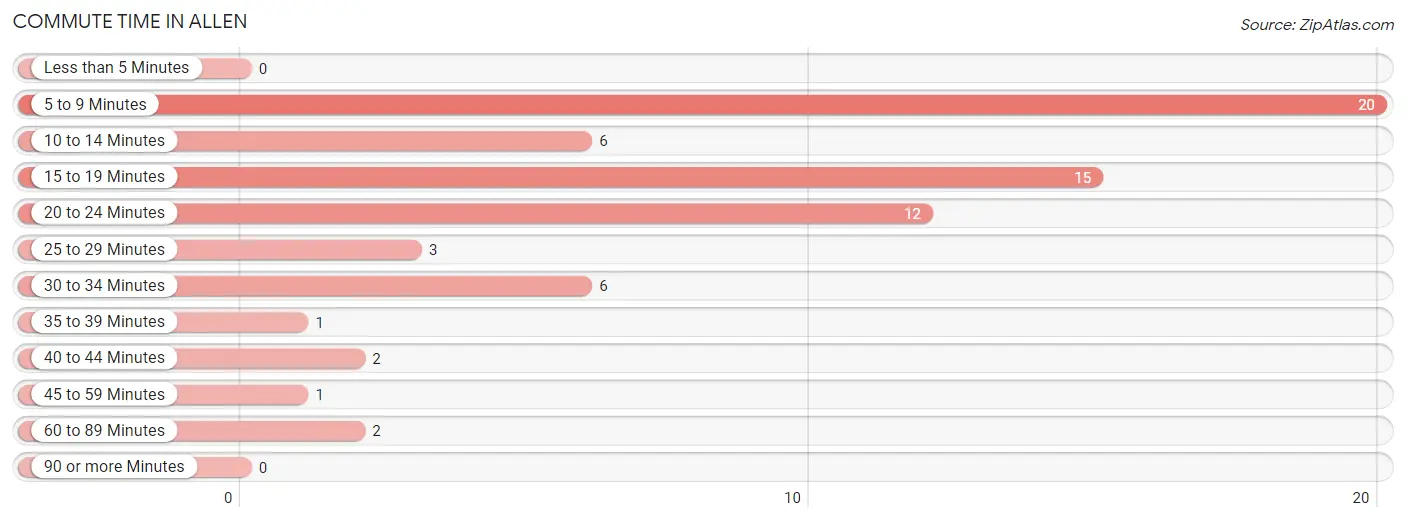
| Commute Time | # Commuters | % Commuters |
| Less than 5 Minutes | 0 | 0.0% |
| 5 to 9 Minutes | 20 | 29.4% |
| 10 to 14 Minutes | 6 | 8.8% |
| 15 to 19 Minutes | 15 | 22.1% |
| 20 to 24 Minutes | 12 | 17.6% |
| 25 to 29 Minutes | 3 | 4.4% |
| 30 to 34 Minutes | 6 | 8.8% |
| 35 to 39 Minutes | 1 | 1.5% |
| 40 to 44 Minutes | 2 | 2.9% |
| 45 to 59 Minutes | 1 | 1.5% |
| 60 to 89 Minutes | 2 | 2.9% |
| 90 or more Minutes | 0 | 0.0% |
Commute Time by Sex in Allen
The most common commute times in Allen are 5 to 9 minutes (8 commuters, 26.7%) for males and 15 to 19 minutes (14 commuters, 36.8%) for females.
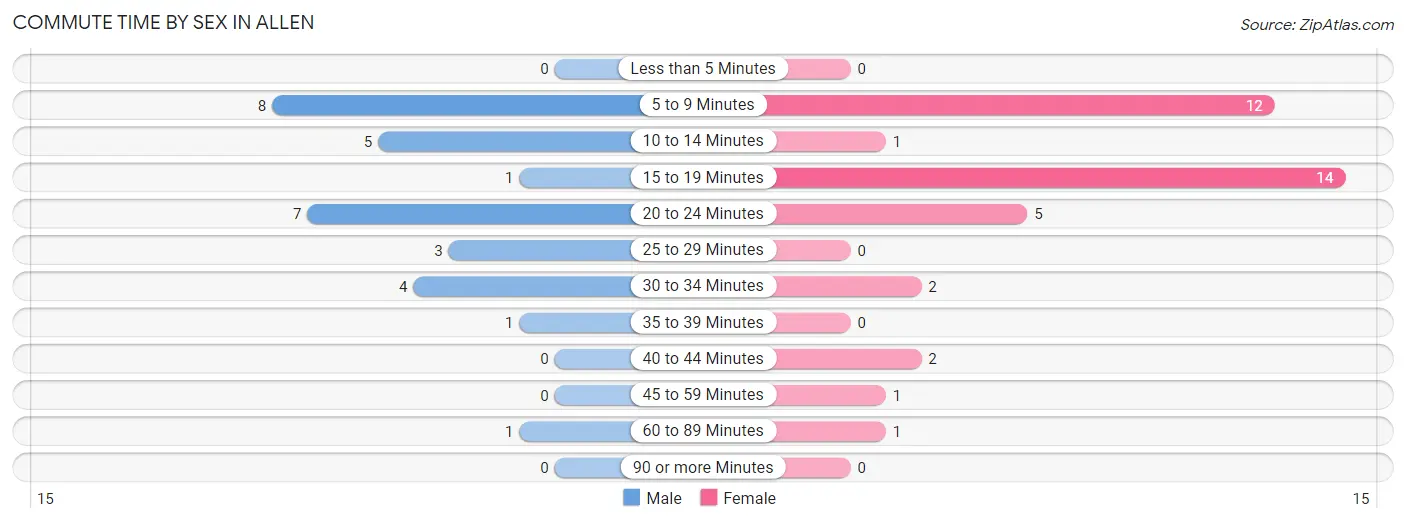
| Commute Time | Male | Female |
| Less than 5 Minutes | 0 (0.0%) | 0 (0.0%) |
| 5 to 9 Minutes | 8 (26.7%) | 12 (31.6%) |
| 10 to 14 Minutes | 5 (16.7%) | 1 (2.6%) |
| 15 to 19 Minutes | 1 (3.3%) | 14 (36.8%) |
| 20 to 24 Minutes | 7 (23.3%) | 5 (13.2%) |
| 25 to 29 Minutes | 3 (10.0%) | 0 (0.0%) |
| 30 to 34 Minutes | 4 (13.3%) | 2 (5.3%) |
| 35 to 39 Minutes | 1 (3.3%) | 0 (0.0%) |
| 40 to 44 Minutes | 0 (0.0%) | 2 (5.3%) |
| 45 to 59 Minutes | 0 (0.0%) | 1 (2.6%) |
| 60 to 89 Minutes | 1 (3.3%) | 1 (2.6%) |
| 90 or more Minutes | 0 (0.0%) | 0 (0.0%) |
Time of Departure to Work by Sex in Allen
The most frequent times of departure to work in Allen are 12:00 PM to 3:59 PM (8, 26.7%) for males and 12:00 PM to 3:59 PM (11, 28.9%) for females.
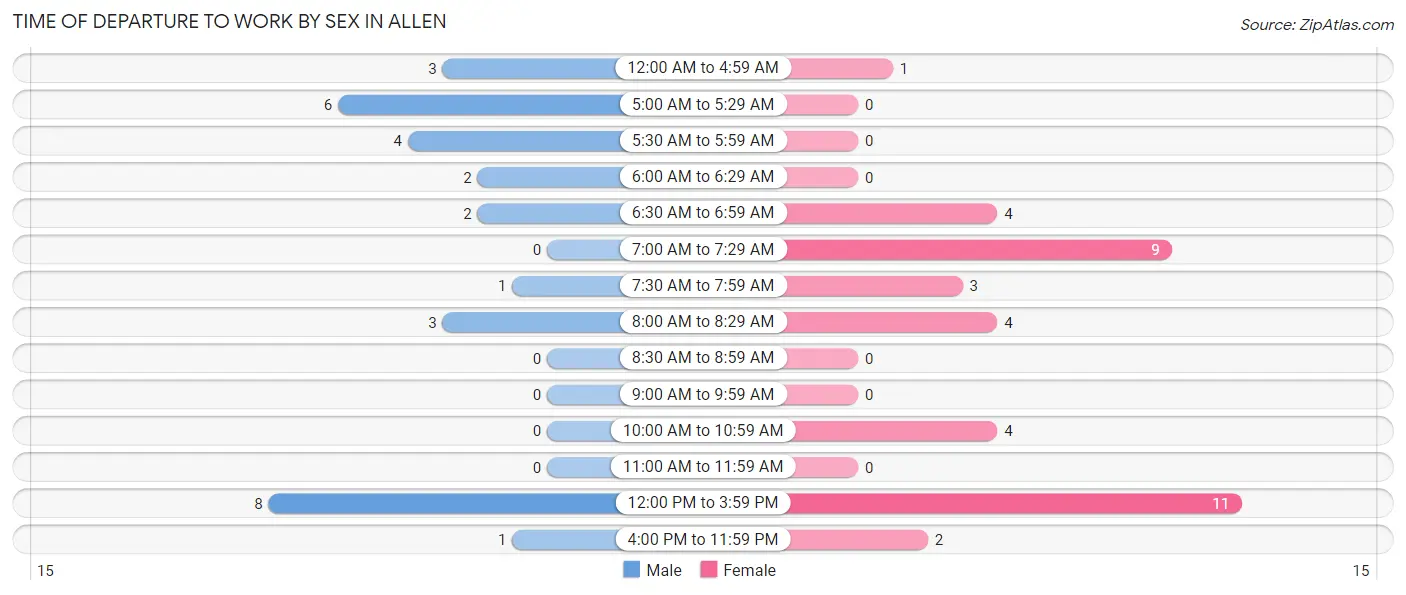
| Time of Departure | Male | Female |
| 12:00 AM to 4:59 AM | 3 (10.0%) | 1 (2.6%) |
| 5:00 AM to 5:29 AM | 6 (20.0%) | 0 (0.0%) |
| 5:30 AM to 5:59 AM | 4 (13.3%) | 0 (0.0%) |
| 6:00 AM to 6:29 AM | 2 (6.7%) | 0 (0.0%) |
| 6:30 AM to 6:59 AM | 2 (6.7%) | 4 (10.5%) |
| 7:00 AM to 7:29 AM | 0 (0.0%) | 9 (23.7%) |
| 7:30 AM to 7:59 AM | 1 (3.3%) | 3 (7.9%) |
| 8:00 AM to 8:29 AM | 3 (10.0%) | 4 (10.5%) |
| 8:30 AM to 8:59 AM | 0 (0.0%) | 0 (0.0%) |
| 9:00 AM to 9:59 AM | 0 (0.0%) | 0 (0.0%) |
| 10:00 AM to 10:59 AM | 0 (0.0%) | 4 (10.5%) |
| 11:00 AM to 11:59 AM | 0 (0.0%) | 0 (0.0%) |
| 12:00 PM to 3:59 PM | 8 (26.7%) | 11 (28.9%) |
| 4:00 PM to 11:59 PM | 1 (3.3%) | 2 (5.3%) |
| Total | 30 (100.0%) | 38 (100.0%) |
Housing Occupancy in Allen
Occupancy by Ownership in Allen
Of the total 83 dwellings in Allen, owner-occupied units account for 69 (83.1%), while renter-occupied units make up 14 (16.9%).
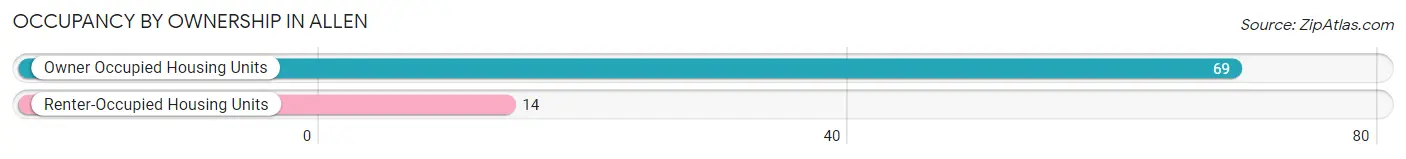
| Occupancy | # Housing Units | % Housing Units |
| Owner Occupied Housing Units | 69 | 83.1% |
| Renter-Occupied Housing Units | 14 | 16.9% |
| Total Occupied Housing Units | 83 | 100.0% |
Occupancy by Household Size in Allen
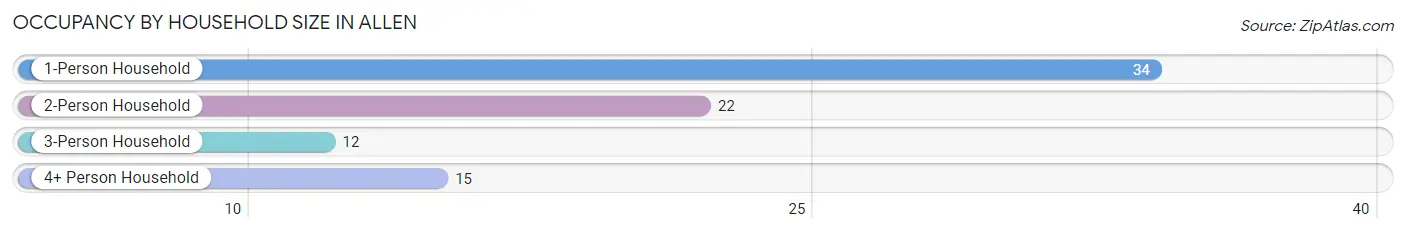
| Household Size | # Housing Units | % Housing Units |
| 1-Person Household | 34 | 41.0% |
| 2-Person Household | 22 | 26.5% |
| 3-Person Household | 12 | 14.5% |
| 4+ Person Household | 15 | 18.1% |
| Total Housing Units | 83 | 100.0% |
Occupancy by Ownership by Household Size in Allen
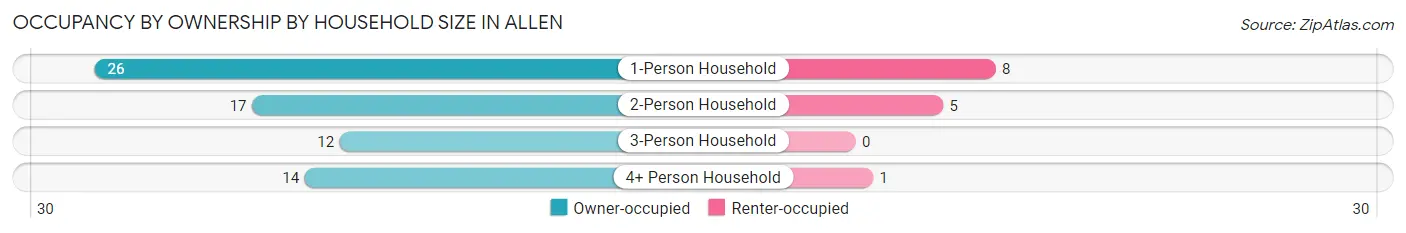
| Household Size | Owner-occupied | Renter-occupied |
| 1-Person Household | 26 (76.5%) | 8 (23.5%) |
| 2-Person Household | 17 (77.3%) | 5 (22.7%) |
| 3-Person Household | 12 (100.0%) | 0 (0.0%) |
| 4+ Person Household | 14 (93.3%) | 1 (6.7%) |
| Total Housing Units | 69 (83.1%) | 14 (16.9%) |
Occupancy by Educational Attainment in Allen
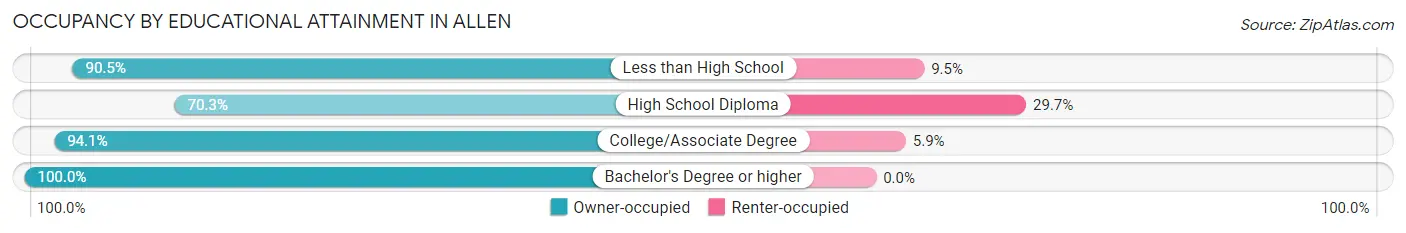
| Household Size | Owner-occupied | Renter-occupied |
| Less than High School | 19 (90.5%) | 2 (9.5%) |
| High School Diploma | 26 (70.3%) | 11 (29.7%) |
| College/Associate Degree | 16 (94.1%) | 1 (5.9%) |
| Bachelor's Degree or higher | 8 (100.0%) | 0 (0.0%) |
Occupancy by Age of Householder in Allen
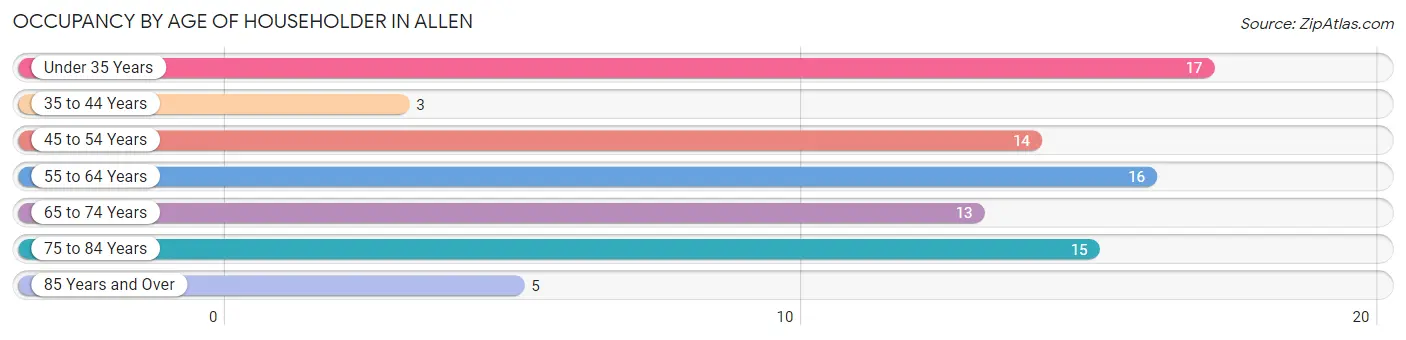
| Age Bracket | # Households | % Households |
| Under 35 Years | 17 | 20.5% |
| 35 to 44 Years | 3 | 3.6% |
| 45 to 54 Years | 14 | 16.9% |
| 55 to 64 Years | 16 | 19.3% |
| 65 to 74 Years | 13 | 15.7% |
| 75 to 84 Years | 15 | 18.1% |
| 85 Years and Over | 5 | 6.0% |
| Total | 83 | 100.0% |
Housing Finances in Allen
Median Income by Occupancy in Allen
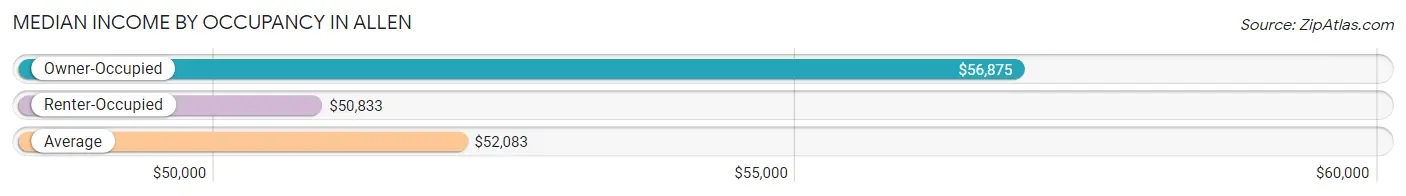
| Occupancy Type | # Households | Median Income |
| Owner-Occupied | 69 (83.1%) | $56,875 |
| Renter-Occupied | 14 (16.9%) | $50,833 |
| Average | 83 (100.0%) | $52,083 |
Occupancy by Householder Income Bracket in Allen
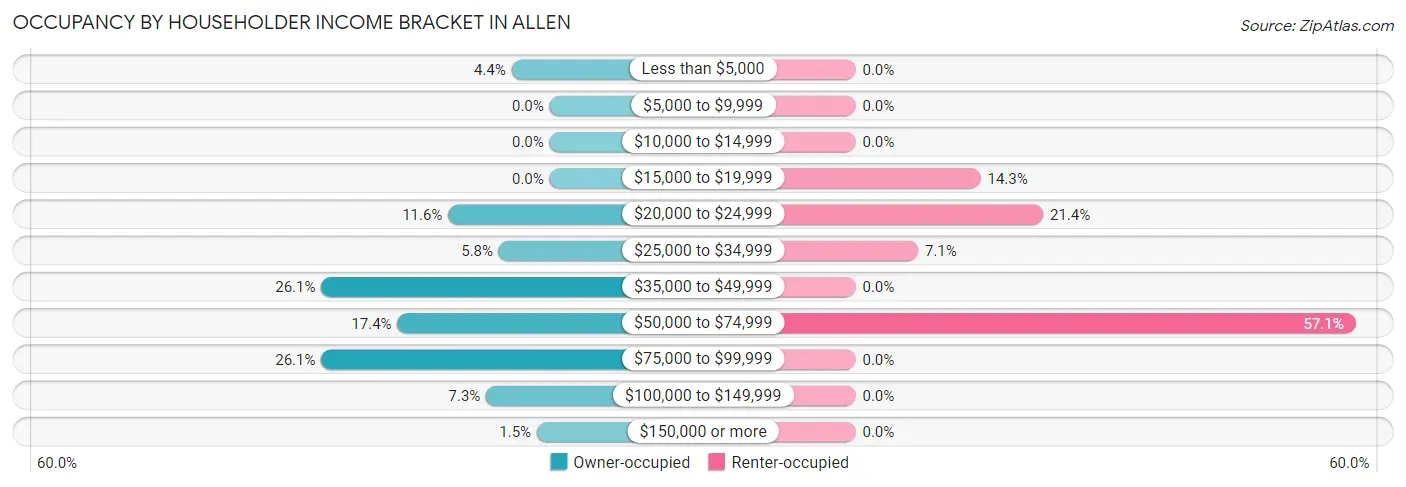
| Income Bracket | Owner-occupied | Renter-occupied |
| Less than $5,000 | 3 (4.3%) | 0 (0.0%) |
| $5,000 to $9,999 | 0 (0.0%) | 0 (0.0%) |
| $10,000 to $14,999 | 0 (0.0%) | 0 (0.0%) |
| $15,000 to $19,999 | 0 (0.0%) | 2 (14.3%) |
| $20,000 to $24,999 | 8 (11.6%) | 3 (21.4%) |
| $25,000 to $34,999 | 4 (5.8%) | 1 (7.1%) |
| $35,000 to $49,999 | 18 (26.1%) | 0 (0.0%) |
| $50,000 to $74,999 | 12 (17.4%) | 8 (57.1%) |
| $75,000 to $99,999 | 18 (26.1%) | 0 (0.0%) |
| $100,000 to $149,999 | 5 (7.2%) | 0 (0.0%) |
| $150,000 or more | 1 (1.5%) | 0 (0.0%) |
| Total | 69 (100.0%) | 14 (100.0%) |
Monthly Housing Cost Tiers in Allen
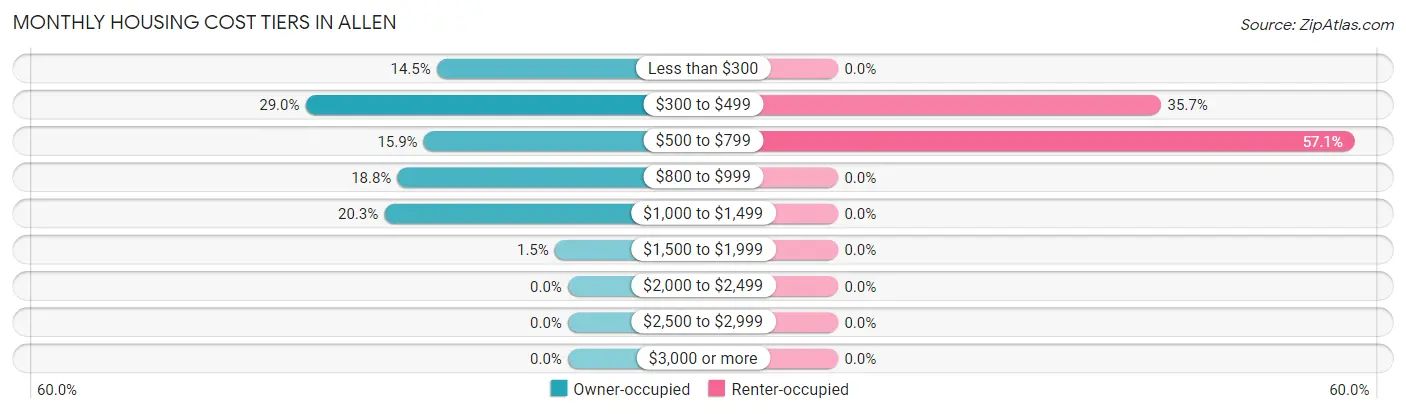
| Monthly Cost | Owner-occupied | Renter-occupied |
| Less than $300 | 10 (14.5%) | 0 (0.0%) |
| $300 to $499 | 20 (29.0%) | 5 (35.7%) |
| $500 to $799 | 11 (15.9%) | 8 (57.1%) |
| $800 to $999 | 13 (18.8%) | 0 (0.0%) |
| $1,000 to $1,499 | 14 (20.3%) | 0 (0.0%) |
| $1,500 to $1,999 | 1 (1.5%) | 0 (0.0%) |
| $2,000 to $2,499 | 0 (0.0%) | 0 (0.0%) |
| $2,500 to $2,999 | 0 (0.0%) | 0 (0.0%) |
| $3,000 or more | 0 (0.0%) | 0 (0.0%) |
| Total | 69 (100.0%) | 14 (100.0%) |
Physical Housing Characteristics in Allen
Housing Structures in Allen
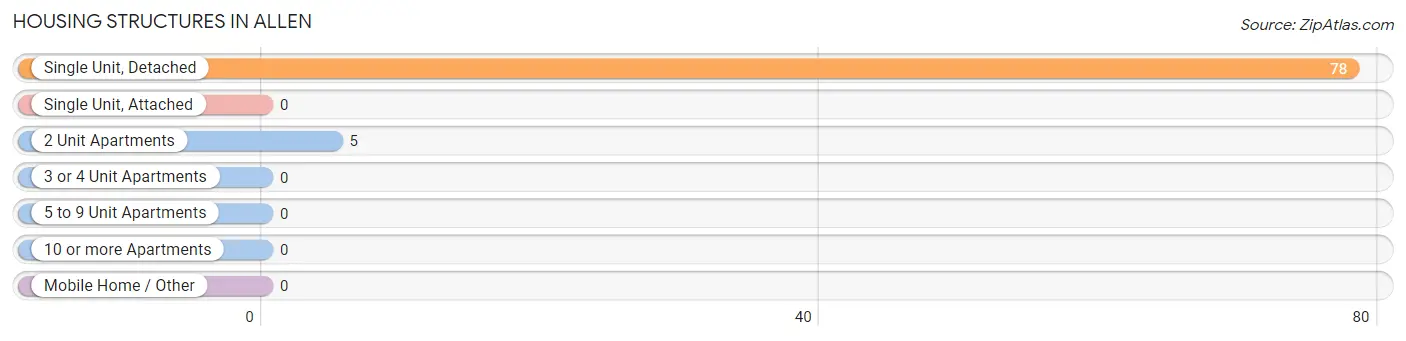
| Structure Type | # Housing Units | % Housing Units |
| Single Unit, Detached | 78 | 94.0% |
| Single Unit, Attached | 0 | 0.0% |
| 2 Unit Apartments | 5 | 6.0% |
| 3 or 4 Unit Apartments | 0 | 0.0% |
| 5 to 9 Unit Apartments | 0 | 0.0% |
| 10 or more Apartments | 0 | 0.0% |
| Mobile Home / Other | 0 | 0.0% |
| Total | 83 | 100.0% |
Housing Structures by Occupancy in Allen
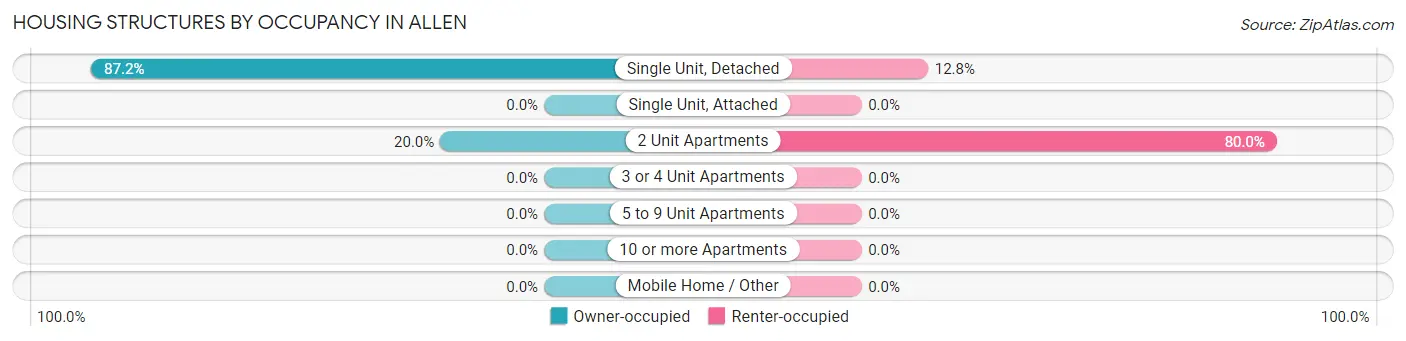
| Structure Type | Owner-occupied | Renter-occupied |
| Single Unit, Detached | 68 (87.2%) | 10 (12.8%) |
| Single Unit, Attached | 0 (0.0%) | 0 (0.0%) |
| 2 Unit Apartments | 1 (20.0%) | 4 (80.0%) |
| 3 or 4 Unit Apartments | 0 (0.0%) | 0 (0.0%) |
| 5 to 9 Unit Apartments | 0 (0.0%) | 0 (0.0%) |
| 10 or more Apartments | 0 (0.0%) | 0 (0.0%) |
| Mobile Home / Other | 0 (0.0%) | 0 (0.0%) |
| Total | 69 (83.1%) | 14 (16.9%) |
Housing Structures by Number of Rooms in Allen
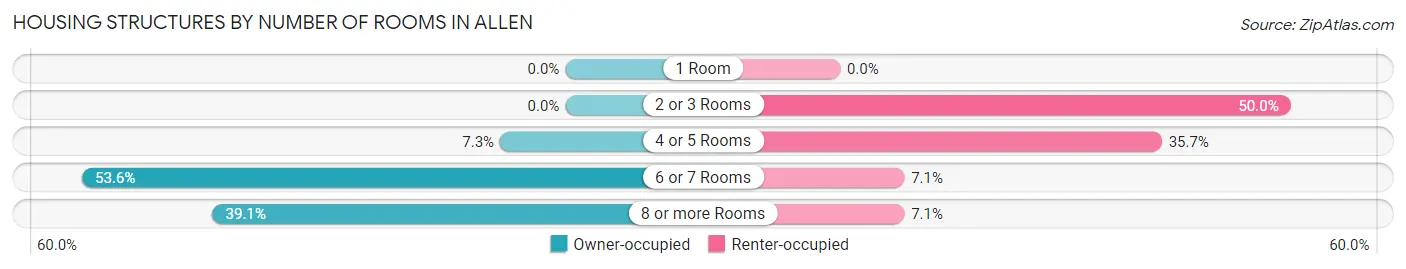
| Number of Rooms | Owner-occupied | Renter-occupied |
| 1 Room | 0 (0.0%) | 0 (0.0%) |
| 2 or 3 Rooms | 0 (0.0%) | 7 (50.0%) |
| 4 or 5 Rooms | 5 (7.2%) | 5 (35.7%) |
| 6 or 7 Rooms | 37 (53.6%) | 1 (7.1%) |
| 8 or more Rooms | 27 (39.1%) | 1 (7.1%) |
| Total | 69 (100.0%) | 14 (100.0%) |
Housing Structure by Heating Type in Allen
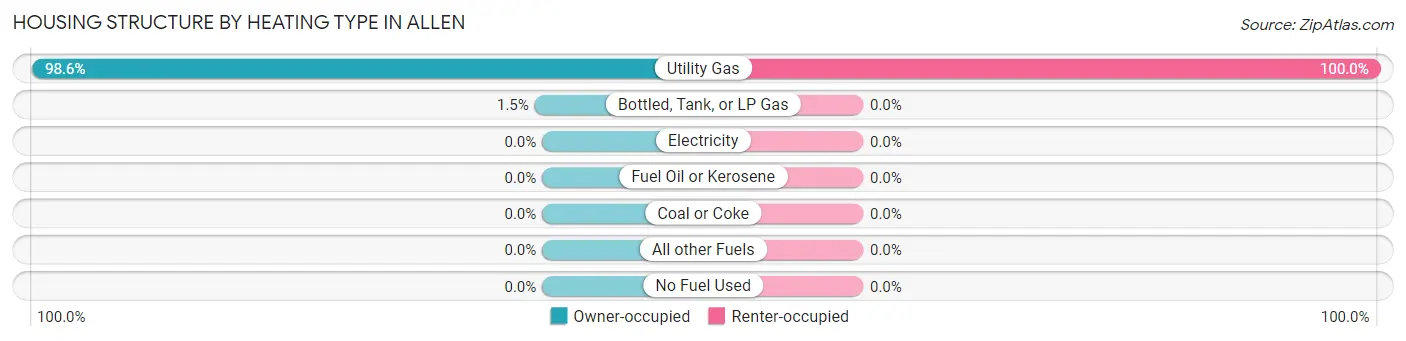
| Heating Type | Owner-occupied | Renter-occupied |
| Utility Gas | 68 (98.6%) | 14 (100.0%) |
| Bottled, Tank, or LP Gas | 1 (1.5%) | 0 (0.0%) |
| Electricity | 0 (0.0%) | 0 (0.0%) |
| Fuel Oil or Kerosene | 0 (0.0%) | 0 (0.0%) |
| Coal or Coke | 0 (0.0%) | 0 (0.0%) |
| All other Fuels | 0 (0.0%) | 0 (0.0%) |
| No Fuel Used | 0 (0.0%) | 0 (0.0%) |
| Total | 69 (100.0%) | 14 (100.0%) |
Household Vehicle Usage in Allen
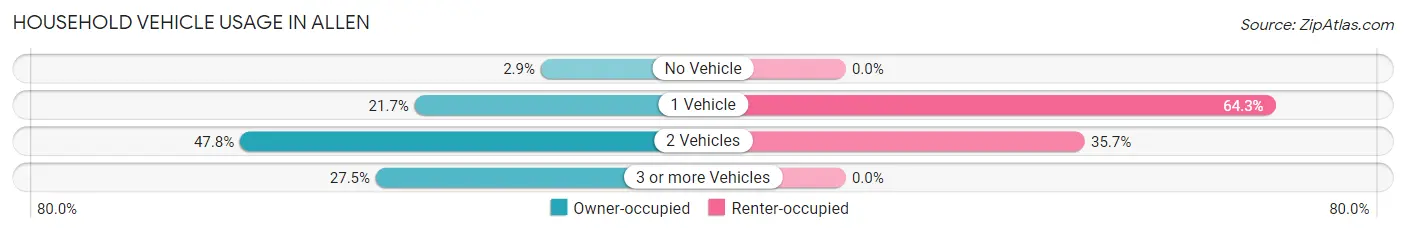
| Vehicles per Household | Owner-occupied | Renter-occupied |
| No Vehicle | 2 (2.9%) | 0 (0.0%) |
| 1 Vehicle | 15 (21.7%) | 9 (64.3%) |
| 2 Vehicles | 33 (47.8%) | 5 (35.7%) |
| 3 or more Vehicles | 19 (27.5%) | 0 (0.0%) |
| Total | 69 (100.0%) | 14 (100.0%) |
Real Estate & Mortgages in Allen
Real Estate and Mortgage Overview in Allen
| Characteristic | Without Mortgage | With Mortgage |
| Housing Units | 35 | 34 |
| Median Property Value | $89,200 | $92,000 |
| Median Household Income | $70,250 | $1 |
| Monthly Housing Costs | $375 | $0 |
| Real Estate Taxes | $1,396 | $0 |
Property Value by Mortgage Status in Allen
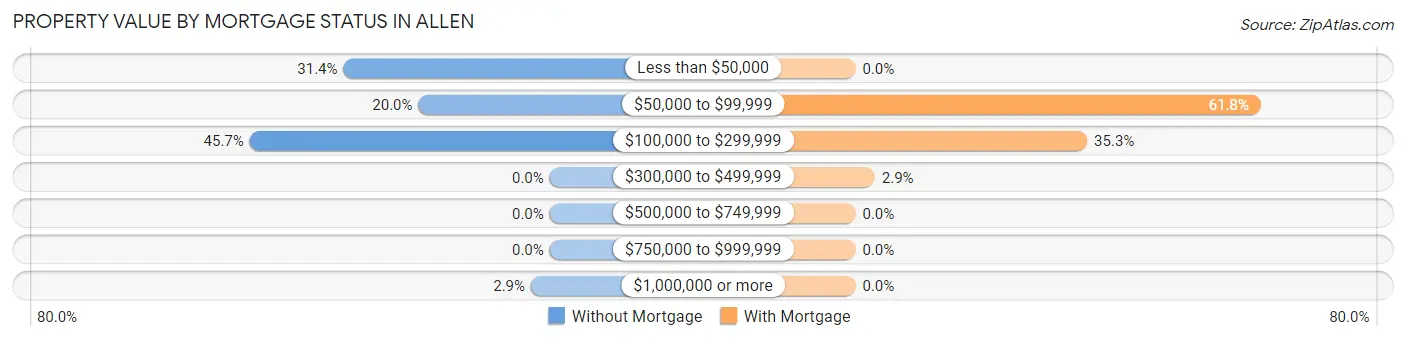
| Property Value | Without Mortgage | With Mortgage |
| Less than $50,000 | 11 (31.4%) | 0 (0.0%) |
| $50,000 to $99,999 | 7 (20.0%) | 21 (61.8%) |
| $100,000 to $299,999 | 16 (45.7%) | 12 (35.3%) |
| $300,000 to $499,999 | 0 (0.0%) | 1 (2.9%) |
| $500,000 to $749,999 | 0 (0.0%) | 0 (0.0%) |
| $750,000 to $999,999 | 0 (0.0%) | 0 (0.0%) |
| $1,000,000 or more | 1 (2.9%) | 0 (0.0%) |
| Total | 35 (100.0%) | 34 (100.0%) |
Household Income by Mortgage Status in Allen
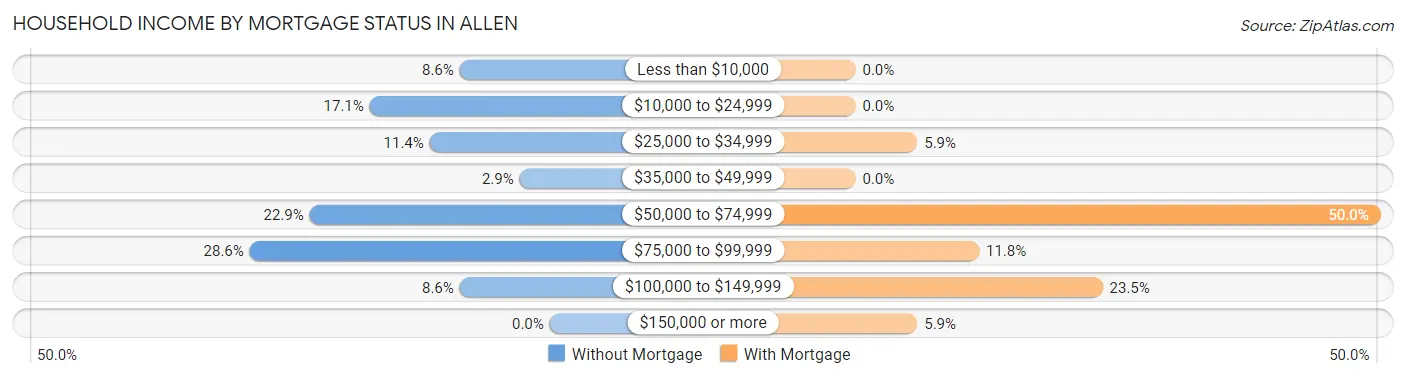
| Household Income | Without Mortgage | With Mortgage |
| Less than $10,000 | 3 (8.6%) | 0 (0.0%) |
| $10,000 to $24,999 | 6 (17.1%) | 0 (0.0%) |
| $25,000 to $34,999 | 4 (11.4%) | 2 (5.9%) |
| $35,000 to $49,999 | 1 (2.9%) | 0 (0.0%) |
| $50,000 to $74,999 | 8 (22.9%) | 17 (50.0%) |
| $75,000 to $99,999 | 10 (28.6%) | 4 (11.8%) |
| $100,000 to $149,999 | 3 (8.6%) | 8 (23.5%) |
| $150,000 or more | 0 (0.0%) | 2 (5.9%) |
| Total | 35 (100.0%) | 34 (100.0%) |
Property Value to Household Income Ratio in Allen
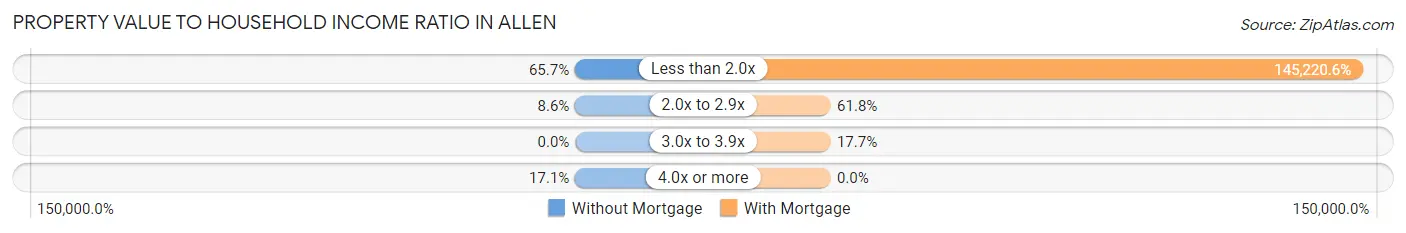
| Value-to-Income Ratio | Without Mortgage | With Mortgage |
| Less than 2.0x | 23 (65.7%) | 49,375 (145,220.6%) |
| 2.0x to 2.9x | 3 (8.6%) | 21 (61.8%) |
| 3.0x to 3.9x | 0 (0.0%) | 6 (17.6%) |
| 4.0x or more | 6 (17.1%) | 0 (0.0%) |
| Total | 35 (100.0%) | 34 (100.0%) |
Real Estate Taxes by Mortgage Status in Allen
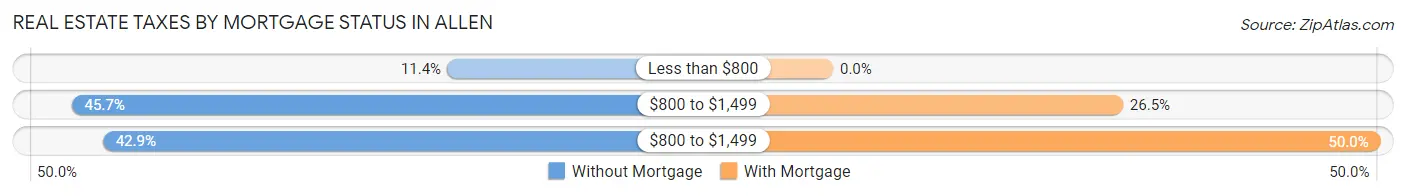
| Property Taxes | Without Mortgage | With Mortgage |
| Less than $800 | 4 (11.4%) | 0 (0.0%) |
| $800 to $1,499 | 16 (45.7%) | 9 (26.5%) |
| $800 to $1,499 | 15 (42.9%) | 17 (50.0%) |
| Total | 35 (100.0%) | 34 (100.0%) |
Health & Disability in Allen
Health Insurance Coverage by Age in Allen
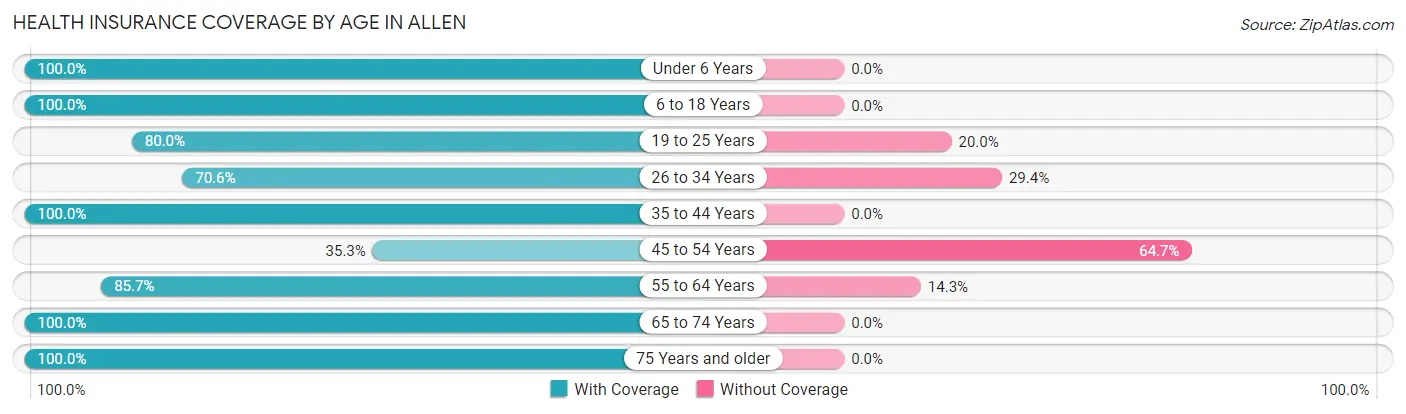
| Age Bracket | With Coverage | Without Coverage |
| Under 6 Years | 21 (100.0%) | 0 (0.0%) |
| 6 to 18 Years | 31 (100.0%) | 0 (0.0%) |
| 19 to 25 Years | 12 (80.0%) | 3 (20.0%) |
| 26 to 34 Years | 24 (70.6%) | 10 (29.4%) |
| 35 to 44 Years | 10 (100.0%) | 0 (0.0%) |
| 45 to 54 Years | 12 (35.3%) | 22 (64.7%) |
| 55 to 64 Years | 18 (85.7%) | 3 (14.3%) |
| 65 to 74 Years | 25 (100.0%) | 0 (0.0%) |
| 75 Years and older | 22 (100.0%) | 0 (0.0%) |
| Total | 175 (82.2%) | 38 (17.8%) |
Health Insurance Coverage by Citizenship Status in Allen
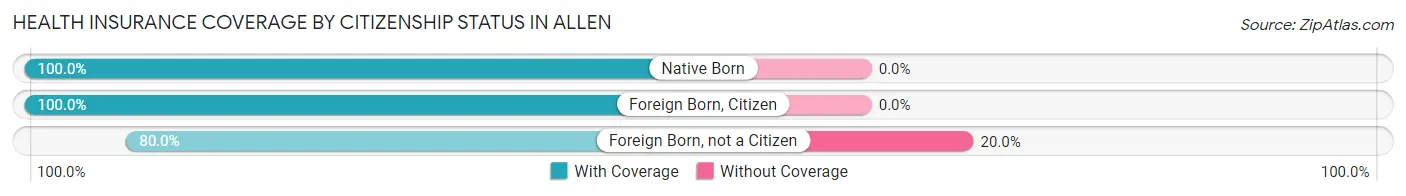
| Citizenship Status | With Coverage | Without Coverage |
| Native Born | 21 (100.0%) | 0 (0.0%) |
| Foreign Born, Citizen | 31 (100.0%) | 0 (0.0%) |
| Foreign Born, not a Citizen | 12 (80.0%) | 3 (20.0%) |
Health Insurance Coverage by Household Income in Allen
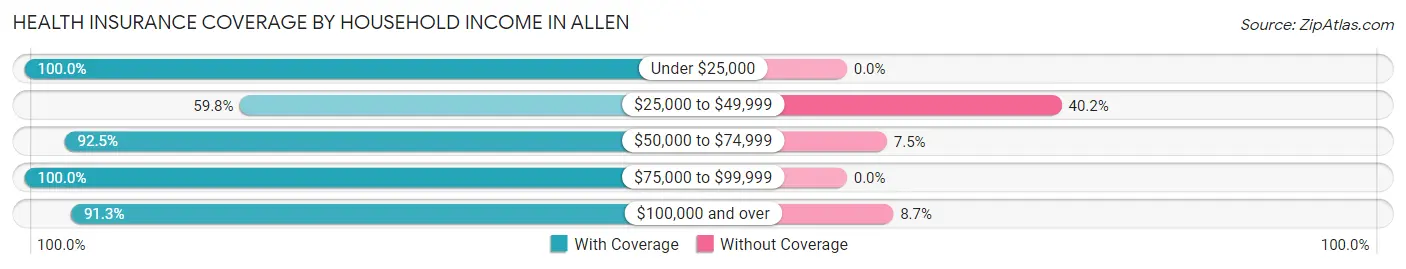
| Household Income | With Coverage | Without Coverage |
| Under $25,000 | 24 (100.0%) | 0 (0.0%) |
| $25,000 to $49,999 | 49 (59.8%) | 33 (40.2%) |
| $50,000 to $74,999 | 37 (92.5%) | 3 (7.5%) |
| $75,000 to $99,999 | 44 (100.0%) | 0 (0.0%) |
| $100,000 and over | 21 (91.3%) | 2 (8.7%) |
Public vs Private Health Insurance Coverage by Age in Allen
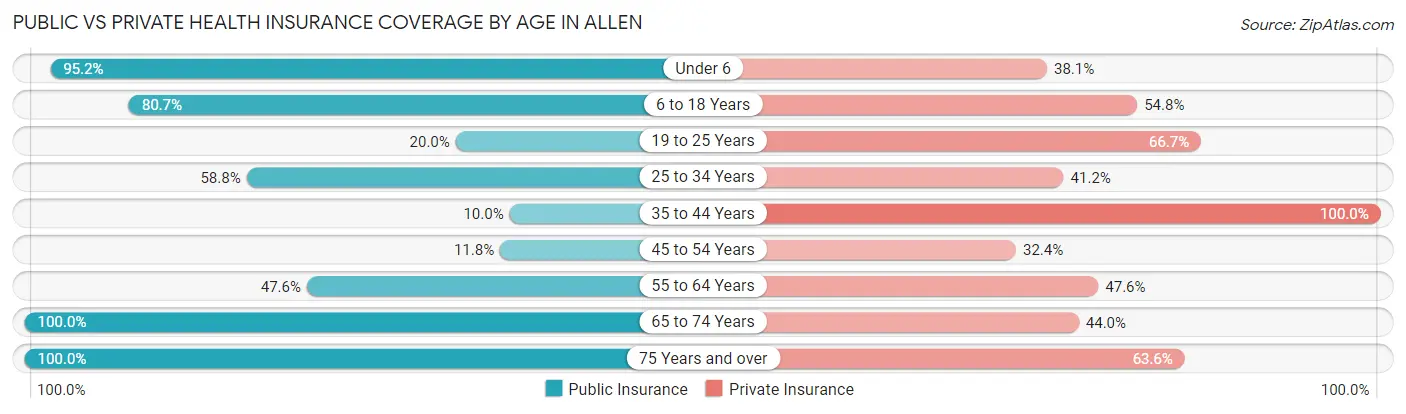
| Age Bracket | Public Insurance | Private Insurance |
| Under 6 | 20 (95.2%) | 8 (38.1%) |
| 6 to 18 Years | 25 (80.6%) | 17 (54.8%) |
| 19 to 25 Years | 3 (20.0%) | 10 (66.7%) |
| 25 to 34 Years | 20 (58.8%) | 14 (41.2%) |
| 35 to 44 Years | 1 (10.0%) | 10 (100.0%) |
| 45 to 54 Years | 4 (11.8%) | 11 (32.4%) |
| 55 to 64 Years | 10 (47.6%) | 10 (47.6%) |
| 65 to 74 Years | 25 (100.0%) | 11 (44.0%) |
| 75 Years and over | 22 (100.0%) | 14 (63.6%) |
| Total | 130 (61.0%) | 105 (49.3%) |
Disability Status by Sex by Age in Allen
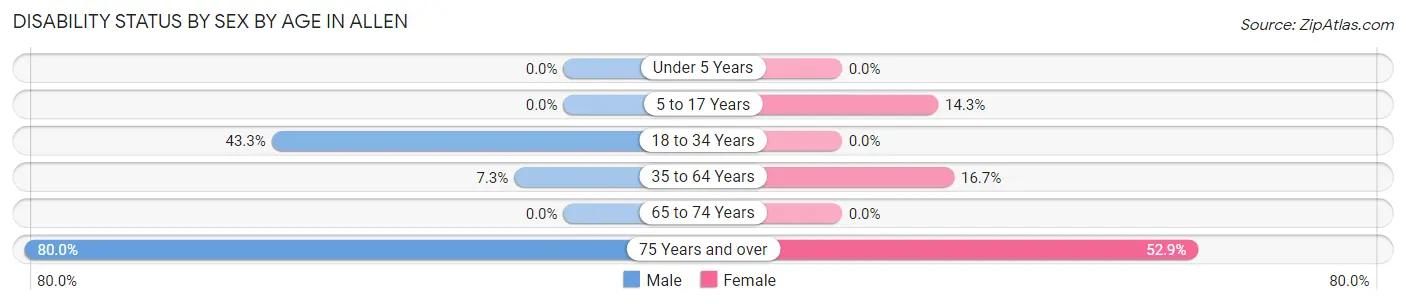
| Age Bracket | Male | Female |
| Under 5 Years | 0 (0.0%) | 0 (0.0%) |
| 5 to 17 Years | 0 (0.0%) | 3 (14.3%) |
| 18 to 34 Years | 13 (43.3%) | 0 (0.0%) |
| 35 to 64 Years | 3 (7.3%) | 4 (16.7%) |
| 65 to 74 Years | 0 (0.0%) | 0 (0.0%) |
| 75 Years and over | 4 (80.0%) | 9 (52.9%) |
Disability Class by Sex by Age in Allen
Disability Class: Hearing Difficulty
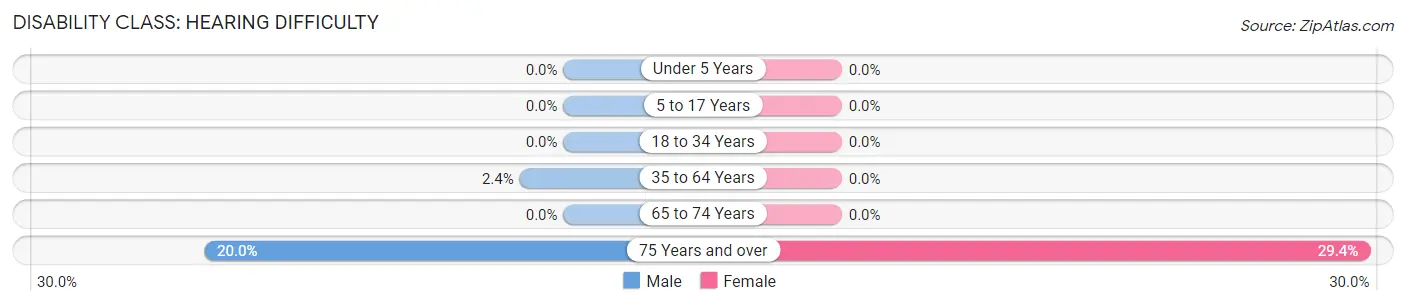
| Age Bracket | Male | Female |
| Under 5 Years | 0 (0.0%) | 0 (0.0%) |
| 5 to 17 Years | 0 (0.0%) | 0 (0.0%) |
| 18 to 34 Years | 0 (0.0%) | 0 (0.0%) |
| 35 to 64 Years | 1 (2.4%) | 0 (0.0%) |
| 65 to 74 Years | 0 (0.0%) | 0 (0.0%) |
| 75 Years and over | 1 (20.0%) | 5 (29.4%) |
Disability Class: Vision Difficulty
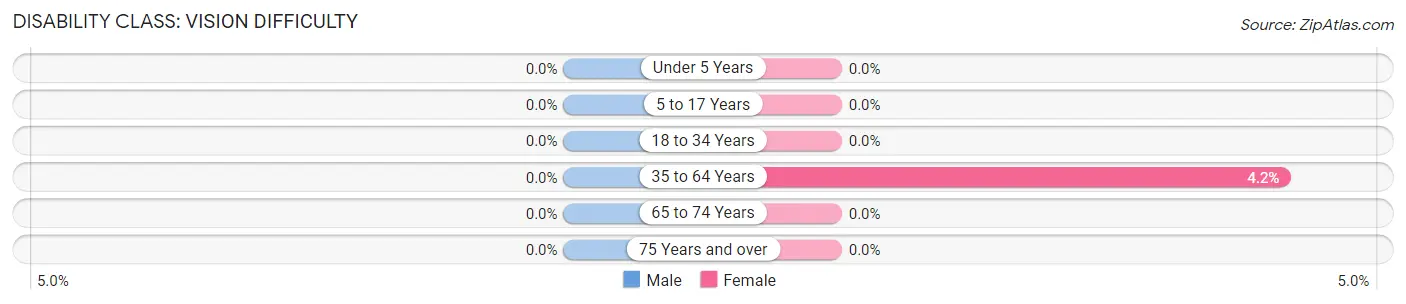
| Age Bracket | Male | Female |
| Under 5 Years | 0 (0.0%) | 0 (0.0%) |
| 5 to 17 Years | 0 (0.0%) | 0 (0.0%) |
| 18 to 34 Years | 0 (0.0%) | 0 (0.0%) |
| 35 to 64 Years | 0 (0.0%) | 1 (4.2%) |
| 65 to 74 Years | 0 (0.0%) | 0 (0.0%) |
| 75 Years and over | 0 (0.0%) | 0 (0.0%) |
Disability Class: Cognitive Difficulty
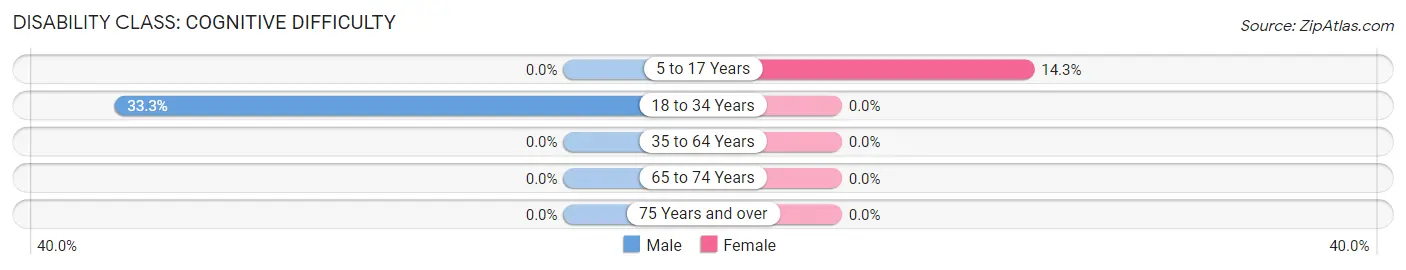
| Age Bracket | Male | Female |
| 5 to 17 Years | 0 (0.0%) | 3 (14.3%) |
| 18 to 34 Years | 10 (33.3%) | 0 (0.0%) |
| 35 to 64 Years | 0 (0.0%) | 0 (0.0%) |
| 65 to 74 Years | 0 (0.0%) | 0 (0.0%) |
| 75 Years and over | 0 (0.0%) | 0 (0.0%) |
Disability Class: Ambulatory Difficulty
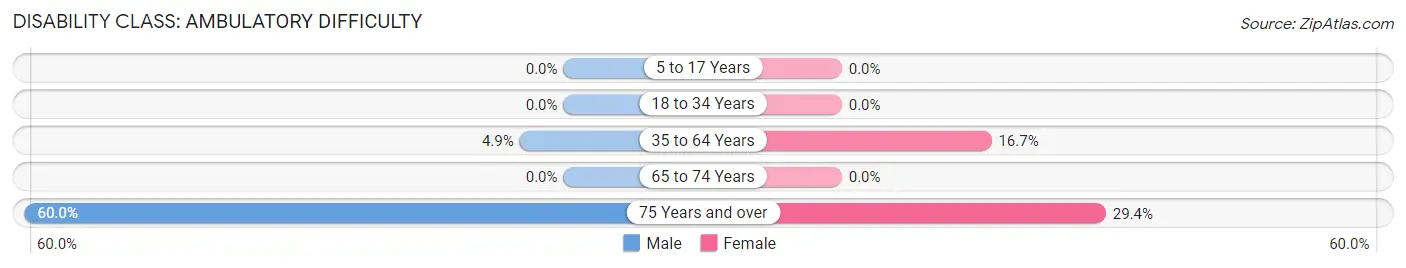
| Age Bracket | Male | Female |
| 5 to 17 Years | 0 (0.0%) | 0 (0.0%) |
| 18 to 34 Years | 0 (0.0%) | 0 (0.0%) |
| 35 to 64 Years | 2 (4.9%) | 4 (16.7%) |
| 65 to 74 Years | 0 (0.0%) | 0 (0.0%) |
| 75 Years and over | 3 (60.0%) | 5 (29.4%) |
Disability Class: Self-Care Difficulty
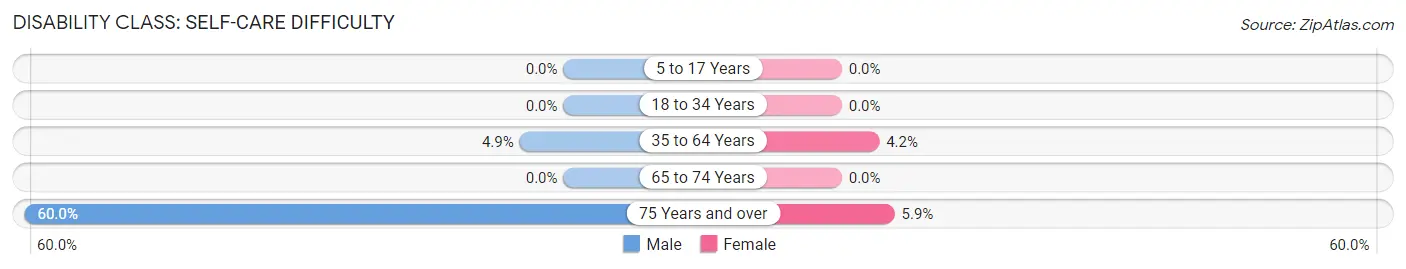
| Age Bracket | Male | Female |
| 5 to 17 Years | 0 (0.0%) | 0 (0.0%) |
| 18 to 34 Years | 0 (0.0%) | 0 (0.0%) |
| 35 to 64 Years | 2 (4.9%) | 1 (4.2%) |
| 65 to 74 Years | 0 (0.0%) | 0 (0.0%) |
| 75 Years and over | 3 (60.0%) | 1 (5.9%) |
Technology Access in Allen
Computing Device Access in Allen
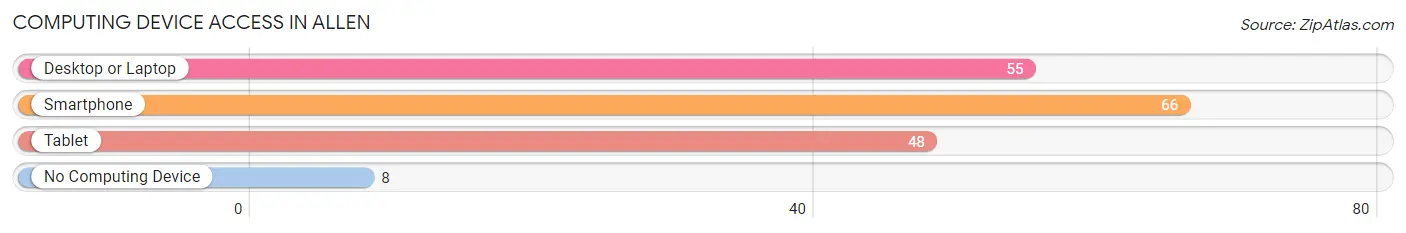
| Device Type | # Households | % Households |
| Desktop or Laptop | 55 | 66.3% |
| Smartphone | 66 | 79.5% |
| Tablet | 48 | 57.8% |
| No Computing Device | 8 | 9.6% |
| Total | 83 | 100.0% |
Internet Access in Allen
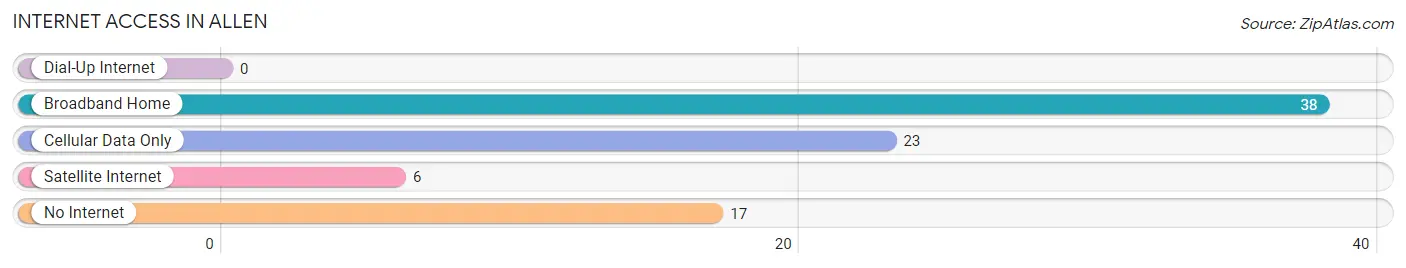
| Internet Type | # Households | % Households |
| Dial-Up Internet | 0 | 0.0% |
| Broadband Home | 38 | 45.8% |
| Cellular Data Only | 23 | 27.7% |
| Satellite Internet | 6 | 7.2% |
| No Internet | 17 | 20.5% |
| Total | 83 | 100.0% |
Allen Summary
Allen is a small city located in the state of Michigan in the United States. It is located in the southeastern part of the state, about 25 miles from the city of Detroit. The city has a population of approximately 8,000 people and is part of the Detroit metropolitan area.
History
The area that is now Allen was first settled in the early 1800s by settlers from New England. The first settlers were farmers who were attracted to the area by its fertile soil and abundant natural resources. The area was originally known as "Allen's Settlement" after the first settler, John Allen. The settlement grew slowly over the years and in 1837, it was officially incorporated as the village of Allen.
In the late 1800s, the village of Allen began to experience rapid growth due to the arrival of the railroad. The railroad allowed for the transportation of goods and people to and from the area, which helped to spur economic growth. The village was officially incorporated as a city in 1891.
Geography
Allen is located in southeastern Michigan, about 25 miles from the city of Detroit. The city is situated on the banks of the Huron River, which flows through the city. The city is surrounded by several small towns and villages, including Ypsilanti, Ann Arbor, and Saline.
The city has a total area of 4.2 square miles, of which 4.1 square miles is land and 0.1 square miles is water. The city is located in a humid continental climate zone, with hot summers and cold winters.
Economy
The economy of Allen is largely based on manufacturing and retail. The city is home to several large manufacturing companies, including Ford Motor Company, General Motors, and Chrysler. The city also has a large retail sector, with several large shopping malls and retail stores.
The city also has a large tourism industry, with several popular attractions, including the Allen Historical Museum, the Allen Art Museum, and the Allen Zoo.
Demographics
As of the 2010 census, the population of Allen was 8,000 people. The racial makeup of the city was 79.2% White, 14.2% African American, 0.7% Native American, 1.2% Asian, and 4.7% from other races. The median household income was $45,000, and the median family income was $50,000.
The city has a large number of immigrants, with approximately 20% of the population being foreign-born. The largest immigrant groups are from Mexico, India, and China.
Conclusion
Allen is a small city located in southeastern Michigan, about 25 miles from the city of Detroit. The city has a population of approximately 8,000 people and is part of the Detroit metropolitan area. The economy of Allen is largely based on manufacturing and retail, and the city also has a large tourism industry. The city has a diverse population, with a large number of immigrants from Mexico, India, and China.
Common Questions
What is Per Capita Income in Allen?
Per Capita income in Allen is $23,642.
What is the Median Family Income in Allen?
Median Family Income in Allen is $52,500.
What is the Median Household income in Allen?
Median Household Income in Allen is $52,083.
What is Income or Wage Gap in Allen?
Income or Wage Gap in Allen is 5.2%.
Women in Allen earn 94.8 cents for every dollar earned by a man.
What is Inequality or Gini Index in Allen?
Inequality or Gini Index in Allen is 0.31.
What is the Total Population of Allen?
Total Population of Allen is 213.
What is the Total Male Population of Allen?
Total Male Population of Allen is 107.
What is the Total Female Population of Allen?
Total Female Population of Allen is 106.
What is the Ratio of Males per 100 Females in Allen?
There are 100.94 Males per 100 Females in Allen.
What is the Ratio of Females per 100 Males in Allen?
There are 99.07 Females per 100 Males in Allen.
What is the Median Population Age in Allen?
Median Population Age in Allen is 36.6 Years.
What is the Average Family Size in Allen
Average Family Size in Allen is 3.7 People.
What is the Average Household Size in Allen
Average Household Size in Allen is 2.6 People.
How Large is the Labor Force in Allen?
There are 93 People in the Labor Forcein in Allen.
What is the Percentage of People in the Labor Force in Allen?
57.8% of People are in the Labor Force in Allen.
What is the Unemployment Rate in Allen?
Unemployment Rate in Allen is 24.7%.