Quincy, MI Map & Demographics
Quincy Map
Quincy Overview
$27,913
PER CAPITA INCOME
$52,292
AVG FAMILY INCOME
$47,275
AVG HOUSEHOLD INCOME
23.9%
WAGE / INCOME GAP [ % ]
76.1¢/ $1
WAGE / INCOME GAP [ $ ]
0.36
INEQUALITY / GINI INDEX
1,303
TOTAL POPULATION
636
MALE POPULATION
667
FEMALE POPULATION
95.35
MALES / 100 FEMALES
104.87
FEMALES / 100 MALES
39.6
MEDIAN AGE
2.9
AVG FAMILY SIZE
2.1
AVG HOUSEHOLD SIZE
653
LABOR FORCE [ PEOPLE ]
61.2%
PERCENT IN LABOR FORCE
7.5%
UNEMPLOYMENT RATE
Quincy Zip Codes
Quincy Area Codes
Income in Quincy
Income Overview in Quincy
Per Capita Income in Quincy is $27,913, while median incomes of families and households are $52,292 and $47,275 respectively.
| Characteristic | Number | Measure |
| Per Capita Income | 1,303 | $27,913 |
| Median Family Income | 297 | $52,292 |
| Mean Family Income | 297 | $64,463 |
| Median Household Income | 609 | $47,275 |
| Mean Household Income | 609 | $58,519 |
| Income Deficit | 297 | $0 |
| Wage / Income Gap (%) | 1,303 | 23.89% |
| Wage / Income Gap ($) | 1,303 | 76.11¢ per $1 |
| Gini / Inequality Index | 1,303 | 0.36 |
Earnings by Sex in Quincy
Average Earnings in Quincy are $39,881, $45,700 for men and $34,783 for women, a difference of 23.9%.
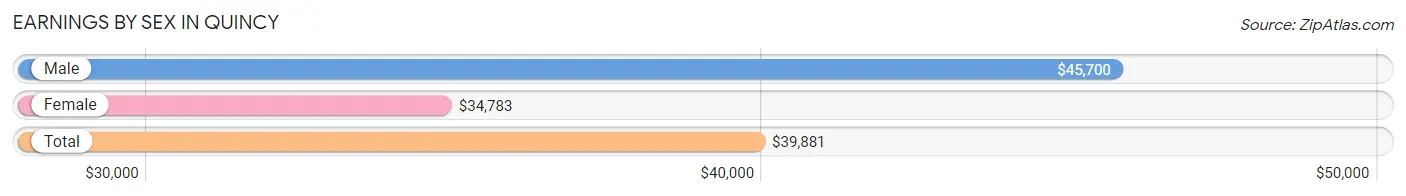
| Sex | Number | Average Earnings |
| Male | 378 (57.1%) | $45,700 |
| Female | 284 (42.9%) | $34,783 |
| Total | 662 (100.0%) | $39,881 |
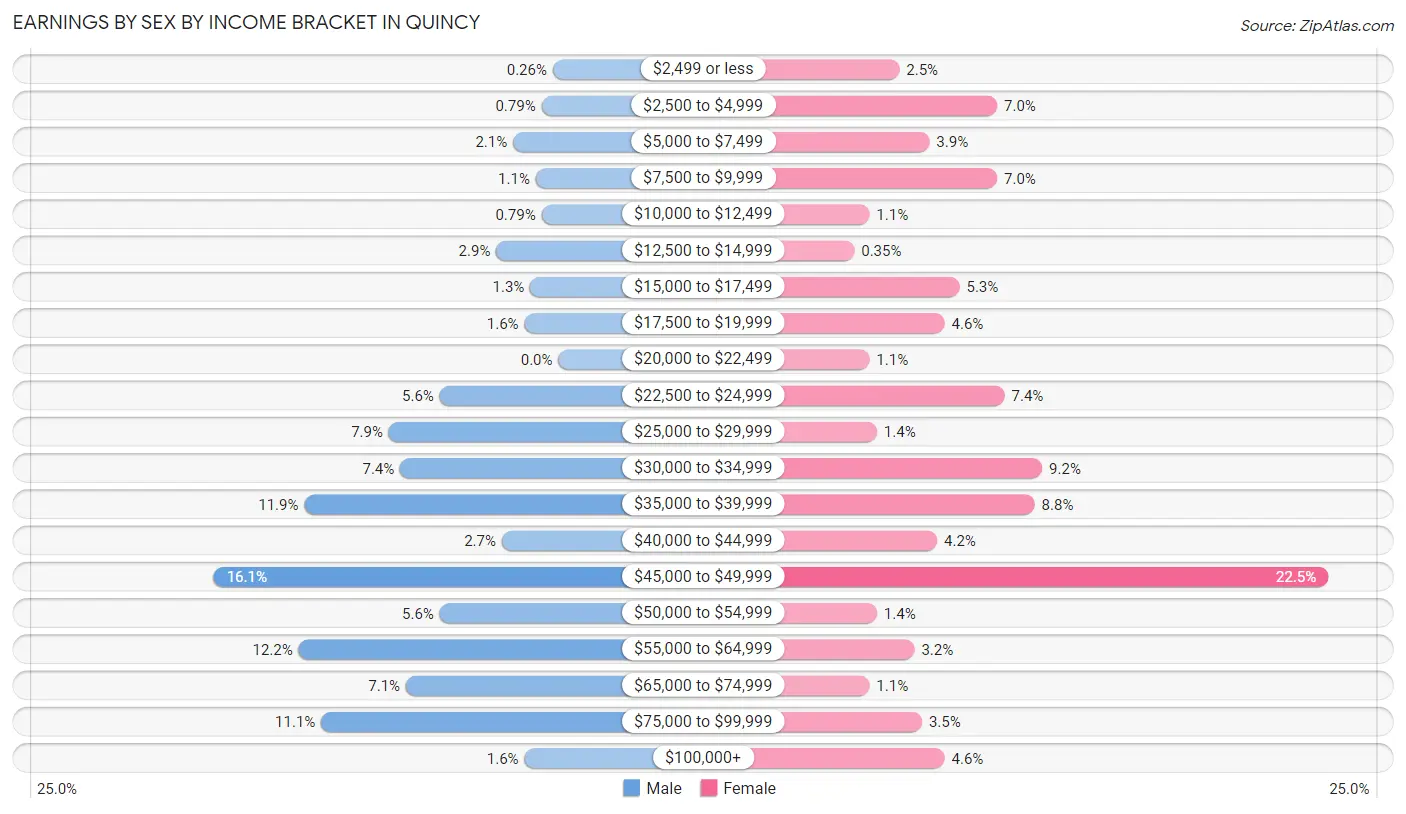
Earnings by Sex by Income Bracket in Quincy
The most common earnings brackets in Quincy are $45,000 to $49,999 for men (61 | 16.1%) and $45,000 to $49,999 for women (64 | 22.5%).
| Income | Male | Female |
| $2,499 or less | 1 (0.3%) | 7 (2.5%) |
| $2,500 to $4,999 | 3 (0.8%) | 20 (7.0%) |
| $5,000 to $7,499 | 8 (2.1%) | 11 (3.9%) |
| $7,500 to $9,999 | 4 (1.1%) | 20 (7.0%) |
| $10,000 to $12,499 | 3 (0.8%) | 3 (1.1%) |
| $12,500 to $14,999 | 11 (2.9%) | 1 (0.4%) |
| $15,000 to $17,499 | 5 (1.3%) | 15 (5.3%) |
| $17,500 to $19,999 | 6 (1.6%) | 13 (4.6%) |
| $20,000 to $22,499 | 0 (0.0%) | 3 (1.1%) |
| $22,500 to $24,999 | 21 (5.6%) | 21 (7.4%) |
| $25,000 to $29,999 | 30 (7.9%) | 4 (1.4%) |
| $30,000 to $34,999 | 28 (7.4%) | 26 (9.1%) |
| $35,000 to $39,999 | 45 (11.9%) | 25 (8.8%) |
| $40,000 to $44,999 | 10 (2.6%) | 12 (4.2%) |
| $45,000 to $49,999 | 61 (16.1%) | 64 (22.5%) |
| $50,000 to $54,999 | 21 (5.6%) | 4 (1.4%) |
| $55,000 to $64,999 | 46 (12.2%) | 9 (3.2%) |
| $65,000 to $74,999 | 27 (7.1%) | 3 (1.1%) |
| $75,000 to $99,999 | 42 (11.1%) | 10 (3.5%) |
| $100,000+ | 6 (1.6%) | 13 (4.6%) |
| Total | 378 (100.0%) | 284 (100.0%) |
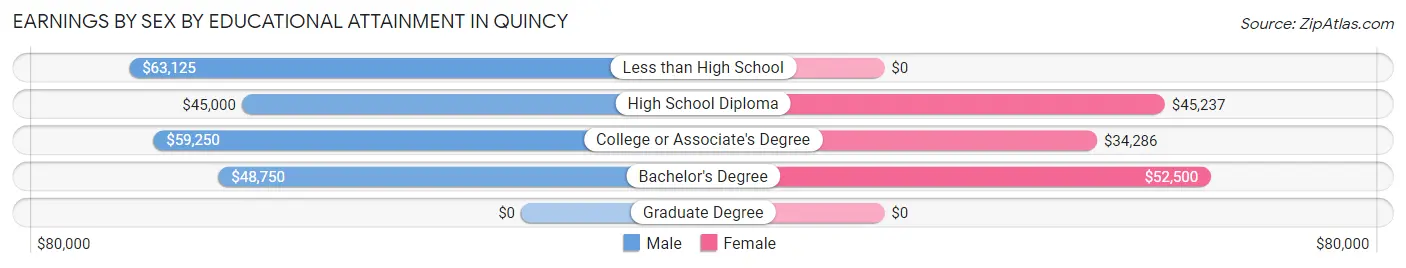
Earnings by Sex by Educational Attainment in Quincy
Average earnings in Quincy are $50,294 for men and $38,083 for women, a difference of 24.3%. Men with an educational attainment of less than high school enjoy the highest average annual earnings of $63,125, while those with high school diploma education earn the least with $45,000. Women with an educational attainment of bachelor's degree earn the most with the average annual earnings of $52,500, while those with college or associate's degree education have the smallest earnings of $34,286.
| Educational Attainment | Male Income | Female Income |
| Less than High School | $63,125 | $0 |
| High School Diploma | $45,000 | $45,237 |
| College or Associate's Degree | $59,250 | $34,286 |
| Bachelor's Degree | $48,750 | $52,500 |
| Graduate Degree | - | - |
| Total | $50,294 | $38,083 |
Family Income in Quincy
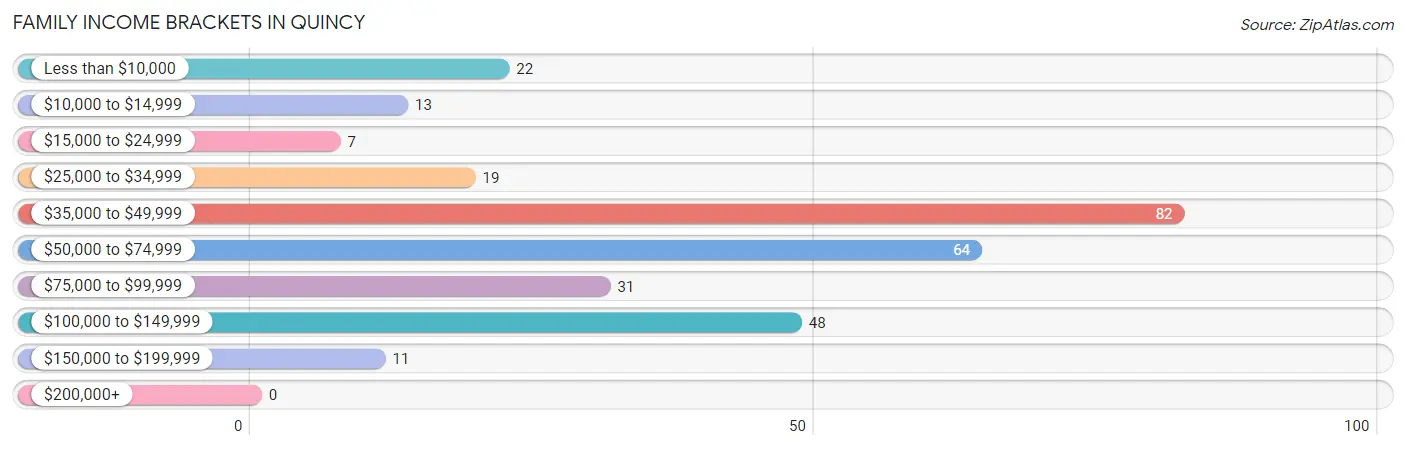
Family Income Brackets in Quincy
According to the Quincy family income data, there are 82 families falling into the $35,000 to $49,999 income range, which is the most common income bracket and makes up 27.6% of all families.
| Income Bracket | # Families | % Families |
| Less than $10,000 | 22 | 7.4% |
| $10,000 to $14,999 | 13 | 4.4% |
| $15,000 to $24,999 | 7 | 2.4% |
| $25,000 to $34,999 | 19 | 6.4% |
| $35,000 to $49,999 | 82 | 27.6% |
| $50,000 to $74,999 | 64 | 21.5% |
| $75,000 to $99,999 | 31 | 10.4% |
| $100,000 to $149,999 | 48 | 16.2% |
| $150,000 to $199,999 | 11 | 3.7% |
| $200,000+ | 0 | 0.0% |
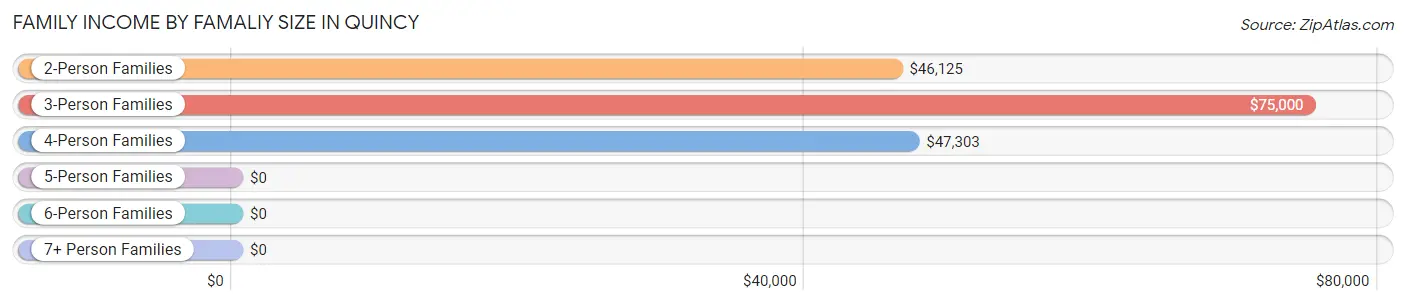
Family Income by Famaliy Size in Quincy
3-person families (56 | 18.9%) account for the highest median family income in Quincy with $75,000 per family, while 3-person families (56 | 18.9%) have the highest median income of $25,000 per family member.
| Income Bracket | # Families | Median Income |
| 2-Person Families | 167 (56.2%) | $46,125 |
| 3-Person Families | 56 (18.9%) | $75,000 |
| 4-Person Families | 43 (14.5%) | $47,303 |
| 5-Person Families | 25 (8.4%) | $0 |
| 6-Person Families | 5 (1.7%) | $0 |
| 7+ Person Families | 1 (0.3%) | $0 |
| Total | 297 (100.0%) | $52,292 |
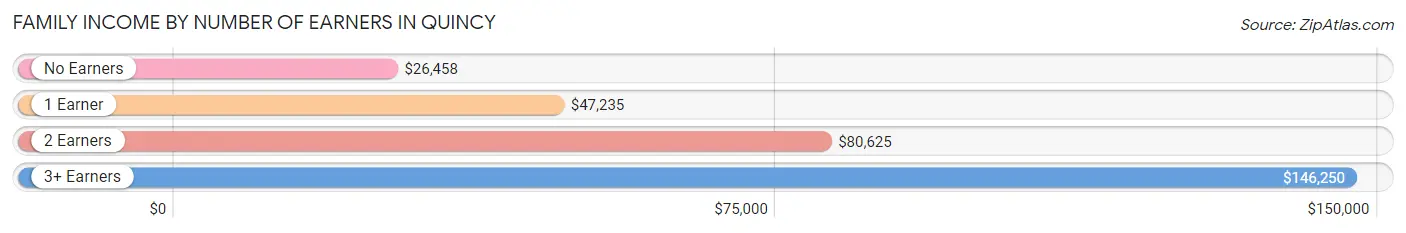
Family Income by Number of Earners in Quincy
The median family income in Quincy is $52,292, with families comprising 3+ earners (20) having the highest median family income of $146,250, while families with no earners (69) have the lowest median family income of $26,458, accounting for 6.7% and 23.2% of families, respectively.
| Number of Earners | # Families | Median Income |
| No Earners | 69 (23.2%) | $26,458 |
| 1 Earner | 121 (40.7%) | $47,235 |
| 2 Earners | 87 (29.3%) | $80,625 |
| 3+ Earners | 20 (6.7%) | $146,250 |
| Total | 297 (100.0%) | $52,292 |
Household Income in Quincy
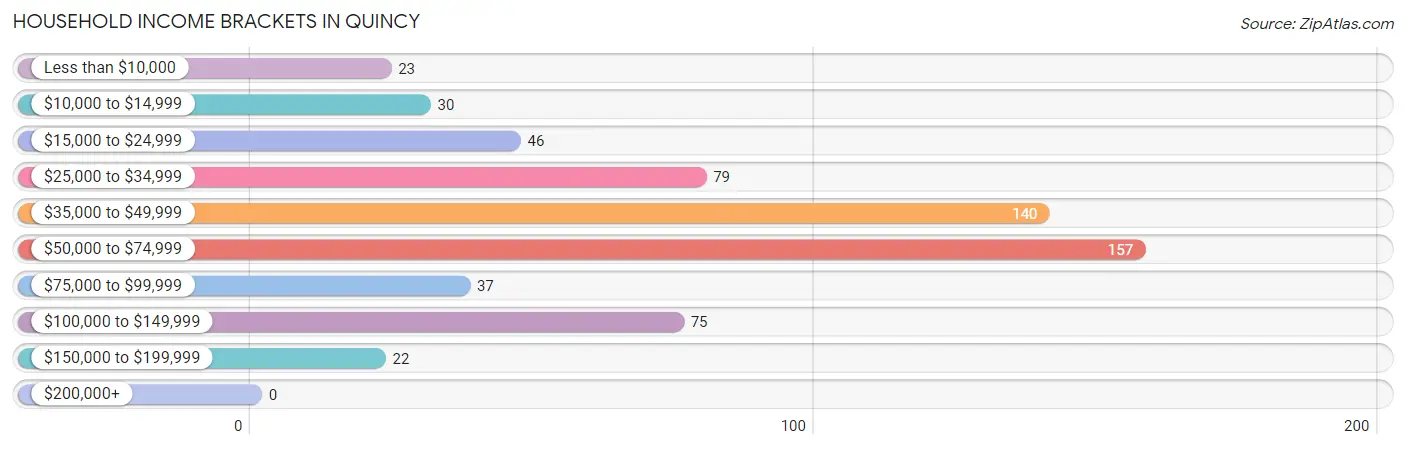
Household Income Brackets in Quincy
With 157 households falling in the category, the $50,000 to $74,999 income range is the most frequent in Quincy, accounting for 25.8% of all households.
| Income Bracket | # Households | % Households |
| Less than $10,000 | 23 | 3.8% |
| $10,000 to $14,999 | 30 | 4.9% |
| $15,000 to $24,999 | 46 | 7.6% |
| $25,000 to $34,999 | 79 | 13.0% |
| $35,000 to $49,999 | 140 | 23.0% |
| $50,000 to $74,999 | 157 | 25.8% |
| $75,000 to $99,999 | 37 | 6.1% |
| $100,000 to $149,999 | 75 | 12.3% |
| $150,000 to $199,999 | 22 | 3.6% |
| $200,000+ | 0 | 0.0% |
Household Income by Householder Age in Quincy
The median household income in Quincy is $47,275, with the highest median household income of $59,028 found in the 45 to 64 years age bracket for the primary householder. A total of 207 households (34.0%) fall into this category. Meanwhile, the 15 to 24 years age bracket for the primary householder has the lowest median household income of $33,750, with 54 households (8.9%) in this group.
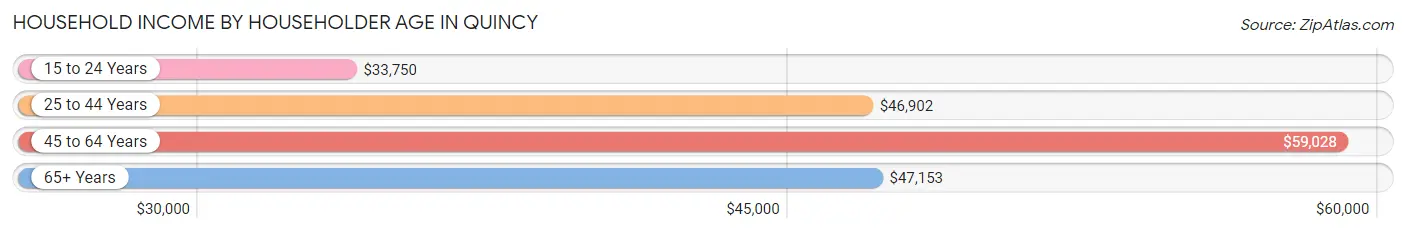
| Income Bracket | # Households | Median Income |
| 15 to 24 Years | 54 (8.9%) | $33,750 |
| 25 to 44 Years | 153 (25.1%) | $46,902 |
| 45 to 64 Years | 207 (34.0%) | $59,028 |
| 65+ Years | 195 (32.0%) | $47,153 |
| Total | 609 (100.0%) | $47,275 |
Poverty in Quincy
Income Below Poverty by Sex and Age in Quincy
With 11.5% poverty level for males and 17.5% for females among the residents of Quincy, under 5 year old males and 18 to 24 year old females are the most vulnerable to poverty, with 24 males (43.6%) and 31 females (59.6%) in their respective age groups living below the poverty level.
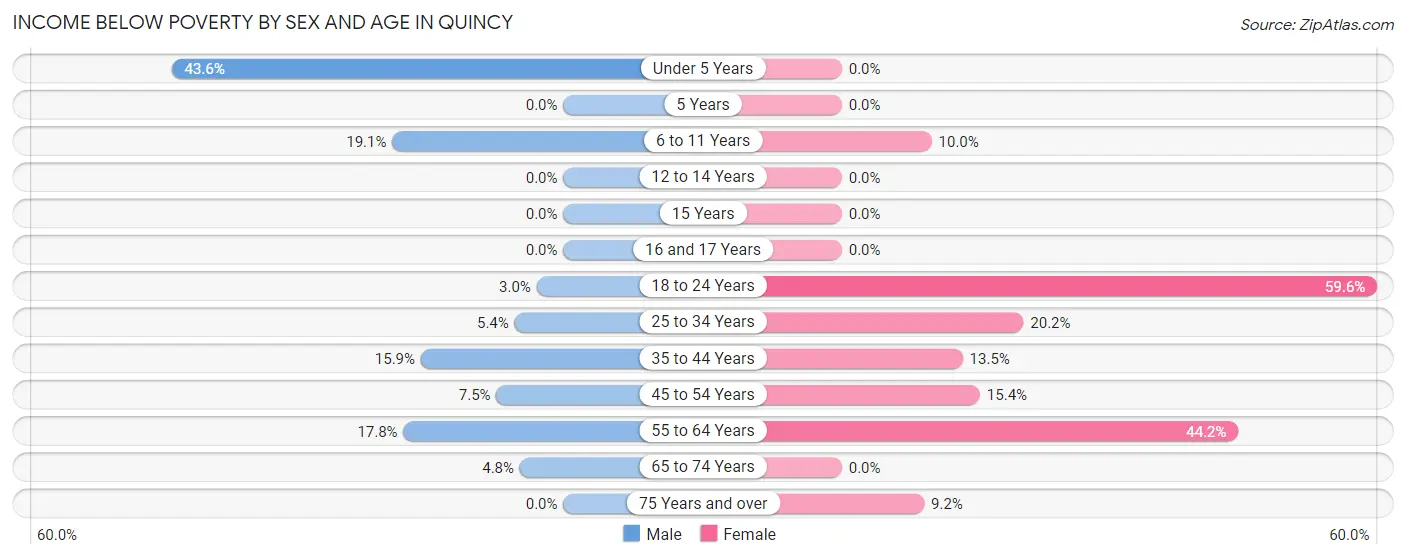
| Age Bracket | Male | Female |
| Under 5 Years | 24 (43.6%) | 0 (0.0%) |
| 5 Years | 0 (0.0%) | 0 (0.0%) |
| 6 to 11 Years | 8 (19.1%) | 5 (10.0%) |
| 12 to 14 Years | 0 (0.0%) | 0 (0.0%) |
| 15 Years | 0 (0.0%) | 0 (0.0%) |
| 16 and 17 Years | 0 (0.0%) | 0 (0.0%) |
| 18 to 24 Years | 3 (3.0%) | 31 (59.6%) |
| 25 to 34 Years | 5 (5.4%) | 18 (20.2%) |
| 35 to 44 Years | 10 (15.9%) | 7 (13.5%) |
| 45 to 54 Years | 7 (7.4%) | 12 (15.4%) |
| 55 to 64 Years | 13 (17.8%) | 34 (44.2%) |
| 65 to 74 Years | 3 (4.8%) | 0 (0.0%) |
| 75 Years and over | 0 (0.0%) | 10 (9.2%) |
| Total | 73 (11.5%) | 117 (17.5%) |
Income Above Poverty by Sex and Age in Quincy
According to the poverty statistics in Quincy, males aged 5 years and females aged under 5 years are the age groups that are most secure financially, with 100.0% of males and 100.0% of females in these age groups living above the poverty line.
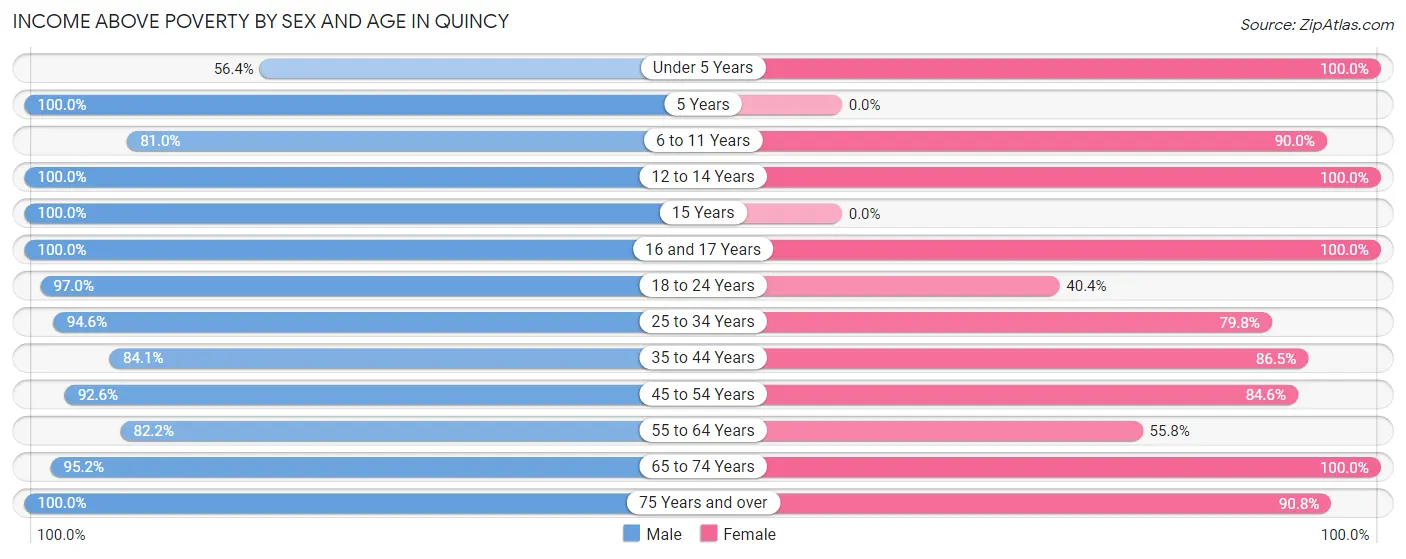
| Age Bracket | Male | Female |
| Under 5 Years | 31 (56.4%) | 47 (100.0%) |
| 5 Years | 14 (100.0%) | 0 (0.0%) |
| 6 to 11 Years | 34 (80.9%) | 45 (90.0%) |
| 12 to 14 Years | 6 (100.0%) | 15 (100.0%) |
| 15 Years | 7 (100.0%) | 0 (0.0%) |
| 16 and 17 Years | 15 (100.0%) | 18 (100.0%) |
| 18 to 24 Years | 98 (97.0%) | 21 (40.4%) |
| 25 to 34 Years | 87 (94.6%) | 71 (79.8%) |
| 35 to 44 Years | 53 (84.1%) | 45 (86.5%) |
| 45 to 54 Years | 87 (92.5%) | 66 (84.6%) |
| 55 to 64 Years | 60 (82.2%) | 43 (55.8%) |
| 65 to 74 Years | 59 (95.2%) | 80 (100.0%) |
| 75 Years and over | 12 (100.0%) | 99 (90.8%) |
| Total | 563 (88.5%) | 550 (82.5%) |
Income Below Poverty Among Married-Couple Families in Quincy
The poverty statistics for married-couple families in Quincy show that 3.0% or 6 of the total 198 families live below the poverty line. Families with 3 or 4 children have the highest poverty rate of 28.6%, comprising of 4 families. On the other hand, families with 1 or 2 children have the lowest poverty rate of 0.0%, which includes 0 families.
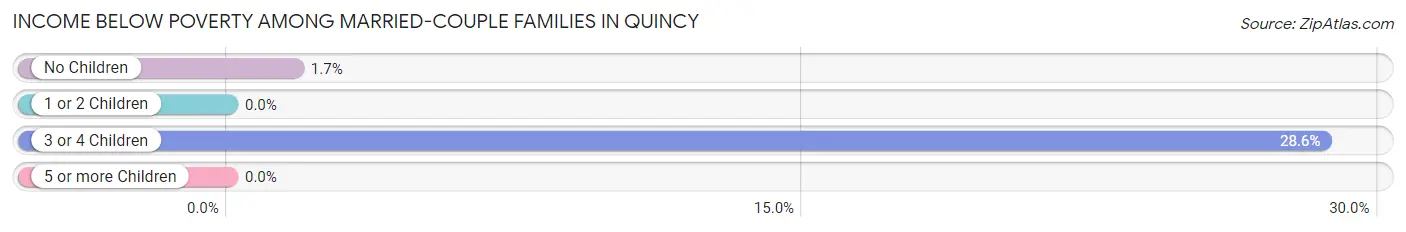
| Children | Above Poverty | Below Poverty |
| No Children | 114 (98.3%) | 2 (1.7%) |
| 1 or 2 Children | 67 (100.0%) | 0 (0.0%) |
| 3 or 4 Children | 10 (71.4%) | 4 (28.6%) |
| 5 or more Children | 1 (100.0%) | 0 (0.0%) |
| Total | 192 (97.0%) | 6 (3.0%) |
Income Below Poverty Among Single-Parent Households in Quincy
According to the poverty data in Quincy, 16.7% or 7 single-father households and 45.6% or 26 single-mother households are living below the poverty line. Among single-father households, those with no children have the highest poverty rate, with 3 households (100.0%) experiencing poverty. Likewise, among single-mother households, those with 1 or 2 children have the highest poverty rate, with 17 households (54.8%) falling below the poverty line.
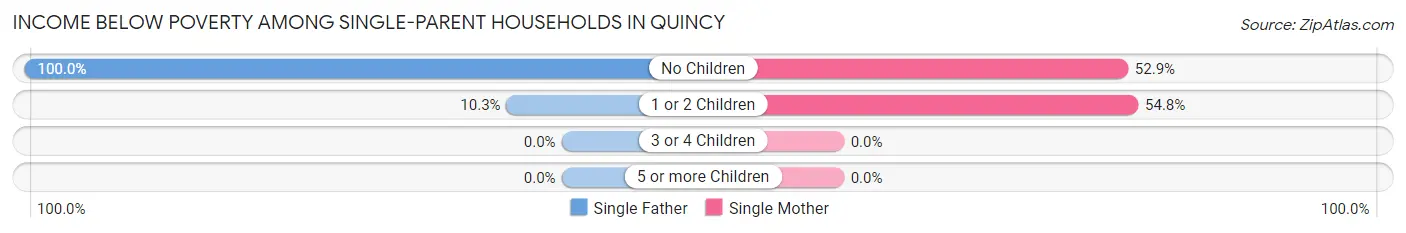
| Children | Single Father | Single Mother |
| No Children | 3 (100.0%) | 9 (52.9%) |
| 1 or 2 Children | 4 (10.3%) | 17 (54.8%) |
| 3 or 4 Children | 0 (0.0%) | 0 (0.0%) |
| 5 or more Children | 0 (0.0%) | 0 (0.0%) |
| Total | 7 (16.7%) | 26 (45.6%) |
Income Below Poverty Among Married-Couple vs Single-Parent Households in Quincy
The poverty data for Quincy shows that 6 of the married-couple family households (3.0%) and 33 of the single-parent households (33.3%) are living below the poverty level. Within the married-couple family households, those with 3 or 4 children have the highest poverty rate, with 4 households (28.6%) falling below the poverty line. Among the single-parent households, those with no children have the highest poverty rate, with 12 household (60.0%) living below poverty.
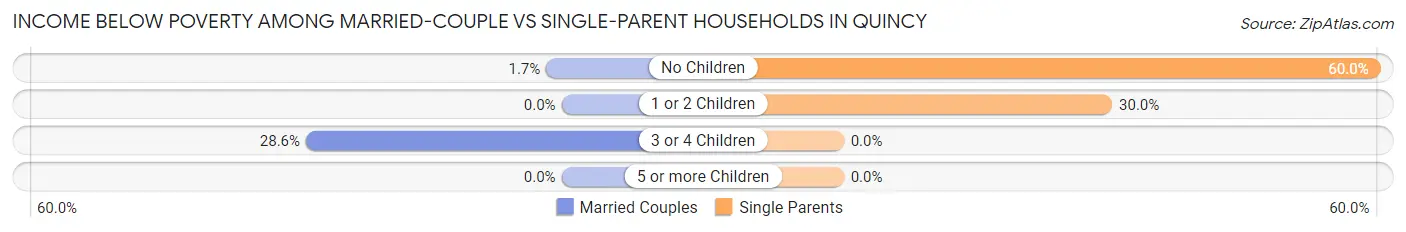
| Children | Married-Couple Families | Single-Parent Households |
| No Children | 2 (1.7%) | 12 (60.0%) |
| 1 or 2 Children | 0 (0.0%) | 21 (30.0%) |
| 3 or 4 Children | 4 (28.6%) | 0 (0.0%) |
| 5 or more Children | 0 (0.0%) | 0 (0.0%) |
| Total | 6 (3.0%) | 33 (33.3%) |
Race in Quincy
The most populous races in Quincy are White / Caucasian (1,273 | 97.7%), Native / Alaskan (11 | 0.8%), and Two or more Races (11 | 0.8%).
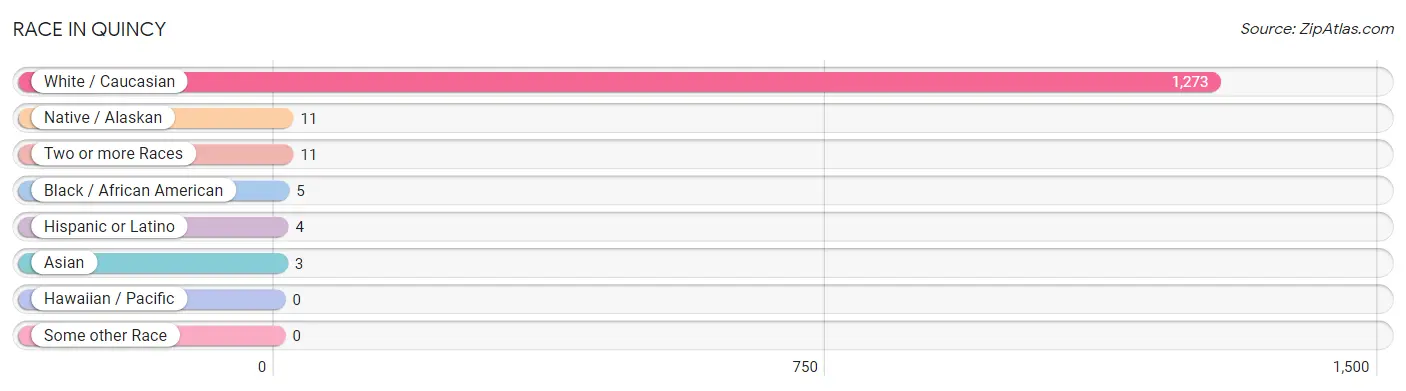
| Race | # Population | % Population |
| Asian | 3 | 0.2% |
| Black / African American | 5 | 0.4% |
| Hawaiian / Pacific | 0 | 0.0% |
| Hispanic or Latino | 4 | 0.3% |
| Native / Alaskan | 11 | 0.8% |
| White / Caucasian | 1,273 | 97.7% |
| Two or more Races | 11 | 0.8% |
| Some other Race | 0 | 0.0% |
| Total | 1,303 | 100.0% |
Ancestry in Quincy
The most populous ancestries reported in Quincy are German (171 | 13.1%), Irish (165 | 12.7%), English (155 | 11.9%), Dutch (77 | 5.9%), and American (71 | 5.4%), together accounting for 49.0% of all Quincy residents.
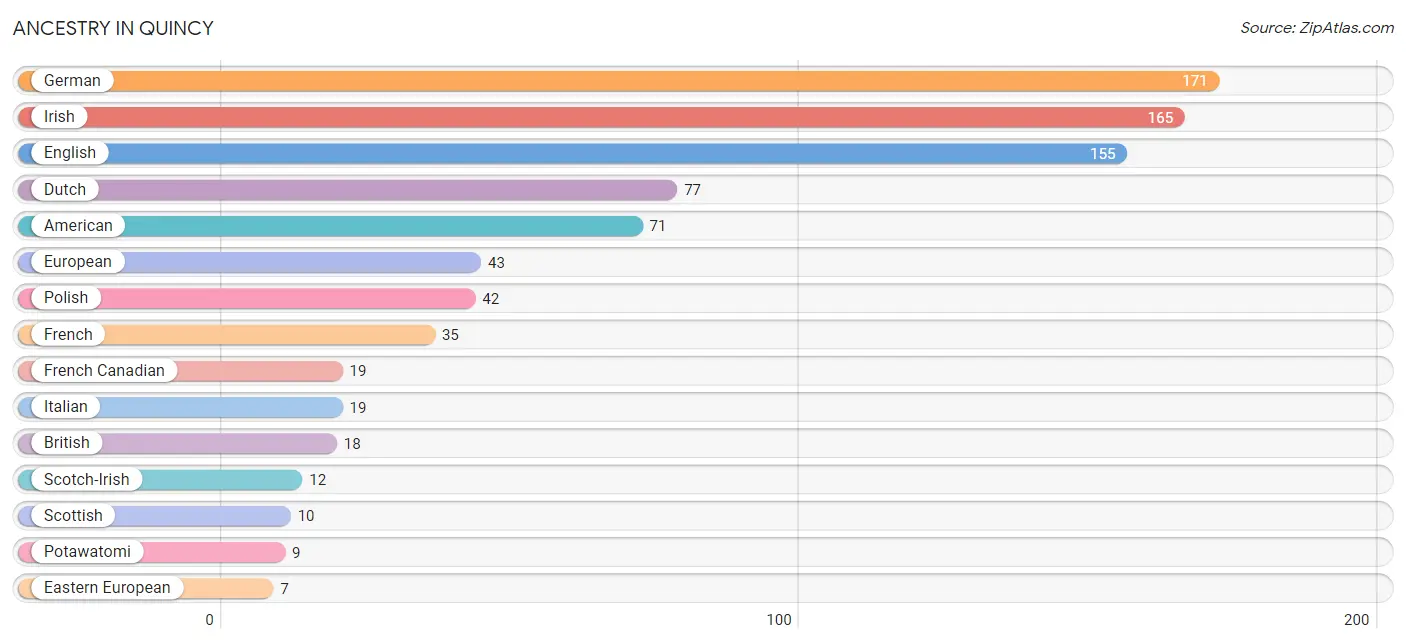
| Ancestry | # Population | % Population |
| American | 71 | 5.4% |
| British | 18 | 1.4% |
| Chippewa | 2 | 0.2% |
| Dutch | 77 | 5.9% |
| Eastern European | 7 | 0.5% |
| English | 155 | 11.9% |
| European | 43 | 3.3% |
| French | 35 | 2.7% |
| French Canadian | 19 | 1.5% |
| German | 171 | 13.1% |
| Irish | 165 | 12.7% |
| Italian | 19 | 1.5% |
| Jamaican | 5 | 0.4% |
| Korean | 3 | 0.2% |
| Northern European | 4 | 0.3% |
| Norwegian | 7 | 0.5% |
| Polish | 42 | 3.2% |
| Potawatomi | 9 | 0.7% |
| Puerto Rican | 4 | 0.3% |
| Scotch-Irish | 12 | 0.9% |
| Scottish | 10 | 0.8% |
| Sioux | 2 | 0.2% |
| Slovak | 2 | 0.2% |
| Swedish | 2 | 0.2% | View All 24 Rows |
Immigrants in Quincy
The most numerous immigrant groups reported in Quincy came from Europe (4 | 0.3%), Germany (4 | 0.3%), Western Europe (4 | 0.3%), Asia (3 | 0.2%), and Philippines (3 | 0.2%), together accounting for 1.4% of all Quincy residents.
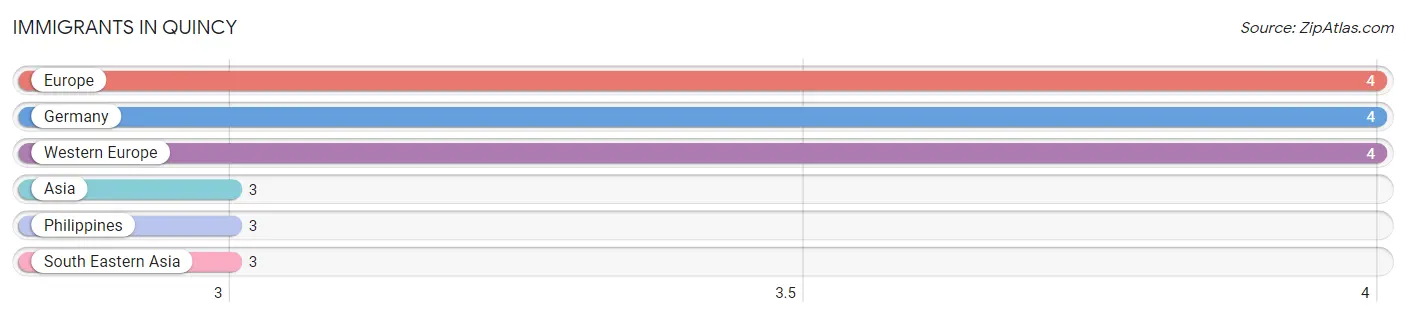
| Immigration Origin | # Population | % Population |
| Asia | 3 | 0.2% |
| Europe | 4 | 0.3% |
| Germany | 4 | 0.3% |
| Philippines | 3 | 0.2% |
| South Eastern Asia | 3 | 0.2% |
| Western Europe | 4 | 0.3% | View All 6 Rows |
Sex and Age in Quincy
Sex and Age in Quincy
The most populous age groups in Quincy are 20 to 24 Years (78 | 12.3%) for men and 75 to 79 Years (83 | 12.4%) for women.
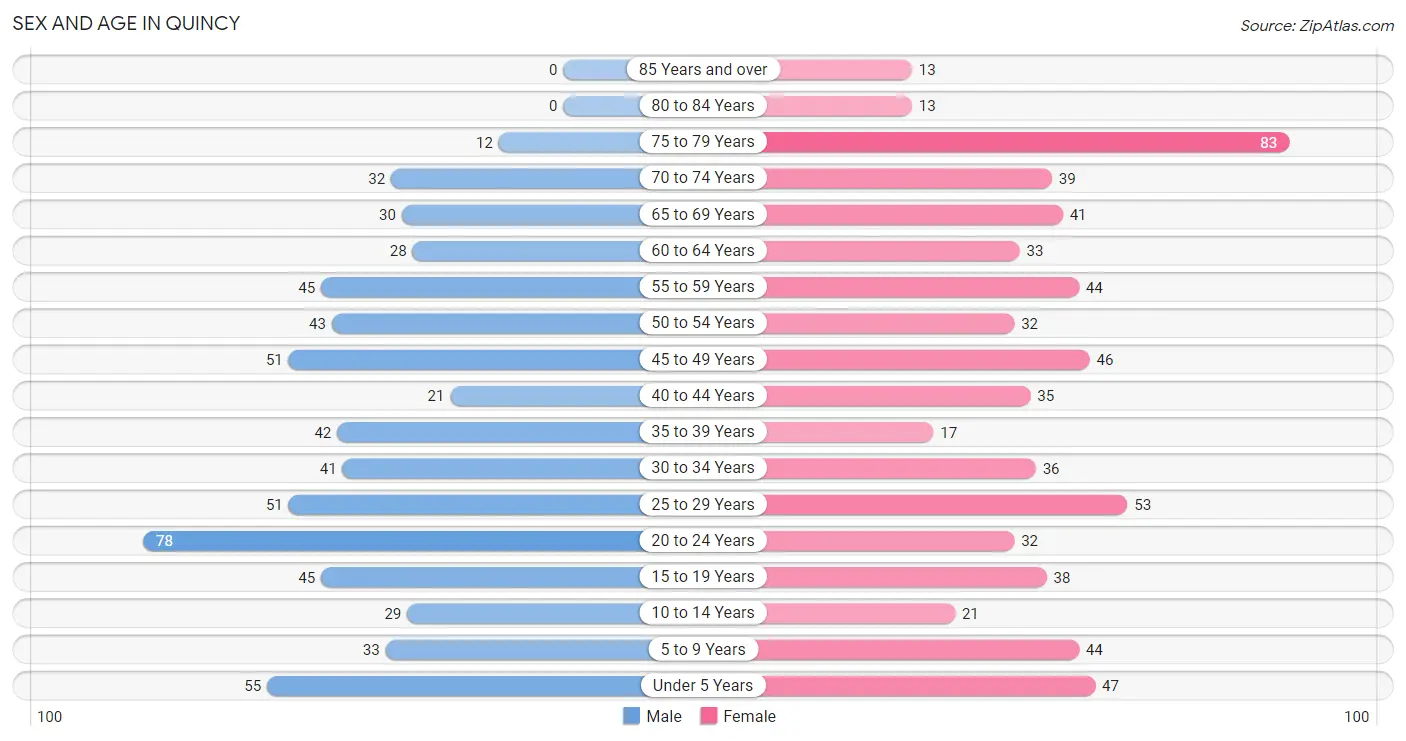
| Age Bracket | Male | Female |
| Under 5 Years | 55 (8.6%) | 47 (7.0%) |
| 5 to 9 Years | 33 (5.2%) | 44 (6.6%) |
| 10 to 14 Years | 29 (4.6%) | 21 (3.2%) |
| 15 to 19 Years | 45 (7.1%) | 38 (5.7%) |
| 20 to 24 Years | 78 (12.3%) | 32 (4.8%) |
| 25 to 29 Years | 51 (8.0%) | 53 (8.0%) |
| 30 to 34 Years | 41 (6.5%) | 36 (5.4%) |
| 35 to 39 Years | 42 (6.6%) | 17 (2.5%) |
| 40 to 44 Years | 21 (3.3%) | 35 (5.2%) |
| 45 to 49 Years | 51 (8.0%) | 46 (6.9%) |
| 50 to 54 Years | 43 (6.8%) | 32 (4.8%) |
| 55 to 59 Years | 45 (7.1%) | 44 (6.6%) |
| 60 to 64 Years | 28 (4.4%) | 33 (5.0%) |
| 65 to 69 Years | 30 (4.7%) | 41 (6.1%) |
| 70 to 74 Years | 32 (5.0%) | 39 (5.9%) |
| 75 to 79 Years | 12 (1.9%) | 83 (12.4%) |
| 80 to 84 Years | 0 (0.0%) | 13 (1.9%) |
| 85 Years and over | 0 (0.0%) | 13 (1.9%) |
| Total | 636 (100.0%) | 667 (100.0%) |
Families and Households in Quincy
Median Family Size in Quincy
The median family size in Quincy is 2.94 persons per family, with married-couple families (198 | 66.7%) accounting for the largest median family size of 3.14 persons per family. On the other hand, single male/father families (42 | 14.1%) represent the smallest median family size with 2.33 persons per family.
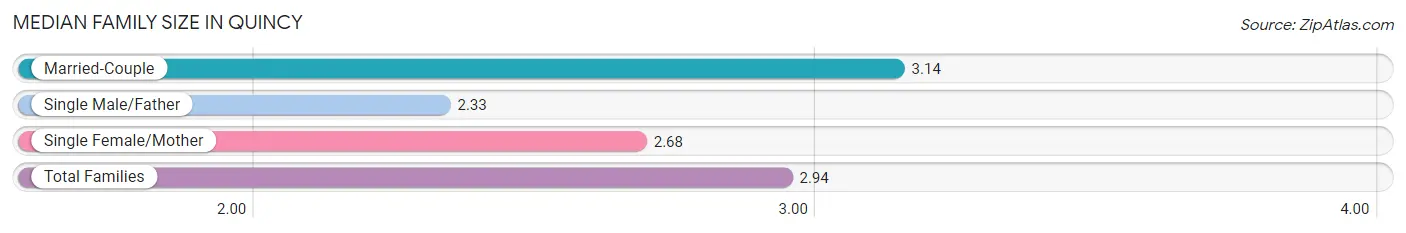
| Family Type | # Families | Family Size |
| Married-Couple | 198 (66.7%) | 3.14 |
| Single Male/Father | 42 (14.1%) | 2.33 |
| Single Female/Mother | 57 (19.2%) | 2.68 |
| Total Families | 297 (100.0%) | 2.94 |
Median Household Size in Quincy
The median household size in Quincy is 2.14 persons per household, with married-couple households (198 | 32.5%) accounting for the largest median household size of 3.14 persons per household. non-family households (312 | 51.2%) represent the smallest median household size with 1.22 persons per household.
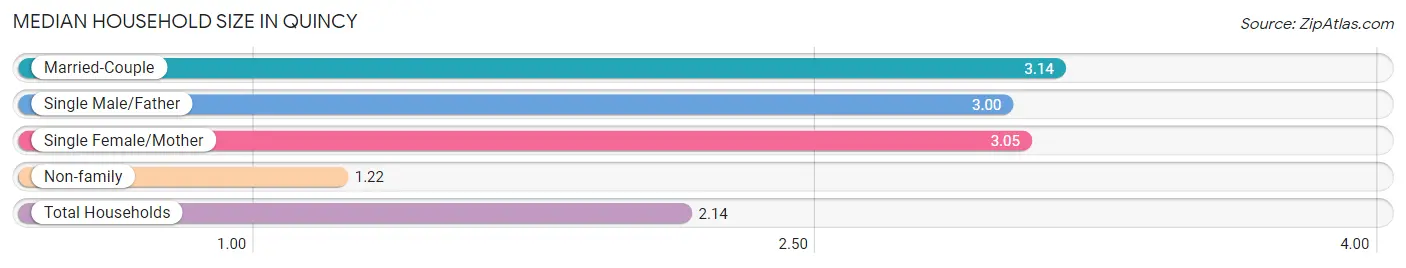
| Household Type | # Households | Household Size |
| Married-Couple | 198 (32.5%) | 3.14 |
| Single Male/Father | 42 (6.9%) | 3.00 |
| Single Female/Mother | 57 (9.4%) | 3.05 |
| Non-family | 312 (51.2%) | 1.22 |
| Total Households | 609 (100.0%) | 2.14 |
Household Size by Marriage Status in Quincy
Out of a total of 609 households in Quincy, 297 (48.8%) are family households, while 312 (51.2%) are nonfamily households. The most numerous type of family households are 2-person households, comprising 133, and the most common type of nonfamily households are 1-person households, comprising 260.
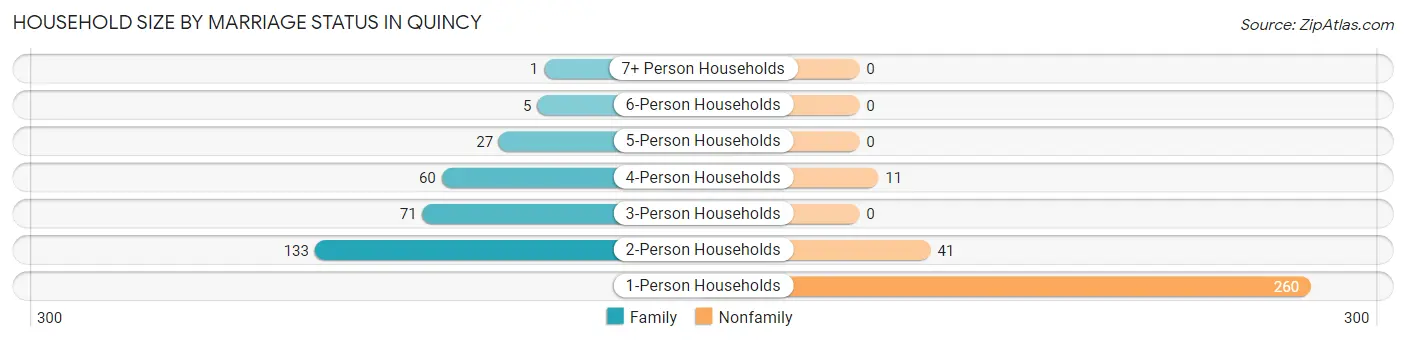
| Household Size | Family Households | Nonfamily Households |
| 1-Person Households | - | 260 (42.7%) |
| 2-Person Households | 133 (21.8%) | 41 (6.7%) |
| 3-Person Households | 71 (11.7%) | 0 (0.0%) |
| 4-Person Households | 60 (9.9%) | 11 (1.8%) |
| 5-Person Households | 27 (4.4%) | 0 (0.0%) |
| 6-Person Households | 5 (0.8%) | 0 (0.0%) |
| 7+ Person Households | 1 (0.2%) | 0 (0.0%) |
| Total | 297 (48.8%) | 312 (51.2%) |
Female Fertility in Quincy
Fertility by Age in Quincy
Average fertility rate in Quincy is 127.0 births per 1,000 women. Women in the age bracket of 20 to 34 years have the highest fertility rate with 248.0 births per 1,000 women. Women in the age bracket of 20 to 34 years acount for 90.9% of all women with births.
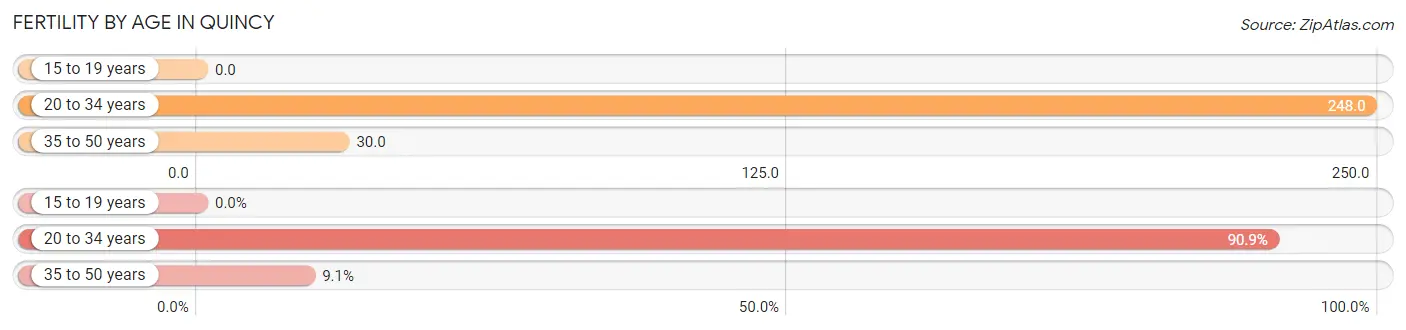
| Age Bracket | Women with Births | Births / 1,000 Women |
| 15 to 19 years | 0 (0.0%) | 0.0 |
| 20 to 34 years | 30 (90.9%) | 248.0 |
| 35 to 50 years | 3 (9.1%) | 30.0 |
| Total | 33 (100.0%) | 127.0 |
Fertility by Age by Marriage Status in Quincy
12.1% of women with births (33) in Quincy are married. The highest percentage of unmarried women with births falls into 35 to 50 years age bracket with 100.0% of them unmarried at the time of birth, while the lowest percentage of unmarried women with births belong to 20 to 34 years age bracket with 86.7% of them unmarried.
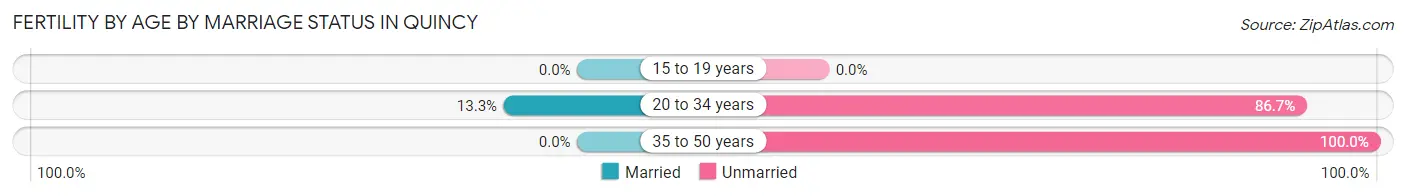
| Age Bracket | Married | Unmarried |
| 15 to 19 years | 0 (0.0%) | 0 (0.0%) |
| 20 to 34 years | 4 (13.3%) | 26 (86.7%) |
| 35 to 50 years | 0 (0.0%) | 3 (100.0%) |
| Total | 4 (12.1%) | 29 (87.9%) |
Fertility by Education in Quincy
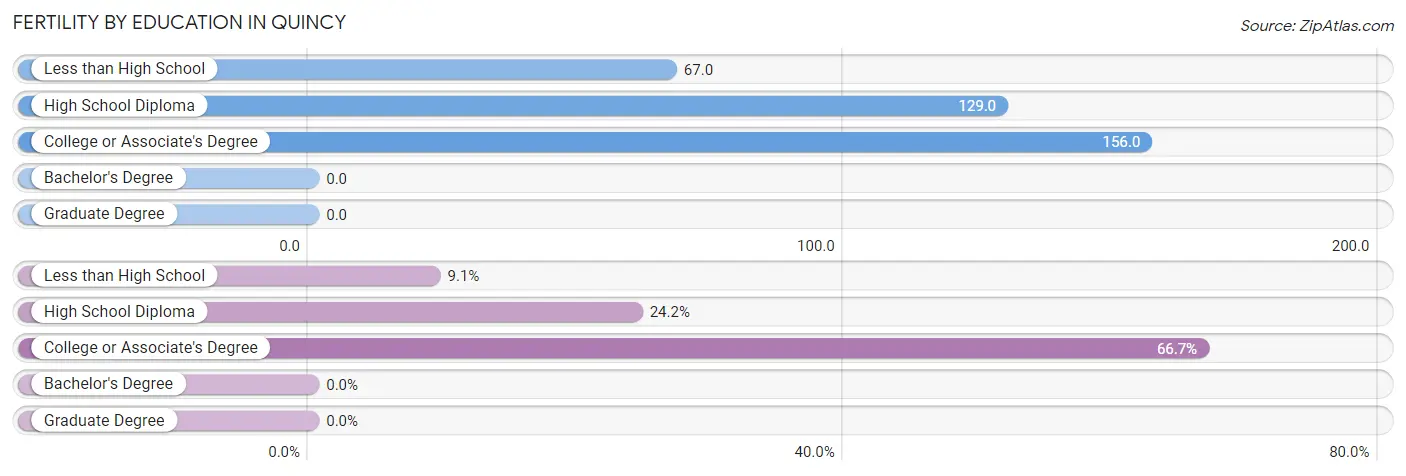
| Educational Attainment | Women with Births | Births / 1,000 Women |
| Less than High School | 3 (9.1%) | 67.0 |
| High School Diploma | 8 (24.2%) | 129.0 |
| College or Associate's Degree | 22 (66.7%) | 156.0 |
| Bachelor's Degree | 0 (0.0%) | 0.0 |
| Graduate Degree | 0 (0.0%) | 0.0 |
| Total | 33 (100.0%) | 127.0 |
Fertility by Education by Marriage Status in Quincy
87.9% of women with births in Quincy are unmarried. Women with the educational attainment of high school diploma are most likely to be married with 50.0% of them married at childbirth, while women with the educational attainment of less than high school are least likely to be married with 100.0% of them unmarried at childbirth.
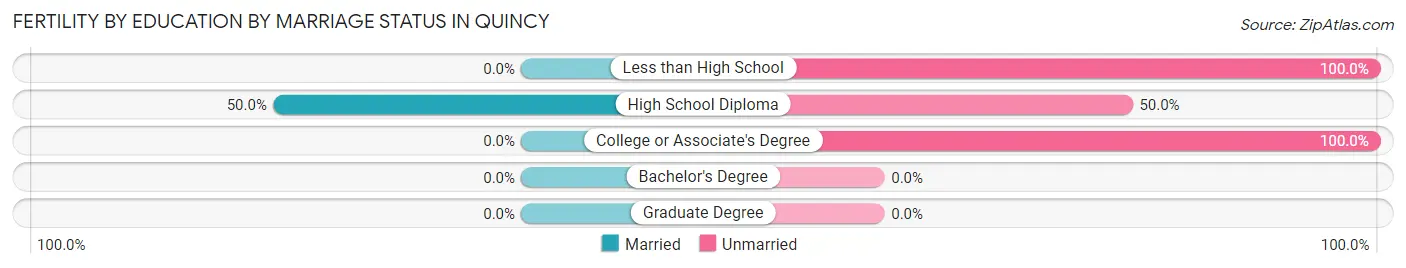
| Educational Attainment | Married | Unmarried |
| Less than High School | 0 (0.0%) | 3 (100.0%) |
| High School Diploma | 4 (50.0%) | 4 (50.0%) |
| College or Associate's Degree | 0 (0.0%) | 22 (100.0%) |
| Bachelor's Degree | 0 (0.0%) | 0 (0.0%) |
| Graduate Degree | 0 (0.0%) | 0 (0.0%) |
| Total | 4 (12.1%) | 29 (87.9%) |
Employment Characteristics in Quincy
Employment by Class of Employer in Quincy
Among the 600 employed individuals in Quincy, private company employees (411 | 68.5%), local government employees (85 | 14.2%), and not-for-profit organizations (40 | 6.7%) make up the most common classes of employment.
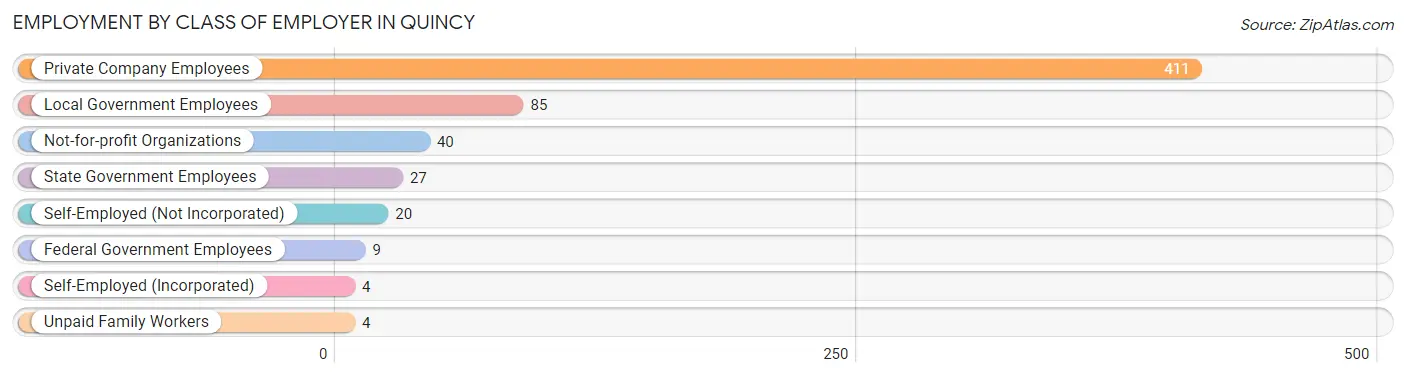
| Employer Class | # Employees | % Employees |
| Private Company Employees | 411 | 68.5% |
| Self-Employed (Incorporated) | 4 | 0.7% |
| Self-Employed (Not Incorporated) | 20 | 3.3% |
| Not-for-profit Organizations | 40 | 6.7% |
| Local Government Employees | 85 | 14.2% |
| State Government Employees | 27 | 4.5% |
| Federal Government Employees | 9 | 1.5% |
| Unpaid Family Workers | 4 | 0.7% |
| Total | 600 | 100.0% |
Employment Status by Age in Quincy
According to the labor force statistics for Quincy, out of the total population over 16 years of age (1,067), 61.2% or 653 individuals are in the labor force, with 7.5% or 49 of them unemployed. The age group with the highest labor force participation rate is 35 to 44 years, with 87.0% or 100 individuals in the labor force. Within the labor force, the 16 to 19 years age range has the highest percentage of unemployed individuals, with 48.5% or 16 of them being unemployed.
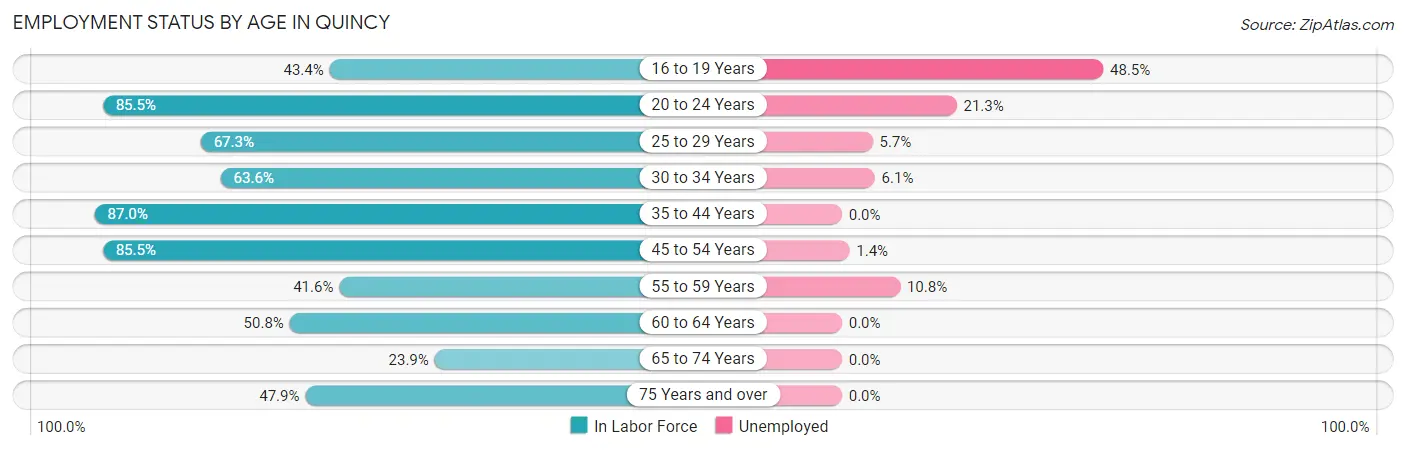
| Age Bracket | In Labor Force | Unemployed |
| 16 to 19 Years | 33 (43.4%) | 16 (48.5%) |
| 20 to 24 Years | 94 (85.5%) | 20 (21.3%) |
| 25 to 29 Years | 70 (67.3%) | 4 (5.7%) |
| 30 to 34 Years | 49 (63.6%) | 3 (6.1%) |
| 35 to 44 Years | 100 (87.0%) | 0 (0.0%) |
| 45 to 54 Years | 147 (85.5%) | 2 (1.4%) |
| 55 to 59 Years | 37 (41.6%) | 4 (10.8%) |
| 60 to 64 Years | 31 (50.8%) | 0 (0.0%) |
| 65 to 74 Years | 34 (23.9%) | 0 (0.0%) |
| 75 Years and over | 58 (47.9%) | 0 (0.0%) |
| Total | 653 (61.2%) | 49 (7.5%) |
Employment Status by Educational Attainment in Quincy
According to labor force statistics for Quincy, 70.2% of individuals (434) out of the total population between 25 and 64 years of age (618) are in the labor force, with 3.0% or 13 of them being unemployed. The group with the highest labor force participation rate are those with the educational attainment of bachelor's degree or higher, with 88.2% or 45 individuals in the labor force. Within the labor force, individuals with bachelor's degree or higher education have the highest percentage of unemployment, with 4.4% or 2 of them being unemployed.
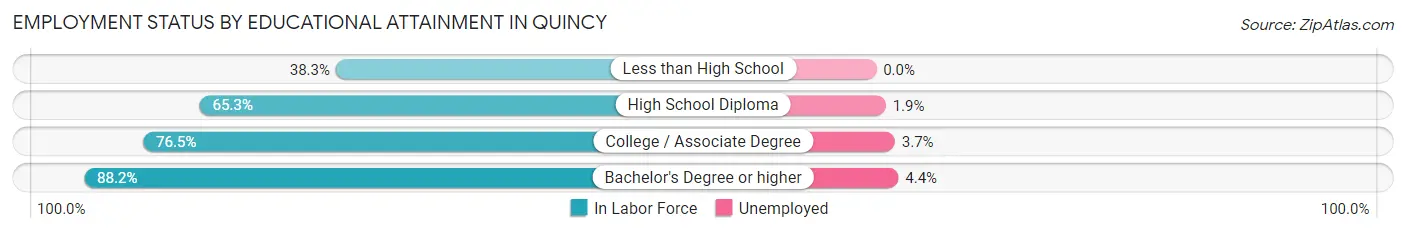
| Educational Attainment | In Labor Force | Unemployed |
| Less than High School | 18 (38.3%) | 0 (0.0%) |
| High School Diploma | 156 (65.3%) | 5 (1.9%) |
| College / Associate Degree | 215 (76.5%) | 10 (3.7%) |
| Bachelor's Degree or higher | 45 (88.2%) | 2 (4.4%) |
| Total | 434 (70.2%) | 19 (3.0%) |
Employment Occupations by Sex in Quincy
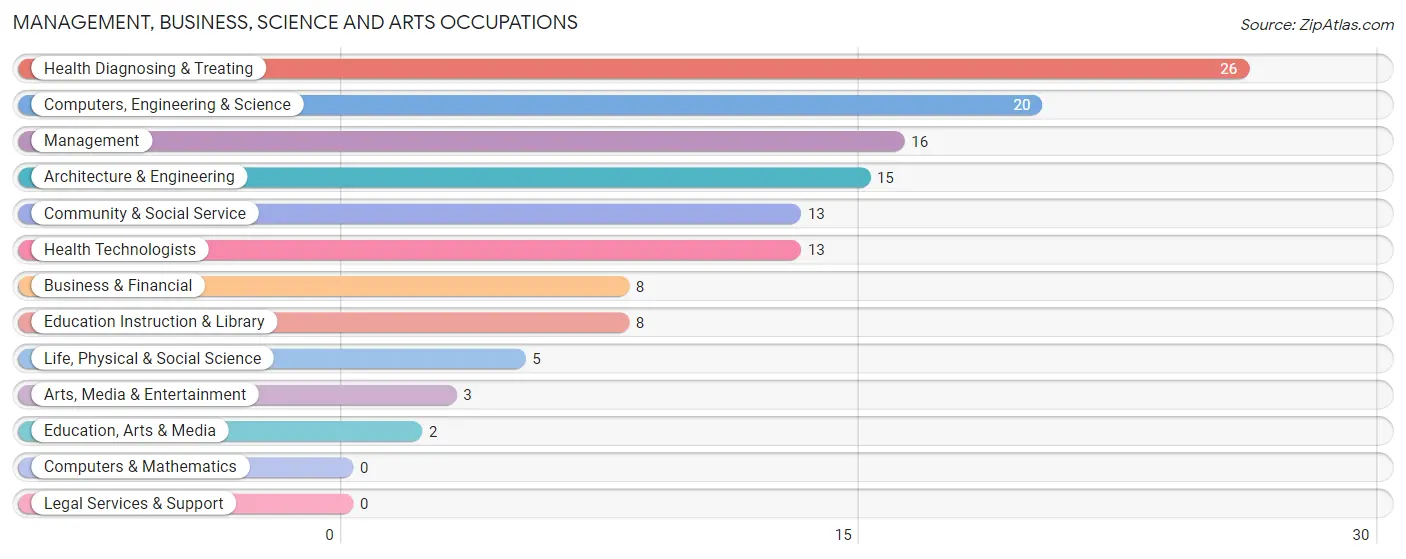
Management, Business, Science and Arts Occupations
The most common Management, Business, Science and Arts occupations in Quincy are Health Diagnosing & Treating (26 | 4.3%), Computers, Engineering & Science (20 | 3.3%), Management (16 | 2.6%), Architecture & Engineering (15 | 2.5%), and Community & Social Service (13 | 2.1%).
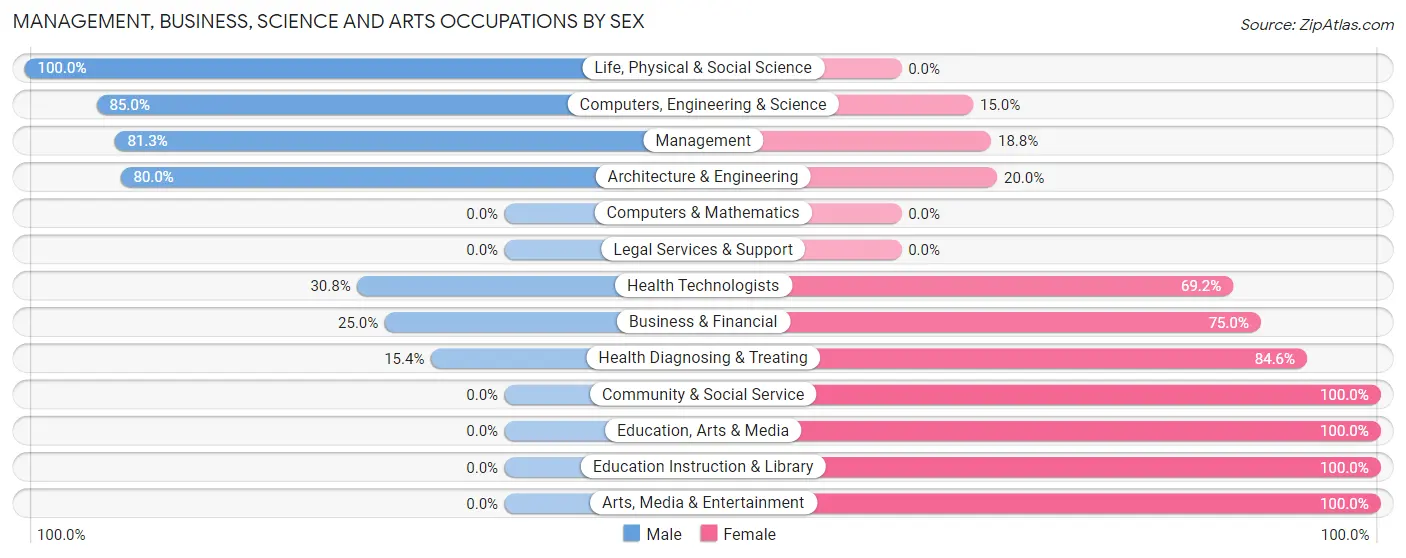
Management, Business, Science and Arts Occupations by Sex
Within the Management, Business, Science and Arts occupations in Quincy, the most male-oriented occupations are Life, Physical & Social Science (100.0%), Computers, Engineering & Science (85.0%), and Management (81.2%), while the most female-oriented occupations are Community & Social Service (100.0%), Education, Arts & Media (100.0%), and Education Instruction & Library (100.0%).
| Occupation | Male | Female |
| Management | 13 (81.2%) | 3 (18.8%) |
| Business & Financial | 2 (25.0%) | 6 (75.0%) |
| Computers, Engineering & Science | 17 (85.0%) | 3 (15.0%) |
| Computers & Mathematics | 0 (0.0%) | 0 (0.0%) |
| Architecture & Engineering | 12 (80.0%) | 3 (20.0%) |
| Life, Physical & Social Science | 5 (100.0%) | 0 (0.0%) |
| Community & Social Service | 0 (0.0%) | 13 (100.0%) |
| Education, Arts & Media | 0 (0.0%) | 2 (100.0%) |
| Legal Services & Support | 0 (0.0%) | 0 (0.0%) |
| Education Instruction & Library | 0 (0.0%) | 8 (100.0%) |
| Arts, Media & Entertainment | 0 (0.0%) | 3 (100.0%) |
| Health Diagnosing & Treating | 4 (15.4%) | 22 (84.6%) |
| Health Technologists | 4 (30.8%) | 9 (69.2%) |
| Total (Category) | 36 (43.4%) | 47 (56.6%) |
| Total (Overall) | 347 (57.5%) | 257 (42.5%) |
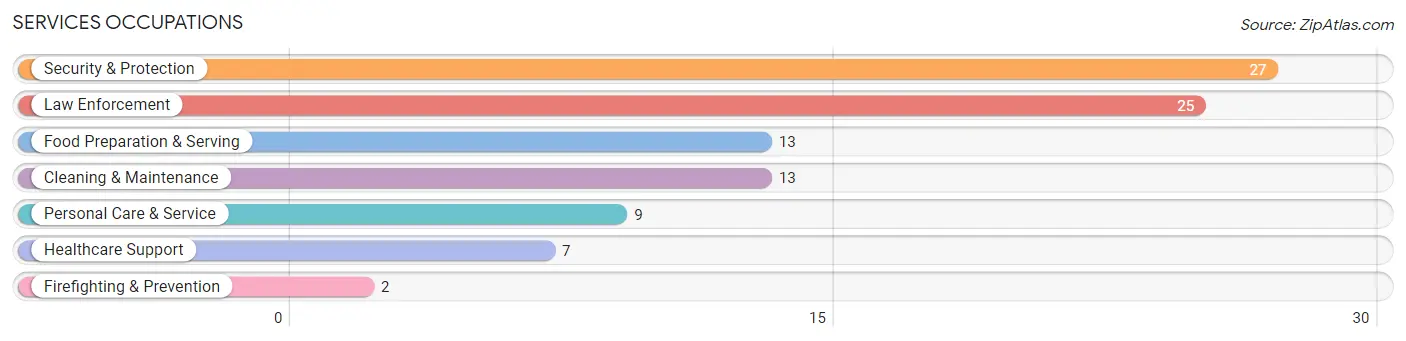
Services Occupations
The most common Services occupations in Quincy are Security & Protection (27 | 4.5%), Law Enforcement (25 | 4.1%), Food Preparation & Serving (13 | 2.1%), Cleaning & Maintenance (13 | 2.1%), and Personal Care & Service (9 | 1.5%).
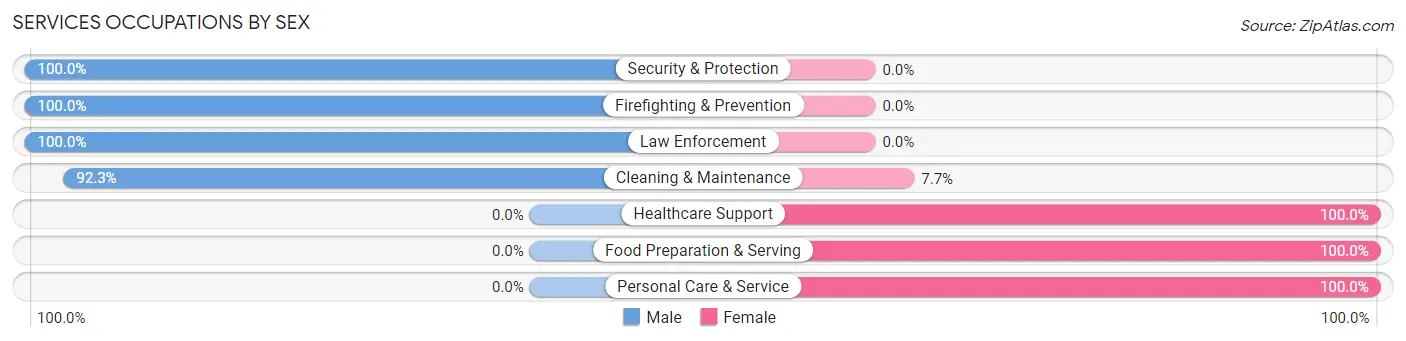
Services Occupations by Sex
Within the Services occupations in Quincy, the most male-oriented occupations are Security & Protection (100.0%), Firefighting & Prevention (100.0%), and Law Enforcement (100.0%), while the most female-oriented occupations are Healthcare Support (100.0%), Food Preparation & Serving (100.0%), and Personal Care & Service (100.0%).
| Occupation | Male | Female |
| Healthcare Support | 0 (0.0%) | 7 (100.0%) |
| Security & Protection | 27 (100.0%) | 0 (0.0%) |
| Firefighting & Prevention | 2 (100.0%) | 0 (0.0%) |
| Law Enforcement | 25 (100.0%) | 0 (0.0%) |
| Food Preparation & Serving | 0 (0.0%) | 13 (100.0%) |
| Cleaning & Maintenance | 12 (92.3%) | 1 (7.7%) |
| Personal Care & Service | 0 (0.0%) | 9 (100.0%) |
| Total (Category) | 39 (56.5%) | 30 (43.5%) |
| Total (Overall) | 347 (57.5%) | 257 (42.5%) |
Sales and Office Occupations
The most common Sales and Office occupations in Quincy are Sales & Related (43 | 7.1%), and Office & Administration (41 | 6.8%).
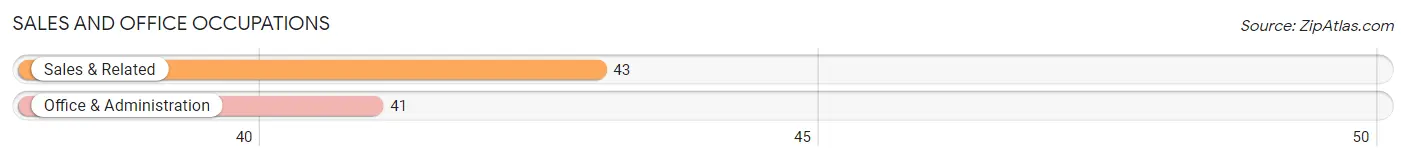
Sales and Office Occupations by Sex
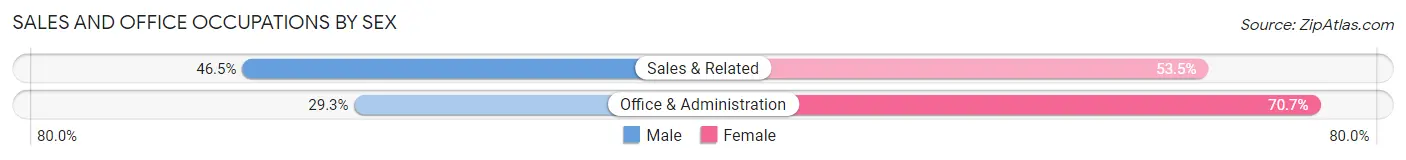
| Occupation | Male | Female |
| Sales & Related | 20 (46.5%) | 23 (53.5%) |
| Office & Administration | 12 (29.3%) | 29 (70.7%) |
| Total (Category) | 32 (38.1%) | 52 (61.9%) |
| Total (Overall) | 347 (57.5%) | 257 (42.5%) |
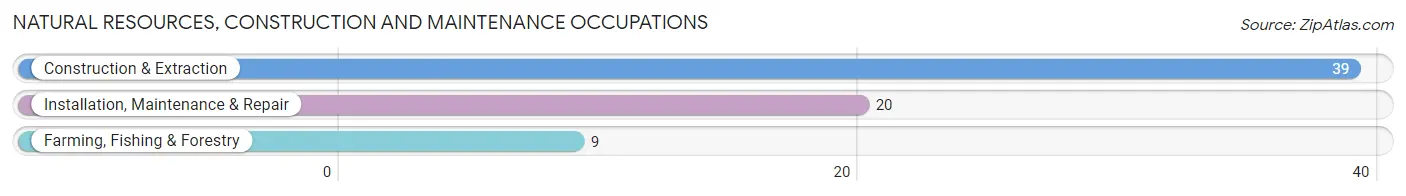
Natural Resources, Construction and Maintenance Occupations
The most common Natural Resources, Construction and Maintenance occupations in Quincy are Construction & Extraction (39 | 6.5%), Installation, Maintenance & Repair (20 | 3.3%), and Farming, Fishing & Forestry (9 | 1.5%).
Natural Resources, Construction and Maintenance Occupations by Sex
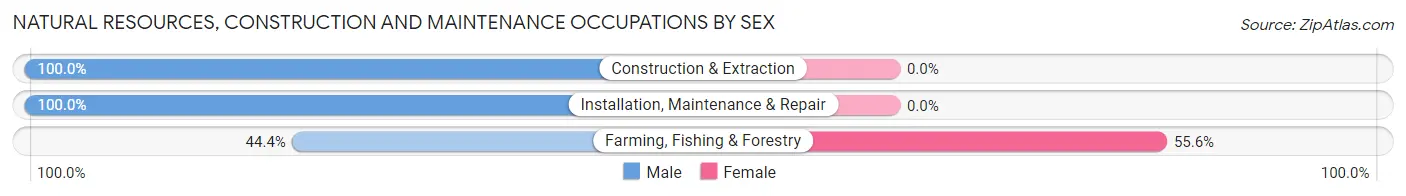
| Occupation | Male | Female |
| Farming, Fishing & Forestry | 4 (44.4%) | 5 (55.6%) |
| Construction & Extraction | 39 (100.0%) | 0 (0.0%) |
| Installation, Maintenance & Repair | 20 (100.0%) | 0 (0.0%) |
| Total (Category) | 63 (92.6%) | 5 (7.3%) |
| Total (Overall) | 347 (57.5%) | 257 (42.5%) |
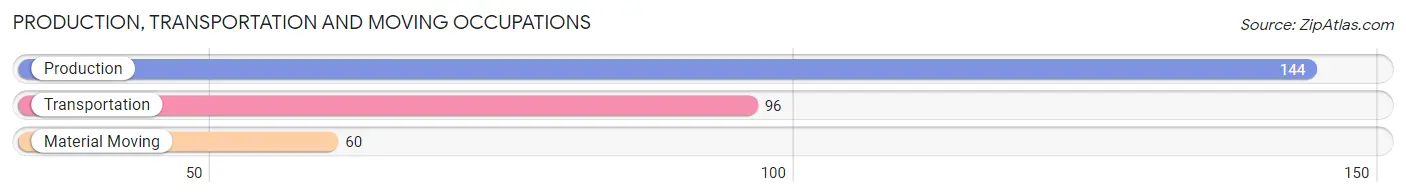
Production, Transportation and Moving Occupations
The most common Production, Transportation and Moving occupations in Quincy are Production (144 | 23.8%), Transportation (96 | 15.9%), and Material Moving (60 | 9.9%).
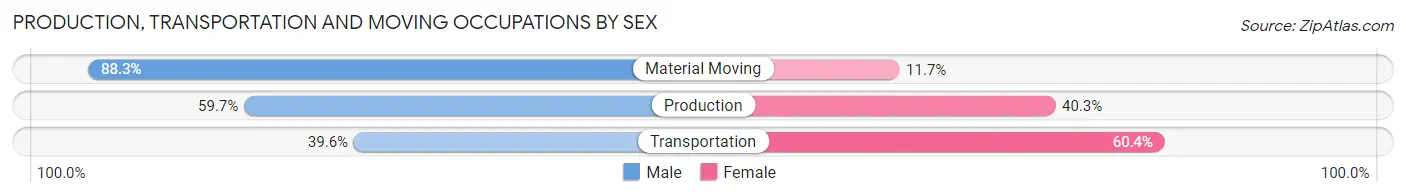
Production, Transportation and Moving Occupations by Sex
| Occupation | Male | Female |
| Production | 86 (59.7%) | 58 (40.3%) |
| Transportation | 38 (39.6%) | 58 (60.4%) |
| Material Moving | 53 (88.3%) | 7 (11.7%) |
| Total (Category) | 177 (59.0%) | 123 (41.0%) |
| Total (Overall) | 347 (57.5%) | 257 (42.5%) |
Employment Industries by Sex in Quincy
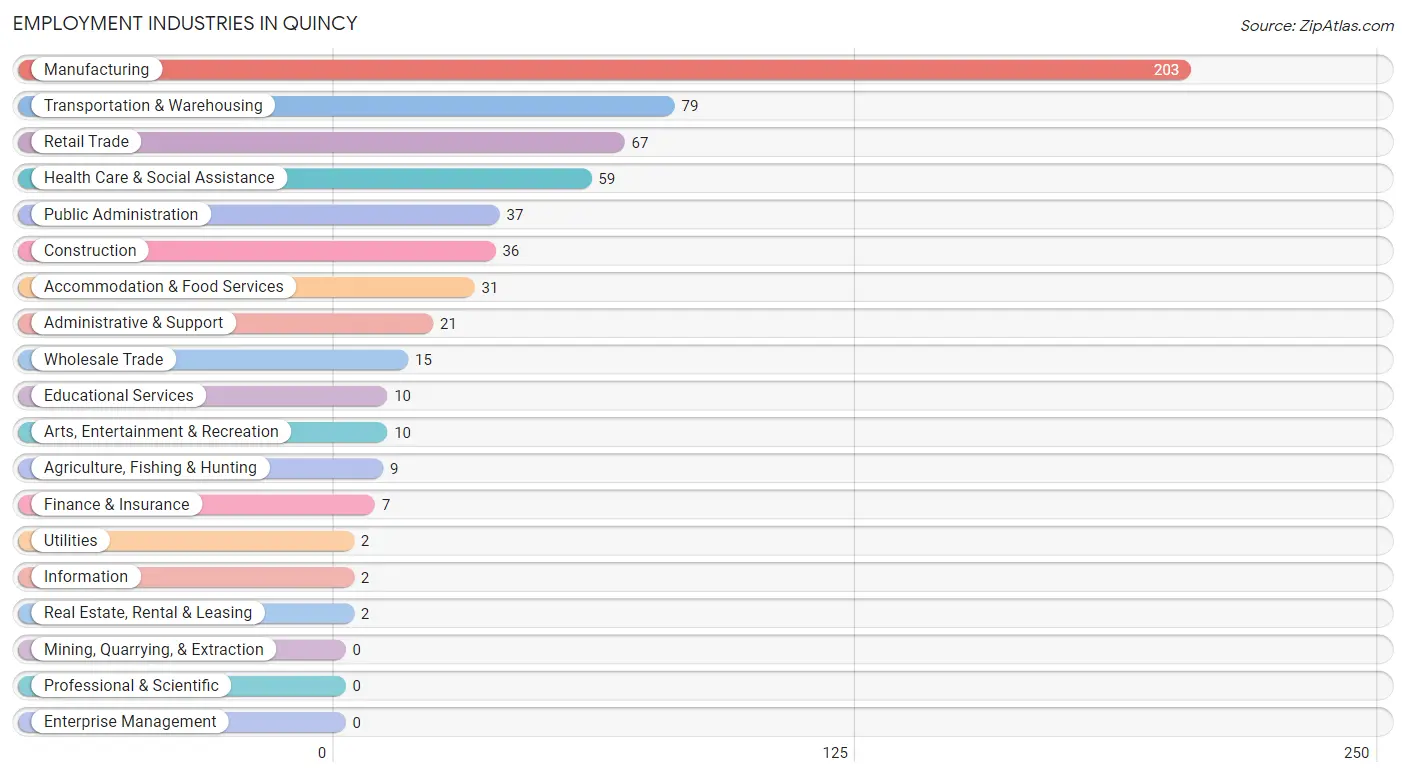
Employment Industries in Quincy
The major employment industries in Quincy include Manufacturing (203 | 33.6%), Transportation & Warehousing (79 | 13.1%), Retail Trade (67 | 11.1%), Health Care & Social Assistance (59 | 9.8%), and Public Administration (37 | 6.1%).
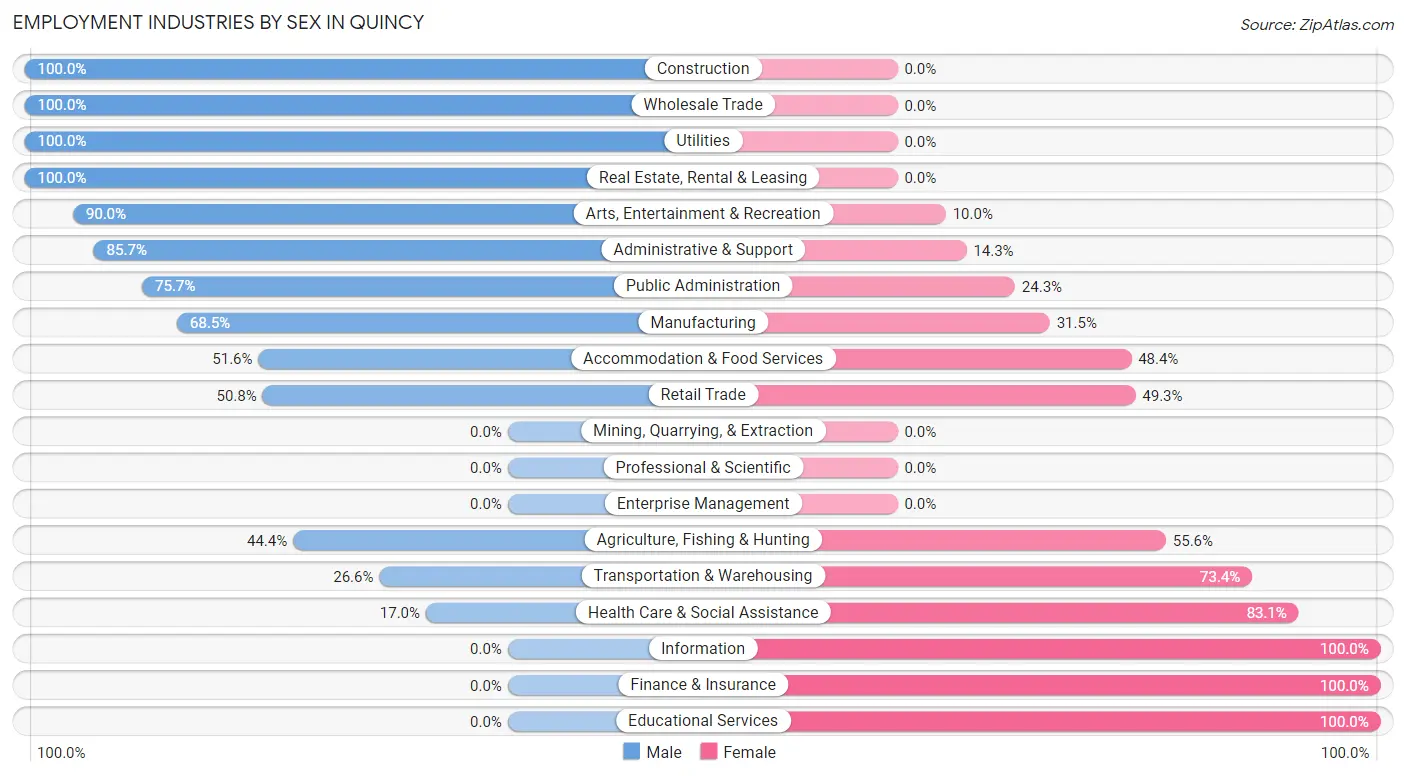
Employment Industries by Sex in Quincy
The Quincy industries that see more men than women are Construction (100.0%), Wholesale Trade (100.0%), and Utilities (100.0%), whereas the industries that tend to have a higher number of women are Information (100.0%), Finance & Insurance (100.0%), and Educational Services (100.0%).
| Industry | Male | Female |
| Agriculture, Fishing & Hunting | 4 (44.4%) | 5 (55.6%) |
| Mining, Quarrying, & Extraction | 0 (0.0%) | 0 (0.0%) |
| Construction | 36 (100.0%) | 0 (0.0%) |
| Manufacturing | 139 (68.5%) | 64 (31.5%) |
| Wholesale Trade | 15 (100.0%) | 0 (0.0%) |
| Retail Trade | 34 (50.7%) | 33 (49.2%) |
| Transportation & Warehousing | 21 (26.6%) | 58 (73.4%) |
| Utilities | 2 (100.0%) | 0 (0.0%) |
| Information | 0 (0.0%) | 2 (100.0%) |
| Finance & Insurance | 0 (0.0%) | 7 (100.0%) |
| Real Estate, Rental & Leasing | 2 (100.0%) | 0 (0.0%) |
| Professional & Scientific | 0 (0.0%) | 0 (0.0%) |
| Enterprise Management | 0 (0.0%) | 0 (0.0%) |
| Administrative & Support | 18 (85.7%) | 3 (14.3%) |
| Educational Services | 0 (0.0%) | 10 (100.0%) |
| Health Care & Social Assistance | 10 (17.0%) | 49 (83.1%) |
| Arts, Entertainment & Recreation | 9 (90.0%) | 1 (10.0%) |
| Accommodation & Food Services | 16 (51.6%) | 15 (48.4%) |
| Public Administration | 28 (75.7%) | 9 (24.3%) |
| Total | 347 (57.5%) | 257 (42.5%) |
Education in Quincy
School Enrollment in Quincy
The most common levels of schooling among the 180 students in Quincy are high school (49 | 27.2%), elementary school (48 | 26.7%), and middle school (38 | 21.1%).
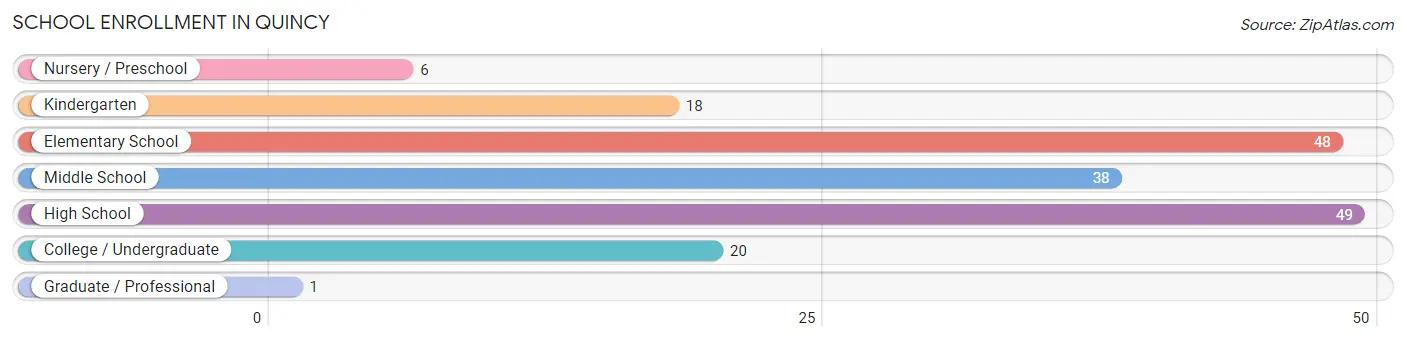
| School Level | # Students | % Students |
| Nursery / Preschool | 6 | 3.3% |
| Kindergarten | 18 | 10.0% |
| Elementary School | 48 | 26.7% |
| Middle School | 38 | 21.1% |
| High School | 49 | 27.2% |
| College / Undergraduate | 20 | 11.1% |
| Graduate / Professional | 1 | 0.6% |
| Total | 180 | 100.0% |
School Enrollment by Age by Funding Source in Quincy
Out of a total of 180 students who are enrolled in schools in Quincy, 11 (6.1%) attend a private institution, while the remaining 169 (93.9%) are enrolled in public schools. The age group of 3 to 4 year olds has the highest likelihood of being enrolled in private schools, with 3 (50.0% in the age bracket) enrolled. Conversely, the age group of 15 to 17 year olds has the lowest likelihood of being enrolled in a private school, with 40 (100.0% in the age bracket) attending a public institution.
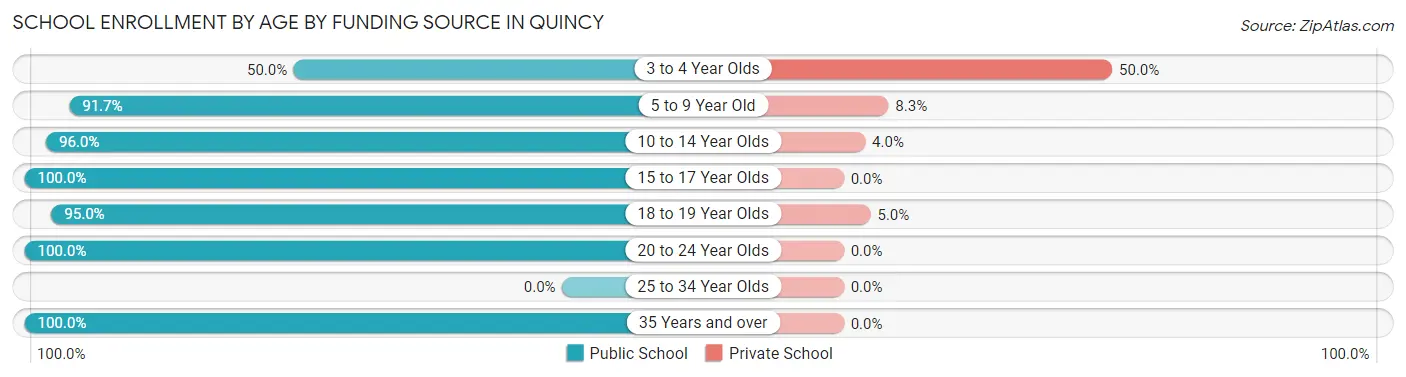
| Age Bracket | Public School | Private School |
| 3 to 4 Year Olds | 3 (50.0%) | 3 (50.0%) |
| 5 to 9 Year Old | 55 (91.7%) | 5 (8.3%) |
| 10 to 14 Year Olds | 48 (96.0%) | 2 (4.0%) |
| 15 to 17 Year Olds | 40 (100.0%) | 0 (0.0%) |
| 18 to 19 Year Olds | 19 (95.0%) | 1 (5.0%) |
| 20 to 24 Year Olds | 3 (100.0%) | 0 (0.0%) |
| 25 to 34 Year Olds | 0 (0.0%) | 0 (0.0%) |
| 35 Years and over | 1 (100.0%) | 0 (0.0%) |
| Total | 169 (93.9%) | 11 (6.1%) |
Educational Attainment by Field of Study in Quincy
Education (20 | 26.3%), business (14 | 18.4%), arts & humanities (13 | 17.1%), science & technology (10 | 13.2%), and computers & mathematics (4 | 5.3%) are the most common fields of study among 76 individuals in Quincy who have obtained a bachelor's degree or higher.
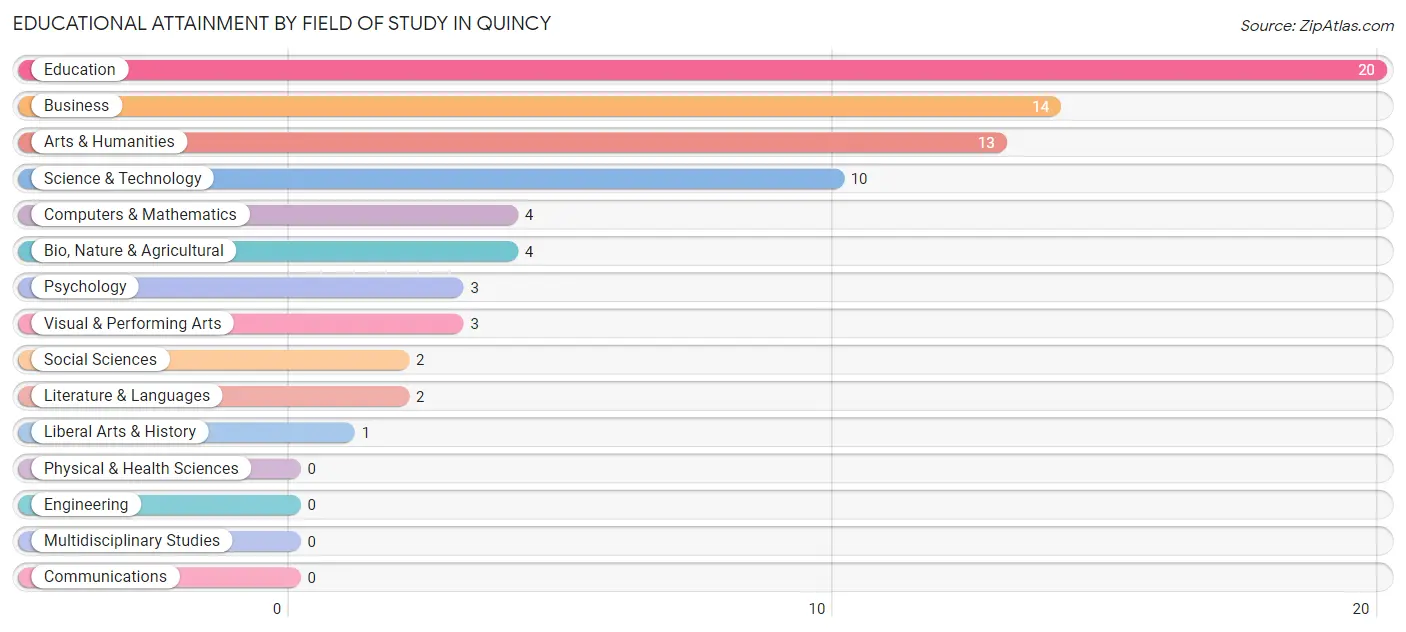
| Field of Study | # Graduates | % Graduates |
| Computers & Mathematics | 4 | 5.3% |
| Bio, Nature & Agricultural | 4 | 5.3% |
| Physical & Health Sciences | 0 | 0.0% |
| Psychology | 3 | 4.0% |
| Social Sciences | 2 | 2.6% |
| Engineering | 0 | 0.0% |
| Multidisciplinary Studies | 0 | 0.0% |
| Science & Technology | 10 | 13.2% |
| Business | 14 | 18.4% |
| Education | 20 | 26.3% |
| Literature & Languages | 2 | 2.6% |
| Liberal Arts & History | 1 | 1.3% |
| Visual & Performing Arts | 3 | 4.0% |
| Communications | 0 | 0.0% |
| Arts & Humanities | 13 | 17.1% |
| Total | 76 | 100.0% |
Transportation & Commute in Quincy
Vehicle Availability by Sex in Quincy
The most prevalent vehicle ownership categories in Quincy are males with 2 vehicles (134, accounting for 38.6%) and females with 2 vehicles (71, making up 53.0%).
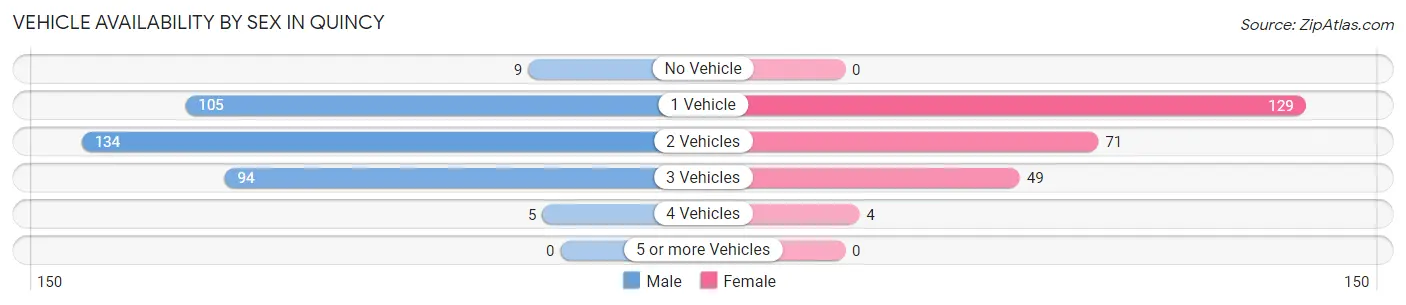
| Vehicles Available | Male | Female |
| No Vehicle | 9 (2.6%) | 0 (0.0%) |
| 1 Vehicle | 105 (30.3%) | 129 (51.0%) |
| 2 Vehicles | 134 (38.6%) | 71 (28.1%) |
| 3 Vehicles | 94 (27.1%) | 49 (19.4%) |
| 4 Vehicles | 5 (1.4%) | 4 (1.6%) |
| 5 or more Vehicles | 0 (0.0%) | 0 (0.0%) |
| Total | 347 (100.0%) | 253 (100.0%) |
Commute Time in Quincy
The most frequently occuring commute durations in Quincy are 10 to 14 minutes (183 commuters, 30.8%), 15 to 19 minutes (104 commuters, 17.5%), and 5 to 9 minutes (89 commuters, 15.0%).
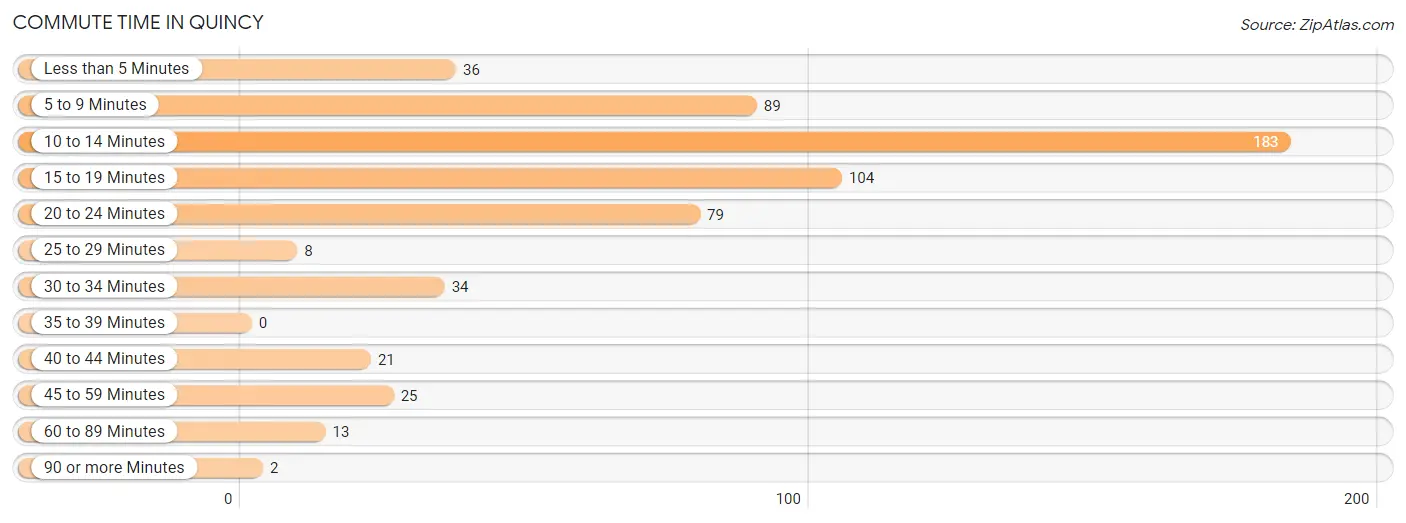
| Commute Time | # Commuters | % Commuters |
| Less than 5 Minutes | 36 | 6.1% |
| 5 to 9 Minutes | 89 | 15.0% |
| 10 to 14 Minutes | 183 | 30.8% |
| 15 to 19 Minutes | 104 | 17.5% |
| 20 to 24 Minutes | 79 | 13.3% |
| 25 to 29 Minutes | 8 | 1.3% |
| 30 to 34 Minutes | 34 | 5.7% |
| 35 to 39 Minutes | 0 | 0.0% |
| 40 to 44 Minutes | 21 | 3.5% |
| 45 to 59 Minutes | 25 | 4.2% |
| 60 to 89 Minutes | 13 | 2.2% |
| 90 or more Minutes | 2 | 0.3% |
Commute Time by Sex in Quincy
The most common commute times in Quincy are 10 to 14 minutes (77 commuters, 22.3%) for males and 10 to 14 minutes (106 commuters, 42.7%) for females.
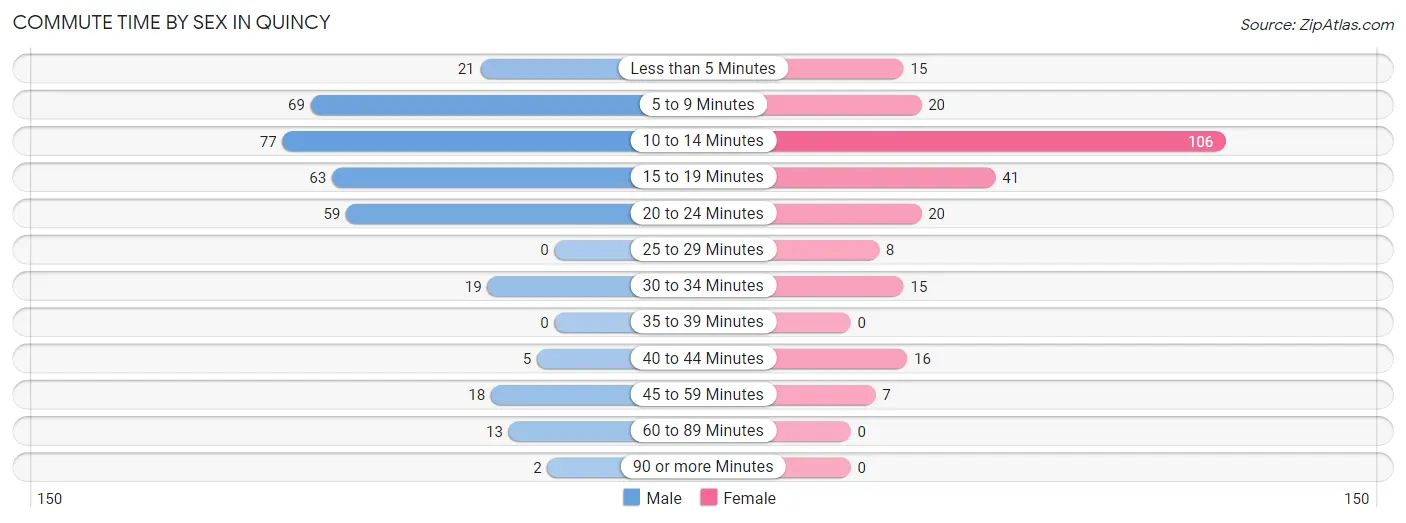
| Commute Time | Male | Female |
| Less than 5 Minutes | 21 (6.1%) | 15 (6.0%) |
| 5 to 9 Minutes | 69 (19.9%) | 20 (8.1%) |
| 10 to 14 Minutes | 77 (22.3%) | 106 (42.7%) |
| 15 to 19 Minutes | 63 (18.2%) | 41 (16.5%) |
| 20 to 24 Minutes | 59 (17.1%) | 20 (8.1%) |
| 25 to 29 Minutes | 0 (0.0%) | 8 (3.2%) |
| 30 to 34 Minutes | 19 (5.5%) | 15 (6.0%) |
| 35 to 39 Minutes | 0 (0.0%) | 0 (0.0%) |
| 40 to 44 Minutes | 5 (1.5%) | 16 (6.5%) |
| 45 to 59 Minutes | 18 (5.2%) | 7 (2.8%) |
| 60 to 89 Minutes | 13 (3.8%) | 0 (0.0%) |
| 90 or more Minutes | 2 (0.6%) | 0 (0.0%) |
Time of Departure to Work by Sex in Quincy
The most frequent times of departure to work in Quincy are 5:30 AM to 5:59 AM (55, 15.9%) for males and 7:30 AM to 7:59 AM (75, 30.2%) for females.
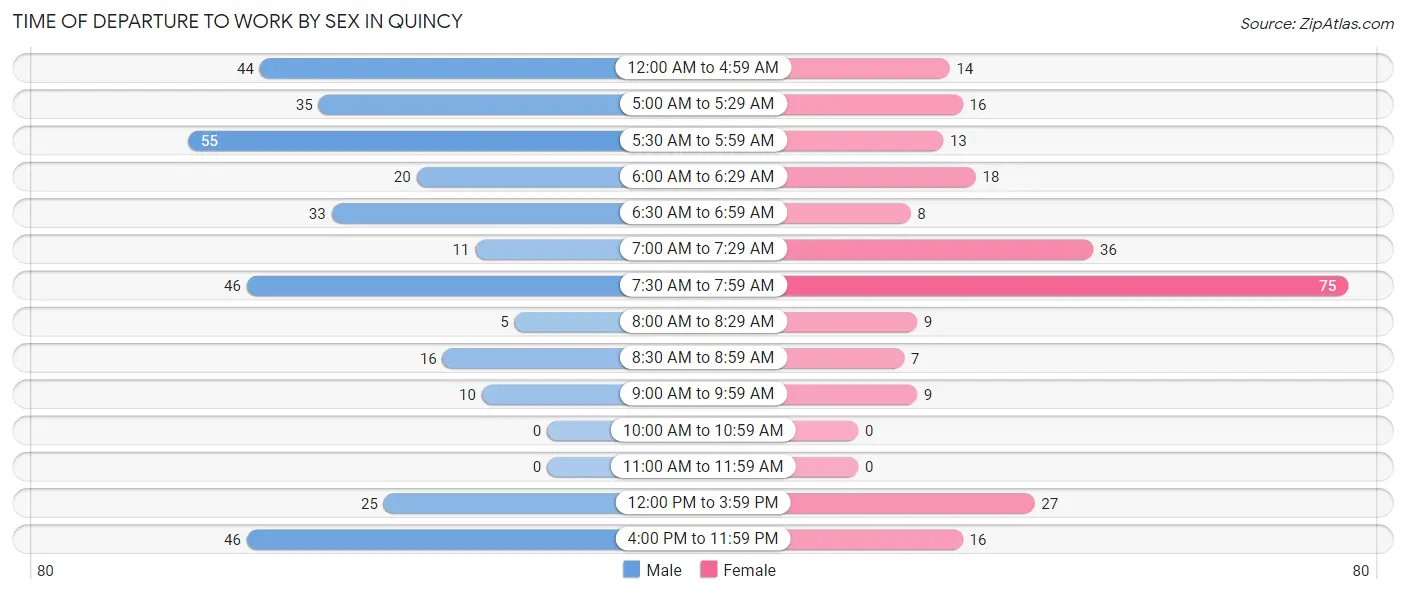
| Time of Departure | Male | Female |
| 12:00 AM to 4:59 AM | 44 (12.7%) | 14 (5.7%) |
| 5:00 AM to 5:29 AM | 35 (10.1%) | 16 (6.5%) |
| 5:30 AM to 5:59 AM | 55 (15.9%) | 13 (5.2%) |
| 6:00 AM to 6:29 AM | 20 (5.8%) | 18 (7.3%) |
| 6:30 AM to 6:59 AM | 33 (9.5%) | 8 (3.2%) |
| 7:00 AM to 7:29 AM | 11 (3.2%) | 36 (14.5%) |
| 7:30 AM to 7:59 AM | 46 (13.3%) | 75 (30.2%) |
| 8:00 AM to 8:29 AM | 5 (1.5%) | 9 (3.6%) |
| 8:30 AM to 8:59 AM | 16 (4.6%) | 7 (2.8%) |
| 9:00 AM to 9:59 AM | 10 (2.9%) | 9 (3.6%) |
| 10:00 AM to 10:59 AM | 0 (0.0%) | 0 (0.0%) |
| 11:00 AM to 11:59 AM | 0 (0.0%) | 0 (0.0%) |
| 12:00 PM to 3:59 PM | 25 (7.2%) | 27 (10.9%) |
| 4:00 PM to 11:59 PM | 46 (13.3%) | 16 (6.5%) |
| Total | 346 (100.0%) | 248 (100.0%) |
Housing Occupancy in Quincy
Occupancy by Ownership in Quincy
Of the total 609 dwellings in Quincy, owner-occupied units account for 475 (78.0%), while renter-occupied units make up 134 (22.0%).
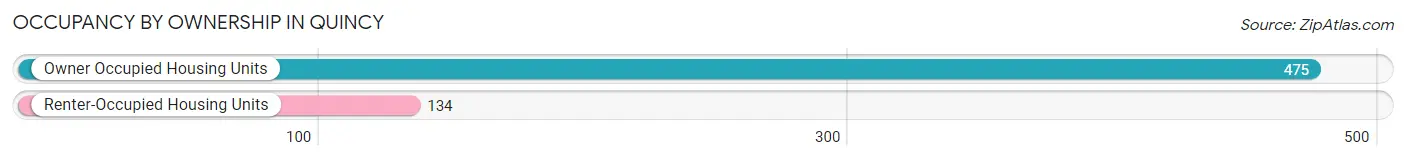
| Occupancy | # Housing Units | % Housing Units |
| Owner Occupied Housing Units | 475 | 78.0% |
| Renter-Occupied Housing Units | 134 | 22.0% |
| Total Occupied Housing Units | 609 | 100.0% |
Occupancy by Household Size in Quincy
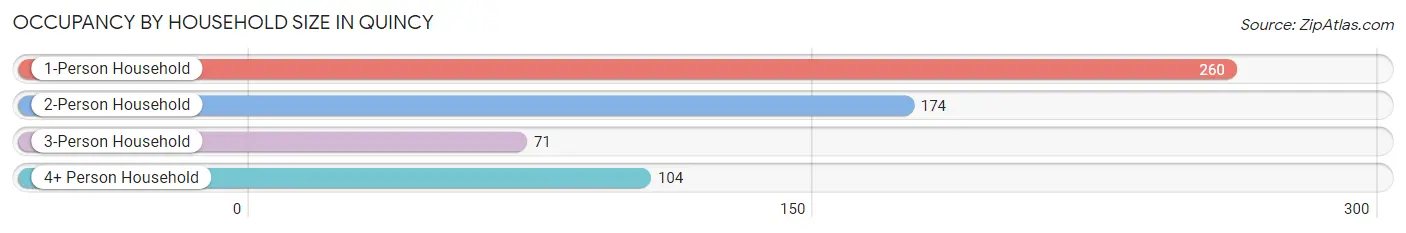
| Household Size | # Housing Units | % Housing Units |
| 1-Person Household | 260 | 42.7% |
| 2-Person Household | 174 | 28.6% |
| 3-Person Household | 71 | 11.7% |
| 4+ Person Household | 104 | 17.1% |
| Total Housing Units | 609 | 100.0% |
Occupancy by Ownership by Household Size in Quincy
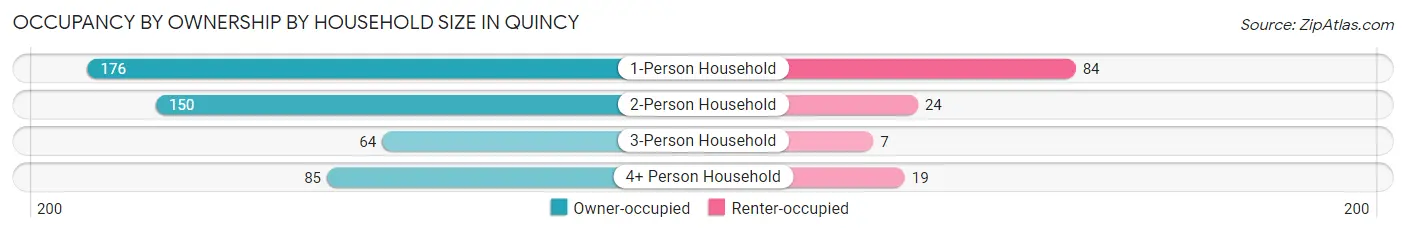
| Household Size | Owner-occupied | Renter-occupied |
| 1-Person Household | 176 (67.7%) | 84 (32.3%) |
| 2-Person Household | 150 (86.2%) | 24 (13.8%) |
| 3-Person Household | 64 (90.1%) | 7 (9.9%) |
| 4+ Person Household | 85 (81.7%) | 19 (18.3%) |
| Total Housing Units | 475 (78.0%) | 134 (22.0%) |
Occupancy by Educational Attainment in Quincy
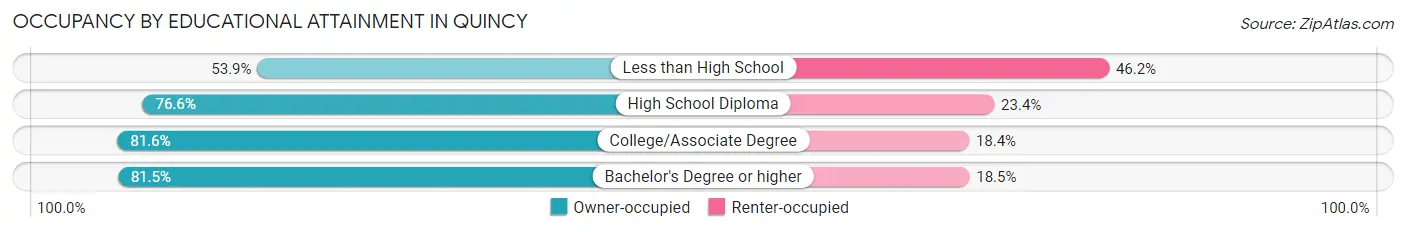
| Household Size | Owner-occupied | Renter-occupied |
| Less than High School | 14 (53.8%) | 12 (46.2%) |
| High School Diploma | 226 (76.6%) | 69 (23.4%) |
| College/Associate Degree | 182 (81.6%) | 41 (18.4%) |
| Bachelor's Degree or higher | 53 (81.5%) | 12 (18.5%) |
Occupancy by Age of Householder in Quincy
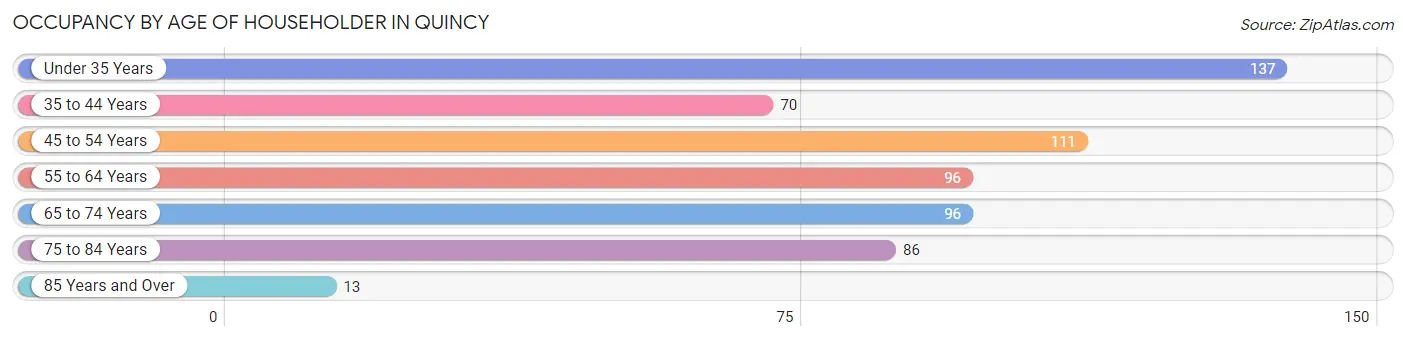
| Age Bracket | # Households | % Households |
| Under 35 Years | 137 | 22.5% |
| 35 to 44 Years | 70 | 11.5% |
| 45 to 54 Years | 111 | 18.2% |
| 55 to 64 Years | 96 | 15.8% |
| 65 to 74 Years | 96 | 15.8% |
| 75 to 84 Years | 86 | 14.1% |
| 85 Years and Over | 13 | 2.1% |
| Total | 609 | 100.0% |
Housing Finances in Quincy
Median Income by Occupancy in Quincy
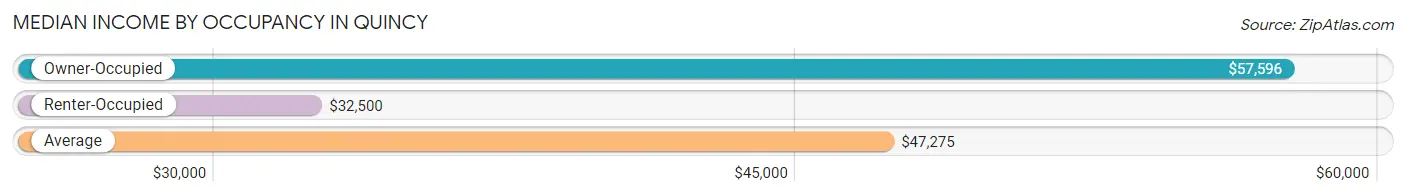
| Occupancy Type | # Households | Median Income |
| Owner-Occupied | 475 (78.0%) | $57,596 |
| Renter-Occupied | 134 (22.0%) | $32,500 |
| Average | 609 (100.0%) | $47,275 |
Occupancy by Householder Income Bracket in Quincy
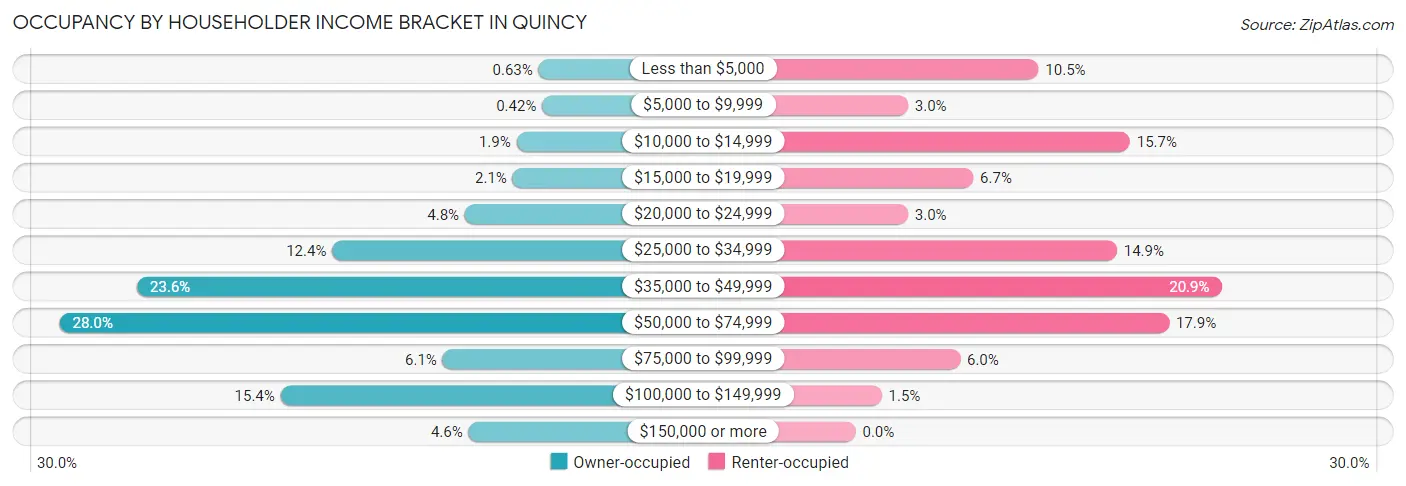
| Income Bracket | Owner-occupied | Renter-occupied |
| Less than $5,000 | 3 (0.6%) | 14 (10.4%) |
| $5,000 to $9,999 | 2 (0.4%) | 4 (3.0%) |
| $10,000 to $14,999 | 9 (1.9%) | 21 (15.7%) |
| $15,000 to $19,999 | 10 (2.1%) | 9 (6.7%) |
| $20,000 to $24,999 | 23 (4.8%) | 4 (3.0%) |
| $25,000 to $34,999 | 59 (12.4%) | 20 (14.9%) |
| $35,000 to $49,999 | 112 (23.6%) | 28 (20.9%) |
| $50,000 to $74,999 | 133 (28.0%) | 24 (17.9%) |
| $75,000 to $99,999 | 29 (6.1%) | 8 (6.0%) |
| $100,000 to $149,999 | 73 (15.4%) | 2 (1.5%) |
| $150,000 or more | 22 (4.6%) | 0 (0.0%) |
| Total | 475 (100.0%) | 134 (100.0%) |
Monthly Housing Cost Tiers in Quincy
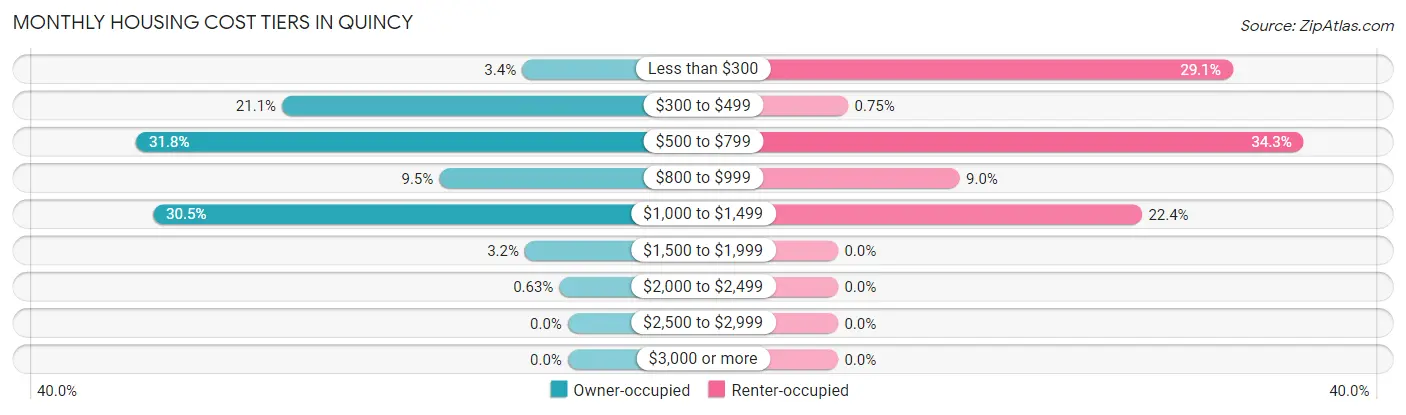
| Monthly Cost | Owner-occupied | Renter-occupied |
| Less than $300 | 16 (3.4%) | 39 (29.1%) |
| $300 to $499 | 100 (21.0%) | 1 (0.7%) |
| $500 to $799 | 151 (31.8%) | 46 (34.3%) |
| $800 to $999 | 45 (9.5%) | 12 (9.0%) |
| $1,000 to $1,499 | 145 (30.5%) | 30 (22.4%) |
| $1,500 to $1,999 | 15 (3.2%) | 0 (0.0%) |
| $2,000 to $2,499 | 3 (0.6%) | 0 (0.0%) |
| $2,500 to $2,999 | 0 (0.0%) | 0 (0.0%) |
| $3,000 or more | 0 (0.0%) | 0 (0.0%) |
| Total | 475 (100.0%) | 134 (100.0%) |
Physical Housing Characteristics in Quincy
Housing Structures in Quincy
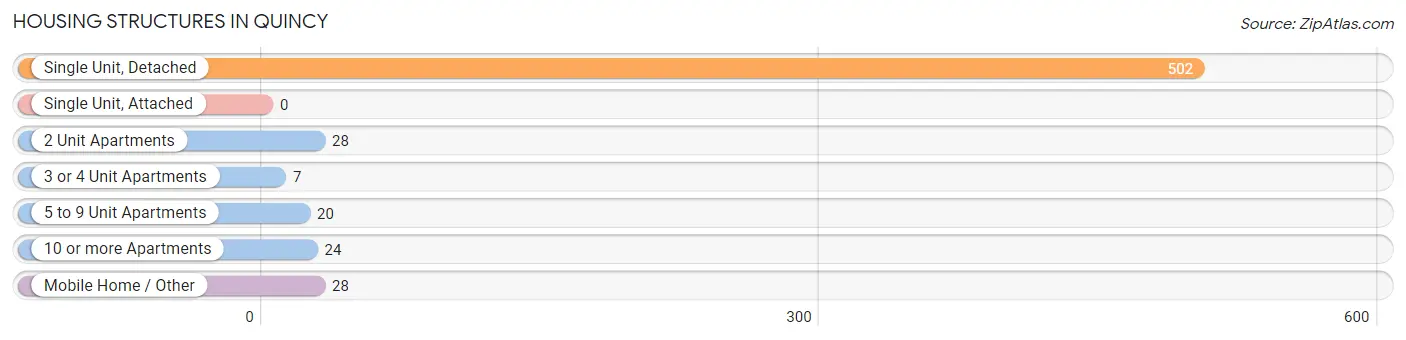
| Structure Type | # Housing Units | % Housing Units |
| Single Unit, Detached | 502 | 82.4% |
| Single Unit, Attached | 0 | 0.0% |
| 2 Unit Apartments | 28 | 4.6% |
| 3 or 4 Unit Apartments | 7 | 1.1% |
| 5 to 9 Unit Apartments | 20 | 3.3% |
| 10 or more Apartments | 24 | 3.9% |
| Mobile Home / Other | 28 | 4.6% |
| Total | 609 | 100.0% |
Housing Structures by Occupancy in Quincy
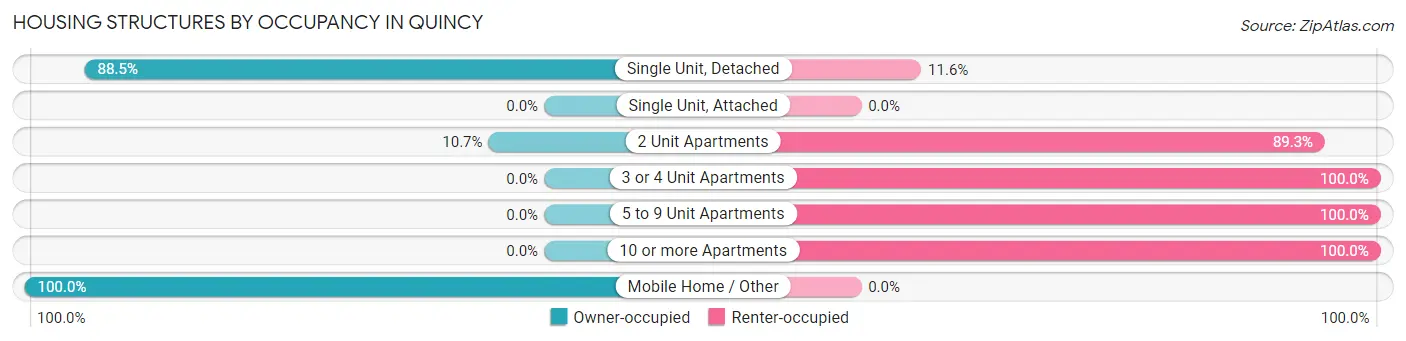
| Structure Type | Owner-occupied | Renter-occupied |
| Single Unit, Detached | 444 (88.4%) | 58 (11.6%) |
| Single Unit, Attached | 0 (0.0%) | 0 (0.0%) |
| 2 Unit Apartments | 3 (10.7%) | 25 (89.3%) |
| 3 or 4 Unit Apartments | 0 (0.0%) | 7 (100.0%) |
| 5 to 9 Unit Apartments | 0 (0.0%) | 20 (100.0%) |
| 10 or more Apartments | 0 (0.0%) | 24 (100.0%) |
| Mobile Home / Other | 28 (100.0%) | 0 (0.0%) |
| Total | 475 (78.0%) | 134 (22.0%) |
Housing Structures by Number of Rooms in Quincy
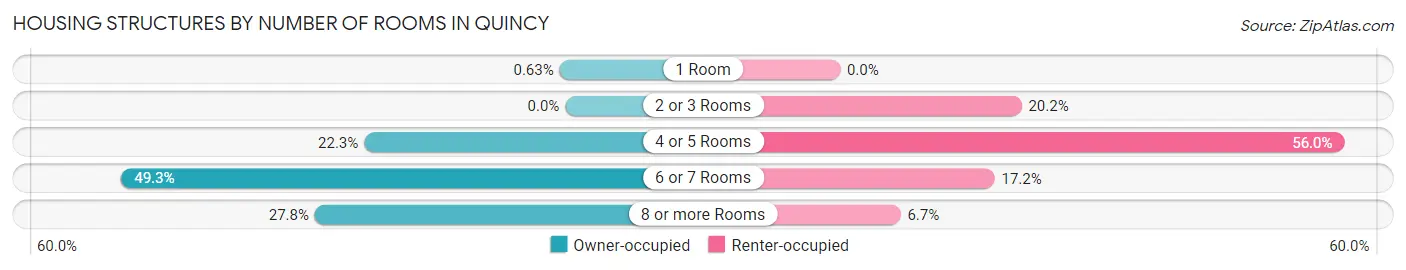
| Number of Rooms | Owner-occupied | Renter-occupied |
| 1 Room | 3 (0.6%) | 0 (0.0%) |
| 2 or 3 Rooms | 0 (0.0%) | 27 (20.2%) |
| 4 or 5 Rooms | 106 (22.3%) | 75 (56.0%) |
| 6 or 7 Rooms | 234 (49.3%) | 23 (17.2%) |
| 8 or more Rooms | 132 (27.8%) | 9 (6.7%) |
| Total | 475 (100.0%) | 134 (100.0%) |
Housing Structure by Heating Type in Quincy
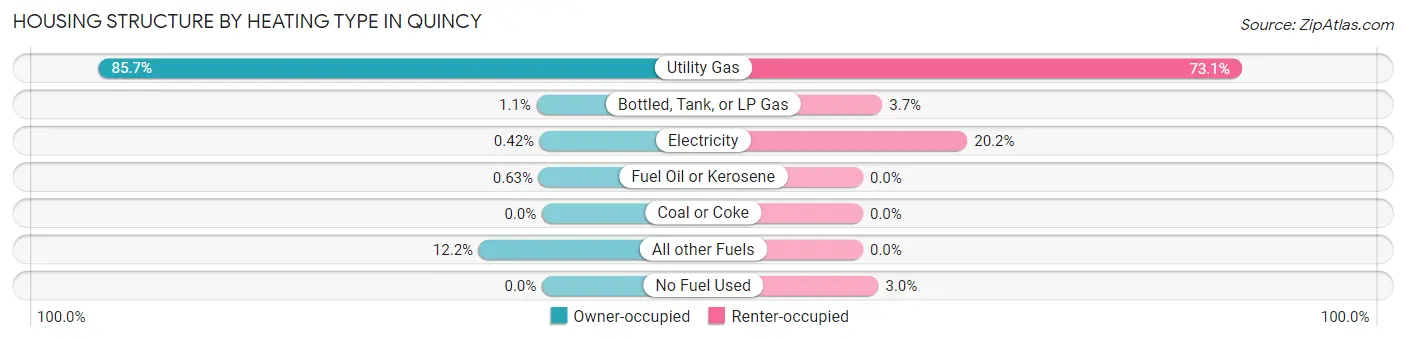
| Heating Type | Owner-occupied | Renter-occupied |
| Utility Gas | 407 (85.7%) | 98 (73.1%) |
| Bottled, Tank, or LP Gas | 5 (1.1%) | 5 (3.7%) |
| Electricity | 2 (0.4%) | 27 (20.2%) |
| Fuel Oil or Kerosene | 3 (0.6%) | 0 (0.0%) |
| Coal or Coke | 0 (0.0%) | 0 (0.0%) |
| All other Fuels | 58 (12.2%) | 0 (0.0%) |
| No Fuel Used | 0 (0.0%) | 4 (3.0%) |
| Total | 475 (100.0%) | 134 (100.0%) |
Household Vehicle Usage in Quincy
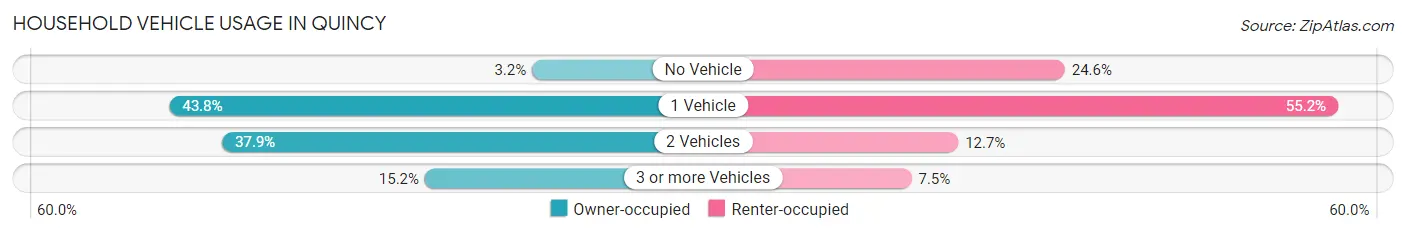
| Vehicles per Household | Owner-occupied | Renter-occupied |
| No Vehicle | 15 (3.2%) | 33 (24.6%) |
| 1 Vehicle | 208 (43.8%) | 74 (55.2%) |
| 2 Vehicles | 180 (37.9%) | 17 (12.7%) |
| 3 or more Vehicles | 72 (15.2%) | 10 (7.5%) |
| Total | 475 (100.0%) | 134 (100.0%) |
Real Estate & Mortgages in Quincy
Real Estate and Mortgage Overview in Quincy
| Characteristic | Without Mortgage | With Mortgage |
| Housing Units | 164 | 311 |
| Median Property Value | $93,600 | $99,300 |
| Median Household Income | $45,000 | $22 |
| Monthly Housing Costs | $452 | $0 |
| Real Estate Taxes | $1,689 | $23 |
Property Value by Mortgage Status in Quincy
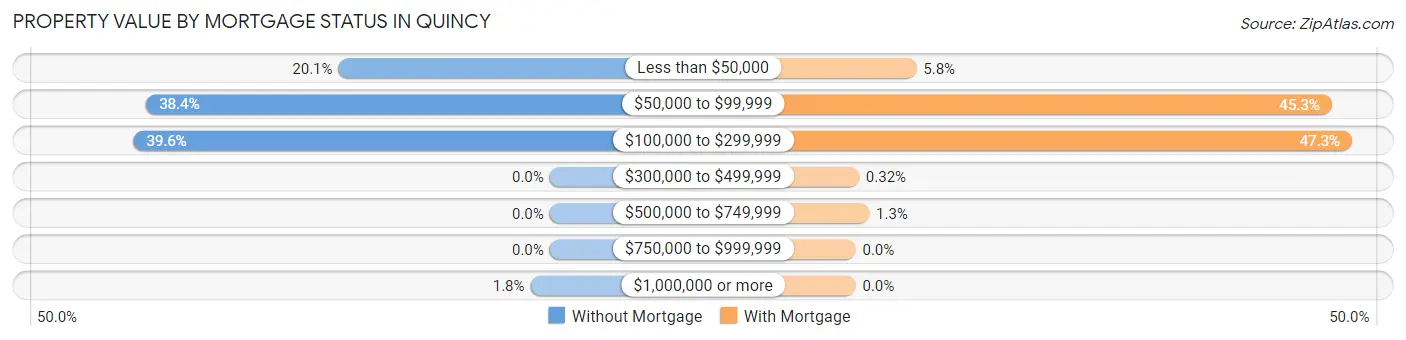
| Property Value | Without Mortgage | With Mortgage |
| Less than $50,000 | 33 (20.1%) | 18 (5.8%) |
| $50,000 to $99,999 | 63 (38.4%) | 141 (45.3%) |
| $100,000 to $299,999 | 65 (39.6%) | 147 (47.3%) |
| $300,000 to $499,999 | 0 (0.0%) | 1 (0.3%) |
| $500,000 to $749,999 | 0 (0.0%) | 4 (1.3%) |
| $750,000 to $999,999 | 0 (0.0%) | 0 (0.0%) |
| $1,000,000 or more | 3 (1.8%) | 0 (0.0%) |
| Total | 164 (100.0%) | 311 (100.0%) |
Household Income by Mortgage Status in Quincy
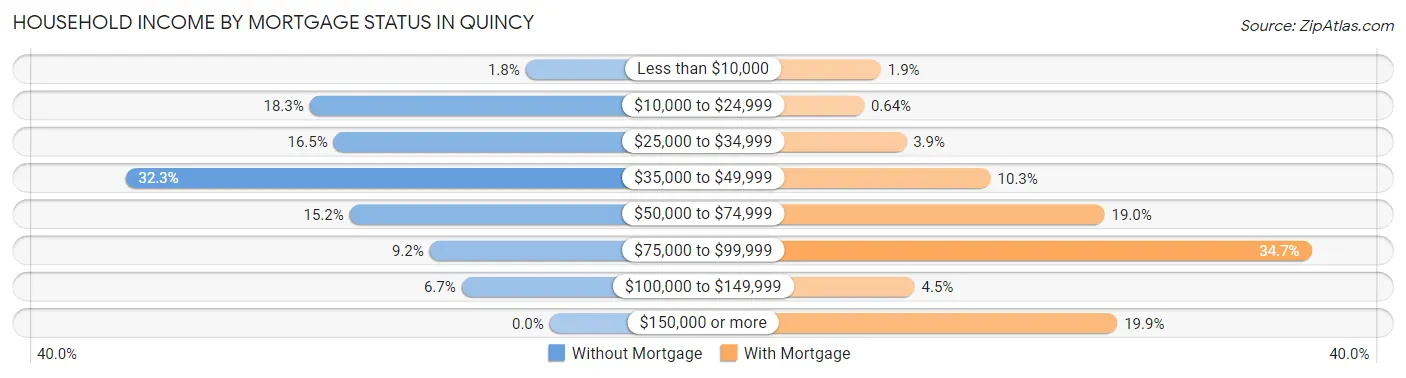
| Household Income | Without Mortgage | With Mortgage |
| Less than $10,000 | 3 (1.8%) | 6 (1.9%) |
| $10,000 to $24,999 | 30 (18.3%) | 2 (0.6%) |
| $25,000 to $34,999 | 27 (16.5%) | 12 (3.9%) |
| $35,000 to $49,999 | 53 (32.3%) | 32 (10.3%) |
| $50,000 to $74,999 | 25 (15.2%) | 59 (19.0%) |
| $75,000 to $99,999 | 15 (9.1%) | 108 (34.7%) |
| $100,000 to $149,999 | 11 (6.7%) | 14 (4.5%) |
| $150,000 or more | 0 (0.0%) | 62 (19.9%) |
| Total | 164 (100.0%) | 311 (100.0%) |
Property Value to Household Income Ratio in Quincy
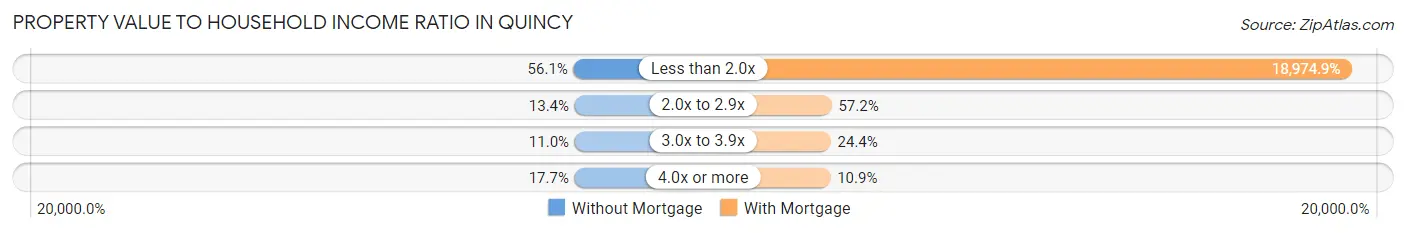
| Value-to-Income Ratio | Without Mortgage | With Mortgage |
| Less than 2.0x | 92 (56.1%) | 59,012 (18,974.9%) |
| 2.0x to 2.9x | 22 (13.4%) | 178 (57.2%) |
| 3.0x to 3.9x | 18 (11.0%) | 76 (24.4%) |
| 4.0x or more | 29 (17.7%) | 34 (10.9%) |
| Total | 164 (100.0%) | 311 (100.0%) |
Real Estate Taxes by Mortgage Status in Quincy
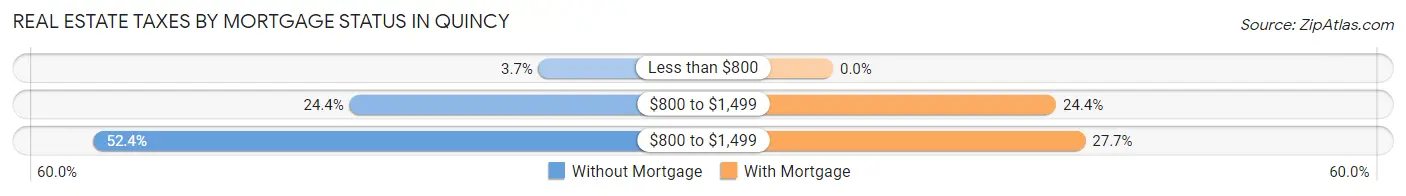
| Property Taxes | Without Mortgage | With Mortgage |
| Less than $800 | 6 (3.7%) | 0 (0.0%) |
| $800 to $1,499 | 40 (24.4%) | 76 (24.4%) |
| $800 to $1,499 | 86 (52.4%) | 86 (27.7%) |
| Total | 164 (100.0%) | 311 (100.0%) |
Health & Disability in Quincy
Health Insurance Coverage by Age in Quincy
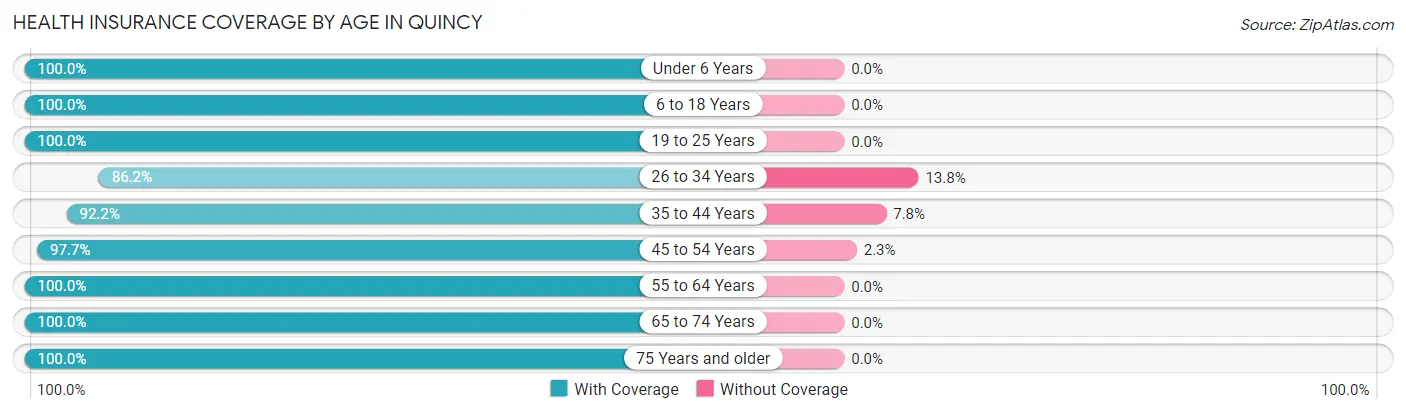
| Age Bracket | With Coverage | Without Coverage |
| Under 6 Years | 116 (100.0%) | 0 (0.0%) |
| 6 to 18 Years | 168 (100.0%) | 0 (0.0%) |
| 19 to 25 Years | 160 (100.0%) | 0 (0.0%) |
| 26 to 34 Years | 137 (86.2%) | 22 (13.8%) |
| 35 to 44 Years | 106 (92.2%) | 9 (7.8%) |
| 45 to 54 Years | 168 (97.7%) | 4 (2.3%) |
| 55 to 64 Years | 150 (100.0%) | 0 (0.0%) |
| 65 to 74 Years | 142 (100.0%) | 0 (0.0%) |
| 75 Years and older | 121 (100.0%) | 0 (0.0%) |
| Total | 1,268 (97.3%) | 35 (2.7%) |
Health Insurance Coverage by Citizenship Status in Quincy
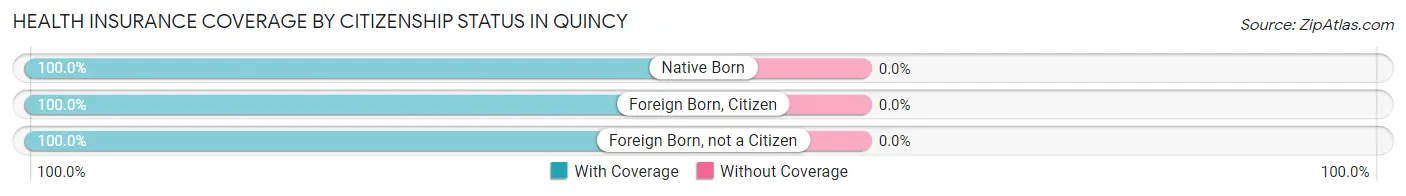
| Citizenship Status | With Coverage | Without Coverage |
| Native Born | 116 (100.0%) | 0 (0.0%) |
| Foreign Born, Citizen | 168 (100.0%) | 0 (0.0%) |
| Foreign Born, not a Citizen | 160 (100.0%) | 0 (0.0%) |
Health Insurance Coverage by Household Income in Quincy
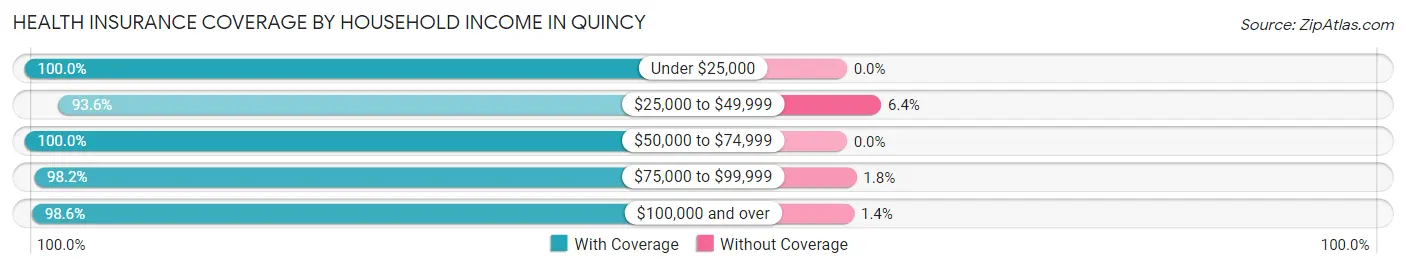
| Household Income | With Coverage | Without Coverage |
| Under $25,000 | 152 (100.0%) | 0 (0.0%) |
| $25,000 to $49,999 | 422 (93.6%) | 29 (6.4%) |
| $50,000 to $74,999 | 295 (100.0%) | 0 (0.0%) |
| $75,000 to $99,999 | 109 (98.2%) | 2 (1.8%) |
| $100,000 and over | 290 (98.6%) | 4 (1.4%) |
Public vs Private Health Insurance Coverage by Age in Quincy
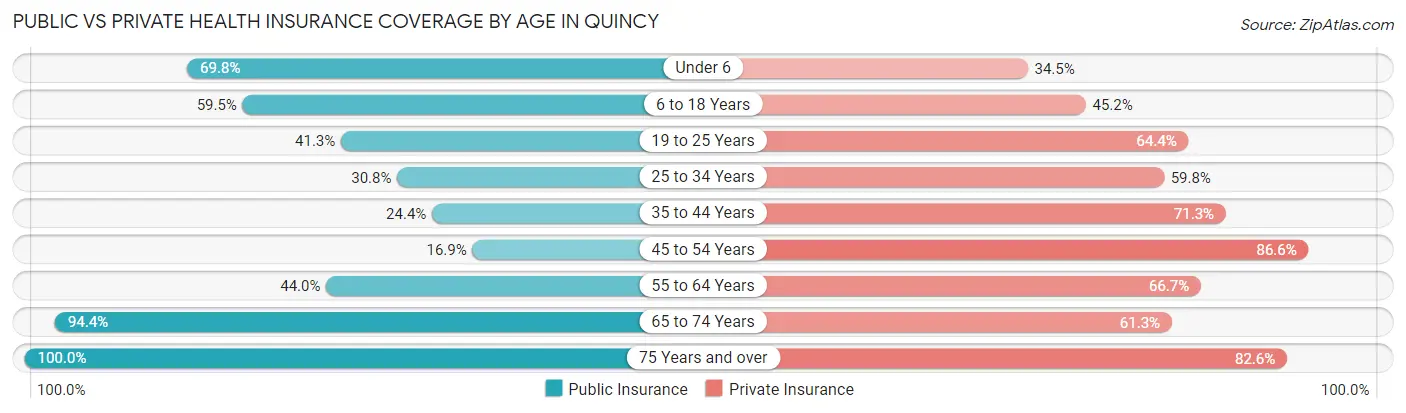
| Age Bracket | Public Insurance | Private Insurance |
| Under 6 | 81 (69.8%) | 40 (34.5%) |
| 6 to 18 Years | 100 (59.5%) | 76 (45.2%) |
| 19 to 25 Years | 66 (41.2%) | 103 (64.4%) |
| 25 to 34 Years | 49 (30.8%) | 95 (59.8%) |
| 35 to 44 Years | 28 (24.3%) | 82 (71.3%) |
| 45 to 54 Years | 29 (16.9%) | 149 (86.6%) |
| 55 to 64 Years | 66 (44.0%) | 100 (66.7%) |
| 65 to 74 Years | 134 (94.4%) | 87 (61.3%) |
| 75 Years and over | 121 (100.0%) | 100 (82.6%) |
| Total | 674 (51.7%) | 832 (63.8%) |
Disability Status by Sex by Age in Quincy
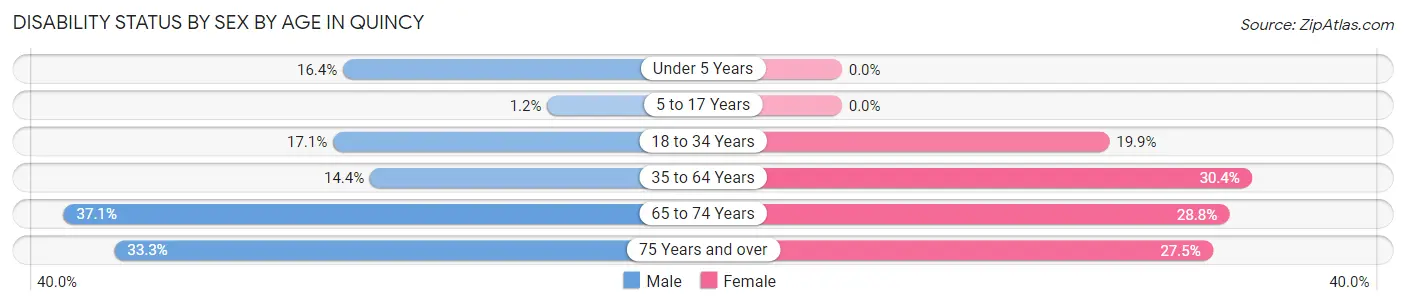
| Age Bracket | Male | Female |
| Under 5 Years | 9 (16.4%) | 0 (0.0%) |
| 5 to 17 Years | 1 (1.2%) | 0 (0.0%) |
| 18 to 34 Years | 33 (17.1%) | 28 (19.9%) |
| 35 to 64 Years | 33 (14.3%) | 63 (30.4%) |
| 65 to 74 Years | 23 (37.1%) | 23 (28.7%) |
| 75 Years and over | 4 (33.3%) | 30 (27.5%) |
Disability Class by Sex by Age in Quincy
Disability Class: Hearing Difficulty
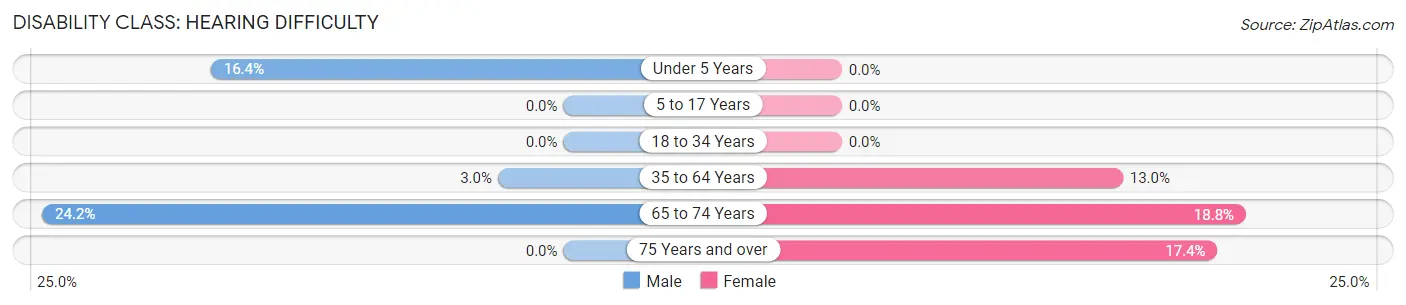
| Age Bracket | Male | Female |
| Under 5 Years | 9 (16.4%) | 0 (0.0%) |
| 5 to 17 Years | 0 (0.0%) | 0 (0.0%) |
| 18 to 34 Years | 0 (0.0%) | 0 (0.0%) |
| 35 to 64 Years | 7 (3.0%) | 27 (13.0%) |
| 65 to 74 Years | 15 (24.2%) | 15 (18.8%) |
| 75 Years and over | 0 (0.0%) | 19 (17.4%) |
Disability Class: Vision Difficulty
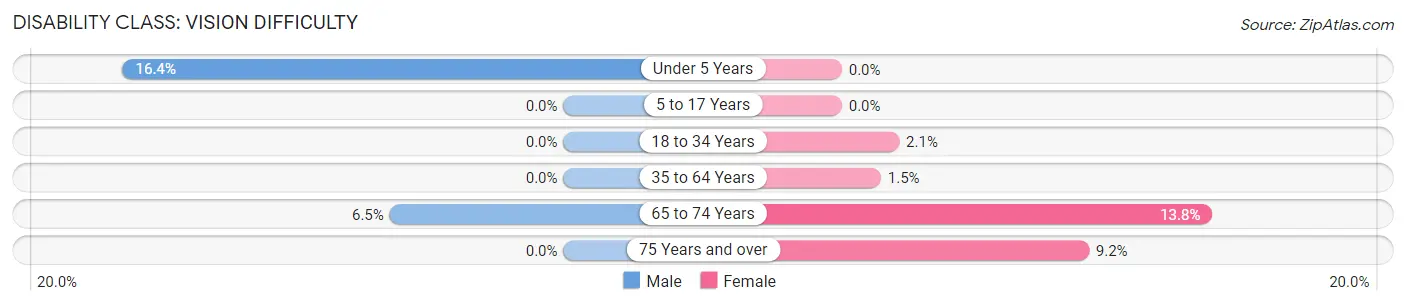
| Age Bracket | Male | Female |
| Under 5 Years | 9 (16.4%) | 0 (0.0%) |
| 5 to 17 Years | 0 (0.0%) | 0 (0.0%) |
| 18 to 34 Years | 0 (0.0%) | 3 (2.1%) |
| 35 to 64 Years | 0 (0.0%) | 3 (1.5%) |
| 65 to 74 Years | 4 (6.5%) | 11 (13.8%) |
| 75 Years and over | 0 (0.0%) | 10 (9.2%) |
Disability Class: Cognitive Difficulty
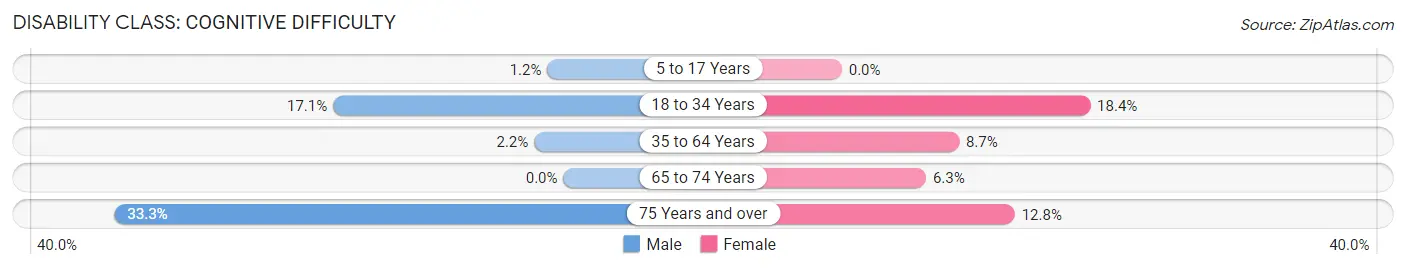
| Age Bracket | Male | Female |
| 5 to 17 Years | 1 (1.2%) | 0 (0.0%) |
| 18 to 34 Years | 33 (17.1%) | 26 (18.4%) |
| 35 to 64 Years | 5 (2.2%) | 18 (8.7%) |
| 65 to 74 Years | 0 (0.0%) | 5 (6.2%) |
| 75 Years and over | 4 (33.3%) | 14 (12.8%) |
Disability Class: Ambulatory Difficulty
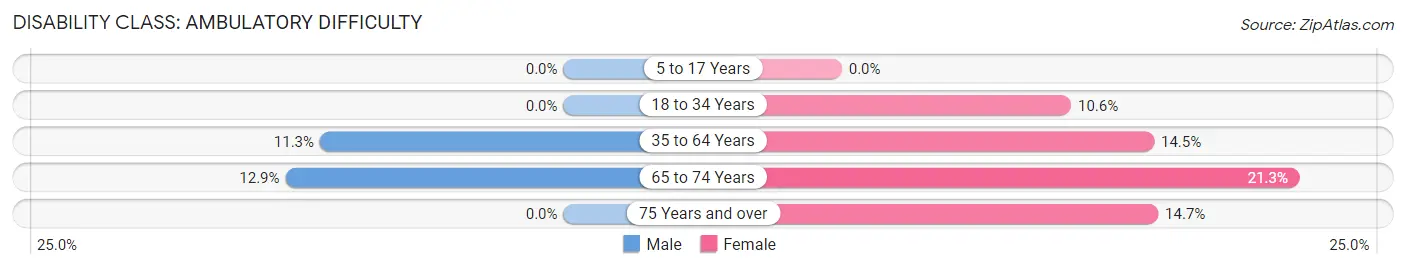
| Age Bracket | Male | Female |
| 5 to 17 Years | 0 (0.0%) | 0 (0.0%) |
| 18 to 34 Years | 0 (0.0%) | 15 (10.6%) |
| 35 to 64 Years | 26 (11.3%) | 30 (14.5%) |
| 65 to 74 Years | 8 (12.9%) | 17 (21.2%) |
| 75 Years and over | 0 (0.0%) | 16 (14.7%) |
Disability Class: Self-Care Difficulty
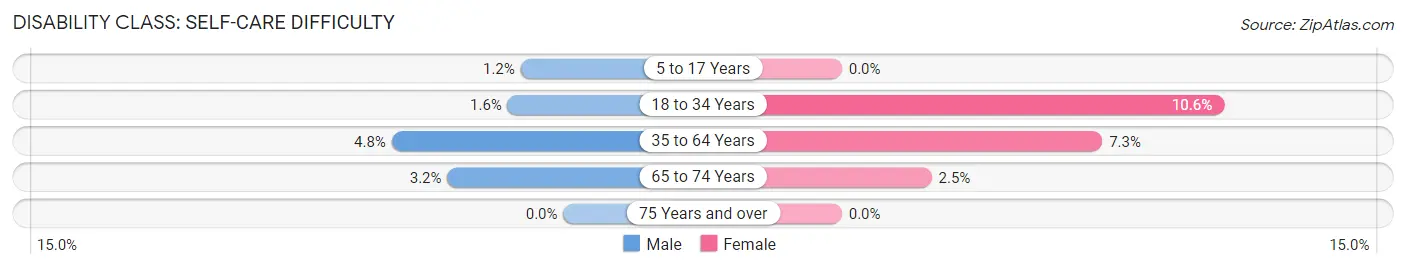
| Age Bracket | Male | Female |
| 5 to 17 Years | 1 (1.2%) | 0 (0.0%) |
| 18 to 34 Years | 3 (1.5%) | 15 (10.6%) |
| 35 to 64 Years | 11 (4.8%) | 15 (7.2%) |
| 65 to 74 Years | 2 (3.2%) | 2 (2.5%) |
| 75 Years and over | 0 (0.0%) | 0 (0.0%) |
Technology Access in Quincy
Computing Device Access in Quincy
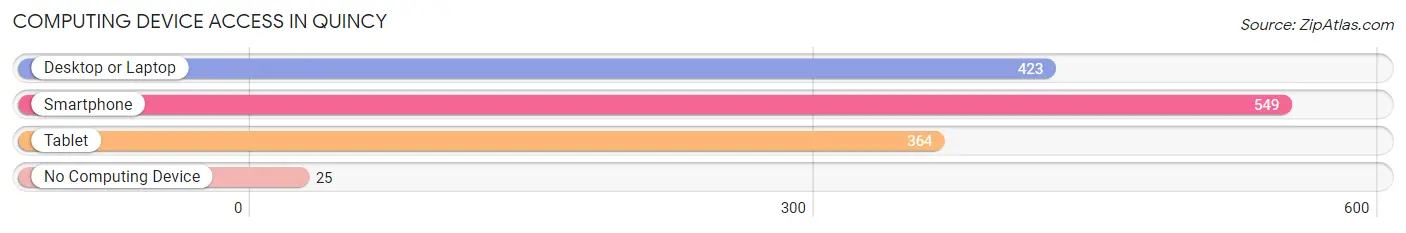
| Device Type | # Households | % Households |
| Desktop or Laptop | 423 | 69.5% |
| Smartphone | 549 | 90.1% |
| Tablet | 364 | 59.8% |
| No Computing Device | 25 | 4.1% |
| Total | 609 | 100.0% |
Internet Access in Quincy
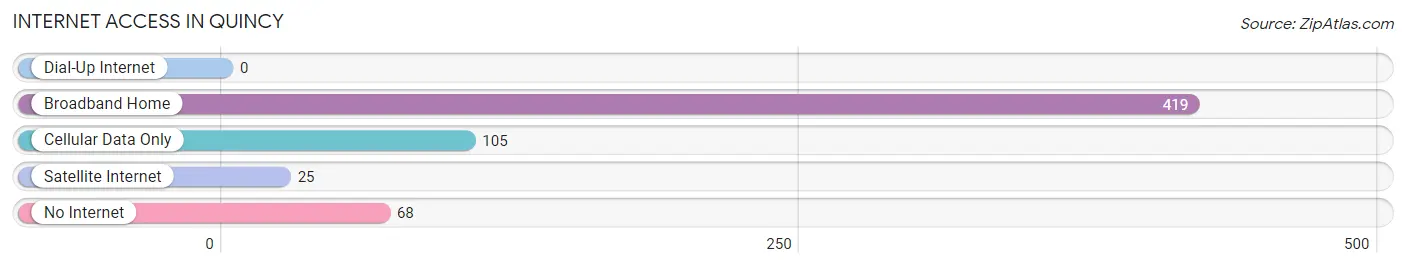
| Internet Type | # Households | % Households |
| Dial-Up Internet | 0 | 0.0% |
| Broadband Home | 419 | 68.8% |
| Cellular Data Only | 105 | 17.2% |
| Satellite Internet | 25 | 4.1% |
| No Internet | 68 | 11.2% |
| Total | 609 | 100.0% |
Quincy Summary
Quincy is a small unincorporated community located in Branch County, Michigan. It is situated in the northeast corner of the county, approximately 10 miles south of Coldwater and 15 miles north of Hillsdale. The population of Quincy was estimated to be 1,093 in 2019.
History
Quincy was first settled in 1836 by a group of settlers from Quincy, Massachusetts. The town was named after the Massachusetts city, and the first post office was established in 1837. The first school was built in 1838, and the first church was built in 1839.
In 1845, the first sawmill was built in Quincy, and the first grist mill was built in 1848. The first newspaper, the Quincy Herald, was established in 1851. The first bank was established in 1853, and the first railroad line was built in 1871.
Geography
Quincy is located in the northeast corner of Branch County, Michigan. It is situated on the banks of the St. Joseph River, which flows through the town. The town is located approximately 10 miles south of Coldwater and 15 miles north of Hillsdale.
The terrain of Quincy is mostly flat, with some rolling hills. The town is surrounded by farmland, and there are several small lakes and ponds in the area.
Economy
The economy of Quincy is largely based on agriculture. The town is home to several farms, and the surrounding area is known for its production of corn, soybeans, and wheat.
Quincy also has a small manufacturing sector, with several small businesses located in the town. The town is also home to several retail stores, restaurants, and other businesses.
Demographics
As of 2019, the population of Quincy was estimated to be 1,093. The racial makeup of the town was 97.3% White, 0.7% African American, 0.3% Native American, 0.2% Asian, 0.1% Pacific Islander, 0.2% from other races, and 1.2% from two or more races. Hispanic or Latino of any race were 1.2% of the population.
The median household income in Quincy was $45,938 in 2019, and the median home value was $117,400. The median age of the population was 43.3 years.
Conclusion
Quincy is a small unincorporated community located in Branch County, Michigan. It was first settled in 1836, and the town was named after the Massachusetts city. The economy of Quincy is largely based on agriculture, and the town is also home to several small businesses. The population of Quincy was estimated to be 1,093 in 2019, and the median household income was $45,938.
Common Questions
What is Per Capita Income in Quincy?
Per Capita income in Quincy is $27,913.
What is the Median Family Income in Quincy?
Median Family Income in Quincy is $52,292.
What is the Median Household income in Quincy?
Median Household Income in Quincy is $47,275.
What is Income or Wage Gap in Quincy?
Income or Wage Gap in Quincy is 23.9%.
Women in Quincy earn 76.1 cents for every dollar earned by a man.
What is Inequality or Gini Index in Quincy?
Inequality or Gini Index in Quincy is 0.36.
What is the Total Population of Quincy?
Total Population of Quincy is 1,303.
What is the Total Male Population of Quincy?
Total Male Population of Quincy is 636.
What is the Total Female Population of Quincy?
Total Female Population of Quincy is 667.
What is the Ratio of Males per 100 Females in Quincy?
There are 95.35 Males per 100 Females in Quincy.
What is the Ratio of Females per 100 Males in Quincy?
There are 104.87 Females per 100 Males in Quincy.
What is the Median Population Age in Quincy?
Median Population Age in Quincy is 39.6 Years.
What is the Average Family Size in Quincy
Average Family Size in Quincy is 2.9 People.
What is the Average Household Size in Quincy
Average Household Size in Quincy is 2.1 People.
How Large is the Labor Force in Quincy?
There are 653 People in the Labor Forcein in Quincy.
What is the Percentage of People in the Labor Force in Quincy?
61.2% of People are in the Labor Force in Quincy.
What is the Unemployment Rate in Quincy?
Unemployment Rate in Quincy is 7.5%.