Michigan Center, MI Map & Demographics
Michigan Center Map
Michigan Center Overview
$40,255
PER CAPITA INCOME
$69,922
AVG FAMILY INCOME
$64,286
AVG HOUSEHOLD INCOME
9.4%
WAGE / INCOME GAP [ % ]
90.6¢/ $1
WAGE / INCOME GAP [ $ ]
0.47
INEQUALITY / GINI INDEX
4,906
TOTAL POPULATION
2,392
MALE POPULATION
2,514
FEMALE POPULATION
95.15
MALES / 100 FEMALES
105.10
FEMALES / 100 MALES
40.4
MEDIAN AGE
3.0
AVG FAMILY SIZE
2.3
AVG HOUSEHOLD SIZE
2,517
LABOR FORCE [ PEOPLE ]
63.2%
PERCENT IN LABOR FORCE
8.5%
UNEMPLOYMENT RATE
Michigan Center Zip Codes
Michigan Center Area Codes
Income in Michigan Center
Income Overview in Michigan Center
Per Capita Income in Michigan Center is $40,255, while median incomes of families and households are $69,922 and $64,286 respectively.
| Characteristic | Number | Measure |
| Per Capita Income | 4,906 | $40,255 |
| Median Family Income | 1,255 | $69,922 |
| Mean Family Income | 1,255 | $104,723 |
| Median Household Income | 2,170 | $64,286 |
| Mean Household Income | 2,170 | $89,882 |
| Income Deficit | 1,255 | $0 |
| Wage / Income Gap (%) | 4,906 | 9.38% |
| Wage / Income Gap ($) | 4,906 | 90.62¢ per $1 |
| Gini / Inequality Index | 4,906 | 0.47 |
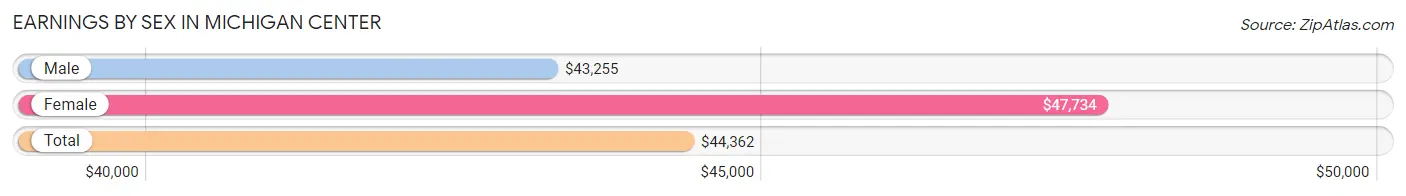
Earnings by Sex in Michigan Center
Average Earnings in Michigan Center are $44,362, $43,255 for men and $47,734 for women, a difference of 9.4%.
| Sex | Number | Average Earnings |
| Male | 1,196 (45.4%) | $43,255 |
| Female | 1,437 (54.6%) | $47,734 |
| Total | 2,633 (100.0%) | $44,362 |
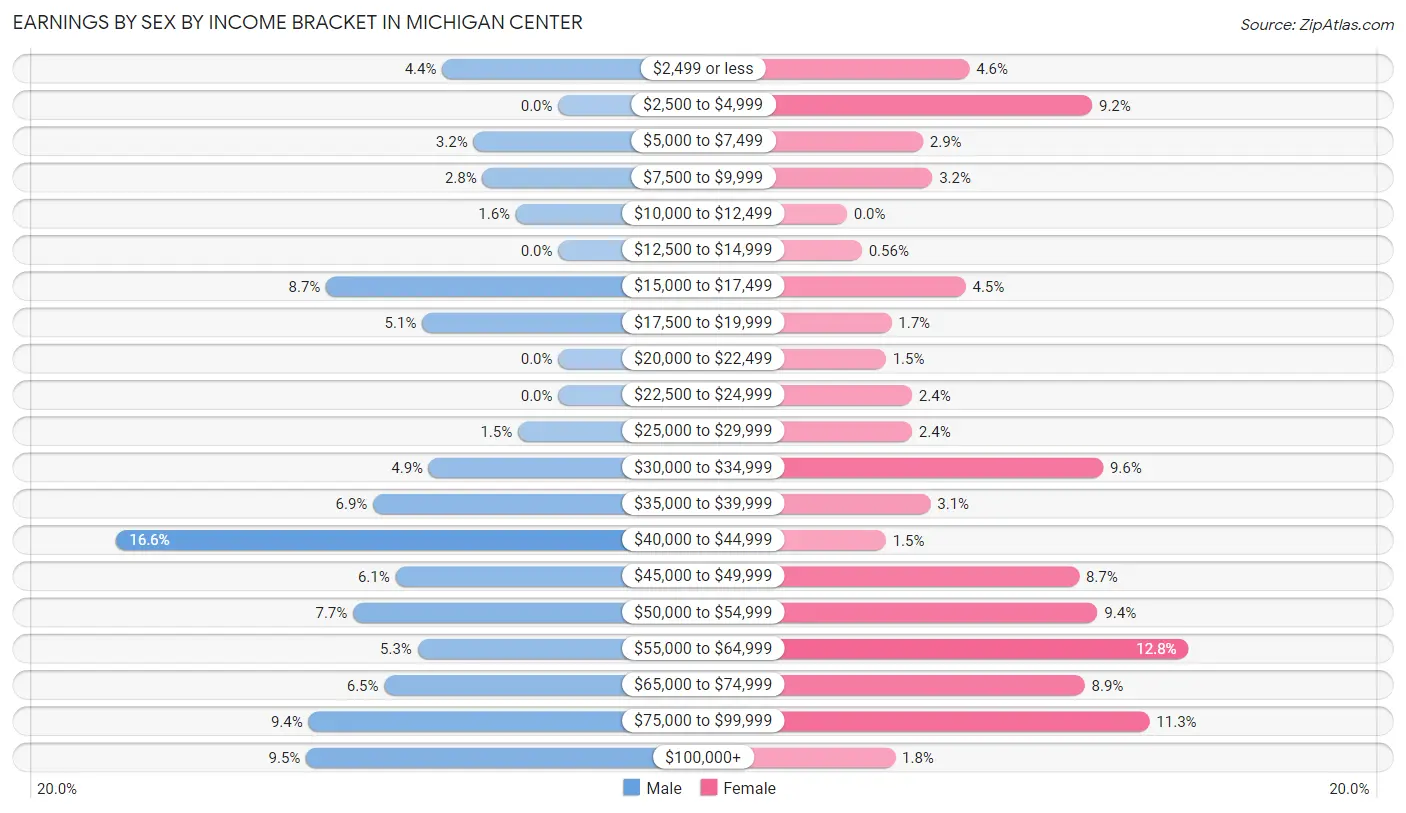
Earnings by Sex by Income Bracket in Michigan Center
The most common earnings brackets in Michigan Center are $40,000 to $44,999 for men (198 | 16.6%) and $55,000 to $64,999 for women (184 | 12.8%).
| Income | Male | Female |
| $2,499 or less | 52 (4.3%) | 66 (4.6%) |
| $2,500 to $4,999 | 0 (0.0%) | 132 (9.2%) |
| $5,000 to $7,499 | 38 (3.2%) | 41 (2.9%) |
| $7,500 to $9,999 | 34 (2.8%) | 46 (3.2%) |
| $10,000 to $12,499 | 19 (1.6%) | 0 (0.0%) |
| $12,500 to $14,999 | 0 (0.0%) | 8 (0.6%) |
| $15,000 to $17,499 | 104 (8.7%) | 64 (4.4%) |
| $17,500 to $19,999 | 61 (5.1%) | 24 (1.7%) |
| $20,000 to $22,499 | 0 (0.0%) | 21 (1.5%) |
| $22,500 to $24,999 | 0 (0.0%) | 35 (2.4%) |
| $25,000 to $29,999 | 18 (1.5%) | 35 (2.4%) |
| $30,000 to $34,999 | 58 (4.9%) | 138 (9.6%) |
| $35,000 to $39,999 | 83 (6.9%) | 45 (3.1%) |
| $40,000 to $44,999 | 198 (16.6%) | 21 (1.5%) |
| $45,000 to $49,999 | 73 (6.1%) | 125 (8.7%) |
| $50,000 to $54,999 | 92 (7.7%) | 135 (9.4%) |
| $55,000 to $64,999 | 63 (5.3%) | 184 (12.8%) |
| $65,000 to $74,999 | 78 (6.5%) | 128 (8.9%) |
| $75,000 to $99,999 | 112 (9.4%) | 163 (11.3%) |
| $100,000+ | 113 (9.5%) | 26 (1.8%) |
| Total | 1,196 (100.0%) | 1,437 (100.0%) |
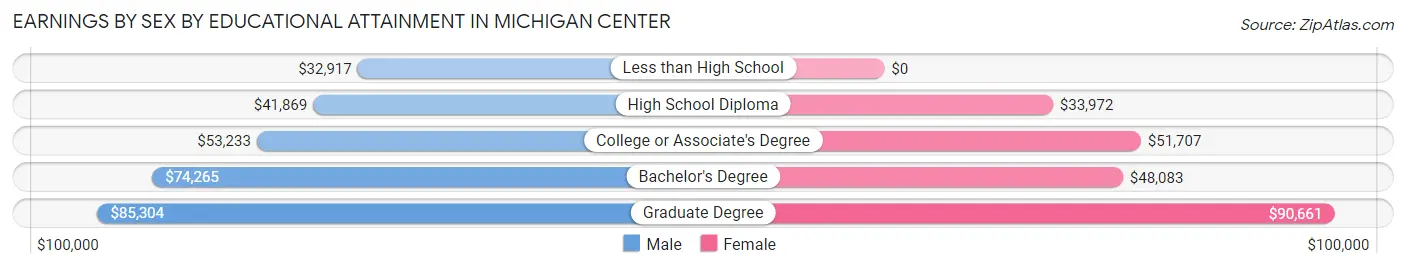
Earnings by Sex by Educational Attainment in Michigan Center
Average earnings in Michigan Center are $44,948 for men and $50,534 for women, a difference of 11.1%. Men with an educational attainment of graduate degree enjoy the highest average annual earnings of $85,304, while those with less than high school education earn the least with $32,917. Women with an educational attainment of graduate degree earn the most with the average annual earnings of $90,661, while those with high school diploma education have the smallest earnings of $33,972.
| Educational Attainment | Male Income | Female Income |
| Less than High School | $32,917 | $0 |
| High School Diploma | $41,869 | $33,972 |
| College or Associate's Degree | $53,233 | $51,707 |
| Bachelor's Degree | $74,265 | $48,083 |
| Graduate Degree | $85,304 | $90,661 |
| Total | $44,948 | $50,534 |
Family Income in Michigan Center
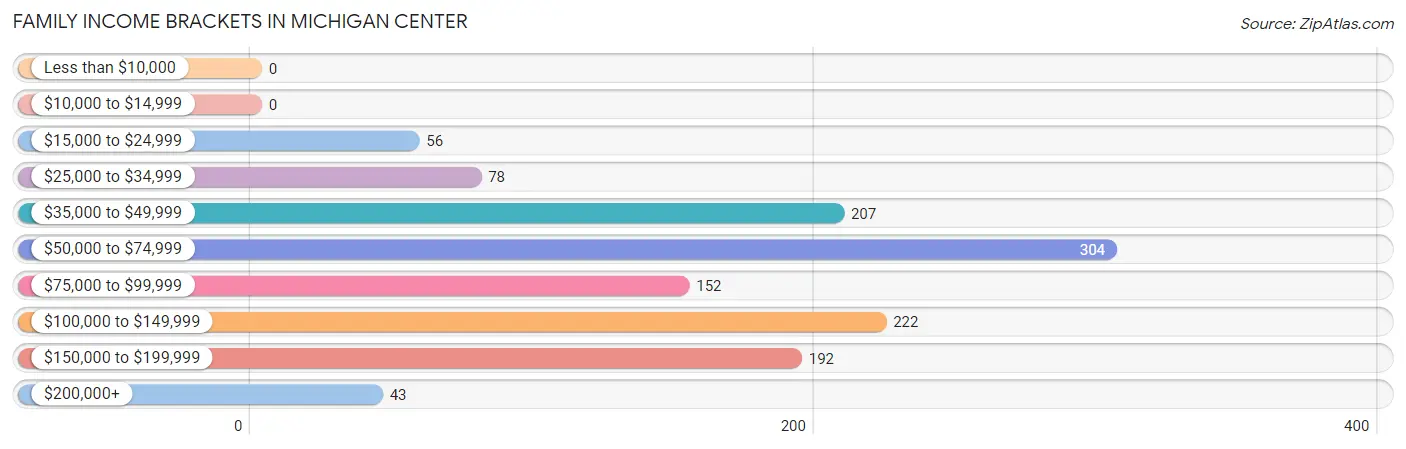
Family Income Brackets in Michigan Center
According to the Michigan Center family income data, there are 304 families falling into the $50,000 to $74,999 income range, which is the most common income bracket and makes up 24.2% of all families.
| Income Bracket | # Families | % Families |
| Less than $10,000 | 0 | 0.0% |
| $10,000 to $14,999 | 0 | 0.0% |
| $15,000 to $24,999 | 56 | 4.5% |
| $25,000 to $34,999 | 78 | 6.2% |
| $35,000 to $49,999 | 207 | 16.5% |
| $50,000 to $74,999 | 304 | 24.2% |
| $75,000 to $99,999 | 152 | 12.1% |
| $100,000 to $149,999 | 222 | 17.7% |
| $150,000 to $199,999 | 192 | 15.3% |
| $200,000+ | 43 | 3.4% |
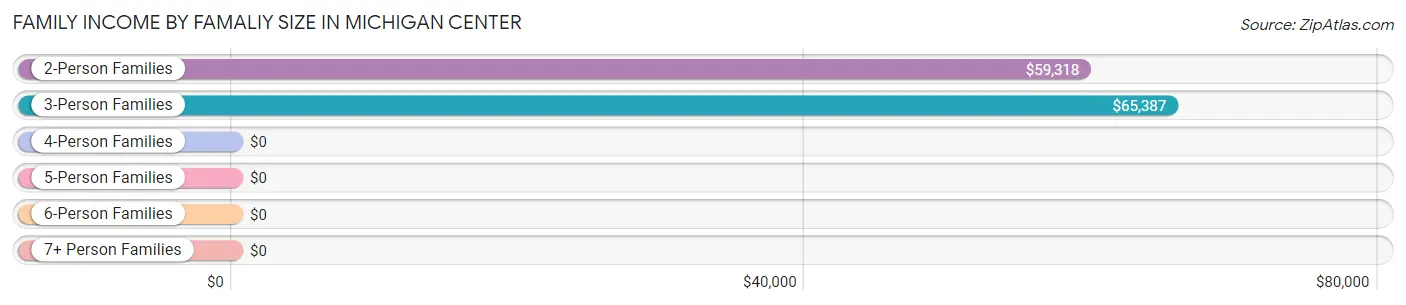
Family Income by Famaliy Size in Michigan Center
3-person families (409 | 32.6%) account for the highest median family income in Michigan Center with $65,387 per family, while 2-person families (658 | 52.4%) have the highest median income of $29,659 per family member.
| Income Bracket | # Families | Median Income |
| 2-Person Families | 658 (52.4%) | $59,318 |
| 3-Person Families | 409 (32.6%) | $65,387 |
| 4-Person Families | 86 (6.9%) | $0 |
| 5-Person Families | 75 (6.0%) | $0 |
| 6-Person Families | 0 (0.0%) | $0 |
| 7+ Person Families | 27 (2.1%) | $0 |
| Total | 1,255 (100.0%) | $69,922 |
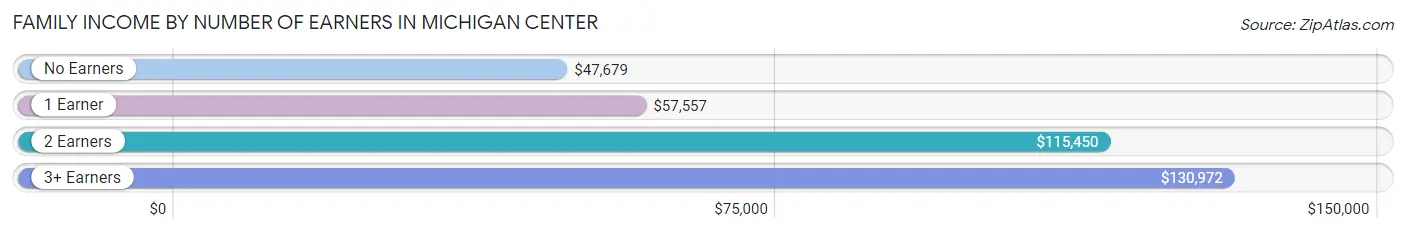
Family Income by Number of Earners in Michigan Center
The median family income in Michigan Center is $69,922, with families comprising 3+ earners (131) having the highest median family income of $130,972, while families with no earners (213) have the lowest median family income of $47,679, accounting for 10.4% and 17.0% of families, respectively.
| Number of Earners | # Families | Median Income |
| No Earners | 213 (17.0%) | $47,679 |
| 1 Earner | 504 (40.2%) | $57,557 |
| 2 Earners | 407 (32.4%) | $115,450 |
| 3+ Earners | 131 (10.4%) | $130,972 |
| Total | 1,255 (100.0%) | $69,922 |
Household Income in Michigan Center
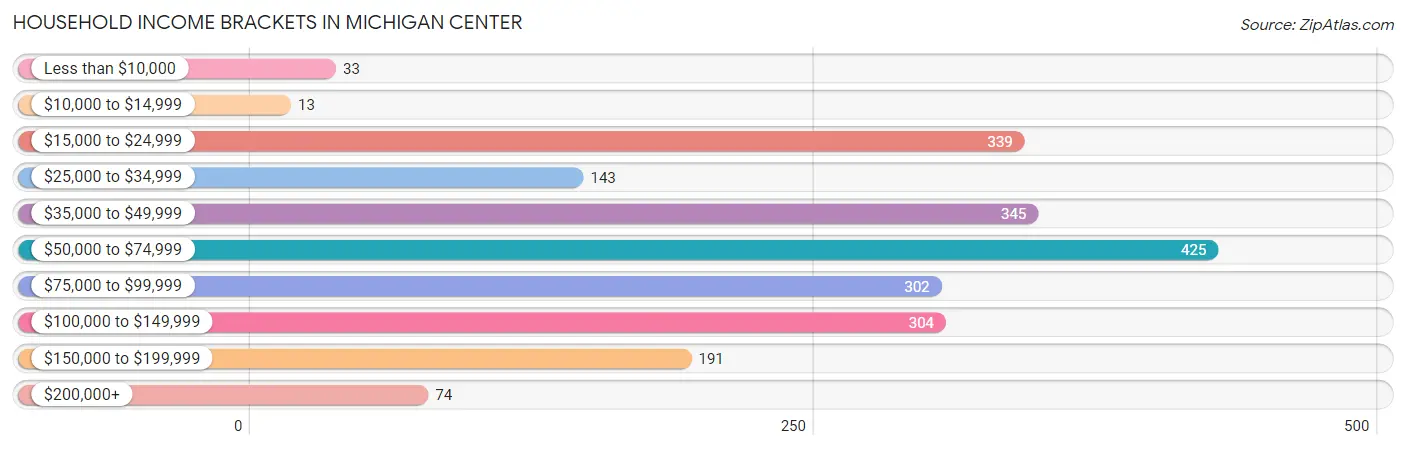
Household Income Brackets in Michigan Center
With 425 households falling in the category, the $50,000 to $74,999 income range is the most frequent in Michigan Center, accounting for 19.6% of all households. In contrast, only 13 households (0.6%) fall into the $10,000 to $14,999 income bracket, making it the least populous group.
| Income Bracket | # Households | % Households |
| Less than $10,000 | 33 | 1.5% |
| $10,000 to $14,999 | 13 | 0.6% |
| $15,000 to $24,999 | 339 | 15.6% |
| $25,000 to $34,999 | 143 | 6.6% |
| $35,000 to $49,999 | 345 | 15.9% |
| $50,000 to $74,999 | 425 | 19.6% |
| $75,000 to $99,999 | 302 | 13.9% |
| $100,000 to $149,999 | 304 | 14.0% |
| $150,000 to $199,999 | 191 | 8.8% |
| $200,000+ | 74 | 3.4% |
Household Income by Householder Age in Michigan Center
The median household income in Michigan Center is $64,286, with the highest median household income of $68,229 found in the 45 to 64 years age bracket for the primary householder. A total of 685 households (31.6%) fall into this category. Meanwhile, the 15 to 24 years age bracket for the primary householder has the lowest median household income of $0, with 66 households (3.0%) in this group.
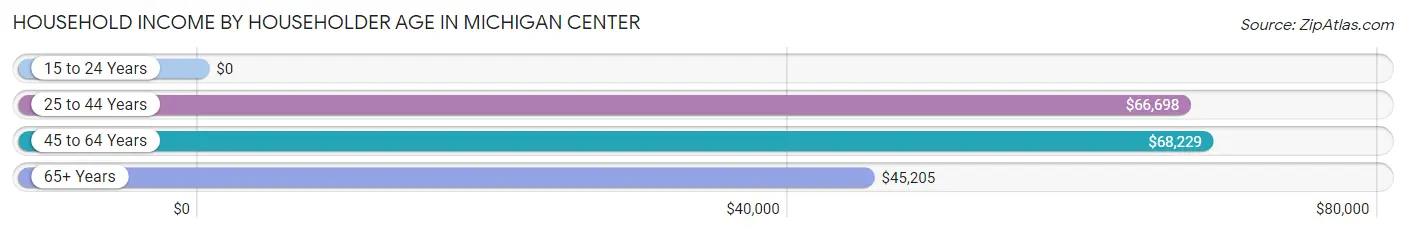
| Income Bracket | # Households | Median Income |
| 15 to 24 Years | 66 (3.0%) | $0 |
| 25 to 44 Years | 896 (41.3%) | $66,698 |
| 45 to 64 Years | 685 (31.6%) | $68,229 |
| 65+ Years | 523 (24.1%) | $45,205 |
| Total | 2,170 (100.0%) | $64,286 |
Poverty in Michigan Center
Income Below Poverty by Sex and Age in Michigan Center
With 5.8% poverty level for males and 2.7% for females among the residents of Michigan Center, 35 to 44 year old males and 65 to 74 year old females are the most vulnerable to poverty, with 56 males (19.9%) and 27 females (10.5%) in their respective age groups living below the poverty level.
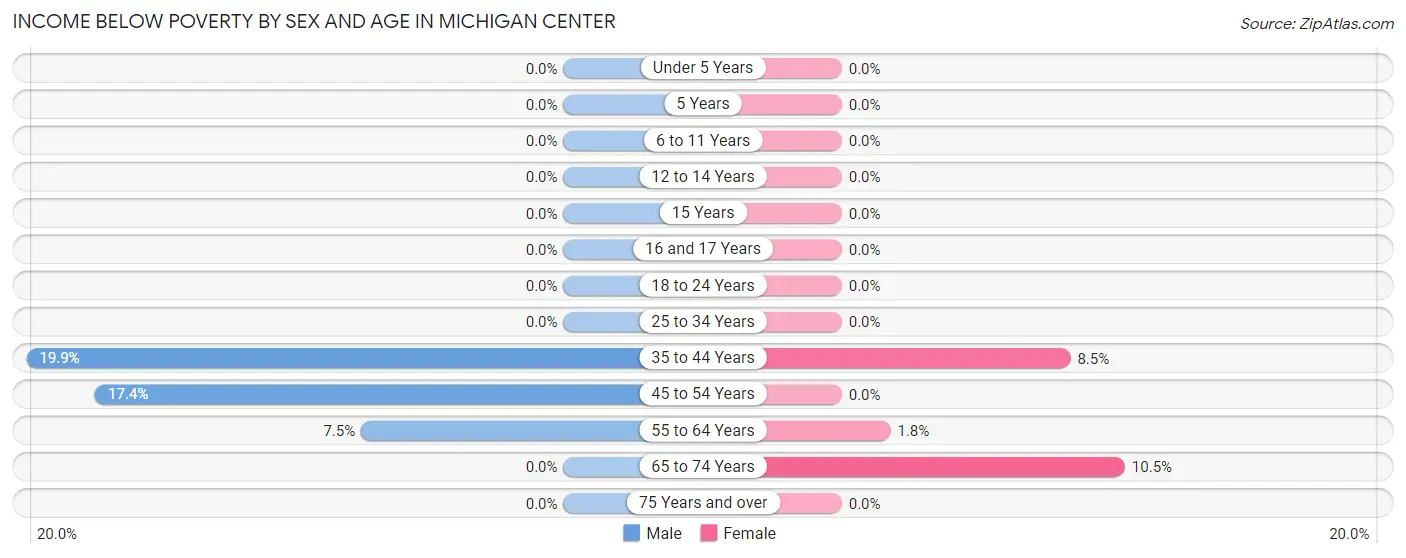
| Age Bracket | Male | Female |
| Under 5 Years | 0 (0.0%) | 0 (0.0%) |
| 5 Years | 0 (0.0%) | 0 (0.0%) |
| 6 to 11 Years | 0 (0.0%) | 0 (0.0%) |
| 12 to 14 Years | 0 (0.0%) | 0 (0.0%) |
| 15 Years | 0 (0.0%) | 0 (0.0%) |
| 16 and 17 Years | 0 (0.0%) | 0 (0.0%) |
| 18 to 24 Years | 0 (0.0%) | 0 (0.0%) |
| 25 to 34 Years | 0 (0.0%) | 0 (0.0%) |
| 35 to 44 Years | 56 (19.9%) | 36 (8.5%) |
| 45 to 54 Years | 53 (17.4%) | 0 (0.0%) |
| 55 to 64 Years | 29 (7.5%) | 6 (1.8%) |
| 65 to 74 Years | 0 (0.0%) | 27 (10.5%) |
| 75 Years and over | 0 (0.0%) | 0 (0.0%) |
| Total | 138 (5.8%) | 69 (2.7%) |
Income Above Poverty by Sex and Age in Michigan Center
According to the poverty statistics in Michigan Center, males aged under 5 years and females aged under 5 years are the age groups that are most secure financially, with 100.0% of males and 100.0% of females in these age groups living above the poverty line.
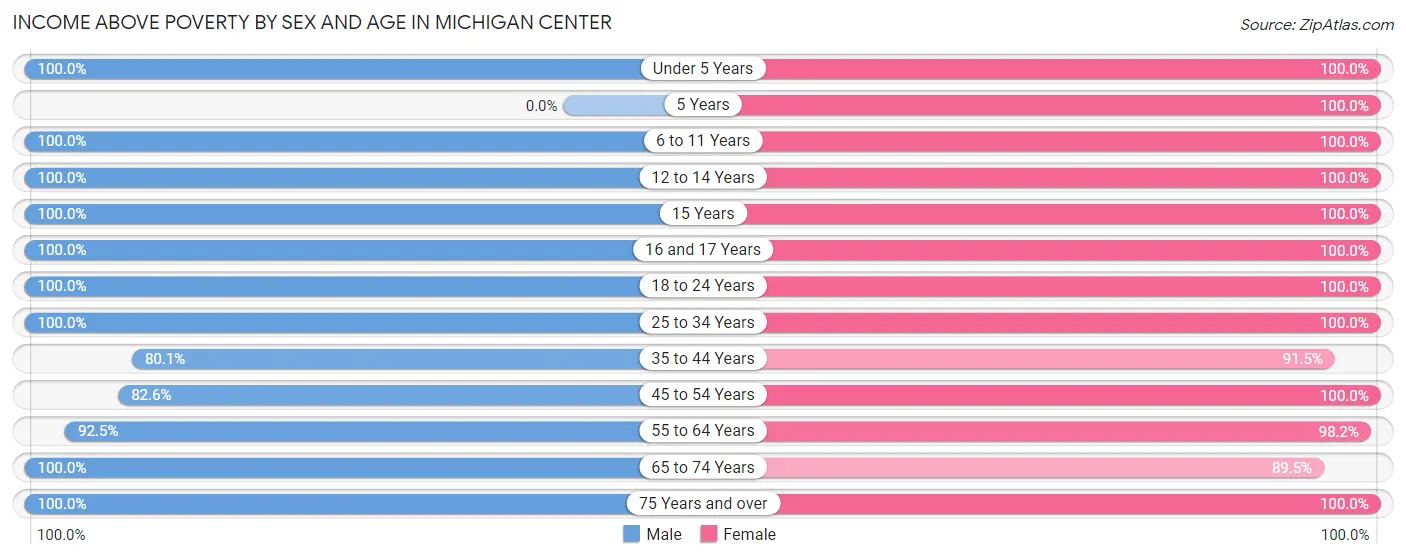
| Age Bracket | Male | Female |
| Under 5 Years | 178 (100.0%) | 64 (100.0%) |
| 5 Years | 0 (0.0%) | 27 (100.0%) |
| 6 to 11 Years | 226 (100.0%) | 221 (100.0%) |
| 12 to 14 Years | 80 (100.0%) | 105 (100.0%) |
| 15 Years | 8 (100.0%) | 14 (100.0%) |
| 16 and 17 Years | 55 (100.0%) | 44 (100.0%) |
| 18 to 24 Years | 277 (100.0%) | 213 (100.0%) |
| 25 to 34 Years | 243 (100.0%) | 383 (100.0%) |
| 35 to 44 Years | 225 (80.1%) | 388 (91.5%) |
| 45 to 54 Years | 252 (82.6%) | 254 (100.0%) |
| 55 to 64 Years | 357 (92.5%) | 325 (98.2%) |
| 65 to 74 Years | 275 (100.0%) | 230 (89.5%) |
| 75 Years and over | 78 (100.0%) | 177 (100.0%) |
| Total | 2,254 (94.2%) | 2,445 (97.3%) |
Income Below Poverty Among Married-Couple Families in Michigan Center
The poverty statistics for married-couple families in Michigan Center show that 5.6% or 45 of the total 800 families live below the poverty line. Families with no children have the highest poverty rate of 8.0%, comprising of 45 families. On the other hand, families with 1 or 2 children have the lowest poverty rate of 0.0%, which includes 0 families.
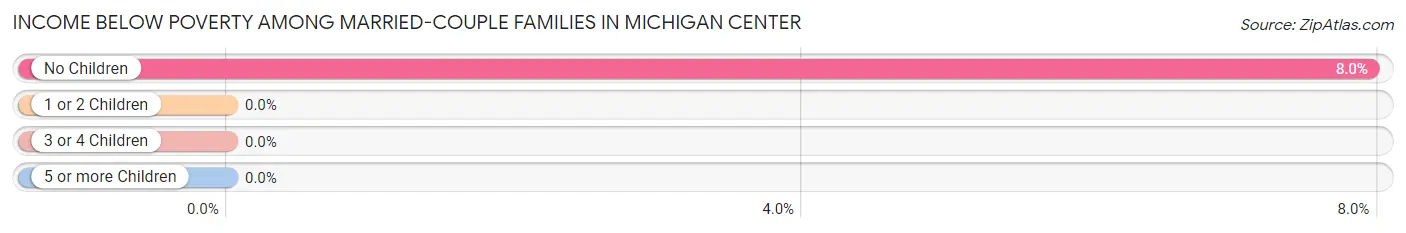
| Children | Above Poverty | Below Poverty |
| No Children | 521 (92.0%) | 45 (8.0%) |
| 1 or 2 Children | 169 (100.0%) | 0 (0.0%) |
| 3 or 4 Children | 38 (100.0%) | 0 (0.0%) |
| 5 or more Children | 27 (100.0%) | 0 (0.0%) |
| Total | 755 (94.4%) | 45 (5.6%) |
Income Below Poverty Among Single-Parent Households in Michigan Center
| Children | Single Father | Single Mother |
| No Children | 0 (0.0%) | 0 (0.0%) |
| 1 or 2 Children | 0 (0.0%) | 0 (0.0%) |
| 3 or 4 Children | 0 (0.0%) | 0 (0.0%) |
| 5 or more Children | 0 (0.0%) | 0 (0.0%) |
| Total | 0 (0.0%) | 0 (0.0%) |
Income Below Poverty Among Married-Couple vs Single-Parent Households in Michigan Center
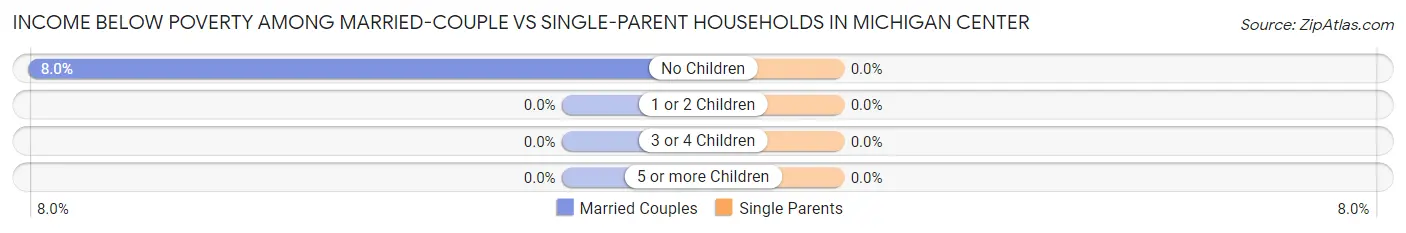
| Children | Married-Couple Families | Single-Parent Households |
| No Children | 45 (8.0%) | 0 (0.0%) |
| 1 or 2 Children | 0 (0.0%) | 0 (0.0%) |
| 3 or 4 Children | 0 (0.0%) | 0 (0.0%) |
| 5 or more Children | 0 (0.0%) | 0 (0.0%) |
| Total | 45 (5.6%) | 0 (0.0%) |
Race in Michigan Center
The most populous races in Michigan Center are White / Caucasian (4,529 | 92.3%), Two or more Races (287 | 5.9%), and Hispanic or Latino (174 | 3.5%).
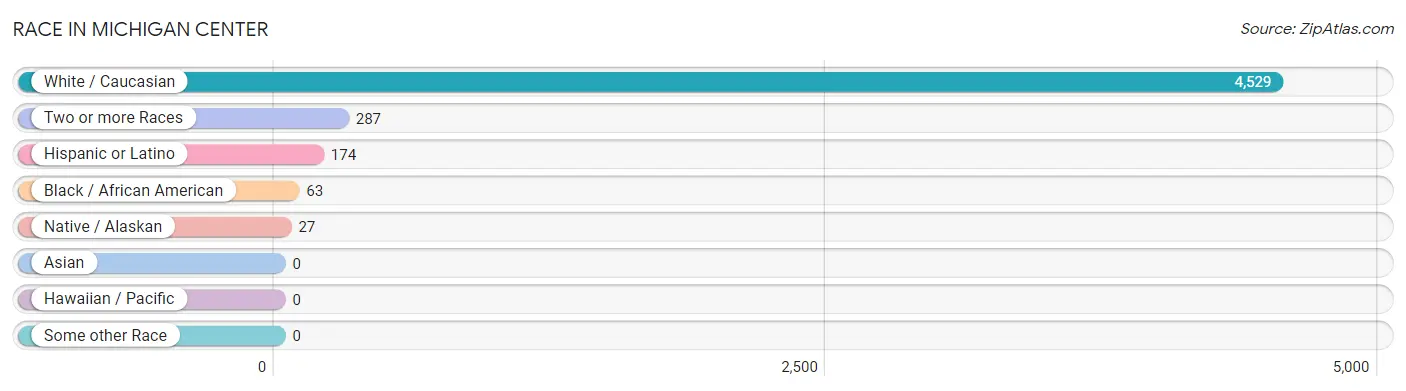
| Race | # Population | % Population |
| Asian | 0 | 0.0% |
| Black / African American | 63 | 1.3% |
| Hawaiian / Pacific | 0 | 0.0% |
| Hispanic or Latino | 174 | 3.5% |
| Native / Alaskan | 27 | 0.5% |
| White / Caucasian | 4,529 | 92.3% |
| Two or more Races | 287 | 5.9% |
| Some other Race | 0 | 0.0% |
| Total | 4,906 | 100.0% |
Ancestry in Michigan Center
The most populous ancestries reported in Michigan Center are English (1,292 | 26.3%), Irish (786 | 16.0%), German (785 | 16.0%), American (466 | 9.5%), and French (300 | 6.1%), together accounting for 74.0% of all Michigan Center residents.
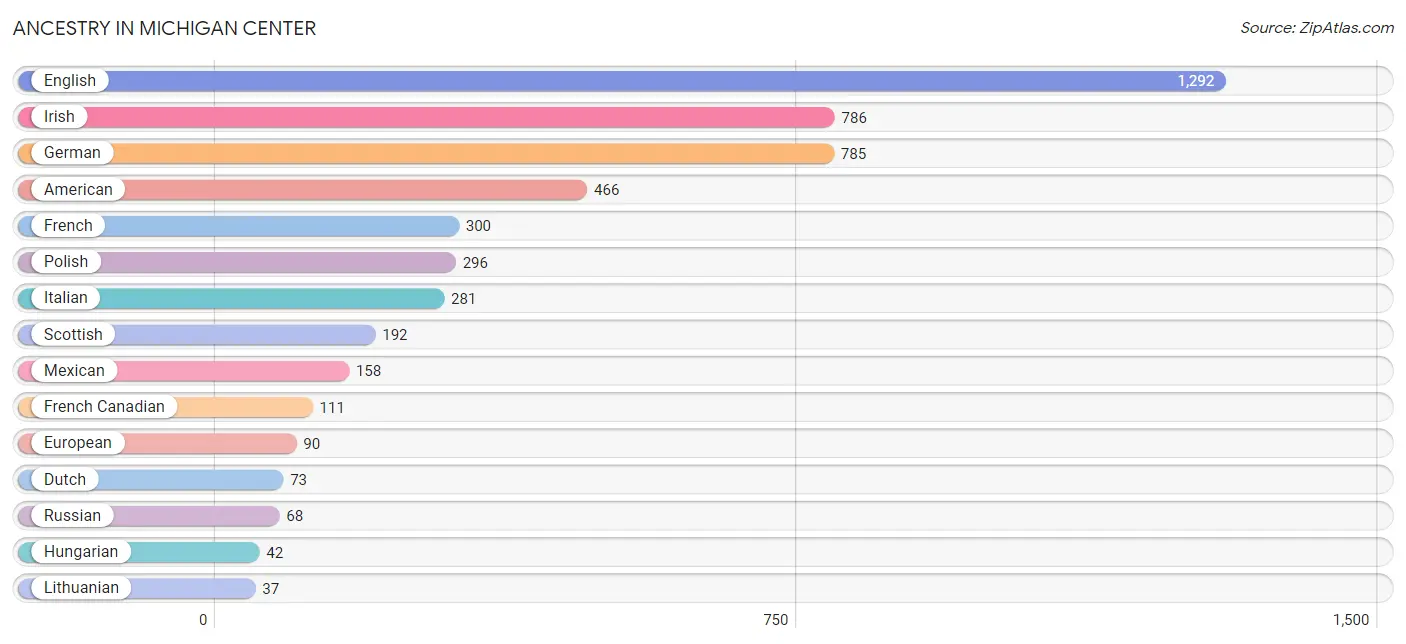
| Ancestry | # Population | % Population |
| American | 466 | 9.5% |
| Apache | 27 | 0.5% |
| Brazilian | 10 | 0.2% |
| Canadian | 12 | 0.2% |
| Cherokee | 27 | 0.5% |
| Dutch | 73 | 1.5% |
| Eastern European | 8 | 0.2% |
| English | 1,292 | 26.3% |
| European | 90 | 1.8% |
| French | 300 | 6.1% |
| French Canadian | 111 | 2.3% |
| German | 785 | 16.0% |
| Hungarian | 42 | 0.9% |
| Irish | 786 | 16.0% |
| Italian | 281 | 5.7% |
| Lithuanian | 37 | 0.7% |
| Mexican | 158 | 3.2% |
| Norwegian | 6 | 0.1% |
| Polish | 296 | 6.0% |
| Puerto Rican | 10 | 0.2% |
| Russian | 68 | 1.4% |
| Scandinavian | 10 | 0.2% |
| Scottish | 192 | 3.9% |
| Sioux | 27 | 0.5% |
| Spanish | 6 | 0.1% |
| Welsh | 6 | 0.1% | View All 26 Rows |
Immigrants in Michigan Center
The most numerous immigrant groups reported in Michigan Center came from Europe (42 | 0.9%), Germany (42 | 0.9%), Western Europe (42 | 0.9%), and Canada (28 | 0.6%), together accounting for 3.2% of all Michigan Center residents.
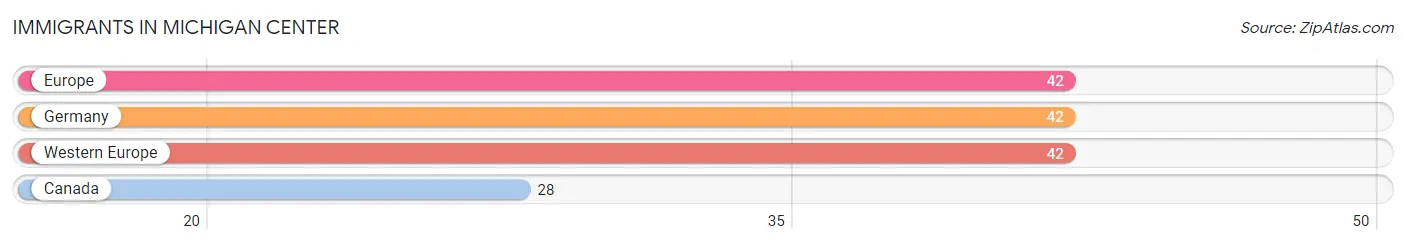
| Immigration Origin | # Population | % Population |
| Canada | 28 | 0.6% |
| Europe | 42 | 0.9% |
| Germany | 42 | 0.9% |
| Western Europe | 42 | 0.9% | View All 4 Rows |
Sex and Age in Michigan Center
Sex and Age in Michigan Center
The most populous age groups in Michigan Center are 55 to 59 Years (290 | 12.1%) for men and 40 to 44 Years (296 | 11.8%) for women.
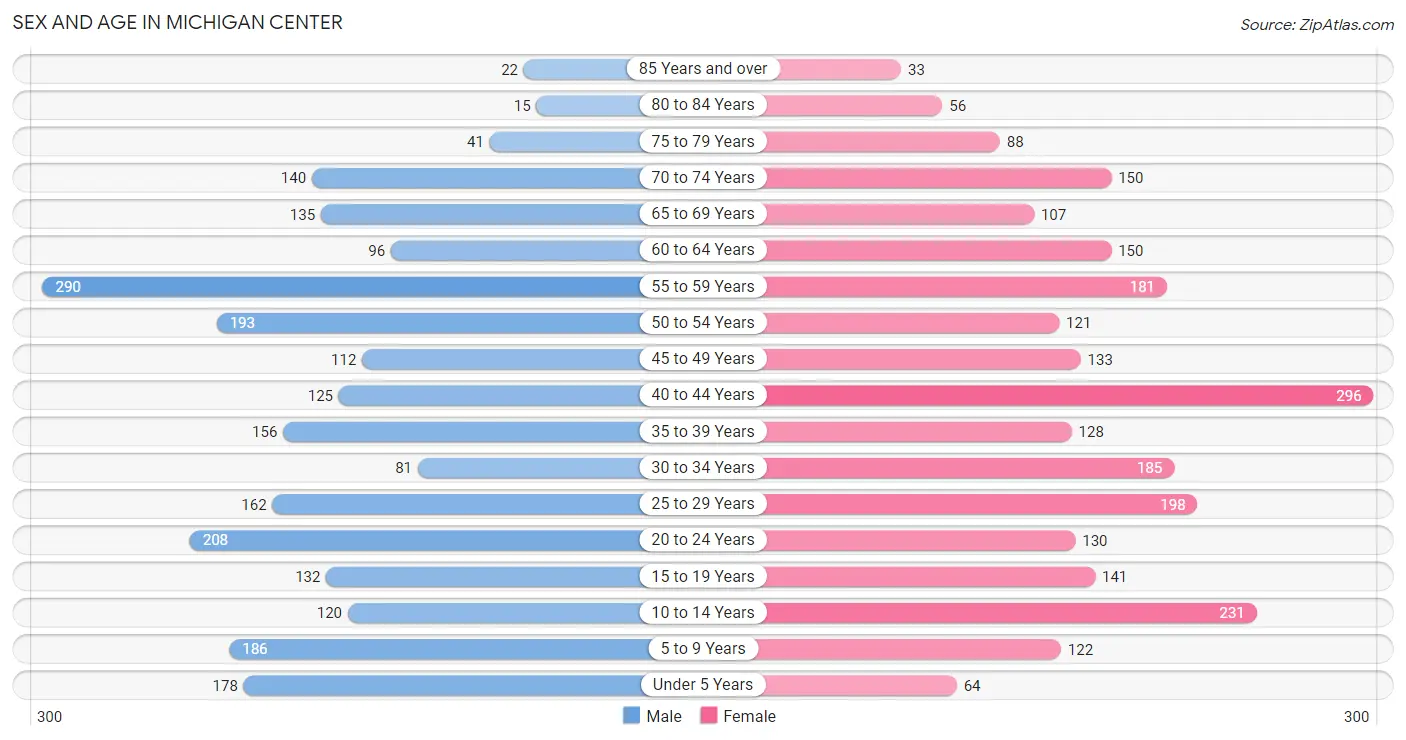
| Age Bracket | Male | Female |
| Under 5 Years | 178 (7.4%) | 64 (2.5%) |
| 5 to 9 Years | 186 (7.8%) | 122 (4.9%) |
| 10 to 14 Years | 120 (5.0%) | 231 (9.2%) |
| 15 to 19 Years | 132 (5.5%) | 141 (5.6%) |
| 20 to 24 Years | 208 (8.7%) | 130 (5.2%) |
| 25 to 29 Years | 162 (6.8%) | 198 (7.9%) |
| 30 to 34 Years | 81 (3.4%) | 185 (7.4%) |
| 35 to 39 Years | 156 (6.5%) | 128 (5.1%) |
| 40 to 44 Years | 125 (5.2%) | 296 (11.8%) |
| 45 to 49 Years | 112 (4.7%) | 133 (5.3%) |
| 50 to 54 Years | 193 (8.1%) | 121 (4.8%) |
| 55 to 59 Years | 290 (12.1%) | 181 (7.2%) |
| 60 to 64 Years | 96 (4.0%) | 150 (6.0%) |
| 65 to 69 Years | 135 (5.6%) | 107 (4.3%) |
| 70 to 74 Years | 140 (5.9%) | 150 (6.0%) |
| 75 to 79 Years | 41 (1.7%) | 88 (3.5%) |
| 80 to 84 Years | 15 (0.6%) | 56 (2.2%) |
| 85 Years and over | 22 (0.9%) | 33 (1.3%) |
| Total | 2,392 (100.0%) | 2,514 (100.0%) |
Families and Households in Michigan Center
Median Family Size in Michigan Center
The median family size in Michigan Center is 2.95 persons per family, with married-couple families (800 | 63.7%) accounting for the largest median family size of 3.11 persons per family. On the other hand, single male/father families (151 | 12.0%) represent the smallest median family size with 2.50 persons per family.
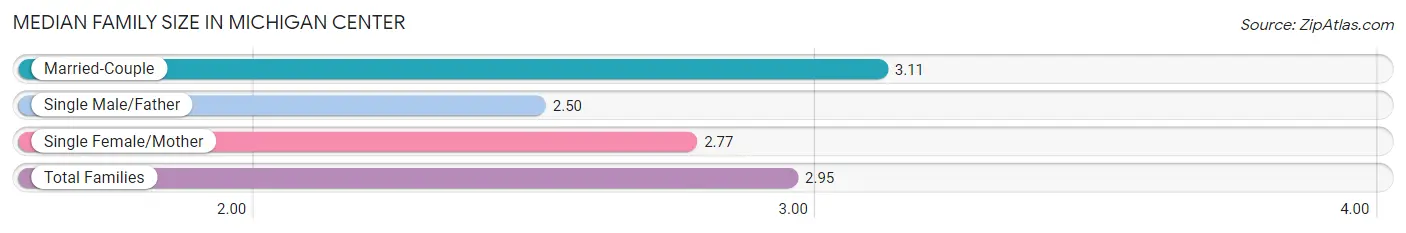
| Family Type | # Families | Family Size |
| Married-Couple | 800 (63.7%) | 3.11 |
| Single Male/Father | 151 (12.0%) | 2.50 |
| Single Female/Mother | 304 (24.2%) | 2.77 |
| Total Families | 1,255 (100.0%) | 2.95 |
Median Household Size in Michigan Center
The median household size in Michigan Center is 2.26 persons per household, with married-couple households (800 | 36.9%) accounting for the largest median household size of 3.11 persons per household. non-family households (915 | 42.2%) represent the smallest median household size with 1.22 persons per household.
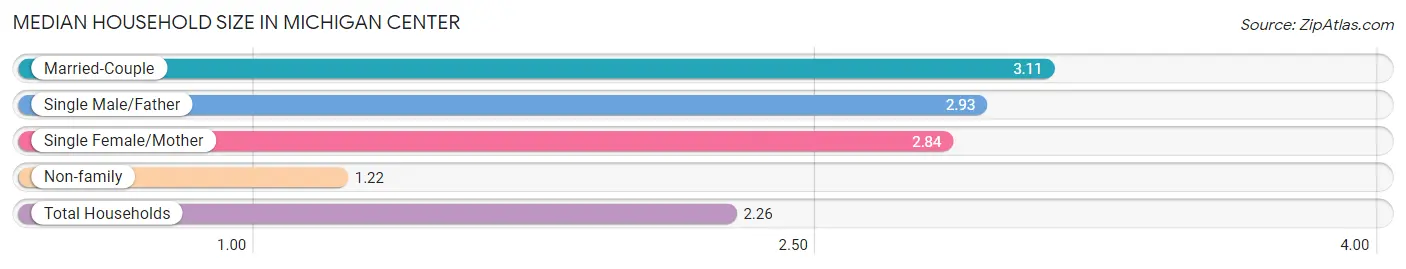
| Household Type | # Households | Household Size |
| Married-Couple | 800 (36.9%) | 3.11 |
| Single Male/Father | 151 (7.0%) | 2.93 |
| Single Female/Mother | 304 (14.0%) | 2.84 |
| Non-family | 915 (42.2%) | 1.22 |
| Total Households | 2,170 (100.0%) | 2.26 |
Household Size by Marriage Status in Michigan Center
Out of a total of 2,170 households in Michigan Center, 1,255 (57.8%) are family households, while 915 (42.2%) are nonfamily households. The most numerous type of family households are 2-person households, comprising 614, and the most common type of nonfamily households are 1-person households, comprising 788.
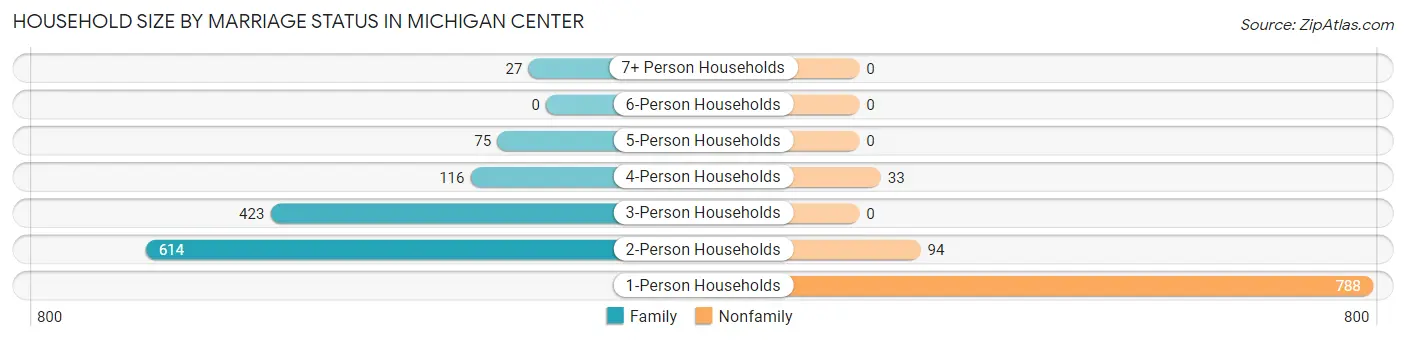
| Household Size | Family Households | Nonfamily Households |
| 1-Person Households | - | 788 (36.3%) |
| 2-Person Households | 614 (28.3%) | 94 (4.3%) |
| 3-Person Households | 423 (19.5%) | 0 (0.0%) |
| 4-Person Households | 116 (5.3%) | 33 (1.5%) |
| 5-Person Households | 75 (3.5%) | 0 (0.0%) |
| 6-Person Households | 0 (0.0%) | 0 (0.0%) |
| 7+ Person Households | 27 (1.2%) | 0 (0.0%) |
| Total | 1,255 (57.8%) | 915 (42.2%) |
Female Fertility in Michigan Center
Fertility by Age in Michigan Center
Average fertility rate in Michigan Center is 51.0 births per 1,000 women. Women in the age bracket of 20 to 34 years have the highest fertility rate with 125.0 births per 1,000 women. Women in the age bracket of 20 to 34 years acount for 100.0% of all women with births.
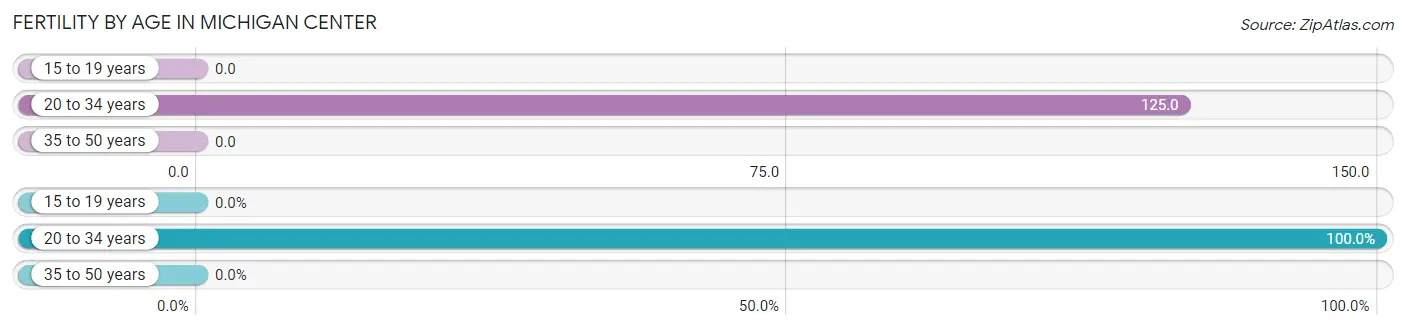
| Age Bracket | Women with Births | Births / 1,000 Women |
| 15 to 19 years | 0 (0.0%) | 0.0 |
| 20 to 34 years | 64 (100.0%) | 125.0 |
| 35 to 50 years | 0 (0.0%) | 0.0 |
| Total | 64 (100.0%) | 51.0 |
Fertility by Age by Marriage Status in Michigan Center
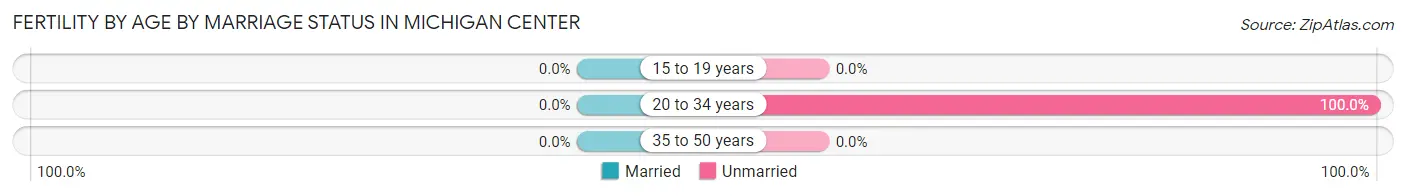
| Age Bracket | Married | Unmarried |
| 15 to 19 years | 0 (0.0%) | 0 (0.0%) |
| 20 to 34 years | 0 (0.0%) | 64 (100.0%) |
| 35 to 50 years | 0 (0.0%) | 0 (0.0%) |
| Total | 0 (0.0%) | 64 (100.0%) |
Fertility by Education in Michigan Center
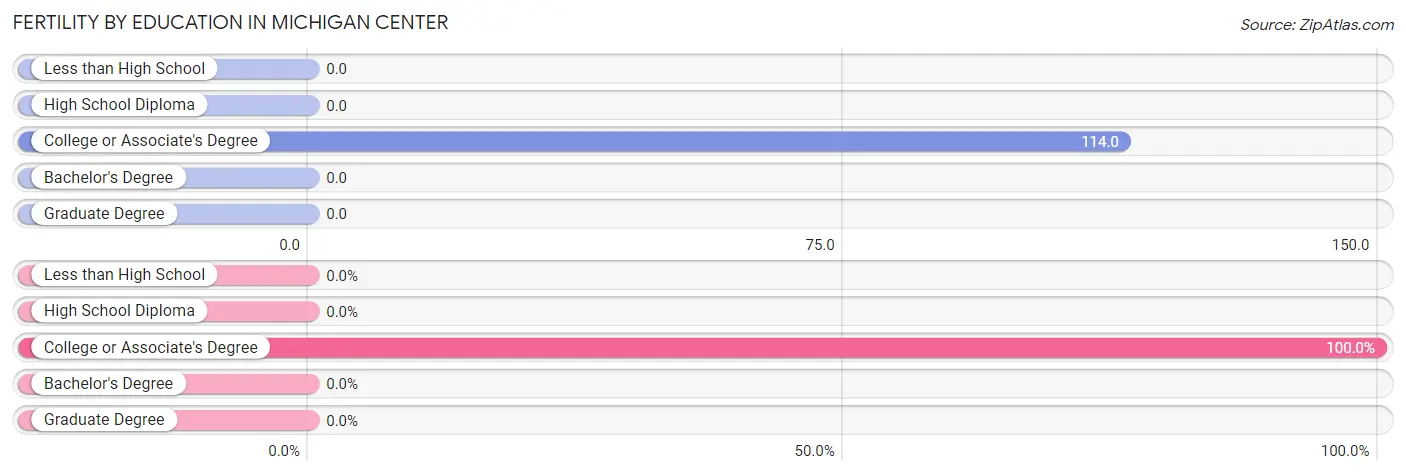
| Educational Attainment | Women with Births | Births / 1,000 Women |
| Less than High School | 0 (0.0%) | 0.0 |
| High School Diploma | 0 (0.0%) | 0.0 |
| College or Associate's Degree | 64 (100.0%) | 114.0 |
| Bachelor's Degree | 0 (0.0%) | 0.0 |
| Graduate Degree | 0 (0.0%) | 0.0 |
| Total | 64 (100.0%) | 51.0 |
Fertility by Education by Marriage Status in Michigan Center
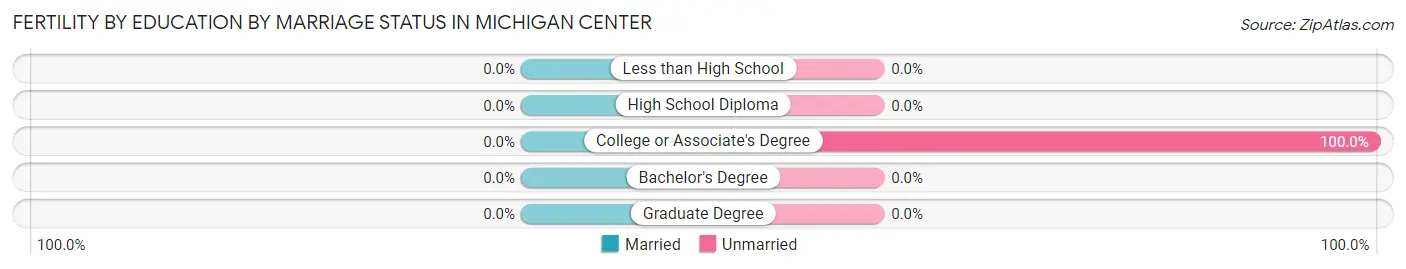
| Educational Attainment | Married | Unmarried |
| Less than High School | 0 (0.0%) | 0 (0.0%) |
| High School Diploma | 0 (0.0%) | 0 (0.0%) |
| College or Associate's Degree | 0 (0.0%) | 64 (100.0%) |
| Bachelor's Degree | 0 (0.0%) | 0 (0.0%) |
| Graduate Degree | 0 (0.0%) | 0 (0.0%) |
| Total | 0 (0.0%) | 64 (100.0%) |
Employment Characteristics in Michigan Center
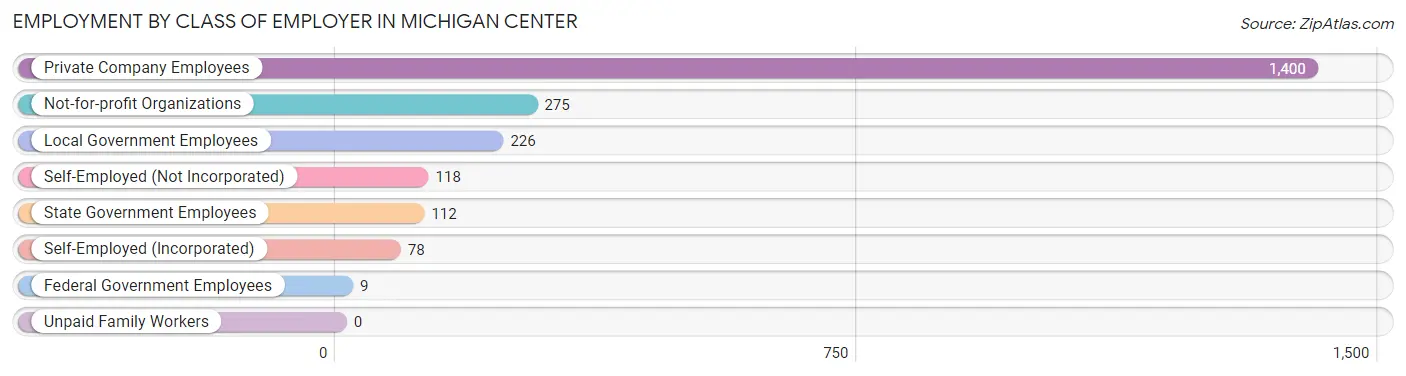
Employment by Class of Employer in Michigan Center
Among the 2,218 employed individuals in Michigan Center, private company employees (1,400 | 63.1%), not-for-profit organizations (275 | 12.4%), and local government employees (226 | 10.2%) make up the most common classes of employment.
| Employer Class | # Employees | % Employees |
| Private Company Employees | 1,400 | 63.1% |
| Self-Employed (Incorporated) | 78 | 3.5% |
| Self-Employed (Not Incorporated) | 118 | 5.3% |
| Not-for-profit Organizations | 275 | 12.4% |
| Local Government Employees | 226 | 10.2% |
| State Government Employees | 112 | 5.1% |
| Federal Government Employees | 9 | 0.4% |
| Unpaid Family Workers | 0 | 0.0% |
| Total | 2,218 | 100.0% |
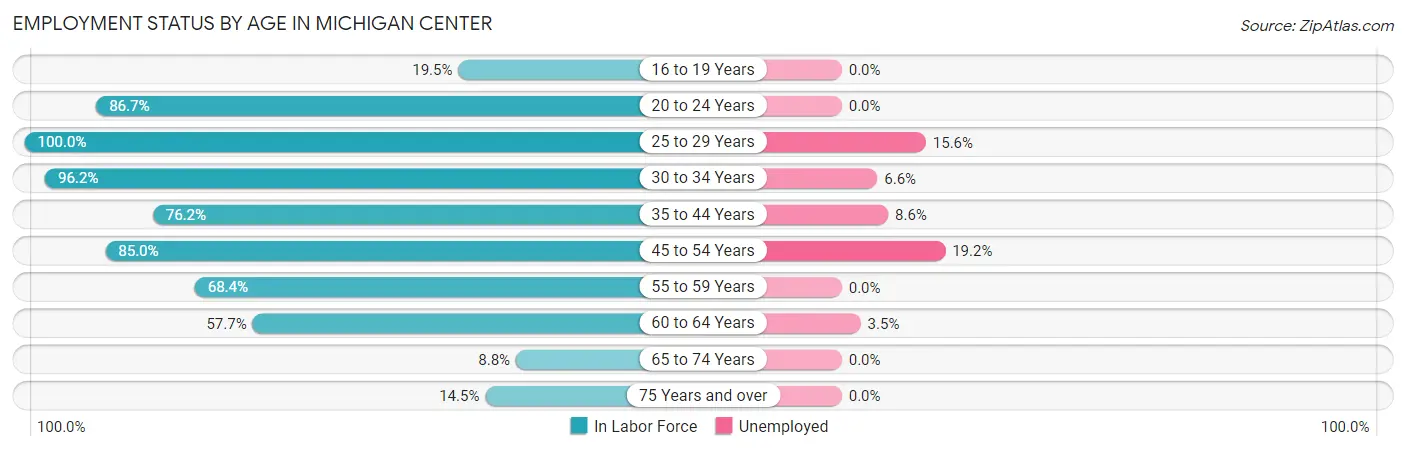
Employment Status by Age in Michigan Center
According to the labor force statistics for Michigan Center, out of the total population over 16 years of age (3,983), 63.2% or 2,517 individuals are in the labor force, with 8.5% or 214 of them unemployed. The age group with the highest labor force participation rate is 25 to 29 years, with 100.0% or 360 individuals in the labor force. Within the labor force, the 45 to 54 years age range has the highest percentage of unemployed individuals, with 19.2% or 91 of them being unemployed.
| Age Bracket | In Labor Force | Unemployed |
| 16 to 19 Years | 49 (19.5%) | 0 (0.0%) |
| 20 to 24 Years | 293 (86.7%) | 0 (0.0%) |
| 25 to 29 Years | 360 (100.0%) | 56 (15.6%) |
| 30 to 34 Years | 256 (96.2%) | 17 (6.6%) |
| 35 to 44 Years | 537 (76.2%) | 46 (8.6%) |
| 45 to 54 Years | 475 (85.0%) | 91 (19.2%) |
| 55 to 59 Years | 322 (68.4%) | 0 (0.0%) |
| 60 to 64 Years | 142 (57.7%) | 5 (3.5%) |
| 65 to 74 Years | 47 (8.8%) | 0 (0.0%) |
| 75 Years and over | 37 (14.5%) | 0 (0.0%) |
| Total | 2,517 (63.2%) | 214 (8.5%) |
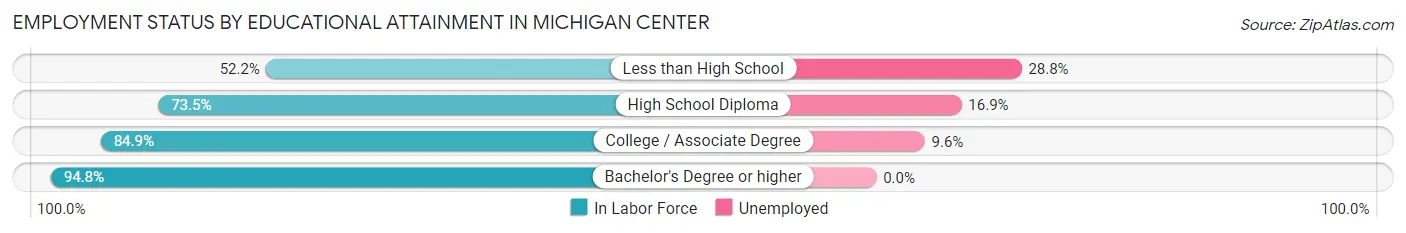
Employment Status by Educational Attainment in Michigan Center
According to labor force statistics for Michigan Center, 80.2% of individuals (2,091) out of the total population between 25 and 64 years of age (2,607) are in the labor force, with 10.3% or 215 of them being unemployed. The group with the highest labor force participation rate are those with the educational attainment of bachelor's degree or higher, with 94.8% or 578 individuals in the labor force. Within the labor force, individuals with less than high school education have the highest percentage of unemployment, with 28.8% or 44 of them being unemployed.
| Educational Attainment | In Labor Force | Unemployed |
| Less than High School | 153 (52.2%) | 84 (28.8%) |
| High School Diploma | 556 (73.5%) | 128 (16.9%) |
| College / Associate Degree | 805 (84.9%) | 91 (9.6%) |
| Bachelor's Degree or higher | 578 (94.8%) | 0 (0.0%) |
| Total | 2,091 (80.2%) | 269 (10.3%) |
Employment Occupations by Sex in Michigan Center
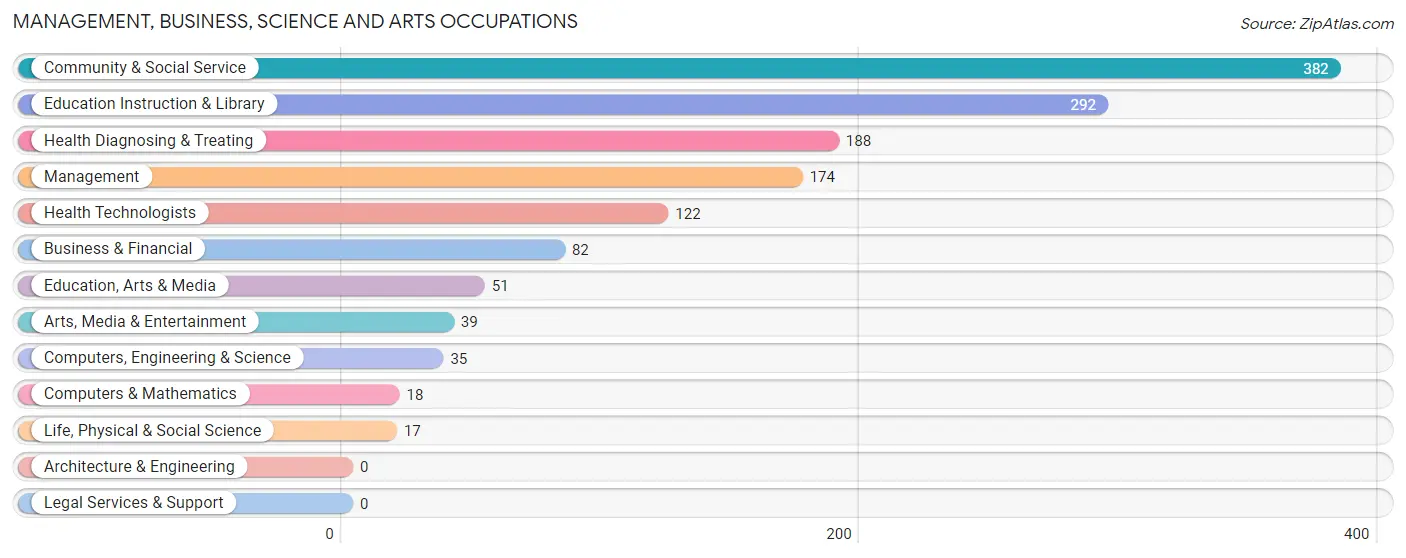
Management, Business, Science and Arts Occupations
The most common Management, Business, Science and Arts occupations in Michigan Center are Community & Social Service (382 | 16.6%), Education Instruction & Library (292 | 12.7%), Health Diagnosing & Treating (188 | 8.2%), Management (174 | 7.6%), and Health Technologists (122 | 5.3%).
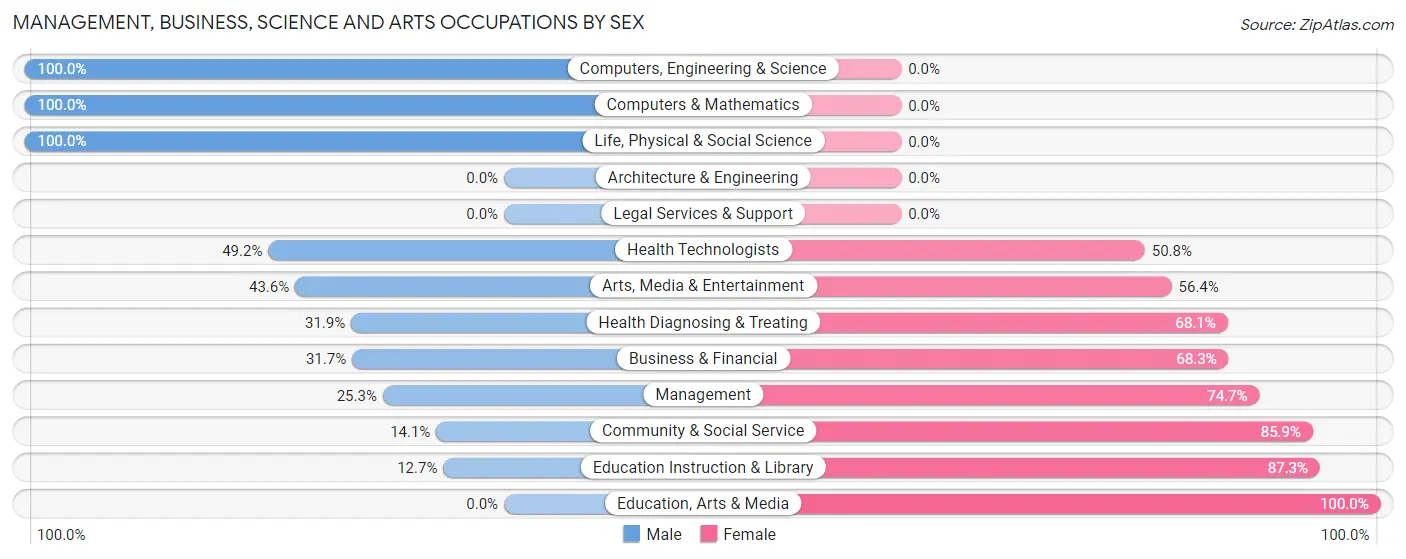
Management, Business, Science and Arts Occupations by Sex
Within the Management, Business, Science and Arts occupations in Michigan Center, the most male-oriented occupations are Computers, Engineering & Science (100.0%), Computers & Mathematics (100.0%), and Life, Physical & Social Science (100.0%), while the most female-oriented occupations are Education, Arts & Media (100.0%), Education Instruction & Library (87.3%), and Community & Social Service (85.9%).
| Occupation | Male | Female |
| Management | 44 (25.3%) | 130 (74.7%) |
| Business & Financial | 26 (31.7%) | 56 (68.3%) |
| Computers, Engineering & Science | 35 (100.0%) | 0 (0.0%) |
| Computers & Mathematics | 18 (100.0%) | 0 (0.0%) |
| Architecture & Engineering | 0 (0.0%) | 0 (0.0%) |
| Life, Physical & Social Science | 17 (100.0%) | 0 (0.0%) |
| Community & Social Service | 54 (14.1%) | 328 (85.9%) |
| Education, Arts & Media | 0 (0.0%) | 51 (100.0%) |
| Legal Services & Support | 0 (0.0%) | 0 (0.0%) |
| Education Instruction & Library | 37 (12.7%) | 255 (87.3%) |
| Arts, Media & Entertainment | 17 (43.6%) | 22 (56.4%) |
| Health Diagnosing & Treating | 60 (31.9%) | 128 (68.1%) |
| Health Technologists | 60 (49.2%) | 62 (50.8%) |
| Total (Category) | 219 (25.4%) | 642 (74.6%) |
| Total (Overall) | 1,042 (45.3%) | 1,261 (54.7%) |
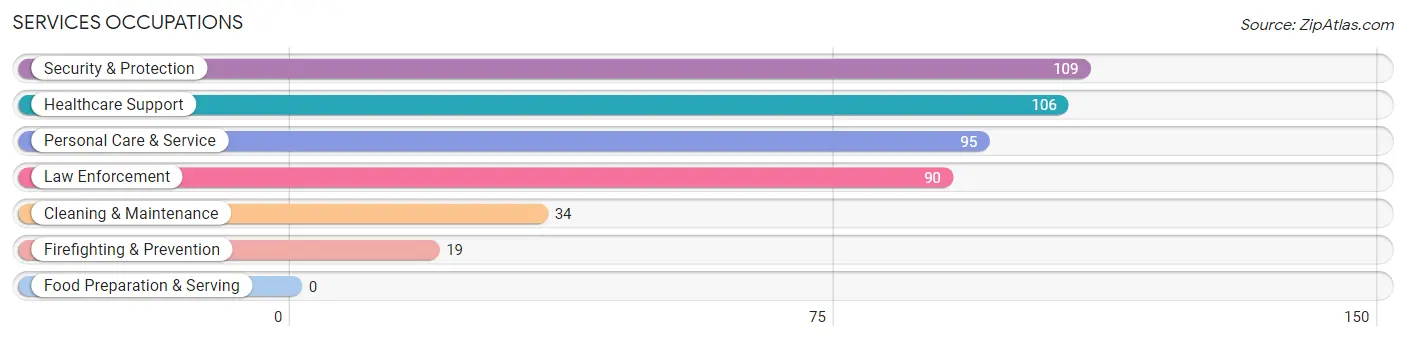
Services Occupations
The most common Services occupations in Michigan Center are Security & Protection (109 | 4.7%), Healthcare Support (106 | 4.6%), Personal Care & Service (95 | 4.1%), Law Enforcement (90 | 3.9%), and Cleaning & Maintenance (34 | 1.5%).
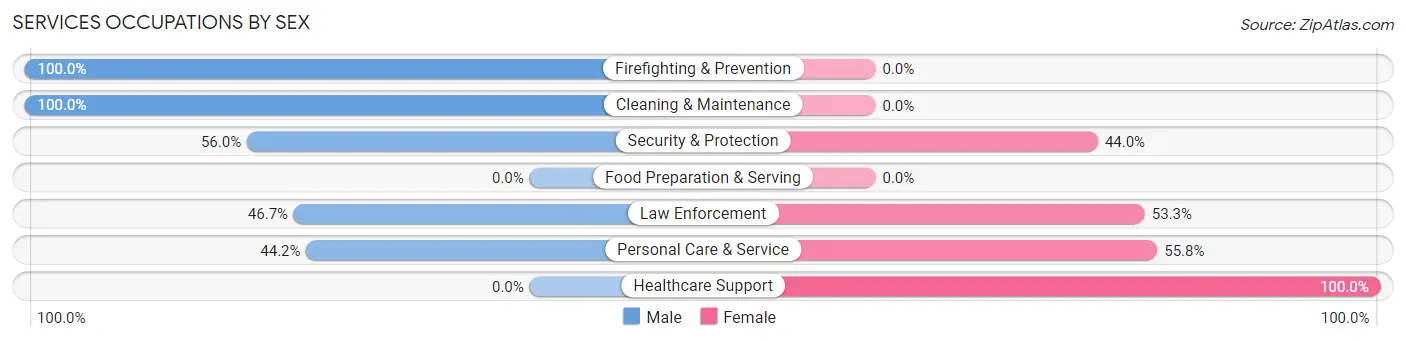
Services Occupations by Sex
Within the Services occupations in Michigan Center, the most male-oriented occupations are Firefighting & Prevention (100.0%), Cleaning & Maintenance (100.0%), and Security & Protection (56.0%), while the most female-oriented occupations are Healthcare Support (100.0%), Personal Care & Service (55.8%), and Law Enforcement (53.3%).
| Occupation | Male | Female |
| Healthcare Support | 0 (0.0%) | 106 (100.0%) |
| Security & Protection | 61 (56.0%) | 48 (44.0%) |
| Firefighting & Prevention | 19 (100.0%) | 0 (0.0%) |
| Law Enforcement | 42 (46.7%) | 48 (53.3%) |
| Food Preparation & Serving | 0 (0.0%) | 0 (0.0%) |
| Cleaning & Maintenance | 34 (100.0%) | 0 (0.0%) |
| Personal Care & Service | 42 (44.2%) | 53 (55.8%) |
| Total (Category) | 137 (39.8%) | 207 (60.2%) |
| Total (Overall) | 1,042 (45.3%) | 1,261 (54.7%) |
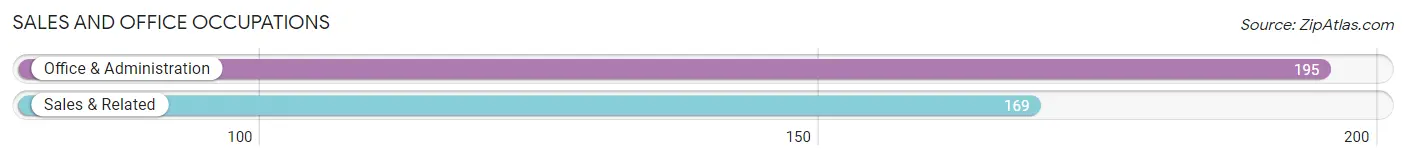
Sales and Office Occupations
The most common Sales and Office occupations in Michigan Center are Office & Administration (195 | 8.5%), and Sales & Related (169 | 7.3%).
Sales and Office Occupations by Sex
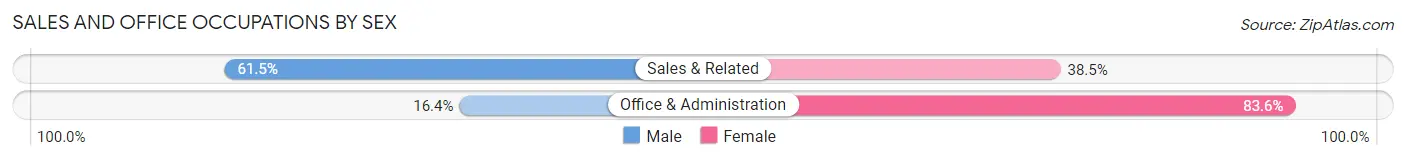
| Occupation | Male | Female |
| Sales & Related | 104 (61.5%) | 65 (38.5%) |
| Office & Administration | 32 (16.4%) | 163 (83.6%) |
| Total (Category) | 136 (37.4%) | 228 (62.6%) |
| Total (Overall) | 1,042 (45.3%) | 1,261 (54.7%) |
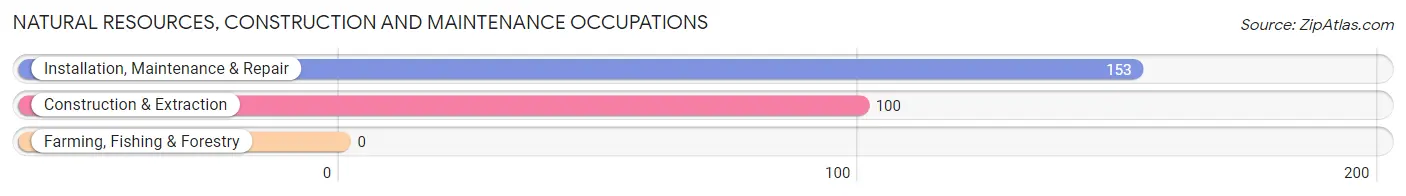
Natural Resources, Construction and Maintenance Occupations
The most common Natural Resources, Construction and Maintenance occupations in Michigan Center are Installation, Maintenance & Repair (153 | 6.6%), and Construction & Extraction (100 | 4.3%).
Natural Resources, Construction and Maintenance Occupations by Sex
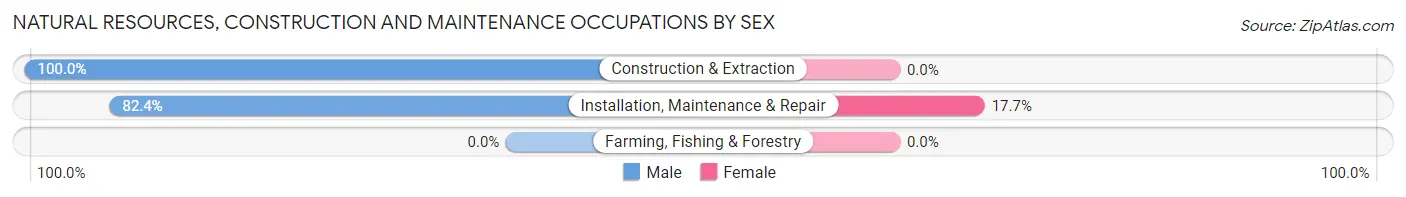
| Occupation | Male | Female |
| Farming, Fishing & Forestry | 0 (0.0%) | 0 (0.0%) |
| Construction & Extraction | 100 (100.0%) | 0 (0.0%) |
| Installation, Maintenance & Repair | 126 (82.4%) | 27 (17.6%) |
| Total (Category) | 226 (89.3%) | 27 (10.7%) |
| Total (Overall) | 1,042 (45.3%) | 1,261 (54.7%) |
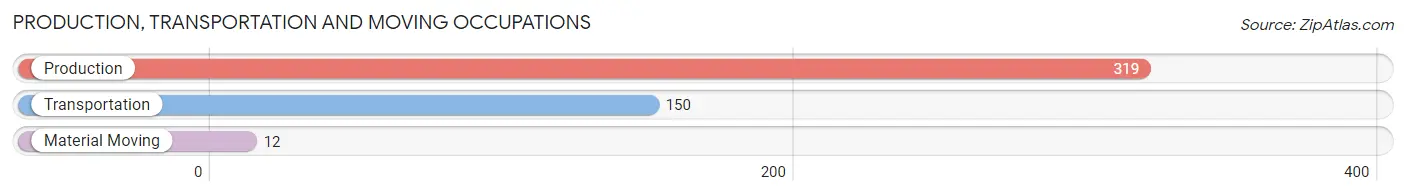
Production, Transportation and Moving Occupations
The most common Production, Transportation and Moving occupations in Michigan Center are Production (319 | 13.9%), Transportation (150 | 6.5%), and Material Moving (12 | 0.5%).
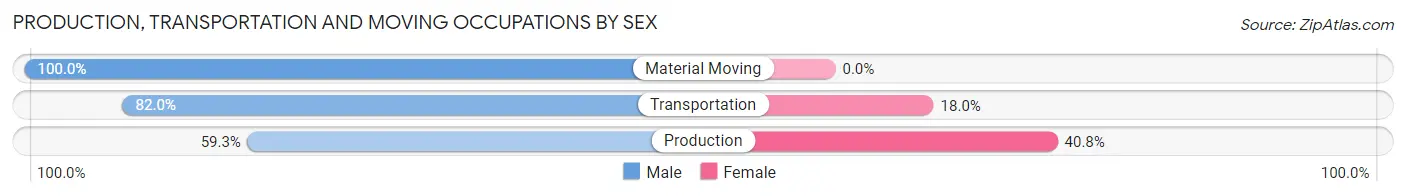
Production, Transportation and Moving Occupations by Sex
| Occupation | Male | Female |
| Production | 189 (59.3%) | 130 (40.7%) |
| Transportation | 123 (82.0%) | 27 (18.0%) |
| Material Moving | 12 (100.0%) | 0 (0.0%) |
| Total (Category) | 324 (67.4%) | 157 (32.6%) |
| Total (Overall) | 1,042 (45.3%) | 1,261 (54.7%) |
Employment Industries by Sex in Michigan Center
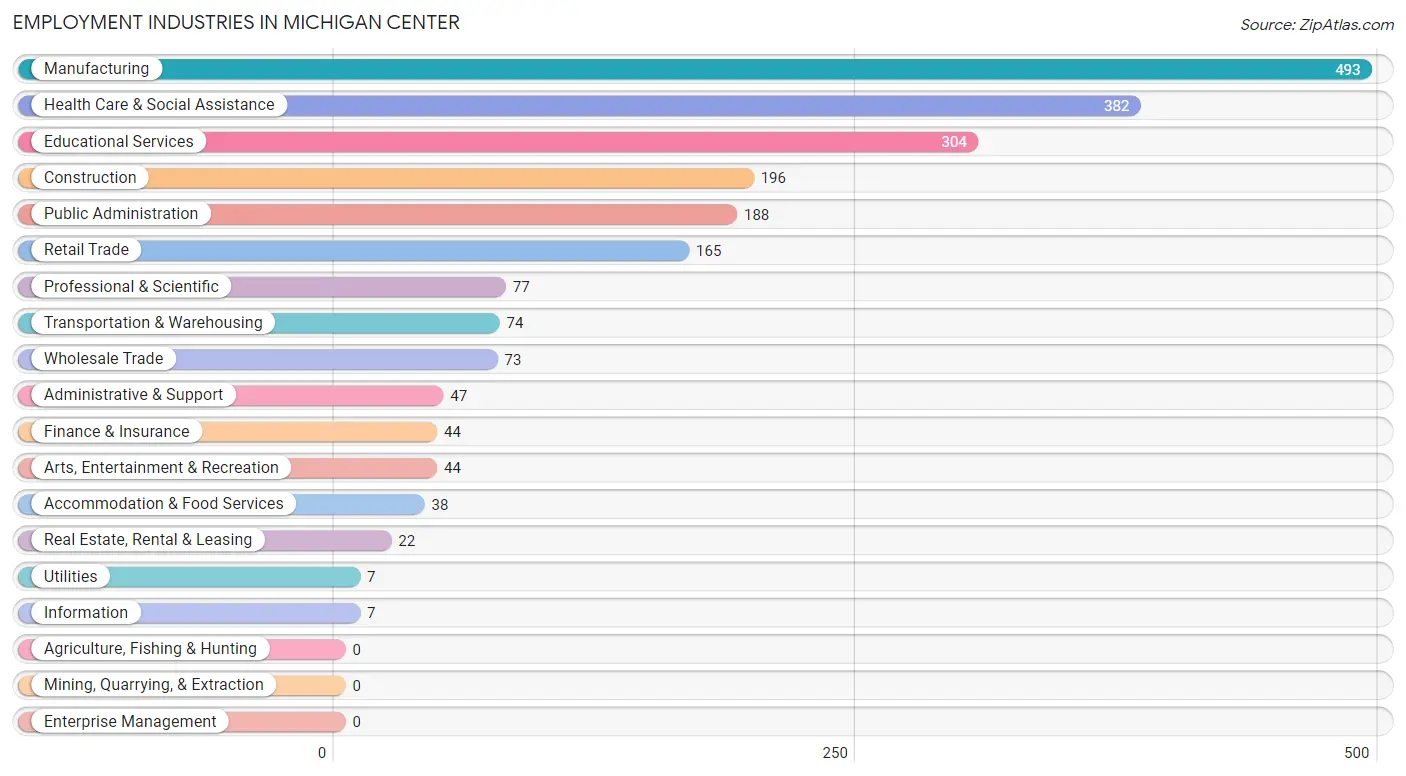
Employment Industries in Michigan Center
The major employment industries in Michigan Center include Manufacturing (493 | 21.4%), Health Care & Social Assistance (382 | 16.6%), Educational Services (304 | 13.2%), Construction (196 | 8.5%), and Public Administration (188 | 8.2%).
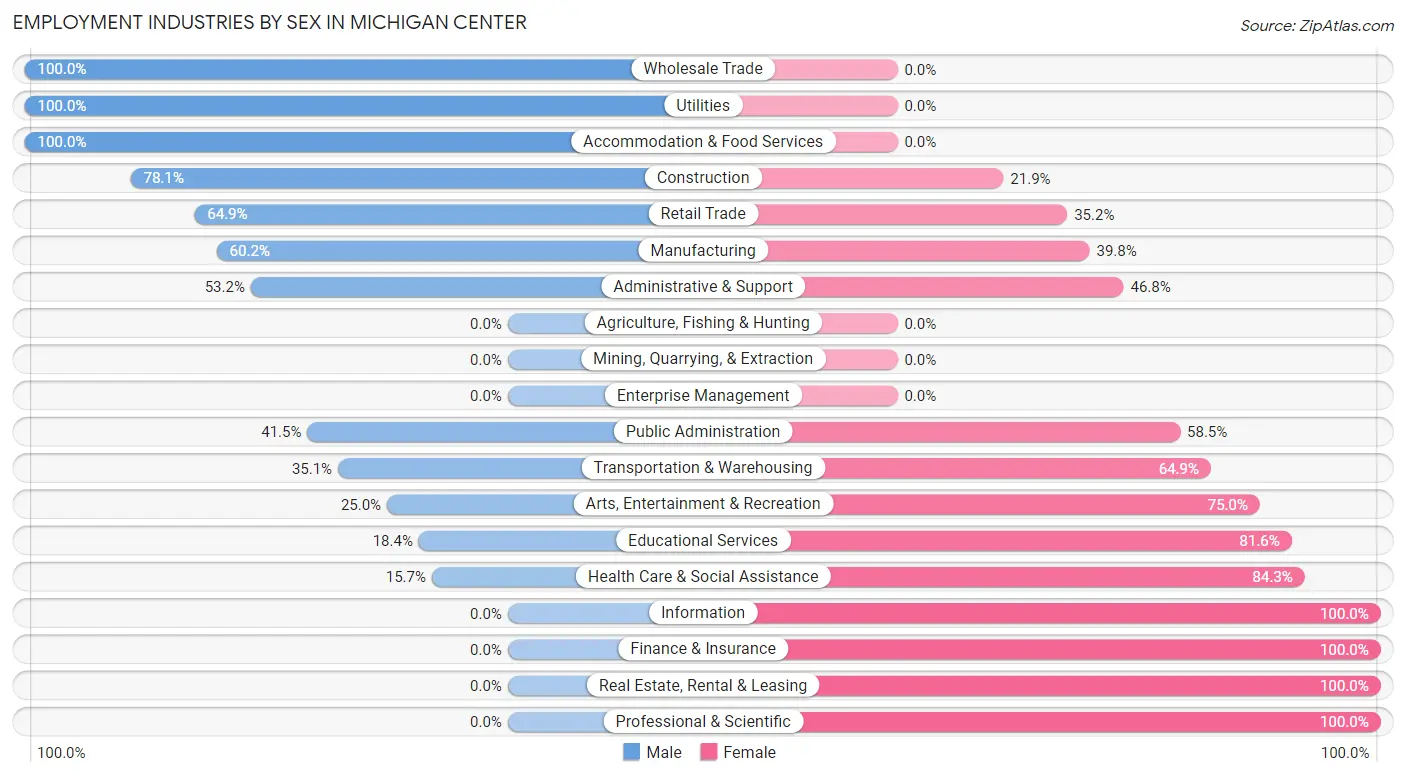
Employment Industries by Sex in Michigan Center
The Michigan Center industries that see more men than women are Wholesale Trade (100.0%), Utilities (100.0%), and Accommodation & Food Services (100.0%), whereas the industries that tend to have a higher number of women are Information (100.0%), Finance & Insurance (100.0%), and Real Estate, Rental & Leasing (100.0%).
| Industry | Male | Female |
| Agriculture, Fishing & Hunting | 0 (0.0%) | 0 (0.0%) |
| Mining, Quarrying, & Extraction | 0 (0.0%) | 0 (0.0%) |
| Construction | 153 (78.1%) | 43 (21.9%) |
| Manufacturing | 297 (60.2%) | 196 (39.8%) |
| Wholesale Trade | 73 (100.0%) | 0 (0.0%) |
| Retail Trade | 107 (64.8%) | 58 (35.1%) |
| Transportation & Warehousing | 26 (35.1%) | 48 (64.9%) |
| Utilities | 7 (100.0%) | 0 (0.0%) |
| Information | 0 (0.0%) | 7 (100.0%) |
| Finance & Insurance | 0 (0.0%) | 44 (100.0%) |
| Real Estate, Rental & Leasing | 0 (0.0%) | 22 (100.0%) |
| Professional & Scientific | 0 (0.0%) | 77 (100.0%) |
| Enterprise Management | 0 (0.0%) | 0 (0.0%) |
| Administrative & Support | 25 (53.2%) | 22 (46.8%) |
| Educational Services | 56 (18.4%) | 248 (81.6%) |
| Health Care & Social Assistance | 60 (15.7%) | 322 (84.3%) |
| Arts, Entertainment & Recreation | 11 (25.0%) | 33 (75.0%) |
| Accommodation & Food Services | 38 (100.0%) | 0 (0.0%) |
| Public Administration | 78 (41.5%) | 110 (58.5%) |
| Total | 1,042 (45.3%) | 1,261 (54.7%) |
Education in Michigan Center
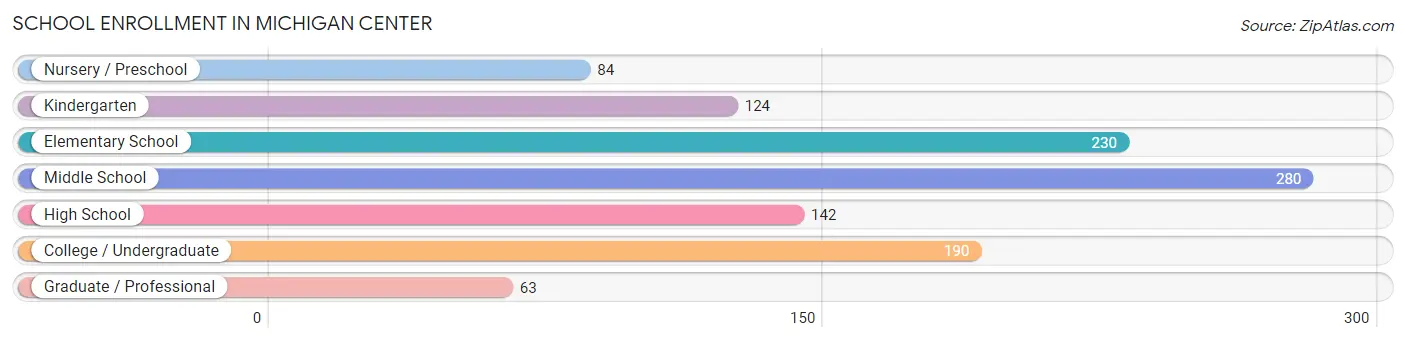
School Enrollment in Michigan Center
The most common levels of schooling among the 1,113 students in Michigan Center are middle school (280 | 25.2%), elementary school (230 | 20.7%), and college / undergraduate (190 | 17.1%).
| School Level | # Students | % Students |
| Nursery / Preschool | 84 | 7.5% |
| Kindergarten | 124 | 11.1% |
| Elementary School | 230 | 20.7% |
| Middle School | 280 | 25.2% |
| High School | 142 | 12.8% |
| College / Undergraduate | 190 | 17.1% |
| Graduate / Professional | 63 | 5.7% |
| Total | 1,113 | 100.0% |
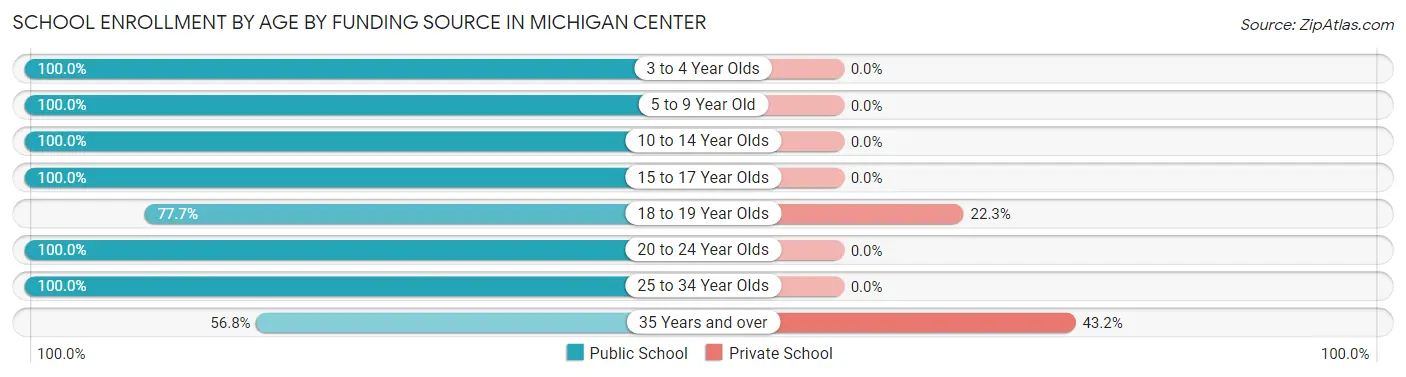
School Enrollment by Age by Funding Source in Michigan Center
Out of a total of 1,113 students who are enrolled in schools in Michigan Center, 59 (5.3%) attend a private institution, while the remaining 1,054 (94.7%) are enrolled in public schools. The age group of 35 years and over has the highest likelihood of being enrolled in private schools, with 38 (43.2% in the age bracket) enrolled. Conversely, the age group of 3 to 4 year olds has the lowest likelihood of being enrolled in a private school, with 84 (100.0% in the age bracket) attending a public institution.
| Age Bracket | Public School | Private School |
| 3 to 4 Year Olds | 84 (100.0%) | 0 (0.0%) |
| 5 to 9 Year Old | 308 (100.0%) | 0 (0.0%) |
| 10 to 14 Year Olds | 326 (100.0%) | 0 (0.0%) |
| 15 to 17 Year Olds | 121 (100.0%) | 0 (0.0%) |
| 18 to 19 Year Olds | 73 (77.7%) | 21 (22.3%) |
| 20 to 24 Year Olds | 31 (100.0%) | 0 (0.0%) |
| 25 to 34 Year Olds | 61 (100.0%) | 0 (0.0%) |
| 35 Years and over | 50 (56.8%) | 38 (43.2%) |
| Total | 1,054 (94.7%) | 59 (5.3%) |
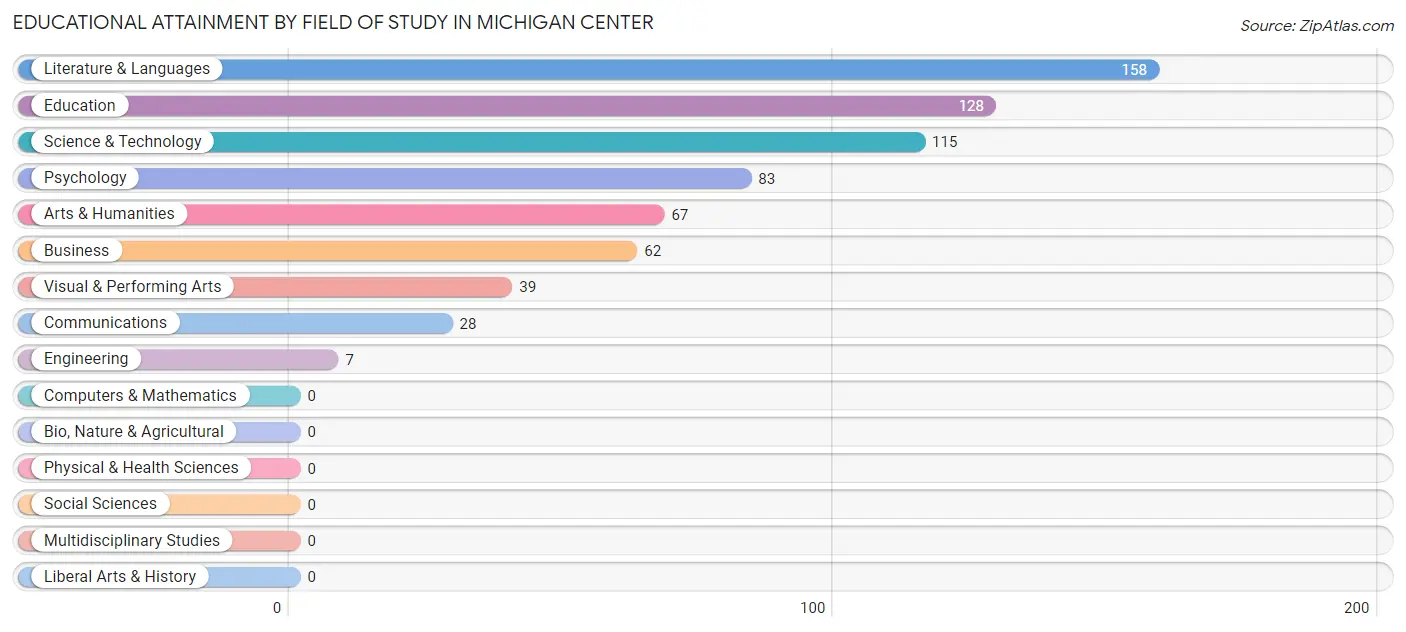
Educational Attainment by Field of Study in Michigan Center
Literature & languages (158 | 23.0%), education (128 | 18.6%), science & technology (115 | 16.7%), psychology (83 | 12.1%), and arts & humanities (67 | 9.8%) are the most common fields of study among 687 individuals in Michigan Center who have obtained a bachelor's degree or higher.
| Field of Study | # Graduates | % Graduates |
| Computers & Mathematics | 0 | 0.0% |
| Bio, Nature & Agricultural | 0 | 0.0% |
| Physical & Health Sciences | 0 | 0.0% |
| Psychology | 83 | 12.1% |
| Social Sciences | 0 | 0.0% |
| Engineering | 7 | 1.0% |
| Multidisciplinary Studies | 0 | 0.0% |
| Science & Technology | 115 | 16.7% |
| Business | 62 | 9.0% |
| Education | 128 | 18.6% |
| Literature & Languages | 158 | 23.0% |
| Liberal Arts & History | 0 | 0.0% |
| Visual & Performing Arts | 39 | 5.7% |
| Communications | 28 | 4.1% |
| Arts & Humanities | 67 | 9.8% |
| Total | 687 | 100.0% |
Transportation & Commute in Michigan Center
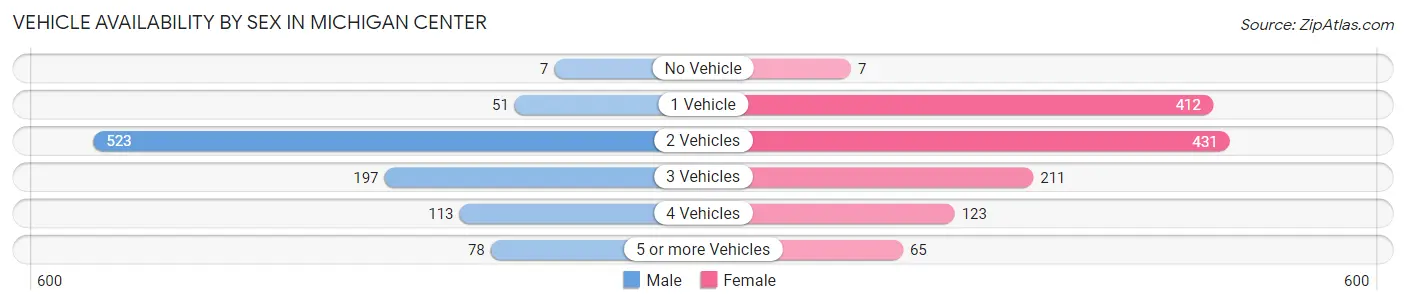
Vehicle Availability by Sex in Michigan Center
The most prevalent vehicle ownership categories in Michigan Center are males with 2 vehicles (523, accounting for 54.0%) and females with 2 vehicles (431, making up 41.9%).
| Vehicles Available | Male | Female |
| No Vehicle | 7 (0.7%) | 7 (0.6%) |
| 1 Vehicle | 51 (5.3%) | 412 (33.0%) |
| 2 Vehicles | 523 (54.0%) | 431 (34.5%) |
| 3 Vehicles | 197 (20.3%) | 211 (16.9%) |
| 4 Vehicles | 113 (11.7%) | 123 (9.9%) |
| 5 or more Vehicles | 78 (8.1%) | 65 (5.2%) |
| Total | 969 (100.0%) | 1,249 (100.0%) |
Commute Time in Michigan Center
The most frequently occuring commute durations in Michigan Center are 10 to 14 minutes (449 commuters, 22.0%), 20 to 24 minutes (374 commuters, 18.3%), and 15 to 19 minutes (323 commuters, 15.8%).
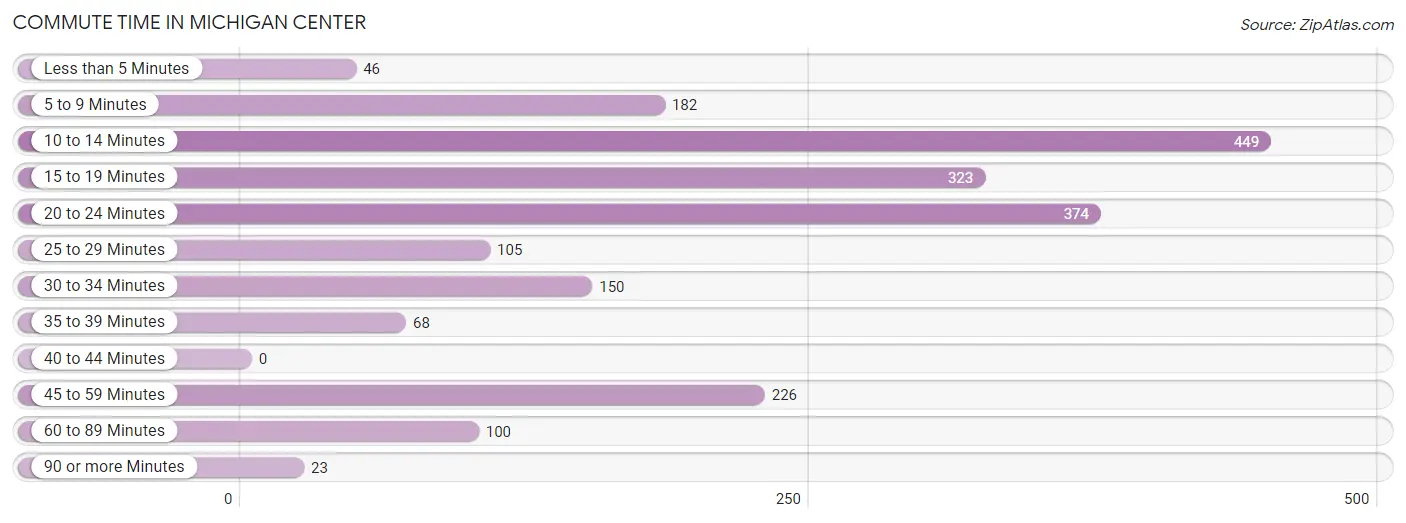
| Commute Time | # Commuters | % Commuters |
| Less than 5 Minutes | 46 | 2.2% |
| 5 to 9 Minutes | 182 | 8.9% |
| 10 to 14 Minutes | 449 | 22.0% |
| 15 to 19 Minutes | 323 | 15.8% |
| 20 to 24 Minutes | 374 | 18.3% |
| 25 to 29 Minutes | 105 | 5.1% |
| 30 to 34 Minutes | 150 | 7.3% |
| 35 to 39 Minutes | 68 | 3.3% |
| 40 to 44 Minutes | 0 | 0.0% |
| 45 to 59 Minutes | 226 | 11.1% |
| 60 to 89 Minutes | 100 | 4.9% |
| 90 or more Minutes | 23 | 1.1% |
Commute Time by Sex in Michigan Center
The most common commute times in Michigan Center are 20 to 24 minutes (238 commuters, 25.5%) for males and 10 to 14 minutes (307 commuters, 27.6%) for females.
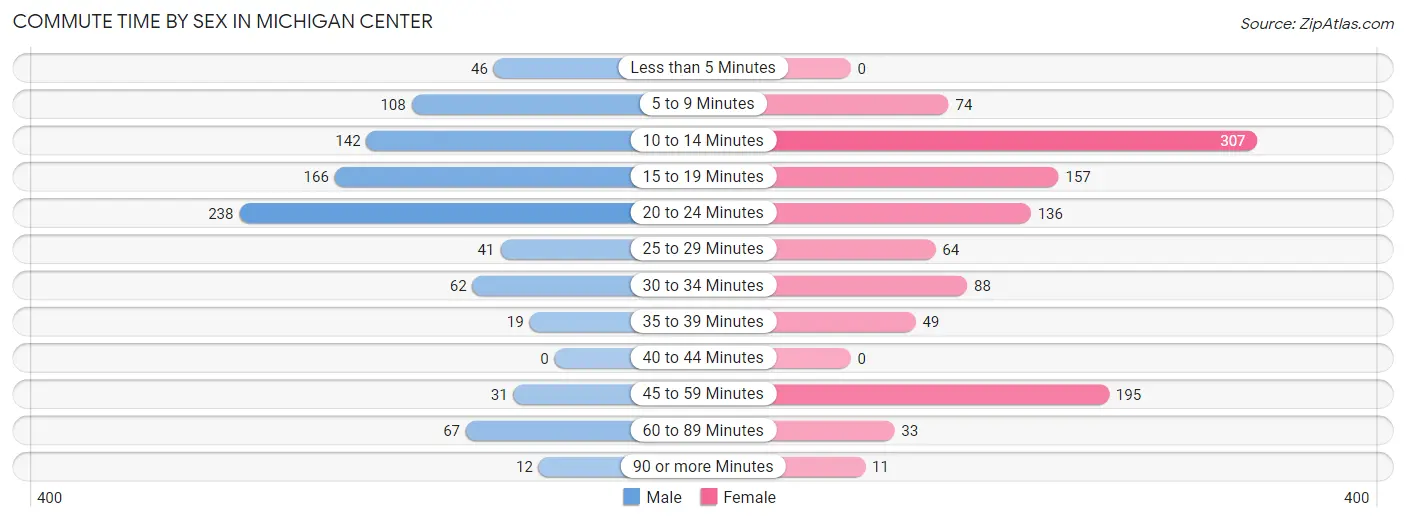
| Commute Time | Male | Female |
| Less than 5 Minutes | 46 (4.9%) | 0 (0.0%) |
| 5 to 9 Minutes | 108 (11.6%) | 74 (6.6%) |
| 10 to 14 Minutes | 142 (15.2%) | 307 (27.6%) |
| 15 to 19 Minutes | 166 (17.8%) | 157 (14.1%) |
| 20 to 24 Minutes | 238 (25.5%) | 136 (12.2%) |
| 25 to 29 Minutes | 41 (4.4%) | 64 (5.8%) |
| 30 to 34 Minutes | 62 (6.7%) | 88 (7.9%) |
| 35 to 39 Minutes | 19 (2.0%) | 49 (4.4%) |
| 40 to 44 Minutes | 0 (0.0%) | 0 (0.0%) |
| 45 to 59 Minutes | 31 (3.3%) | 195 (17.5%) |
| 60 to 89 Minutes | 67 (7.2%) | 33 (3.0%) |
| 90 or more Minutes | 12 (1.3%) | 11 (1.0%) |
Time of Departure to Work by Sex in Michigan Center
The most frequent times of departure to work in Michigan Center are 7:00 AM to 7:29 AM (243, 26.1%) for males and 6:30 AM to 6:59 AM (345, 31.0%) for females.
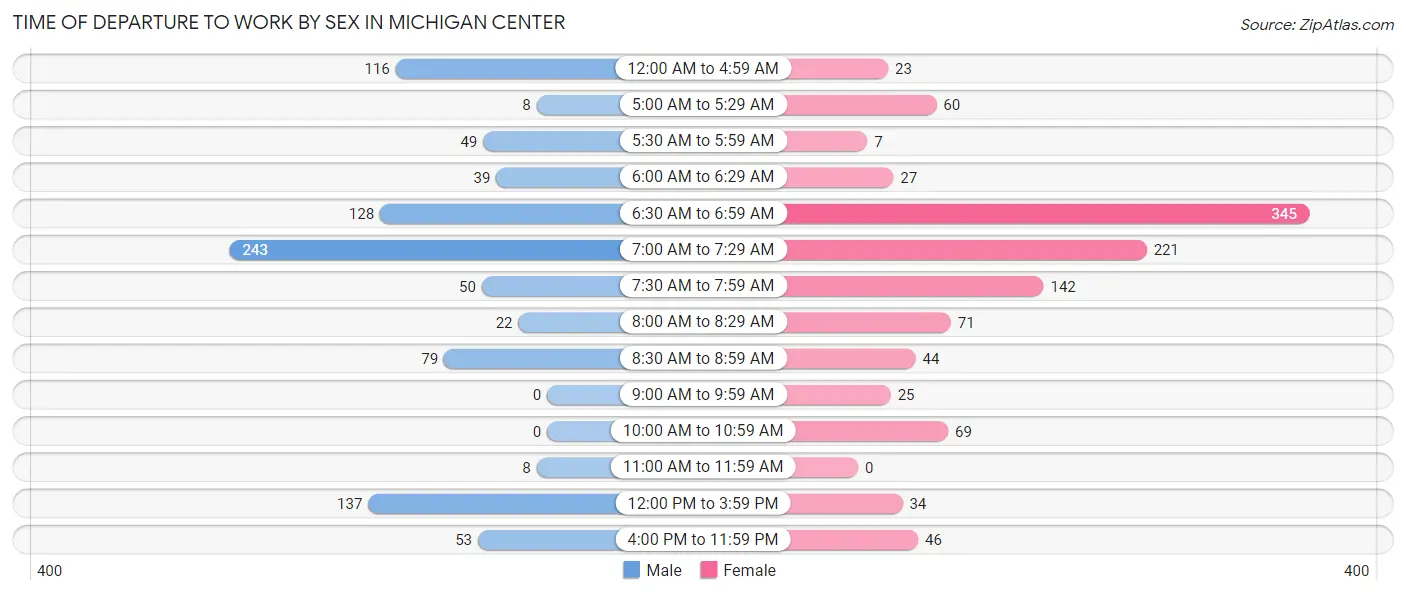
| Time of Departure | Male | Female |
| 12:00 AM to 4:59 AM | 116 (12.4%) | 23 (2.1%) |
| 5:00 AM to 5:29 AM | 8 (0.9%) | 60 (5.4%) |
| 5:30 AM to 5:59 AM | 49 (5.3%) | 7 (0.6%) |
| 6:00 AM to 6:29 AM | 39 (4.2%) | 27 (2.4%) |
| 6:30 AM to 6:59 AM | 128 (13.7%) | 345 (31.0%) |
| 7:00 AM to 7:29 AM | 243 (26.1%) | 221 (19.8%) |
| 7:30 AM to 7:59 AM | 50 (5.4%) | 142 (12.8%) |
| 8:00 AM to 8:29 AM | 22 (2.4%) | 71 (6.4%) |
| 8:30 AM to 8:59 AM | 79 (8.5%) | 44 (4.0%) |
| 9:00 AM to 9:59 AM | 0 (0.0%) | 25 (2.2%) |
| 10:00 AM to 10:59 AM | 0 (0.0%) | 69 (6.2%) |
| 11:00 AM to 11:59 AM | 8 (0.9%) | 0 (0.0%) |
| 12:00 PM to 3:59 PM | 137 (14.7%) | 34 (3.0%) |
| 4:00 PM to 11:59 PM | 53 (5.7%) | 46 (4.1%) |
| Total | 932 (100.0%) | 1,114 (100.0%) |
Housing Occupancy in Michigan Center
Occupancy by Ownership in Michigan Center
Of the total 2,170 dwellings in Michigan Center, owner-occupied units account for 1,786 (82.3%), while renter-occupied units make up 384 (17.7%).
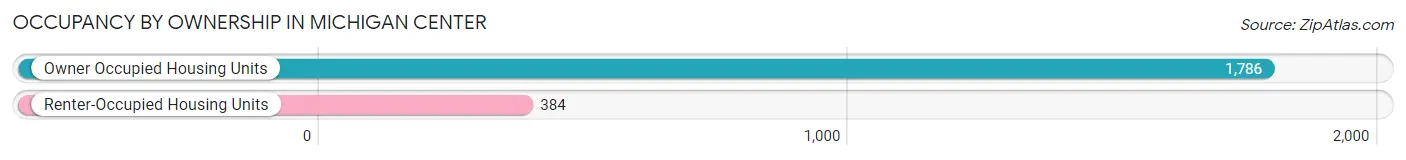
| Occupancy | # Housing Units | % Housing Units |
| Owner Occupied Housing Units | 1,786 | 82.3% |
| Renter-Occupied Housing Units | 384 | 17.7% |
| Total Occupied Housing Units | 2,170 | 100.0% |
Occupancy by Household Size in Michigan Center
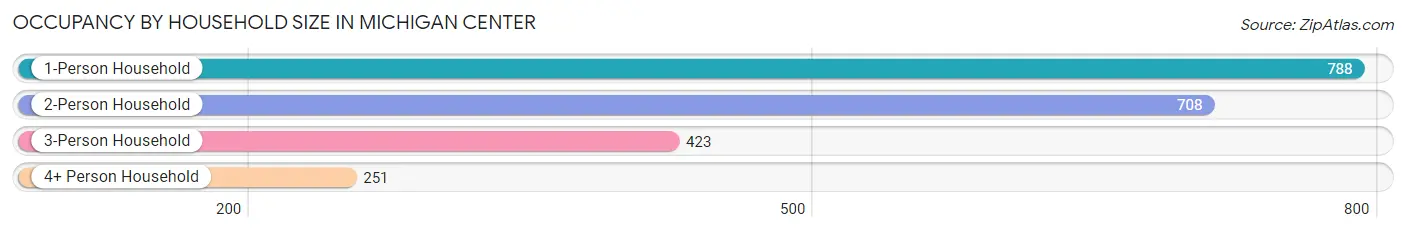
| Household Size | # Housing Units | % Housing Units |
| 1-Person Household | 788 | 36.3% |
| 2-Person Household | 708 | 32.6% |
| 3-Person Household | 423 | 19.5% |
| 4+ Person Household | 251 | 11.6% |
| Total Housing Units | 2,170 | 100.0% |
Occupancy by Ownership by Household Size in Michigan Center
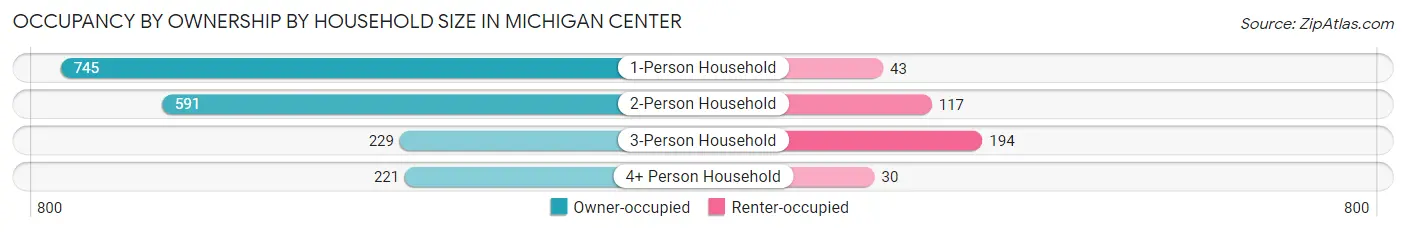
| Household Size | Owner-occupied | Renter-occupied |
| 1-Person Household | 745 (94.5%) | 43 (5.5%) |
| 2-Person Household | 591 (83.5%) | 117 (16.5%) |
| 3-Person Household | 229 (54.1%) | 194 (45.9%) |
| 4+ Person Household | 221 (88.0%) | 30 (11.9%) |
| Total Housing Units | 1,786 (82.3%) | 384 (17.7%) |
Occupancy by Educational Attainment in Michigan Center
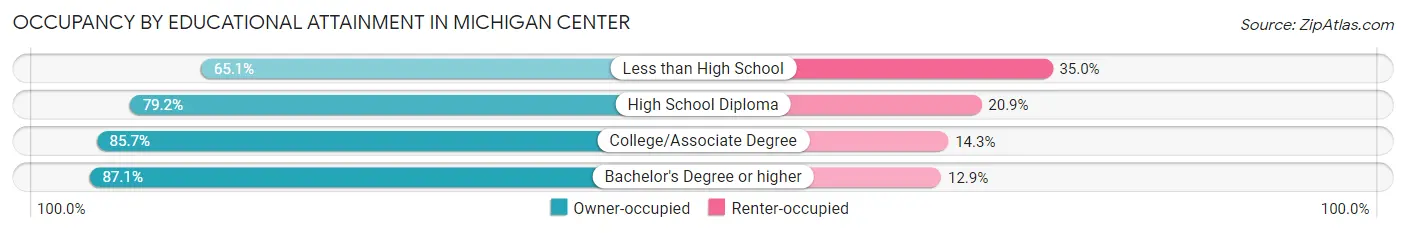
| Household Size | Owner-occupied | Renter-occupied |
| Less than High School | 121 (65.0%) | 65 (34.9%) |
| High School Diploma | 505 (79.1%) | 133 (20.8%) |
| College/Associate Degree | 774 (85.7%) | 129 (14.3%) |
| Bachelor's Degree or higher | 386 (87.1%) | 57 (12.9%) |
Occupancy by Age of Householder in Michigan Center
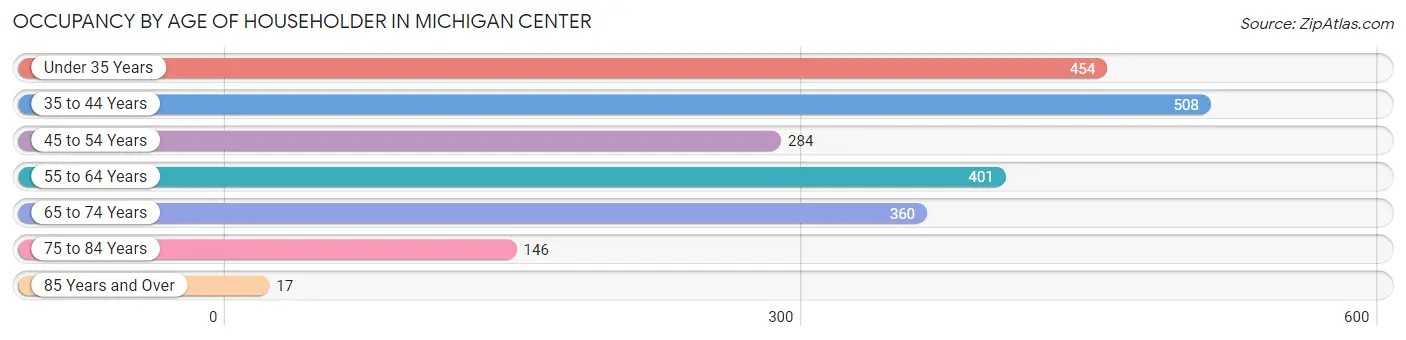
| Age Bracket | # Households | % Households |
| Under 35 Years | 454 | 20.9% |
| 35 to 44 Years | 508 | 23.4% |
| 45 to 54 Years | 284 | 13.1% |
| 55 to 64 Years | 401 | 18.5% |
| 65 to 74 Years | 360 | 16.6% |
| 75 to 84 Years | 146 | 6.7% |
| 85 Years and Over | 17 | 0.8% |
| Total | 2,170 | 100.0% |
Housing Finances in Michigan Center
Median Income by Occupancy in Michigan Center
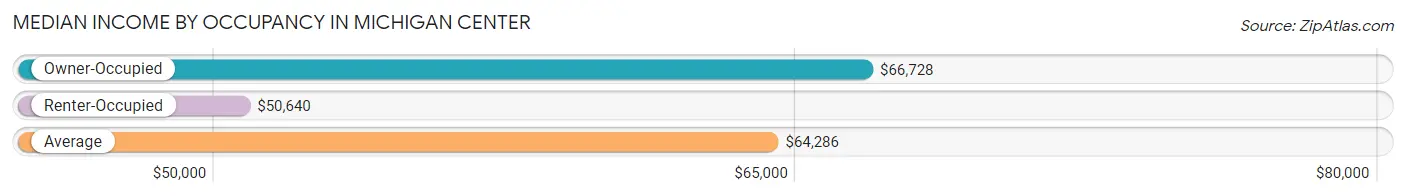
| Occupancy Type | # Households | Median Income |
| Owner-Occupied | 1,786 (82.3%) | $66,728 |
| Renter-Occupied | 384 (17.7%) | $50,640 |
| Average | 2,170 (100.0%) | $64,286 |
Occupancy by Householder Income Bracket in Michigan Center
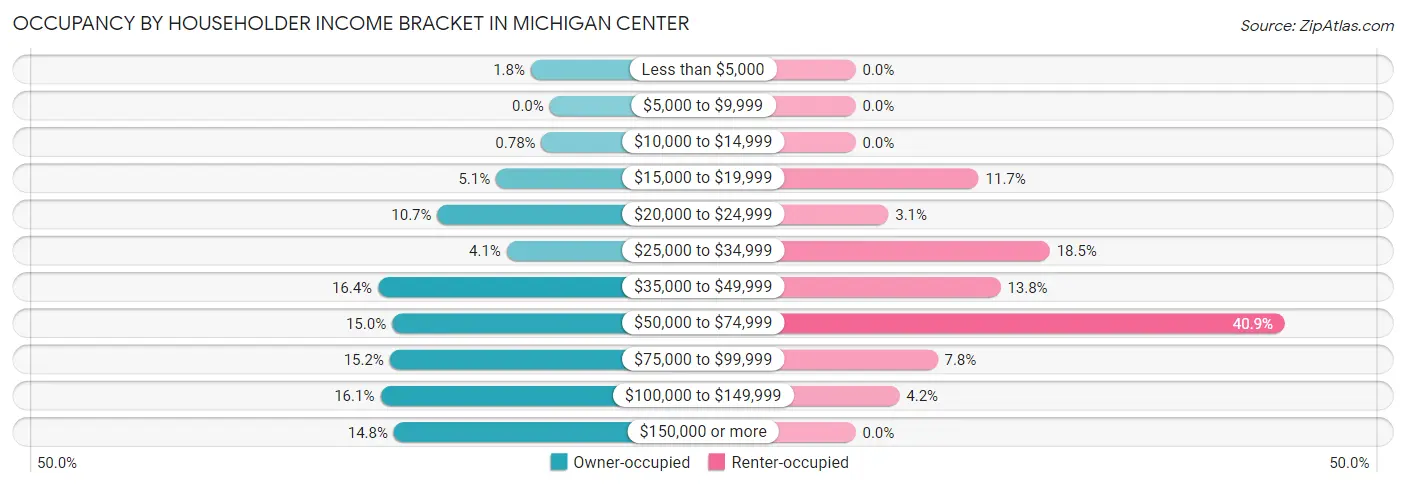
| Income Bracket | Owner-occupied | Renter-occupied |
| Less than $5,000 | 32 (1.8%) | 0 (0.0%) |
| $5,000 to $9,999 | 0 (0.0%) | 0 (0.0%) |
| $10,000 to $14,999 | 14 (0.8%) | 0 (0.0%) |
| $15,000 to $19,999 | 91 (5.1%) | 45 (11.7%) |
| $20,000 to $24,999 | 191 (10.7%) | 12 (3.1%) |
| $25,000 to $34,999 | 73 (4.1%) | 71 (18.5%) |
| $35,000 to $49,999 | 292 (16.4%) | 53 (13.8%) |
| $50,000 to $74,999 | 268 (15.0%) | 157 (40.9%) |
| $75,000 to $99,999 | 272 (15.2%) | 30 (7.8%) |
| $100,000 to $149,999 | 288 (16.1%) | 16 (4.2%) |
| $150,000 or more | 265 (14.8%) | 0 (0.0%) |
| Total | 1,786 (100.0%) | 384 (100.0%) |
Monthly Housing Cost Tiers in Michigan Center
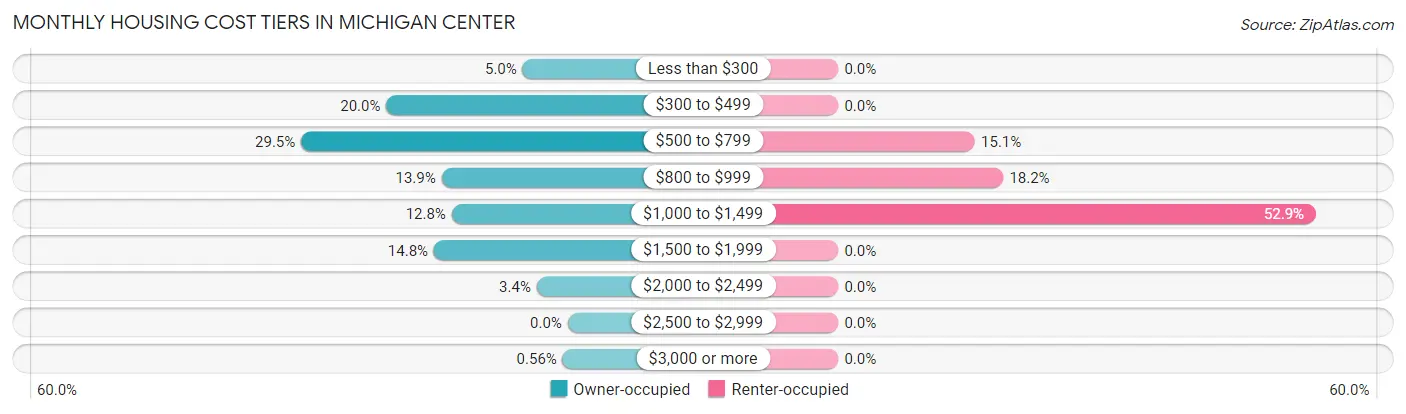
| Monthly Cost | Owner-occupied | Renter-occupied |
| Less than $300 | 89 (5.0%) | 0 (0.0%) |
| $300 to $499 | 358 (20.0%) | 0 (0.0%) |
| $500 to $799 | 526 (29.4%) | 58 (15.1%) |
| $800 to $999 | 249 (13.9%) | 70 (18.2%) |
| $1,000 to $1,499 | 229 (12.8%) | 203 (52.9%) |
| $1,500 to $1,999 | 264 (14.8%) | 0 (0.0%) |
| $2,000 to $2,499 | 61 (3.4%) | 0 (0.0%) |
| $2,500 to $2,999 | 0 (0.0%) | 0 (0.0%) |
| $3,000 or more | 10 (0.6%) | 0 (0.0%) |
| Total | 1,786 (100.0%) | 384 (100.0%) |
Physical Housing Characteristics in Michigan Center
Housing Structures in Michigan Center
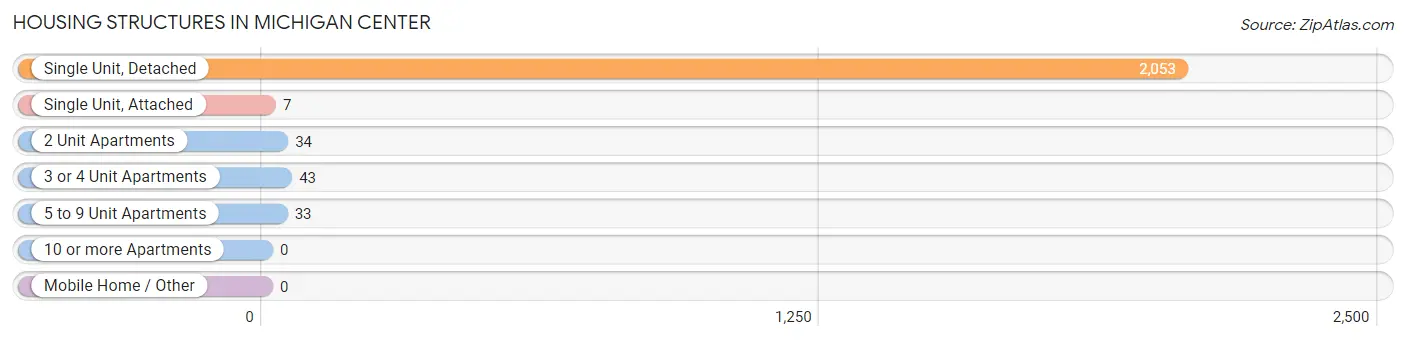
| Structure Type | # Housing Units | % Housing Units |
| Single Unit, Detached | 2,053 | 94.6% |
| Single Unit, Attached | 7 | 0.3% |
| 2 Unit Apartments | 34 | 1.6% |
| 3 or 4 Unit Apartments | 43 | 2.0% |
| 5 to 9 Unit Apartments | 33 | 1.5% |
| 10 or more Apartments | 0 | 0.0% |
| Mobile Home / Other | 0 | 0.0% |
| Total | 2,170 | 100.0% |
Housing Structures by Occupancy in Michigan Center
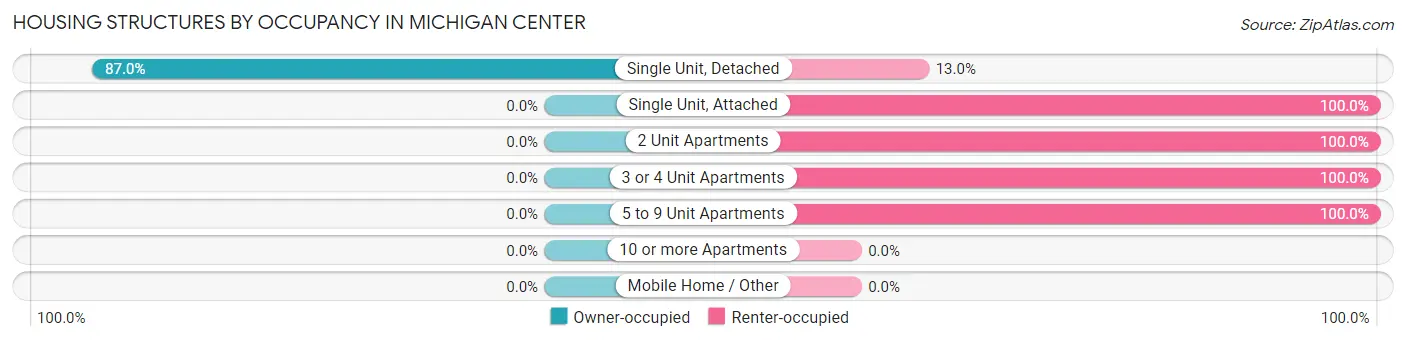
| Structure Type | Owner-occupied | Renter-occupied |
| Single Unit, Detached | 1,786 (87.0%) | 267 (13.0%) |
| Single Unit, Attached | 0 (0.0%) | 7 (100.0%) |
| 2 Unit Apartments | 0 (0.0%) | 34 (100.0%) |
| 3 or 4 Unit Apartments | 0 (0.0%) | 43 (100.0%) |
| 5 to 9 Unit Apartments | 0 (0.0%) | 33 (100.0%) |
| 10 or more Apartments | 0 (0.0%) | 0 (0.0%) |
| Mobile Home / Other | 0 (0.0%) | 0 (0.0%) |
| Total | 1,786 (82.3%) | 384 (17.7%) |
Housing Structures by Number of Rooms in Michigan Center
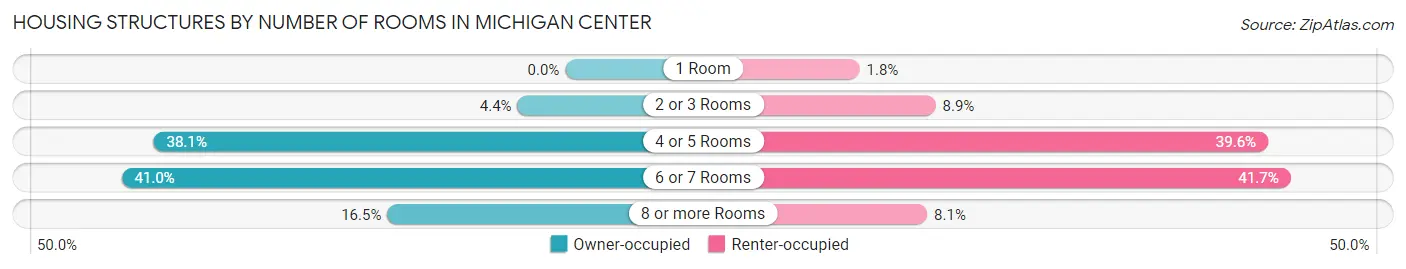
| Number of Rooms | Owner-occupied | Renter-occupied |
| 1 Room | 0 (0.0%) | 7 (1.8%) |
| 2 or 3 Rooms | 79 (4.4%) | 34 (8.8%) |
| 4 or 5 Rooms | 680 (38.1%) | 152 (39.6%) |
| 6 or 7 Rooms | 733 (41.0%) | 160 (41.7%) |
| 8 or more Rooms | 294 (16.5%) | 31 (8.1%) |
| Total | 1,786 (100.0%) | 384 (100.0%) |
Housing Structure by Heating Type in Michigan Center
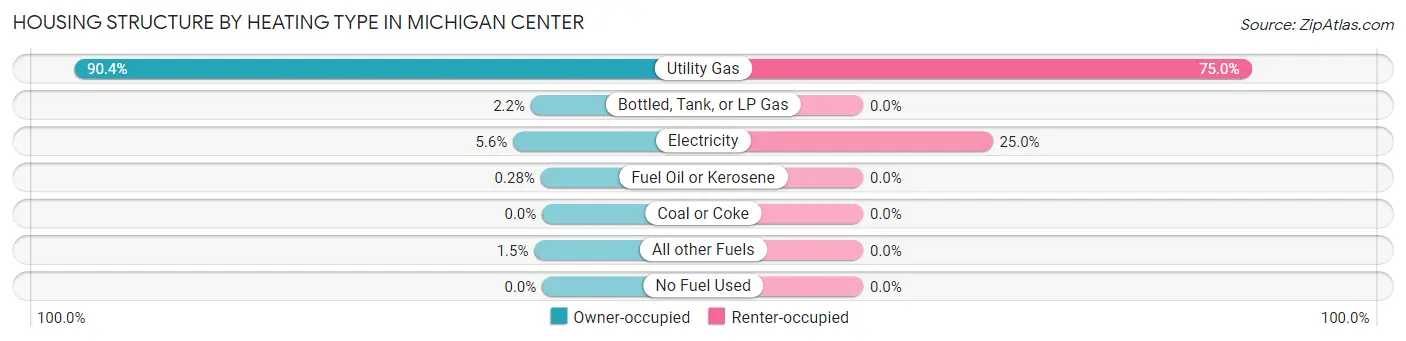
| Heating Type | Owner-occupied | Renter-occupied |
| Utility Gas | 1,615 (90.4%) | 288 (75.0%) |
| Bottled, Tank, or LP Gas | 39 (2.2%) | 0 (0.0%) |
| Electricity | 100 (5.6%) | 96 (25.0%) |
| Fuel Oil or Kerosene | 5 (0.3%) | 0 (0.0%) |
| Coal or Coke | 0 (0.0%) | 0 (0.0%) |
| All other Fuels | 27 (1.5%) | 0 (0.0%) |
| No Fuel Used | 0 (0.0%) | 0 (0.0%) |
| Total | 1,786 (100.0%) | 384 (100.0%) |
Household Vehicle Usage in Michigan Center
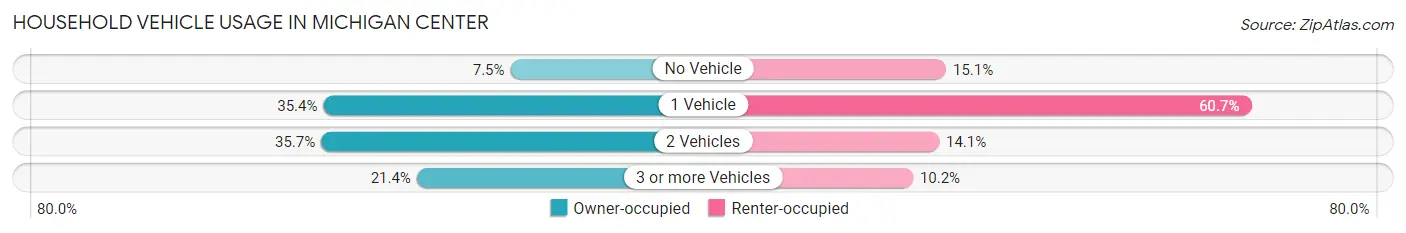
| Vehicles per Household | Owner-occupied | Renter-occupied |
| No Vehicle | 133 (7.4%) | 58 (15.1%) |
| 1 Vehicle | 632 (35.4%) | 233 (60.7%) |
| 2 Vehicles | 638 (35.7%) | 54 (14.1%) |
| 3 or more Vehicles | 383 (21.4%) | 39 (10.2%) |
| Total | 1,786 (100.0%) | 384 (100.0%) |
Real Estate & Mortgages in Michigan Center
Real Estate and Mortgage Overview in Michigan Center
| Characteristic | Without Mortgage | With Mortgage |
| Housing Units | 673 | 1,113 |
| Median Property Value | $162,900 | $155,100 |
| Median Household Income | $51,659 | $161 |
| Monthly Housing Costs | $443 | $10 |
| Real Estate Taxes | $1,739 | $85 |
Property Value by Mortgage Status in Michigan Center
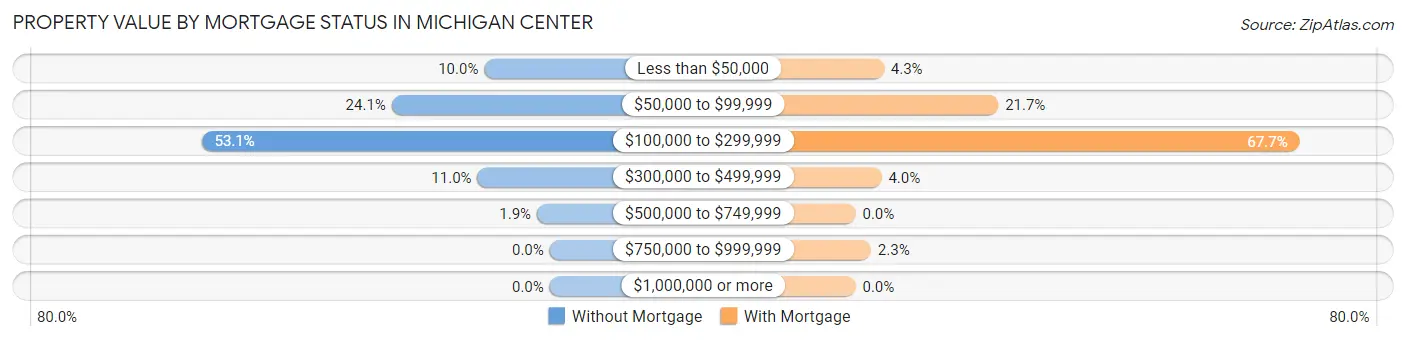
| Property Value | Without Mortgage | With Mortgage |
| Less than $50,000 | 67 (10.0%) | 48 (4.3%) |
| $50,000 to $99,999 | 162 (24.1%) | 242 (21.7%) |
| $100,000 to $299,999 | 357 (53.0%) | 753 (67.6%) |
| $300,000 to $499,999 | 74 (11.0%) | 44 (4.0%) |
| $500,000 to $749,999 | 13 (1.9%) | 0 (0.0%) |
| $750,000 to $999,999 | 0 (0.0%) | 26 (2.3%) |
| $1,000,000 or more | 0 (0.0%) | 0 (0.0%) |
| Total | 673 (100.0%) | 1,113 (100.0%) |
Household Income by Mortgage Status in Michigan Center
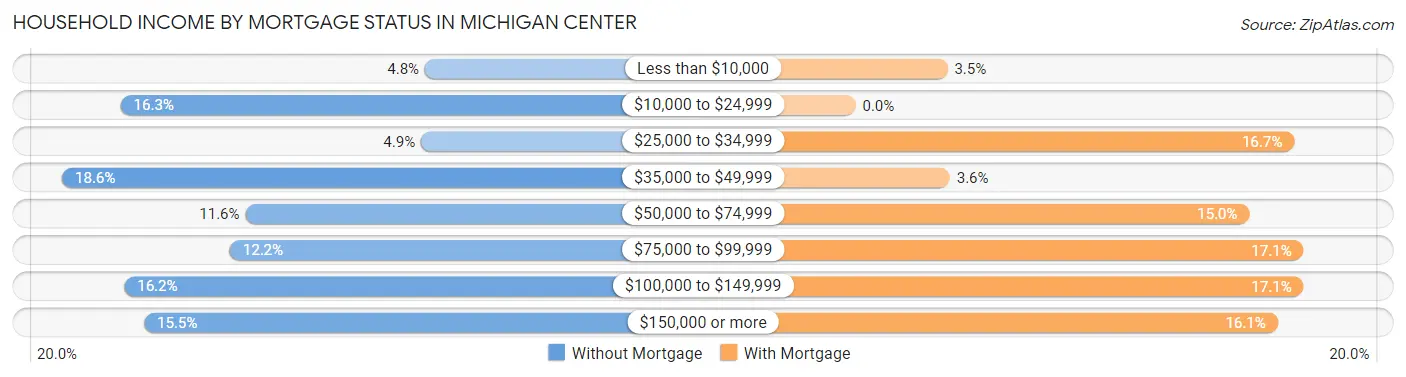
| Household Income | Without Mortgage | With Mortgage |
| Less than $10,000 | 32 (4.8%) | 39 (3.5%) |
| $10,000 to $24,999 | 110 (16.3%) | 0 (0.0%) |
| $25,000 to $34,999 | 33 (4.9%) | 186 (16.7%) |
| $35,000 to $49,999 | 125 (18.6%) | 40 (3.6%) |
| $50,000 to $74,999 | 78 (11.6%) | 167 (15.0%) |
| $75,000 to $99,999 | 82 (12.2%) | 190 (17.1%) |
| $100,000 to $149,999 | 109 (16.2%) | 190 (17.1%) |
| $150,000 or more | 104 (15.4%) | 179 (16.1%) |
| Total | 673 (100.0%) | 1,113 (100.0%) |
Property Value to Household Income Ratio in Michigan Center
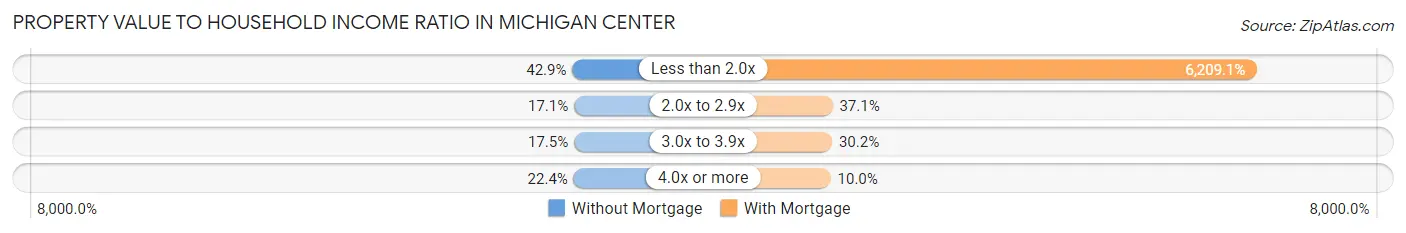
| Value-to-Income Ratio | Without Mortgage | With Mortgage |
| Less than 2.0x | 289 (42.9%) | 69,107 (6,209.1%) |
| 2.0x to 2.9x | 115 (17.1%) | 413 (37.1%) |
| 3.0x to 3.9x | 118 (17.5%) | 336 (30.2%) |
| 4.0x or more | 151 (22.4%) | 111 (10.0%) |
| Total | 673 (100.0%) | 1,113 (100.0%) |
Real Estate Taxes by Mortgage Status in Michigan Center
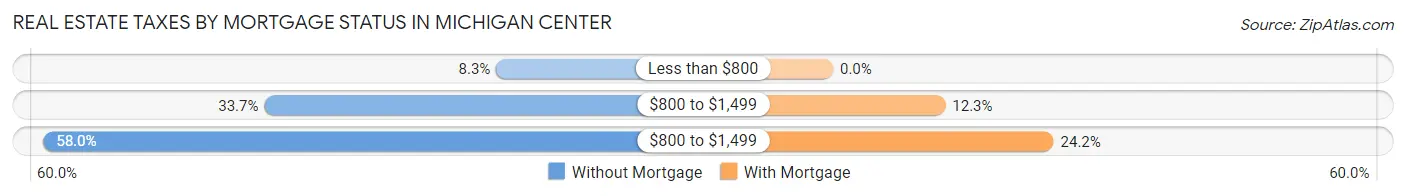
| Property Taxes | Without Mortgage | With Mortgage |
| Less than $800 | 56 (8.3%) | 0 (0.0%) |
| $800 to $1,499 | 227 (33.7%) | 137 (12.3%) |
| $800 to $1,499 | 390 (58.0%) | 269 (24.2%) |
| Total | 673 (100.0%) | 1,113 (100.0%) |
Health & Disability in Michigan Center
Health Insurance Coverage by Age in Michigan Center
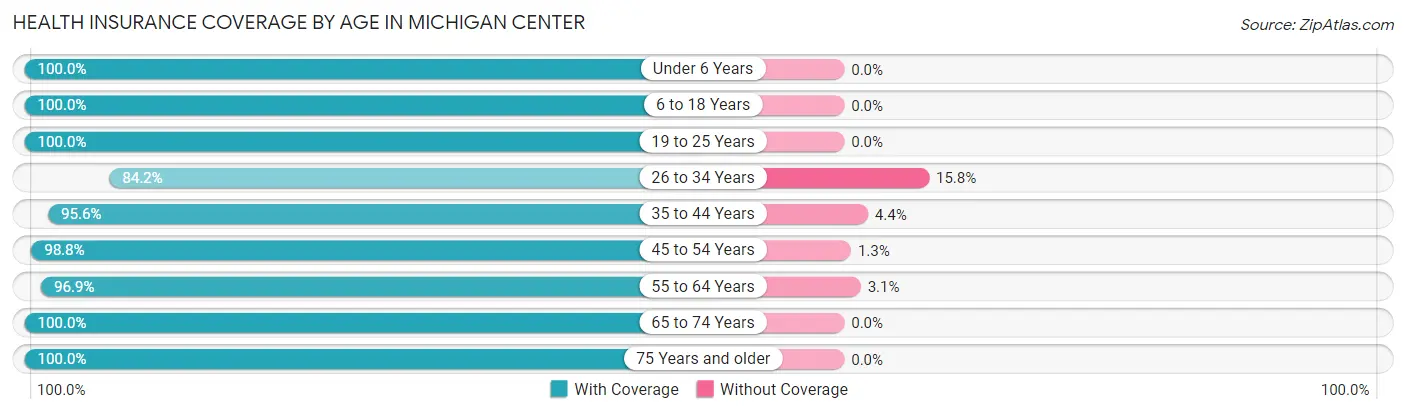
| Age Bracket | With Coverage | Without Coverage |
| Under 6 Years | 269 (100.0%) | 0 (0.0%) |
| 6 to 18 Years | 843 (100.0%) | 0 (0.0%) |
| 19 to 25 Years | 539 (100.0%) | 0 (0.0%) |
| 26 to 34 Years | 410 (84.2%) | 77 (15.8%) |
| 35 to 44 Years | 674 (95.6%) | 31 (4.4%) |
| 45 to 54 Years | 552 (98.8%) | 7 (1.3%) |
| 55 to 64 Years | 695 (96.9%) | 22 (3.1%) |
| 65 to 74 Years | 532 (100.0%) | 0 (0.0%) |
| 75 Years and older | 255 (100.0%) | 0 (0.0%) |
| Total | 4,769 (97.2%) | 137 (2.8%) |
Health Insurance Coverage by Citizenship Status in Michigan Center
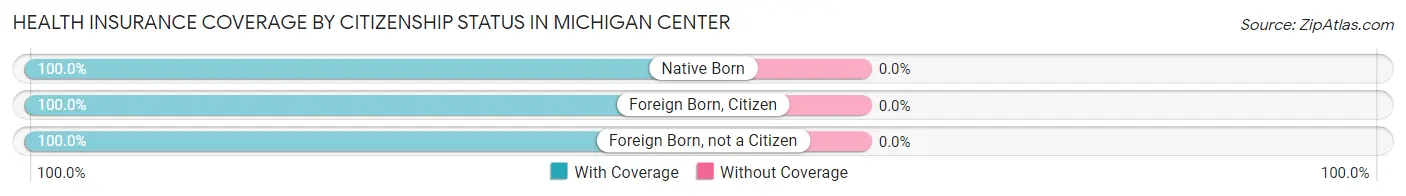
| Citizenship Status | With Coverage | Without Coverage |
| Native Born | 269 (100.0%) | 0 (0.0%) |
| Foreign Born, Citizen | 843 (100.0%) | 0 (0.0%) |
| Foreign Born, not a Citizen | 539 (100.0%) | 0 (0.0%) |
Health Insurance Coverage by Household Income in Michigan Center
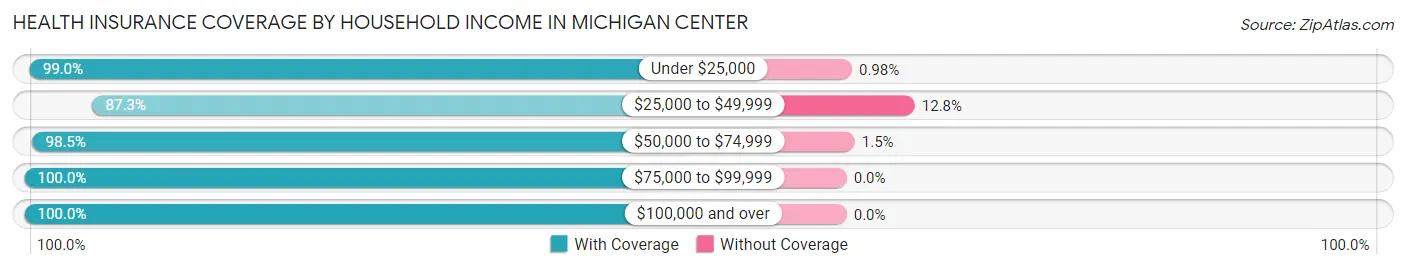
| Household Income | With Coverage | Without Coverage |
| Under $25,000 | 504 (99.0%) | 5 (1.0%) |
| $25,000 to $49,999 | 801 (87.3%) | 117 (12.8%) |
| $50,000 to $74,999 | 976 (98.5%) | 15 (1.5%) |
| $75,000 to $99,999 | 589 (100.0%) | 0 (0.0%) |
| $100,000 and over | 1,899 (100.0%) | 0 (0.0%) |
Public vs Private Health Insurance Coverage by Age in Michigan Center
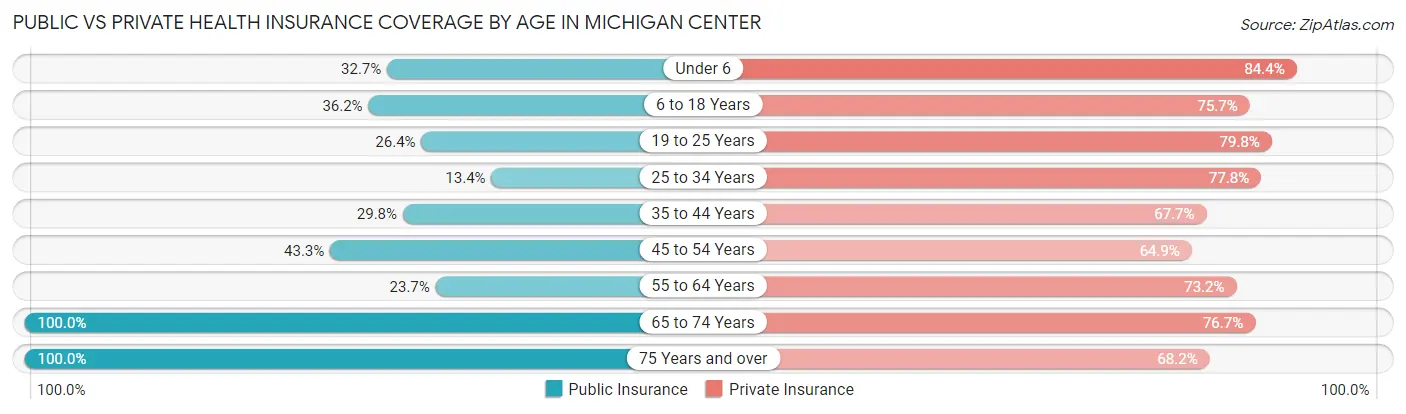
| Age Bracket | Public Insurance | Private Insurance |
| Under 6 | 88 (32.7%) | 227 (84.4%) |
| 6 to 18 Years | 305 (36.2%) | 638 (75.7%) |
| 19 to 25 Years | 142 (26.4%) | 430 (79.8%) |
| 25 to 34 Years | 65 (13.4%) | 379 (77.8%) |
| 35 to 44 Years | 210 (29.8%) | 477 (67.7%) |
| 45 to 54 Years | 242 (43.3%) | 363 (64.9%) |
| 55 to 64 Years | 170 (23.7%) | 525 (73.2%) |
| 65 to 74 Years | 532 (100.0%) | 408 (76.7%) |
| 75 Years and over | 255 (100.0%) | 174 (68.2%) |
| Total | 2,009 (40.9%) | 3,621 (73.8%) |
Disability Status by Sex by Age in Michigan Center
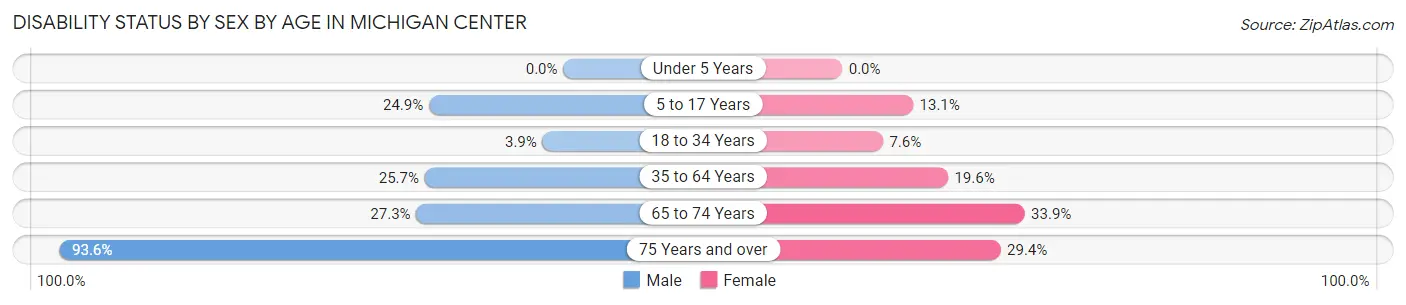
| Age Bracket | Male | Female |
| Under 5 Years | 0 (0.0%) | 0 (0.0%) |
| 5 to 17 Years | 92 (24.9%) | 54 (13.1%) |
| 18 to 34 Years | 20 (3.8%) | 45 (7.5%) |
| 35 to 64 Years | 250 (25.7%) | 198 (19.6%) |
| 65 to 74 Years | 75 (27.3%) | 87 (33.9%) |
| 75 Years and over | 73 (93.6%) | 52 (29.4%) |
Disability Class by Sex by Age in Michigan Center
Disability Class: Hearing Difficulty
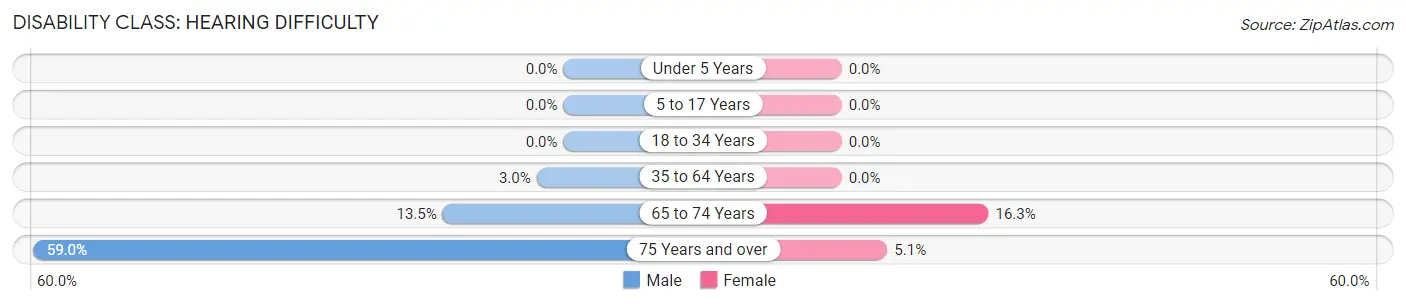
| Age Bracket | Male | Female |
| Under 5 Years | 0 (0.0%) | 0 (0.0%) |
| 5 to 17 Years | 0 (0.0%) | 0 (0.0%) |
| 18 to 34 Years | 0 (0.0%) | 0 (0.0%) |
| 35 to 64 Years | 29 (3.0%) | 0 (0.0%) |
| 65 to 74 Years | 37 (13.5%) | 42 (16.3%) |
| 75 Years and over | 46 (59.0%) | 9 (5.1%) |
Disability Class: Vision Difficulty
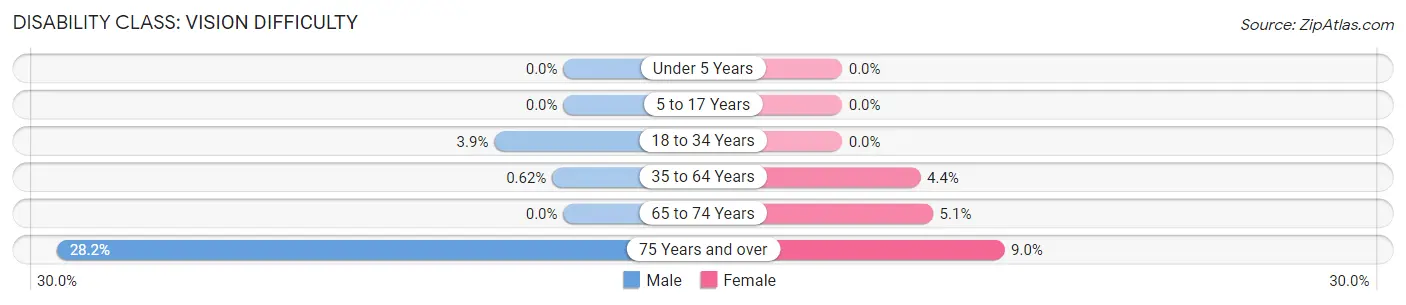
| Age Bracket | Male | Female |
| Under 5 Years | 0 (0.0%) | 0 (0.0%) |
| 5 to 17 Years | 0 (0.0%) | 0 (0.0%) |
| 18 to 34 Years | 20 (3.8%) | 0 (0.0%) |
| 35 to 64 Years | 6 (0.6%) | 44 (4.4%) |
| 65 to 74 Years | 0 (0.0%) | 13 (5.1%) |
| 75 Years and over | 22 (28.2%) | 16 (9.0%) |
Disability Class: Cognitive Difficulty
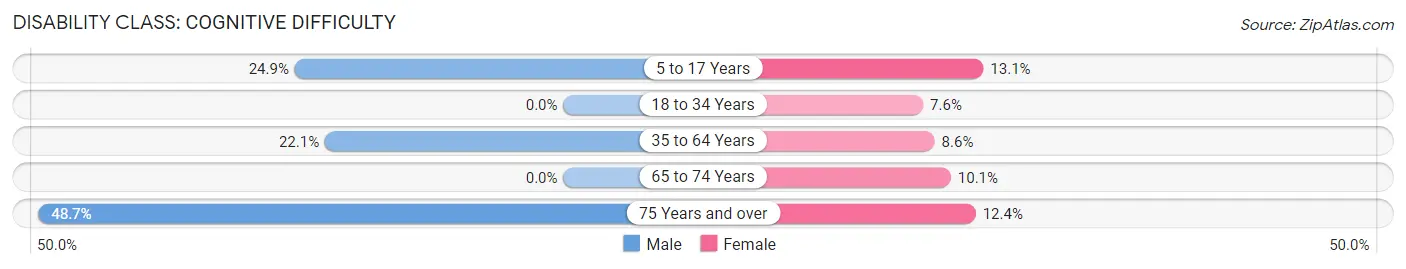
| Age Bracket | Male | Female |
| 5 to 17 Years | 92 (24.9%) | 54 (13.1%) |
| 18 to 34 Years | 0 (0.0%) | 45 (7.5%) |
| 35 to 64 Years | 215 (22.1%) | 87 (8.6%) |
| 65 to 74 Years | 0 (0.0%) | 26 (10.1%) |
| 75 Years and over | 38 (48.7%) | 22 (12.4%) |
Disability Class: Ambulatory Difficulty
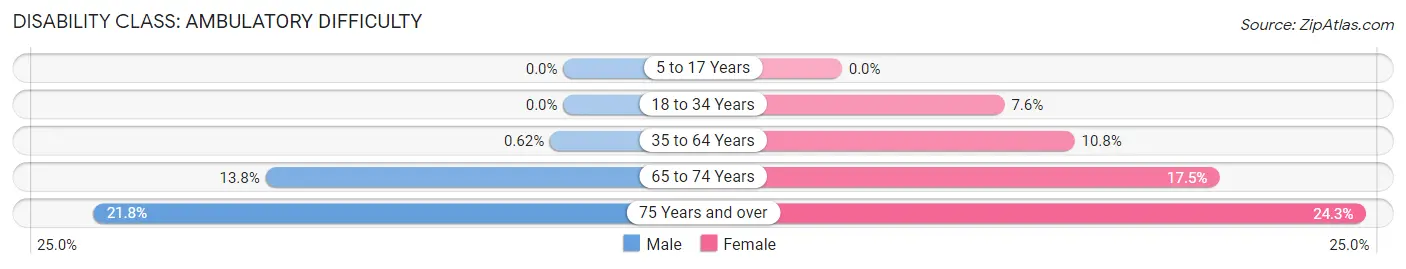
| Age Bracket | Male | Female |
| 5 to 17 Years | 0 (0.0%) | 0 (0.0%) |
| 18 to 34 Years | 0 (0.0%) | 45 (7.5%) |
| 35 to 64 Years | 6 (0.6%) | 109 (10.8%) |
| 65 to 74 Years | 38 (13.8%) | 45 (17.5%) |
| 75 Years and over | 17 (21.8%) | 43 (24.3%) |
Disability Class: Self-Care Difficulty
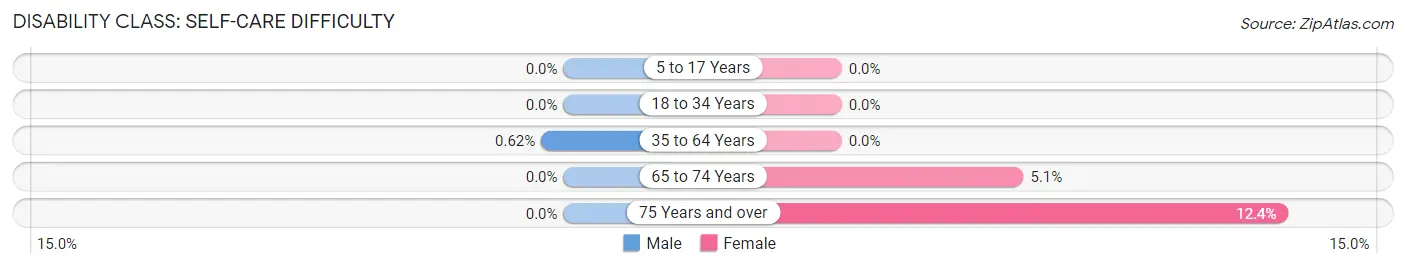
| Age Bracket | Male | Female |
| 5 to 17 Years | 0 (0.0%) | 0 (0.0%) |
| 18 to 34 Years | 0 (0.0%) | 0 (0.0%) |
| 35 to 64 Years | 6 (0.6%) | 0 (0.0%) |
| 65 to 74 Years | 0 (0.0%) | 13 (5.1%) |
| 75 Years and over | 0 (0.0%) | 22 (12.4%) |
Technology Access in Michigan Center
Computing Device Access in Michigan Center
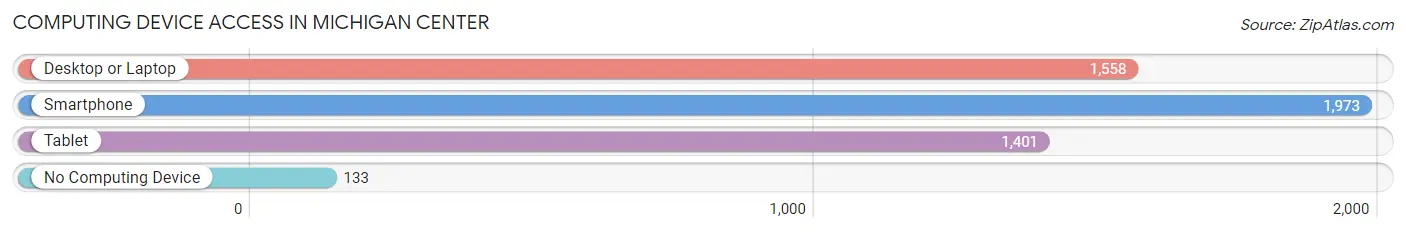
| Device Type | # Households | % Households |
| Desktop or Laptop | 1,558 | 71.8% |
| Smartphone | 1,973 | 90.9% |
| Tablet | 1,401 | 64.6% |
| No Computing Device | 133 | 6.1% |
| Total | 2,170 | 100.0% |
Internet Access in Michigan Center
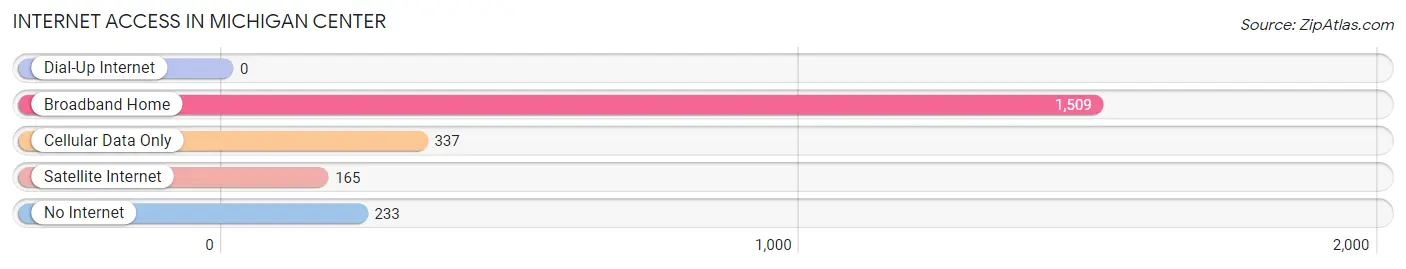
| Internet Type | # Households | % Households |
| Dial-Up Internet | 0 | 0.0% |
| Broadband Home | 1,509 | 69.5% |
| Cellular Data Only | 337 | 15.5% |
| Satellite Internet | 165 | 7.6% |
| No Internet | 233 | 10.7% |
| Total | 2,170 | 100.0% |
Michigan Center Summary
Michigan Center is a small unincorporated community located in Jackson County, Michigan. It is situated in the south-central part of the state, approximately 10 miles east of the city of Jackson. The community is bordered by the cities of Grass Lake to the north, Parma to the east, and Concord to the south. The population of Michigan Center was estimated to be 1,845 in 2019.
History
The area that is now Michigan Center was first settled in the early 1800s by settlers from New York and New England. The first post office in the area was established in 1837, and the community was officially incorporated as a village in 1867. The village was named after the nearby Michigan Central Railroad, which ran through the area.
In the late 19th century, Michigan Center was a thriving agricultural community, with many farms and orchards in the area. The village also had a number of small businesses, including a general store, a blacksmith shop, and a sawmill.
In the early 20th century, Michigan Center began to experience a decline in population as many of its residents moved away to larger cities in search of better job opportunities. The village was eventually disincorporated in the 1950s, and the area has since become an unincorporated community.
Geography
Michigan Center is located in the south-central part of the state, approximately 10 miles east of the city of Jackson. The community is bordered by the cities of Grass Lake to the north, Parma to the east, and Concord to the south.
The terrain of Michigan Center is mostly flat, with some rolling hills in the area. The soil is mostly sandy loam, with some areas of clay. The climate is humid continental, with hot summers and cold winters.
Economy
The economy of Michigan Center is largely based on agriculture. The area is home to several farms and orchards, which produce a variety of fruits and vegetables. The village also has a number of small businesses, including a general store, a blacksmith shop, and a sawmill.
Demographics
The population of Michigan Center was estimated to be 1,845 in 2019. The racial makeup of the village is 94.3% White, 1.2% African American, 0.7% Native American, 0.4% Asian, and 3.4% from other races. The median household income is $45,938, and the median home value is $127,400.
Conclusion
Michigan Center is a small unincorporated community located in Jackson County, Michigan. It is situated in the south-central part of the state, approximately 10 miles east of the city of Jackson. The population of Michigan Center was estimated to be 1,845 in 2019. The economy of Michigan Center is largely based on agriculture, with several farms and orchards in the area. The racial makeup of the village is 94.3% White, 1.2% African American, 0.7% Native American, 0.4% Asian, and 3.4% from other races. The median household income is $45,938, and the median home value is $127,400.
Common Questions
What is Per Capita Income in Michigan Center?
Per Capita income in Michigan Center is $40,255.
What is the Median Family Income in Michigan Center?
Median Family Income in Michigan Center is $69,922.
What is the Median Household income in Michigan Center?
Median Household Income in Michigan Center is $64,286.
What is Income or Wage Gap in Michigan Center?
Income or Wage Gap in Michigan Center is 9.4%.
Women in Michigan Center earn 90.6 cents for every dollar earned by a man.
What is Inequality or Gini Index in Michigan Center?
Inequality or Gini Index in Michigan Center is 0.47.
What is the Total Population of Michigan Center?
Total Population of Michigan Center is 4,906.
What is the Total Male Population of Michigan Center?
Total Male Population of Michigan Center is 2,392.
What is the Total Female Population of Michigan Center?
Total Female Population of Michigan Center is 2,514.
What is the Ratio of Males per 100 Females in Michigan Center?
There are 95.15 Males per 100 Females in Michigan Center.
What is the Ratio of Females per 100 Males in Michigan Center?
There are 105.10 Females per 100 Males in Michigan Center.
What is the Median Population Age in Michigan Center?
Median Population Age in Michigan Center is 40.4 Years.
What is the Average Family Size in Michigan Center
Average Family Size in Michigan Center is 3.0 People.
What is the Average Household Size in Michigan Center
Average Household Size in Michigan Center is 2.3 People.
How Large is the Labor Force in Michigan Center?
There are 2,517 People in the Labor Forcein in Michigan Center.
What is the Percentage of People in the Labor Force in Michigan Center?
63.2% of People are in the Labor Force in Michigan Center.
What is the Unemployment Rate in Michigan Center?
Unemployment Rate in Michigan Center is 8.5%.