Cities with the Highest Percentage of Population Taking Public Transit to Work in Maryland
RELATED REPORTS & OPTIONS
Public Transit
Maryland
Compare Cities
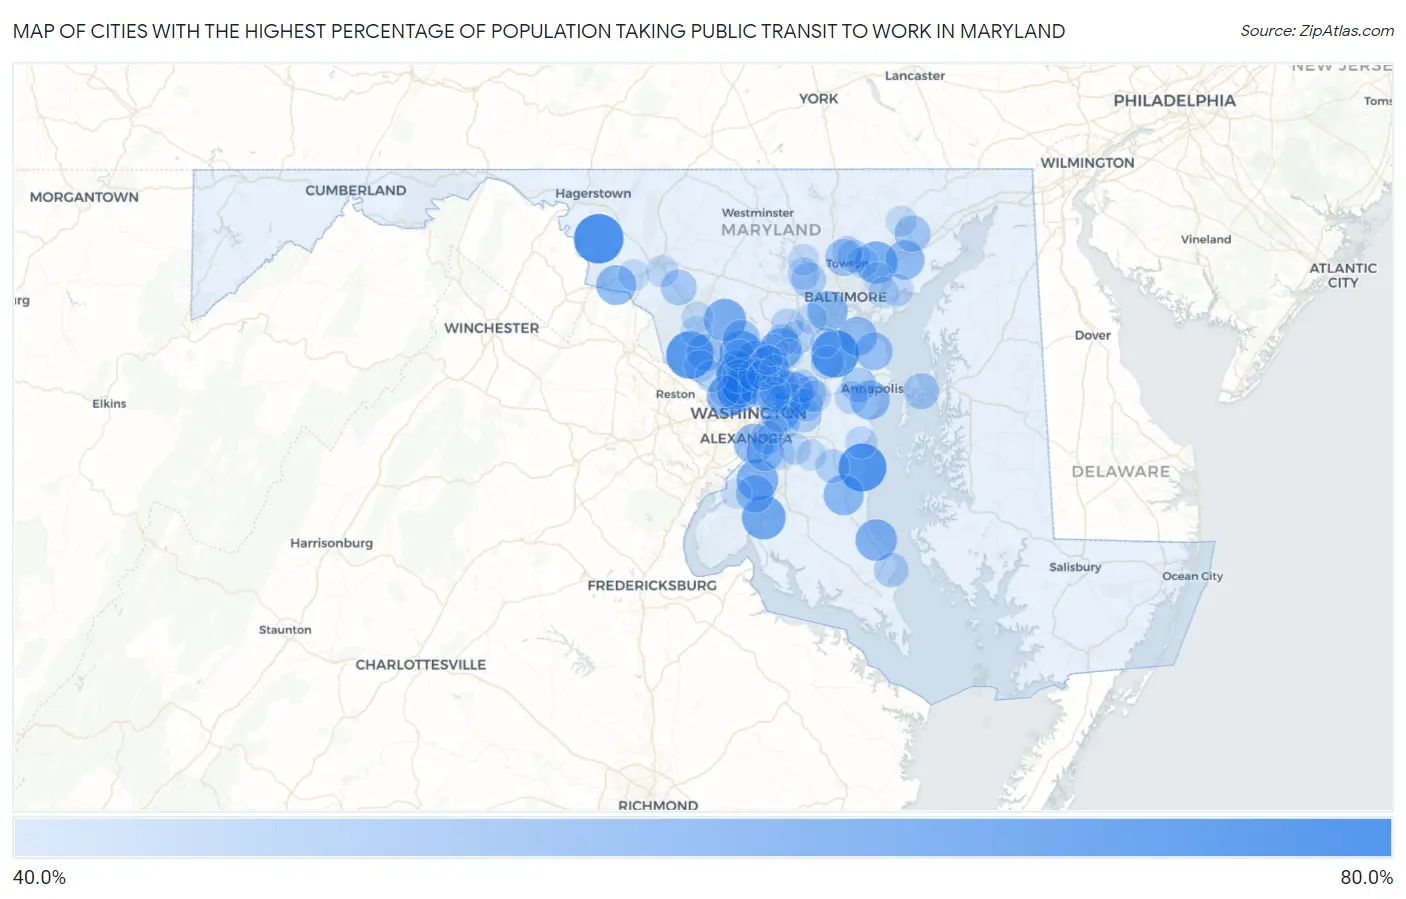
Map of Cities with the Highest Percentage of Population Taking Public Transit to Work in Maryland
0.0%
80.0%
Cities with the Highest Percentage of Population Taking Public Transit to Work in Maryland
| City | % Public Transit | vs State | vs National | |
| 1. | Keedysville | 63.5% | 40.9%(+22.6)#1 | 38.5%(+25.0)#78 |
| 2. | North Beach | 61.8% | 40.9%(+20.9)#2 | 38.5%(+23.3)#110 |
| 3. | Gambrills | 61.6% | 40.9%(+20.7)#3 | 38.5%(+23.1)#117 |
| 4. | Darnestown | 61.4% | 40.9%(+20.5)#4 | 38.5%(+22.9)#123 |
| 5. | La Plata | 57.8% | 40.9%(+16.9)#5 | 38.5%(+19.3)#271 |
| 6. | Leisure World | 57.4% | 40.9%(+16.5)#6 | 38.5%(+18.9)#291 |
| 7. | Chevy Chase View | 57.1% | 40.9%(+16.2)#7 | 38.5%(+18.6)#308 |
| 8. | Perry Hall | 56.3% | 40.9%(+15.4)#8 | 38.5%(+17.8)#355 |
| 9. | Laytonsville | 56.3% | 40.9%(+15.4)#9 | 38.5%(+17.8)#362 |
| 10. | Chevy Chase Village | 56.0% | 40.9%(+15.1)#10 | 38.5%(+17.5)#381 |
| 11. | Accokeek | 55.8% | 40.9%(+14.9)#11 | 38.5%(+17.3)#389 |
| 12. | Lanham | 55.8% | 40.9%(+14.9)#12 | 38.5%(+17.3)#390 |
| 13. | Brookmont | 55.6% | 40.9%(+14.7)#13 | 38.5%(+17.1)#403 |
| 14. | Colesville | 55.5% | 40.9%(+14.6)#14 | 38.5%(+17.0)#409 |
| 15. | Long Beach | 55.5% | 40.9%(+14.6)#15 | 38.5%(+17.0)#414 |
| 16. | Garrett Park | 55.5% | 40.9%(+14.6)#16 | 38.5%(+17.0)#415 |
| 17. | West Laurel | 54.9% | 40.9%(+14.0)#17 | 38.5%(+16.4)#458 |
| 18. | Chevy Chase Section Three | 54.5% | 40.9%(+13.6)#18 | 38.5%(+16.0)#481 |
| 19. | Huntingtown | 54.4% | 40.9%(+13.5)#19 | 38.5%(+15.9)#489 |
| 20. | Arbutus | 54.3% | 40.9%(+13.4)#20 | 38.5%(+15.8)#498 |
| 21. | Calverton | 54.3% | 40.9%(+13.4)#21 | 38.5%(+15.8)#499 |
| 22. | Rosemont | 54.0% | 40.9%(+13.1)#22 | 38.5%(+15.5)#526 |
| 23. | National Harbor | 53.9% | 40.9%(+13.0)#23 | 38.5%(+15.4)#529 |
| 24. | Annapolis Neck | 53.4% | 40.9%(+12.5)#24 | 38.5%(+14.9)#568 |
| 25. | Chevy Chase | 53.4% | 40.9%(+12.5)#25 | 38.5%(+14.9)#569 |
| 26. | Abingdon | 53.3% | 40.9%(+12.4)#26 | 38.5%(+14.8)#582 |
| 27. | Seat Pleasant | 53.3% | 40.9%(+12.4)#27 | 38.5%(+14.8)#583 |
| 28. | Joppatowne | 53.2% | 40.9%(+12.3)#28 | 38.5%(+14.7)#592 |
| 29. | Pasadena | 53.1% | 40.9%(+12.2)#29 | 38.5%(+14.6)#601 |
| 30. | Lake Shore | 52.0% | 40.9%(+11.1)#30 | 38.5%(+13.5)#688 |
| 31. | Bensville | 52.0% | 40.9%(+11.1)#31 | 38.5%(+13.5)#689 |
| 32. | Olney | 51.5% | 40.9%(+10.6)#32 | 38.5%(+13.0)#715 |
| 33. | Friendly | 51.4% | 40.9%(+10.5)#33 | 38.5%(+12.9)#737 |
| 34. | North Potomac | 51.3% | 40.9%(+10.4)#34 | 38.5%(+12.8)#743 |
| 35. | Lutherville | 51.0% | 40.9%(+10.1)#35 | 38.5%(+12.5)#780 |
| 36. | Bel Air South | 50.5% | 40.9%(+9.60)#36 | 38.5%(+12.0)#821 |
| 37. | Maryland Park | 50.4% | 40.9%(+9.50)#37 | 38.5%(+11.9)#840 |
| 38. | Somerset | 50.3% | 40.9%(+9.40)#38 | 38.5%(+11.8)#856 |
| 39. | Chevy Chase Section Five | 50.3% | 40.9%(+9.40)#39 | 38.5%(+11.8)#857 |
| 40. | Chester | 50.2% | 40.9%(+9.30)#40 | 38.5%(+11.7)#874 |
| 41. | Brown Station | 50.1% | 40.9%(+9.20)#41 | 38.5%(+11.6)#888 |
| 42. | Urbana | 49.9% | 40.9%(+9.00)#42 | 38.5%(+11.4)#901 |
| 43. | Flower Hill | 49.8% | 40.9%(+8.90)#43 | 38.5%(+11.3)#909 |
| 44. | Berwyn Heights | 49.8% | 40.9%(+8.90)#44 | 38.5%(+11.3)#912 |
| 45. | Takoma Park | 49.5% | 40.9%(+8.60)#45 | 38.5%(+11.0)#955 |
| 46. | Parole | 49.3% | 40.9%(+8.40)#46 | 38.5%(+10.8)#992 |
| 47. | Fairwood | 49.3% | 40.9%(+8.40)#47 | 38.5%(+10.8)#999 |
| 48. | Kettering | 49.2% | 40.9%(+8.30)#48 | 38.5%(+10.7)#1,011 |
| 49. | Springdale | 49.2% | 40.9%(+8.30)#49 | 38.5%(+10.7)#1,014 |
| 50. | Milford Mill | 49.1% | 40.9%(+8.20)#50 | 38.5%(+10.6)#1,021 |
| 51. | District Heights | 49.1% | 40.9%(+8.20)#51 | 38.5%(+10.6)#1,032 |
| 52. | Chesapeake Ranch Estates | 49.0% | 40.9%(+8.10)#52 | 38.5%(+10.5)#1,046 |
| 53. | Woodlawn Cdp Prince George S County | 49.0% | 40.9%(+8.10)#53 | 38.5%(+10.5)#1,049 |
| 54. | Dunkirk | 48.4% | 40.9%(+7.50)#54 | 38.5%(+9.90)#1,125 |
| 55. | Temple Hills | 48.1% | 40.9%(+7.20)#55 | 38.5%(+9.60)#1,170 |
| 56. | Savage | 48.1% | 40.9%(+7.20)#56 | 38.5%(+9.60)#1,171 |
| 57. | Burnt Mills | 48.1% | 40.9%(+7.20)#57 | 38.5%(+9.60)#1,177 |
| 58. | North Brentwood | 48.0% | 40.9%(+7.10)#58 | 38.5%(+9.50)#1,186 |
| 59. | Odenton | 47.7% | 40.9%(+6.80)#59 | 38.5%(+9.20)#1,214 |
| 60. | South Kensington | 47.6% | 40.9%(+6.70)#60 | 38.5%(+9.10)#1,233 |
| 61. | Woodmore | 47.6% | 40.9%(+6.70)#61 | 38.5%(+9.10)#1,240 |
| 62. | Four Corners | 47.5% | 40.9%(+6.60)#62 | 38.5%(+9.00)#1,257 |
| 63. | Hampton | 47.5% | 40.9%(+6.60)#63 | 38.5%(+9.00)#1,259 |
| 64. | Riva | 47.5% | 40.9%(+6.60)#64 | 38.5%(+9.00)#1,261 |
| 65. | Columbia | 47.3% | 40.9%(+6.40)#65 | 38.5%(+8.80)#1,284 |
| 66. | Glenn Dale | 47.3% | 40.9%(+6.40)#66 | 38.5%(+8.80)#1,293 |
| 67. | Randallstown | 46.9% | 40.9%(+6.00)#67 | 38.5%(+8.40)#1,355 |
| 68. | Greenbelt | 46.9% | 40.9%(+6.00)#68 | 38.5%(+8.40)#1,357 |
| 69. | Bladensburg | 46.8% | 40.9%(+5.90)#69 | 38.5%(+8.30)#1,373 |
| 70. | Bowleys Quarters | 46.8% | 40.9%(+5.90)#70 | 38.5%(+8.30)#1,377 |
| 71. | Ballenger Creek | 46.7% | 40.9%(+5.80)#71 | 38.5%(+8.20)#1,382 |
| 72. | Travilah | 46.7% | 40.9%(+5.80)#72 | 38.5%(+8.20)#1,387 |
| 73. | Scaggsville | 46.7% | 40.9%(+5.80)#73 | 38.5%(+8.20)#1,388 |
| 74. | Deale | 46.6% | 40.9%(+5.70)#74 | 38.5%(+8.10)#1,407 |
| 75. | Clinton | 46.5% | 40.9%(+5.60)#75 | 38.5%(+8.00)#1,410 |
| 76. | Bowie | 46.4% | 40.9%(+5.50)#76 | 38.5%(+7.90)#1,433 |
| 77. | Rosaryville | 46.4% | 40.9%(+5.50)#77 | 38.5%(+7.90)#1,443 |
| 78. | Glen Echo | 46.3% | 40.9%(+5.40)#78 | 38.5%(+7.80)#1,463 |
| 79. | Owings Mills | 46.2% | 40.9%(+5.30)#79 | 38.5%(+7.70)#1,465 |
| 80. | Carney | 46.2% | 40.9%(+5.30)#80 | 38.5%(+7.70)#1,467 |
| 81. | Clarksburg | 46.2% | 40.9%(+5.30)#81 | 38.5%(+7.70)#1,468 |
| 82. | Burtonsville | 46.2% | 40.9%(+5.30)#82 | 38.5%(+7.70)#1,474 |
| 83. | Essex | 46.1% | 40.9%(+5.20)#83 | 38.5%(+7.60)#1,488 |
| 84. | Ilchester | 46.1% | 40.9%(+5.20)#84 | 38.5%(+7.60)#1,489 |
| 85. | Jefferson | 46.0% | 40.9%(+5.10)#85 | 38.5%(+7.50)#1,504 |
| 86. | Potomac | 45.9% | 40.9%(+5.00)#86 | 38.5%(+7.40)#1,506 |
| 87. | Riverdale Park | 45.9% | 40.9%(+5.00)#87 | 38.5%(+7.40)#1,513 |
| 88. | Croom | 45.8% | 40.9%(+4.90)#88 | 38.5%(+7.30)#1,527 |
| 89. | Bel Air North | 45.7% | 40.9%(+4.80)#89 | 38.5%(+7.20)#1,538 |
| 90. | Germantown | 45.6% | 40.9%(+4.70)#90 | 38.5%(+7.10)#1,549 |
| 91. | Aspen Hill | 45.4% | 40.9%(+4.50)#91 | 38.5%(+6.90)#1,589 |
| 92. | Rossville | 45.4% | 40.9%(+4.50)#92 | 38.5%(+6.90)#1,597 |
| 93. | Timonium | 45.3% | 40.9%(+4.40)#93 | 38.5%(+6.80)#1,617 |
| 94. | Beltsville | 45.1% | 40.9%(+4.20)#94 | 38.5%(+6.60)#1,651 |
| 95. | Bryans Road | 44.9% | 40.9%(+4.00)#95 | 38.5%(+6.40)#1,685 |
| 96. | Hillandale | 44.7% | 40.9%(+3.80)#96 | 38.5%(+6.20)#1,712 |
| 97. | Laurel | 44.6% | 40.9%(+3.70)#97 | 38.5%(+6.10)#1,720 |
| 98. | Fairland | 44.6% | 40.9%(+3.70)#98 | 38.5%(+6.10)#1,722 |
| 99. | Silver Hill | 44.6% | 40.9%(+3.70)#99 | 38.5%(+6.10)#1,728 |
| 100. | Severn | 44.5% | 40.9%(+3.60)#100 | 38.5%(+6.00)#1,734 |
Common Questions
What are the Top 10 Cities with the Highest Percentage of Population Taking Public Transit to Work in Maryland?
Top 10 Cities with the Highest Percentage of Population Taking Public Transit to Work in Maryland are:
#1
63.5%
#2
61.8%
#3
61.6%
#4
61.4%
#5
57.8%
#6
57.4%
#7
57.1%
#8
56.3%
#9
56.3%
#10
56.0%
What city has the Highest Percentage of Population Taking Public Transit to Work in Maryland?
Keedysville has the Highest Percentage of Population Taking Public Transit to Work in Maryland with 63.5%.
What is the Percentage of Population Taking Public Transit to Work in the State of Maryland?
Percentage of Population Taking Public Transit to Work in Maryland is 40.9%.
What is the Percentage of Population Taking Public Transit to Work in the United States?
Percentage of Population Taking Public Transit to Work in the United States is 38.5%.