Cities with the Highest Percentage of Immigrants from Panama in New Jersey
RELATED REPORTS & OPTIONS
Panama
New Jersey
Compare Cities
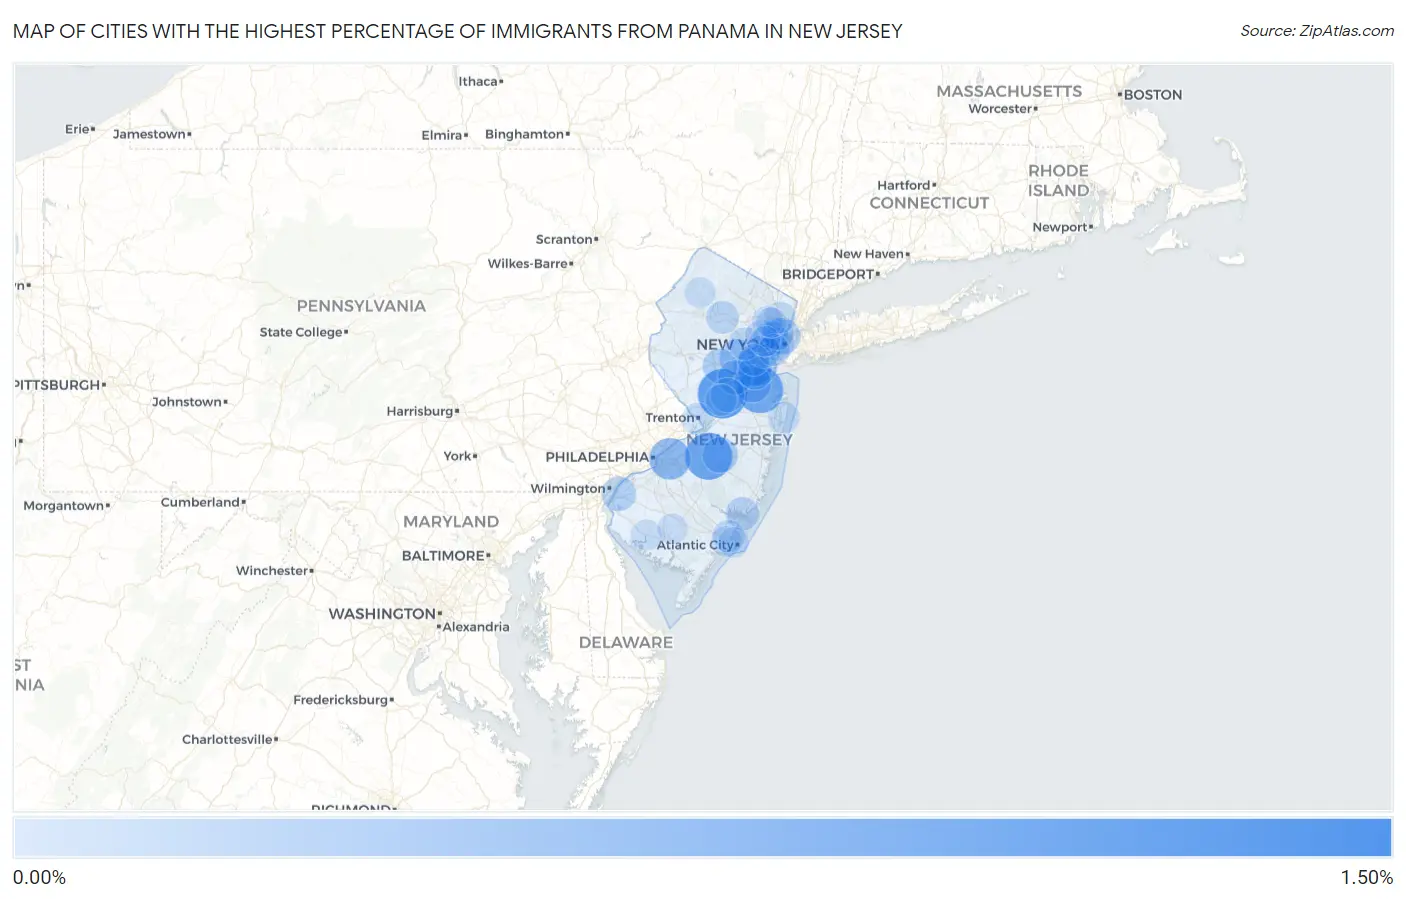
Map of Cities with the Highest Percentage of Immigrants from Panama in New Jersey
0.00%
1.50%
Cities with the Highest Percentage of Immigrants from Panama in New Jersey
| City | Panama | vs State | vs National | |
| 1. | Liberty Corner | 1.14% | 0.046%(+1.09)#-1 | 0.032%(+1.11)#0 |
| 2. | Roselle Borough | 0.95% | 0.046%(+0.900)#0 | 0.032%(+0.915)#1 |
| 3. | Monmouth Junction | 0.94% | 0.046%(+0.897)#1 | 0.032%(+0.912)#2 |
| 4. | Roselle Park Borough | 0.85% | 0.046%(+0.806)#2 | 0.032%(+0.820)#24 |
| 5. | Pemberton Heights | 0.83% | 0.046%(+0.782)#3 | 0.032%(+0.797)#25 |
| 6. | Strathmore | 0.80% | 0.046%(+0.750)#4 | 0.032%(+0.765)#26 |
| 7. | Westwood Borough | 0.59% | 0.046%(+0.541)#5 | 0.032%(+0.555)#27 |
| 8. | Cherry Hill Mall | 0.54% | 0.046%(+0.497)#6 | 0.032%(+0.511)#28 |
| 9. | Port Reading | 0.45% | 0.046%(+0.399)#7 | 0.032%(+0.414)#29 |
| 10. | Woodbridge | 0.39% | 0.046%(+0.345)#8 | 0.032%(+0.360)#30 |
| 11. | Middlesex Borough | 0.39% | 0.046%(+0.339)#9 | 0.032%(+0.354)#31 |
| 12. | Carteret Borough | 0.35% | 0.046%(+0.307)#10 | 0.032%(+0.322)#32 |
| 13. | Madison Park | 0.35% | 0.046%(+0.303)#11 | 0.032%(+0.318)#33 |
| 14. | Wallington Borough | 0.35% | 0.046%(+0.300)#12 | 0.032%(+0.315)#34 |
| 15. | Plainfield | 0.30% | 0.046%(+0.253)#13 | 0.032%(+0.268)#85 |
| 16. | Union City | 0.29% | 0.046%(+0.244)#14 | 0.032%(+0.258)#86 |
| 17. | Haledon Borough | 0.28% | 0.046%(+0.233)#15 | 0.032%(+0.248)#87 |
| 18. | Fanwood Borough | 0.27% | 0.046%(+0.226)#16 | 0.032%(+0.240)#88 |
| 19. | Browns Mills | 0.26% | 0.046%(+0.212)#17 | 0.032%(+0.227)#89 |
| 20. | Finderne | 0.22% | 0.046%(+0.175)#18 | 0.032%(+0.189)#90 |
| 21. | Kearny | 0.22% | 0.046%(+0.172)#19 | 0.032%(+0.187)#91 |
| 22. | Chesilhurst Borough | 0.22% | 0.046%(+0.170)#20 | 0.032%(+0.185)#92 |
| 23. | Elmwood Park Borough | 0.21% | 0.046%(+0.165)#21 | 0.032%(+0.180)#93 |
| 24. | Carneys Point | 0.21% | 0.046%(+0.163)#22 | 0.032%(+0.177)#94 |
| 25. | New Brunswick | 0.20% | 0.046%(+0.155)#23 | 0.032%(+0.169)#95 |
| 26. | Dayton | 0.19% | 0.046%(+0.145)#24 | 0.032%(+0.160)#96 |
| 27. | Perth Amboy | 0.19% | 0.046%(+0.142)#25 | 0.032%(+0.157)#97 |
| 28. | Keyport Borough | 0.18% | 0.046%(+0.134)#26 | 0.032%(+0.149)#98 |
| 29. | Lake Como Borough | 0.18% | 0.046%(+0.129)#27 | 0.032%(+0.144)#99 |
| 30. | Cliffside Park Borough | 0.17% | 0.046%(+0.122)#28 | 0.032%(+0.137)#100 |
| 31. | Jersey City | 0.17% | 0.046%(+0.122)#29 | 0.032%(+0.136)#240 |
| 32. | Mystic Island | 0.16% | 0.046%(+0.111)#30 | 0.032%(+0.125)#241 |
| 33. | Elizabeth | 0.15% | 0.046%(+0.103)#31 | 0.032%(+0.117)#242 |
| 34. | North Haledon Borough | 0.14% | 0.046%(+0.090)#32 | 0.032%(+0.105)#243 |
| 35. | Dover | 0.12% | 0.046%(+0.078)#33 | 0.032%(+0.093)#244 |
| 36. | Raritan Borough | 0.12% | 0.046%(+0.074)#34 | 0.032%(+0.089)#245 |
| 37. | Summit | 0.12% | 0.046%(+0.073)#35 | 0.032%(+0.088)#246 |
| 38. | Ramsey Borough | 0.12% | 0.046%(+0.069)#36 | 0.032%(+0.084)#247 |
| 39. | East Orange | 0.11% | 0.046%(+0.068)#37 | 0.032%(+0.083)#248 |
| 40. | North Plainfield Borough | 0.11% | 0.046%(+0.068)#38 | 0.032%(+0.083)#249 |
| 41. | Secaucus | 0.11% | 0.046%(+0.065)#39 | 0.032%(+0.080)#250 |
| 42. | Hawthorne Borough | 0.10% | 0.046%(+0.056)#40 | 0.032%(+0.071)#251 |
| 43. | Absecon | 0.099% | 0.046%(+0.053)#41 | 0.032%(+0.067)#252 |
| 44. | Bayonne | 0.092% | 0.046%(+0.046)#42 | 0.032%(+0.060)#253 |
| 45. | Trenton | 0.080% | 0.046%(+0.034)#43 | 0.032%(+0.048)#254 |
| 46. | Asbury Park | 0.079% | 0.046%(+0.032)#44 | 0.032%(+0.047)#255 |
| 47. | Princeton Meadows | 0.071% | 0.046%(+0.024)#45 | 0.032%(+0.039)#256 |
| 48. | Rahway | 0.067% | 0.046%(+0.021)#46 | 0.032%(+0.036)#257 |
| 49. | Rutherford Borough | 0.064% | 0.046%(+0.018)#47 | 0.032%(+0.032)#258 |
| 50. | Hackensack | 0.063% | 0.046%(+0.017)#48 | 0.032%(+0.032)#259 |
| 51. | Dumont Borough | 0.061% | 0.046%(+0.015)#49 | 0.032%(+0.029)#260 |
| 52. | Madison Borough | 0.054% | 0.046%(+0.008)#50 | 0.032%(+0.023)#261 |
| 53. | Sayreville Borough | 0.053% | 0.046%(+0.007)#51 | 0.032%(+0.021)#262 |
| 54. | Fair Lawn Borough | 0.052% | 0.046%(+0.005)#52 | 0.032%(+0.020)#263 |
| 55. | South Plainfield Borough | 0.045% | 0.046%(-0.001)#53 | 0.032%(+0.014)#264 |
| 56. | Newton | 0.036% | 0.046%(-0.011)#54 | 0.032%(+0.004)#265 |
| 57. | Pleasantville | 0.034% | 0.046%(-0.012)#55 | 0.032%(+0.002)#266 |
| 58. | Clifton | 0.031% | 0.046%(-0.015)#56 | 0.032%(-0.000)#267 |
| 59. | Bridgeton | 0.030% | 0.046%(-0.017)#57 | 0.032%(-0.002)#268 |
| 60. | Newark | 0.024% | 0.046%(-0.022)#58 | 0.032%(-0.008)#269 |
| 61. | Atlantic City | 0.018% | 0.046%(-0.028)#59 | 0.032%(-0.014)#270 |
| 62. | Vineland | 0.018% | 0.046%(-0.028)#60 | 0.032%(-0.014)#271 |
| 63. | Fort Lee Borough | 0.018% | 0.046%(-0.029)#61 | 0.032%(-0.014)#272 |
| 64. | Passaic | 0.014% | 0.046%(-0.032)#62 | 0.032%(-0.018)#273 |
| 65. | Sicklerville | 0.013% | 0.046%(-0.033)#63 | 0.032%(-0.019)#274 |
Common Questions
What are the Top 10 Cities with the Highest Percentage of Immigrants from Panama in New Jersey?
Top 10 Cities with the Highest Percentage of Immigrants from Panama in New Jersey are:
#1
0.94%
#2
0.83%
#3
0.80%
#4
0.54%
#5
0.45%
#6
0.39%
#7
0.35%
#8
0.30%
#9
0.29%
#10
0.26%
What city has the Highest Percentage of Immigrants from Panama in New Jersey?
Monmouth Junction has the Highest Percentage of Immigrants from Panama in New Jersey with 0.94%.
What is the Percentage of Immigrants from Panama in the State of New Jersey?
Percentage of Immigrants from Panama in New Jersey is 0.046%.
What is the Percentage of Immigrants from Panama in the United States?
Percentage of Immigrants from Panama in the United States is 0.032%.