Donnellson, IL Map & Demographics
Donnellson Map
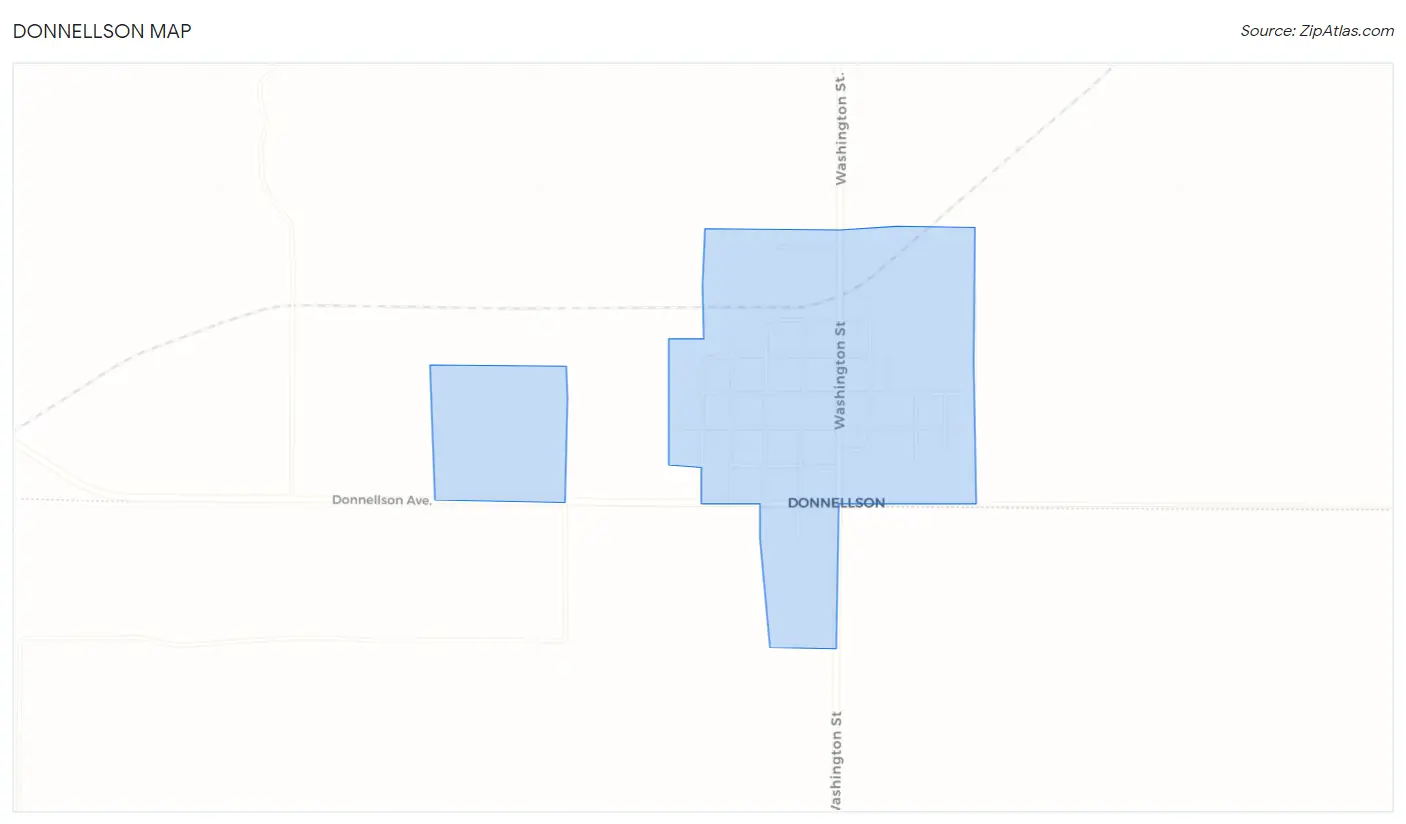
Donnellson Overview
$19,995
PER CAPITA INCOME
0.45
INEQUALITY / GINI INDEX
142
TOTAL POPULATION
104
MALE POPULATION
38
FEMALE POPULATION
273.68
MALES / 100 FEMALES
36.54
FEMALES / 100 MALES
38.6
MEDIAN AGE
2.7
AVG FAMILY SIZE
2.2
AVG HOUSEHOLD SIZE
32
LABOR FORCE [ PEOPLE ]
28.1%
PERCENT IN LABOR FORCE
Donnellson Zip Codes
Donnellson Area Codes
Income in Donnellson
Income Overview in Donnellson
| Characteristic | Number | Measure |
| Per Capita Income | 142 | $19,995 |
| Median Family Income | 39 | $0 |
| Mean Family Income | 39 | $41,121 |
| Median Household Income | 64 | $0 |
| Mean Household Income | 64 | $41,602 |
| Income Deficit | 39 | $0 |
| Wage / Income Gap (%) | 142 | 0.00% |
| Wage / Income Gap ($) | 142 | 100.00¢ per $1 |
| Gini / Inequality Index | 142 | 0.45 |
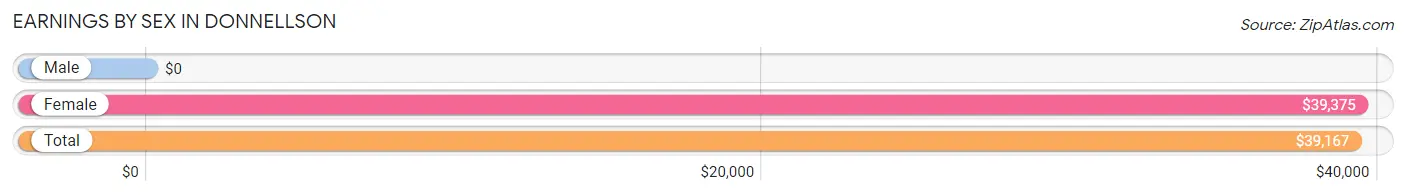
Earnings by Sex in Donnellson
| Sex | Number | Average Earnings |
| Male | 25 (69.4%) | $0 |
| Female | 11 (30.6%) | $39,375 |
| Total | 36 (100.0%) | $39,167 |
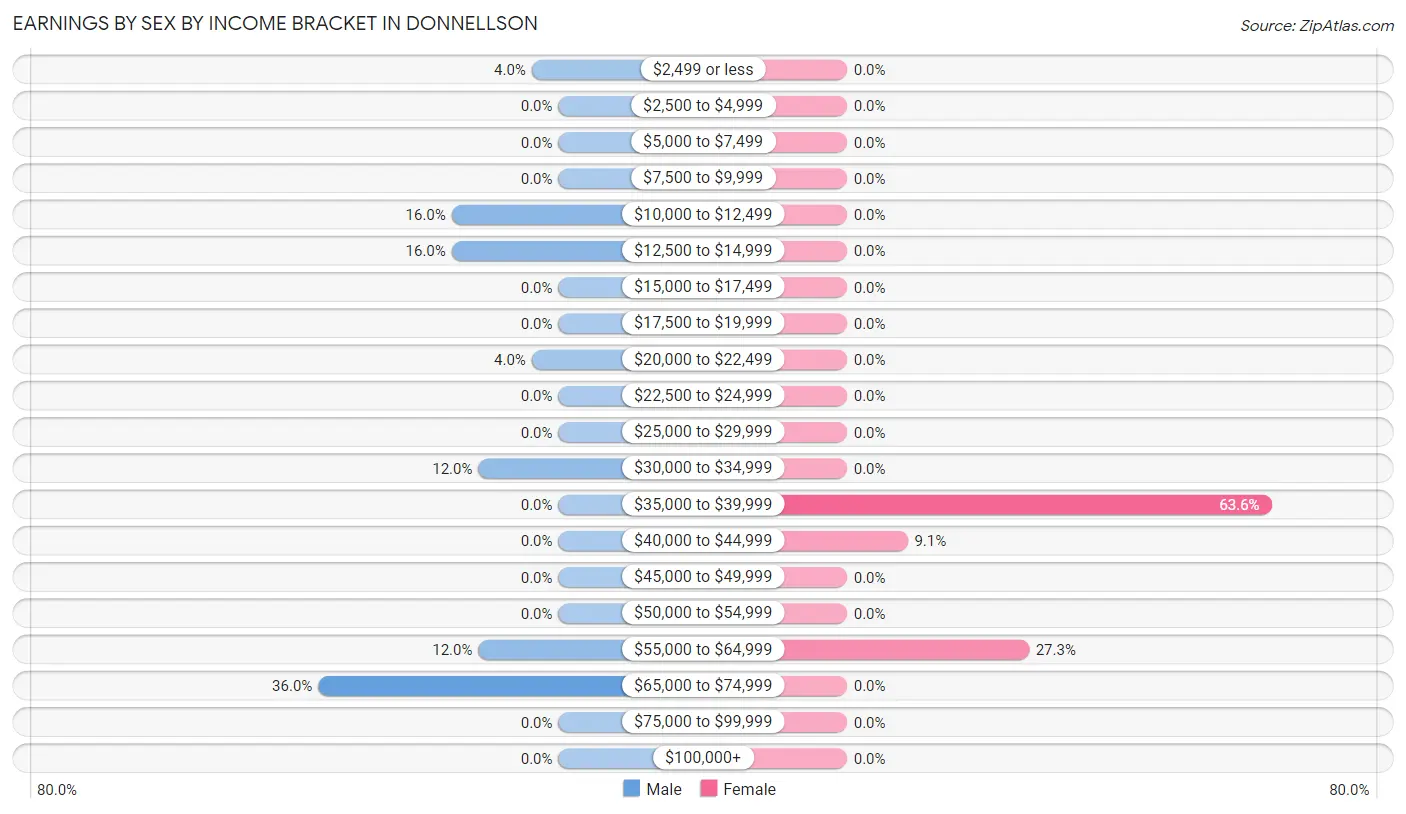
Earnings by Sex by Income Bracket in Donnellson
The most common earnings brackets in Donnellson are $65,000 to $74,999 for men (9 | 36.0%) and $35,000 to $39,999 for women (7 | 63.6%).
| Income | Male | Female |
| $2,499 or less | 1 (4.0%) | 0 (0.0%) |
| $2,500 to $4,999 | 0 (0.0%) | 0 (0.0%) |
| $5,000 to $7,499 | 0 (0.0%) | 0 (0.0%) |
| $7,500 to $9,999 | 0 (0.0%) | 0 (0.0%) |
| $10,000 to $12,499 | 4 (16.0%) | 0 (0.0%) |
| $12,500 to $14,999 | 4 (16.0%) | 0 (0.0%) |
| $15,000 to $17,499 | 0 (0.0%) | 0 (0.0%) |
| $17,500 to $19,999 | 0 (0.0%) | 0 (0.0%) |
| $20,000 to $22,499 | 1 (4.0%) | 0 (0.0%) |
| $22,500 to $24,999 | 0 (0.0%) | 0 (0.0%) |
| $25,000 to $29,999 | 0 (0.0%) | 0 (0.0%) |
| $30,000 to $34,999 | 3 (12.0%) | 0 (0.0%) |
| $35,000 to $39,999 | 0 (0.0%) | 7 (63.6%) |
| $40,000 to $44,999 | 0 (0.0%) | 1 (9.1%) |
| $45,000 to $49,999 | 0 (0.0%) | 0 (0.0%) |
| $50,000 to $54,999 | 0 (0.0%) | 0 (0.0%) |
| $55,000 to $64,999 | 3 (12.0%) | 3 (27.3%) |
| $65,000 to $74,999 | 9 (36.0%) | 0 (0.0%) |
| $75,000 to $99,999 | 0 (0.0%) | 0 (0.0%) |
| $100,000+ | 0 (0.0%) | 0 (0.0%) |
| Total | 25 (100.0%) | 11 (100.0%) |
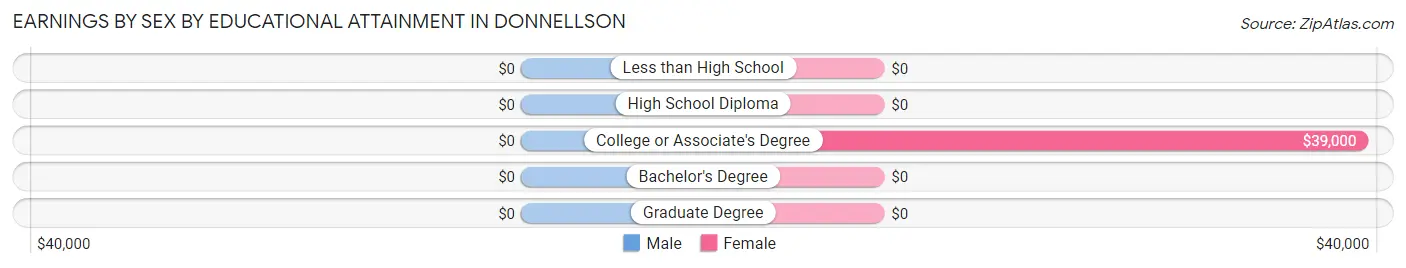
Earnings by Sex by Educational Attainment in Donnellson
| Educational Attainment | Male Income | Female Income |
| Less than High School | - | - |
| High School Diploma | - | - |
| College or Associate's Degree | - | - |
| Bachelor's Degree | - | - |
| Graduate Degree | - | - |
| Total | - | - |
Family Income in Donnellson
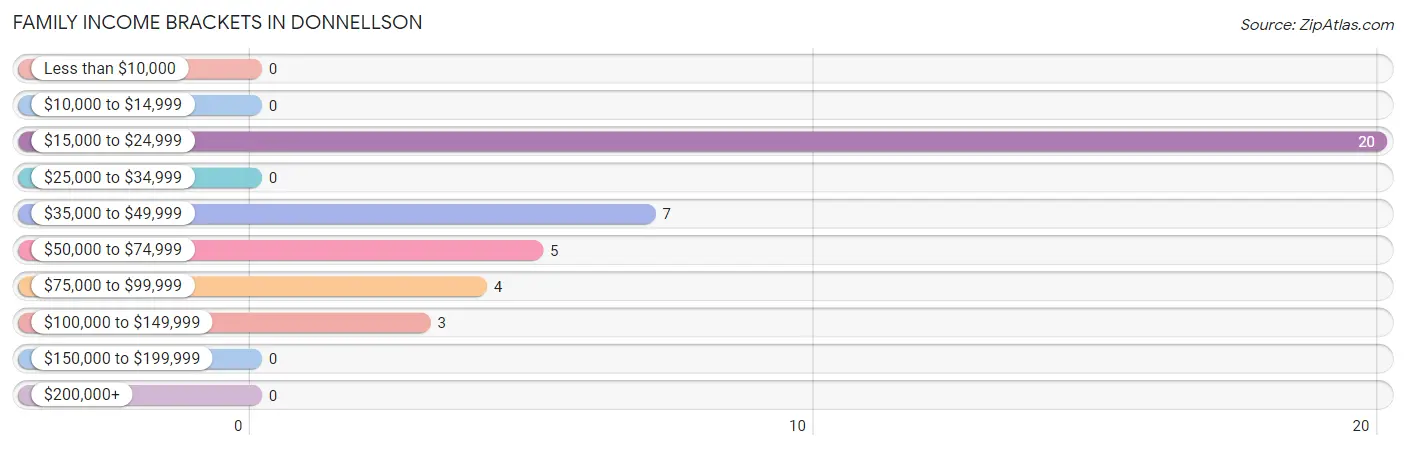
Family Income Brackets in Donnellson
According to the Donnellson family income data, there are 20 families falling into the $15,000 to $24,999 income range, which is the most common income bracket and makes up 51.3% of all families.
| Income Bracket | # Families | % Families |
| Less than $10,000 | 0 | 0.0% |
| $10,000 to $14,999 | 0 | 0.0% |
| $15,000 to $24,999 | 20 | 51.3% |
| $25,000 to $34,999 | 0 | 0.0% |
| $35,000 to $49,999 | 7 | 17.9% |
| $50,000 to $74,999 | 5 | 12.8% |
| $75,000 to $99,999 | 4 | 10.3% |
| $100,000 to $149,999 | 3 | 7.7% |
| $150,000 to $199,999 | 0 | 0.0% |
| $200,000+ | 0 | 0.0% |
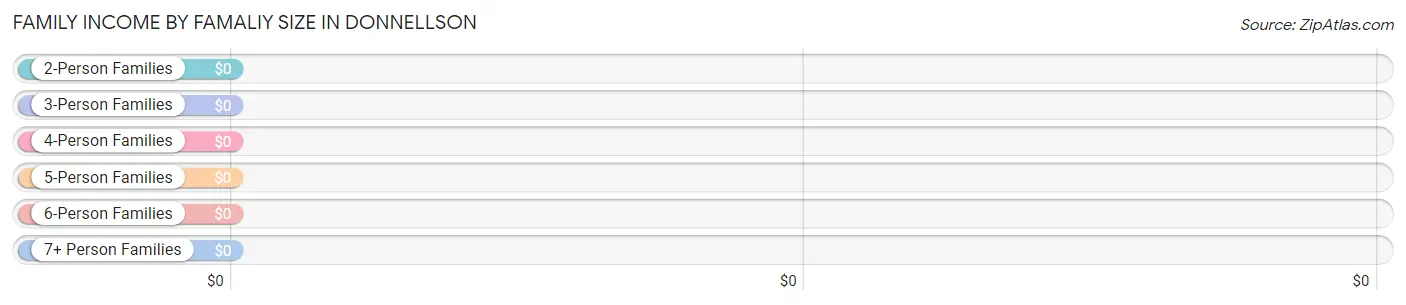
Family Income by Famaliy Size in Donnellson
| Income Bracket | # Families | Median Income |
| 2-Person Families | 33 (84.6%) | $0 |
| 3-Person Families | 1 (2.6%) | $0 |
| 4-Person Families | 0 (0.0%) | $0 |
| 5-Person Families | 0 (0.0%) | $0 |
| 6-Person Families | 0 (0.0%) | $0 |
| 7+ Person Families | 5 (12.8%) | $0 |
| Total | 39 (100.0%) | $0 |
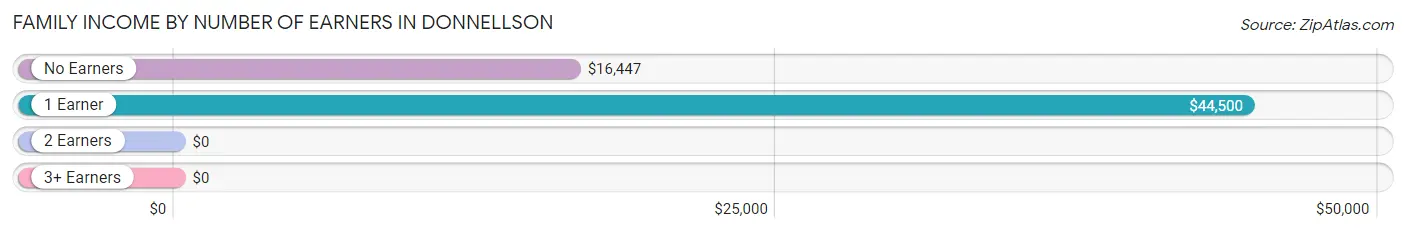
Family Income by Number of Earners in Donnellson
| Number of Earners | # Families | Median Income |
| No Earners | 22 (56.4%) | $16,447 |
| 1 Earner | 10 (25.6%) | $44,500 |
| 2 Earners | 7 (17.9%) | $0 |
| 3+ Earners | 0 (0.0%) | $0 |
| Total | 39 (100.0%) | $0 |
Household Income in Donnellson
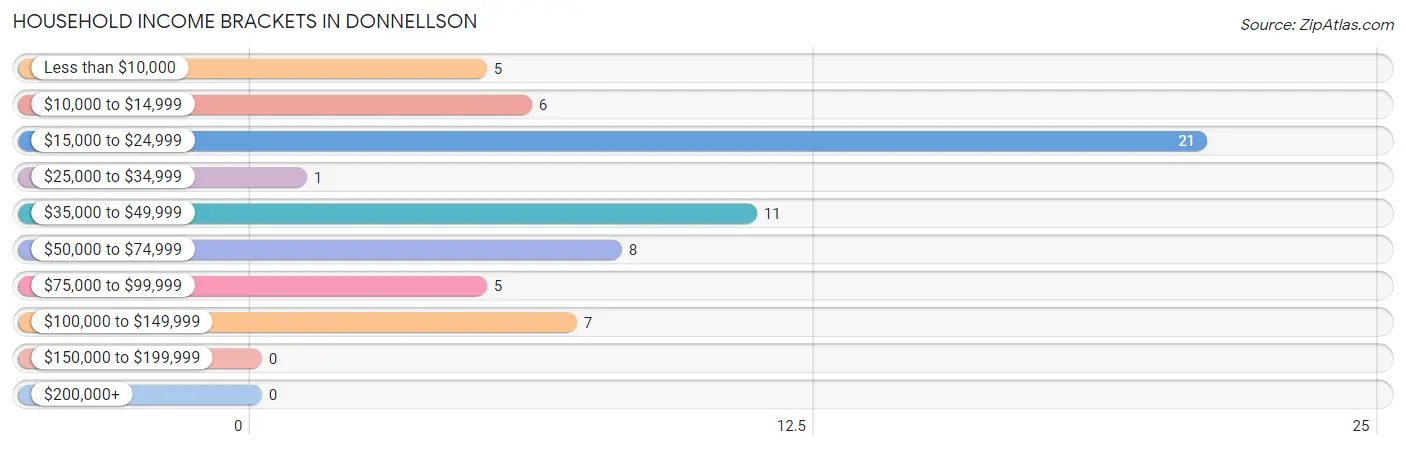
Household Income Brackets in Donnellson
With 21 households falling in the category, the $15,000 to $24,999 income range is the most frequent in Donnellson, accounting for 32.8% of all households.
| Income Bracket | # Households | % Households |
| Less than $10,000 | 5 | 7.8% |
| $10,000 to $14,999 | 6 | 9.4% |
| $15,000 to $24,999 | 21 | 32.8% |
| $25,000 to $34,999 | 1 | 1.6% |
| $35,000 to $49,999 | 11 | 17.2% |
| $50,000 to $74,999 | 8 | 12.5% |
| $75,000 to $99,999 | 5 | 7.8% |
| $100,000 to $149,999 | 7 | 10.9% |
| $150,000 to $199,999 | 0 | 0.0% |
| $200,000+ | 0 | 0.0% |
Household Income by Householder Age in Donnellson
The median household income in Donnellson is $0, with the highest median household income of $43,750 found in the 45 to 64 years age bracket for the primary householder. A total of 17 households (26.6%) fall into this category.
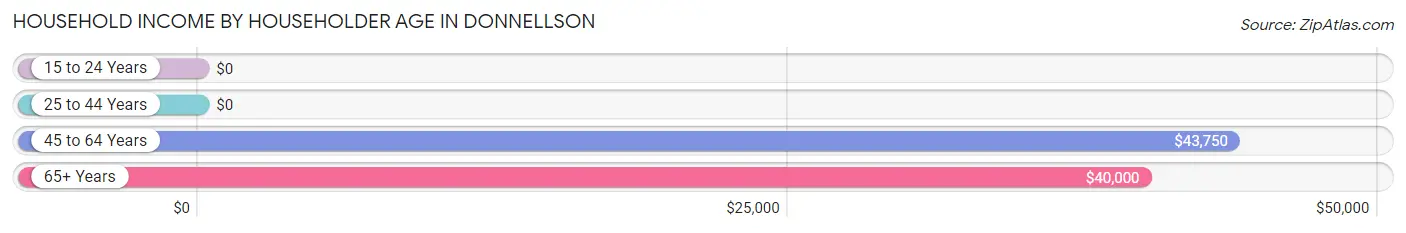
| Income Bracket | # Households | Median Income |
| 15 to 24 Years | 0 (0.0%) | $0 |
| 25 to 44 Years | 27 (42.2%) | $0 |
| 45 to 64 Years | 17 (26.6%) | $43,750 |
| 65+ Years | 20 (31.2%) | $40,000 |
| Total | 64 (100.0%) | $0 |
Poverty in Donnellson
Income Below Poverty by Sex and Age in Donnellson
With 70.2% poverty level for males and 42.1% for females among the residents of Donnellson, 6 to 11 year old males and under 5 year old females are the most vulnerable to poverty, with 8 males (100.0%) and 4 females (100.0%) in their respective age groups living below the poverty level.
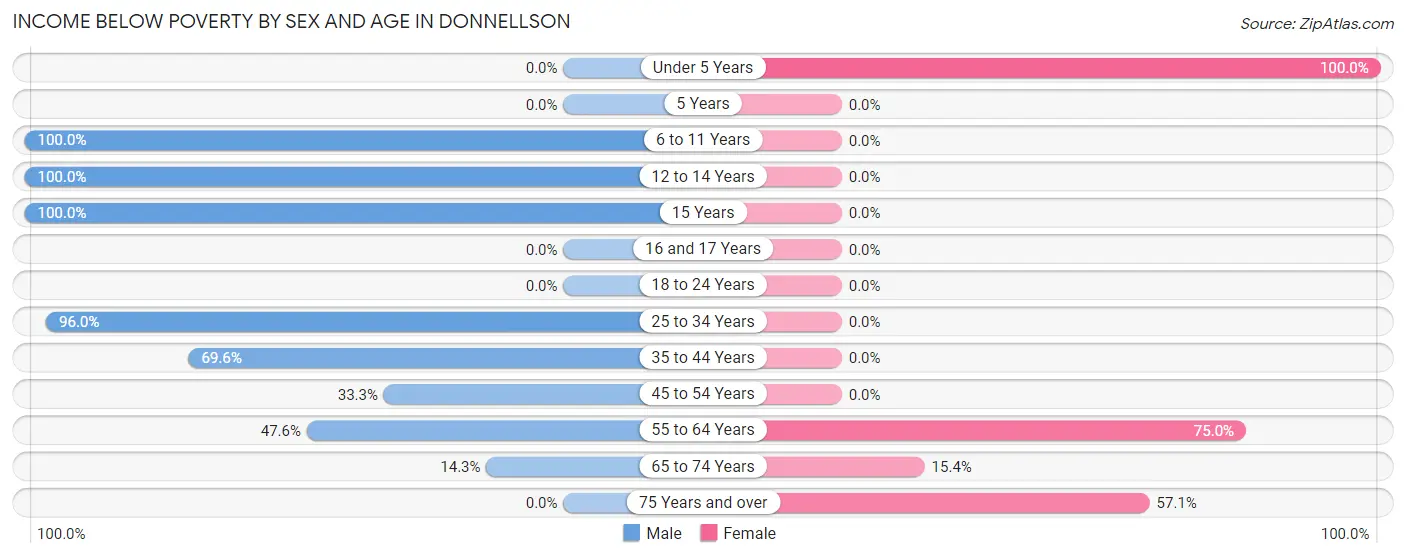
| Age Bracket | Male | Female |
| Under 5 Years | 0 (0.0%) | 4 (100.0%) |
| 5 Years | 0 (0.0%) | 0 (0.0%) |
| 6 to 11 Years | 8 (100.0%) | 0 (0.0%) |
| 12 to 14 Years | 7 (100.0%) | 0 (0.0%) |
| 15 Years | 6 (100.0%) | 0 (0.0%) |
| 16 and 17 Years | 0 (0.0%) | 0 (0.0%) |
| 18 to 24 Years | 0 (0.0%) | 0 (0.0%) |
| 25 to 34 Years | 24 (96.0%) | 0 (0.0%) |
| 35 to 44 Years | 16 (69.6%) | 0 (0.0%) |
| 45 to 54 Years | 1 (33.3%) | 0 (0.0%) |
| 55 to 64 Years | 10 (47.6%) | 6 (75.0%) |
| 65 to 74 Years | 1 (14.3%) | 2 (15.4%) |
| 75 Years and over | 0 (0.0%) | 4 (57.1%) |
| Total | 73 (70.2%) | 16 (42.1%) |
Income Above Poverty by Sex and Age in Donnellson
According to the poverty statistics in Donnellson, males aged under 5 years and females aged 5 years are the age groups that are most secure financially, with 100.0% of males and 100.0% of females in these age groups living above the poverty line.
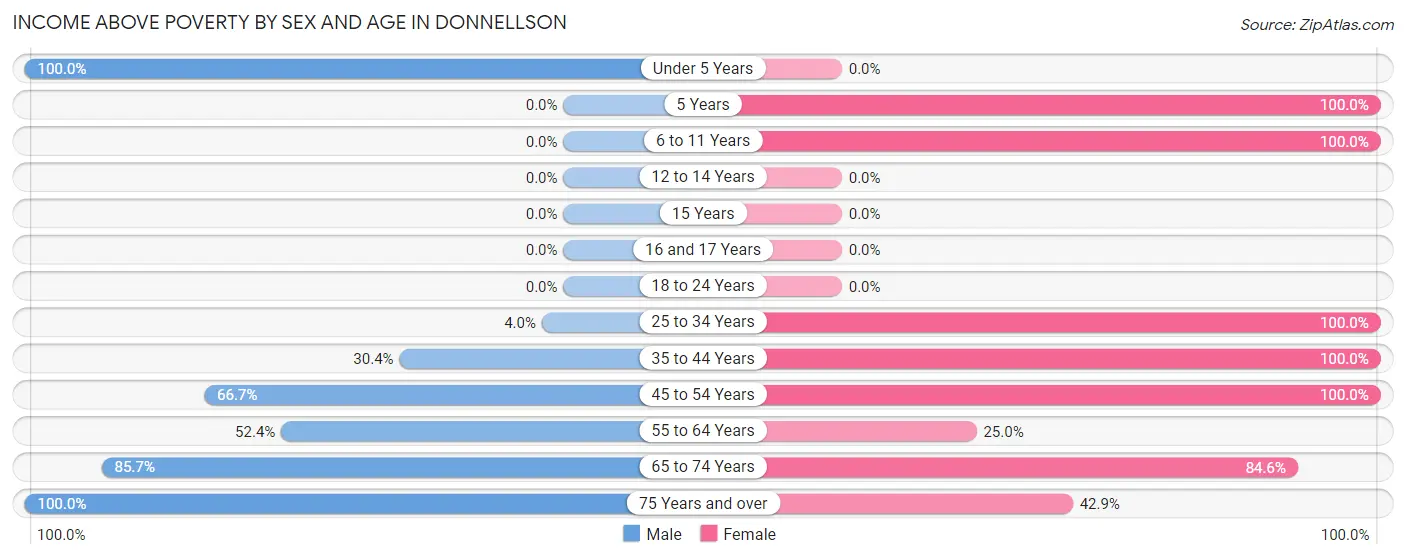
| Age Bracket | Male | Female |
| Under 5 Years | 1 (100.0%) | 0 (0.0%) |
| 5 Years | 0 (0.0%) | 1 (100.0%) |
| 6 to 11 Years | 0 (0.0%) | 1 (100.0%) |
| 12 to 14 Years | 0 (0.0%) | 0 (0.0%) |
| 15 Years | 0 (0.0%) | 0 (0.0%) |
| 16 and 17 Years | 0 (0.0%) | 0 (0.0%) |
| 18 to 24 Years | 0 (0.0%) | 0 (0.0%) |
| 25 to 34 Years | 1 (4.0%) | 2 (100.0%) |
| 35 to 44 Years | 7 (30.4%) | 1 (100.0%) |
| 45 to 54 Years | 2 (66.7%) | 1 (100.0%) |
| 55 to 64 Years | 11 (52.4%) | 2 (25.0%) |
| 65 to 74 Years | 6 (85.7%) | 11 (84.6%) |
| 75 Years and over | 3 (100.0%) | 3 (42.9%) |
| Total | 31 (29.8%) | 22 (57.9%) |
Income Below Poverty Among Married-Couple Families in Donnellson
The poverty statistics for married-couple families in Donnellson show that 45.5% or 5 of the total 11 families live below the poverty line. Families with 5 or more children have the highest poverty rate of 100.0%, comprising of 5 families. On the other hand, families with no children have the lowest poverty rate of 0.0%, which includes 0 families.
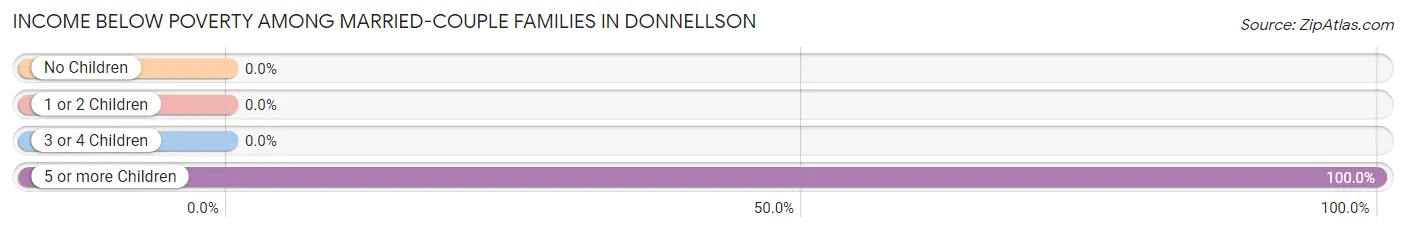
| Children | Above Poverty | Below Poverty |
| No Children | 6 (100.0%) | 0 (0.0%) |
| 1 or 2 Children | 0 (0.0%) | 0 (0.0%) |
| 3 or 4 Children | 0 (0.0%) | 0 (0.0%) |
| 5 or more Children | 0 (0.0%) | 5 (100.0%) |
| Total | 6 (54.5%) | 5 (45.5%) |
Income Below Poverty Among Single-Parent Households in Donnellson
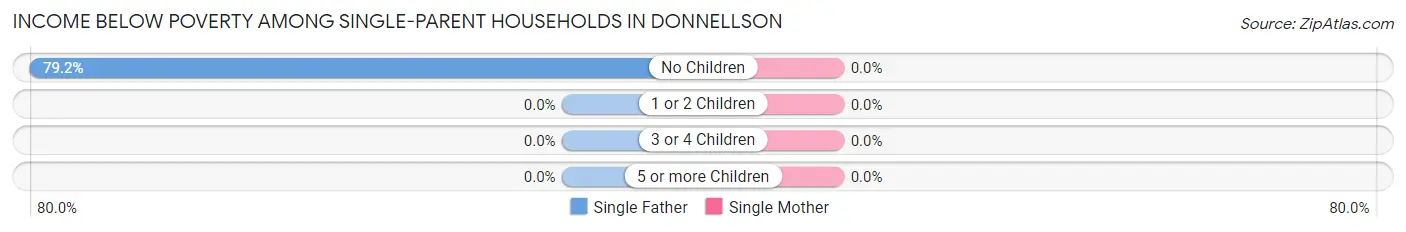
| Children | Single Father | Single Mother |
| No Children | 19 (79.2%) | 0 (0.0%) |
| 1 or 2 Children | 0 (0.0%) | 0 (0.0%) |
| 3 or 4 Children | 0 (0.0%) | 0 (0.0%) |
| 5 or more Children | 0 (0.0%) | 0 (0.0%) |
| Total | 19 (73.1%) | 0 (0.0%) |
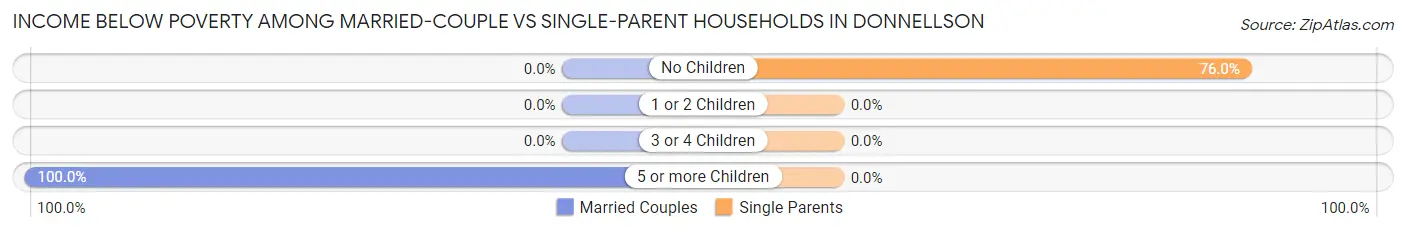
Income Below Poverty Among Married-Couple vs Single-Parent Households in Donnellson
The poverty data for Donnellson shows that 5 of the married-couple family households (45.5%) and 19 of the single-parent households (67.9%) are living below the poverty level. Within the married-couple family households, those with 5 or more children have the highest poverty rate, with 5 households (100.0%) falling below the poverty line. Among the single-parent households, those with no children have the highest poverty rate, with 19 household (76.0%) living below poverty.
| Children | Married-Couple Families | Single-Parent Households |
| No Children | 0 (0.0%) | 19 (76.0%) |
| 1 or 2 Children | 0 (0.0%) | 0 (0.0%) |
| 3 or 4 Children | 0 (0.0%) | 0 (0.0%) |
| 5 or more Children | 5 (100.0%) | 0 (0.0%) |
| Total | 5 (45.5%) | 19 (67.9%) |
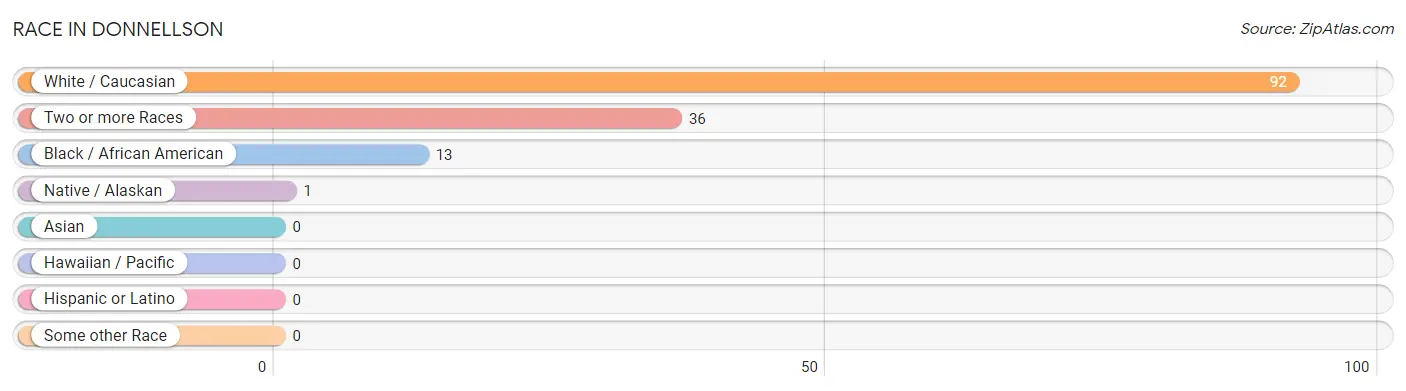
Race in Donnellson
The most populous races in Donnellson are White / Caucasian (92 | 64.8%), Two or more Races (36 | 25.4%), and Black / African American (13 | 9.1%).
| Race | # Population | % Population |
| Asian | 0 | 0.0% |
| Black / African American | 13 | 9.1% |
| Hawaiian / Pacific | 0 | 0.0% |
| Hispanic or Latino | 0 | 0.0% |
| Native / Alaskan | 1 | 0.7% |
| White / Caucasian | 92 | 64.8% |
| Two or more Races | 36 | 25.4% |
| Some other Race | 0 | 0.0% |
| Total | 142 | 100.0% |
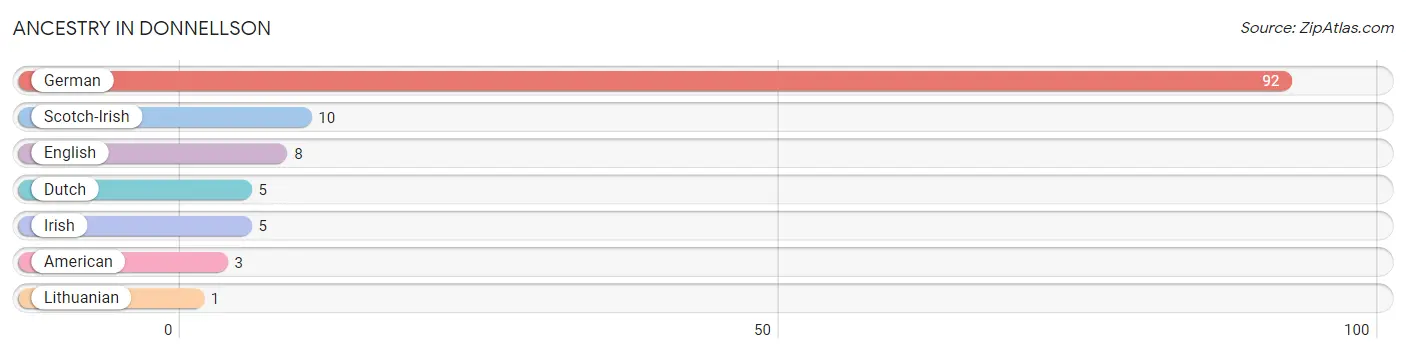
Ancestry in Donnellson
The most populous ancestries reported in Donnellson are German (92 | 64.8%), Scotch-Irish (10 | 7.0%), English (8 | 5.6%), Dutch (5 | 3.5%), and Irish (5 | 3.5%), together accounting for 84.5% of all Donnellson residents.
| Ancestry | # Population | % Population |
| American | 3 | 2.1% |
| Dutch | 5 | 3.5% |
| English | 8 | 5.6% |
| German | 92 | 64.8% |
| Irish | 5 | 3.5% |
| Lithuanian | 1 | 0.7% |
| Scotch-Irish | 10 | 7.0% | View All 7 Rows |
Immigrants in Donnellson
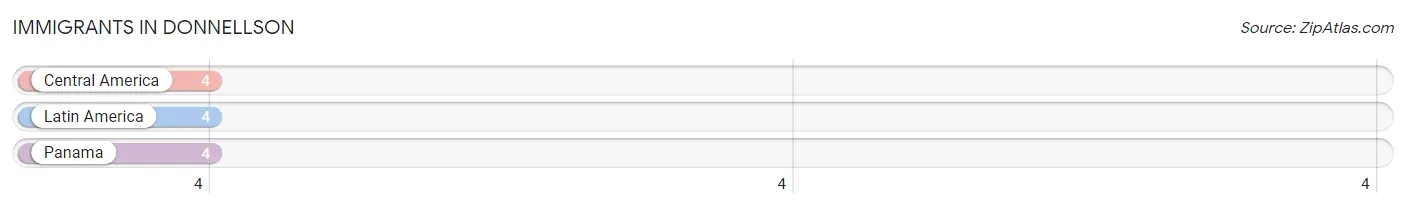
The most numerous immigrant groups reported in Donnellson came from Central America (4 | 2.8%), Latin America (4 | 2.8%), and Panama (4 | 2.8%), together accounting for 8.5% of all Donnellson residents.
| Immigration Origin | # Population | % Population |
| Central America | 4 | 2.8% |
| Latin America | 4 | 2.8% |
| Panama | 4 | 2.8% | View All 3 Rows |
Sex and Age in Donnellson
Sex and Age in Donnellson
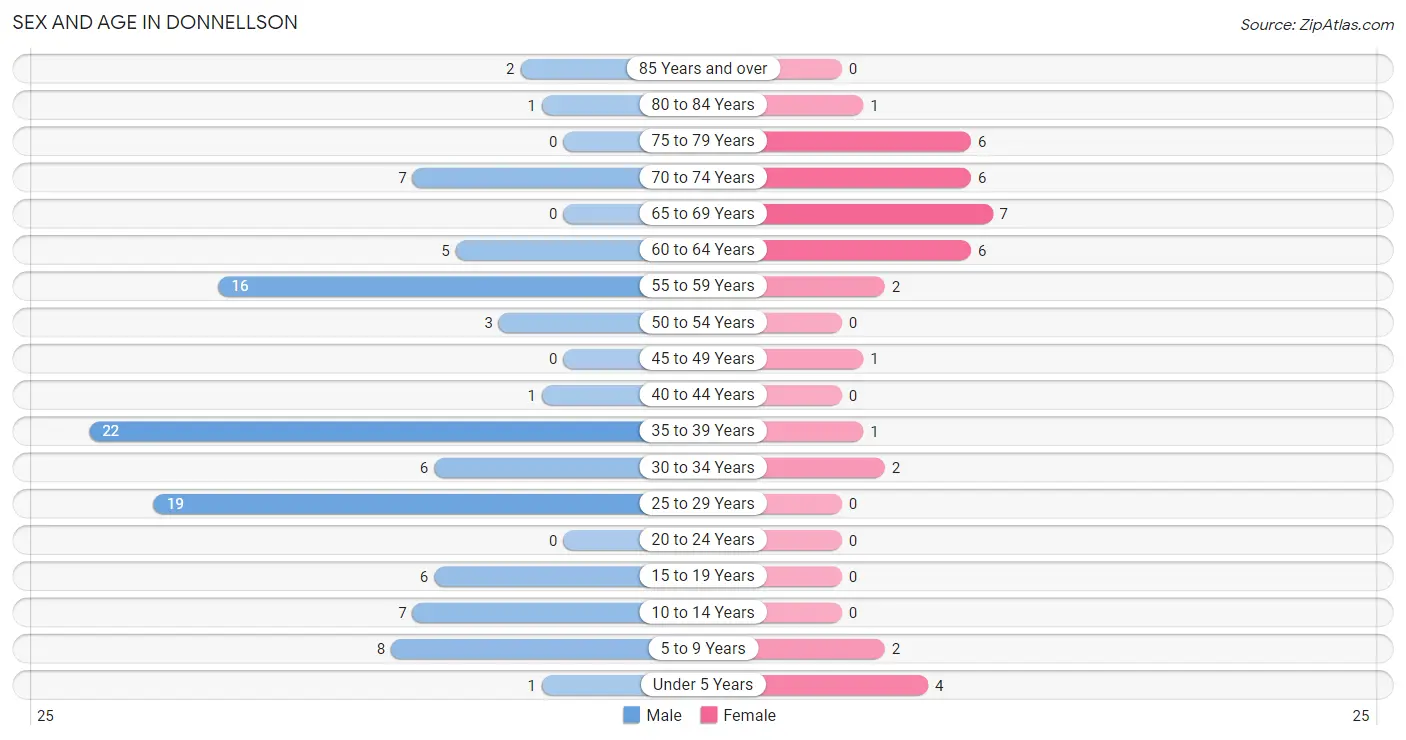
The most populous age groups in Donnellson are 35 to 39 Years (22 | 21.1%) for men and 65 to 69 Years (7 | 18.4%) for women.
| Age Bracket | Male | Female |
| Under 5 Years | 1 (1.0%) | 4 (10.5%) |
| 5 to 9 Years | 8 (7.7%) | 2 (5.3%) |
| 10 to 14 Years | 7 (6.7%) | 0 (0.0%) |
| 15 to 19 Years | 6 (5.8%) | 0 (0.0%) |
| 20 to 24 Years | 0 (0.0%) | 0 (0.0%) |
| 25 to 29 Years | 19 (18.3%) | 0 (0.0%) |
| 30 to 34 Years | 6 (5.8%) | 2 (5.3%) |
| 35 to 39 Years | 22 (21.1%) | 1 (2.6%) |
| 40 to 44 Years | 1 (1.0%) | 0 (0.0%) |
| 45 to 49 Years | 0 (0.0%) | 1 (2.6%) |
| 50 to 54 Years | 3 (2.9%) | 0 (0.0%) |
| 55 to 59 Years | 16 (15.4%) | 2 (5.3%) |
| 60 to 64 Years | 5 (4.8%) | 6 (15.8%) |
| 65 to 69 Years | 0 (0.0%) | 7 (18.4%) |
| 70 to 74 Years | 7 (6.7%) | 6 (15.8%) |
| 75 to 79 Years | 0 (0.0%) | 6 (15.8%) |
| 80 to 84 Years | 1 (1.0%) | 1 (2.6%) |
| 85 Years and over | 2 (1.9%) | 0 (0.0%) |
| Total | 104 (100.0%) | 38 (100.0%) |
Families and Households in Donnellson
Median Family Size in Donnellson
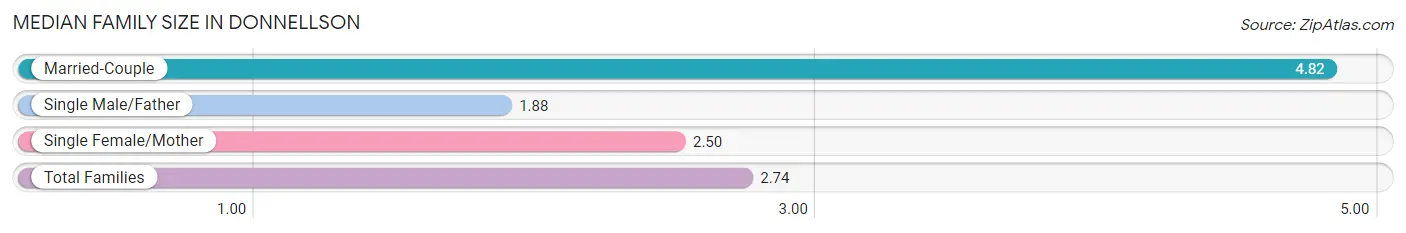
The median family size in Donnellson is 2.74 persons per family, with married-couple families (11 | 28.2%) accounting for the largest median family size of 4.82 persons per family. On the other hand, single male/father families (26 | 66.7%) represent the smallest median family size with 1.88 persons per family.
| Family Type | # Families | Family Size |
| Married-Couple | 11 (28.2%) | 4.82 |
| Single Male/Father | 26 (66.7%) | 1.88 |
| Single Female/Mother | 2 (5.1%) | 2.50 |
| Total Families | 39 (100.0%) | 2.74 |
Median Household Size in Donnellson
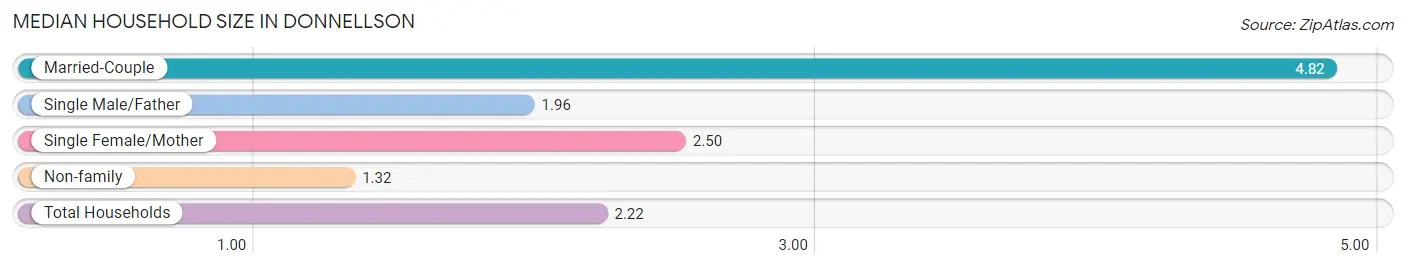
The median household size in Donnellson is 2.22 persons per household, with married-couple households (11 | 17.2%) accounting for the largest median household size of 4.82 persons per household. non-family households (25 | 39.1%) represent the smallest median household size with 1.32 persons per household.
| Household Type | # Households | Household Size |
| Married-Couple | 11 (17.2%) | 4.82 |
| Single Male/Father | 26 (40.6%) | 1.96 |
| Single Female/Mother | 2 (3.1%) | 2.50 |
| Non-family | 25 (39.1%) | 1.32 |
| Total Households | 64 (100.0%) | 2.22 |
Household Size by Marriage Status in Donnellson
Out of a total of 64 households in Donnellson, 39 (60.9%) are family households, while 25 (39.1%) are nonfamily households. The most numerous type of family households are 2-person households, comprising 31, and the most common type of nonfamily households are 1-person households, comprising 20.
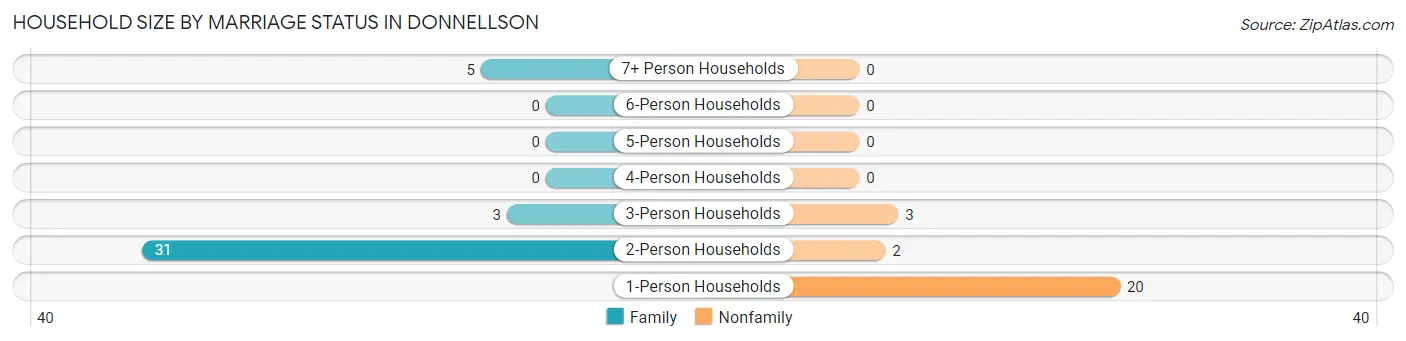
| Household Size | Family Households | Nonfamily Households |
| 1-Person Households | - | 20 (31.2%) |
| 2-Person Households | 31 (48.4%) | 2 (3.1%) |
| 3-Person Households | 3 (4.7%) | 3 (4.7%) |
| 4-Person Households | 0 (0.0%) | 0 (0.0%) |
| 5-Person Households | 0 (0.0%) | 0 (0.0%) |
| 6-Person Households | 0 (0.0%) | 0 (0.0%) |
| 7+ Person Households | 5 (7.8%) | 0 (0.0%) |
| Total | 39 (60.9%) | 25 (39.1%) |
Female Fertility in Donnellson
Fertility by Age in Donnellson
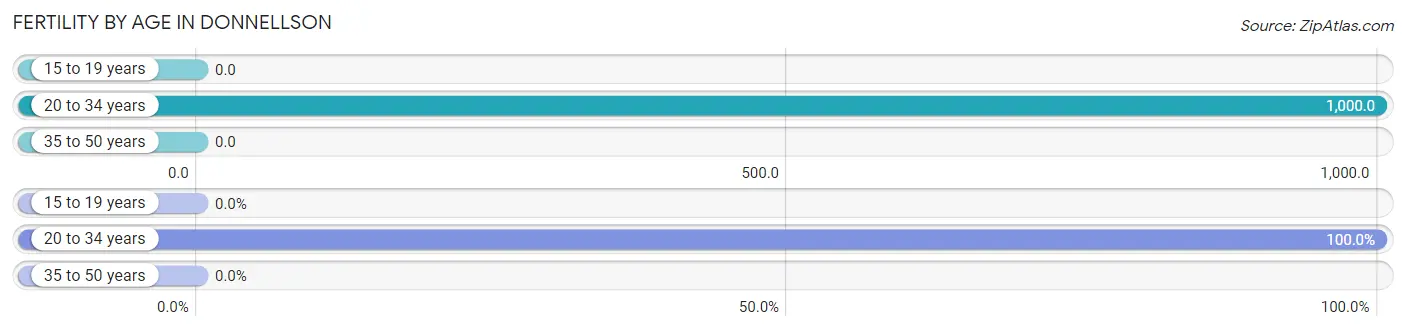
Average fertility rate in Donnellson is 500.0 births per 1,000 women. Women in the age bracket of 20 to 34 years have the highest fertility rate with 1,000.0 births per 1,000 women. Women in the age bracket of 20 to 34 years acount for 100.0% of all women with births.
| Age Bracket | Women with Births | Births / 1,000 Women |
| 15 to 19 years | 0 (0.0%) | 0.0 |
| 20 to 34 years | 2 (100.0%) | 1,000.0 |
| 35 to 50 years | 0 (0.0%) | 0.0 |
| Total | 2 (100.0%) | 500.0 |
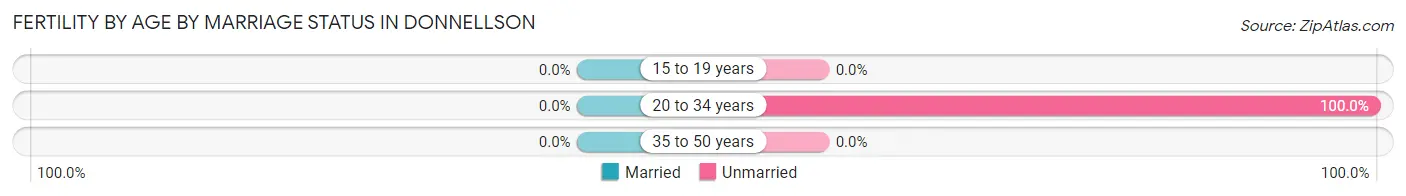
Fertility by Age by Marriage Status in Donnellson
| Age Bracket | Married | Unmarried |
| 15 to 19 years | 0 (0.0%) | 0 (0.0%) |
| 20 to 34 years | 0 (0.0%) | 2 (100.0%) |
| 35 to 50 years | 0 (0.0%) | 0 (0.0%) |
| Total | 0 (0.0%) | 2 (100.0%) |
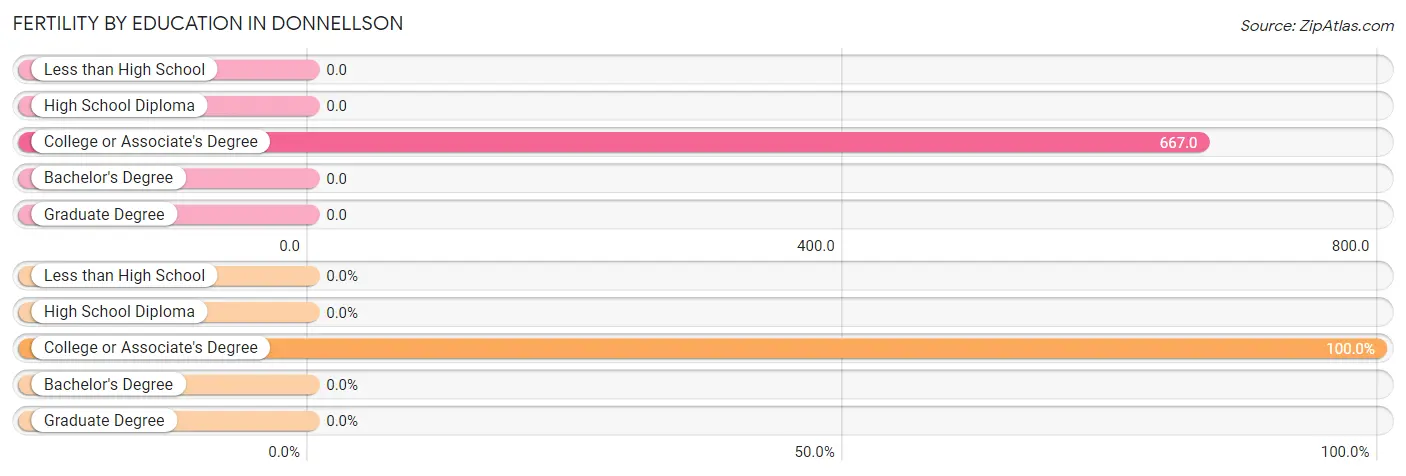
Fertility by Education in Donnellson
| Educational Attainment | Women with Births | Births / 1,000 Women |
| Less than High School | 0 (0.0%) | 0.0 |
| High School Diploma | 0 (0.0%) | 0.0 |
| College or Associate's Degree | 2 (100.0%) | 667.0 |
| Bachelor's Degree | 0 (0.0%) | 0.0 |
| Graduate Degree | 0 (0.0%) | 0.0 |
| Total | 2 (100.0%) | 500.0 |
Fertility by Education by Marriage Status in Donnellson
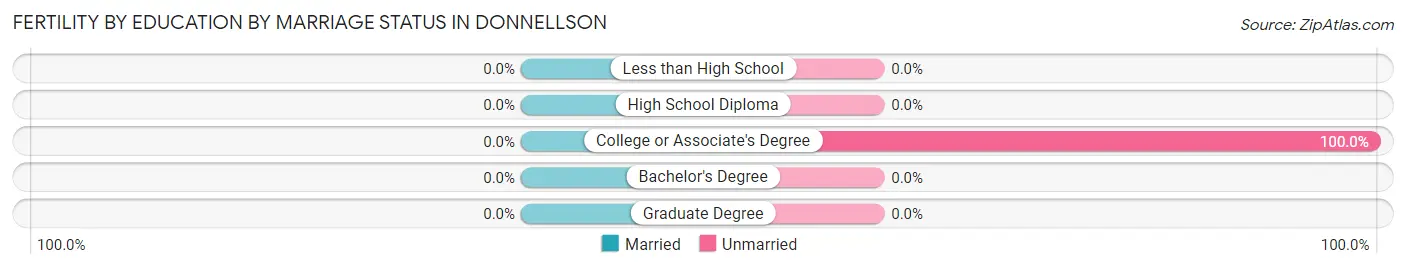
| Educational Attainment | Married | Unmarried |
| Less than High School | 0 (0.0%) | 0 (0.0%) |
| High School Diploma | 0 (0.0%) | 0 (0.0%) |
| College or Associate's Degree | 0 (0.0%) | 2 (100.0%) |
| Bachelor's Degree | 0 (0.0%) | 0 (0.0%) |
| Graduate Degree | 0 (0.0%) | 0 (0.0%) |
| Total | 0 (0.0%) | 2 (100.0%) |
Employment Characteristics in Donnellson
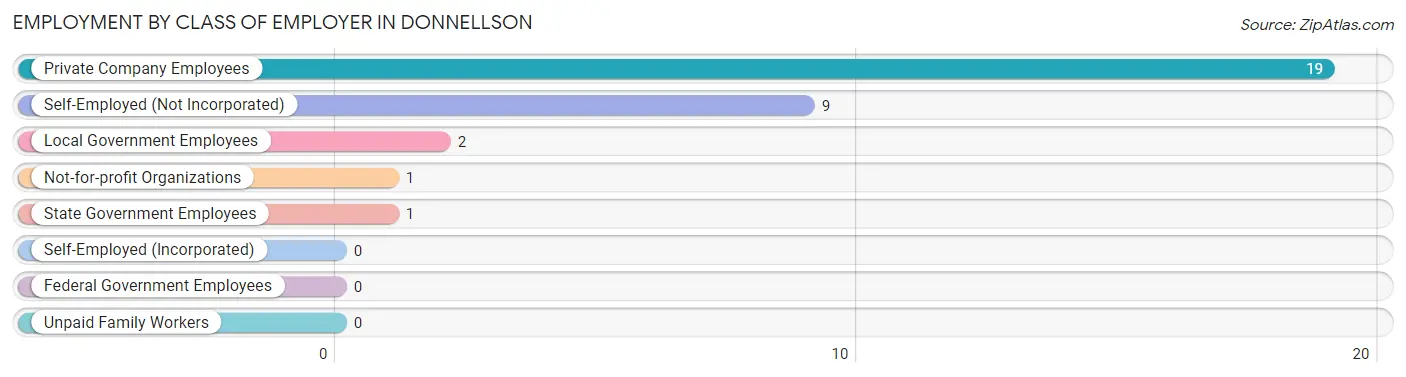
Employment by Class of Employer in Donnellson
Among the 32 employed individuals in Donnellson, private company employees (19 | 59.4%), self-employed (not incorporated) (9 | 28.1%), and local government employees (2 | 6.2%) make up the most common classes of employment.
| Employer Class | # Employees | % Employees |
| Private Company Employees | 19 | 59.4% |
| Self-Employed (Incorporated) | 0 | 0.0% |
| Self-Employed (Not Incorporated) | 9 | 28.1% |
| Not-for-profit Organizations | 1 | 3.1% |
| Local Government Employees | 2 | 6.2% |
| State Government Employees | 1 | 3.1% |
| Federal Government Employees | 0 | 0.0% |
| Unpaid Family Workers | 0 | 0.0% |
| Total | 32 | 100.0% |
Employment Status by Age in Donnellson
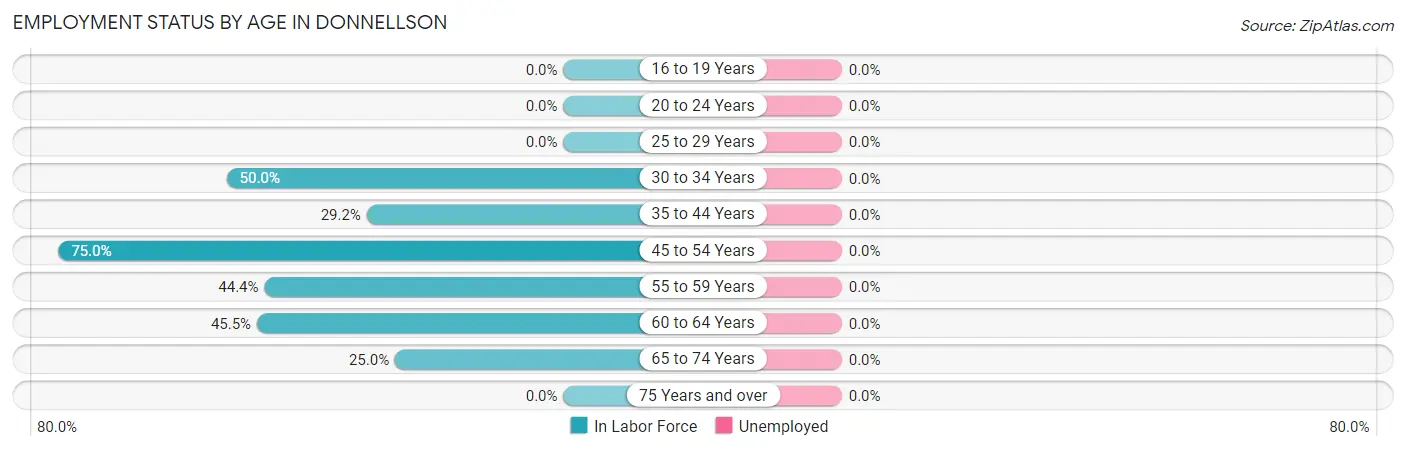
| Age Bracket | In Labor Force | Unemployed |
| 16 to 19 Years | 0 (0.0%) | 0 (0.0%) |
| 20 to 24 Years | 0 (0.0%) | 0 (0.0%) |
| 25 to 29 Years | 0 (0.0%) | 0 (0.0%) |
| 30 to 34 Years | 4 (50.0%) | 0 (0.0%) |
| 35 to 44 Years | 7 (29.2%) | 0 (0.0%) |
| 45 to 54 Years | 3 (75.0%) | 0 (0.0%) |
| 55 to 59 Years | 8 (44.4%) | 0 (0.0%) |
| 60 to 64 Years | 5 (45.5%) | 0 (0.0%) |
| 65 to 74 Years | 5 (25.0%) | 0 (0.0%) |
| 75 Years and over | 0 (0.0%) | 0 (0.0%) |
| Total | 32 (28.1%) | 0 (0.0%) |
Employment Status by Educational Attainment in Donnellson
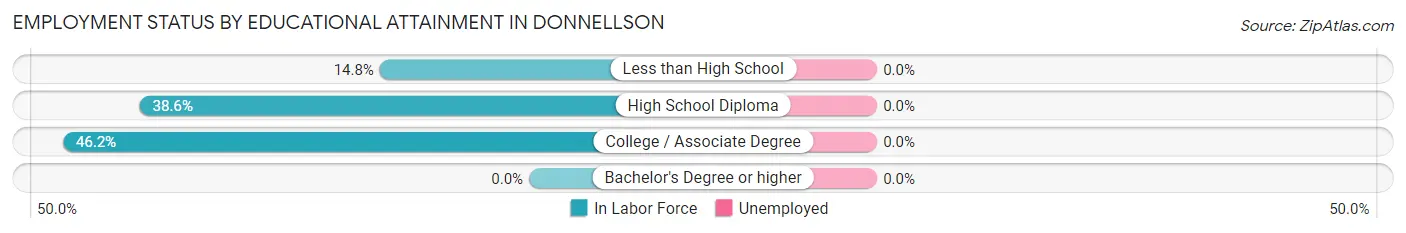
| Educational Attainment | In Labor Force | Unemployed |
| Less than High School | 4 (14.8%) | 0 (0.0%) |
| High School Diploma | 17 (38.6%) | 0 (0.0%) |
| College / Associate Degree | 6 (46.2%) | 0 (0.0%) |
| Bachelor's Degree or higher | 0 (0.0%) | 0 (0.0%) |
| Total | 27 (32.1%) | 0 (0.0%) |
Employment Occupations by Sex in Donnellson
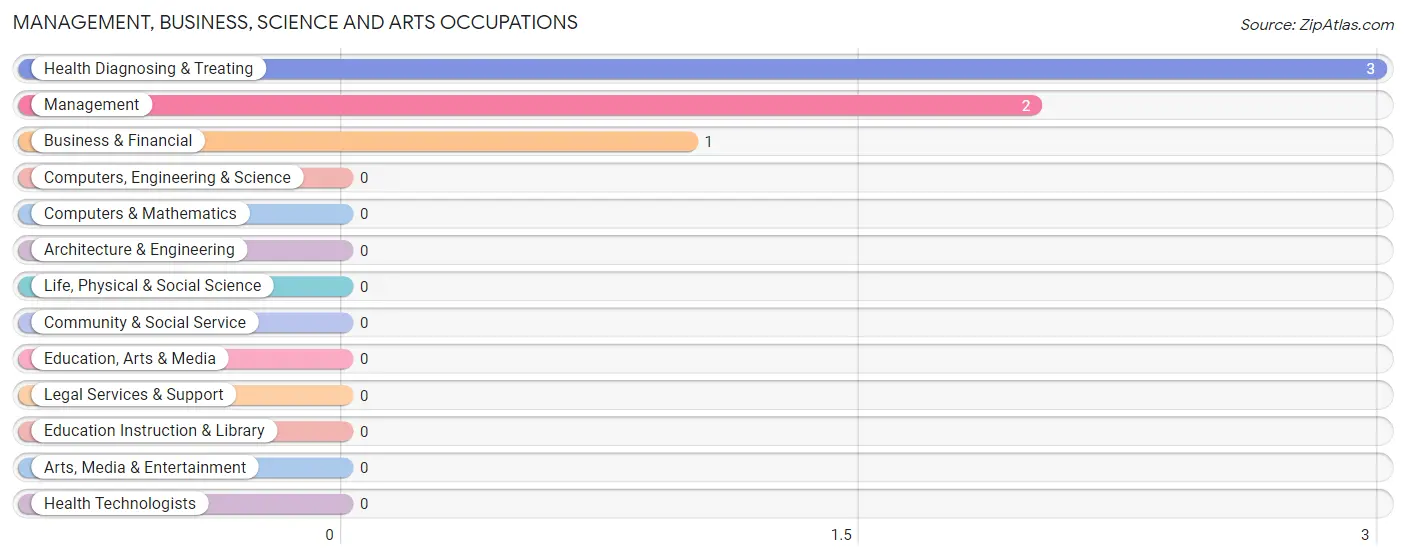
Management, Business, Science and Arts Occupations
The most common Management, Business, Science and Arts occupations in Donnellson are Health Diagnosing & Treating (3 | 9.4%), Management (2 | 6.2%), and Business & Financial (1 | 3.1%).
Management, Business, Science and Arts Occupations by Sex
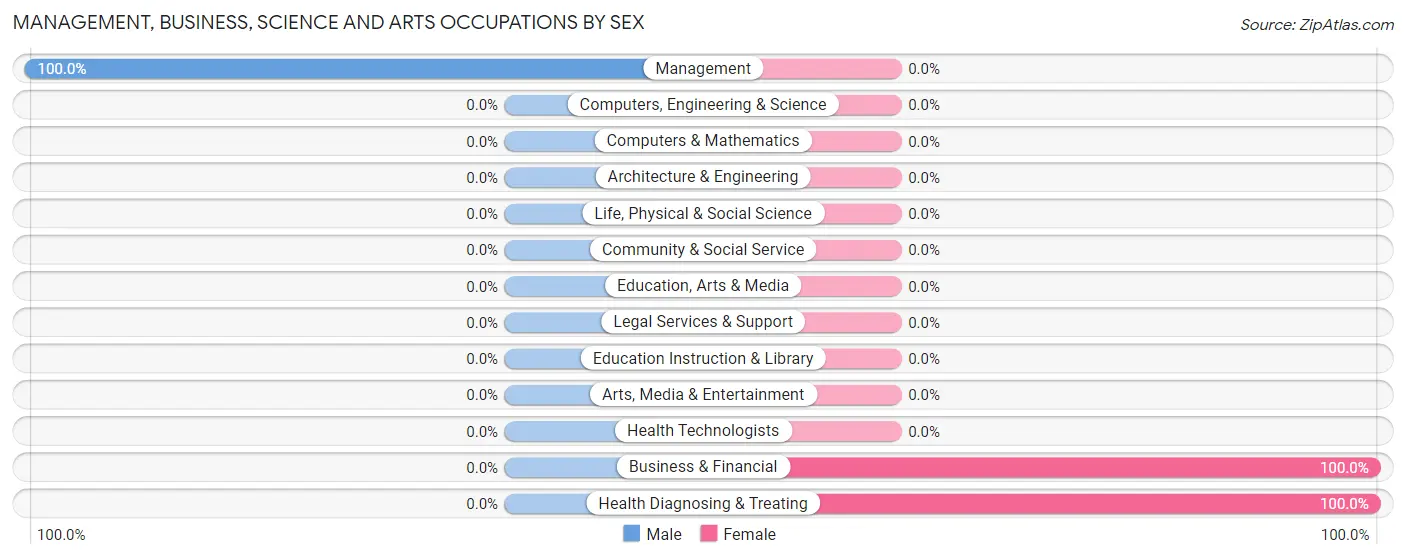
| Occupation | Male | Female |
| Management | 2 (100.0%) | 0 (0.0%) |
| Business & Financial | 0 (0.0%) | 1 (100.0%) |
| Computers, Engineering & Science | 0 (0.0%) | 0 (0.0%) |
| Computers & Mathematics | 0 (0.0%) | 0 (0.0%) |
| Architecture & Engineering | 0 (0.0%) | 0 (0.0%) |
| Life, Physical & Social Science | 0 (0.0%) | 0 (0.0%) |
| Community & Social Service | 0 (0.0%) | 0 (0.0%) |
| Education, Arts & Media | 0 (0.0%) | 0 (0.0%) |
| Legal Services & Support | 0 (0.0%) | 0 (0.0%) |
| Education Instruction & Library | 0 (0.0%) | 0 (0.0%) |
| Arts, Media & Entertainment | 0 (0.0%) | 0 (0.0%) |
| Health Diagnosing & Treating | 0 (0.0%) | 3 (100.0%) |
| Health Technologists | 0 (0.0%) | 0 (0.0%) |
| Total (Category) | 2 (33.3%) | 4 (66.7%) |
| Total (Overall) | 21 (65.6%) | 11 (34.4%) |
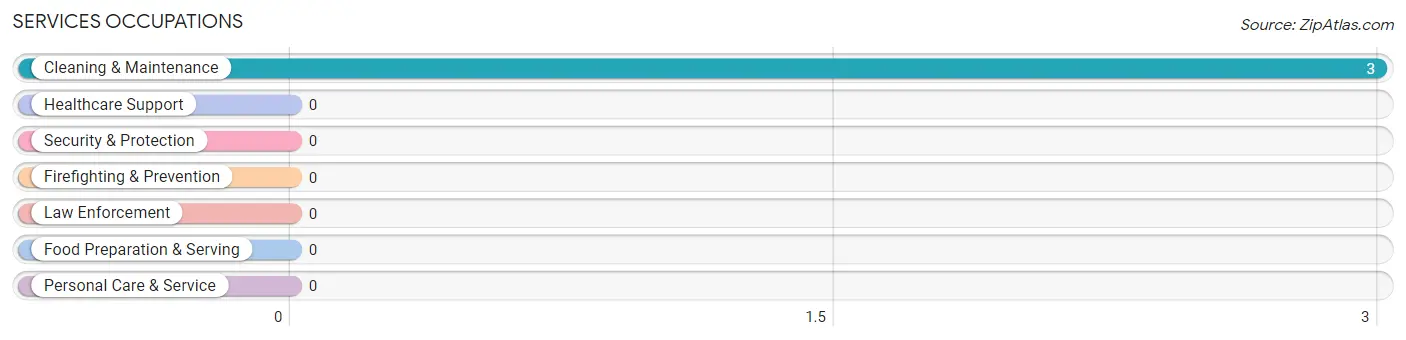
Services Occupations
The most common Services occupations in Donnellson are , and Cleaning & Maintenance (3 | 9.4%).
Services Occupations by Sex
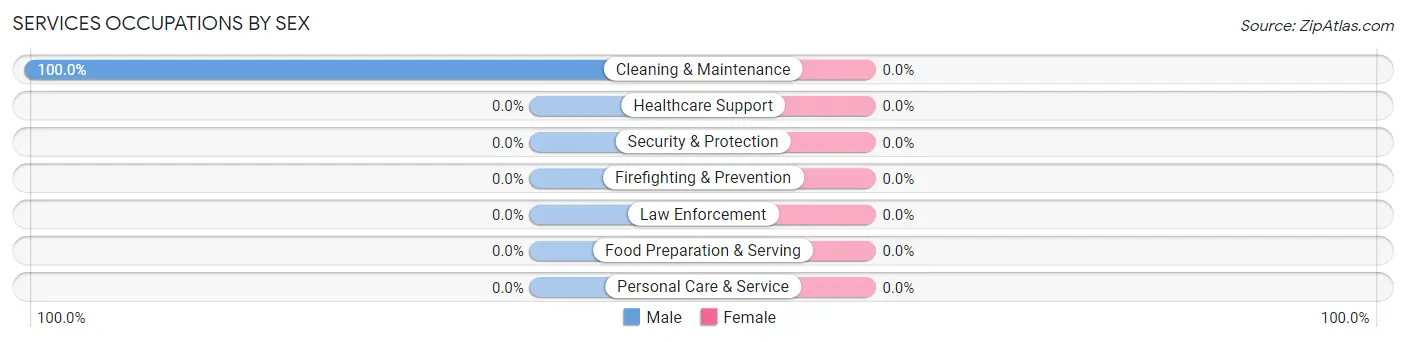
| Occupation | Male | Female |
| Healthcare Support | 0 (0.0%) | 0 (0.0%) |
| Security & Protection | 0 (0.0%) | 0 (0.0%) |
| Firefighting & Prevention | 0 (0.0%) | 0 (0.0%) |
| Law Enforcement | 0 (0.0%) | 0 (0.0%) |
| Food Preparation & Serving | 0 (0.0%) | 0 (0.0%) |
| Cleaning & Maintenance | 3 (100.0%) | 0 (0.0%) |
| Personal Care & Service | 0 (0.0%) | 0 (0.0%) |
| Total (Category) | 3 (100.0%) | 0 (0.0%) |
| Total (Overall) | 21 (65.6%) | 11 (34.4%) |
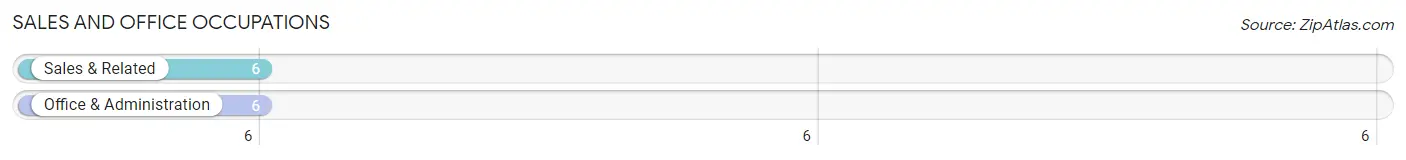
Sales and Office Occupations
The most common Sales and Office occupations in Donnellson are Sales & Related (6 | 18.8%), and Office & Administration (6 | 18.8%).
Sales and Office Occupations by Sex
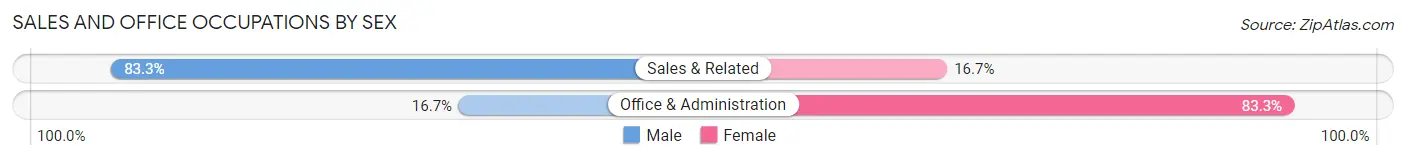
| Occupation | Male | Female |
| Sales & Related | 5 (83.3%) | 1 (16.7%) |
| Office & Administration | 1 (16.7%) | 5 (83.3%) |
| Total (Category) | 6 (50.0%) | 6 (50.0%) |
| Total (Overall) | 21 (65.6%) | 11 (34.4%) |
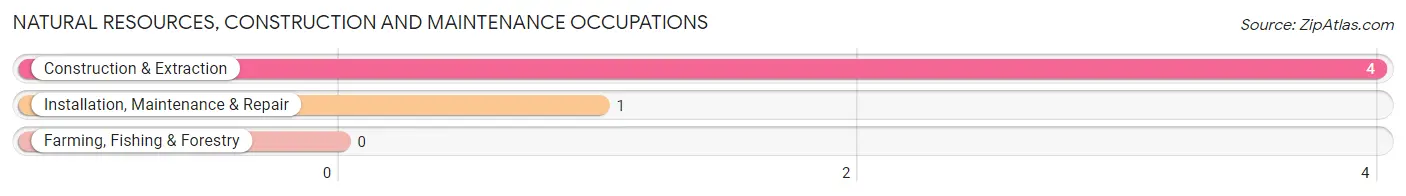
Natural Resources, Construction and Maintenance Occupations
The most common Natural Resources, Construction and Maintenance occupations in Donnellson are Construction & Extraction (4 | 12.5%), and Installation, Maintenance & Repair (1 | 3.1%).
Natural Resources, Construction and Maintenance Occupations by Sex
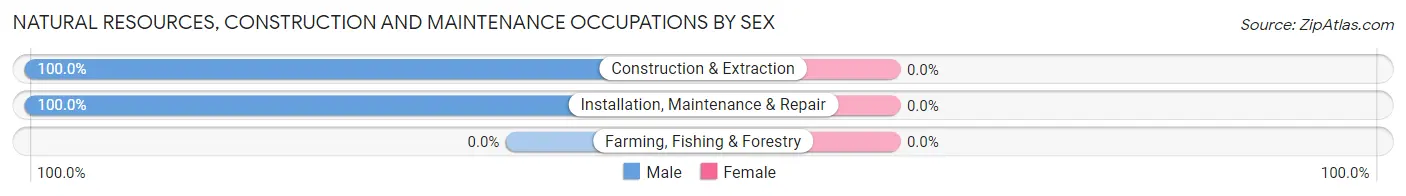
| Occupation | Male | Female |
| Farming, Fishing & Forestry | 0 (0.0%) | 0 (0.0%) |
| Construction & Extraction | 4 (100.0%) | 0 (0.0%) |
| Installation, Maintenance & Repair | 1 (100.0%) | 0 (0.0%) |
| Total (Category) | 5 (100.0%) | 0 (0.0%) |
| Total (Overall) | 21 (65.6%) | 11 (34.4%) |
Production, Transportation and Moving Occupations
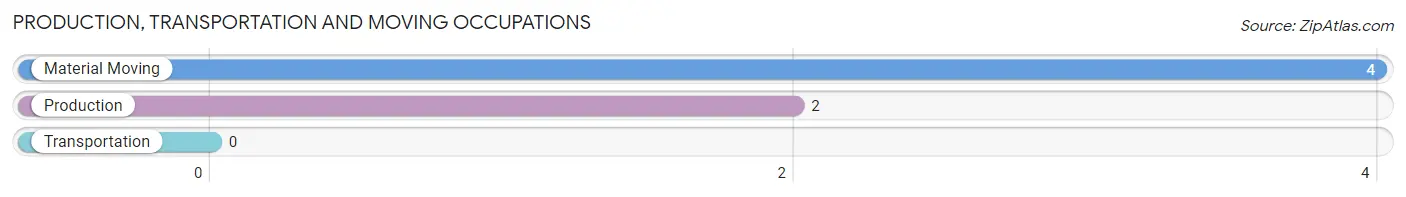
The most common Production, Transportation and Moving occupations in Donnellson are Material Moving (4 | 12.5%), and Production (2 | 6.2%).
Production, Transportation and Moving Occupations by Sex
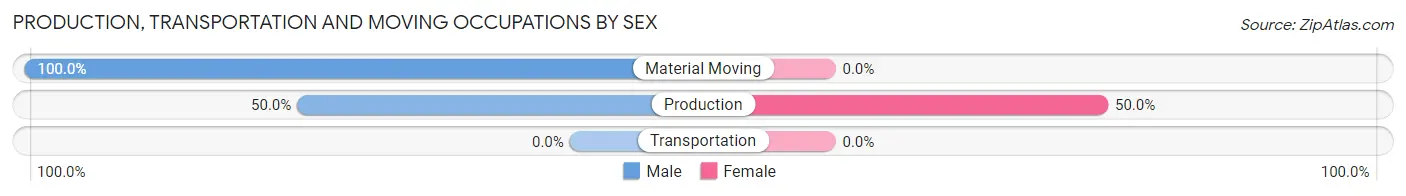
| Occupation | Male | Female |
| Production | 1 (50.0%) | 1 (50.0%) |
| Transportation | 0 (0.0%) | 0 (0.0%) |
| Material Moving | 4 (100.0%) | 0 (0.0%) |
| Total (Category) | 5 (83.3%) | 1 (16.7%) |
| Total (Overall) | 21 (65.6%) | 11 (34.4%) |
Employment Industries by Sex in Donnellson
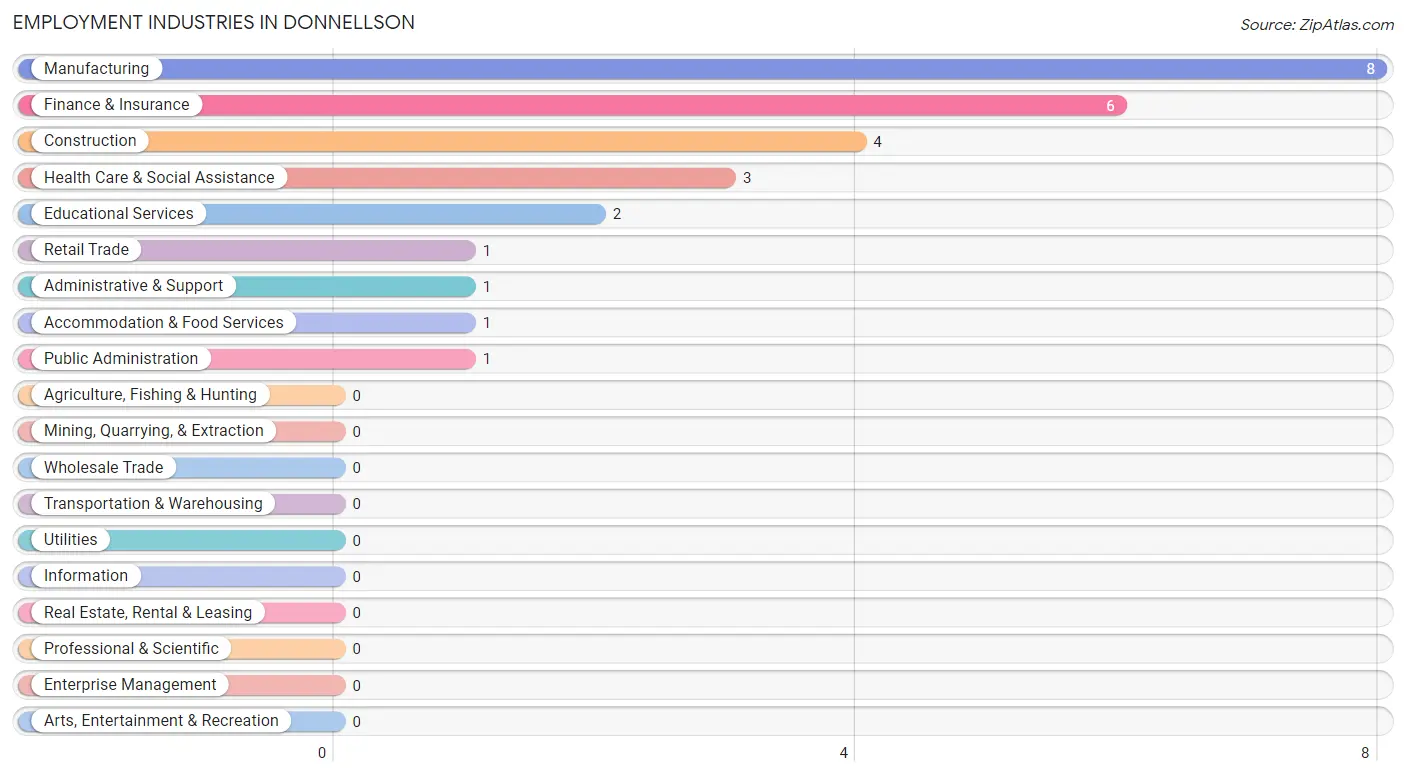
Employment Industries in Donnellson
The major employment industries in Donnellson include Manufacturing (8 | 25.0%), Finance & Insurance (6 | 18.8%), Construction (4 | 12.5%), Health Care & Social Assistance (3 | 9.4%), and Educational Services (2 | 6.2%).
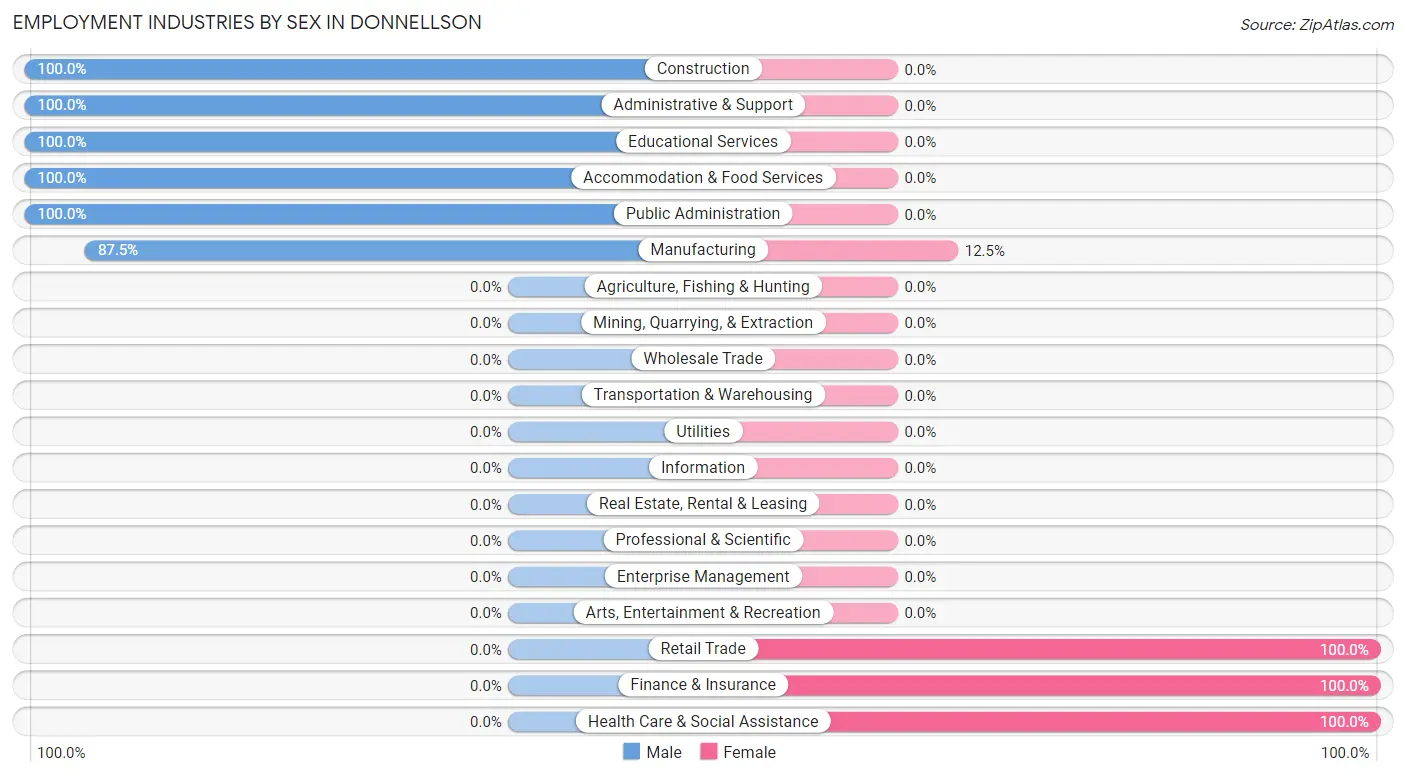
Employment Industries by Sex in Donnellson
The Donnellson industries that see more men than women are Construction (100.0%), Administrative & Support (100.0%), and Educational Services (100.0%), whereas the industries that tend to have a higher number of women are Retail Trade (100.0%), Finance & Insurance (100.0%), and Health Care & Social Assistance (100.0%).
| Industry | Male | Female |
| Agriculture, Fishing & Hunting | 0 (0.0%) | 0 (0.0%) |
| Mining, Quarrying, & Extraction | 0 (0.0%) | 0 (0.0%) |
| Construction | 4 (100.0%) | 0 (0.0%) |
| Manufacturing | 7 (87.5%) | 1 (12.5%) |
| Wholesale Trade | 0 (0.0%) | 0 (0.0%) |
| Retail Trade | 0 (0.0%) | 1 (100.0%) |
| Transportation & Warehousing | 0 (0.0%) | 0 (0.0%) |
| Utilities | 0 (0.0%) | 0 (0.0%) |
| Information | 0 (0.0%) | 0 (0.0%) |
| Finance & Insurance | 0 (0.0%) | 6 (100.0%) |
| Real Estate, Rental & Leasing | 0 (0.0%) | 0 (0.0%) |
| Professional & Scientific | 0 (0.0%) | 0 (0.0%) |
| Enterprise Management | 0 (0.0%) | 0 (0.0%) |
| Administrative & Support | 1 (100.0%) | 0 (0.0%) |
| Educational Services | 2 (100.0%) | 0 (0.0%) |
| Health Care & Social Assistance | 0 (0.0%) | 3 (100.0%) |
| Arts, Entertainment & Recreation | 0 (0.0%) | 0 (0.0%) |
| Accommodation & Food Services | 1 (100.0%) | 0 (0.0%) |
| Public Administration | 1 (100.0%) | 0 (0.0%) |
| Total | 21 (65.6%) | 11 (34.4%) |
Education in Donnellson
School Enrollment in Donnellson
The most common levels of schooling among the 27 students in Donnellson are high school (13 | 48.1%), kindergarten (5 | 18.5%), and elementary school (5 | 18.5%).
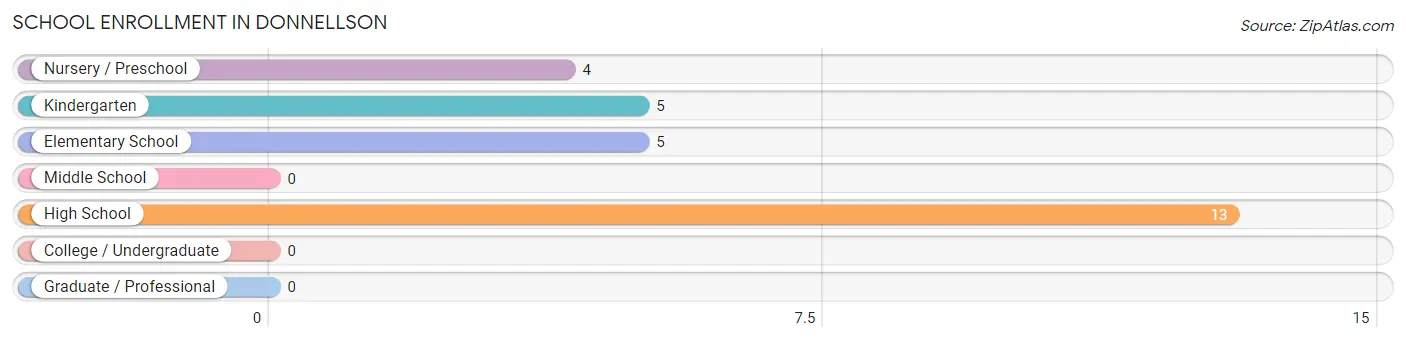
| School Level | # Students | % Students |
| Nursery / Preschool | 4 | 14.8% |
| Kindergarten | 5 | 18.5% |
| Elementary School | 5 | 18.5% |
| Middle School | 0 | 0.0% |
| High School | 13 | 48.1% |
| College / Undergraduate | 0 | 0.0% |
| Graduate / Professional | 0 | 0.0% |
| Total | 27 | 100.0% |
School Enrollment by Age by Funding Source in Donnellson
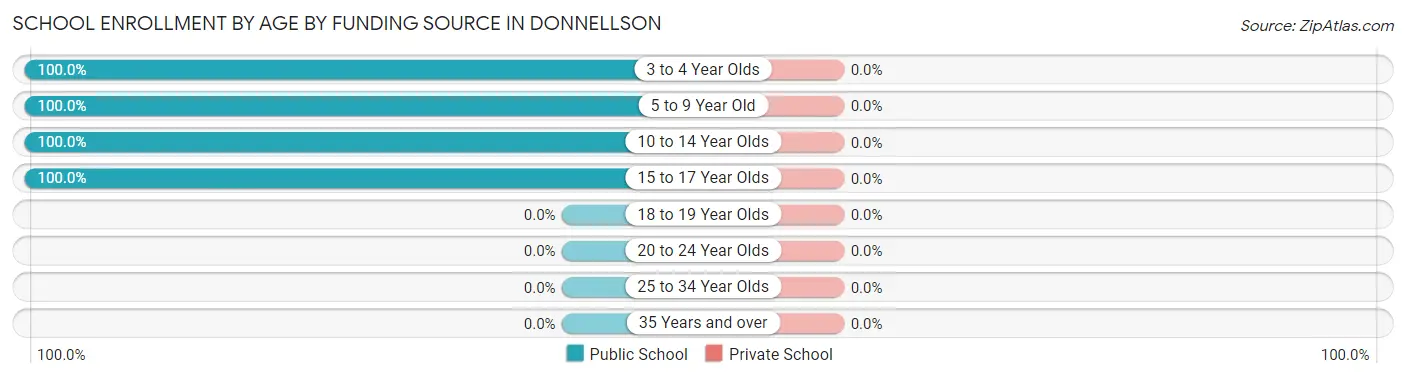
| Age Bracket | Public School | Private School |
| 3 to 4 Year Olds | 4 (100.0%) | 0 (0.0%) |
| 5 to 9 Year Old | 10 (100.0%) | 0 (0.0%) |
| 10 to 14 Year Olds | 7 (100.0%) | 0 (0.0%) |
| 15 to 17 Year Olds | 6 (100.0%) | 0 (0.0%) |
| 18 to 19 Year Olds | 0 (0.0%) | 0 (0.0%) |
| 20 to 24 Year Olds | 0 (0.0%) | 0 (0.0%) |
| 25 to 34 Year Olds | 0 (0.0%) | 0 (0.0%) |
| 35 Years and over | 0 (0.0%) | 0 (0.0%) |
| Total | 27 (100.0%) | 0 (0.0%) |
Educational Attainment by Field of Study in Donnellson
Liberal arts & history (2 | 66.7%), and computers & mathematics (1 | 33.3%) are the most common fields of study among 3 individuals in Donnellson who have obtained a bachelor's degree or higher.
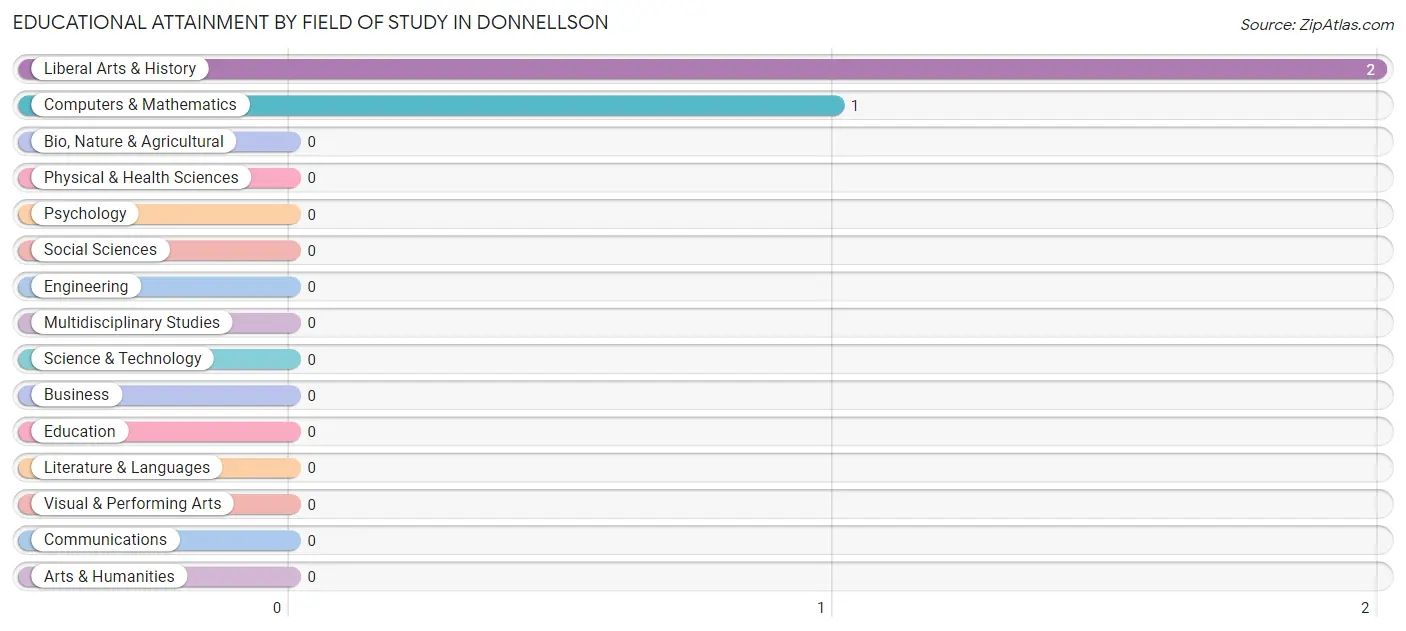
| Field of Study | # Graduates | % Graduates |
| Computers & Mathematics | 1 | 33.3% |
| Bio, Nature & Agricultural | 0 | 0.0% |
| Physical & Health Sciences | 0 | 0.0% |
| Psychology | 0 | 0.0% |
| Social Sciences | 0 | 0.0% |
| Engineering | 0 | 0.0% |
| Multidisciplinary Studies | 0 | 0.0% |
| Science & Technology | 0 | 0.0% |
| Business | 0 | 0.0% |
| Education | 0 | 0.0% |
| Literature & Languages | 0 | 0.0% |
| Liberal Arts & History | 2 | 66.7% |
| Visual & Performing Arts | 0 | 0.0% |
| Communications | 0 | 0.0% |
| Arts & Humanities | 0 | 0.0% |
| Total | 3 | 100.0% |
Transportation & Commute in Donnellson
Vehicle Availability by Sex in Donnellson
The most prevalent vehicle ownership categories in Donnellson are males with 5 or more vehicles (11, accounting for 52.4%) and females with 5 or more vehicles (2, making up 100.0%).
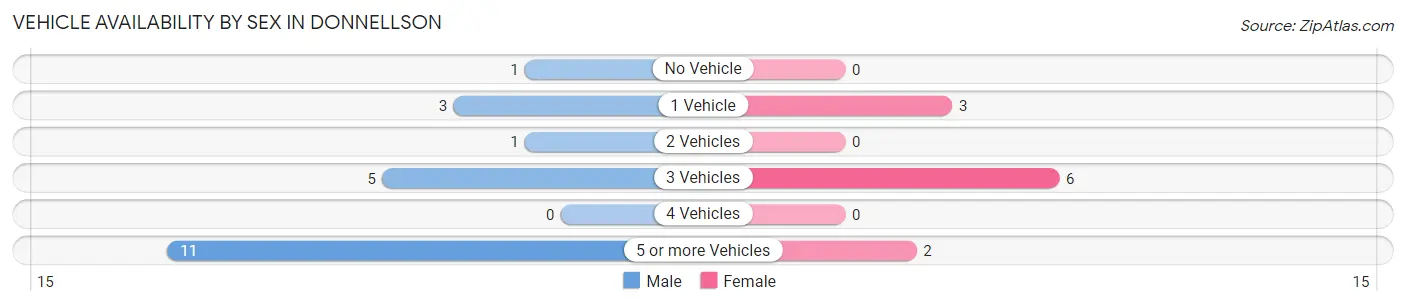
| Vehicles Available | Male | Female |
| No Vehicle | 1 (4.8%) | 0 (0.0%) |
| 1 Vehicle | 3 (14.3%) | 3 (27.3%) |
| 2 Vehicles | 1 (4.8%) | 0 (0.0%) |
| 3 Vehicles | 5 (23.8%) | 6 (54.5%) |
| 4 Vehicles | 0 (0.0%) | 0 (0.0%) |
| 5 or more Vehicles | 11 (52.4%) | 2 (18.2%) |
| Total | 21 (100.0%) | 11 (100.0%) |
Commute Time in Donnellson
The most frequently occuring commute durations in Donnellson are 30 to 34 minutes (9 commuters, 30.0%), 60 to 89 minutes (8 commuters, 26.7%), and 5 to 9 minutes (7 commuters, 23.3%).
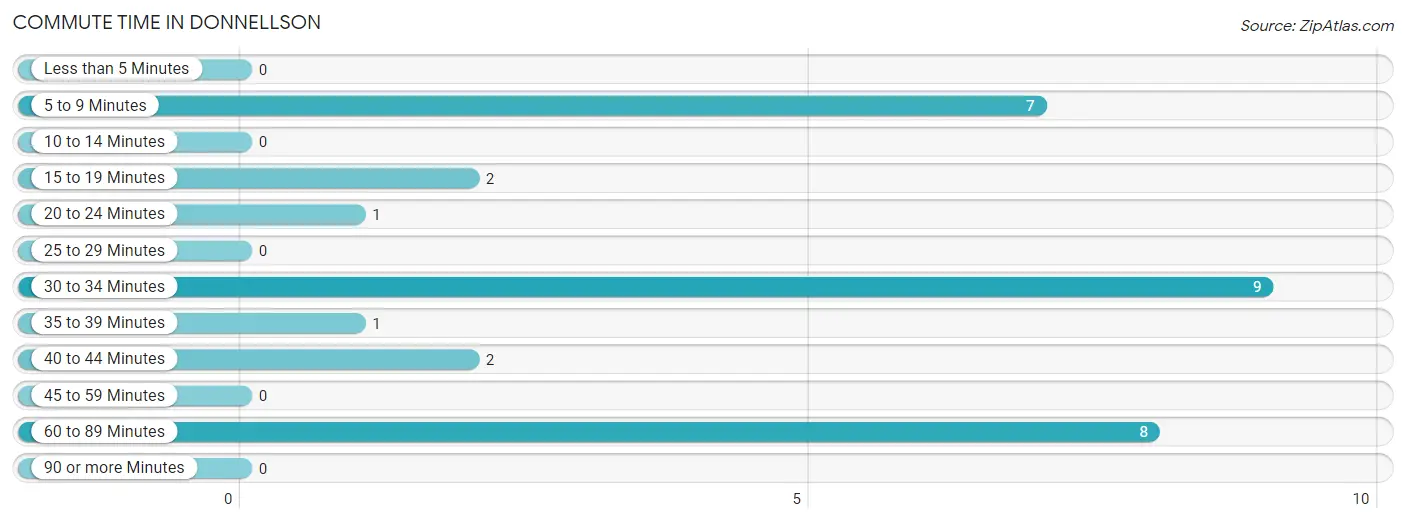
| Commute Time | # Commuters | % Commuters |
| Less than 5 Minutes | 0 | 0.0% |
| 5 to 9 Minutes | 7 | 23.3% |
| 10 to 14 Minutes | 0 | 0.0% |
| 15 to 19 Minutes | 2 | 6.7% |
| 20 to 24 Minutes | 1 | 3.3% |
| 25 to 29 Minutes | 0 | 0.0% |
| 30 to 34 Minutes | 9 | 30.0% |
| 35 to 39 Minutes | 1 | 3.3% |
| 40 to 44 Minutes | 2 | 6.7% |
| 45 to 59 Minutes | 0 | 0.0% |
| 60 to 89 Minutes | 8 | 26.7% |
| 90 or more Minutes | 0 | 0.0% |
Commute Time by Sex in Donnellson
The most common commute times in Donnellson are 5 to 9 minutes (5 commuters, 26.3%) for males and 30 to 34 minutes (5 commuters, 45.5%) for females.
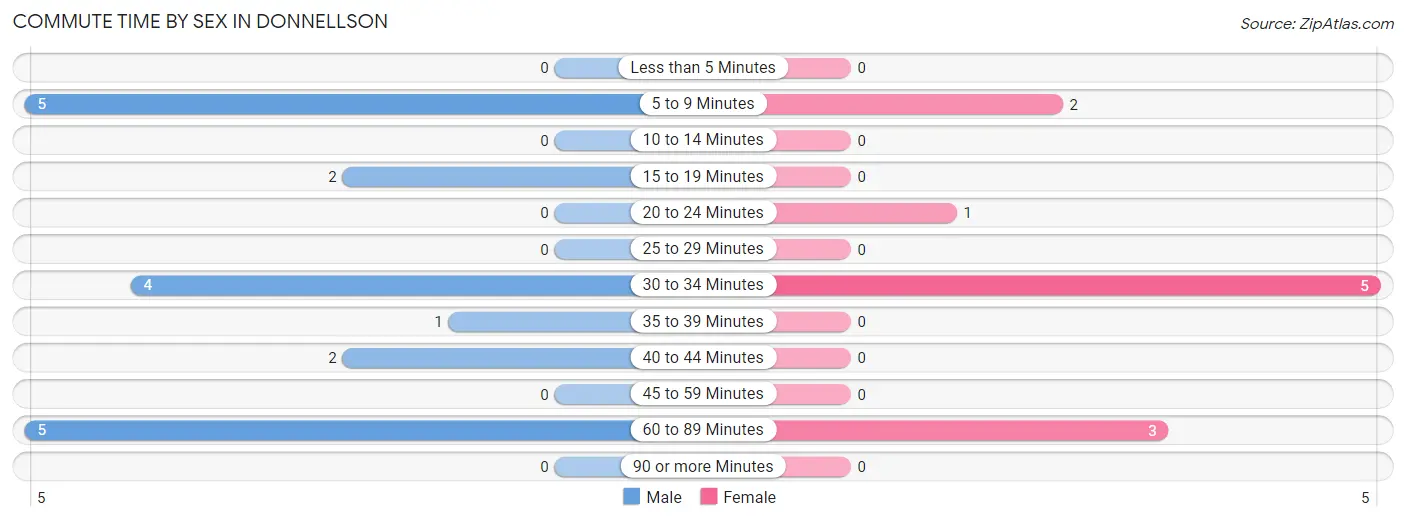
| Commute Time | Male | Female |
| Less than 5 Minutes | 0 (0.0%) | 0 (0.0%) |
| 5 to 9 Minutes | 5 (26.3%) | 2 (18.2%) |
| 10 to 14 Minutes | 0 (0.0%) | 0 (0.0%) |
| 15 to 19 Minutes | 2 (10.5%) | 0 (0.0%) |
| 20 to 24 Minutes | 0 (0.0%) | 1 (9.1%) |
| 25 to 29 Minutes | 0 (0.0%) | 0 (0.0%) |
| 30 to 34 Minutes | 4 (21.0%) | 5 (45.5%) |
| 35 to 39 Minutes | 1 (5.3%) | 0 (0.0%) |
| 40 to 44 Minutes | 2 (10.5%) | 0 (0.0%) |
| 45 to 59 Minutes | 0 (0.0%) | 0 (0.0%) |
| 60 to 89 Minutes | 5 (26.3%) | 3 (27.3%) |
| 90 or more Minutes | 0 (0.0%) | 0 (0.0%) |
Time of Departure to Work by Sex in Donnellson
The most frequent times of departure to work in Donnellson are 8:00 AM to 8:29 AM (5, 26.3%) for males and 7:00 AM to 7:29 AM (5, 45.5%) for females.
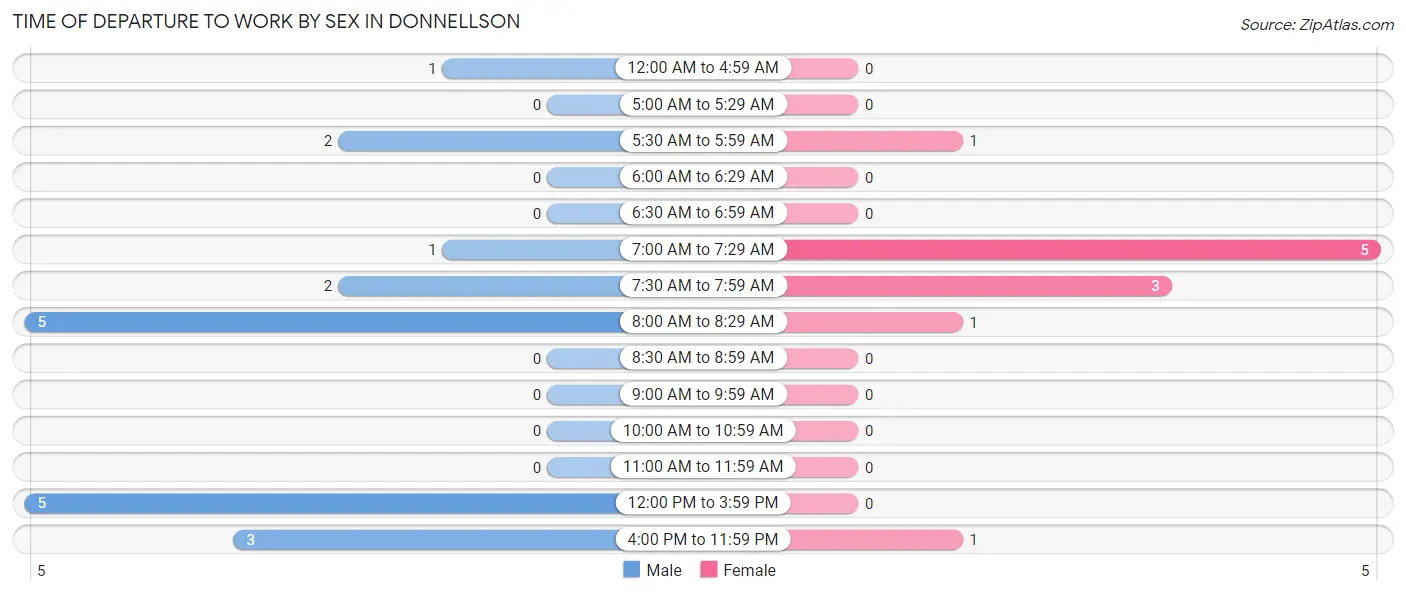
| Time of Departure | Male | Female |
| 12:00 AM to 4:59 AM | 1 (5.3%) | 0 (0.0%) |
| 5:00 AM to 5:29 AM | 0 (0.0%) | 0 (0.0%) |
| 5:30 AM to 5:59 AM | 2 (10.5%) | 1 (9.1%) |
| 6:00 AM to 6:29 AM | 0 (0.0%) | 0 (0.0%) |
| 6:30 AM to 6:59 AM | 0 (0.0%) | 0 (0.0%) |
| 7:00 AM to 7:29 AM | 1 (5.3%) | 5 (45.5%) |
| 7:30 AM to 7:59 AM | 2 (10.5%) | 3 (27.3%) |
| 8:00 AM to 8:29 AM | 5 (26.3%) | 1 (9.1%) |
| 8:30 AM to 8:59 AM | 0 (0.0%) | 0 (0.0%) |
| 9:00 AM to 9:59 AM | 0 (0.0%) | 0 (0.0%) |
| 10:00 AM to 10:59 AM | 0 (0.0%) | 0 (0.0%) |
| 11:00 AM to 11:59 AM | 0 (0.0%) | 0 (0.0%) |
| 12:00 PM to 3:59 PM | 5 (26.3%) | 0 (0.0%) |
| 4:00 PM to 11:59 PM | 3 (15.8%) | 1 (9.1%) |
| Total | 19 (100.0%) | 11 (100.0%) |
Housing Occupancy in Donnellson
Occupancy by Ownership in Donnellson
Of the total 64 dwellings in Donnellson, owner-occupied units account for 56 (87.5%), while renter-occupied units make up 8 (12.5%).
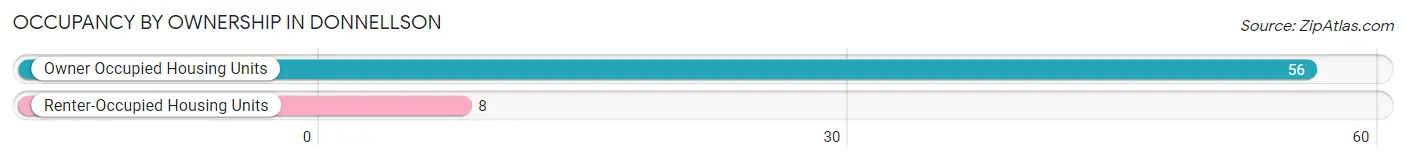
| Occupancy | # Housing Units | % Housing Units |
| Owner Occupied Housing Units | 56 | 87.5% |
| Renter-Occupied Housing Units | 8 | 12.5% |
| Total Occupied Housing Units | 64 | 100.0% |
Occupancy by Household Size in Donnellson
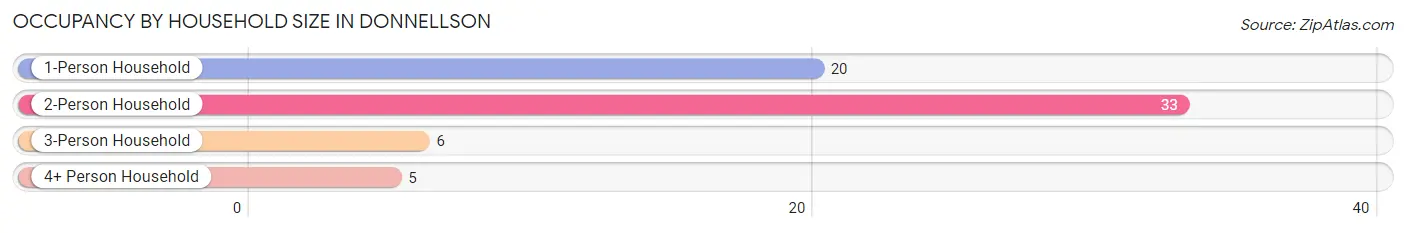
| Household Size | # Housing Units | % Housing Units |
| 1-Person Household | 20 | 31.2% |
| 2-Person Household | 33 | 51.6% |
| 3-Person Household | 6 | 9.4% |
| 4+ Person Household | 5 | 7.8% |
| Total Housing Units | 64 | 100.0% |
Occupancy by Ownership by Household Size in Donnellson
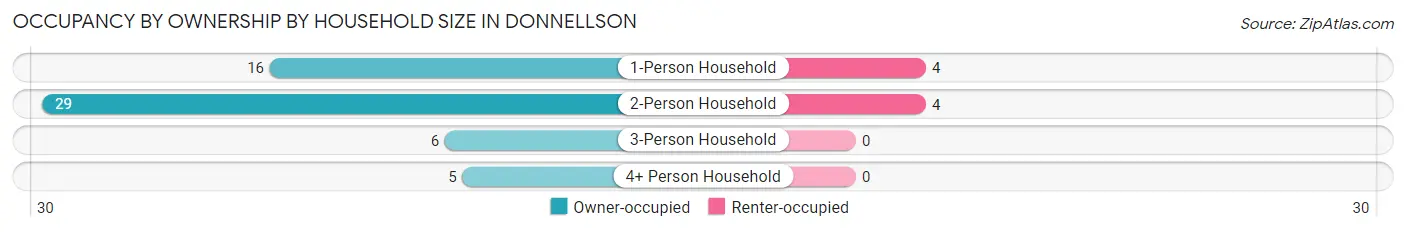
| Household Size | Owner-occupied | Renter-occupied |
| 1-Person Household | 16 (80.0%) | 4 (20.0%) |
| 2-Person Household | 29 (87.9%) | 4 (12.1%) |
| 3-Person Household | 6 (100.0%) | 0 (0.0%) |
| 4+ Person Household | 5 (100.0%) | 0 (0.0%) |
| Total Housing Units | 56 (87.5%) | 8 (12.5%) |
Occupancy by Educational Attainment in Donnellson
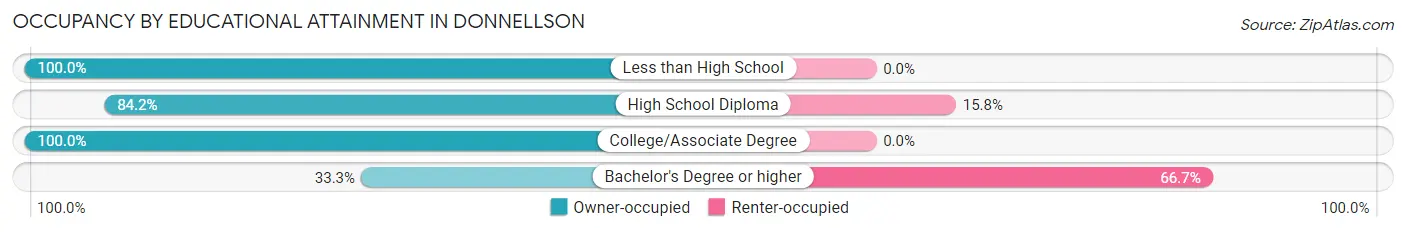
| Household Size | Owner-occupied | Renter-occupied |
| Less than High School | 10 (100.0%) | 0 (0.0%) |
| High School Diploma | 32 (84.2%) | 6 (15.8%) |
| College/Associate Degree | 13 (100.0%) | 0 (0.0%) |
| Bachelor's Degree or higher | 1 (33.3%) | 2 (66.7%) |
Occupancy by Age of Householder in Donnellson
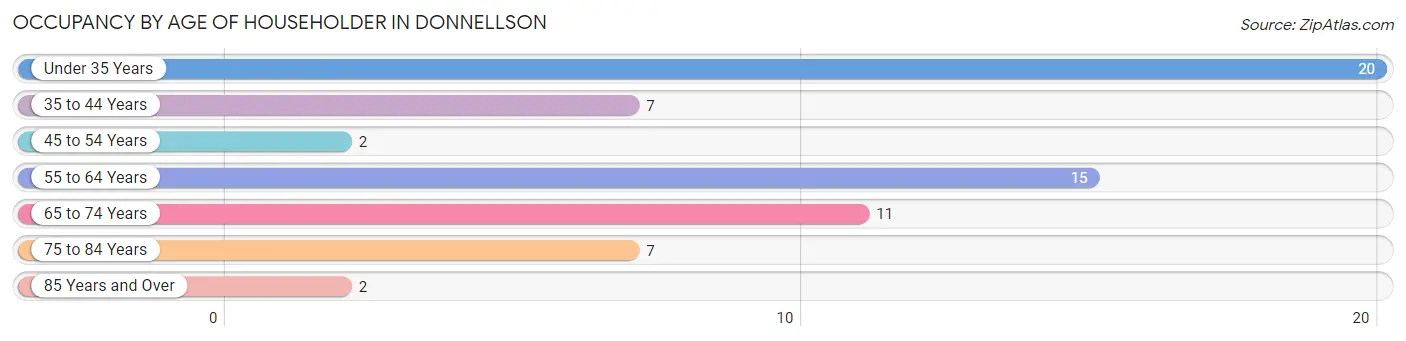
| Age Bracket | # Households | % Households |
| Under 35 Years | 20 | 31.2% |
| 35 to 44 Years | 7 | 10.9% |
| 45 to 54 Years | 2 | 3.1% |
| 55 to 64 Years | 15 | 23.4% |
| 65 to 74 Years | 11 | 17.2% |
| 75 to 84 Years | 7 | 10.9% |
| 85 Years and Over | 2 | 3.1% |
| Total | 64 | 100.0% |
Housing Finances in Donnellson
Median Income by Occupancy in Donnellson
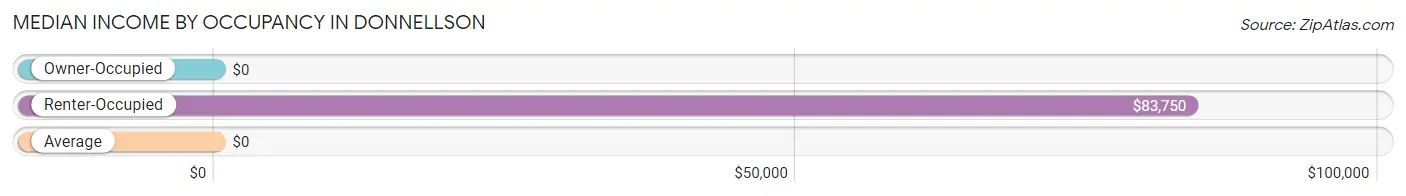
| Occupancy Type | # Households | Median Income |
| Owner-Occupied | 56 (87.5%) | $0 |
| Renter-Occupied | 8 (12.5%) | $83,750 |
| Average | 64 (100.0%) | $0 |
Occupancy by Householder Income Bracket in Donnellson
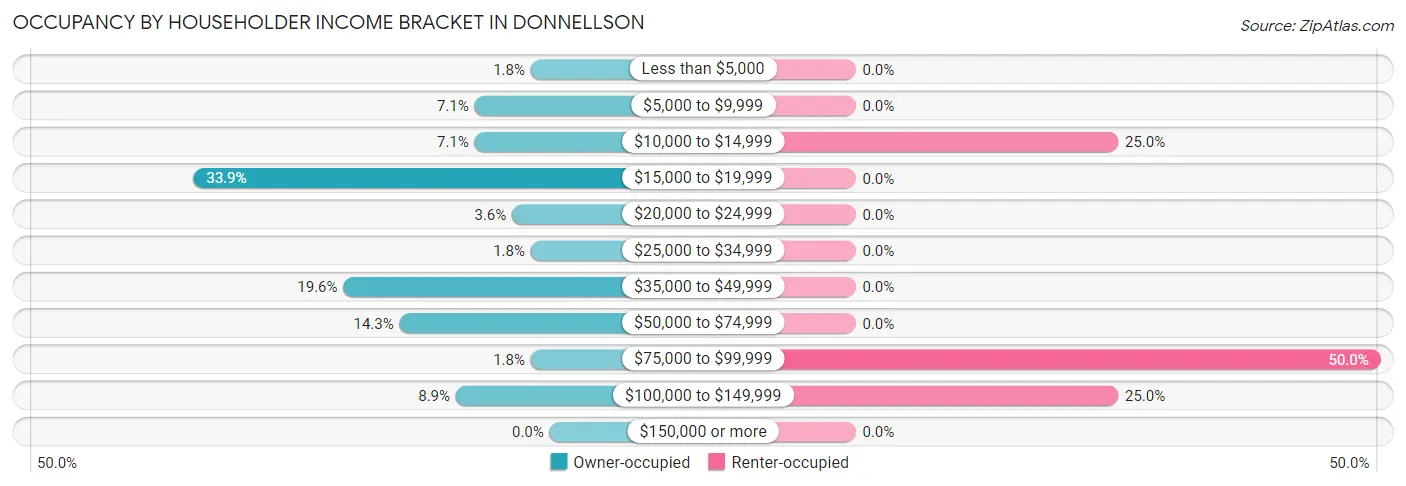
| Income Bracket | Owner-occupied | Renter-occupied |
| Less than $5,000 | 1 (1.8%) | 0 (0.0%) |
| $5,000 to $9,999 | 4 (7.1%) | 0 (0.0%) |
| $10,000 to $14,999 | 4 (7.1%) | 2 (25.0%) |
| $15,000 to $19,999 | 19 (33.9%) | 0 (0.0%) |
| $20,000 to $24,999 | 2 (3.6%) | 0 (0.0%) |
| $25,000 to $34,999 | 1 (1.8%) | 0 (0.0%) |
| $35,000 to $49,999 | 11 (19.6%) | 0 (0.0%) |
| $50,000 to $74,999 | 8 (14.3%) | 0 (0.0%) |
| $75,000 to $99,999 | 1 (1.8%) | 4 (50.0%) |
| $100,000 to $149,999 | 5 (8.9%) | 2 (25.0%) |
| $150,000 or more | 0 (0.0%) | 0 (0.0%) |
| Total | 56 (100.0%) | 8 (100.0%) |
Monthly Housing Cost Tiers in Donnellson
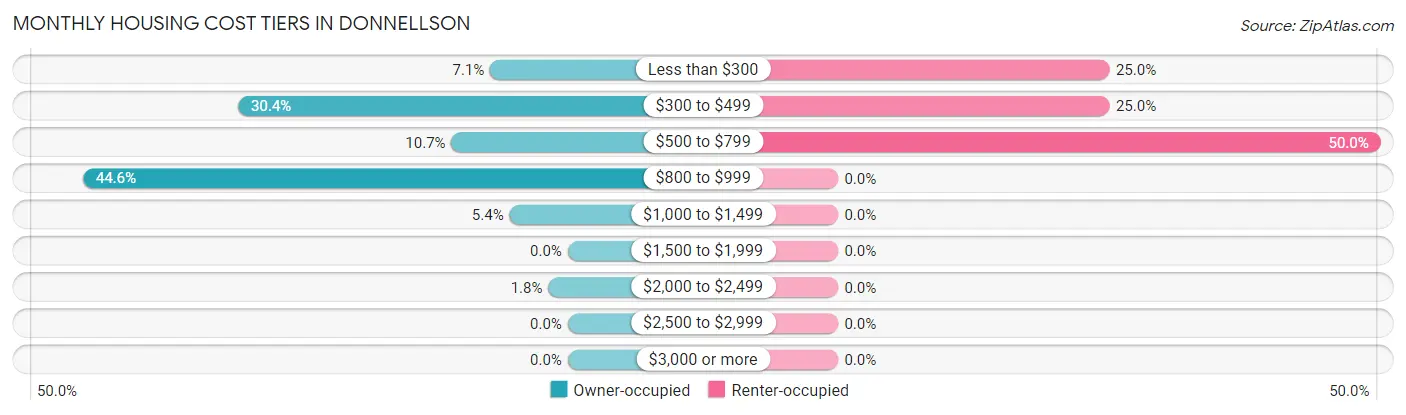
| Monthly Cost | Owner-occupied | Renter-occupied |
| Less than $300 | 4 (7.1%) | 2 (25.0%) |
| $300 to $499 | 17 (30.4%) | 2 (25.0%) |
| $500 to $799 | 6 (10.7%) | 4 (50.0%) |
| $800 to $999 | 25 (44.6%) | 0 (0.0%) |
| $1,000 to $1,499 | 3 (5.4%) | 0 (0.0%) |
| $1,500 to $1,999 | 0 (0.0%) | 0 (0.0%) |
| $2,000 to $2,499 | 1 (1.8%) | 0 (0.0%) |
| $2,500 to $2,999 | 0 (0.0%) | 0 (0.0%) |
| $3,000 or more | 0 (0.0%) | 0 (0.0%) |
| Total | 56 (100.0%) | 8 (100.0%) |
Physical Housing Characteristics in Donnellson
Housing Structures in Donnellson
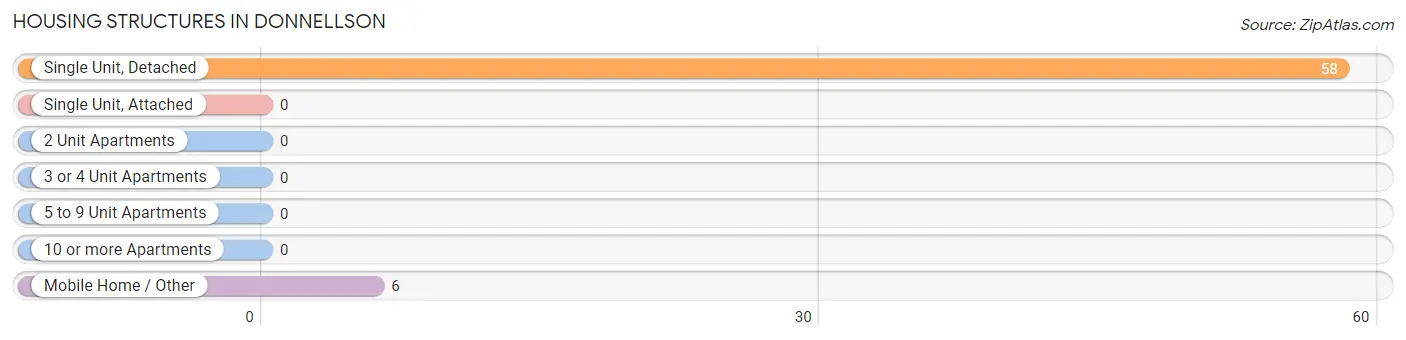
| Structure Type | # Housing Units | % Housing Units |
| Single Unit, Detached | 58 | 90.6% |
| Single Unit, Attached | 0 | 0.0% |
| 2 Unit Apartments | 0 | 0.0% |
| 3 or 4 Unit Apartments | 0 | 0.0% |
| 5 to 9 Unit Apartments | 0 | 0.0% |
| 10 or more Apartments | 0 | 0.0% |
| Mobile Home / Other | 6 | 9.4% |
| Total | 64 | 100.0% |
Housing Structures by Occupancy in Donnellson
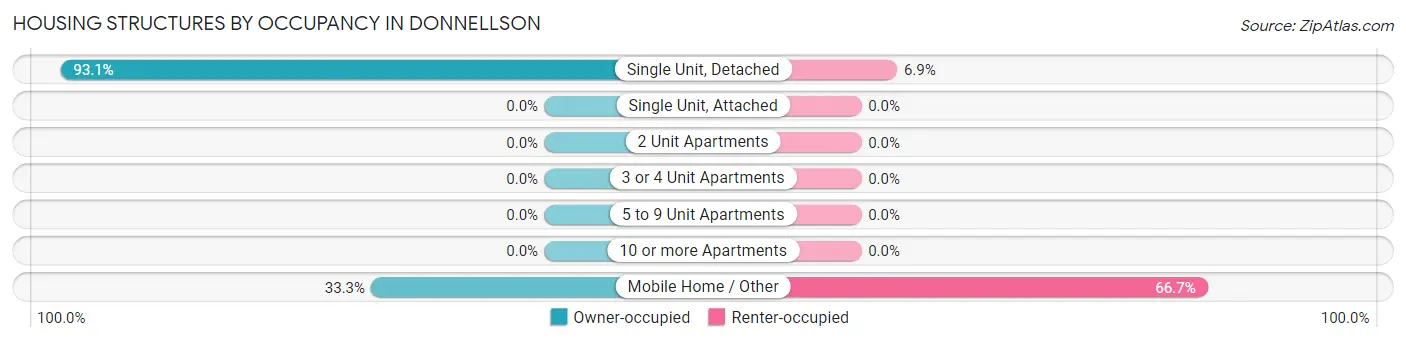
| Structure Type | Owner-occupied | Renter-occupied |
| Single Unit, Detached | 54 (93.1%) | 4 (6.9%) |
| Single Unit, Attached | 0 (0.0%) | 0 (0.0%) |
| 2 Unit Apartments | 0 (0.0%) | 0 (0.0%) |
| 3 or 4 Unit Apartments | 0 (0.0%) | 0 (0.0%) |
| 5 to 9 Unit Apartments | 0 (0.0%) | 0 (0.0%) |
| 10 or more Apartments | 0 (0.0%) | 0 (0.0%) |
| Mobile Home / Other | 2 (33.3%) | 4 (66.7%) |
| Total | 56 (87.5%) | 8 (12.5%) |
Housing Structures by Number of Rooms in Donnellson
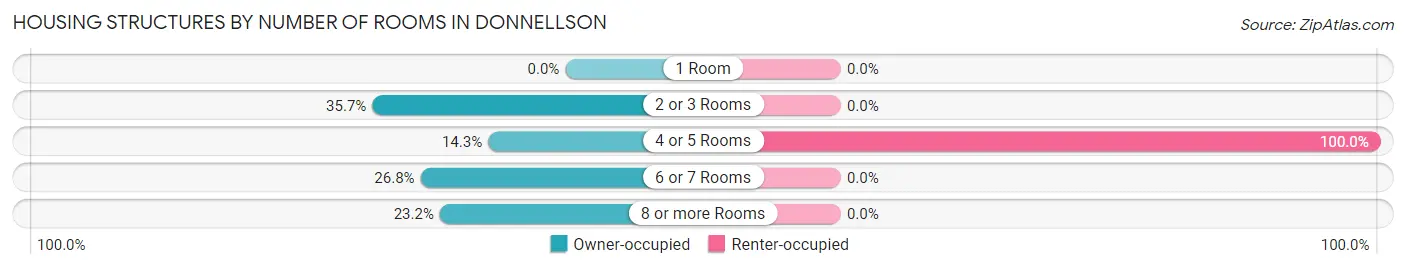
| Number of Rooms | Owner-occupied | Renter-occupied |
| 1 Room | 0 (0.0%) | 0 (0.0%) |
| 2 or 3 Rooms | 20 (35.7%) | 0 (0.0%) |
| 4 or 5 Rooms | 8 (14.3%) | 8 (100.0%) |
| 6 or 7 Rooms | 15 (26.8%) | 0 (0.0%) |
| 8 or more Rooms | 13 (23.2%) | 0 (0.0%) |
| Total | 56 (100.0%) | 8 (100.0%) |
Housing Structure by Heating Type in Donnellson
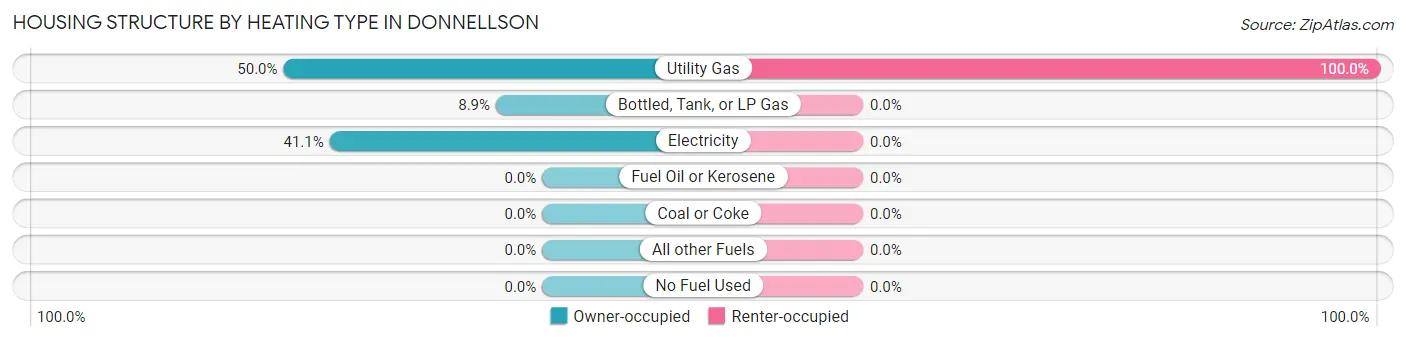
| Heating Type | Owner-occupied | Renter-occupied |
| Utility Gas | 28 (50.0%) | 8 (100.0%) |
| Bottled, Tank, or LP Gas | 5 (8.9%) | 0 (0.0%) |
| Electricity | 23 (41.1%) | 0 (0.0%) |
| Fuel Oil or Kerosene | 0 (0.0%) | 0 (0.0%) |
| Coal or Coke | 0 (0.0%) | 0 (0.0%) |
| All other Fuels | 0 (0.0%) | 0 (0.0%) |
| No Fuel Used | 0 (0.0%) | 0 (0.0%) |
| Total | 56 (100.0%) | 8 (100.0%) |
Household Vehicle Usage in Donnellson
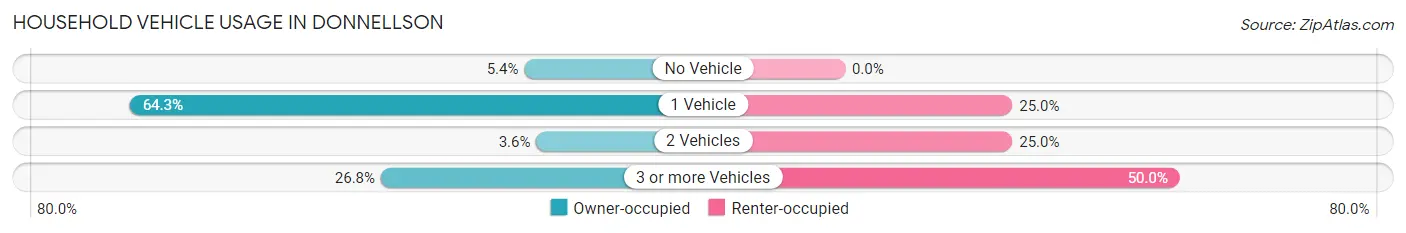
| Vehicles per Household | Owner-occupied | Renter-occupied |
| No Vehicle | 3 (5.4%) | 0 (0.0%) |
| 1 Vehicle | 36 (64.3%) | 2 (25.0%) |
| 2 Vehicles | 2 (3.6%) | 2 (25.0%) |
| 3 or more Vehicles | 15 (26.8%) | 4 (50.0%) |
| Total | 56 (100.0%) | 8 (100.0%) |
Real Estate & Mortgages in Donnellson
Real Estate and Mortgage Overview in Donnellson
| Characteristic | Without Mortgage | With Mortgage |
| Housing Units | 49 | 7 |
| Median Property Value | $47,700 | $75,000 |
| Median Household Income | - | - |
| Monthly Housing Costs | $810 | $0 |
| Real Estate Taxes | $199 | $1 |
Property Value by Mortgage Status in Donnellson
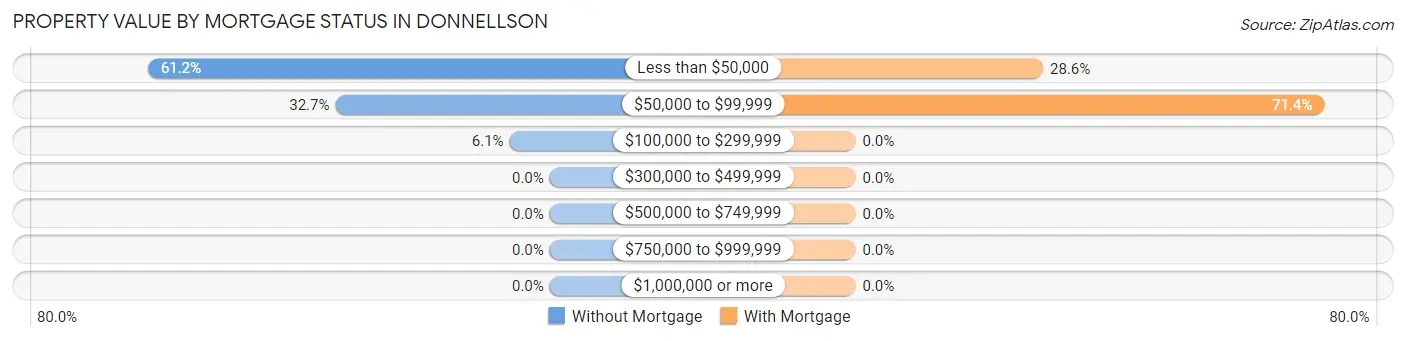
| Property Value | Without Mortgage | With Mortgage |
| Less than $50,000 | 30 (61.2%) | 2 (28.6%) |
| $50,000 to $99,999 | 16 (32.7%) | 5 (71.4%) |
| $100,000 to $299,999 | 3 (6.1%) | 0 (0.0%) |
| $300,000 to $499,999 | 0 (0.0%) | 0 (0.0%) |
| $500,000 to $749,999 | 0 (0.0%) | 0 (0.0%) |
| $750,000 to $999,999 | 0 (0.0%) | 0 (0.0%) |
| $1,000,000 or more | 0 (0.0%) | 0 (0.0%) |
| Total | 49 (100.0%) | 7 (100.0%) |
Household Income by Mortgage Status in Donnellson
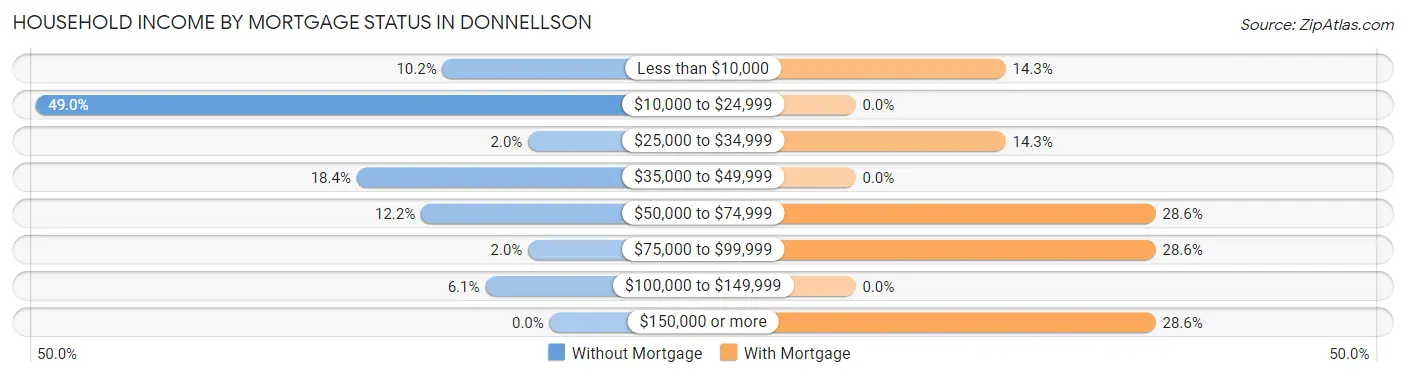
| Household Income | Without Mortgage | With Mortgage |
| Less than $10,000 | 5 (10.2%) | 1 (14.3%) |
| $10,000 to $24,999 | 24 (49.0%) | 0 (0.0%) |
| $25,000 to $34,999 | 1 (2.0%) | 1 (14.3%) |
| $35,000 to $49,999 | 9 (18.4%) | 0 (0.0%) |
| $50,000 to $74,999 | 6 (12.2%) | 2 (28.6%) |
| $75,000 to $99,999 | 1 (2.0%) | 2 (28.6%) |
| $100,000 to $149,999 | 3 (6.1%) | 0 (0.0%) |
| $150,000 or more | 0 (0.0%) | 2 (28.6%) |
| Total | 49 (100.0%) | 7 (100.0%) |
Property Value to Household Income Ratio in Donnellson
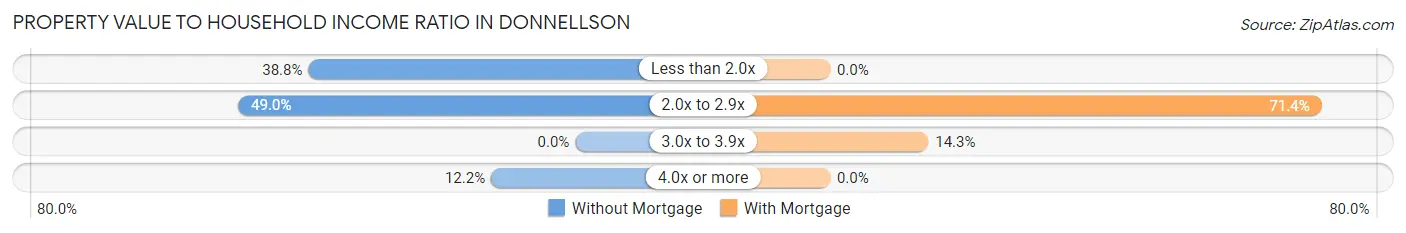
| Value-to-Income Ratio | Without Mortgage | With Mortgage |
| Less than 2.0x | 19 (38.8%) | 0 (0.0%) |
| 2.0x to 2.9x | 24 (49.0%) | 5 (71.4%) |
| 3.0x to 3.9x | 0 (0.0%) | 1 (14.3%) |
| 4.0x or more | 6 (12.2%) | 0 (0.0%) |
| Total | 49 (100.0%) | 7 (100.0%) |
Real Estate Taxes by Mortgage Status in Donnellson
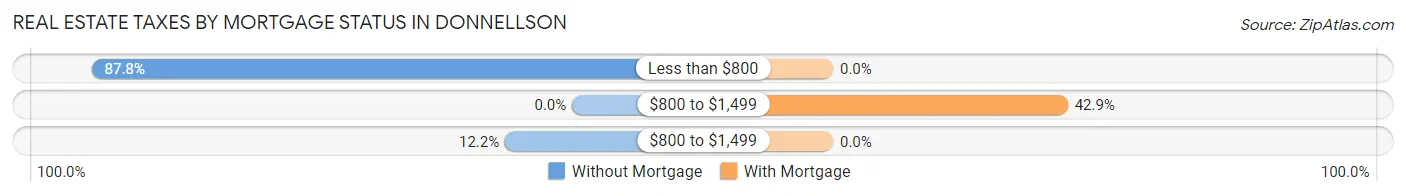
| Property Taxes | Without Mortgage | With Mortgage |
| Less than $800 | 43 (87.8%) | 0 (0.0%) |
| $800 to $1,499 | 0 (0.0%) | 3 (42.9%) |
| $800 to $1,499 | 6 (12.2%) | 0 (0.0%) |
| Total | 49 (100.0%) | 7 (100.0%) |
Health & Disability in Donnellson
Health Insurance Coverage by Age in Donnellson
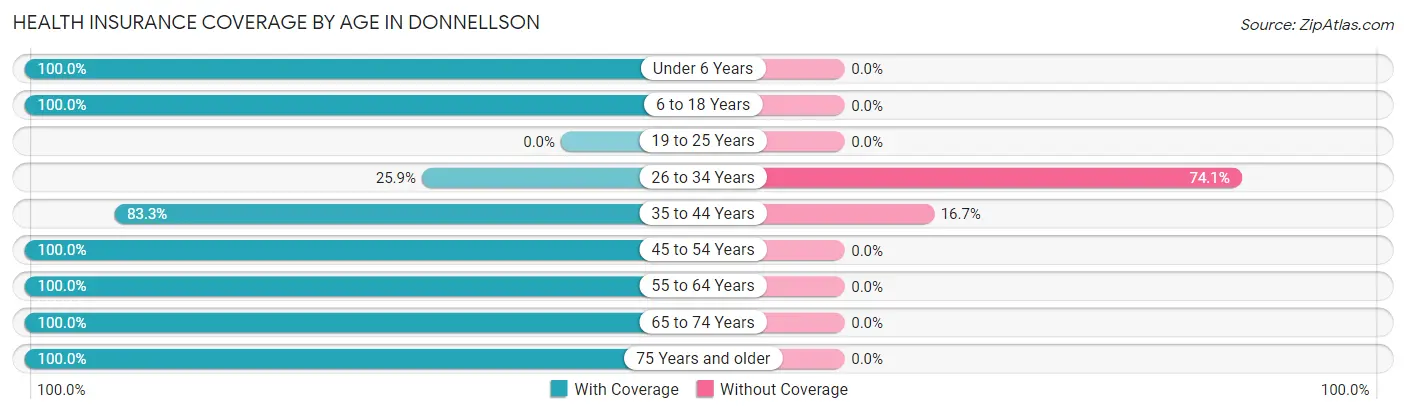
| Age Bracket | With Coverage | Without Coverage |
| Under 6 Years | 6 (100.0%) | 0 (0.0%) |
| 6 to 18 Years | 22 (100.0%) | 0 (0.0%) |
| 19 to 25 Years | 0 (0.0%) | 0 (0.0%) |
| 26 to 34 Years | 7 (25.9%) | 20 (74.1%) |
| 35 to 44 Years | 20 (83.3%) | 4 (16.7%) |
| 45 to 54 Years | 4 (100.0%) | 0 (0.0%) |
| 55 to 64 Years | 29 (100.0%) | 0 (0.0%) |
| 65 to 74 Years | 20 (100.0%) | 0 (0.0%) |
| 75 Years and older | 10 (100.0%) | 0 (0.0%) |
| Total | 118 (83.1%) | 24 (16.9%) |
Health Insurance Coverage by Citizenship Status in Donnellson
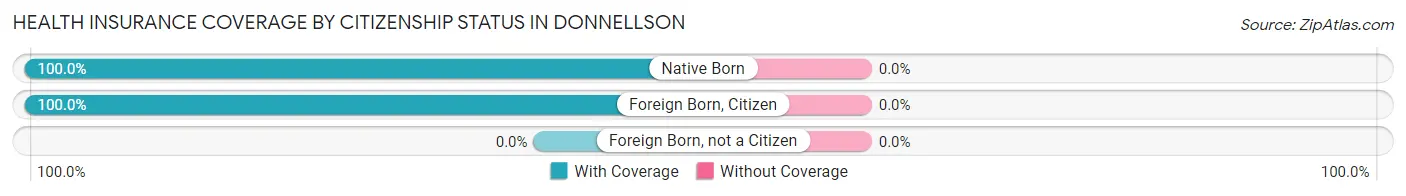
| Citizenship Status | With Coverage | Without Coverage |
| Native Born | 6 (100.0%) | 0 (0.0%) |
| Foreign Born, Citizen | 22 (100.0%) | 0 (0.0%) |
| Foreign Born, not a Citizen | 0 (0.0%) | 0 (0.0%) |
Health Insurance Coverage by Household Income in Donnellson
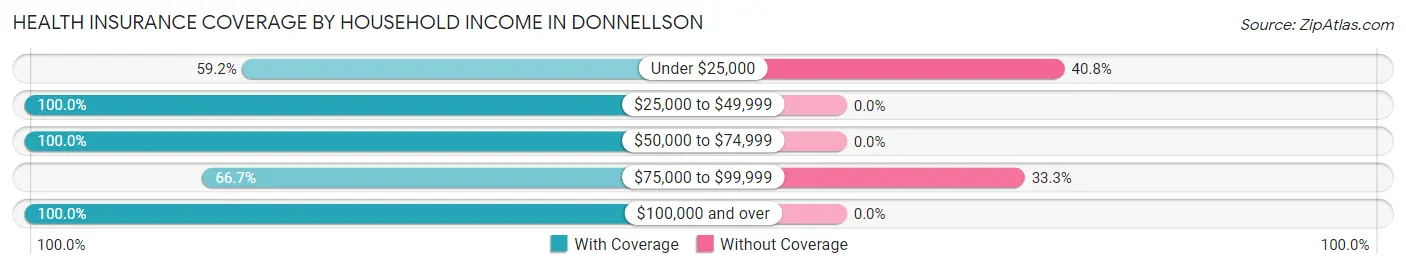
| Household Income | With Coverage | Without Coverage |
| Under $25,000 | 29 (59.2%) | 20 (40.8%) |
| $25,000 to $49,999 | 48 (100.0%) | 0 (0.0%) |
| $50,000 to $74,999 | 18 (100.0%) | 0 (0.0%) |
| $75,000 to $99,999 | 8 (66.7%) | 4 (33.3%) |
| $100,000 and over | 15 (100.0%) | 0 (0.0%) |
Public vs Private Health Insurance Coverage by Age in Donnellson
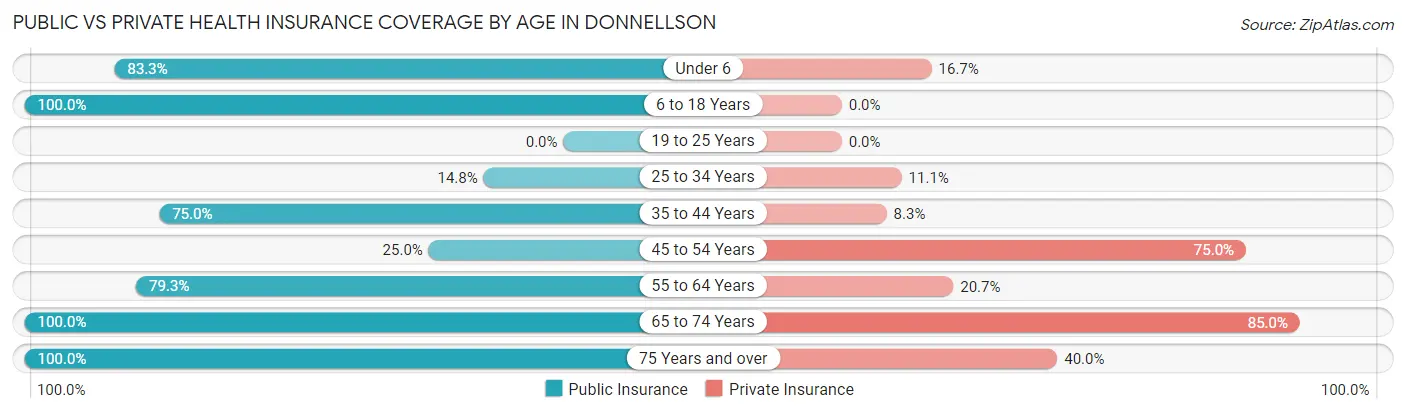
| Age Bracket | Public Insurance | Private Insurance |
| Under 6 | 5 (83.3%) | 1 (16.7%) |
| 6 to 18 Years | 22 (100.0%) | 0 (0.0%) |
| 19 to 25 Years | 0 (0.0%) | 0 (0.0%) |
| 25 to 34 Years | 4 (14.8%) | 3 (11.1%) |
| 35 to 44 Years | 18 (75.0%) | 2 (8.3%) |
| 45 to 54 Years | 1 (25.0%) | 3 (75.0%) |
| 55 to 64 Years | 23 (79.3%) | 6 (20.7%) |
| 65 to 74 Years | 20 (100.0%) | 17 (85.0%) |
| 75 Years and over | 10 (100.0%) | 4 (40.0%) |
| Total | 103 (72.5%) | 36 (25.4%) |
Disability Status by Sex by Age in Donnellson
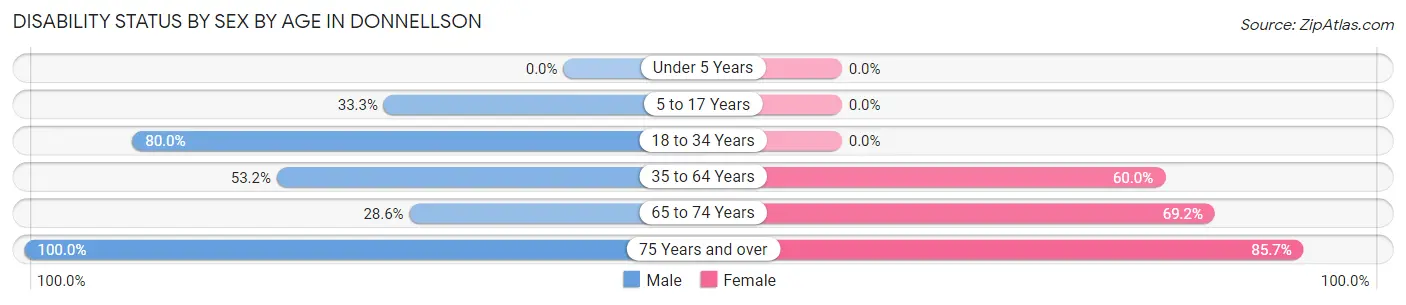
| Age Bracket | Male | Female |
| Under 5 Years | 0 (0.0%) | 0 (0.0%) |
| 5 to 17 Years | 7 (33.3%) | 0 (0.0%) |
| 18 to 34 Years | 20 (80.0%) | 0 (0.0%) |
| 35 to 64 Years | 25 (53.2%) | 6 (60.0%) |
| 65 to 74 Years | 2 (28.6%) | 9 (69.2%) |
| 75 Years and over | 3 (100.0%) | 6 (85.7%) |
Disability Class by Sex by Age in Donnellson
Disability Class: Hearing Difficulty
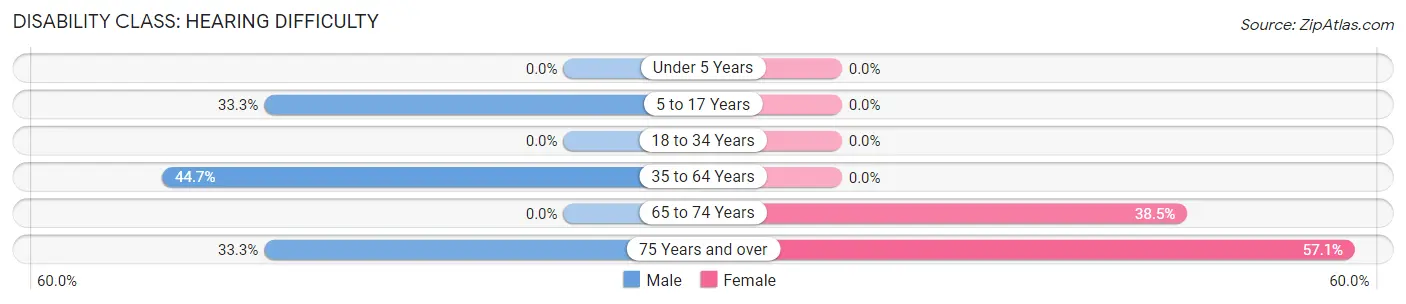
| Age Bracket | Male | Female |
| Under 5 Years | 0 (0.0%) | 0 (0.0%) |
| 5 to 17 Years | 7 (33.3%) | 0 (0.0%) |
| 18 to 34 Years | 0 (0.0%) | 0 (0.0%) |
| 35 to 64 Years | 21 (44.7%) | 0 (0.0%) |
| 65 to 74 Years | 0 (0.0%) | 5 (38.5%) |
| 75 Years and over | 1 (33.3%) | 4 (57.1%) |
Disability Class: Vision Difficulty
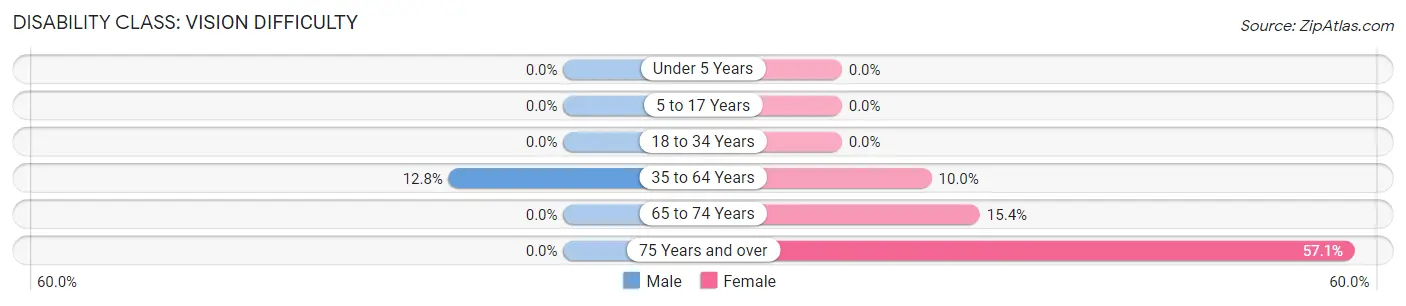
| Age Bracket | Male | Female |
| Under 5 Years | 0 (0.0%) | 0 (0.0%) |
| 5 to 17 Years | 0 (0.0%) | 0 (0.0%) |
| 18 to 34 Years | 0 (0.0%) | 0 (0.0%) |
| 35 to 64 Years | 6 (12.8%) | 1 (10.0%) |
| 65 to 74 Years | 0 (0.0%) | 2 (15.4%) |
| 75 Years and over | 0 (0.0%) | 4 (57.1%) |
Disability Class: Cognitive Difficulty
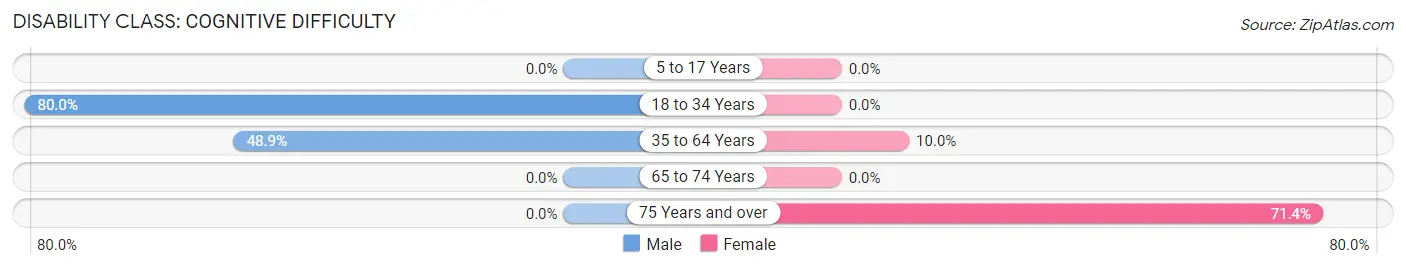
| Age Bracket | Male | Female |
| 5 to 17 Years | 0 (0.0%) | 0 (0.0%) |
| 18 to 34 Years | 20 (80.0%) | 0 (0.0%) |
| 35 to 64 Years | 23 (48.9%) | 1 (10.0%) |
| 65 to 74 Years | 0 (0.0%) | 0 (0.0%) |
| 75 Years and over | 0 (0.0%) | 5 (71.4%) |
Disability Class: Ambulatory Difficulty
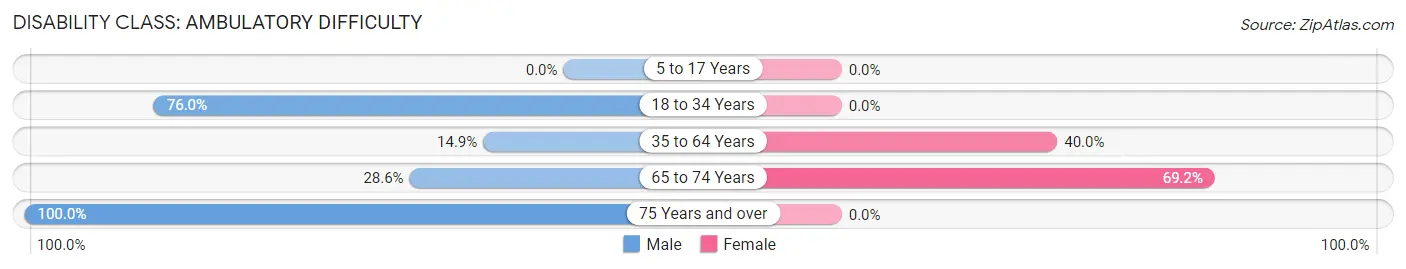
| Age Bracket | Male | Female |
| 5 to 17 Years | 0 (0.0%) | 0 (0.0%) |
| 18 to 34 Years | 19 (76.0%) | 0 (0.0%) |
| 35 to 64 Years | 7 (14.9%) | 4 (40.0%) |
| 65 to 74 Years | 2 (28.6%) | 9 (69.2%) |
| 75 Years and over | 3 (100.0%) | 0 (0.0%) |
Disability Class: Self-Care Difficulty
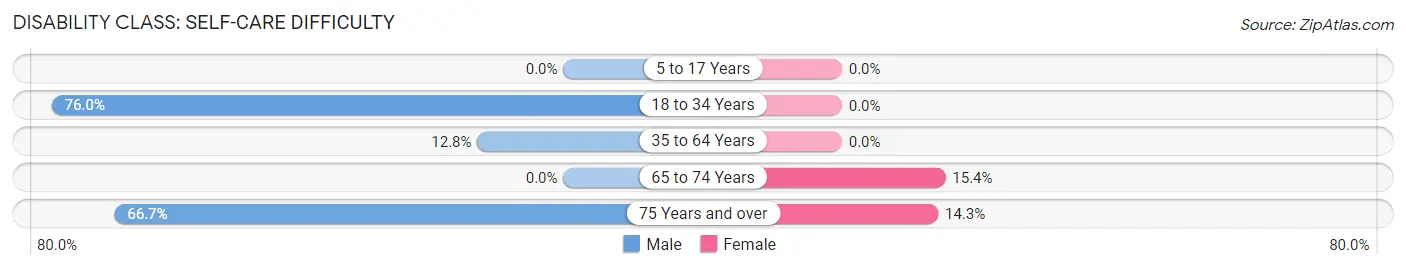
| Age Bracket | Male | Female |
| 5 to 17 Years | 0 (0.0%) | 0 (0.0%) |
| 18 to 34 Years | 19 (76.0%) | 0 (0.0%) |
| 35 to 64 Years | 6 (12.8%) | 0 (0.0%) |
| 65 to 74 Years | 0 (0.0%) | 2 (15.4%) |
| 75 Years and over | 2 (66.7%) | 1 (14.3%) |
Technology Access in Donnellson
Computing Device Access in Donnellson
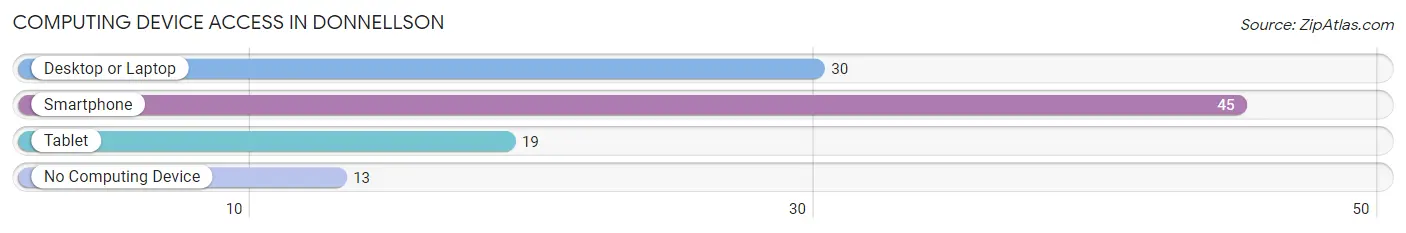
| Device Type | # Households | % Households |
| Desktop or Laptop | 30 | 46.9% |
| Smartphone | 45 | 70.3% |
| Tablet | 19 | 29.7% |
| No Computing Device | 13 | 20.3% |
| Total | 64 | 100.0% |
Internet Access in Donnellson
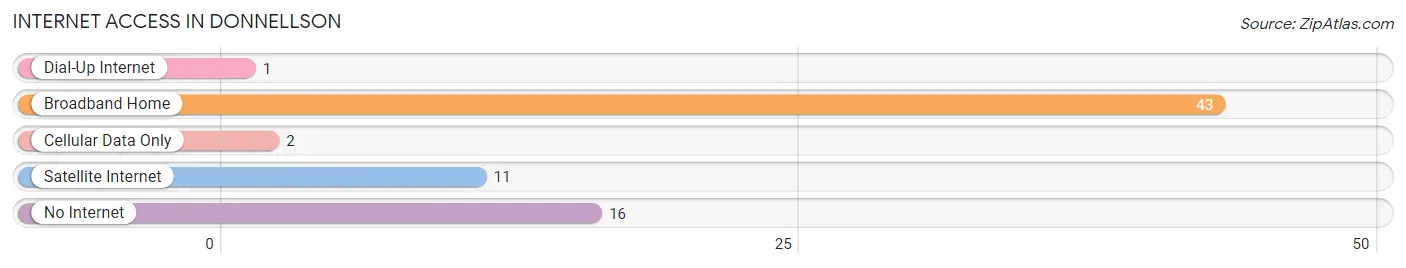
| Internet Type | # Households | % Households |
| Dial-Up Internet | 1 | 1.6% |
| Broadband Home | 43 | 67.2% |
| Cellular Data Only | 2 | 3.1% |
| Satellite Internet | 11 | 17.2% |
| No Internet | 16 | 25.0% |
| Total | 64 | 100.0% |
Donnellson Summary
History
The small town of Donnellson, Illinois is located in the southeastern corner of the state, in Franklin County. It was founded in 1854 by William Donnell, who had moved to the area from Kentucky. Donnell was a successful farmer and businessman, and he quickly established a thriving community. The town was incorporated in 1858, and it has remained a small, rural community ever since.
The town was originally known as Donnell's Station, and it was a stop on the Illinois Central Railroad. The railroad brought new people and businesses to the area, and the town grew rapidly. By the early 1900s, Donnellson had become a bustling center of commerce and industry. The town had several stores, a bank, a post office, a hotel, and a variety of other businesses.
In the early 20th century, Donnellson was a major producer of coal and timber. The town was also home to several factories, including a furniture factory, a canning factory, and a brickyard. The town's economy was largely based on these industries, and it provided employment for many of the town's residents.
In the 1950s, the town's economy began to decline. The coal and timber industries were in decline, and the factories began to close. The town's population began to decline as well, and by the 1970s, Donnellson had become a small, rural community.
Geography
Donnellson is located in the southeastern corner of Illinois, in Franklin County. It is situated on the banks of the Kaskaskia River, and it is surrounded by rolling hills and farmland. The town is located about 25 miles south of the city of St. Louis, Missouri, and it is about 50 miles east of the state capital of Springfield.
The town has a total area of 1.2 square miles, all of which is land. The town is located at an elevation of 645 feet above sea level. The climate in Donnellson is humid continental, with hot, humid summers and cold, snowy winters.
Economy
The economy of Donnellson is largely based on agriculture. The town is surrounded by farmland, and many of the town's residents are employed in the agricultural industry. The town also has several small businesses, including a grocery store, a hardware store, and a few restaurants.
The town is also home to a few manufacturing companies, including a furniture factory and a canning factory. These companies provide employment for many of the town's residents.
Demographics
According to the 2010 census, the population of Donnellson was 1,093. The town has a total area of 1.2 square miles, and the population density is 890.7 people per square mile. The median age in Donnellson is 43.7 years, and the median household income is $41,250.
The racial makeup of Donnellson is 97.2% White, 0.7% African American, 0.2% Native American, 0.2% Asian, 0.2% from other races, and 1.7% from two or more races. The town has a small Hispanic population, with 1.7% of the population identifying as Hispanic or Latino.
Conclusion
Donnellson, Illinois is a small, rural town located in the southeastern corner of the state. The town was founded in 1854, and it has remained a small, rural community ever since. The town's economy is largely based on agriculture, and it also has several small businesses. The population of Donnellson is 1,093, and the median age is 43.7 years. The town has a diverse racial makeup, with 97.2% of the population identifying as White, 0.7% as African American, 0.2% as Native American, 0.2% as Asian, and 1.7% as Hispanic or Latino.
Common Questions
What is Per Capita Income in Donnellson?
Per Capita income in Donnellson is $19,995.
What is Inequality or Gini Index in Donnellson?
Inequality or Gini Index in Donnellson is 0.45.
What is the Total Population of Donnellson?
Total Population of Donnellson is 142.
What is the Total Male Population of Donnellson?
Total Male Population of Donnellson is 104.
What is the Total Female Population of Donnellson?
Total Female Population of Donnellson is 38.
What is the Ratio of Males per 100 Females in Donnellson?
There are 273.68 Males per 100 Females in Donnellson.
What is the Ratio of Females per 100 Males in Donnellson?
There are 36.54 Females per 100 Males in Donnellson.
What is the Median Population Age in Donnellson?
Median Population Age in Donnellson is 38.6 Years.
What is the Average Family Size in Donnellson
Average Family Size in Donnellson is 2.7 People.
What is the Average Household Size in Donnellson
Average Household Size in Donnellson is 2.2 People.
How Large is the Labor Force in Donnellson?
There are 32 People in the Labor Forcein in Donnellson.
What is the Percentage of People in the Labor Force in Donnellson?
28.1% of People are in the Labor Force in Donnellson.