Evergreen Park, IL Map & Demographics
Evergreen Park Map
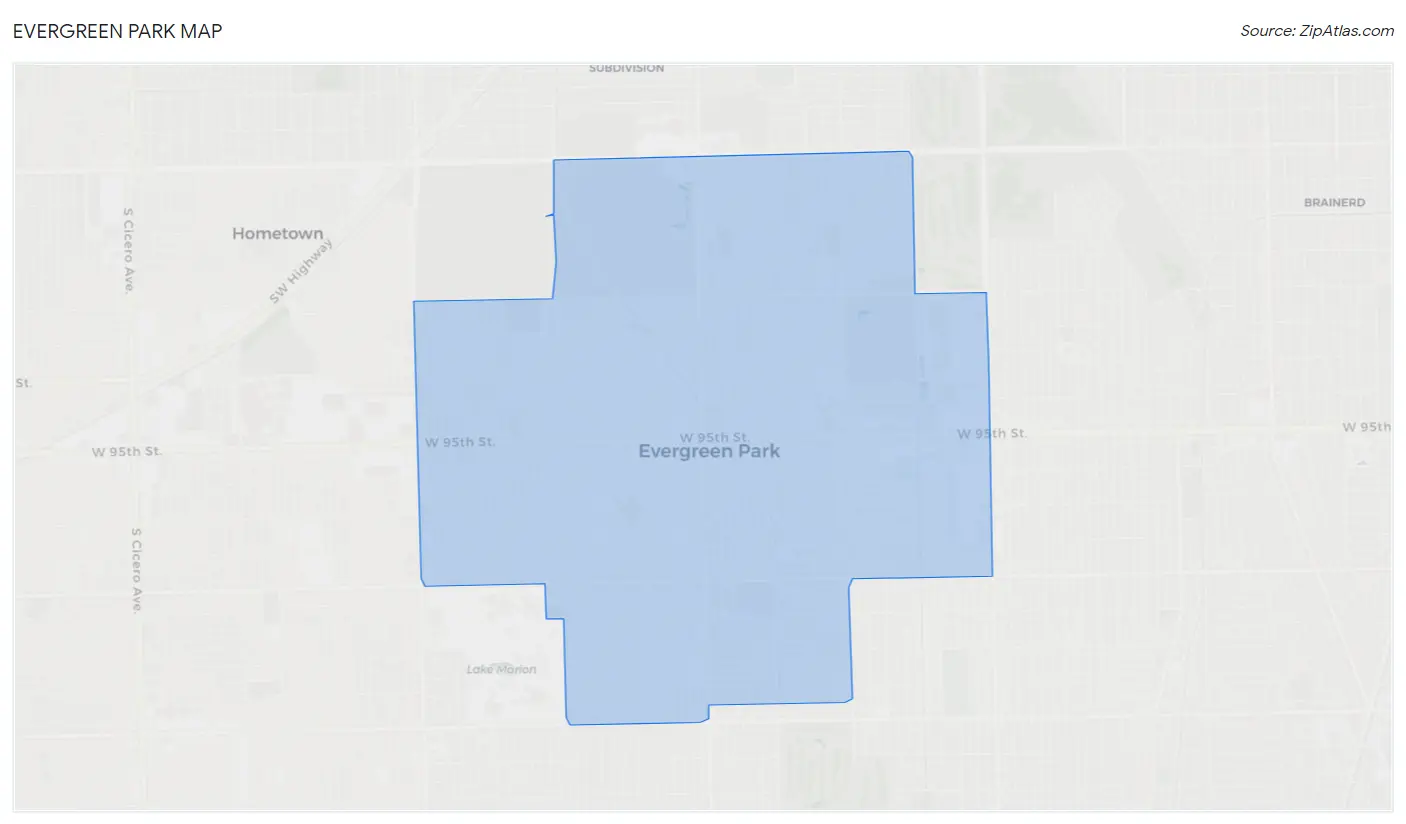
Evergreen Park Overview
$41,521
PER CAPITA INCOME
$111,882
AVG FAMILY INCOME
$92,266
AVG HOUSEHOLD INCOME
36.2%
WAGE / INCOME GAP [ % ]
63.8¢/ $1
WAGE / INCOME GAP [ $ ]
$13,161
FAMILY INCOME DEFICIT
0.39
INEQUALITY / GINI INDEX
19,730
TOTAL POPULATION
9,414
MALE POPULATION
10,316
FEMALE POPULATION
91.26
MALES / 100 FEMALES
109.58
FEMALES / 100 MALES
39.6
MEDIAN AGE
3.3
AVG FAMILY SIZE
2.6
AVG HOUSEHOLD SIZE
10,311
LABOR FORCE [ PEOPLE ]
66.5%
PERCENT IN LABOR FORCE
3.8%
UNEMPLOYMENT RATE
Evergreen Park Zip Codes
Evergreen Park Area Codes
Income in Evergreen Park
Income Overview in Evergreen Park
Per Capita Income in Evergreen Park is $41,521, while median incomes of families and households are $111,882 and $92,266 respectively.
| Characteristic | Number | Measure |
| Per Capita Income | 19,730 | $41,521 |
| Median Family Income | 5,026 | $111,882 |
| Mean Family Income | 5,026 | $128,043 |
| Median Household Income | 7,449 | $92,266 |
| Mean Household Income | 7,449 | $107,362 |
| Income Deficit | 5,026 | $13,161 |
| Wage / Income Gap (%) | 19,730 | 36.22% |
| Wage / Income Gap ($) | 19,730 | 63.78¢ per $1 |
| Gini / Inequality Index | 19,730 | 0.39 |
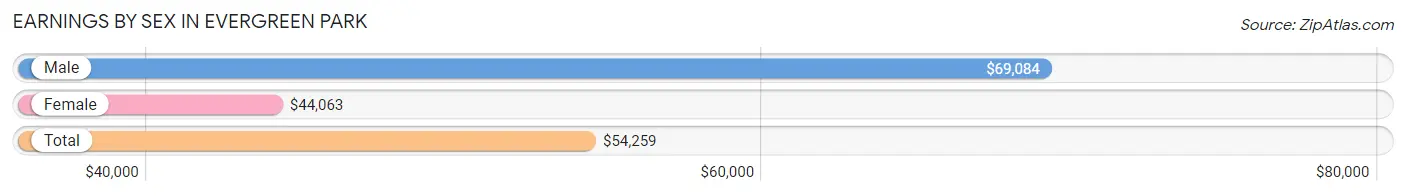
Earnings by Sex in Evergreen Park
Average Earnings in Evergreen Park are $54,259, $69,084 for men and $44,063 for women, a difference of 36.2%.
| Sex | Number | Average Earnings |
| Male | 5,260 (49.1%) | $69,084 |
| Female | 5,447 (50.9%) | $44,063 |
| Total | 10,707 (100.0%) | $54,259 |
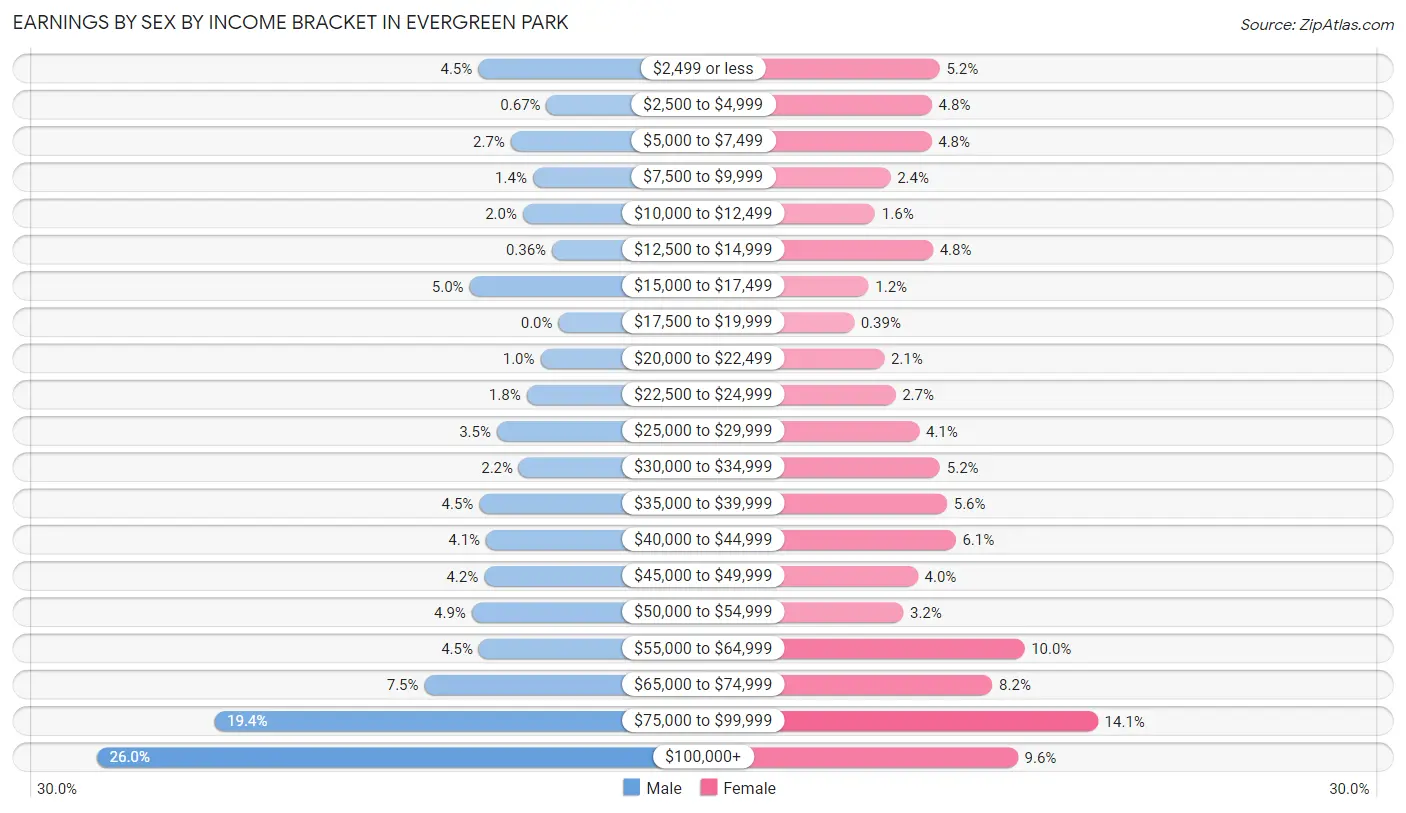
Earnings by Sex by Income Bracket in Evergreen Park
The most common earnings brackets in Evergreen Park are $100,000+ for men (1,365 | 26.0%) and $75,000 to $99,999 for women (768 | 14.1%).
| Income | Male | Female |
| $2,499 or less | 237 (4.5%) | 284 (5.2%) |
| $2,500 to $4,999 | 35 (0.7%) | 260 (4.8%) |
| $5,000 to $7,499 | 141 (2.7%) | 259 (4.8%) |
| $7,500 to $9,999 | 76 (1.4%) | 133 (2.4%) |
| $10,000 to $12,499 | 105 (2.0%) | 86 (1.6%) |
| $12,500 to $14,999 | 19 (0.4%) | 263 (4.8%) |
| $15,000 to $17,499 | 263 (5.0%) | 66 (1.2%) |
| $17,500 to $19,999 | 0 (0.0%) | 21 (0.4%) |
| $20,000 to $22,499 | 53 (1.0%) | 114 (2.1%) |
| $22,500 to $24,999 | 94 (1.8%) | 148 (2.7%) |
| $25,000 to $29,999 | 182 (3.5%) | 221 (4.1%) |
| $30,000 to $34,999 | 117 (2.2%) | 285 (5.2%) |
| $35,000 to $39,999 | 234 (4.4%) | 306 (5.6%) |
| $40,000 to $44,999 | 214 (4.1%) | 333 (6.1%) |
| $45,000 to $49,999 | 220 (4.2%) | 217 (4.0%) |
| $50,000 to $54,999 | 256 (4.9%) | 172 (3.2%) |
| $55,000 to $64,999 | 235 (4.5%) | 543 (10.0%) |
| $65,000 to $74,999 | 396 (7.5%) | 445 (8.2%) |
| $75,000 to $99,999 | 1,018 (19.4%) | 768 (14.1%) |
| $100,000+ | 1,365 (26.0%) | 523 (9.6%) |
| Total | 5,260 (100.0%) | 5,447 (100.0%) |
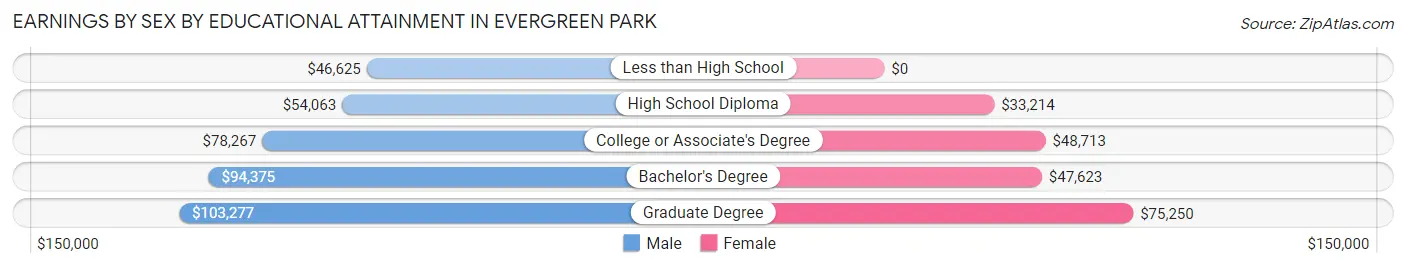
Earnings by Sex by Educational Attainment in Evergreen Park
Average earnings in Evergreen Park are $78,733 for men and $49,462 for women, a difference of 37.2%. Men with an educational attainment of graduate degree enjoy the highest average annual earnings of $103,277, while those with less than high school education earn the least with $46,625. Women with an educational attainment of graduate degree earn the most with the average annual earnings of $75,250, while those with high school diploma education have the smallest earnings of $33,214.
| Educational Attainment | Male Income | Female Income |
| Less than High School | $46,625 | $0 |
| High School Diploma | $54,063 | $33,214 |
| College or Associate's Degree | $78,267 | $48,713 |
| Bachelor's Degree | $94,375 | $47,623 |
| Graduate Degree | $103,277 | $75,250 |
| Total | $78,733 | $49,462 |
Family Income in Evergreen Park
Family Income Brackets in Evergreen Park
According to the Evergreen Park family income data, there are 1,337 families falling into the $100,000 to $149,999 income range, which is the most common income bracket and makes up 26.6% of all families. Conversely, the $10,000 to $14,999 income bracket is the least frequent group with only 45 families (0.9%) belonging to this category.
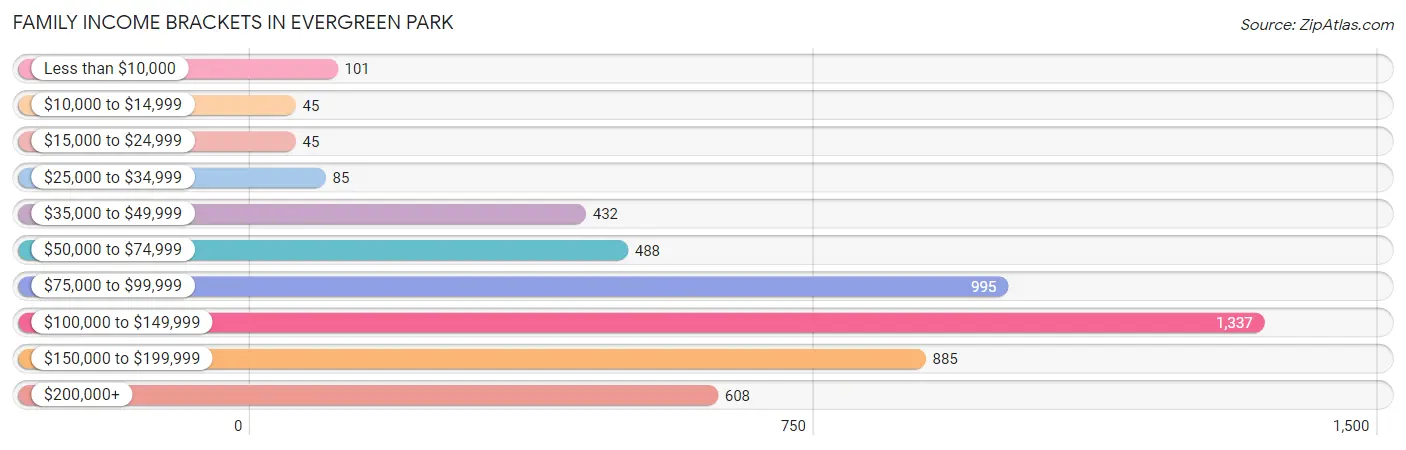
| Income Bracket | # Families | % Families |
| Less than $10,000 | 101 | 2.0% |
| $10,000 to $14,999 | 45 | 0.9% |
| $15,000 to $24,999 | 45 | 0.9% |
| $25,000 to $34,999 | 85 | 1.7% |
| $35,000 to $49,999 | 432 | 8.6% |
| $50,000 to $74,999 | 488 | 9.7% |
| $75,000 to $99,999 | 995 | 19.8% |
| $100,000 to $149,999 | 1,337 | 26.6% |
| $150,000 to $199,999 | 885 | 17.6% |
| $200,000+ | 608 | 12.1% |
Family Income by Famaliy Size in Evergreen Park
7+ person families (57 | 1.1%) account for the highest median family income in Evergreen Park with $222,163 per family, while 2-person families (1,968 | 39.2%) have the highest median income of $48,393 per family member.
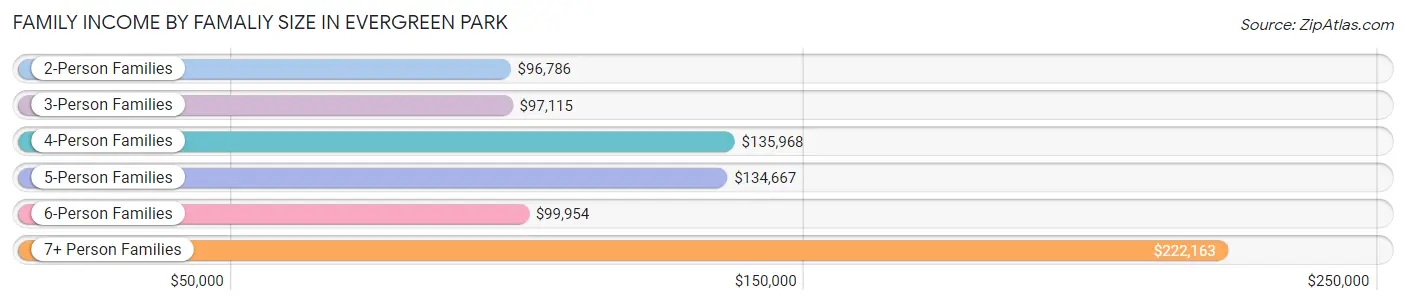
| Income Bracket | # Families | Median Income |
| 2-Person Families | 1,968 (39.2%) | $96,786 |
| 3-Person Families | 1,262 (25.1%) | $97,115 |
| 4-Person Families | 1,064 (21.2%) | $135,968 |
| 5-Person Families | 510 (10.2%) | $134,667 |
| 6-Person Families | 165 (3.3%) | $99,954 |
| 7+ Person Families | 57 (1.1%) | $222,163 |
| Total | 5,026 (100.0%) | $111,882 |
Family Income by Number of Earners in Evergreen Park
The median family income in Evergreen Park is $111,882, with families comprising 2 earners (2,285) having the highest median family income of $142,150, while families with no earners (625) have the lowest median family income of $51,285, accounting for 45.5% and 12.4% of families, respectively.
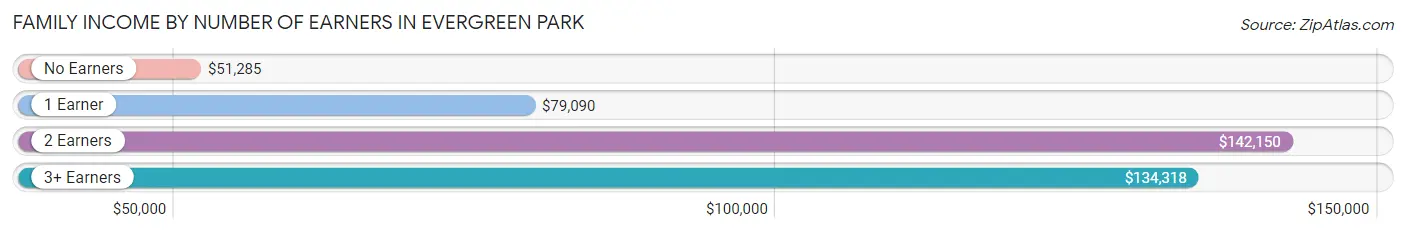
| Number of Earners | # Families | Median Income |
| No Earners | 625 (12.4%) | $51,285 |
| 1 Earner | 1,232 (24.5%) | $79,090 |
| 2 Earners | 2,285 (45.5%) | $142,150 |
| 3+ Earners | 884 (17.6%) | $134,318 |
| Total | 5,026 (100.0%) | $111,882 |
Household Income in Evergreen Park
Household Income Brackets in Evergreen Park
With 1,631 households falling in the category, the $100,000 to $149,999 income range is the most frequent in Evergreen Park, accounting for 21.9% of all households. In contrast, only 246 households (3.3%) fall into the $10,000 to $14,999 income bracket, making it the least populous group.
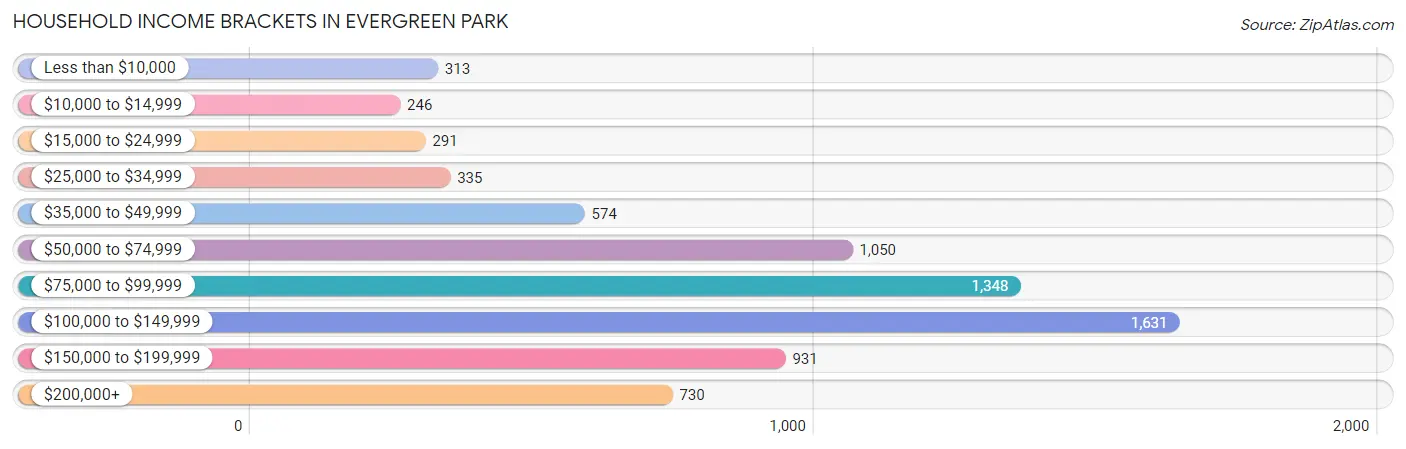
| Income Bracket | # Households | % Households |
| Less than $10,000 | 313 | 4.2% |
| $10,000 to $14,999 | 246 | 3.3% |
| $15,000 to $24,999 | 291 | 3.9% |
| $25,000 to $34,999 | 335 | 4.5% |
| $35,000 to $49,999 | 574 | 7.7% |
| $50,000 to $74,999 | 1,050 | 14.1% |
| $75,000 to $99,999 | 1,348 | 18.1% |
| $100,000 to $149,999 | 1,631 | 21.9% |
| $150,000 to $199,999 | 931 | 12.5% |
| $200,000+ | 730 | 9.8% |
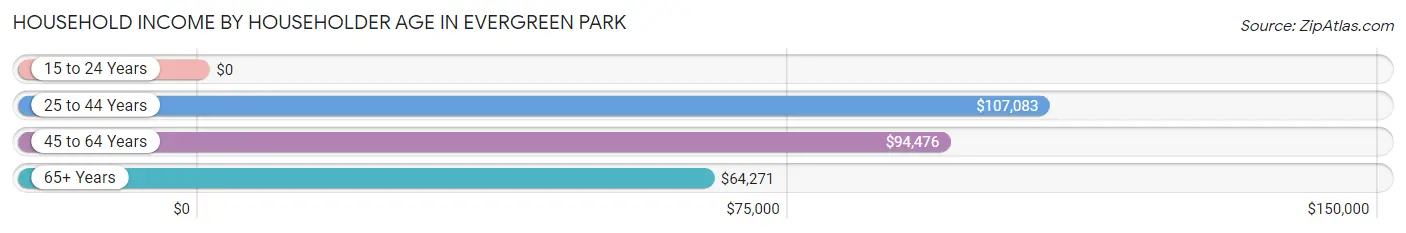
Household Income by Householder Age in Evergreen Park
The median household income in Evergreen Park is $92,266, with the highest median household income of $107,083 found in the 25 to 44 years age bracket for the primary householder. A total of 2,251 households (30.2%) fall into this category. Meanwhile, the 15 to 24 years age bracket for the primary householder has the lowest median household income of $0, with 19 households (0.3%) in this group.
| Income Bracket | # Households | Median Income |
| 15 to 24 Years | 19 (0.3%) | $0 |
| 25 to 44 Years | 2,251 (30.2%) | $107,083 |
| 45 to 64 Years | 3,147 (42.2%) | $94,476 |
| 65+ Years | 2,032 (27.3%) | $64,271 |
| Total | 7,449 (100.0%) | $92,266 |
Poverty in Evergreen Park
Income Below Poverty by Sex and Age in Evergreen Park
With 5.1% poverty level for males and 6.4% for females among the residents of Evergreen Park, 75 year old and over males and 75 year old and over females are the most vulnerable to poverty, with 81 males (30.3%) and 84 females (16.4%) in their respective age groups living below the poverty level.
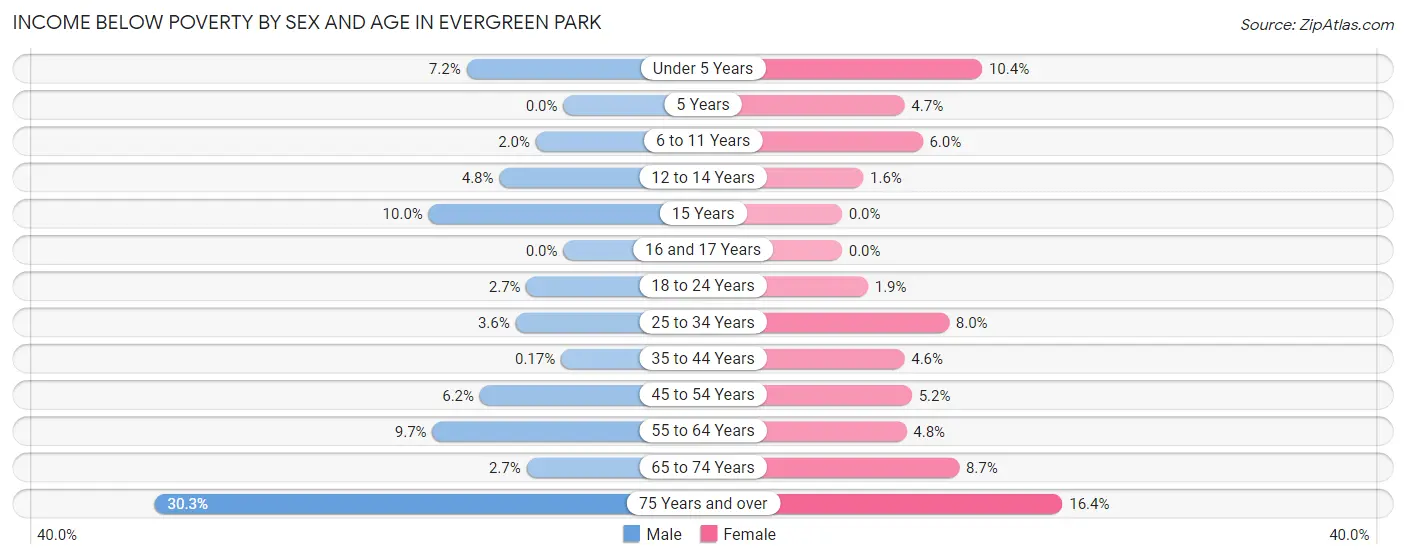
| Age Bracket | Male | Female |
| Under 5 Years | 72 (7.2%) | 82 (10.4%) |
| 5 Years | 0 (0.0%) | 8 (4.6%) |
| 6 to 11 Years | 12 (2.0%) | 47 (6.0%) |
| 12 to 14 Years | 15 (4.8%) | 6 (1.6%) |
| 15 Years | 6 (10.0%) | 0 (0.0%) |
| 16 and 17 Years | 0 (0.0%) | 0 (0.0%) |
| 18 to 24 Years | 24 (2.7%) | 10 (1.9%) |
| 25 to 34 Years | 40 (3.5%) | 122 (8.0%) |
| 35 to 44 Years | 2 (0.2%) | 50 (4.6%) |
| 45 to 54 Years | 79 (6.2%) | 81 (5.2%) |
| 55 to 64 Years | 117 (9.7%) | 68 (4.8%) |
| 65 to 74 Years | 28 (2.7%) | 100 (8.7%) |
| 75 Years and over | 81 (30.3%) | 84 (16.4%) |
| Total | 476 (5.1%) | 658 (6.4%) |
Income Above Poverty by Sex and Age in Evergreen Park
According to the poverty statistics in Evergreen Park, males aged 5 years and females aged 15 years are the age groups that are most secure financially, with 100.0% of males and 100.0% of females in these age groups living above the poverty line.
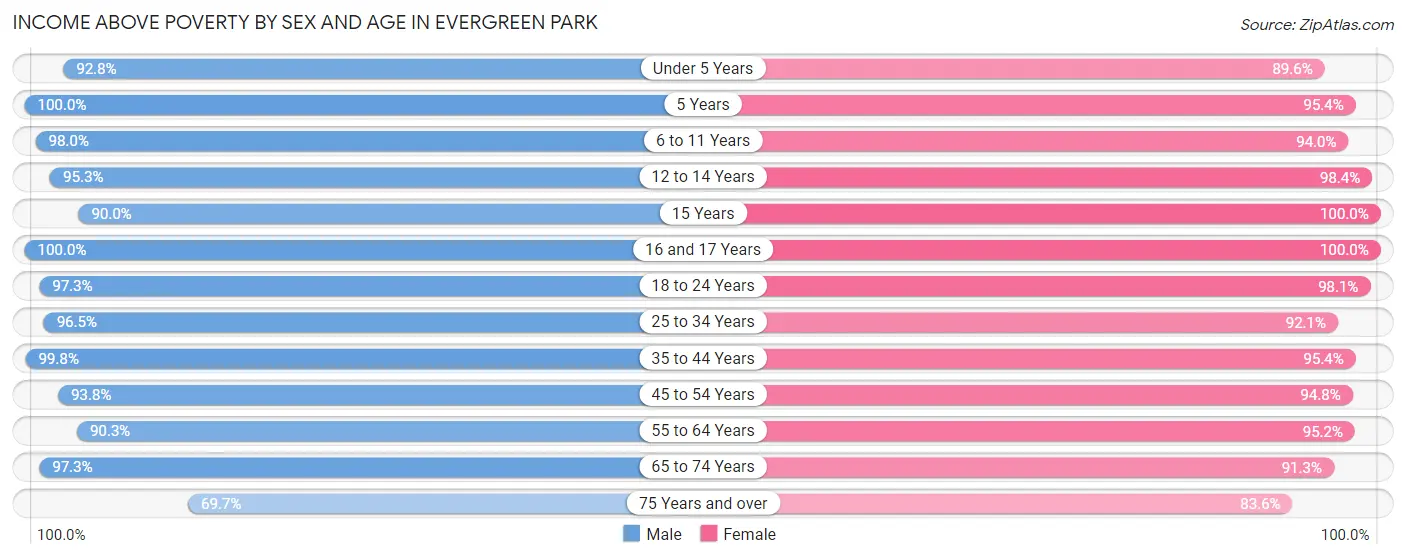
| Age Bracket | Male | Female |
| Under 5 Years | 930 (92.8%) | 706 (89.6%) |
| 5 Years | 68 (100.0%) | 164 (95.4%) |
| 6 to 11 Years | 577 (98.0%) | 737 (94.0%) |
| 12 to 14 Years | 301 (95.3%) | 373 (98.4%) |
| 15 Years | 54 (90.0%) | 66 (100.0%) |
| 16 and 17 Years | 388 (100.0%) | 292 (100.0%) |
| 18 to 24 Years | 852 (97.3%) | 507 (98.1%) |
| 25 to 34 Years | 1,087 (96.5%) | 1,412 (92.0%) |
| 35 to 44 Years | 1,144 (99.8%) | 1,027 (95.4%) |
| 45 to 54 Years | 1,196 (93.8%) | 1,481 (94.8%) |
| 55 to 64 Years | 1,087 (90.3%) | 1,351 (95.2%) |
| 65 to 74 Years | 998 (97.3%) | 1,049 (91.3%) |
| 75 Years and over | 186 (69.7%) | 429 (83.6%) |
| Total | 8,868 (94.9%) | 9,594 (93.6%) |
Income Below Poverty Among Married-Couple Families in Evergreen Park
The poverty statistics for married-couple families in Evergreen Park show that 1.5% or 55 of the total 3,684 families live below the poverty line. Families with no children have the highest poverty rate of 2.8%, comprising of 55 families. On the other hand, families with 1 or 2 children have the lowest poverty rate of 0.0%, which includes 0 families.
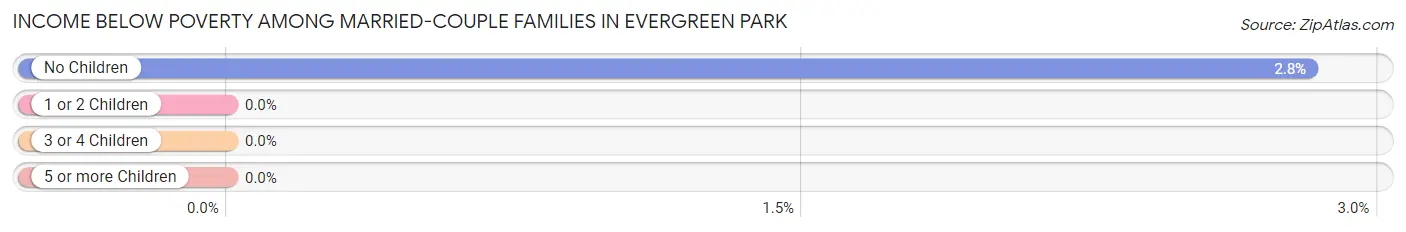
| Children | Above Poverty | Below Poverty |
| No Children | 1,897 (97.2%) | 55 (2.8%) |
| 1 or 2 Children | 1,280 (100.0%) | 0 (0.0%) |
| 3 or 4 Children | 452 (100.0%) | 0 (0.0%) |
| 5 or more Children | 0 (0.0%) | 0 (0.0%) |
| Total | 3,629 (98.5%) | 55 (1.5%) |
Income Below Poverty Among Single-Parent Households in Evergreen Park
According to the poverty data in Evergreen Park, 5.7% or 21 single-father households and 10.5% or 102 single-mother households are living below the poverty line. Among single-father households, those with 3 or 4 children have the highest poverty rate, with 6 households (33.3%) experiencing poverty. Likewise, among single-mother households, those with 5 or more children have the highest poverty rate, with 6 households (100.0%) falling below the poverty line.
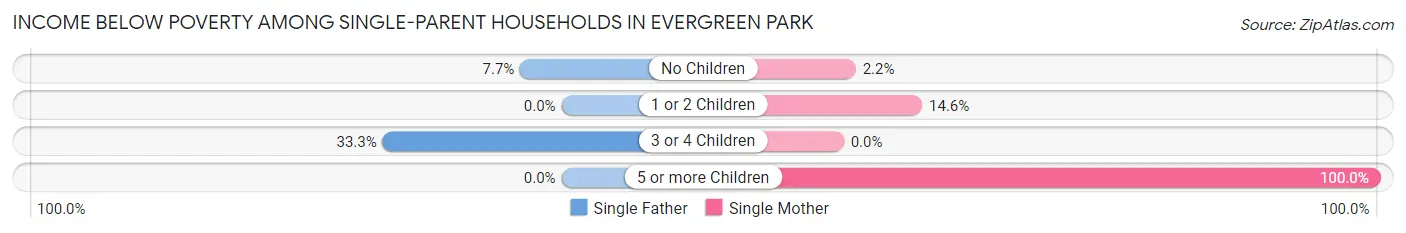
| Children | Single Father | Single Mother |
| No Children | 15 (7.7%) | 7 (2.2%) |
| 1 or 2 Children | 0 (0.0%) | 89 (14.6%) |
| 3 or 4 Children | 6 (33.3%) | 0 (0.0%) |
| 5 or more Children | 0 (0.0%) | 6 (100.0%) |
| Total | 21 (5.7%) | 102 (10.5%) |
Income Below Poverty Among Married-Couple vs Single-Parent Households in Evergreen Park
The poverty data for Evergreen Park shows that 55 of the married-couple family households (1.5%) and 123 of the single-parent households (9.2%) are living below the poverty level. Within the married-couple family households, those with no children have the highest poverty rate, with 55 households (2.8%) falling below the poverty line. Among the single-parent households, those with 5 or more children have the highest poverty rate, with 6 household (100.0%) living below poverty.
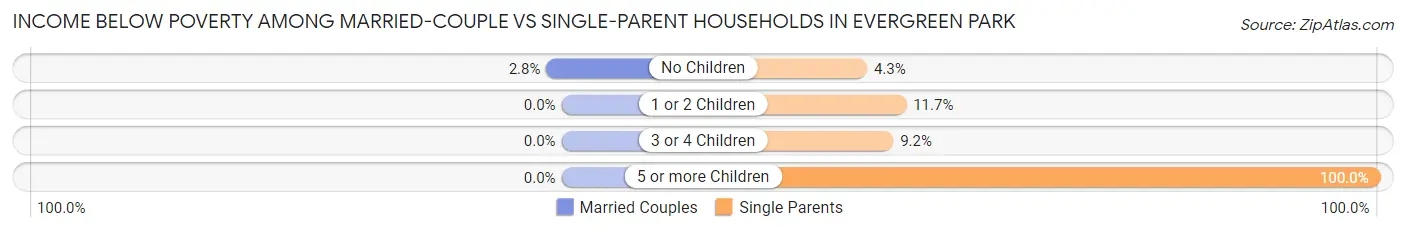
| Children | Married-Couple Families | Single-Parent Households |
| No Children | 55 (2.8%) | 22 (4.3%) |
| 1 or 2 Children | 0 (0.0%) | 89 (11.7%) |
| 3 or 4 Children | 0 (0.0%) | 6 (9.2%) |
| 5 or more Children | 0 (0.0%) | 6 (100.0%) |
| Total | 55 (1.5%) | 123 (9.2%) |
Race in Evergreen Park
The most populous races in Evergreen Park are White / Caucasian (12,317 | 62.4%), Black / African American (4,551 | 23.1%), and Hispanic or Latino (3,064 | 15.5%).
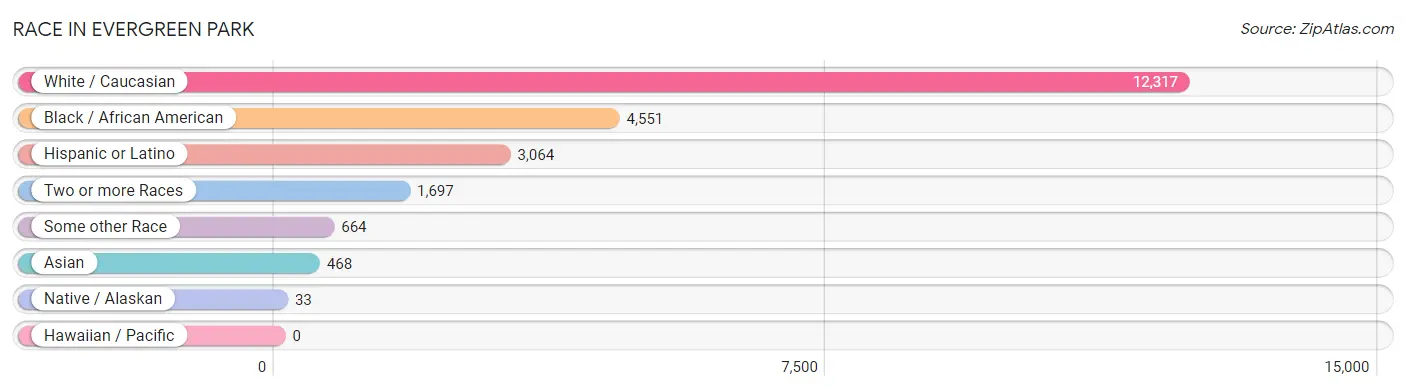
| Race | # Population | % Population |
| Asian | 468 | 2.4% |
| Black / African American | 4,551 | 23.1% |
| Hawaiian / Pacific | 0 | 0.0% |
| Hispanic or Latino | 3,064 | 15.5% |
| Native / Alaskan | 33 | 0.2% |
| White / Caucasian | 12,317 | 62.4% |
| Two or more Races | 1,697 | 8.6% |
| Some other Race | 664 | 3.4% |
| Total | 19,730 | 100.0% |
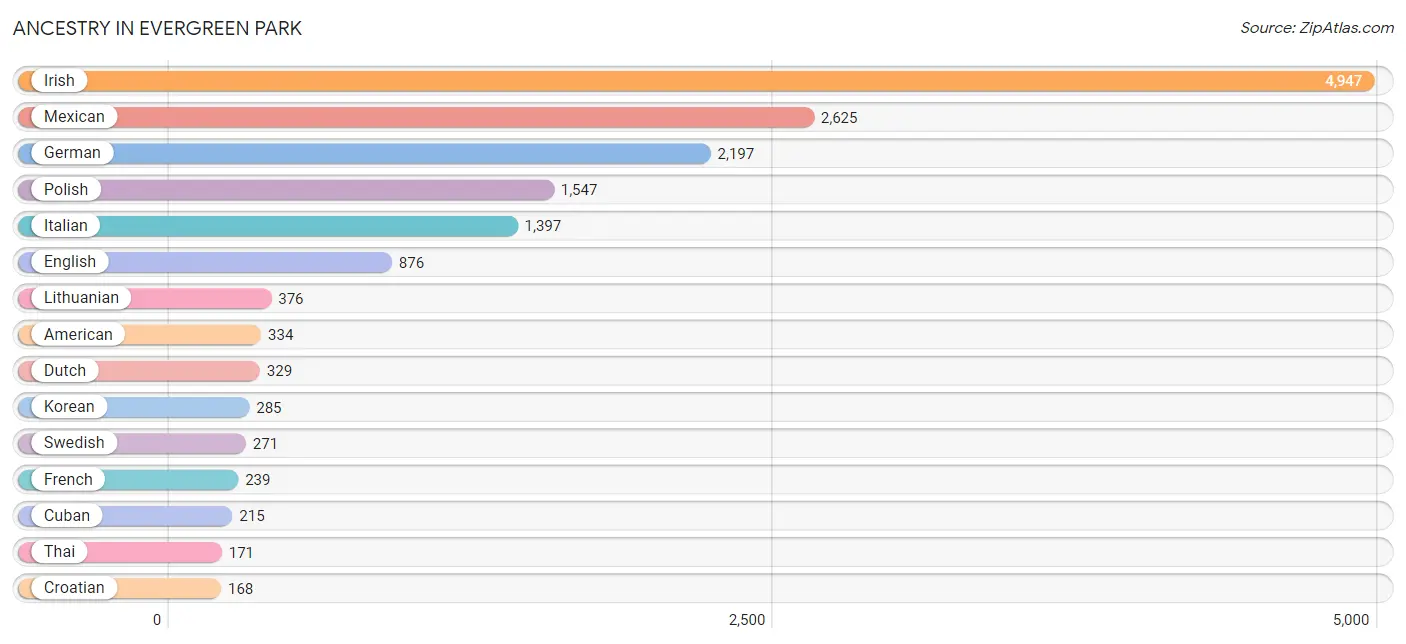
Ancestry in Evergreen Park
The most populous ancestries reported in Evergreen Park are Irish (4,947 | 25.1%), Mexican (2,625 | 13.3%), German (2,197 | 11.1%), Polish (1,547 | 7.8%), and Italian (1,397 | 7.1%), together accounting for 64.4% of all Evergreen Park residents.
| Ancestry | # Population | % Population |
| African | 70 | 0.4% |
| American | 334 | 1.7% |
| Arab | 15 | 0.1% |
| Armenian | 23 | 0.1% |
| Austrian | 13 | 0.1% |
| Belizean | 27 | 0.1% |
| Blackfeet | 7 | 0.0% |
| British | 7 | 0.0% |
| Burmese | 45 | 0.2% |
| Canadian | 6 | 0.0% |
| Central American | 8 | 0.0% |
| Chickasaw | 4 | 0.0% |
| Chippewa | 5 | 0.0% |
| Colombian | 121 | 0.6% |
| Croatian | 168 | 0.9% |
| Cuban | 215 | 1.1% |
| Czech | 105 | 0.5% |
| Czechoslovakian | 29 | 0.2% |
| Danish | 35 | 0.2% |
| Dutch | 329 | 1.7% |
| Eastern European | 43 | 0.2% |
| English | 876 | 4.4% |
| European | 137 | 0.7% |
| Finnish | 22 | 0.1% |
| French | 239 | 1.2% |
| French Canadian | 12 | 0.1% |
| German | 2,197 | 11.1% |
| Ghanaian | 18 | 0.1% |
| Greek | 73 | 0.4% |
| Hungarian | 114 | 0.6% |
| Indian (Asian) | 14 | 0.1% |
| Irish | 4,947 | 25.1% |
| Iroquois | 4 | 0.0% |
| Italian | 1,397 | 7.1% |
| Jordanian | 15 | 0.1% |
| Korean | 285 | 1.4% |
| Lithuanian | 376 | 1.9% |
| Luxembourger | 14 | 0.1% |
| Mexican | 2,625 | 13.3% |
| Mexican American Indian | 18 | 0.1% |
| Navajo | 10 | 0.1% |
| Nicaraguan | 8 | 0.0% |
| Nigerian | 15 | 0.1% |
| Norwegian | 114 | 0.6% |
| Peruvian | 27 | 0.1% |
| Polish | 1,547 | 7.8% |
| Puerto Rican | 60 | 0.3% |
| Russian | 93 | 0.5% |
| Scandinavian | 27 | 0.1% |
| Scotch-Irish | 5 | 0.0% |
| Scottish | 72 | 0.4% |
| Serbian | 105 | 0.5% |
| Slovak | 65 | 0.3% |
| South American | 148 | 0.7% |
| Subsaharan African | 103 | 0.5% |
| Swedish | 271 | 1.4% |
| Swiss | 82 | 0.4% |
| Thai | 171 | 0.9% |
| Ukrainian | 126 | 0.6% |
| Welsh | 47 | 0.2% | View All 60 Rows |
Immigrants in Evergreen Park
The most numerous immigrant groups reported in Evergreen Park came from Latin America (922 | 4.7%), Central America (814 | 4.1%), Mexico (790 | 4.0%), Europe (400 | 2.0%), and Asia (385 | 1.9%), together accounting for 16.8% of all Evergreen Park residents.
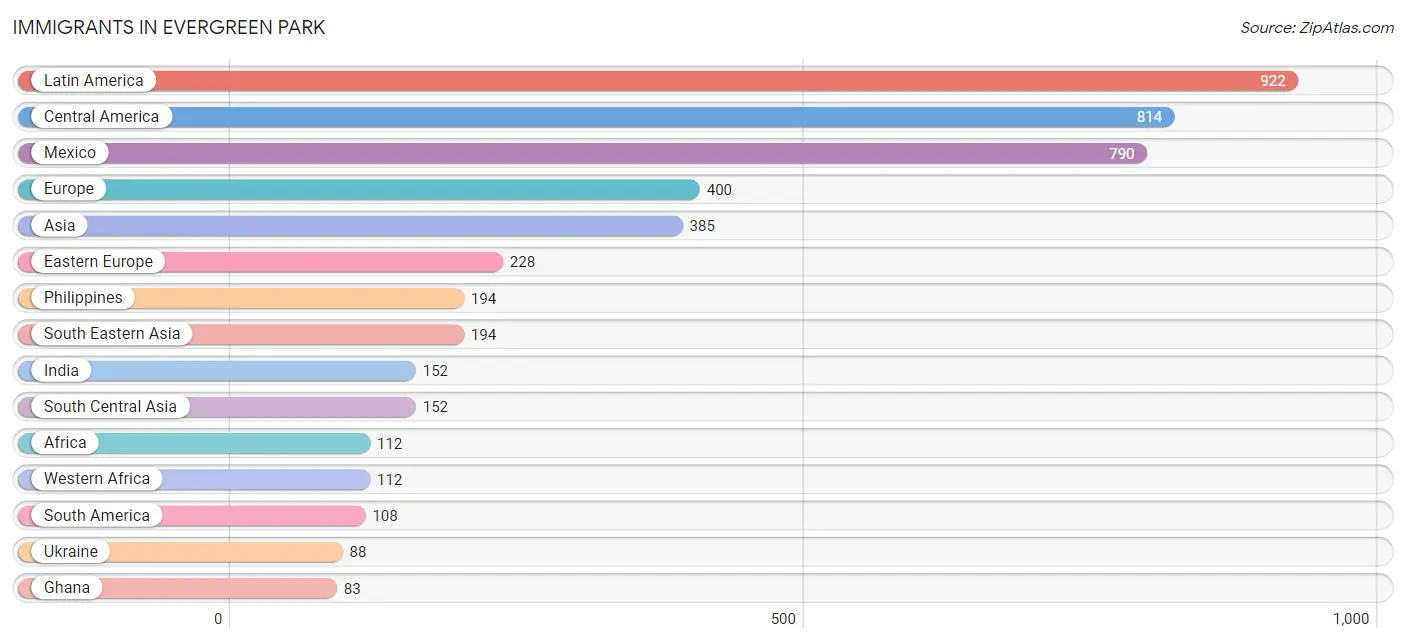
| Immigration Origin | # Population | % Population |
| Africa | 112 | 0.6% |
| Asia | 385 | 1.9% |
| Belize | 16 | 0.1% |
| Canada | 14 | 0.1% |
| Central America | 814 | 4.1% |
| China | 14 | 0.1% |
| Colombia | 81 | 0.4% |
| Croatia | 23 | 0.1% |
| Eastern Asia | 34 | 0.2% |
| Eastern Europe | 228 | 1.2% |
| England | 12 | 0.1% |
| Europe | 400 | 2.0% |
| Germany | 55 | 0.3% |
| Ghana | 83 | 0.4% |
| India | 152 | 0.8% |
| Ireland | 54 | 0.3% |
| Italy | 51 | 0.3% |
| Korea | 20 | 0.1% |
| Latin America | 922 | 4.7% |
| Lithuania | 50 | 0.3% |
| Mexico | 790 | 4.0% |
| Nicaragua | 8 | 0.0% |
| Nigeria | 29 | 0.2% |
| Northern Europe | 66 | 0.3% |
| Peru | 27 | 0.1% |
| Philippines | 194 | 1.0% |
| Poland | 67 | 0.3% |
| Saudi Arabia | 5 | 0.0% |
| South America | 108 | 0.5% |
| South Central Asia | 152 | 0.8% |
| South Eastern Asia | 194 | 1.0% |
| Southern Europe | 51 | 0.3% |
| Ukraine | 88 | 0.4% |
| Western Africa | 112 | 0.6% |
| Western Asia | 5 | 0.0% |
| Western Europe | 55 | 0.3% | View All 36 Rows |
Sex and Age in Evergreen Park
Sex and Age in Evergreen Park
The most populous age groups in Evergreen Park are Under 5 Years (1,002 | 10.6%) for men and 45 to 49 Years (956 | 9.3%) for women.
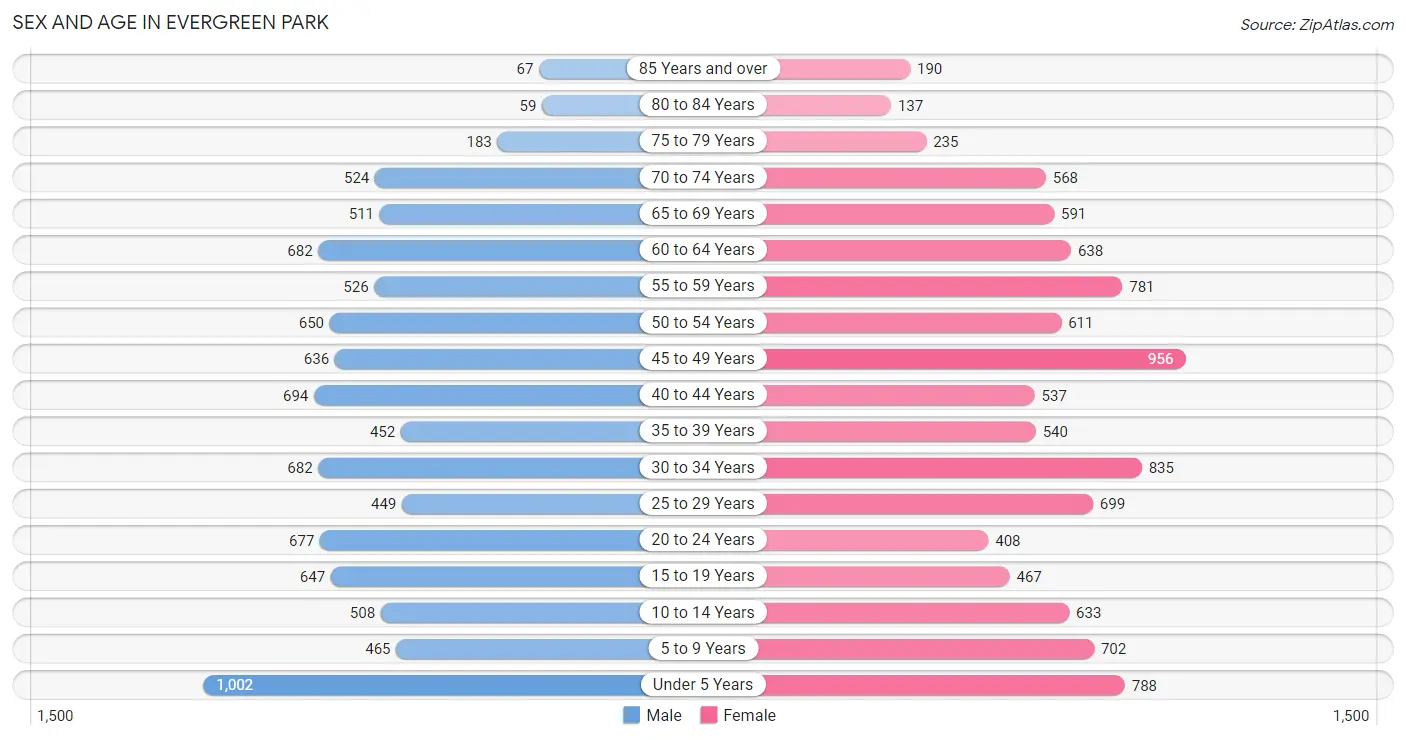
| Age Bracket | Male | Female |
| Under 5 Years | 1,002 (10.6%) | 788 (7.6%) |
| 5 to 9 Years | 465 (4.9%) | 702 (6.8%) |
| 10 to 14 Years | 508 (5.4%) | 633 (6.1%) |
| 15 to 19 Years | 647 (6.9%) | 467 (4.5%) |
| 20 to 24 Years | 677 (7.2%) | 408 (4.0%) |
| 25 to 29 Years | 449 (4.8%) | 699 (6.8%) |
| 30 to 34 Years | 682 (7.2%) | 835 (8.1%) |
| 35 to 39 Years | 452 (4.8%) | 540 (5.2%) |
| 40 to 44 Years | 694 (7.4%) | 537 (5.2%) |
| 45 to 49 Years | 636 (6.8%) | 956 (9.3%) |
| 50 to 54 Years | 650 (6.9%) | 611 (5.9%) |
| 55 to 59 Years | 526 (5.6%) | 781 (7.6%) |
| 60 to 64 Years | 682 (7.2%) | 638 (6.2%) |
| 65 to 69 Years | 511 (5.4%) | 591 (5.7%) |
| 70 to 74 Years | 524 (5.6%) | 568 (5.5%) |
| 75 to 79 Years | 183 (1.9%) | 235 (2.3%) |
| 80 to 84 Years | 59 (0.6%) | 137 (1.3%) |
| 85 Years and over | 67 (0.7%) | 190 (1.8%) |
| Total | 9,414 (100.0%) | 10,316 (100.0%) |
Families and Households in Evergreen Park
Median Family Size in Evergreen Park
The median family size in Evergreen Park is 3.30 persons per family, with married-couple families (3,684 | 73.3%) accounting for the largest median family size of 3.39 persons per family. On the other hand, single male/father families (368 | 7.3%) represent the smallest median family size with 2.97 persons per family.
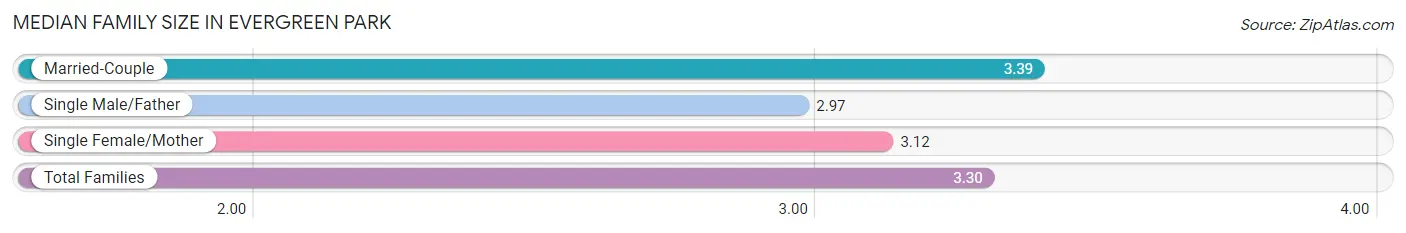
| Family Type | # Families | Family Size |
| Married-Couple | 3,684 (73.3%) | 3.39 |
| Single Male/Father | 368 (7.3%) | 2.97 |
| Single Female/Mother | 974 (19.4%) | 3.12 |
| Total Families | 5,026 (100.0%) | 3.30 |
Median Household Size in Evergreen Park
The median household size in Evergreen Park is 2.62 persons per household, with married-couple households (3,684 | 49.5%) accounting for the largest median household size of 3.4 persons per household. non-family households (2,423 | 32.5%) represent the smallest median household size with 1.09 persons per household.
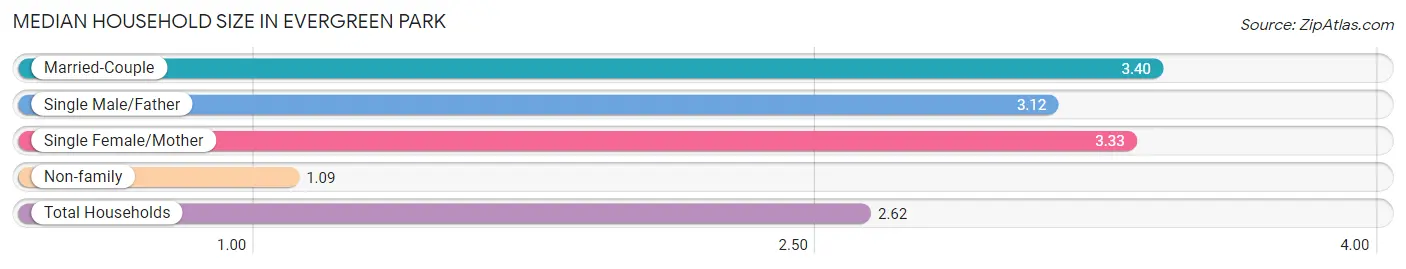
| Household Type | # Households | Household Size |
| Married-Couple | 3,684 (49.5%) | 3.40 |
| Single Male/Father | 368 (4.9%) | 3.12 |
| Single Female/Mother | 974 (13.1%) | 3.33 |
| Non-family | 2,423 (32.5%) | 1.09 |
| Total Households | 7,449 (100.0%) | 2.62 |
Household Size by Marriage Status in Evergreen Park
Out of a total of 7,449 households in Evergreen Park, 5,026 (67.5%) are family households, while 2,423 (32.5%) are nonfamily households. The most numerous type of family households are 2-person households, comprising 1,878, and the most common type of nonfamily households are 1-person households, comprising 2,222.
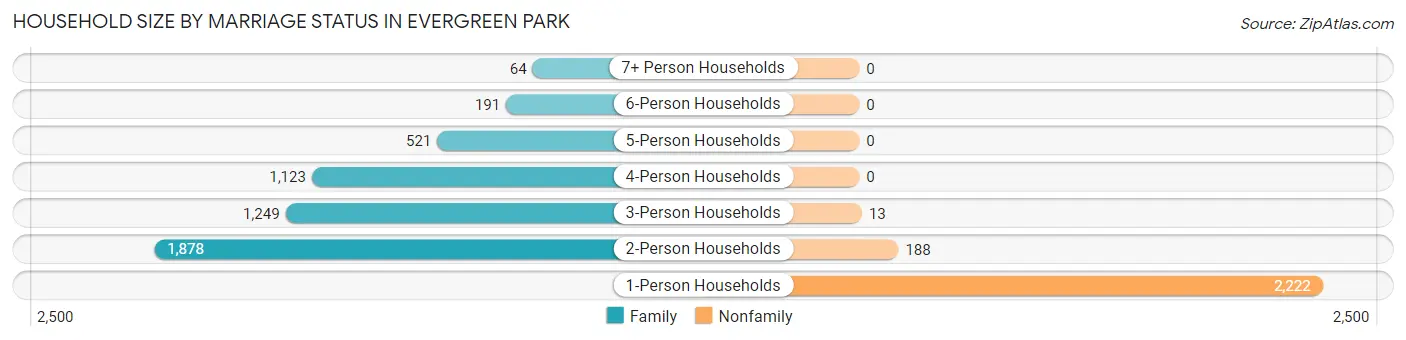
| Household Size | Family Households | Nonfamily Households |
| 1-Person Households | - | 2,222 (29.8%) |
| 2-Person Households | 1,878 (25.2%) | 188 (2.5%) |
| 3-Person Households | 1,249 (16.8%) | 13 (0.2%) |
| 4-Person Households | 1,123 (15.1%) | 0 (0.0%) |
| 5-Person Households | 521 (7.0%) | 0 (0.0%) |
| 6-Person Households | 191 (2.6%) | 0 (0.0%) |
| 7+ Person Households | 64 (0.9%) | 0 (0.0%) |
| Total | 5,026 (67.5%) | 2,423 (32.5%) |
Female Fertility in Evergreen Park
Fertility by Age in Evergreen Park
Average fertility rate in Evergreen Park is 120.0 births per 1,000 women. Women in the age bracket of 20 to 34 years have the highest fertility rate with 185.0 births per 1,000 women. Women in the age bracket of 20 to 34 years acount for 66.7% of all women with births.
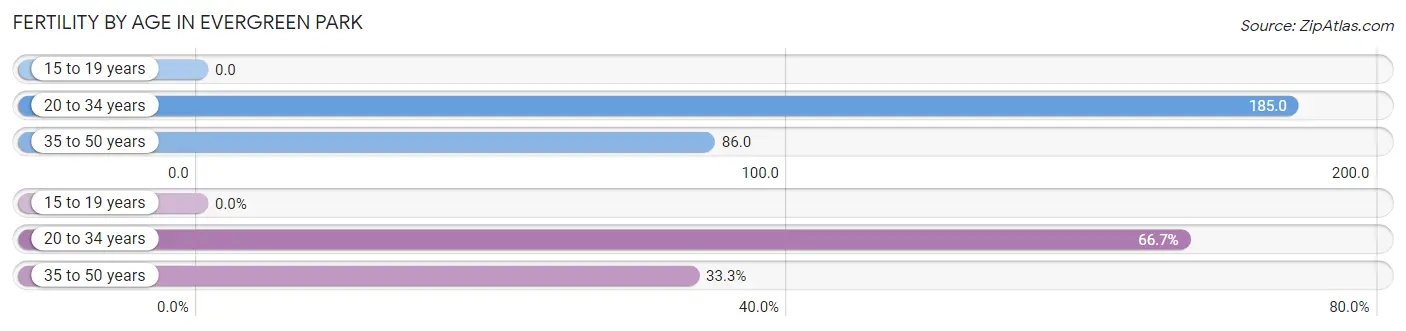
| Age Bracket | Women with Births | Births / 1,000 Women |
| 15 to 19 years | 0 (0.0%) | 0.0 |
| 20 to 34 years | 360 (66.7%) | 185.0 |
| 35 to 50 years | 180 (33.3%) | 86.0 |
| Total | 540 (100.0%) | 120.0 |
Fertility by Age by Marriage Status in Evergreen Park
75.4% of women with births (540) in Evergreen Park are married. The highest percentage of unmarried women with births falls into 20 to 34 years age bracket with 34.2% of them unmarried at the time of birth, while the lowest percentage of unmarried women with births belong to 35 to 50 years age bracket with 5.6% of them unmarried.
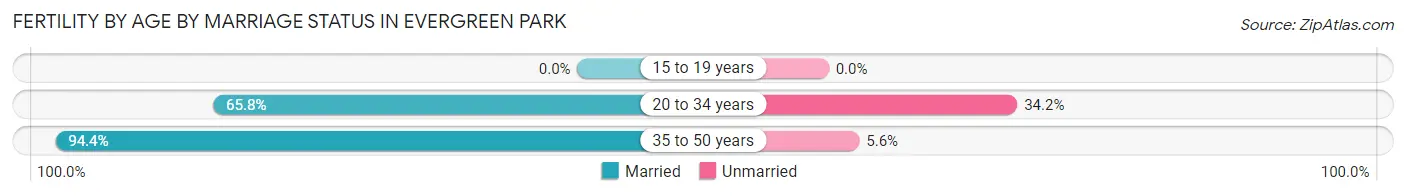
| Age Bracket | Married | Unmarried |
| 15 to 19 years | 0 (0.0%) | 0 (0.0%) |
| 20 to 34 years | 237 (65.8%) | 123 (34.2%) |
| 35 to 50 years | 170 (94.4%) | 10 (5.6%) |
| Total | 407 (75.4%) | 133 (24.6%) |
Fertility by Education in Evergreen Park
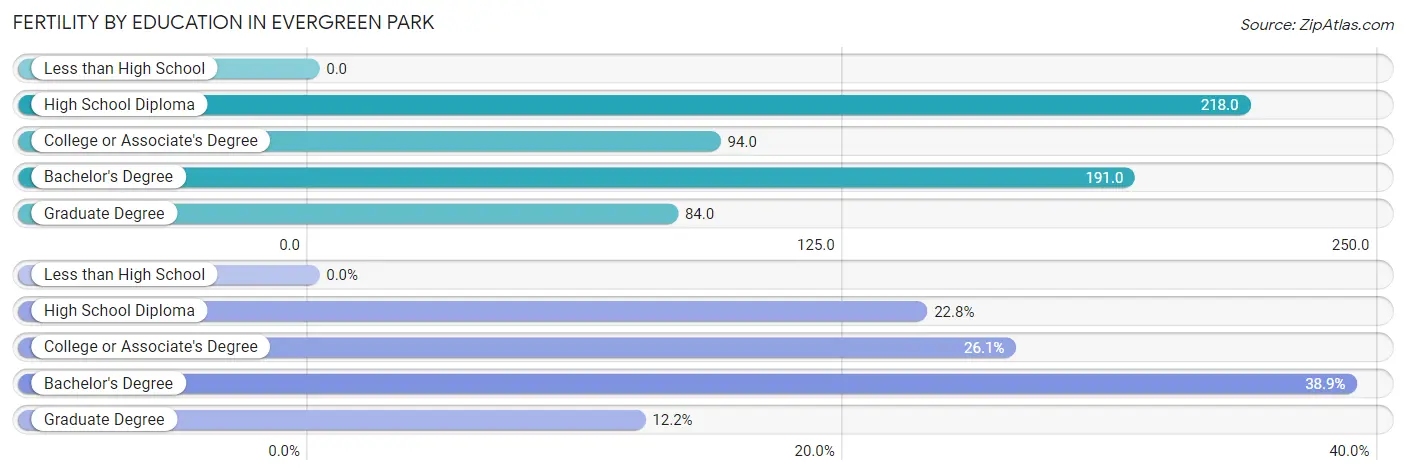
| Educational Attainment | Women with Births | Births / 1,000 Women |
| Less than High School | 0 (0.0%) | 0.0 |
| High School Diploma | 123 (22.8%) | 218.0 |
| College or Associate's Degree | 141 (26.1%) | 94.0 |
| Bachelor's Degree | 210 (38.9%) | 191.0 |
| Graduate Degree | 66 (12.2%) | 84.0 |
| Total | 540 (100.0%) | 120.0 |
Fertility by Education by Marriage Status in Evergreen Park
24.6% of women with births in Evergreen Park are unmarried. Women with the educational attainment of bachelor's degree are most likely to be married with 100.0% of them married at childbirth, while women with the educational attainment of high school diploma are least likely to be married with 64.2% of them unmarried at childbirth.
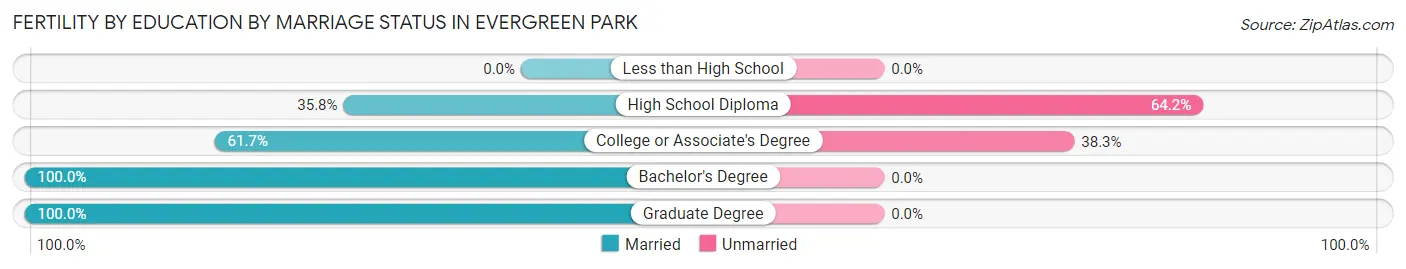
| Educational Attainment | Married | Unmarried |
| Less than High School | 0 (0.0%) | 0 (0.0%) |
| High School Diploma | 44 (35.8%) | 79 (64.2%) |
| College or Associate's Degree | 87 (61.7%) | 54 (38.3%) |
| Bachelor's Degree | 210 (100.0%) | 0 (0.0%) |
| Graduate Degree | 66 (100.0%) | 0 (0.0%) |
| Total | 407 (75.4%) | 133 (24.6%) |
Employment Characteristics in Evergreen Park
Employment by Class of Employer in Evergreen Park
Among the 9,675 employed individuals in Evergreen Park, private company employees (5,980 | 61.8%), not-for-profit organizations (1,427 | 14.7%), and local government employees (1,347 | 13.9%) make up the most common classes of employment.
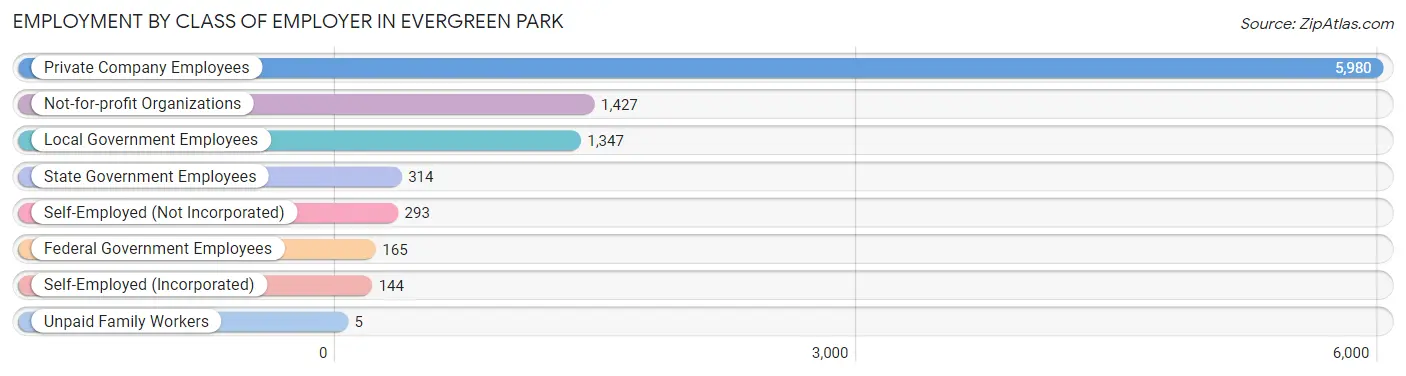
| Employer Class | # Employees | % Employees |
| Private Company Employees | 5,980 | 61.8% |
| Self-Employed (Incorporated) | 144 | 1.5% |
| Self-Employed (Not Incorporated) | 293 | 3.0% |
| Not-for-profit Organizations | 1,427 | 14.7% |
| Local Government Employees | 1,347 | 13.9% |
| State Government Employees | 314 | 3.3% |
| Federal Government Employees | 165 | 1.7% |
| Unpaid Family Workers | 5 | 0.1% |
| Total | 9,675 | 100.0% |
Employment Status by Age in Evergreen Park
According to the labor force statistics for Evergreen Park, out of the total population over 16 years of age (15,506), 66.5% or 10,311 individuals are in the labor force, with 3.8% or 392 of them unemployed. The age group with the highest labor force participation rate is 35 to 44 years, with 91.5% or 2,034 individuals in the labor force. Within the labor force, the 45 to 54 years age range has the highest percentage of unemployed individuals, with 6.5% or 150 of them being unemployed.
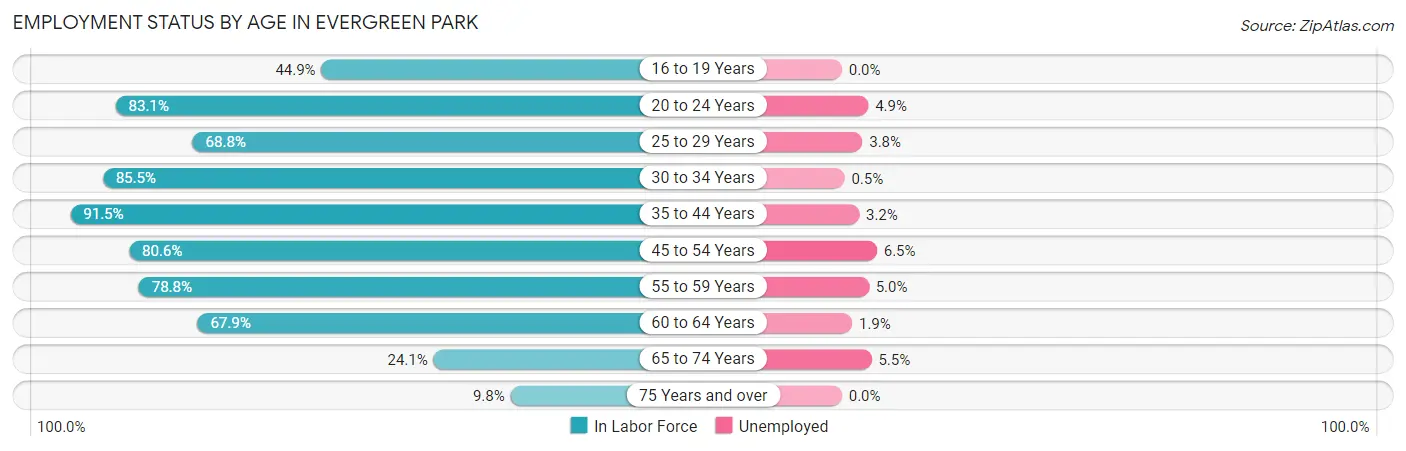
| Age Bracket | In Labor Force | Unemployed |
| 16 to 19 Years | 444 (44.9%) | 0 (0.0%) |
| 20 to 24 Years | 902 (83.1%) | 44 (4.9%) |
| 25 to 29 Years | 790 (68.8%) | 30 (3.8%) |
| 30 to 34 Years | 1,297 (85.5%) | 6 (0.5%) |
| 35 to 44 Years | 2,034 (91.5%) | 65 (3.2%) |
| 45 to 54 Years | 2,300 (80.6%) | 150 (6.5%) |
| 55 to 59 Years | 1,030 (78.8%) | 52 (5.0%) |
| 60 to 64 Years | 896 (67.9%) | 17 (1.9%) |
| 65 to 74 Years | 529 (24.1%) | 29 (5.5%) |
| 75 Years and over | 85 (9.8%) | 0 (0.0%) |
| Total | 10,311 (66.5%) | 392 (3.8%) |
Employment Status by Educational Attainment in Evergreen Park
According to labor force statistics for Evergreen Park, 80.5% of individuals (8,346) out of the total population between 25 and 64 years of age (10,368) are in the labor force, with 3.8% or 317 of them being unemployed. The group with the highest labor force participation rate are those with the educational attainment of bachelor's degree or higher, with 86.2% or 4,038 individuals in the labor force. Within the labor force, individuals with less than high school education have the highest percentage of unemployment, with 10.2% or 42 of them being unemployed.
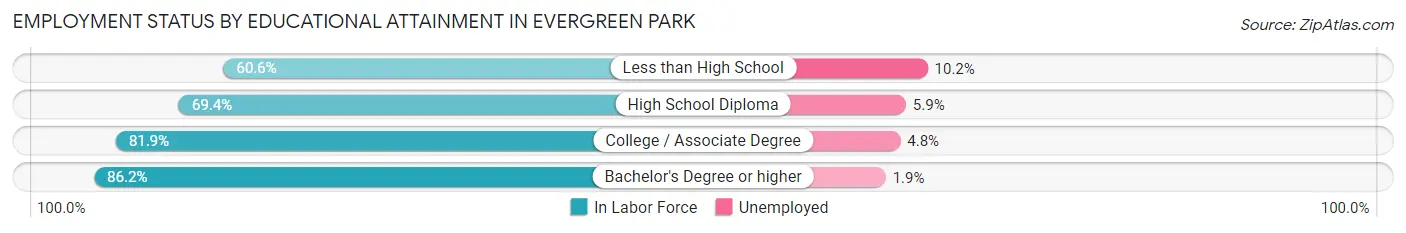
| Educational Attainment | In Labor Force | Unemployed |
| Less than High School | 411 (60.6%) | 69 (10.2%) |
| High School Diploma | 1,126 (69.4%) | 96 (5.9%) |
| College / Associate Degree | 2,770 (81.9%) | 162 (4.8%) |
| Bachelor's Degree or higher | 4,038 (86.2%) | 89 (1.9%) |
| Total | 8,346 (80.5%) | 394 (3.8%) |
Employment Occupations by Sex in Evergreen Park
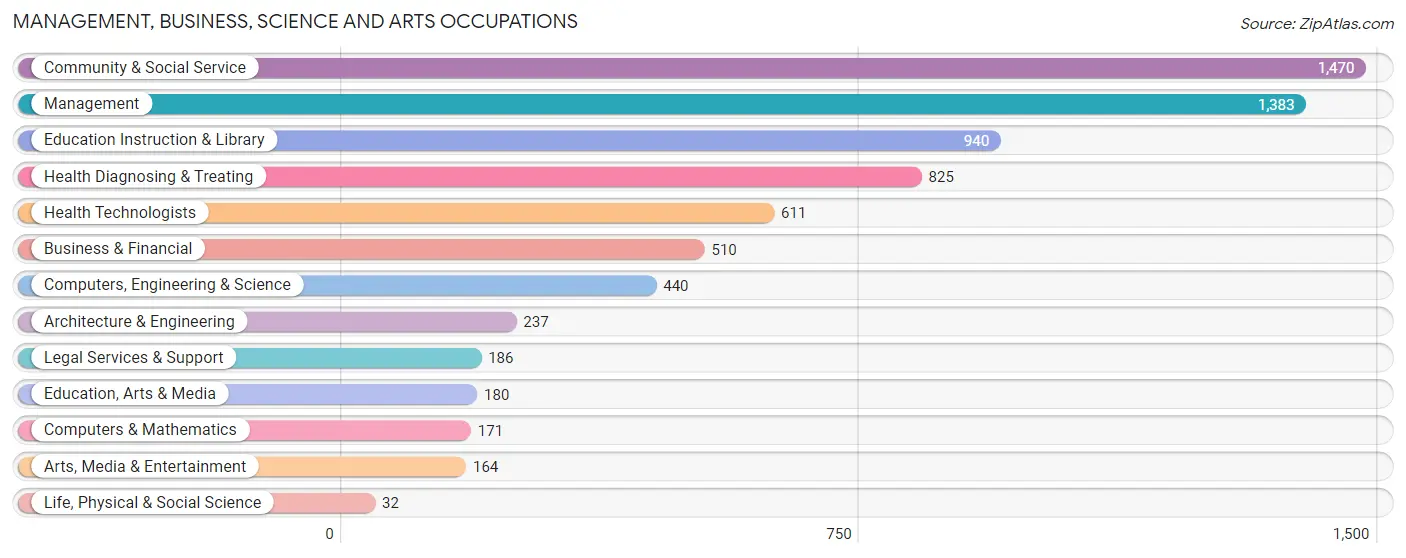
Management, Business, Science and Arts Occupations
The most common Management, Business, Science and Arts occupations in Evergreen Park are Community & Social Service (1,470 | 14.8%), Management (1,383 | 14.0%), Education Instruction & Library (940 | 9.5%), Health Diagnosing & Treating (825 | 8.3%), and Health Technologists (611 | 6.2%).
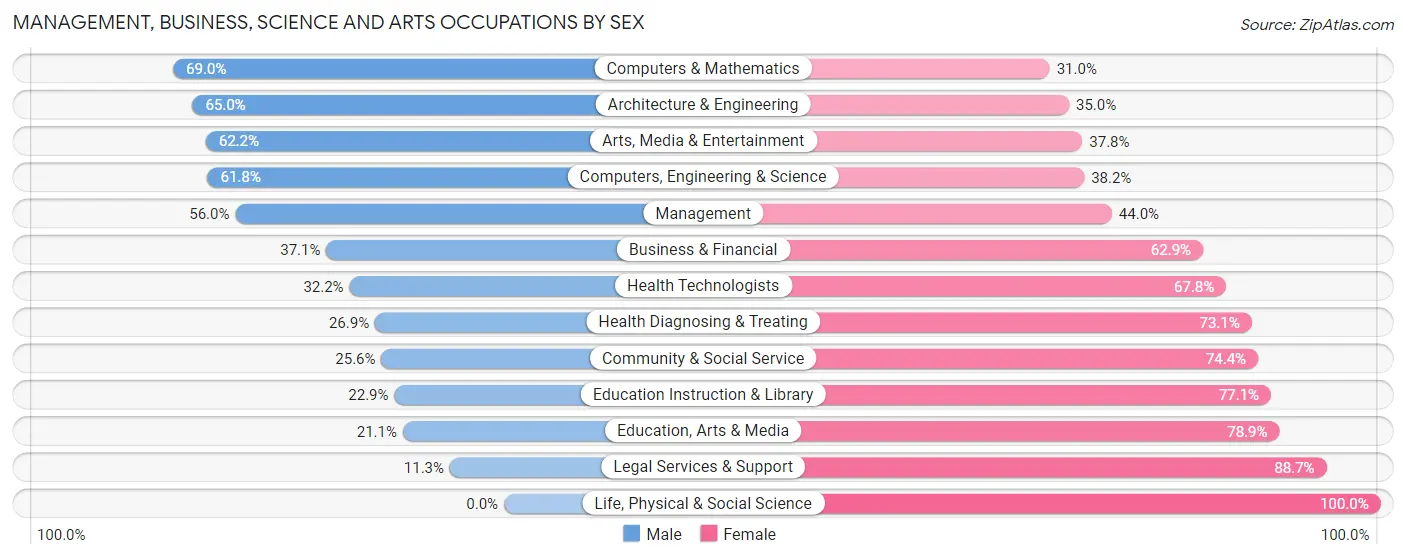
Management, Business, Science and Arts Occupations by Sex
Within the Management, Business, Science and Arts occupations in Evergreen Park, the most male-oriented occupations are Computers & Mathematics (69.0%), Architecture & Engineering (65.0%), and Arts, Media & Entertainment (62.2%), while the most female-oriented occupations are Life, Physical & Social Science (100.0%), Legal Services & Support (88.7%), and Education, Arts & Media (78.9%).
| Occupation | Male | Female |
| Management | 775 (56.0%) | 608 (44.0%) |
| Business & Financial | 189 (37.1%) | 321 (62.9%) |
| Computers, Engineering & Science | 272 (61.8%) | 168 (38.2%) |
| Computers & Mathematics | 118 (69.0%) | 53 (31.0%) |
| Architecture & Engineering | 154 (65.0%) | 83 (35.0%) |
| Life, Physical & Social Science | 0 (0.0%) | 32 (100.0%) |
| Community & Social Service | 376 (25.6%) | 1,094 (74.4%) |
| Education, Arts & Media | 38 (21.1%) | 142 (78.9%) |
| Legal Services & Support | 21 (11.3%) | 165 (88.7%) |
| Education Instruction & Library | 215 (22.9%) | 725 (77.1%) |
| Arts, Media & Entertainment | 102 (62.2%) | 62 (37.8%) |
| Health Diagnosing & Treating | 222 (26.9%) | 603 (73.1%) |
| Health Technologists | 197 (32.2%) | 414 (67.8%) |
| Total (Category) | 1,834 (39.6%) | 2,794 (60.4%) |
| Total (Overall) | 4,945 (49.9%) | 4,969 (50.1%) |
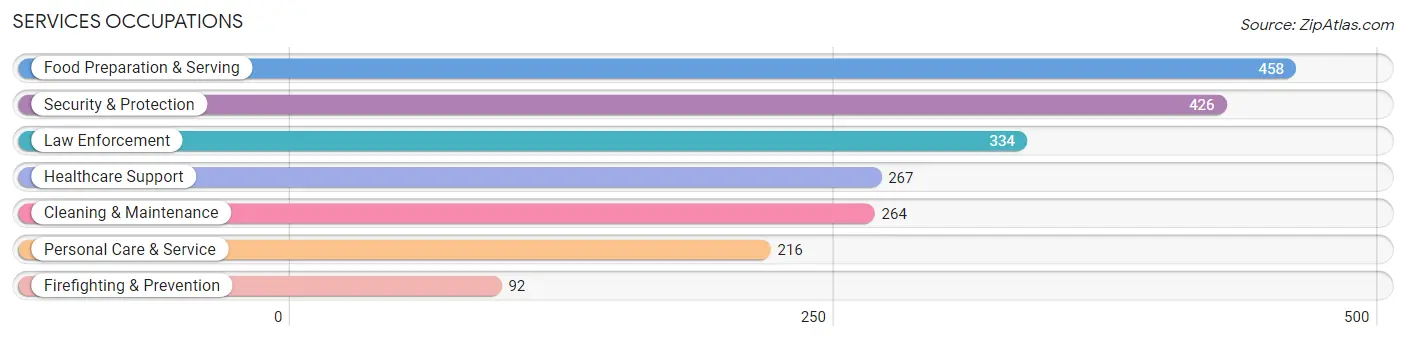
Services Occupations
The most common Services occupations in Evergreen Park are Food Preparation & Serving (458 | 4.6%), Security & Protection (426 | 4.3%), Law Enforcement (334 | 3.4%), Healthcare Support (267 | 2.7%), and Cleaning & Maintenance (264 | 2.7%).
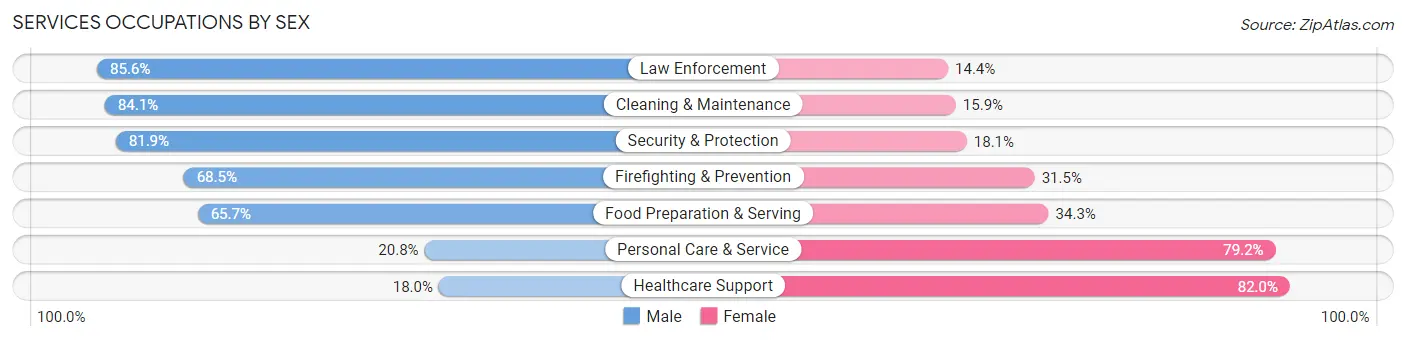
Services Occupations by Sex
Within the Services occupations in Evergreen Park, the most male-oriented occupations are Law Enforcement (85.6%), Cleaning & Maintenance (84.1%), and Security & Protection (81.9%), while the most female-oriented occupations are Healthcare Support (82.0%), Personal Care & Service (79.2%), and Food Preparation & Serving (34.3%).
| Occupation | Male | Female |
| Healthcare Support | 48 (18.0%) | 219 (82.0%) |
| Security & Protection | 349 (81.9%) | 77 (18.1%) |
| Firefighting & Prevention | 63 (68.5%) | 29 (31.5%) |
| Law Enforcement | 286 (85.6%) | 48 (14.4%) |
| Food Preparation & Serving | 301 (65.7%) | 157 (34.3%) |
| Cleaning & Maintenance | 222 (84.1%) | 42 (15.9%) |
| Personal Care & Service | 45 (20.8%) | 171 (79.2%) |
| Total (Category) | 965 (59.2%) | 666 (40.8%) |
| Total (Overall) | 4,945 (49.9%) | 4,969 (50.1%) |
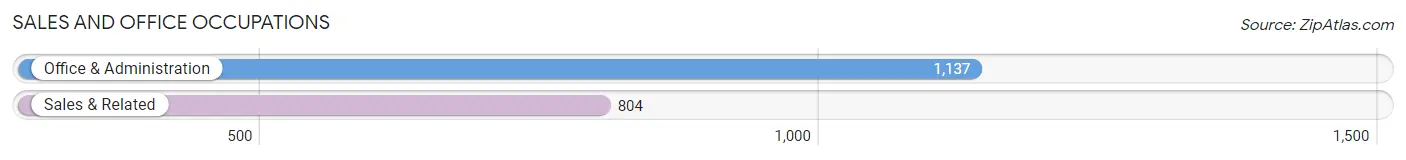
Sales and Office Occupations
The most common Sales and Office occupations in Evergreen Park are Office & Administration (1,137 | 11.5%), and Sales & Related (804 | 8.1%).
Sales and Office Occupations by Sex
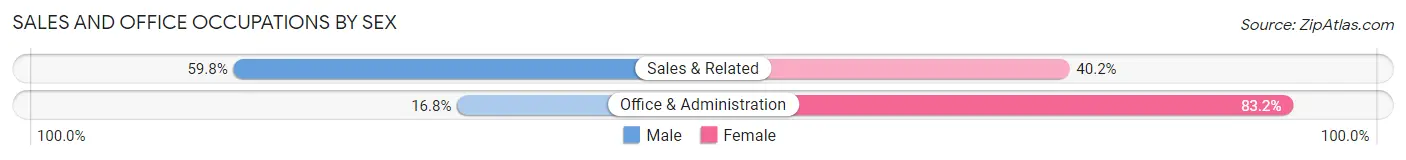
| Occupation | Male | Female |
| Sales & Related | 481 (59.8%) | 323 (40.2%) |
| Office & Administration | 191 (16.8%) | 946 (83.2%) |
| Total (Category) | 672 (34.6%) | 1,269 (65.4%) |
| Total (Overall) | 4,945 (49.9%) | 4,969 (50.1%) |
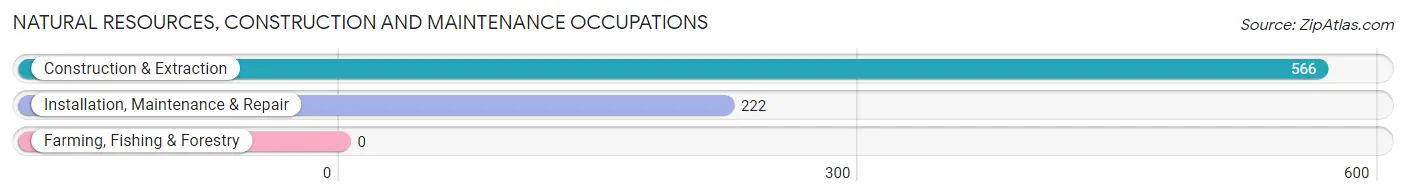
Natural Resources, Construction and Maintenance Occupations
The most common Natural Resources, Construction and Maintenance occupations in Evergreen Park are Construction & Extraction (566 | 5.7%), and Installation, Maintenance & Repair (222 | 2.2%).
Natural Resources, Construction and Maintenance Occupations by Sex
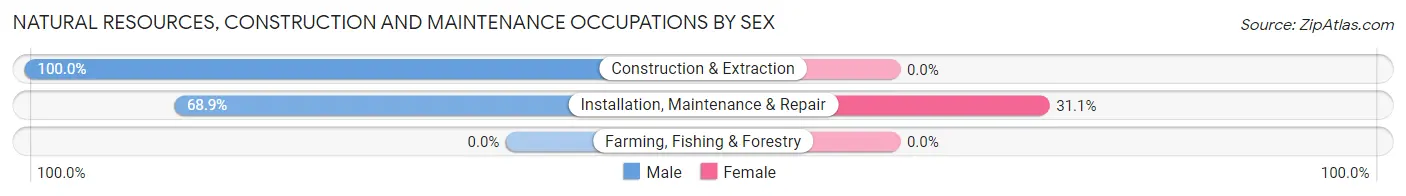
| Occupation | Male | Female |
| Farming, Fishing & Forestry | 0 (0.0%) | 0 (0.0%) |
| Construction & Extraction | 566 (100.0%) | 0 (0.0%) |
| Installation, Maintenance & Repair | 153 (68.9%) | 69 (31.1%) |
| Total (Category) | 719 (91.2%) | 69 (8.8%) |
| Total (Overall) | 4,945 (49.9%) | 4,969 (50.1%) |
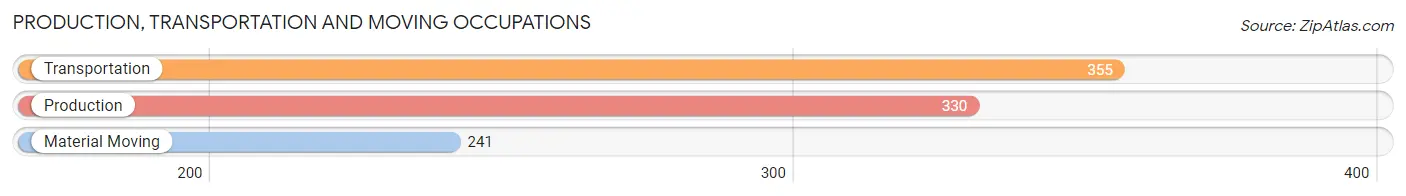
Production, Transportation and Moving Occupations
The most common Production, Transportation and Moving occupations in Evergreen Park are Transportation (355 | 3.6%), Production (330 | 3.3%), and Material Moving (241 | 2.4%).
Production, Transportation and Moving Occupations by Sex
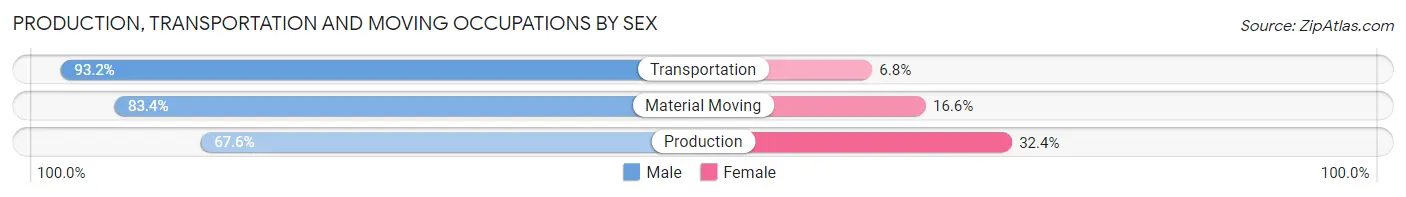
| Occupation | Male | Female |
| Production | 223 (67.6%) | 107 (32.4%) |
| Transportation | 331 (93.2%) | 24 (6.8%) |
| Material Moving | 201 (83.4%) | 40 (16.6%) |
| Total (Category) | 755 (81.5%) | 171 (18.5%) |
| Total (Overall) | 4,945 (49.9%) | 4,969 (50.1%) |
Employment Industries by Sex in Evergreen Park
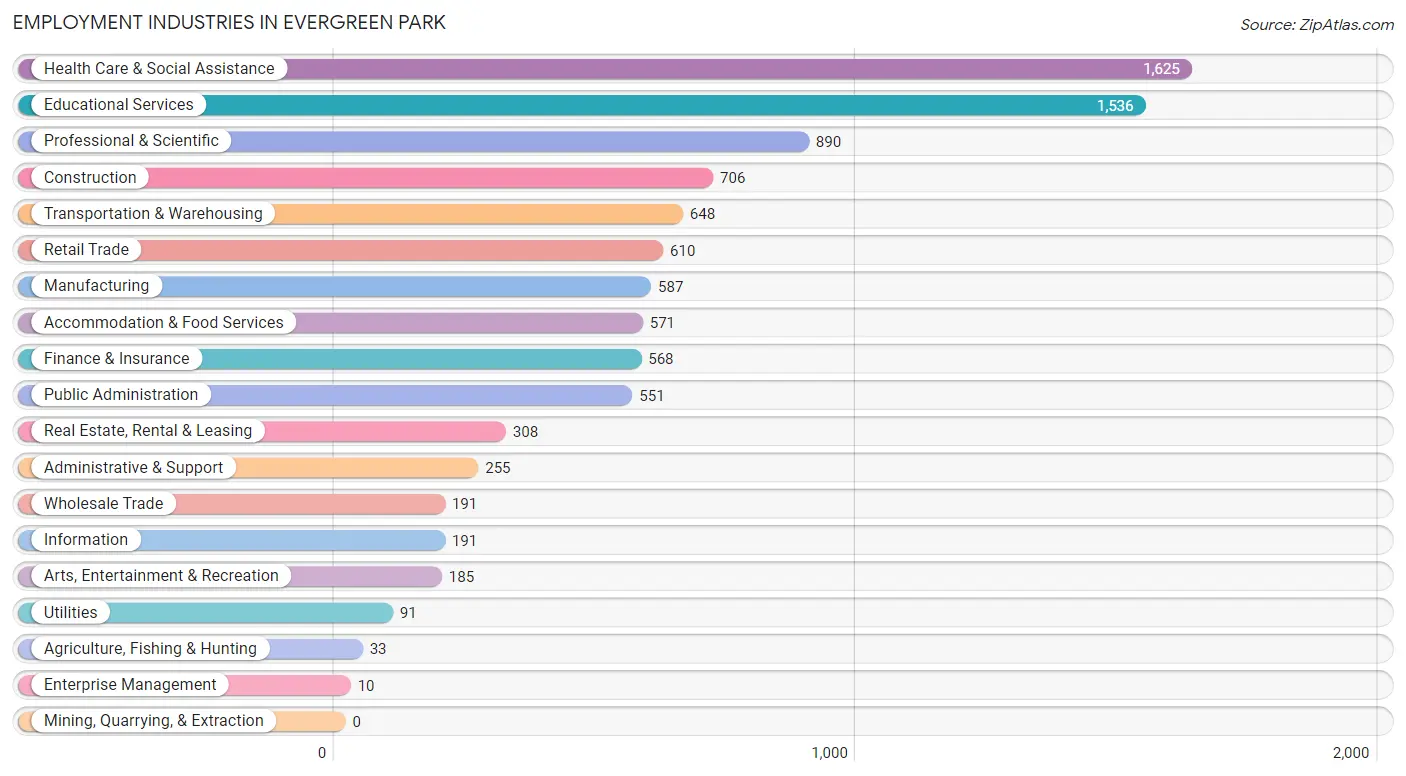
Employment Industries in Evergreen Park
The major employment industries in Evergreen Park include Health Care & Social Assistance (1,625 | 16.4%), Educational Services (1,536 | 15.5%), Professional & Scientific (890 | 9.0%), Construction (706 | 7.1%), and Transportation & Warehousing (648 | 6.5%).
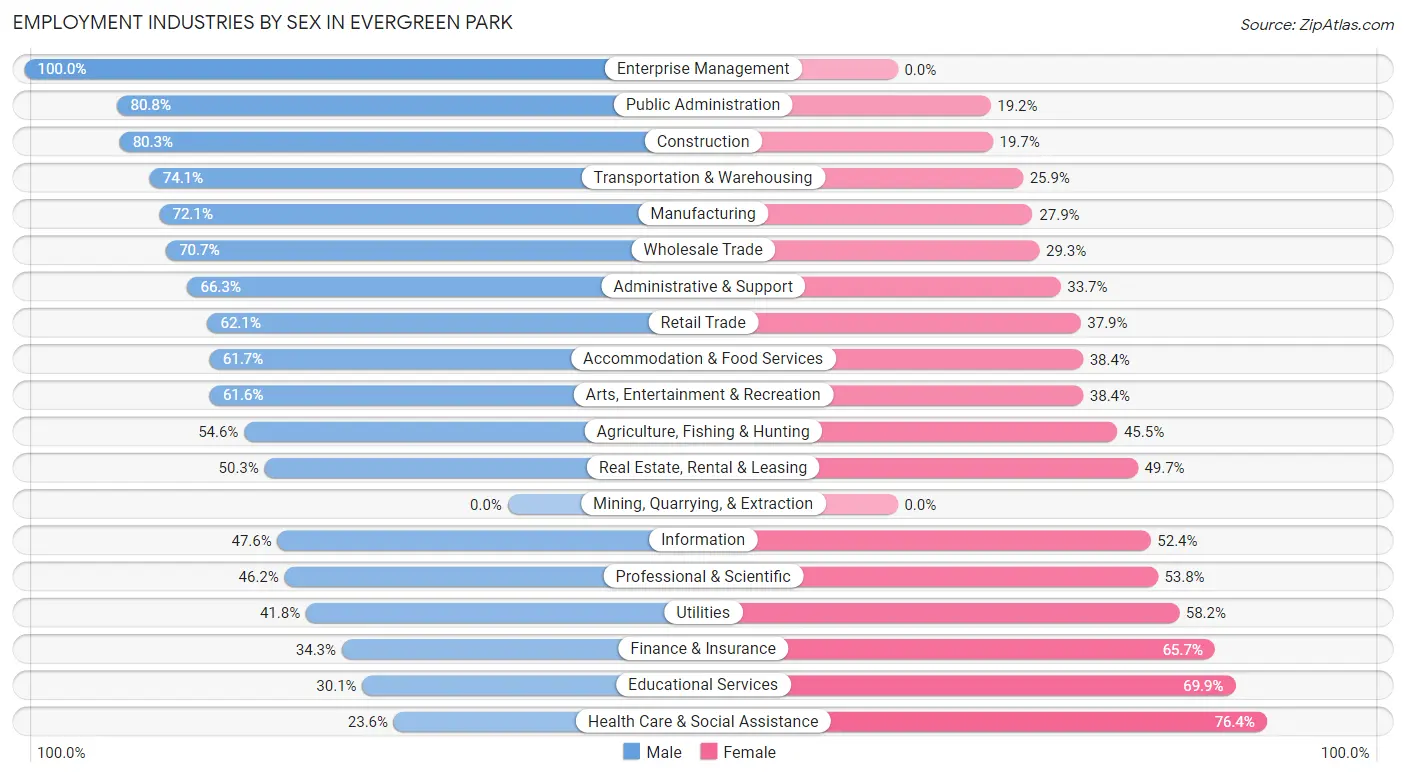
Employment Industries by Sex in Evergreen Park
The Evergreen Park industries that see more men than women are Enterprise Management (100.0%), Public Administration (80.8%), and Construction (80.3%), whereas the industries that tend to have a higher number of women are Health Care & Social Assistance (76.4%), Educational Services (69.9%), and Finance & Insurance (65.7%).
| Industry | Male | Female |
| Agriculture, Fishing & Hunting | 18 (54.5%) | 15 (45.5%) |
| Mining, Quarrying, & Extraction | 0 (0.0%) | 0 (0.0%) |
| Construction | 567 (80.3%) | 139 (19.7%) |
| Manufacturing | 423 (72.1%) | 164 (27.9%) |
| Wholesale Trade | 135 (70.7%) | 56 (29.3%) |
| Retail Trade | 379 (62.1%) | 231 (37.9%) |
| Transportation & Warehousing | 480 (74.1%) | 168 (25.9%) |
| Utilities | 38 (41.8%) | 53 (58.2%) |
| Information | 91 (47.6%) | 100 (52.4%) |
| Finance & Insurance | 195 (34.3%) | 373 (65.7%) |
| Real Estate, Rental & Leasing | 155 (50.3%) | 153 (49.7%) |
| Professional & Scientific | 411 (46.2%) | 479 (53.8%) |
| Enterprise Management | 10 (100.0%) | 0 (0.0%) |
| Administrative & Support | 169 (66.3%) | 86 (33.7%) |
| Educational Services | 462 (30.1%) | 1,074 (69.9%) |
| Health Care & Social Assistance | 383 (23.6%) | 1,242 (76.4%) |
| Arts, Entertainment & Recreation | 114 (61.6%) | 71 (38.4%) |
| Accommodation & Food Services | 352 (61.7%) | 219 (38.4%) |
| Public Administration | 445 (80.8%) | 106 (19.2%) |
| Total | 4,945 (49.9%) | 4,969 (50.1%) |
Education in Evergreen Park
School Enrollment in Evergreen Park
The most common levels of schooling among the 4,541 students in Evergreen Park are high school (991 | 21.8%), elementary school (925 | 20.4%), and middle school (912 | 20.1%).
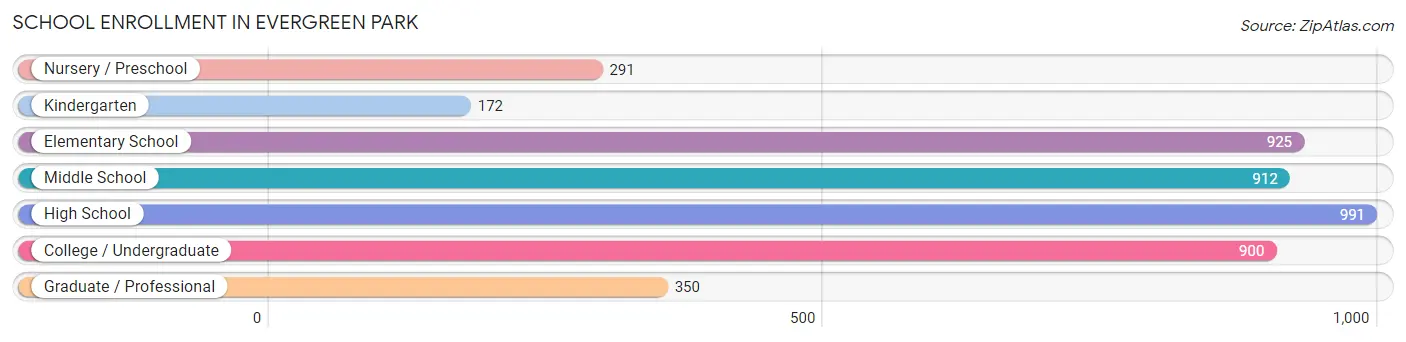
| School Level | # Students | % Students |
| Nursery / Preschool | 291 | 6.4% |
| Kindergarten | 172 | 3.8% |
| Elementary School | 925 | 20.4% |
| Middle School | 912 | 20.1% |
| High School | 991 | 21.8% |
| College / Undergraduate | 900 | 19.8% |
| Graduate / Professional | 350 | 7.7% |
| Total | 4,541 | 100.0% |
School Enrollment by Age by Funding Source in Evergreen Park
Out of a total of 4,541 students who are enrolled in schools in Evergreen Park, 1,226 (27.0%) attend a private institution, while the remaining 3,315 (73.0%) are enrolled in public schools. The age group of 25 to 34 year olds has the highest likelihood of being enrolled in private schools, with 240 (70.8% in the age bracket) enrolled. Conversely, the age group of 15 to 17 year olds has the lowest likelihood of being enrolled in a private school, with 611 (79.7% in the age bracket) attending a public institution.
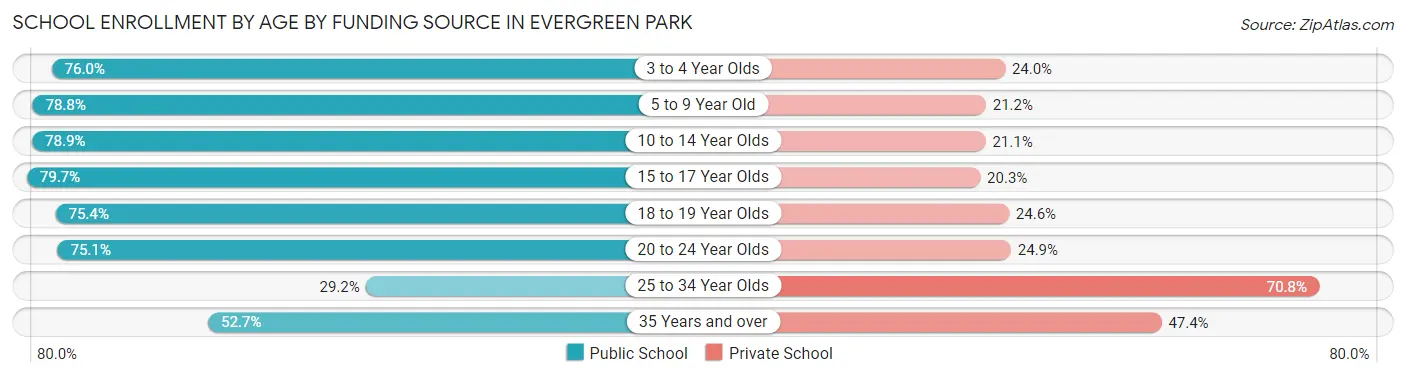
| Age Bracket | Public School | Private School |
| 3 to 4 Year Olds | 117 (76.0%) | 37 (24.0%) |
| 5 to 9 Year Old | 908 (78.8%) | 244 (21.2%) |
| 10 to 14 Year Olds | 877 (78.9%) | 235 (21.1%) |
| 15 to 17 Year Olds | 611 (79.7%) | 156 (20.3%) |
| 18 to 19 Year Olds | 147 (75.4%) | 48 (24.6%) |
| 20 to 24 Year Olds | 419 (75.1%) | 139 (24.9%) |
| 25 to 34 Year Olds | 99 (29.2%) | 240 (70.8%) |
| 35 Years and over | 139 (52.6%) | 125 (47.3%) |
| Total | 3,315 (73.0%) | 1,226 (27.0%) |
Educational Attainment by Field of Study in Evergreen Park
Business (1,267 | 21.0%), education (864 | 14.3%), science & technology (710 | 11.7%), arts & humanities (569 | 9.4%), and social sciences (513 | 8.5%) are the most common fields of study among 6,040 individuals in Evergreen Park who have obtained a bachelor's degree or higher.
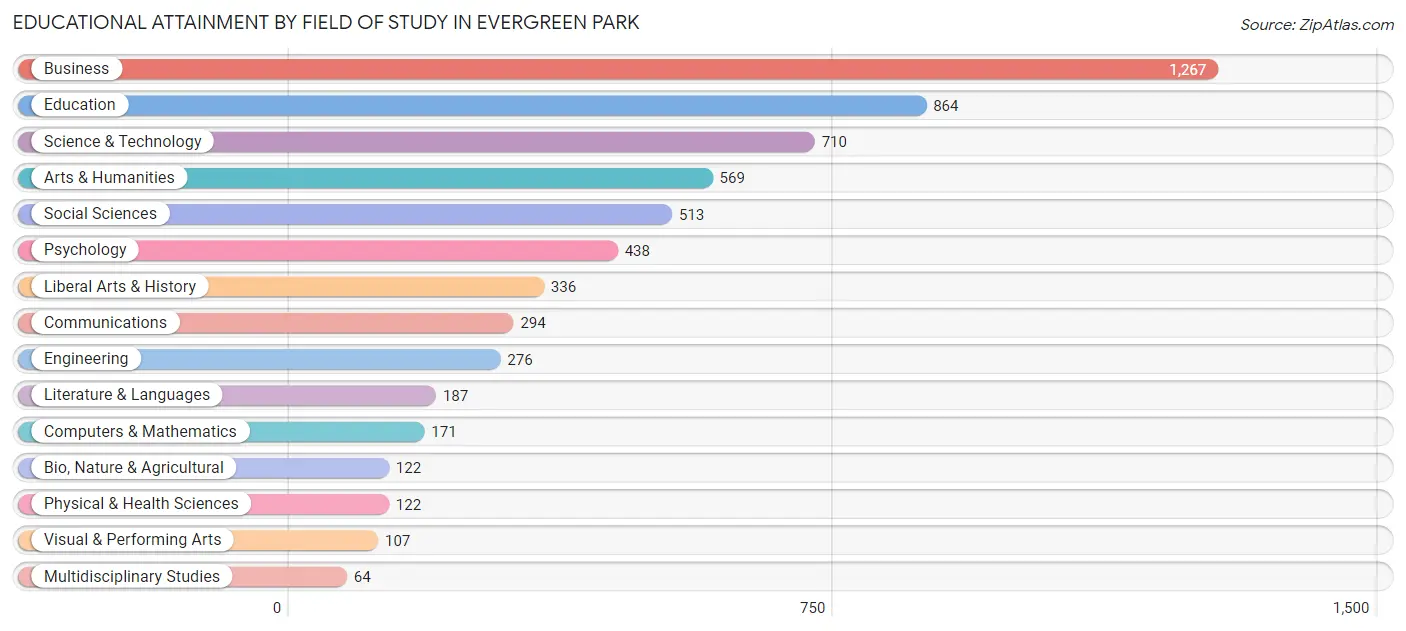
| Field of Study | # Graduates | % Graduates |
| Computers & Mathematics | 171 | 2.8% |
| Bio, Nature & Agricultural | 122 | 2.0% |
| Physical & Health Sciences | 122 | 2.0% |
| Psychology | 438 | 7.2% |
| Social Sciences | 513 | 8.5% |
| Engineering | 276 | 4.6% |
| Multidisciplinary Studies | 64 | 1.1% |
| Science & Technology | 710 | 11.7% |
| Business | 1,267 | 21.0% |
| Education | 864 | 14.3% |
| Literature & Languages | 187 | 3.1% |
| Liberal Arts & History | 336 | 5.6% |
| Visual & Performing Arts | 107 | 1.8% |
| Communications | 294 | 4.9% |
| Arts & Humanities | 569 | 9.4% |
| Total | 6,040 | 100.0% |
Transportation & Commute in Evergreen Park
Vehicle Availability by Sex in Evergreen Park
The most prevalent vehicle ownership categories in Evergreen Park are males with 2 vehicles (2,544, accounting for 52.2%) and females with 2 vehicles (2,113, making up 53.0%).
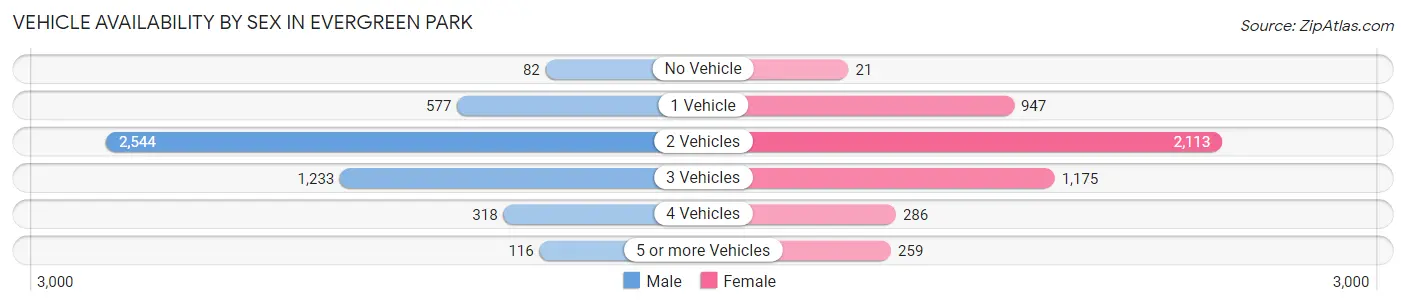
| Vehicles Available | Male | Female |
| No Vehicle | 82 (1.7%) | 21 (0.4%) |
| 1 Vehicle | 577 (11.8%) | 947 (19.7%) |
| 2 Vehicles | 2,544 (52.2%) | 2,113 (44.0%) |
| 3 Vehicles | 1,233 (25.3%) | 1,175 (24.5%) |
| 4 Vehicles | 318 (6.5%) | 286 (6.0%) |
| 5 or more Vehicles | 116 (2.4%) | 259 (5.4%) |
| Total | 4,870 (100.0%) | 4,801 (100.0%) |
Commute Time in Evergreen Park
The most frequently occuring commute durations in Evergreen Park are 45 to 59 minutes (1,288 commuters, 15.0%), 30 to 34 minutes (1,129 commuters, 13.1%), and 10 to 14 minutes (997 commuters, 11.6%).
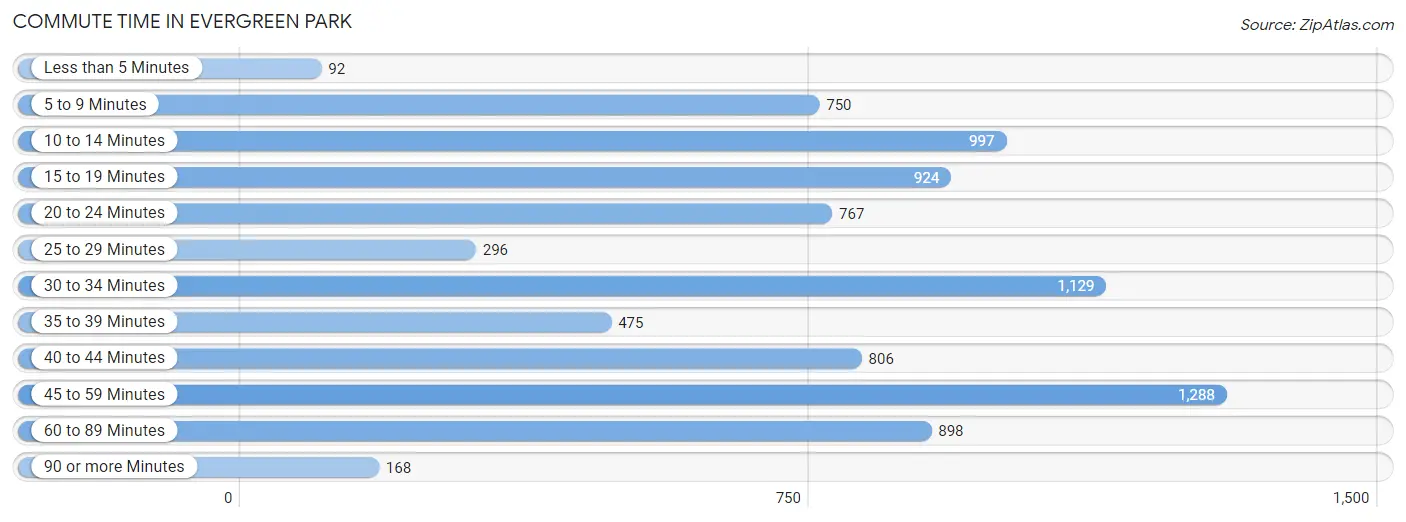
| Commute Time | # Commuters | % Commuters |
| Less than 5 Minutes | 92 | 1.1% |
| 5 to 9 Minutes | 750 | 8.7% |
| 10 to 14 Minutes | 997 | 11.6% |
| 15 to 19 Minutes | 924 | 10.8% |
| 20 to 24 Minutes | 767 | 8.9% |
| 25 to 29 Minutes | 296 | 3.5% |
| 30 to 34 Minutes | 1,129 | 13.1% |
| 35 to 39 Minutes | 475 | 5.5% |
| 40 to 44 Minutes | 806 | 9.4% |
| 45 to 59 Minutes | 1,288 | 15.0% |
| 60 to 89 Minutes | 898 | 10.4% |
| 90 or more Minutes | 168 | 2.0% |
Commute Time by Sex in Evergreen Park
The most common commute times in Evergreen Park are 30 to 34 minutes (714 commuters, 16.0%) for males and 15 to 19 minutes (657 commuters, 15.9%) for females.
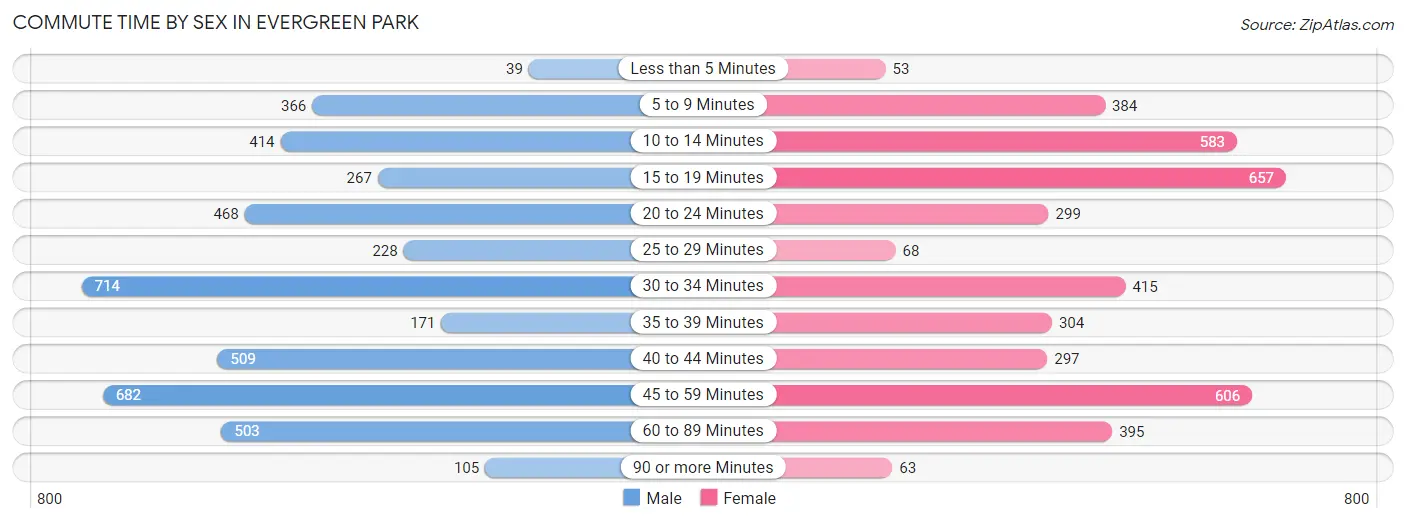
| Commute Time | Male | Female |
| Less than 5 Minutes | 39 (0.9%) | 53 (1.3%) |
| 5 to 9 Minutes | 366 (8.2%) | 384 (9.3%) |
| 10 to 14 Minutes | 414 (9.3%) | 583 (14.1%) |
| 15 to 19 Minutes | 267 (6.0%) | 657 (15.9%) |
| 20 to 24 Minutes | 468 (10.5%) | 299 (7.2%) |
| 25 to 29 Minutes | 228 (5.1%) | 68 (1.7%) |
| 30 to 34 Minutes | 714 (16.0%) | 415 (10.1%) |
| 35 to 39 Minutes | 171 (3.8%) | 304 (7.4%) |
| 40 to 44 Minutes | 509 (11.4%) | 297 (7.2%) |
| 45 to 59 Minutes | 682 (15.3%) | 606 (14.7%) |
| 60 to 89 Minutes | 503 (11.3%) | 395 (9.6%) |
| 90 or more Minutes | 105 (2.4%) | 63 (1.5%) |
Time of Departure to Work by Sex in Evergreen Park
The most frequent times of departure to work in Evergreen Park are 6:00 AM to 6:29 AM (708, 15.9%) for males and 7:00 AM to 7:29 AM (734, 17.8%) for females.
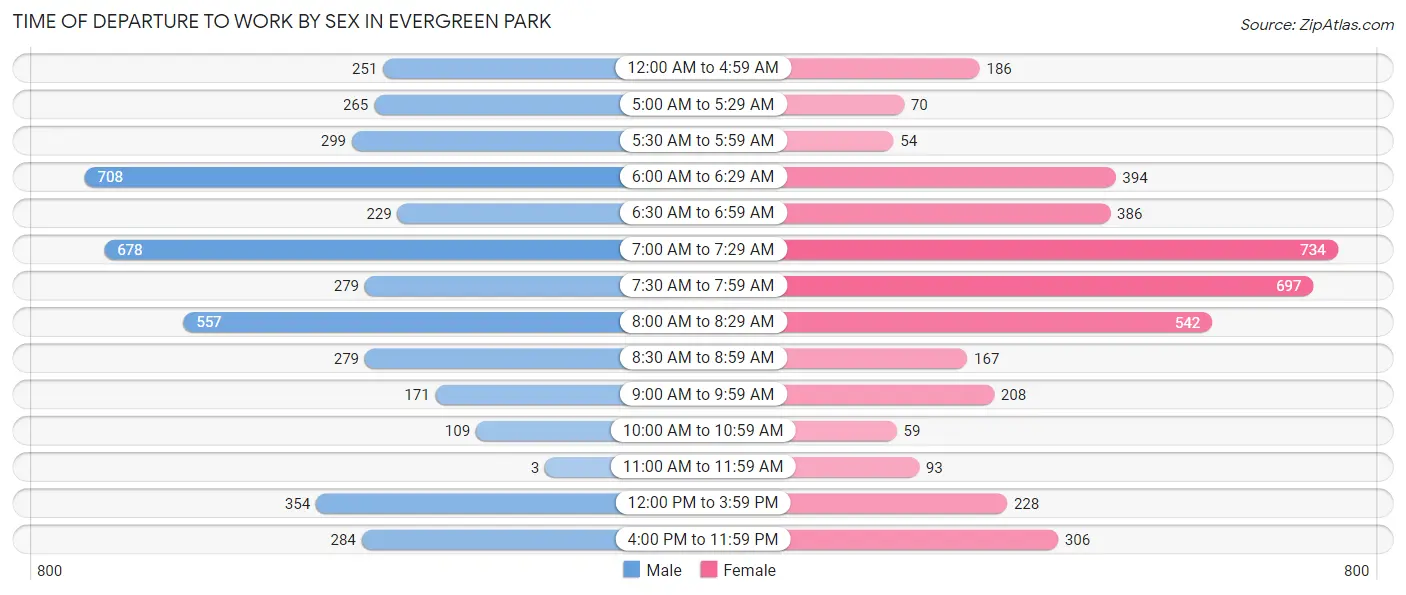
| Time of Departure | Male | Female |
| 12:00 AM to 4:59 AM | 251 (5.6%) | 186 (4.5%) |
| 5:00 AM to 5:29 AM | 265 (5.9%) | 70 (1.7%) |
| 5:30 AM to 5:59 AM | 299 (6.7%) | 54 (1.3%) |
| 6:00 AM to 6:29 AM | 708 (15.9%) | 394 (9.6%) |
| 6:30 AM to 6:59 AM | 229 (5.1%) | 386 (9.4%) |
| 7:00 AM to 7:29 AM | 678 (15.2%) | 734 (17.8%) |
| 7:30 AM to 7:59 AM | 279 (6.2%) | 697 (16.9%) |
| 8:00 AM to 8:29 AM | 557 (12.5%) | 542 (13.1%) |
| 8:30 AM to 8:59 AM | 279 (6.2%) | 167 (4.1%) |
| 9:00 AM to 9:59 AM | 171 (3.8%) | 208 (5.0%) |
| 10:00 AM to 10:59 AM | 109 (2.4%) | 59 (1.4%) |
| 11:00 AM to 11:59 AM | 3 (0.1%) | 93 (2.3%) |
| 12:00 PM to 3:59 PM | 354 (7.9%) | 228 (5.5%) |
| 4:00 PM to 11:59 PM | 284 (6.4%) | 306 (7.4%) |
| Total | 4,466 (100.0%) | 4,124 (100.0%) |
Housing Occupancy in Evergreen Park
Occupancy by Ownership in Evergreen Park
Of the total 7,449 dwellings in Evergreen Park, owner-occupied units account for 6,214 (83.4%), while renter-occupied units make up 1,235 (16.6%).
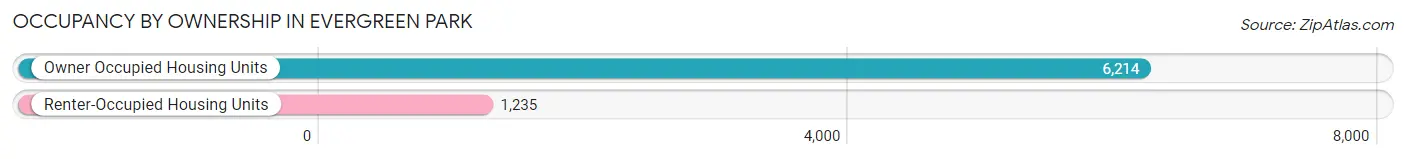
| Occupancy | # Housing Units | % Housing Units |
| Owner Occupied Housing Units | 6,214 | 83.4% |
| Renter-Occupied Housing Units | 1,235 | 16.6% |
| Total Occupied Housing Units | 7,449 | 100.0% |
Occupancy by Household Size in Evergreen Park
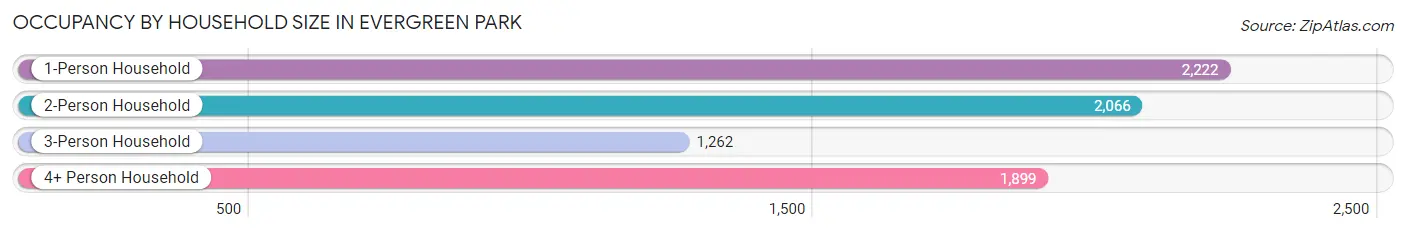
| Household Size | # Housing Units | % Housing Units |
| 1-Person Household | 2,222 | 29.8% |
| 2-Person Household | 2,066 | 27.7% |
| 3-Person Household | 1,262 | 16.9% |
| 4+ Person Household | 1,899 | 25.5% |
| Total Housing Units | 7,449 | 100.0% |
Occupancy by Ownership by Household Size in Evergreen Park
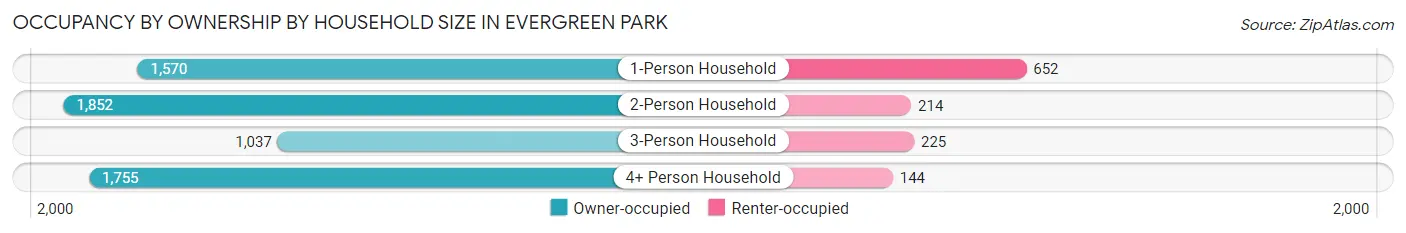
| Household Size | Owner-occupied | Renter-occupied |
| 1-Person Household | 1,570 (70.7%) | 652 (29.3%) |
| 2-Person Household | 1,852 (89.6%) | 214 (10.4%) |
| 3-Person Household | 1,037 (82.2%) | 225 (17.8%) |
| 4+ Person Household | 1,755 (92.4%) | 144 (7.6%) |
| Total Housing Units | 6,214 (83.4%) | 1,235 (16.6%) |
Occupancy by Educational Attainment in Evergreen Park
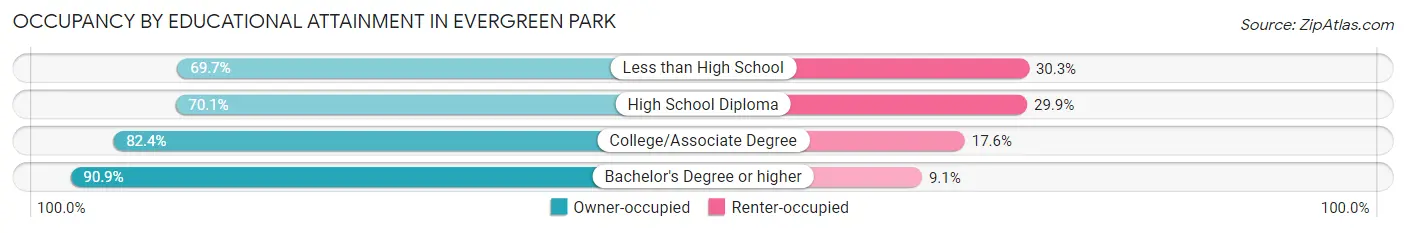
| Household Size | Owner-occupied | Renter-occupied |
| Less than High School | 313 (69.7%) | 136 (30.3%) |
| High School Diploma | 893 (70.1%) | 381 (29.9%) |
| College/Associate Degree | 1,923 (82.4%) | 410 (17.6%) |
| Bachelor's Degree or higher | 3,085 (90.9%) | 308 (9.1%) |
Occupancy by Age of Householder in Evergreen Park
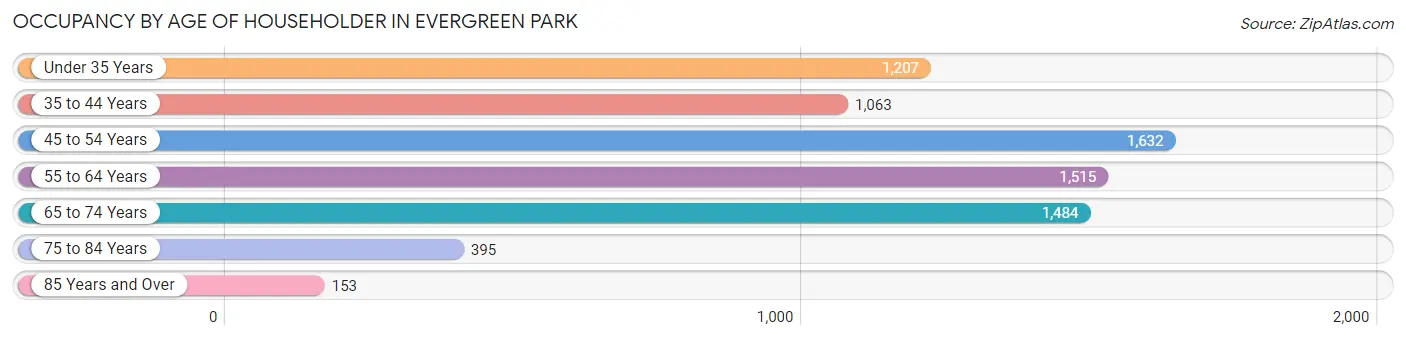
| Age Bracket | # Households | % Households |
| Under 35 Years | 1,207 | 16.2% |
| 35 to 44 Years | 1,063 | 14.3% |
| 45 to 54 Years | 1,632 | 21.9% |
| 55 to 64 Years | 1,515 | 20.3% |
| 65 to 74 Years | 1,484 | 19.9% |
| 75 to 84 Years | 395 | 5.3% |
| 85 Years and Over | 153 | 2.1% |
| Total | 7,449 | 100.0% |
Housing Finances in Evergreen Park
Median Income by Occupancy in Evergreen Park
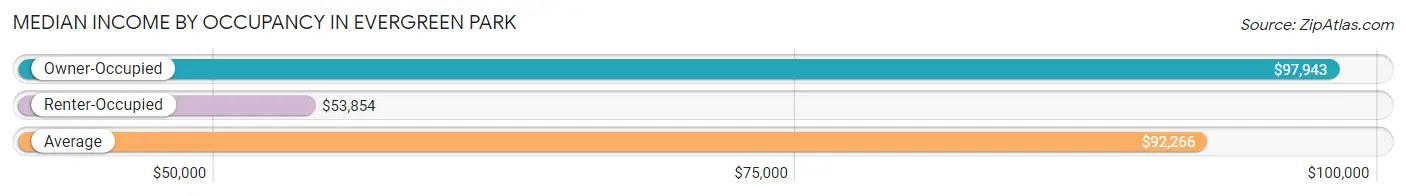
| Occupancy Type | # Households | Median Income |
| Owner-Occupied | 6,214 (83.4%) | $97,943 |
| Renter-Occupied | 1,235 (16.6%) | $53,854 |
| Average | 7,449 (100.0%) | $92,266 |
Occupancy by Householder Income Bracket in Evergreen Park
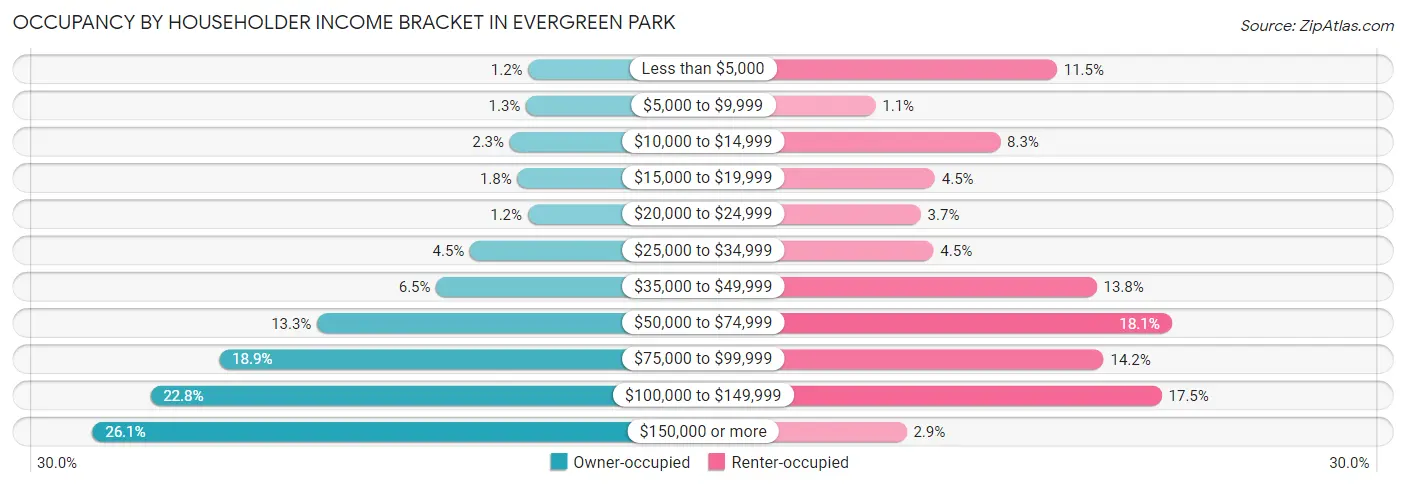
| Income Bracket | Owner-occupied | Renter-occupied |
| Less than $5,000 | 75 (1.2%) | 142 (11.5%) |
| $5,000 to $9,999 | 83 (1.3%) | 14 (1.1%) |
| $10,000 to $14,999 | 141 (2.3%) | 102 (8.3%) |
| $15,000 to $19,999 | 114 (1.8%) | 56 (4.5%) |
| $20,000 to $24,999 | 77 (1.2%) | 46 (3.7%) |
| $25,000 to $34,999 | 282 (4.5%) | 55 (4.4%) |
| $35,000 to $49,999 | 402 (6.5%) | 170 (13.8%) |
| $50,000 to $74,999 | 825 (13.3%) | 223 (18.1%) |
| $75,000 to $99,999 | 1,173 (18.9%) | 175 (14.2%) |
| $100,000 to $149,999 | 1,418 (22.8%) | 216 (17.5%) |
| $150,000 or more | 1,624 (26.1%) | 36 (2.9%) |
| Total | 6,214 (100.0%) | 1,235 (100.0%) |
Monthly Housing Cost Tiers in Evergreen Park
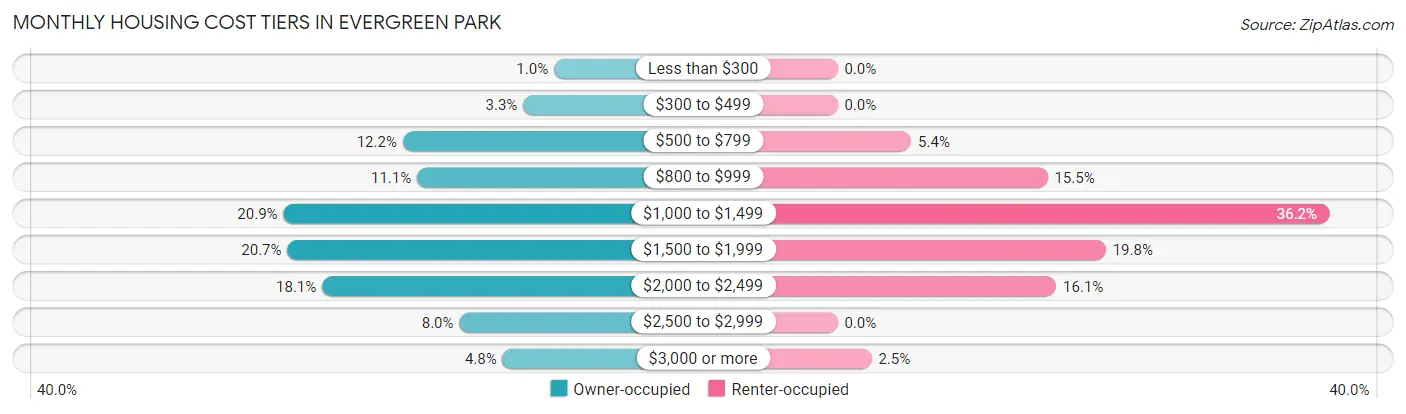
| Monthly Cost | Owner-occupied | Renter-occupied |
| Less than $300 | 63 (1.0%) | 0 (0.0%) |
| $300 to $499 | 204 (3.3%) | 0 (0.0%) |
| $500 to $799 | 755 (12.1%) | 67 (5.4%) |
| $800 to $999 | 690 (11.1%) | 191 (15.5%) |
| $1,000 to $1,499 | 1,301 (20.9%) | 447 (36.2%) |
| $1,500 to $1,999 | 1,283 (20.6%) | 244 (19.8%) |
| $2,000 to $2,499 | 1,124 (18.1%) | 199 (16.1%) |
| $2,500 to $2,999 | 496 (8.0%) | 0 (0.0%) |
| $3,000 or more | 298 (4.8%) | 31 (2.5%) |
| Total | 6,214 (100.0%) | 1,235 (100.0%) |
Physical Housing Characteristics in Evergreen Park
Housing Structures in Evergreen Park
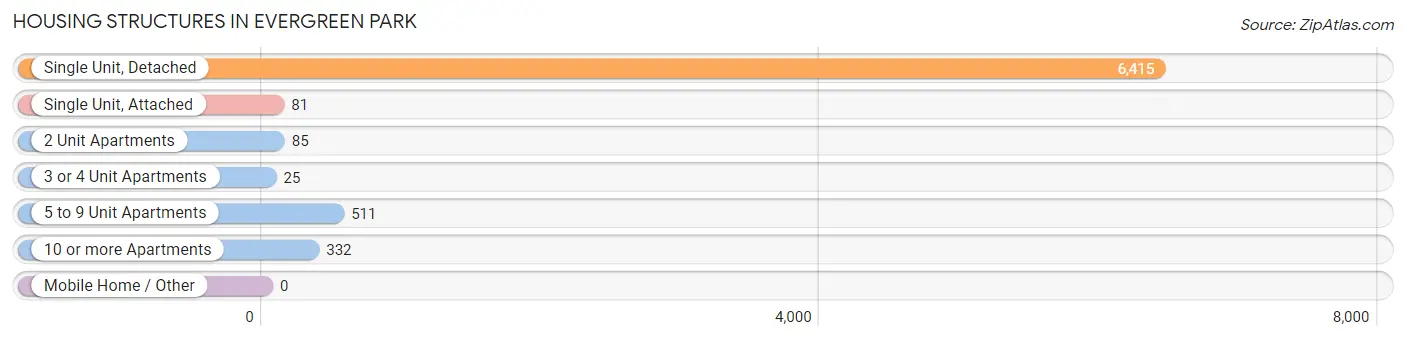
| Structure Type | # Housing Units | % Housing Units |
| Single Unit, Detached | 6,415 | 86.1% |
| Single Unit, Attached | 81 | 1.1% |
| 2 Unit Apartments | 85 | 1.1% |
| 3 or 4 Unit Apartments | 25 | 0.3% |
| 5 to 9 Unit Apartments | 511 | 6.9% |
| 10 or more Apartments | 332 | 4.5% |
| Mobile Home / Other | 0 | 0.0% |
| Total | 7,449 | 100.0% |
Housing Structures by Occupancy in Evergreen Park
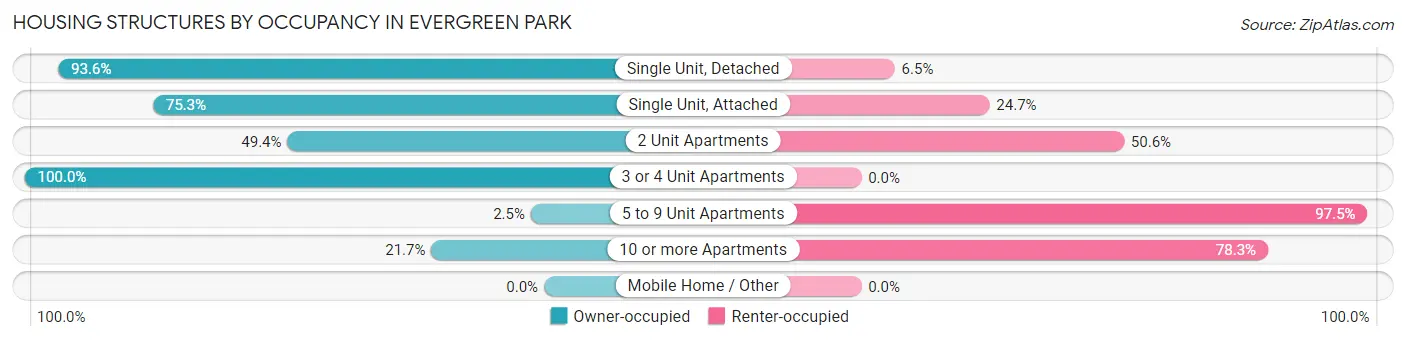
| Structure Type | Owner-occupied | Renter-occupied |
| Single Unit, Detached | 6,001 (93.5%) | 414 (6.5%) |
| Single Unit, Attached | 61 (75.3%) | 20 (24.7%) |
| 2 Unit Apartments | 42 (49.4%) | 43 (50.6%) |
| 3 or 4 Unit Apartments | 25 (100.0%) | 0 (0.0%) |
| 5 to 9 Unit Apartments | 13 (2.5%) | 498 (97.5%) |
| 10 or more Apartments | 72 (21.7%) | 260 (78.3%) |
| Mobile Home / Other | 0 (0.0%) | 0 (0.0%) |
| Total | 6,214 (83.4%) | 1,235 (16.6%) |
Housing Structures by Number of Rooms in Evergreen Park
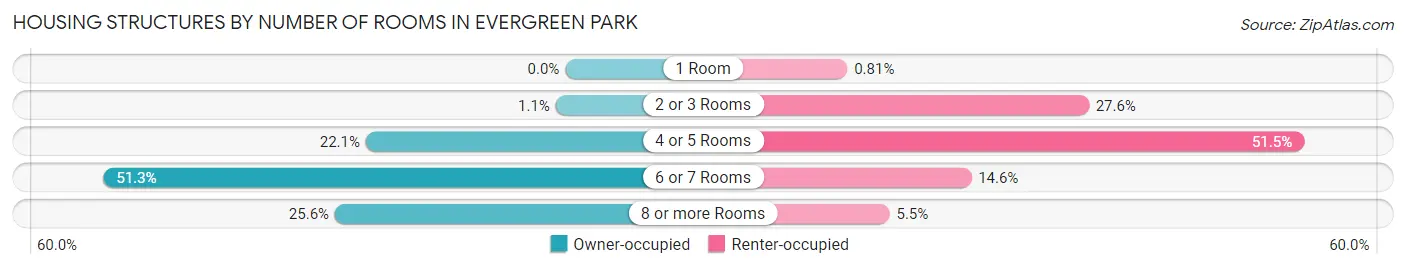
| Number of Rooms | Owner-occupied | Renter-occupied |
| 1 Room | 0 (0.0%) | 10 (0.8%) |
| 2 or 3 Rooms | 66 (1.1%) | 341 (27.6%) |
| 4 or 5 Rooms | 1,375 (22.1%) | 636 (51.5%) |
| 6 or 7 Rooms | 3,185 (51.3%) | 180 (14.6%) |
| 8 or more Rooms | 1,588 (25.6%) | 68 (5.5%) |
| Total | 6,214 (100.0%) | 1,235 (100.0%) |
Housing Structure by Heating Type in Evergreen Park
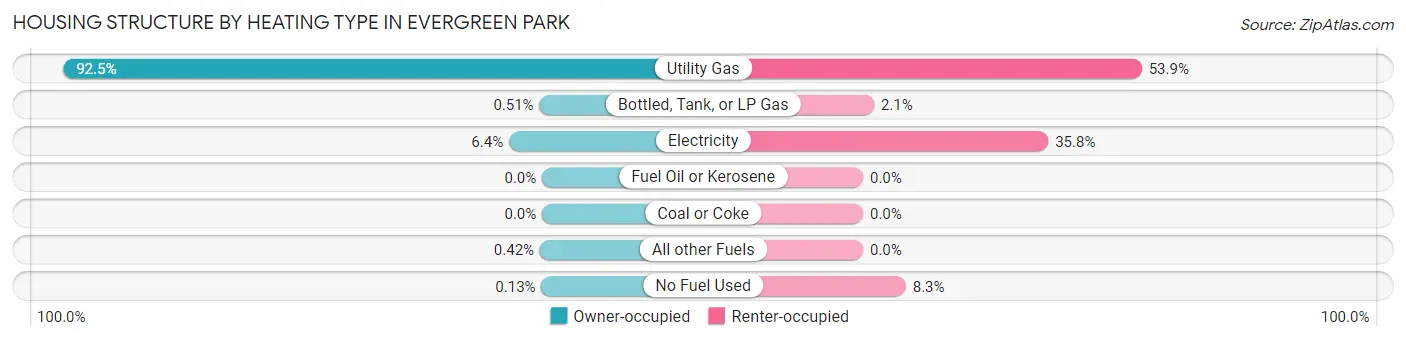
| Heating Type | Owner-occupied | Renter-occupied |
| Utility Gas | 5,750 (92.5%) | 665 (53.8%) |
| Bottled, Tank, or LP Gas | 32 (0.5%) | 26 (2.1%) |
| Electricity | 398 (6.4%) | 442 (35.8%) |
| Fuel Oil or Kerosene | 0 (0.0%) | 0 (0.0%) |
| Coal or Coke | 0 (0.0%) | 0 (0.0%) |
| All other Fuels | 26 (0.4%) | 0 (0.0%) |
| No Fuel Used | 8 (0.1%) | 102 (8.3%) |
| Total | 6,214 (100.0%) | 1,235 (100.0%) |
Household Vehicle Usage in Evergreen Park
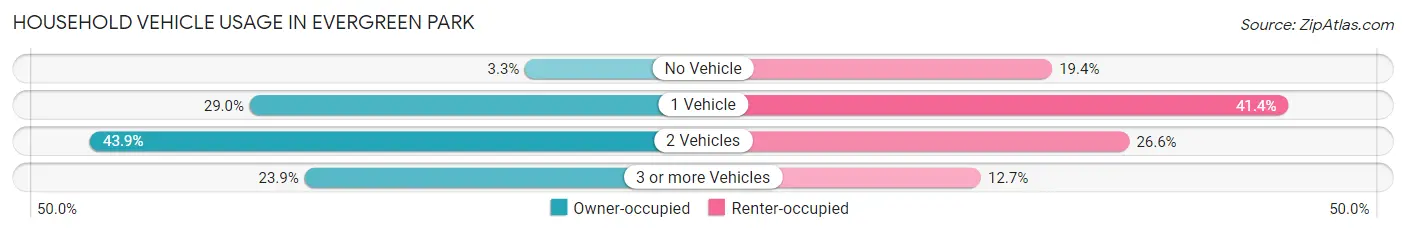
| Vehicles per Household | Owner-occupied | Renter-occupied |
| No Vehicle | 203 (3.3%) | 239 (19.4%) |
| 1 Vehicle | 1,801 (29.0%) | 511 (41.4%) |
| 2 Vehicles | 2,727 (43.9%) | 328 (26.6%) |
| 3 or more Vehicles | 1,483 (23.9%) | 157 (12.7%) |
| Total | 6,214 (100.0%) | 1,235 (100.0%) |
Real Estate & Mortgages in Evergreen Park
Real Estate and Mortgage Overview in Evergreen Park
| Characteristic | Without Mortgage | With Mortgage |
| Housing Units | 2,256 | 3,958 |
| Median Property Value | $232,900 | $251,100 |
| Median Household Income | $89,375 | $1,195 |
| Monthly Housing Costs | $831 | $298 |
| Real Estate Taxes | $5,563 | $44 |
Property Value by Mortgage Status in Evergreen Park
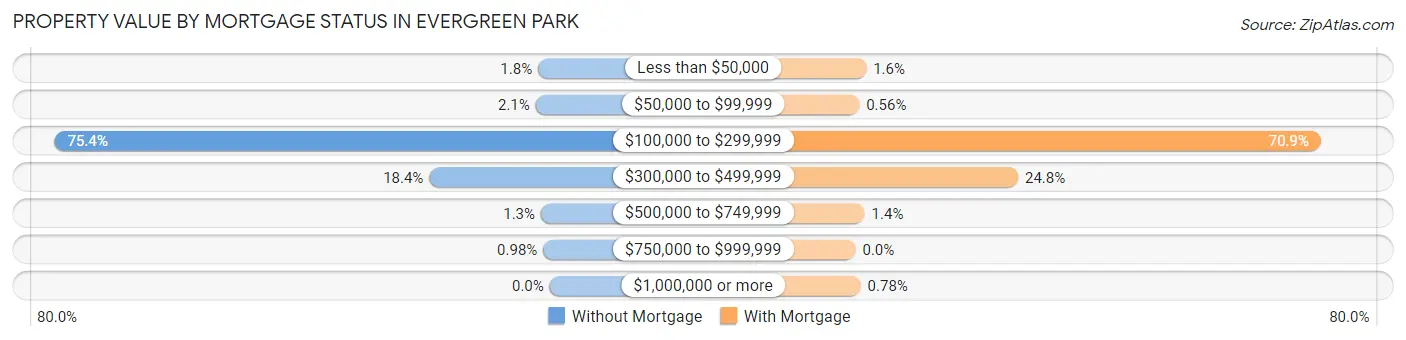
| Property Value | Without Mortgage | With Mortgage |
| Less than $50,000 | 40 (1.8%) | 64 (1.6%) |
| $50,000 to $99,999 | 48 (2.1%) | 22 (0.6%) |
| $100,000 to $299,999 | 1,702 (75.4%) | 2,806 (70.9%) |
| $300,000 to $499,999 | 414 (18.3%) | 980 (24.8%) |
| $500,000 to $749,999 | 30 (1.3%) | 55 (1.4%) |
| $750,000 to $999,999 | 22 (1.0%) | 0 (0.0%) |
| $1,000,000 or more | 0 (0.0%) | 31 (0.8%) |
| Total | 2,256 (100.0%) | 3,958 (100.0%) |
Household Income by Mortgage Status in Evergreen Park
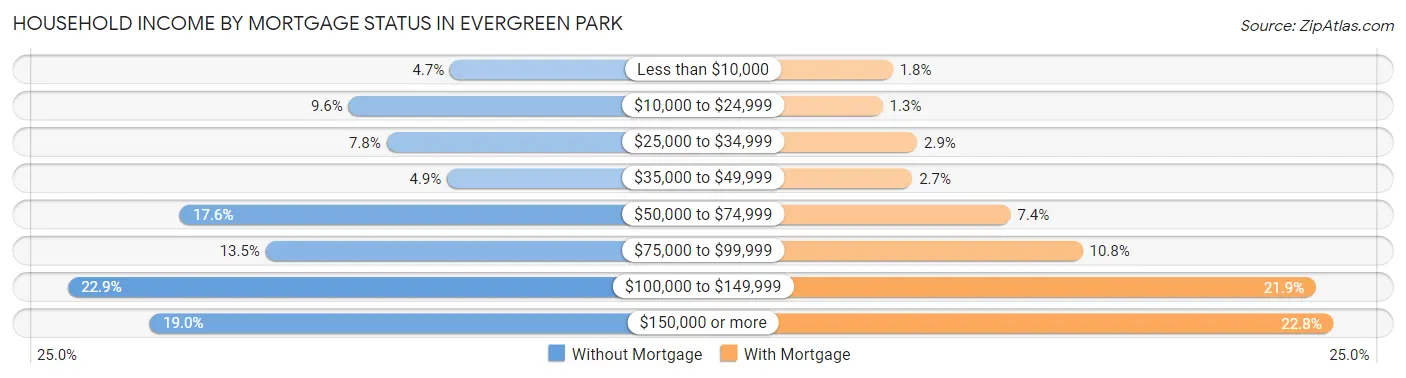
| Household Income | Without Mortgage | With Mortgage |
| Less than $10,000 | 107 (4.7%) | 70 (1.8%) |
| $10,000 to $24,999 | 216 (9.6%) | 51 (1.3%) |
| $25,000 to $34,999 | 175 (7.8%) | 116 (2.9%) |
| $35,000 to $49,999 | 110 (4.9%) | 107 (2.7%) |
| $50,000 to $74,999 | 397 (17.6%) | 292 (7.4%) |
| $75,000 to $99,999 | 305 (13.5%) | 428 (10.8%) |
| $100,000 to $149,999 | 517 (22.9%) | 868 (21.9%) |
| $150,000 or more | 429 (19.0%) | 901 (22.8%) |
| Total | 2,256 (100.0%) | 3,958 (100.0%) |
Property Value to Household Income Ratio in Evergreen Park
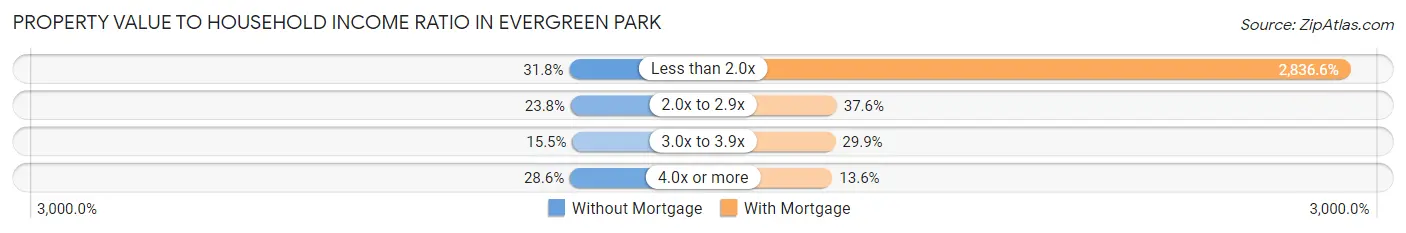
| Value-to-Income Ratio | Without Mortgage | With Mortgage |
| Less than 2.0x | 718 (31.8%) | 112,273 (2,836.6%) |
| 2.0x to 2.9x | 536 (23.8%) | 1,488 (37.6%) |
| 3.0x to 3.9x | 350 (15.5%) | 1,184 (29.9%) |
| 4.0x or more | 645 (28.6%) | 537 (13.6%) |
| Total | 2,256 (100.0%) | 3,958 (100.0%) |
Real Estate Taxes by Mortgage Status in Evergreen Park
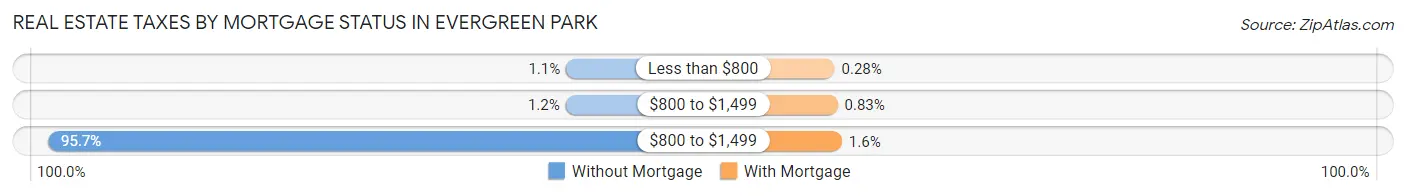
| Property Taxes | Without Mortgage | With Mortgage |
| Less than $800 | 25 (1.1%) | 11 (0.3%) |
| $800 to $1,499 | 27 (1.2%) | 33 (0.8%) |
| $800 to $1,499 | 2,160 (95.7%) | 64 (1.6%) |
| Total | 2,256 (100.0%) | 3,958 (100.0%) |
Health & Disability in Evergreen Park
Health Insurance Coverage by Age in Evergreen Park
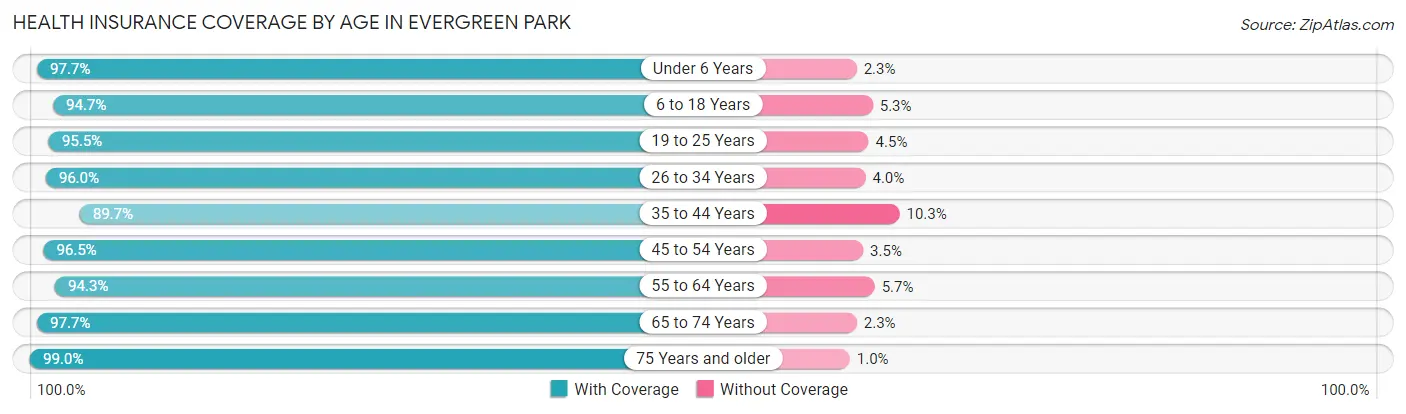
| Age Bracket | With Coverage | Without Coverage |
| Under 6 Years | 1,983 (97.7%) | 47 (2.3%) |
| 6 to 18 Years | 2,853 (94.7%) | 160 (5.3%) |
| 19 to 25 Years | 1,471 (95.5%) | 70 (4.5%) |
| 26 to 34 Years | 2,280 (96.0%) | 94 (4.0%) |
| 35 to 44 Years | 1,994 (89.7%) | 229 (10.3%) |
| 45 to 54 Years | 2,737 (96.5%) | 100 (3.5%) |
| 55 to 64 Years | 2,474 (94.3%) | 149 (5.7%) |
| 65 to 74 Years | 2,124 (97.7%) | 51 (2.3%) |
| 75 Years and older | 772 (99.0%) | 8 (1.0%) |
| Total | 18,688 (95.4%) | 908 (4.6%) |
Health Insurance Coverage by Citizenship Status in Evergreen Park
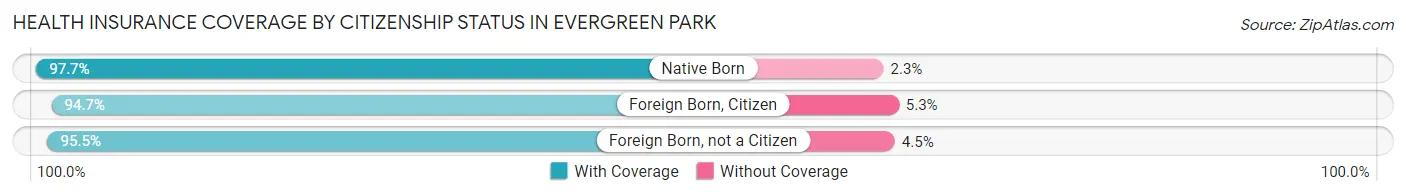
| Citizenship Status | With Coverage | Without Coverage |
| Native Born | 1,983 (97.7%) | 47 (2.3%) |
| Foreign Born, Citizen | 2,853 (94.7%) | 160 (5.3%) |
| Foreign Born, not a Citizen | 1,471 (95.5%) | 70 (4.5%) |
Health Insurance Coverage by Household Income in Evergreen Park
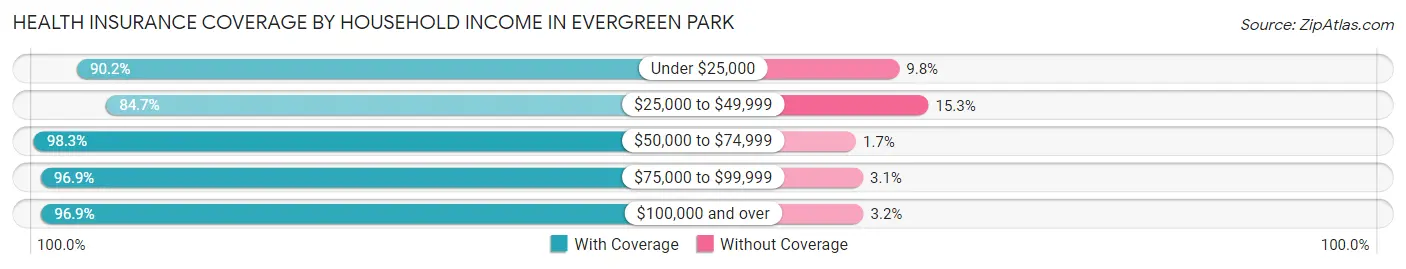
| Household Income | With Coverage | Without Coverage |
| Under $25,000 | 1,054 (90.2%) | 115 (9.8%) |
| $25,000 to $49,999 | 1,730 (84.7%) | 313 (15.3%) |
| $50,000 to $74,999 | 2,200 (98.3%) | 39 (1.7%) |
| $75,000 to $99,999 | 3,103 (96.9%) | 98 (3.1%) |
| $100,000 and over | 10,556 (96.9%) | 343 (3.2%) |
Public vs Private Health Insurance Coverage by Age in Evergreen Park
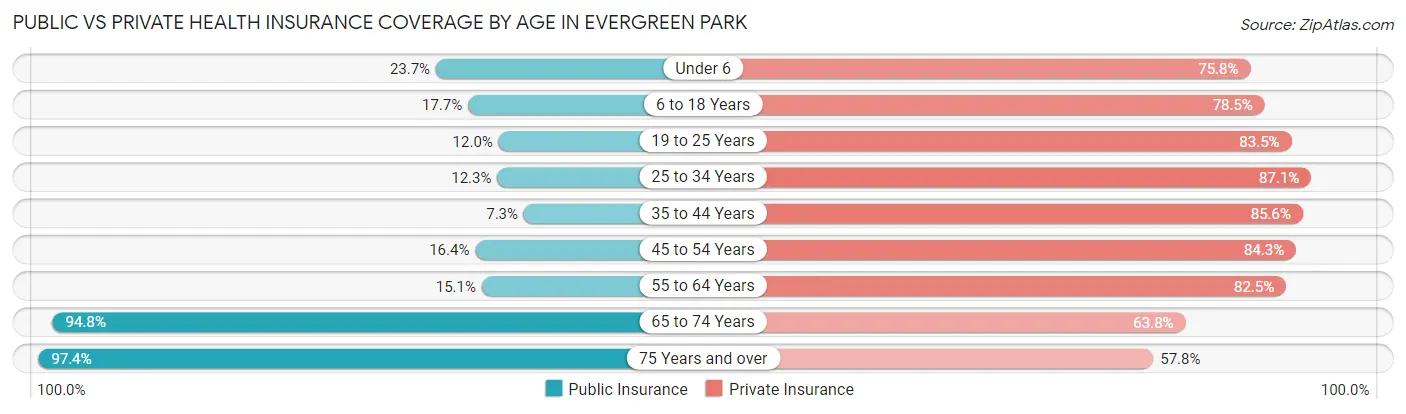
| Age Bracket | Public Insurance | Private Insurance |
| Under 6 | 480 (23.6%) | 1,539 (75.8%) |
| 6 to 18 Years | 533 (17.7%) | 2,365 (78.5%) |
| 19 to 25 Years | 185 (12.0%) | 1,286 (83.5%) |
| 25 to 34 Years | 291 (12.3%) | 2,068 (87.1%) |
| 35 to 44 Years | 163 (7.3%) | 1,902 (85.6%) |
| 45 to 54 Years | 464 (16.4%) | 2,392 (84.3%) |
| 55 to 64 Years | 397 (15.1%) | 2,163 (82.5%) |
| 65 to 74 Years | 2,062 (94.8%) | 1,387 (63.8%) |
| 75 Years and over | 760 (97.4%) | 451 (57.8%) |
| Total | 5,335 (27.2%) | 15,553 (79.4%) |
Disability Status by Sex by Age in Evergreen Park
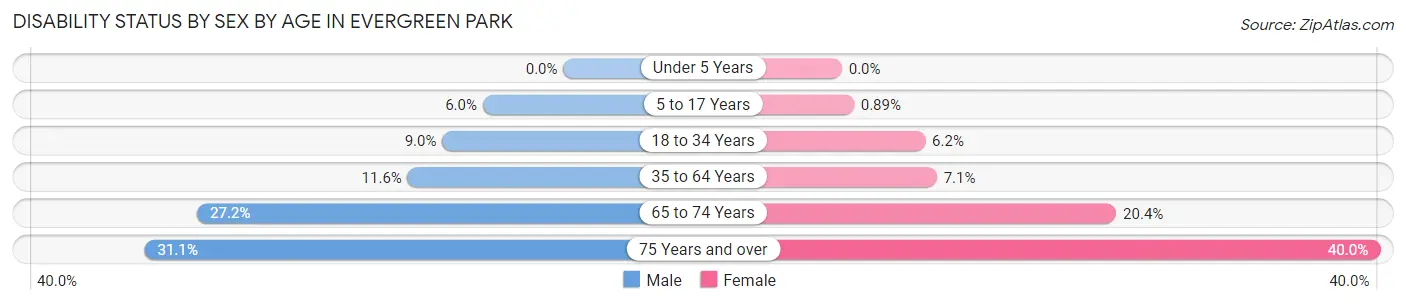
| Age Bracket | Male | Female |
| Under 5 Years | 0 (0.0%) | 0 (0.0%) |
| 5 to 17 Years | 85 (6.0%) | 15 (0.9%) |
| 18 to 34 Years | 180 (9.0%) | 127 (6.2%) |
| 35 to 64 Years | 419 (11.6%) | 286 (7.0%) |
| 65 to 74 Years | 279 (27.2%) | 234 (20.4%) |
| 75 Years and over | 83 (31.1%) | 205 (40.0%) |
Disability Class by Sex by Age in Evergreen Park
Disability Class: Hearing Difficulty
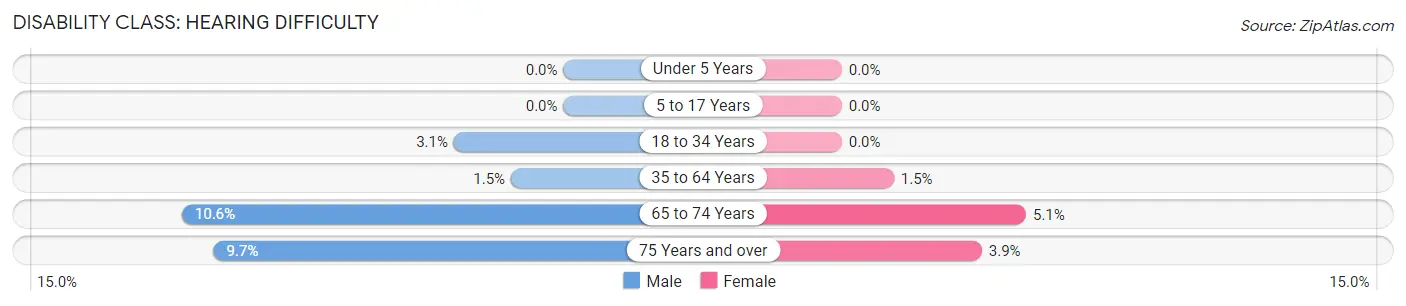
| Age Bracket | Male | Female |
| Under 5 Years | 0 (0.0%) | 0 (0.0%) |
| 5 to 17 Years | 0 (0.0%) | 0 (0.0%) |
| 18 to 34 Years | 61 (3.0%) | 0 (0.0%) |
| 35 to 64 Years | 53 (1.5%) | 59 (1.5%) |
| 65 to 74 Years | 109 (10.6%) | 59 (5.1%) |
| 75 Years and over | 26 (9.7%) | 20 (3.9%) |
Disability Class: Vision Difficulty
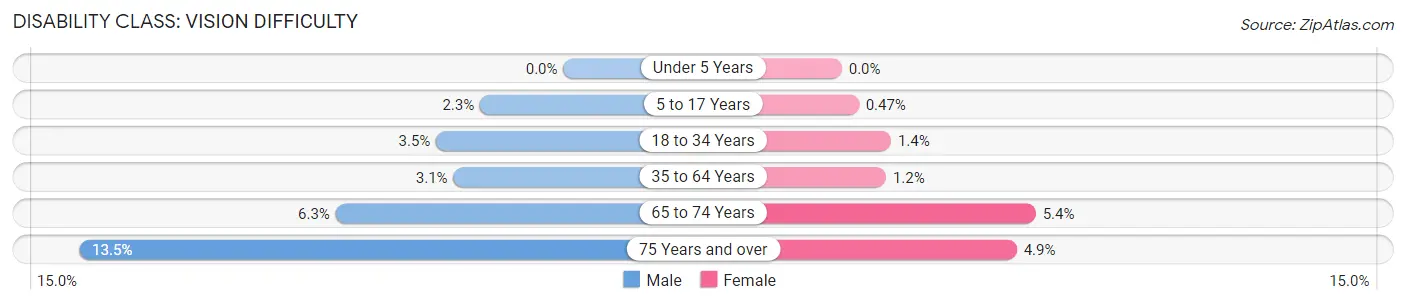
| Age Bracket | Male | Female |
| Under 5 Years | 0 (0.0%) | 0 (0.0%) |
| 5 to 17 Years | 33 (2.3%) | 8 (0.5%) |
| 18 to 34 Years | 71 (3.5%) | 28 (1.4%) |
| 35 to 64 Years | 111 (3.1%) | 50 (1.2%) |
| 65 to 74 Years | 65 (6.3%) | 62 (5.4%) |
| 75 Years and over | 36 (13.5%) | 25 (4.9%) |
Disability Class: Cognitive Difficulty
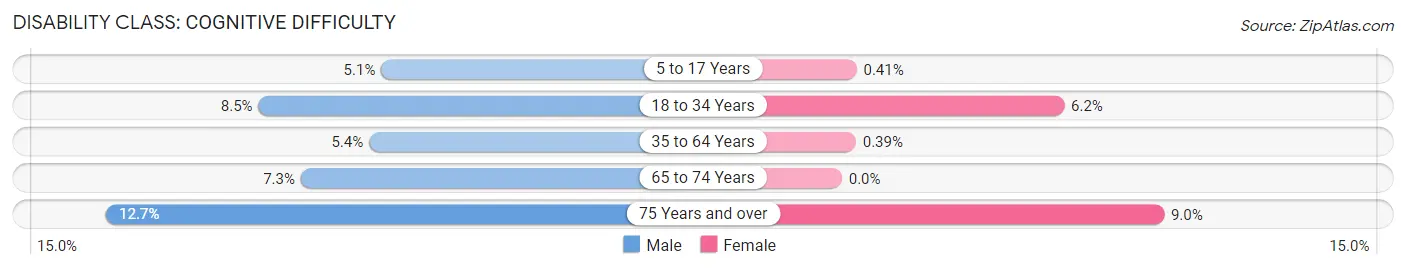
| Age Bracket | Male | Female |
| 5 to 17 Years | 72 (5.1%) | 7 (0.4%) |
| 18 to 34 Years | 170 (8.5%) | 127 (6.2%) |
| 35 to 64 Years | 196 (5.4%) | 16 (0.4%) |
| 65 to 74 Years | 75 (7.3%) | 0 (0.0%) |
| 75 Years and over | 34 (12.7%) | 46 (9.0%) |
Disability Class: Ambulatory Difficulty
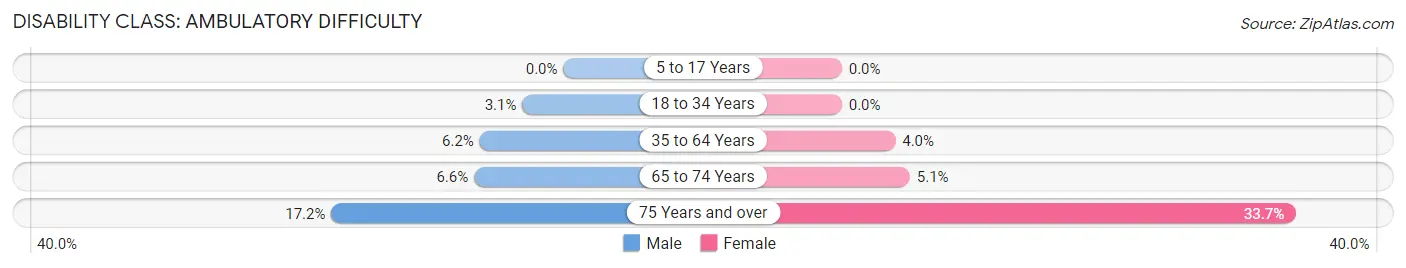
| Age Bracket | Male | Female |
| 5 to 17 Years | 0 (0.0%) | 0 (0.0%) |
| 18 to 34 Years | 61 (3.0%) | 0 (0.0%) |
| 35 to 64 Years | 225 (6.2%) | 161 (4.0%) |
| 65 to 74 Years | 68 (6.6%) | 58 (5.1%) |
| 75 Years and over | 46 (17.2%) | 173 (33.7%) |
Disability Class: Self-Care Difficulty
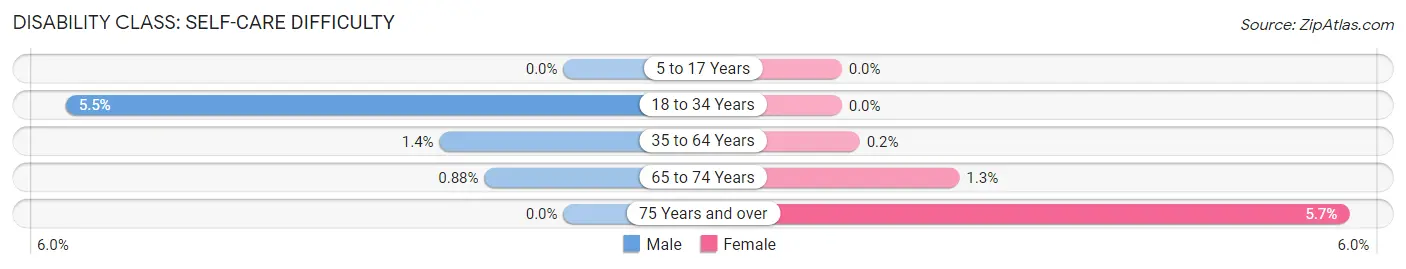
| Age Bracket | Male | Female |
| 5 to 17 Years | 0 (0.0%) | 0 (0.0%) |
| 18 to 34 Years | 111 (5.5%) | 0 (0.0%) |
| 35 to 64 Years | 50 (1.4%) | 8 (0.2%) |
| 65 to 74 Years | 9 (0.9%) | 15 (1.3%) |
| 75 Years and over | 0 (0.0%) | 29 (5.7%) |
Technology Access in Evergreen Park
Computing Device Access in Evergreen Park
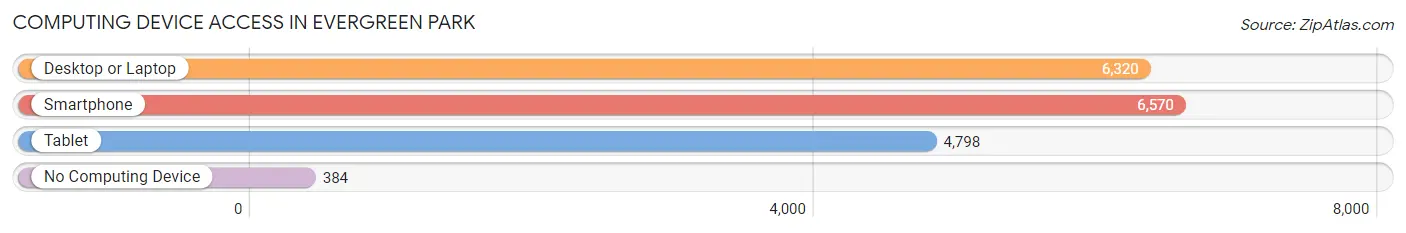
| Device Type | # Households | % Households |
| Desktop or Laptop | 6,320 | 84.8% |
| Smartphone | 6,570 | 88.2% |
| Tablet | 4,798 | 64.4% |
| No Computing Device | 384 | 5.2% |
| Total | 7,449 | 100.0% |
Internet Access in Evergreen Park
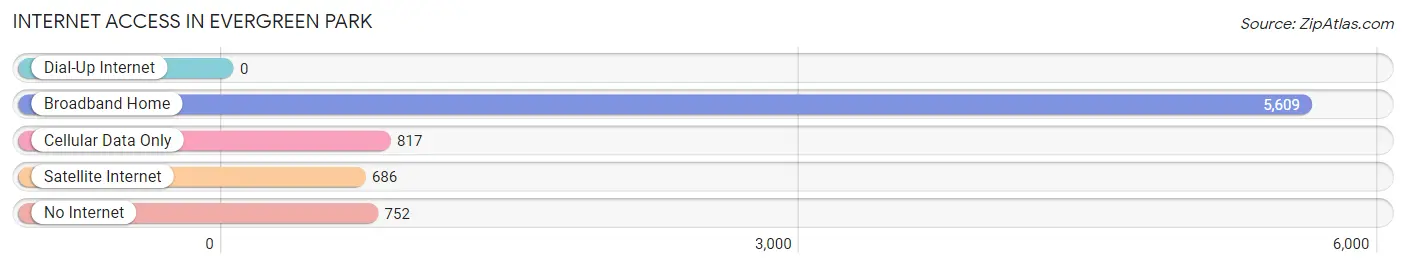
| Internet Type | # Households | % Households |
| Dial-Up Internet | 0 | 0.0% |
| Broadband Home | 5,609 | 75.3% |
| Cellular Data Only | 817 | 11.0% |
| Satellite Internet | 686 | 9.2% |
| No Internet | 752 | 10.1% |
| Total | 7,449 | 100.0% |
Evergreen Park Summary
History
The history of Evergreen Park, Illinois dates back to the early 19th century when the area was first settled by German immigrants. The area was originally known as “Evergreen” and was part of the town of Lake. In 1892, the area was incorporated as the Village of Evergreen Park. The village was named after the evergreen trees that grew in the area.
The village grew slowly but steadily over the years, and by the 1950s, it had become a thriving community. The population of Evergreen Park was just over 10,000 in 1950, and by 1960, it had grown to over 20,000.
In the 1960s, the village experienced a period of rapid growth and development. New businesses and industries moved into the area, and the population increased to over 30,000 by 1970.
In the 1970s, the village continued to grow and develop. The population reached over 40,000 by 1980, and the village was officially incorporated as a city in 1982.
Today, Evergreen Park is a thriving community with a population of over 19,000. The city is home to a variety of businesses, industries, and services, and it is a popular destination for shopping, dining, and entertainment.
Geography
Evergreen Park is located in Cook County, Illinois, approximately 15 miles south of downtown Chicago. The city is bordered by the cities of Oak Lawn to the north, Chicago Ridge to the east, and Hometown to the south.
The city covers an area of 4.2 square miles, and it is located at an elevation of 602 feet above sea level. The city is situated on the Des Plaines River, and it is home to several parks and recreational areas, including Evergreen Park, which is the city’s largest park.
Economy
The economy of Evergreen Park is largely based on retail and services. The city is home to a variety of retail stores, restaurants, and other businesses. The city is also home to several industrial parks, which provide employment opportunities for local residents.
The city is also home to a number of corporate headquarters, including the headquarters of the Chicago Tribune and the Chicago Sun-Times.
Demographics
As of the 2010 census, the population of Evergreen Park was 19,852. The racial makeup of the city was 79.2% White, 11.2% African American, 0.3% Native American, 2.2% Asian, and 6.9% from other races. Hispanic or Latino of any race were 11.7% of the population.
The median household income in Evergreen Park was $50,945, and the median family income was $60,945. The per capita income was $25,945. About 8.2% of families and 10.2% of the population were below the poverty line, including 14.2% of those under age 18 and 6.2% of those age 65 or over.
The population of Evergreen Park is largely Catholic, with over 70% of the population identifying as Catholic. The city is also home to a variety of other religious denominations, including Protestant, Jewish, and Muslim.
Common Questions
What is Per Capita Income in Evergreen Park?
Per Capita income in Evergreen Park is $41,521.
What is the Median Family Income in Evergreen Park?
Median Family Income in Evergreen Park is $111,882.
What is the Median Household income in Evergreen Park?
Median Household Income in Evergreen Park is $92,266.
What is Income or Wage Gap in Evergreen Park?
Income or Wage Gap in Evergreen Park is 36.2%.
Women in Evergreen Park earn 63.8 cents for every dollar earned by a man.
What is Family Income Deficit in Evergreen Park?
Family Income Deficit in Evergreen Park is $13,161.
Families that are below poverty line in Evergreen Park earn $13,161 less on average than the poverty threshold level.
What is Inequality or Gini Index in Evergreen Park?
Inequality or Gini Index in Evergreen Park is 0.39.
What is the Total Population of Evergreen Park?
Total Population of Evergreen Park is 19,730.
What is the Total Male Population of Evergreen Park?
Total Male Population of Evergreen Park is 9,414.
What is the Total Female Population of Evergreen Park?
Total Female Population of Evergreen Park is 10,316.
What is the Ratio of Males per 100 Females in Evergreen Park?
There are 91.26 Males per 100 Females in Evergreen Park.
What is the Ratio of Females per 100 Males in Evergreen Park?
There are 109.58 Females per 100 Males in Evergreen Park.
What is the Median Population Age in Evergreen Park?
Median Population Age in Evergreen Park is 39.6 Years.
What is the Average Family Size in Evergreen Park
Average Family Size in Evergreen Park is 3.3 People.
What is the Average Household Size in Evergreen Park
Average Household Size in Evergreen Park is 2.6 People.
How Large is the Labor Force in Evergreen Park?
There are 10,311 People in the Labor Forcein in Evergreen Park.
What is the Percentage of People in the Labor Force in Evergreen Park?
66.5% of People are in the Labor Force in Evergreen Park.
What is the Unemployment Rate in Evergreen Park?
Unemployment Rate in Evergreen Park is 3.8%.