Steger, IL Map & Demographics
Steger Map
Steger Overview
$29,533
PER CAPITA INCOME
$69,959
AVG FAMILY INCOME
$58,816
AVG HOUSEHOLD INCOME
43.3%
WAGE / INCOME GAP [ % ]
56.7¢/ $1
WAGE / INCOME GAP [ $ ]
0.39
INEQUALITY / GINI INDEX
9,518
TOTAL POPULATION
4,871
MALE POPULATION
4,647
FEMALE POPULATION
104.82
MALES / 100 FEMALES
95.40
FEMALES / 100 MALES
38.5
MEDIAN AGE
3.1
AVG FAMILY SIZE
2.4
AVG HOUSEHOLD SIZE
4,593
LABOR FORCE [ PEOPLE ]
61.5%
PERCENT IN LABOR FORCE
4.5%
UNEMPLOYMENT RATE
Steger Zip Codes
Steger Area Codes
Income in Steger
Income Overview in Steger
Per Capita Income in Steger is $29,533, while median incomes of families and households are $69,959 and $58,816 respectively.
| Characteristic | Number | Measure |
| Per Capita Income | 9,518 | $29,533 |
| Median Family Income | 2,375 | $69,959 |
| Mean Family Income | 2,375 | $83,395 |
| Median Household Income | 4,050 | $58,816 |
| Mean Household Income | 4,050 | $68,996 |
| Income Deficit | 2,375 | $0 |
| Wage / Income Gap (%) | 9,518 | 43.28% |
| Wage / Income Gap ($) | 9,518 | 56.72¢ per $1 |
| Gini / Inequality Index | 9,518 | 0.39 |
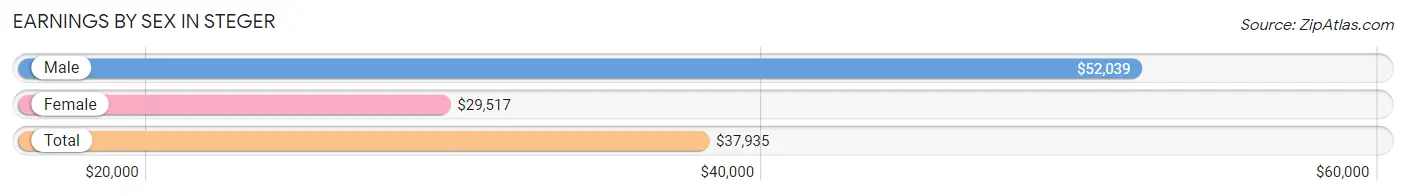
Earnings by Sex in Steger
Average Earnings in Steger are $37,935, $52,039 for men and $29,517 for women, a difference of 43.3%.
| Sex | Number | Average Earnings |
| Male | 2,480 (53.1%) | $52,039 |
| Female | 2,186 (46.9%) | $29,517 |
| Total | 4,666 (100.0%) | $37,935 |
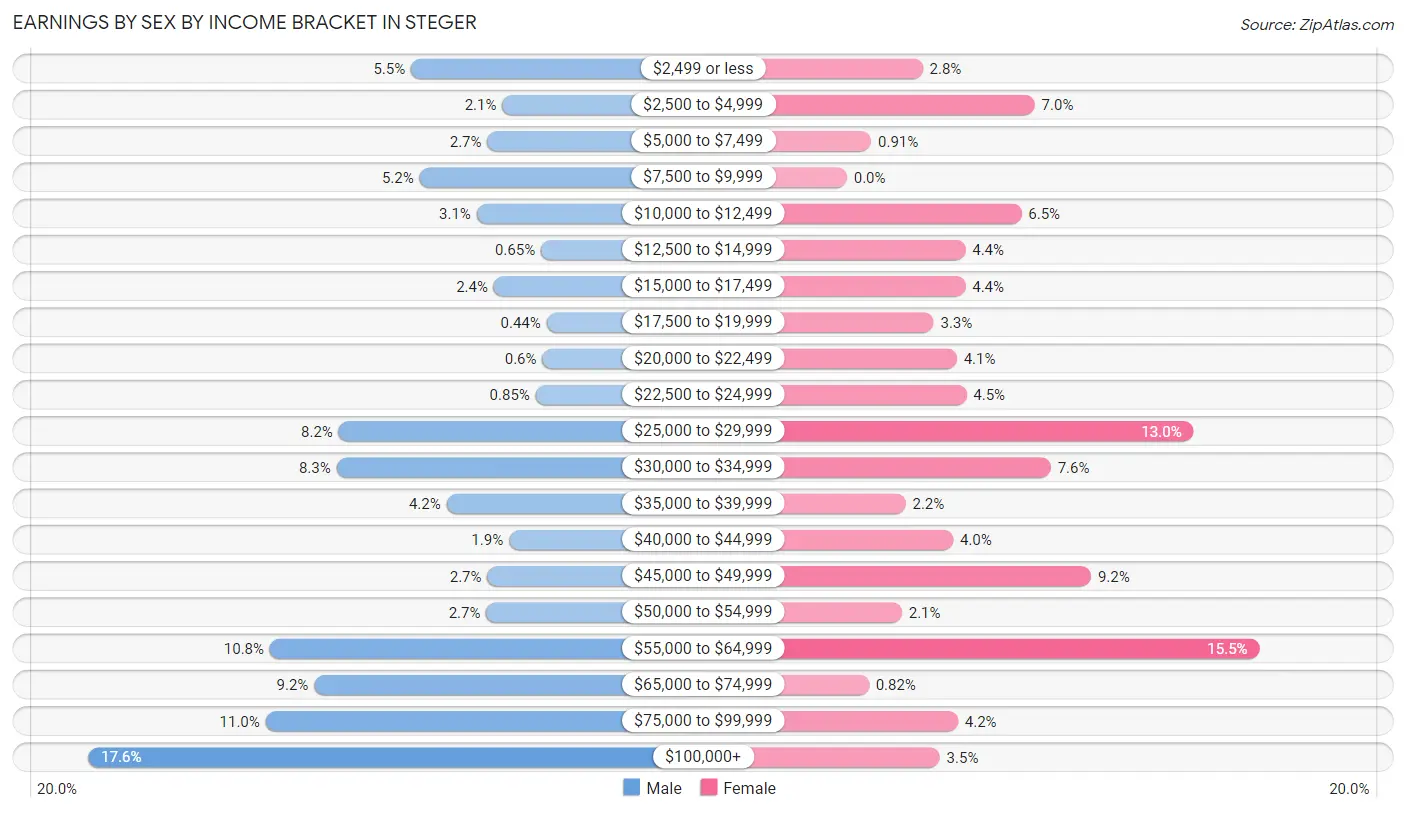
Earnings by Sex by Income Bracket in Steger
The most common earnings brackets in Steger are $100,000+ for men (437 | 17.6%) and $55,000 to $64,999 for women (338 | 15.5%).
| Income | Male | Female |
| $2,499 or less | 137 (5.5%) | 62 (2.8%) |
| $2,500 to $4,999 | 52 (2.1%) | 154 (7.0%) |
| $5,000 to $7,499 | 66 (2.7%) | 20 (0.9%) |
| $7,500 to $9,999 | 129 (5.2%) | 0 (0.0%) |
| $10,000 to $12,499 | 76 (3.1%) | 143 (6.5%) |
| $12,500 to $14,999 | 16 (0.6%) | 97 (4.4%) |
| $15,000 to $17,499 | 60 (2.4%) | 97 (4.4%) |
| $17,500 to $19,999 | 11 (0.4%) | 71 (3.3%) |
| $20,000 to $22,499 | 15 (0.6%) | 90 (4.1%) |
| $22,500 to $24,999 | 21 (0.9%) | 98 (4.5%) |
| $25,000 to $29,999 | 204 (8.2%) | 284 (13.0%) |
| $30,000 to $34,999 | 206 (8.3%) | 167 (7.6%) |
| $35,000 to $39,999 | 104 (4.2%) | 48 (2.2%) |
| $40,000 to $44,999 | 46 (1.8%) | 87 (4.0%) |
| $45,000 to $49,999 | 66 (2.7%) | 200 (9.1%) |
| $50,000 to $54,999 | 67 (2.7%) | 45 (2.1%) |
| $55,000 to $64,999 | 268 (10.8%) | 338 (15.5%) |
| $65,000 to $74,999 | 227 (9.1%) | 18 (0.8%) |
| $75,000 to $99,999 | 272 (11.0%) | 91 (4.2%) |
| $100,000+ | 437 (17.6%) | 76 (3.5%) |
| Total | 2,480 (100.0%) | 2,186 (100.0%) |
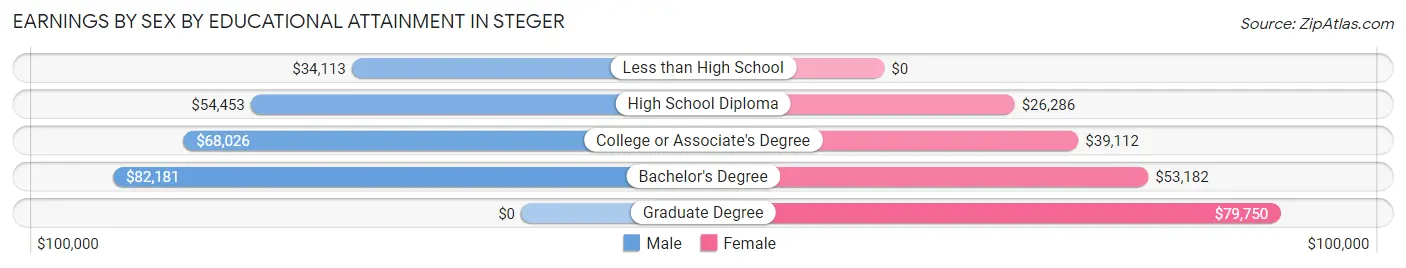
Earnings by Sex by Educational Attainment in Steger
Average earnings in Steger are $60,176 for men and $34,533 for women, a difference of 42.6%. Men with an educational attainment of bachelor's degree enjoy the highest average annual earnings of $82,181, while those with less than high school education earn the least with $34,113. Women with an educational attainment of graduate degree earn the most with the average annual earnings of $79,750, while those with high school diploma education have the smallest earnings of $26,286.
| Educational Attainment | Male Income | Female Income |
| Less than High School | $34,113 | $0 |
| High School Diploma | $54,453 | $26,286 |
| College or Associate's Degree | $68,026 | $39,112 |
| Bachelor's Degree | $82,181 | $53,182 |
| Graduate Degree | - | - |
| Total | $60,176 | $34,533 |
Family Income in Steger
Family Income Brackets in Steger
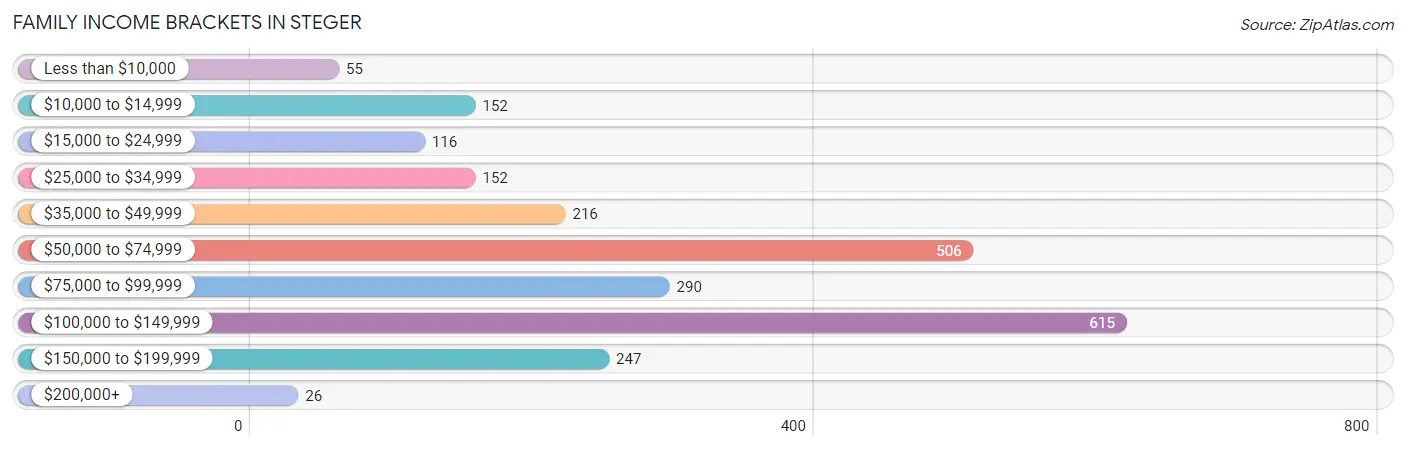
According to the Steger family income data, there are 615 families falling into the $100,000 to $149,999 income range, which is the most common income bracket and makes up 25.9% of all families. Conversely, the $200,000+ income bracket is the least frequent group with only 26 families (1.1%) belonging to this category.
| Income Bracket | # Families | % Families |
| Less than $10,000 | 55 | 2.3% |
| $10,000 to $14,999 | 152 | 6.4% |
| $15,000 to $24,999 | 116 | 4.9% |
| $25,000 to $34,999 | 152 | 6.4% |
| $35,000 to $49,999 | 216 | 9.1% |
| $50,000 to $74,999 | 506 | 21.3% |
| $75,000 to $99,999 | 290 | 12.2% |
| $100,000 to $149,999 | 615 | 25.9% |
| $150,000 to $199,999 | 247 | 10.4% |
| $200,000+ | 26 | 1.1% |
Family Income by Famaliy Size in Steger
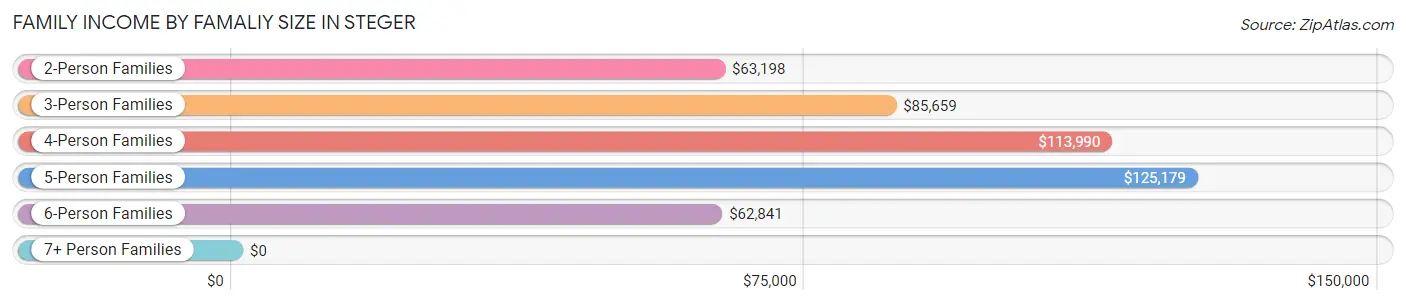
5-person families (175 | 7.4%) account for the highest median family income in Steger with $125,179 per family, while 2-person families (1,090 | 45.9%) have the highest median income of $31,599 per family member.
| Income Bracket | # Families | Median Income |
| 2-Person Families | 1,090 (45.9%) | $63,198 |
| 3-Person Families | 553 (23.3%) | $85,659 |
| 4-Person Families | 425 (17.9%) | $113,990 |
| 5-Person Families | 175 (7.4%) | $125,179 |
| 6-Person Families | 113 (4.8%) | $62,841 |
| 7+ Person Families | 19 (0.8%) | $0 |
| Total | 2,375 (100.0%) | $69,959 |
Family Income by Number of Earners in Steger
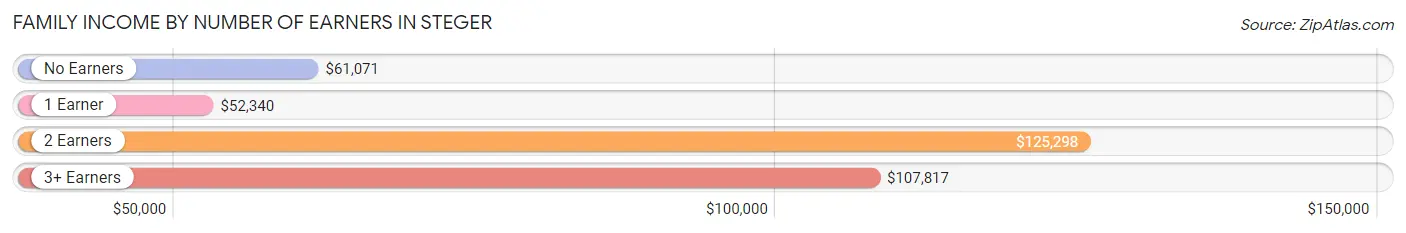
The median family income in Steger is $69,959, with families comprising 2 earners (743) having the highest median family income of $125,298, while families with 1 earner (935) have the lowest median family income of $52,340, accounting for 31.3% and 39.4% of families, respectively.
| Number of Earners | # Families | Median Income |
| No Earners | 424 (17.8%) | $61,071 |
| 1 Earner | 935 (39.4%) | $52,340 |
| 2 Earners | 743 (31.3%) | $125,298 |
| 3+ Earners | 273 (11.5%) | $107,817 |
| Total | 2,375 (100.0%) | $69,959 |
Household Income in Steger
Household Income Brackets in Steger
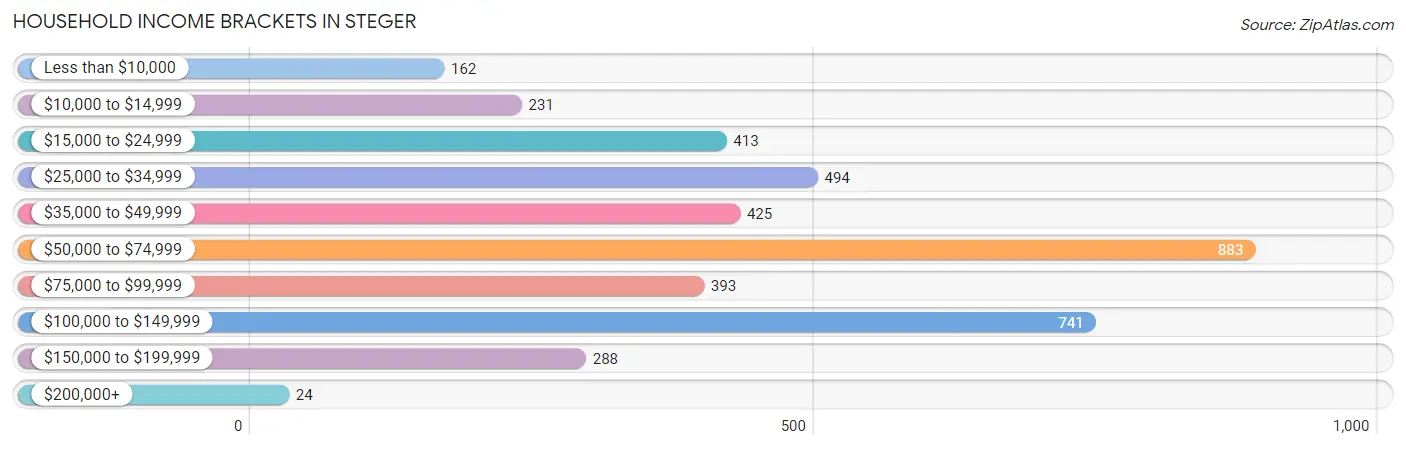
With 883 households falling in the category, the $50,000 to $74,999 income range is the most frequent in Steger, accounting for 21.8% of all households. In contrast, only 24 households (0.6%) fall into the $200,000+ income bracket, making it the least populous group.
| Income Bracket | # Households | % Households |
| Less than $10,000 | 162 | 4.0% |
| $10,000 to $14,999 | 231 | 5.7% |
| $15,000 to $24,999 | 413 | 10.2% |
| $25,000 to $34,999 | 494 | 12.2% |
| $35,000 to $49,999 | 425 | 10.5% |
| $50,000 to $74,999 | 883 | 21.8% |
| $75,000 to $99,999 | 393 | 9.7% |
| $100,000 to $149,999 | 741 | 18.3% |
| $150,000 to $199,999 | 288 | 7.1% |
| $200,000+ | 24 | 0.6% |
Household Income by Householder Age in Steger
The median household income in Steger is $58,816, with the highest median household income of $71,944 found in the 45 to 64 years age bracket for the primary householder. A total of 1,226 households (30.3%) fall into this category. Meanwhile, the 15 to 24 years age bracket for the primary householder has the lowest median household income of $28,445, with 293 households (7.2%) in this group.
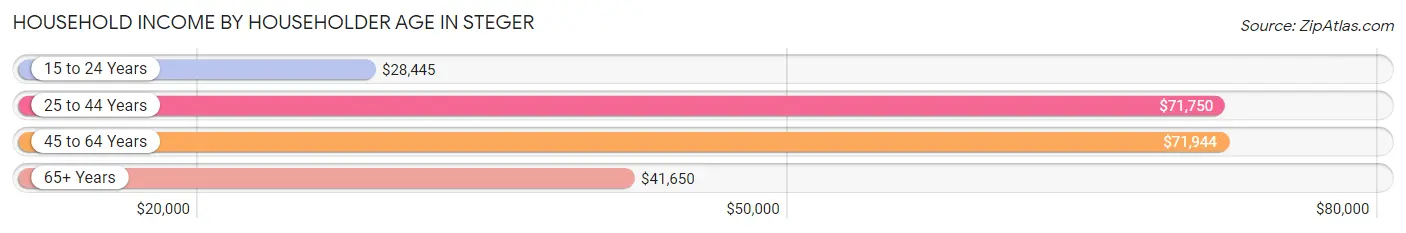
| Income Bracket | # Households | Median Income |
| 15 to 24 Years | 293 (7.2%) | $28,445 |
| 25 to 44 Years | 1,344 (33.2%) | $71,750 |
| 45 to 64 Years | 1,226 (30.3%) | $71,944 |
| 65+ Years | 1,187 (29.3%) | $41,650 |
| Total | 4,050 (100.0%) | $58,816 |
Poverty in Steger
Income Below Poverty by Sex and Age in Steger
With 13.3% poverty level for males and 14.7% for females among the residents of Steger, 15 year old males and under 5 year old females are the most vulnerable to poverty, with 20 males (64.5%) and 119 females (34.8%) in their respective age groups living below the poverty level.
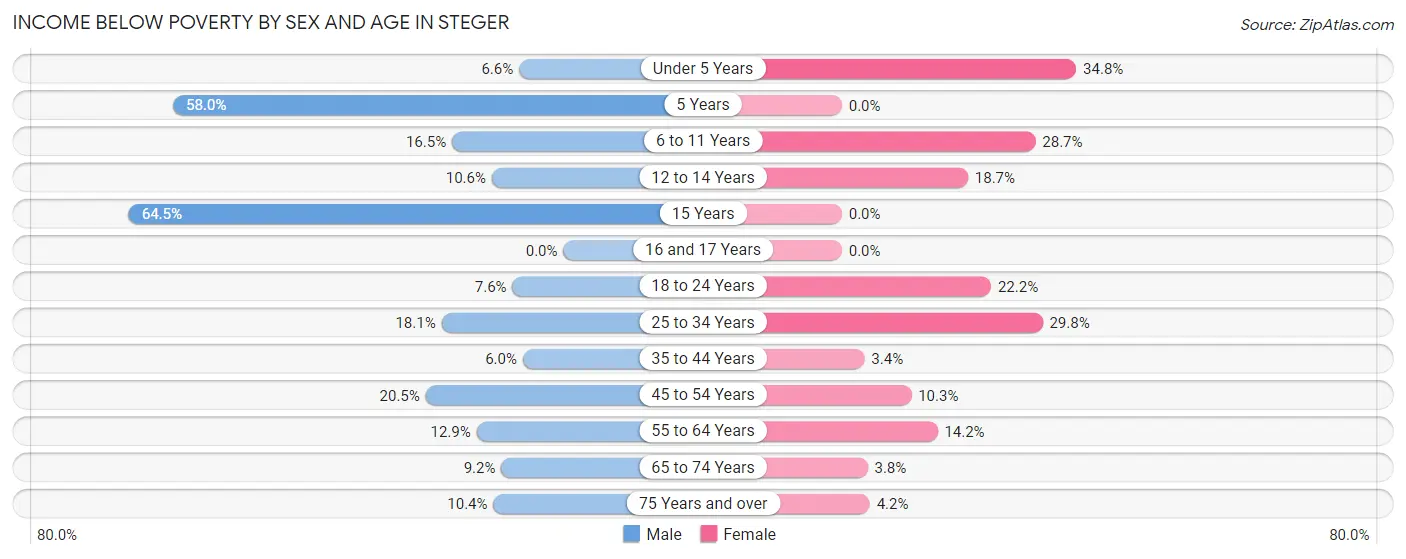
| Age Bracket | Male | Female |
| Under 5 Years | 15 (6.6%) | 119 (34.8%) |
| 5 Years | 51 (58.0%) | 0 (0.0%) |
| 6 to 11 Years | 66 (16.5%) | 96 (28.7%) |
| 12 to 14 Years | 22 (10.6%) | 38 (18.7%) |
| 15 Years | 20 (64.5%) | 0 (0.0%) |
| 16 and 17 Years | 0 (0.0%) | 0 (0.0%) |
| 18 to 24 Years | 39 (7.6%) | 99 (22.2%) |
| 25 to 34 Years | 116 (18.1%) | 152 (29.8%) |
| 35 to 44 Years | 40 (6.0%) | 24 (3.4%) |
| 45 to 54 Years | 153 (20.4%) | 46 (10.3%) |
| 55 to 64 Years | 50 (12.9%) | 69 (14.2%) |
| 65 to 74 Years | 49 (9.2%) | 25 (3.8%) |
| 75 Years and over | 29 (10.4%) | 11 (4.2%) |
| Total | 650 (13.3%) | 679 (14.7%) |
Income Above Poverty by Sex and Age in Steger
According to the poverty statistics in Steger, males aged 16 and 17 years and females aged 5 years are the age groups that are most secure financially, with 100.0% of males and 100.0% of females in these age groups living above the poverty line.
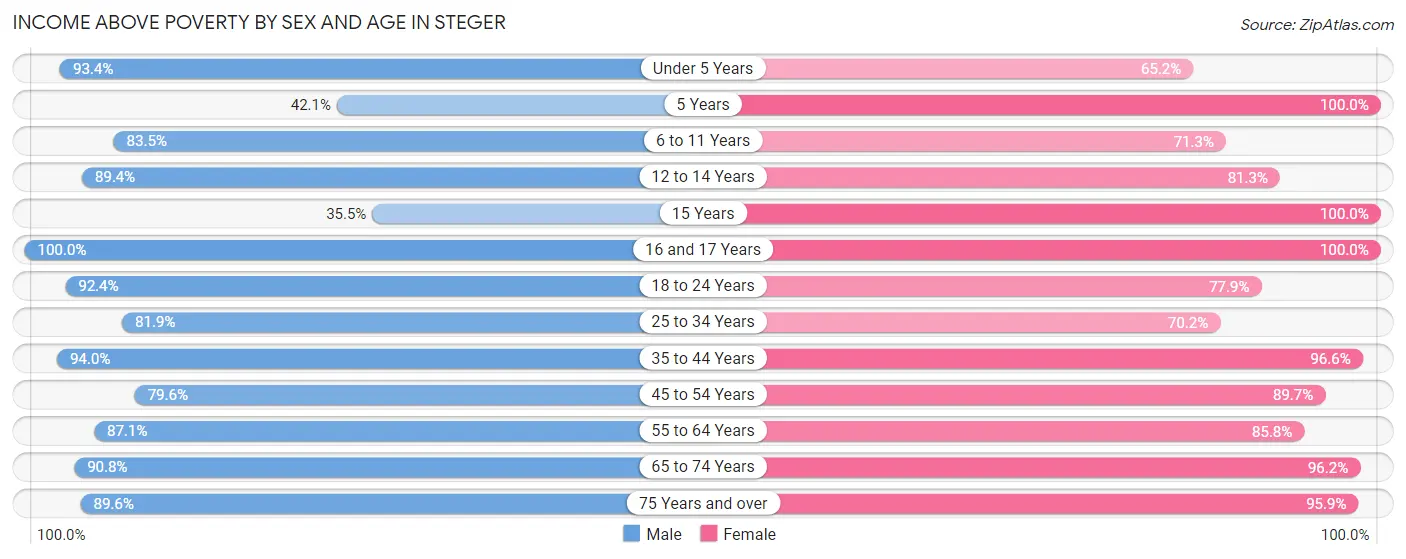
| Age Bracket | Male | Female |
| Under 5 Years | 213 (93.4%) | 223 (65.2%) |
| 5 Years | 37 (42.0%) | 77 (100.0%) |
| 6 to 11 Years | 333 (83.5%) | 238 (71.3%) |
| 12 to 14 Years | 185 (89.4%) | 165 (81.3%) |
| 15 Years | 11 (35.5%) | 121 (100.0%) |
| 16 and 17 Years | 150 (100.0%) | 27 (100.0%) |
| 18 to 24 Years | 477 (92.4%) | 348 (77.8%) |
| 25 to 34 Years | 525 (81.9%) | 358 (70.2%) |
| 35 to 44 Years | 624 (94.0%) | 690 (96.6%) |
| 45 to 54 Years | 595 (79.5%) | 400 (89.7%) |
| 55 to 64 Years | 338 (87.1%) | 417 (85.8%) |
| 65 to 74 Years | 483 (90.8%) | 630 (96.2%) |
| 75 Years and over | 250 (89.6%) | 254 (95.9%) |
| Total | 4,221 (86.7%) | 3,948 (85.3%) |
Income Below Poverty Among Married-Couple Families in Steger
The poverty statistics for married-couple families in Steger show that 5.8% or 88 of the total 1,520 families live below the poverty line. Families with 3 or 4 children have the highest poverty rate of 14.9%, comprising of 10 families. On the other hand, families with no children have the lowest poverty rate of 2.8%, which includes 23 families.
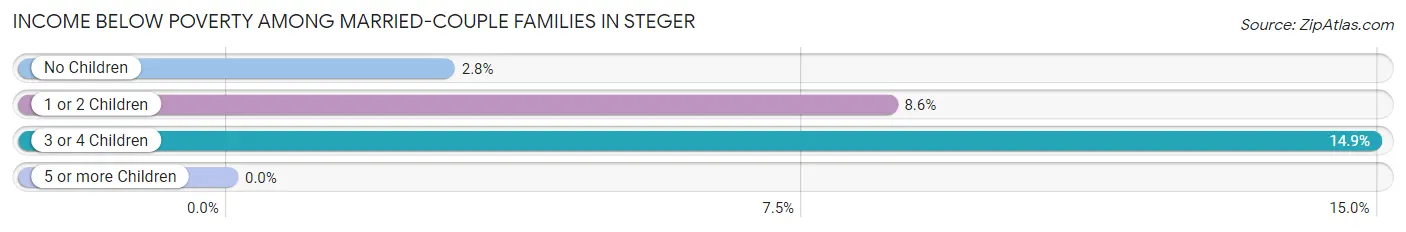
| Children | Above Poverty | Below Poverty |
| No Children | 791 (97.2%) | 23 (2.8%) |
| 1 or 2 Children | 584 (91.4%) | 55 (8.6%) |
| 3 or 4 Children | 57 (85.1%) | 10 (14.9%) |
| 5 or more Children | 0 (0.0%) | 0 (0.0%) |
| Total | 1,432 (94.2%) | 88 (5.8%) |
Income Below Poverty Among Single-Parent Households in Steger
According to the poverty data in Steger, 12.3% or 37 single-father households and 26.5% or 147 single-mother households are living below the poverty line. Among single-father households, those with no children have the highest poverty rate, with 21 households (25.6%) experiencing poverty. Likewise, among single-mother households, those with 3 or 4 children have the highest poverty rate, with 39 households (67.2%) falling below the poverty line.
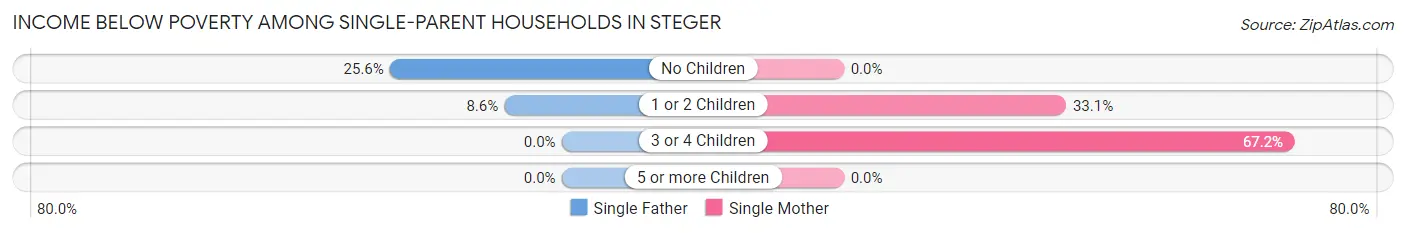
| Children | Single Father | Single Mother |
| No Children | 21 (25.6%) | 0 (0.0%) |
| 1 or 2 Children | 16 (8.6%) | 108 (33.1%) |
| 3 or 4 Children | 0 (0.0%) | 39 (67.2%) |
| 5 or more Children | 0 (0.0%) | 0 (0.0%) |
| Total | 37 (12.3%) | 147 (26.5%) |
Income Below Poverty Among Married-Couple vs Single-Parent Households in Steger
The poverty data for Steger shows that 88 of the married-couple family households (5.8%) and 184 of the single-parent households (21.5%) are living below the poverty level. Within the married-couple family households, those with 3 or 4 children have the highest poverty rate, with 10 households (14.9%) falling below the poverty line. Among the single-parent households, those with 3 or 4 children have the highest poverty rate, with 39 household (43.8%) living below poverty.
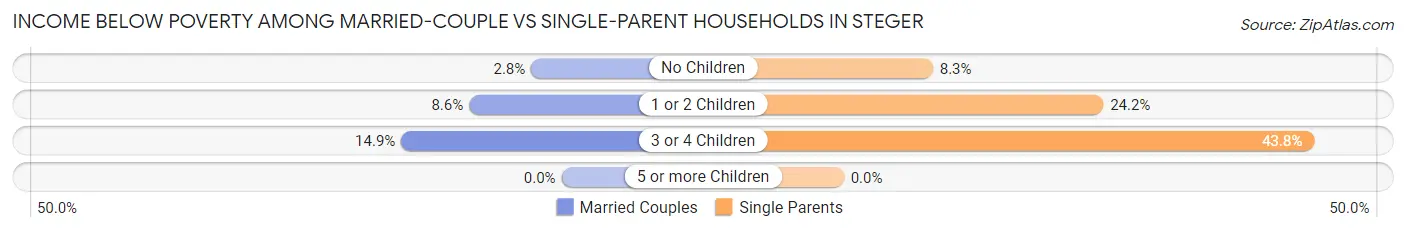
| Children | Married-Couple Families | Single-Parent Households |
| No Children | 23 (2.8%) | 21 (8.3%) |
| 1 or 2 Children | 55 (8.6%) | 124 (24.2%) |
| 3 or 4 Children | 10 (14.9%) | 39 (43.8%) |
| 5 or more Children | 0 (0.0%) | 0 (0.0%) |
| Total | 88 (5.8%) | 184 (21.5%) |
Race in Steger
The most populous races in Steger are White / Caucasian (6,178 | 64.9%), Hispanic or Latino (2,152 | 22.6%), and Black / African American (1,576 | 16.6%).
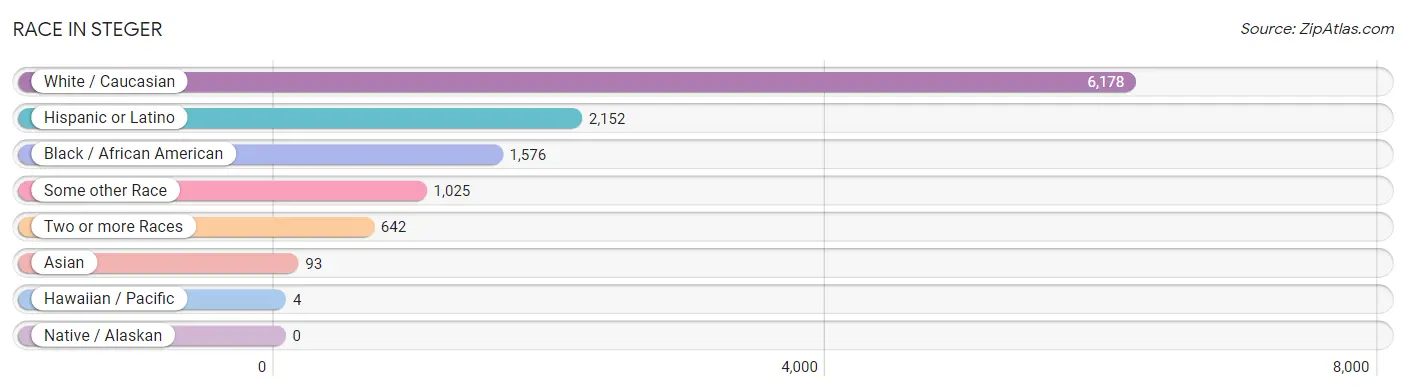
| Race | # Population | % Population |
| Asian | 93 | 1.0% |
| Black / African American | 1,576 | 16.6% |
| Hawaiian / Pacific | 4 | 0.0% |
| Hispanic or Latino | 2,152 | 22.6% |
| Native / Alaskan | 0 | 0.0% |
| White / Caucasian | 6,178 | 64.9% |
| Two or more Races | 642 | 6.8% |
| Some other Race | 1,025 | 10.8% |
| Total | 9,518 | 100.0% |
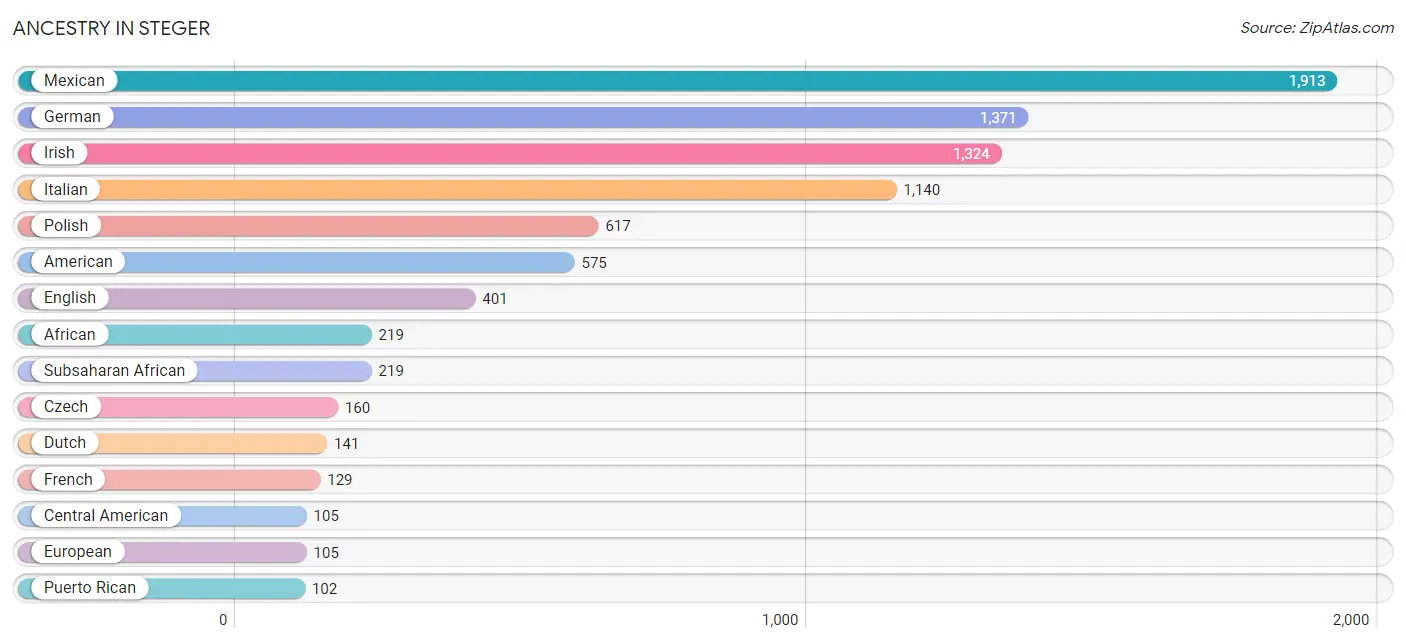
Ancestry in Steger
The most populous ancestries reported in Steger are Mexican (1,913 | 20.1%), German (1,371 | 14.4%), Irish (1,324 | 13.9%), Italian (1,140 | 12.0%), and Polish (617 | 6.5%), together accounting for 66.9% of all Steger residents.
| Ancestry | # Population | % Population |
| African | 219 | 2.3% |
| American | 575 | 6.0% |
| Armenian | 58 | 0.6% |
| Barbadian | 51 | 0.5% |
| British | 6 | 0.1% |
| Burmese | 85 | 0.9% |
| Central American | 105 | 1.1% |
| Cherokee | 27 | 0.3% |
| Choctaw | 10 | 0.1% |
| Croatian | 16 | 0.2% |
| Cuban | 32 | 0.3% |
| Czech | 160 | 1.7% |
| Danish | 27 | 0.3% |
| Dutch | 141 | 1.5% |
| Eastern European | 10 | 0.1% |
| English | 401 | 4.2% |
| European | 105 | 1.1% |
| Finnish | 5 | 0.1% |
| French | 129 | 1.4% |
| French Canadian | 11 | 0.1% |
| German | 1,371 | 14.4% |
| Guamanian / Chamorro | 4 | 0.0% |
| Honduran | 11 | 0.1% |
| Irish | 1,324 | 13.9% |
| Italian | 1,140 | 12.0% |
| Korean | 17 | 0.2% |
| Lithuanian | 43 | 0.4% |
| Menominee | 38 | 0.4% |
| Mexican | 1,913 | 20.1% |
| Native Hawaiian | 14 | 0.2% |
| Norwegian | 11 | 0.1% |
| Polish | 617 | 6.5% |
| Puerto Rican | 102 | 1.1% |
| Russian | 39 | 0.4% |
| Salvadoran | 94 | 1.0% |
| Scotch-Irish | 55 | 0.6% |
| Scottish | 54 | 0.6% |
| Sri Lankan | 4 | 0.0% |
| Subsaharan African | 219 | 2.3% |
| Swedish | 101 | 1.1% |
| Welsh | 12 | 0.1% | View All 41 Rows |
Immigrants in Steger
The most numerous immigrant groups reported in Steger came from Central America (331 | 3.5%), Latin America (331 | 3.5%), Mexico (298 | 3.1%), Europe (129 | 1.4%), and Eastern Europe (116 | 1.2%), together accounting for 12.7% of all Steger residents.
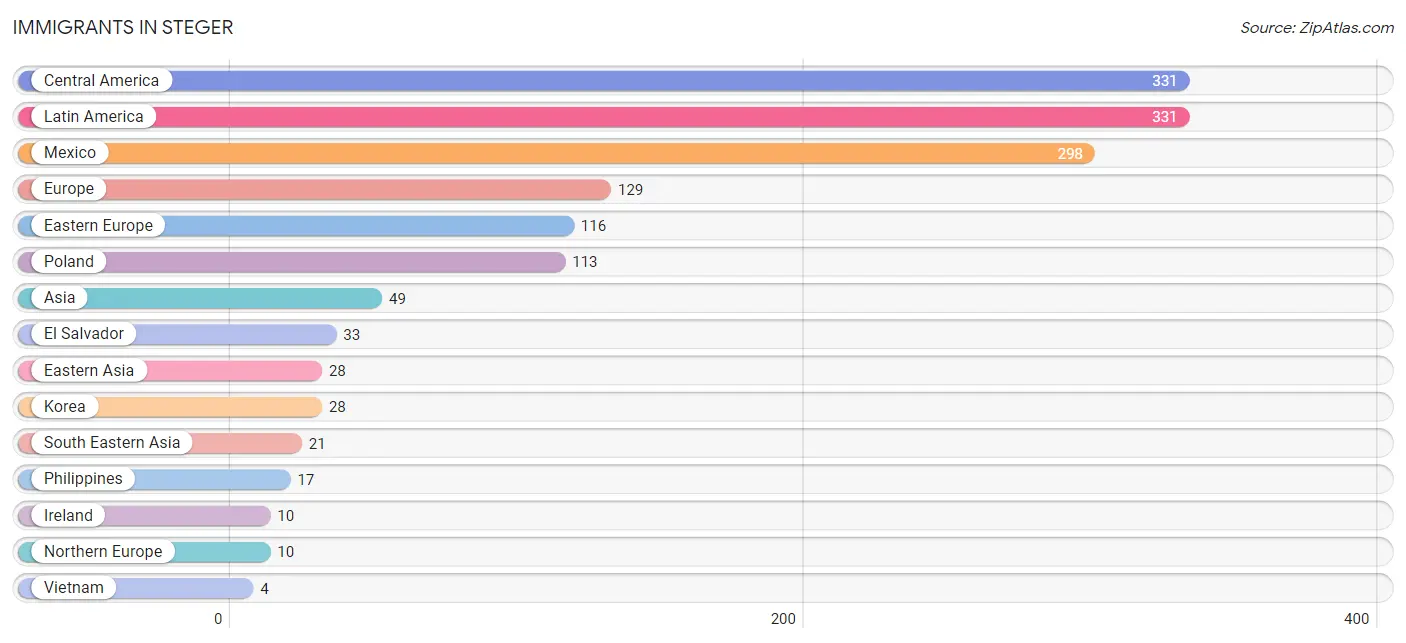
| Immigration Origin | # Population | % Population |
| Africa | 3 | 0.0% |
| Asia | 49 | 0.5% |
| Central America | 331 | 3.5% |
| Croatia | 3 | 0.0% |
| Eastern Asia | 28 | 0.3% |
| Eastern Europe | 116 | 1.2% |
| El Salvador | 33 | 0.4% |
| Europe | 129 | 1.4% |
| Germany | 3 | 0.0% |
| Ghana | 3 | 0.0% |
| Ireland | 10 | 0.1% |
| Korea | 28 | 0.3% |
| Latin America | 331 | 3.5% |
| Mexico | 298 | 3.1% |
| Northern Europe | 10 | 0.1% |
| Philippines | 17 | 0.2% |
| Poland | 113 | 1.2% |
| South Eastern Asia | 21 | 0.2% |
| Vietnam | 4 | 0.0% |
| Western Africa | 3 | 0.0% |
| Western Europe | 3 | 0.0% | View All 21 Rows |
Sex and Age in Steger
Sex and Age in Steger
The most populous age groups in Steger are 15 to 19 Years (417 | 8.6%) for men and 40 to 44 Years (458 | 9.9%) for women.
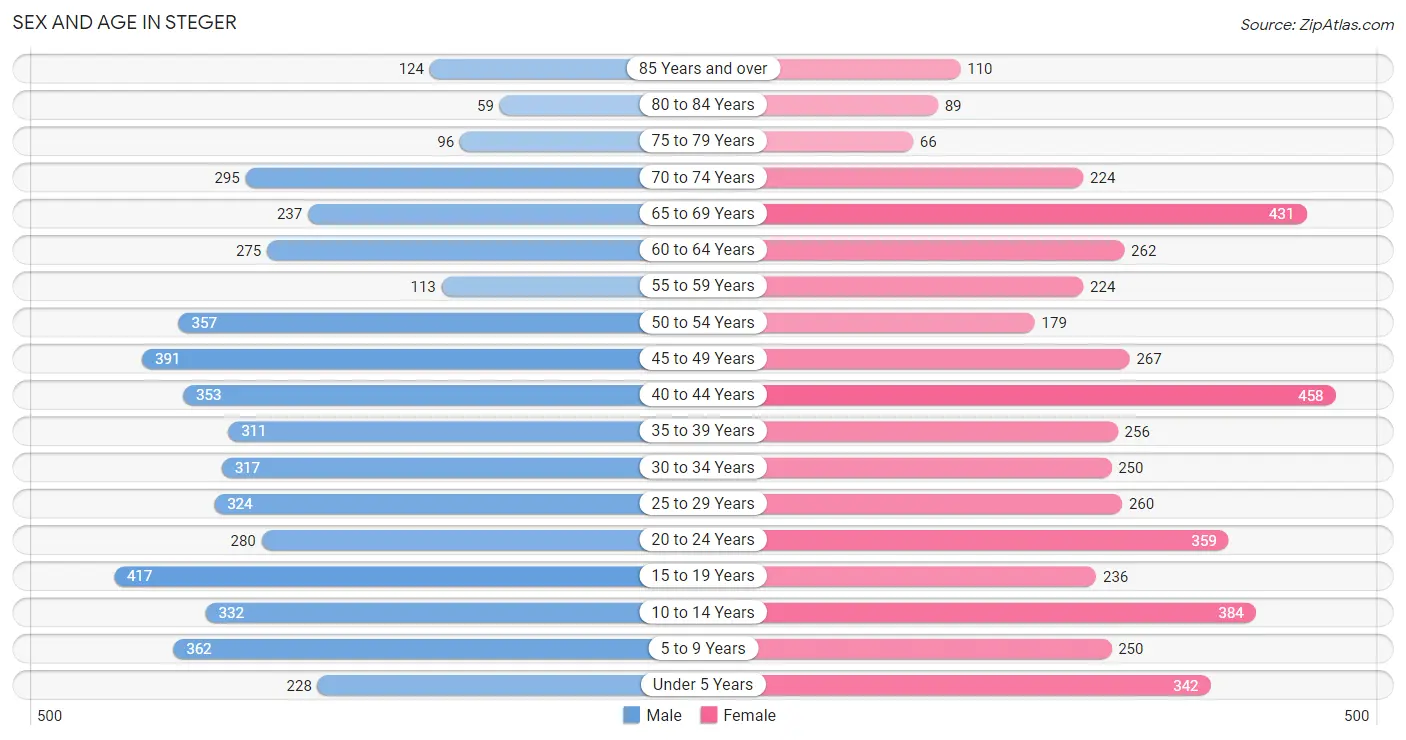
| Age Bracket | Male | Female |
| Under 5 Years | 228 (4.7%) | 342 (7.4%) |
| 5 to 9 Years | 362 (7.4%) | 250 (5.4%) |
| 10 to 14 Years | 332 (6.8%) | 384 (8.3%) |
| 15 to 19 Years | 417 (8.6%) | 236 (5.1%) |
| 20 to 24 Years | 280 (5.8%) | 359 (7.7%) |
| 25 to 29 Years | 324 (6.7%) | 260 (5.6%) |
| 30 to 34 Years | 317 (6.5%) | 250 (5.4%) |
| 35 to 39 Years | 311 (6.4%) | 256 (5.5%) |
| 40 to 44 Years | 353 (7.2%) | 458 (9.9%) |
| 45 to 49 Years | 391 (8.0%) | 267 (5.8%) |
| 50 to 54 Years | 357 (7.3%) | 179 (3.8%) |
| 55 to 59 Years | 113 (2.3%) | 224 (4.8%) |
| 60 to 64 Years | 275 (5.7%) | 262 (5.6%) |
| 65 to 69 Years | 237 (4.9%) | 431 (9.3%) |
| 70 to 74 Years | 295 (6.1%) | 224 (4.8%) |
| 75 to 79 Years | 96 (2.0%) | 66 (1.4%) |
| 80 to 84 Years | 59 (1.2%) | 89 (1.9%) |
| 85 Years and over | 124 (2.5%) | 110 (2.4%) |
| Total | 4,871 (100.0%) | 4,647 (100.0%) |
Families and Households in Steger
Median Family Size in Steger
The median family size in Steger is 3.11 persons per family, with married-couple families (1,520 | 64.0%) accounting for the largest median family size of 3.34 persons per family. On the other hand, single female/mother families (555 | 23.4%) represent the smallest median family size with 2.60 persons per family.
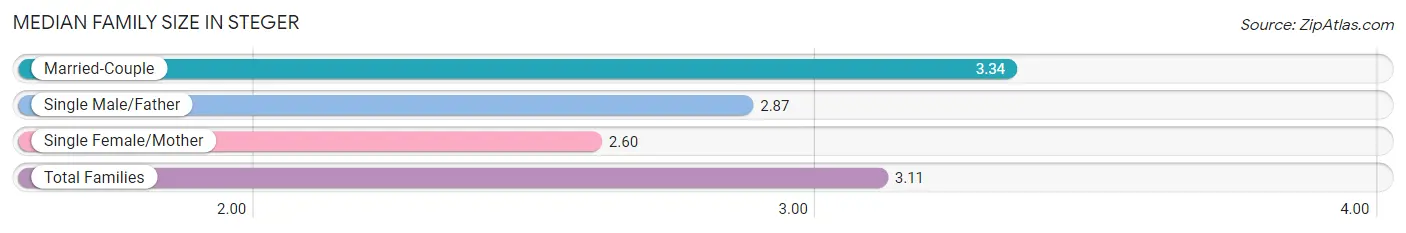
| Family Type | # Families | Family Size |
| Married-Couple | 1,520 (64.0%) | 3.34 |
| Single Male/Father | 300 (12.6%) | 2.87 |
| Single Female/Mother | 555 (23.4%) | 2.60 |
| Total Families | 2,375 (100.0%) | 3.11 |
Median Household Size in Steger
The median household size in Steger is 2.35 persons per household, with married-couple households (1,520 | 37.5%) accounting for the largest median household size of 3.38 persons per household. non-family households (1,675 | 41.4%) represent the smallest median household size with 1.13 persons per household.
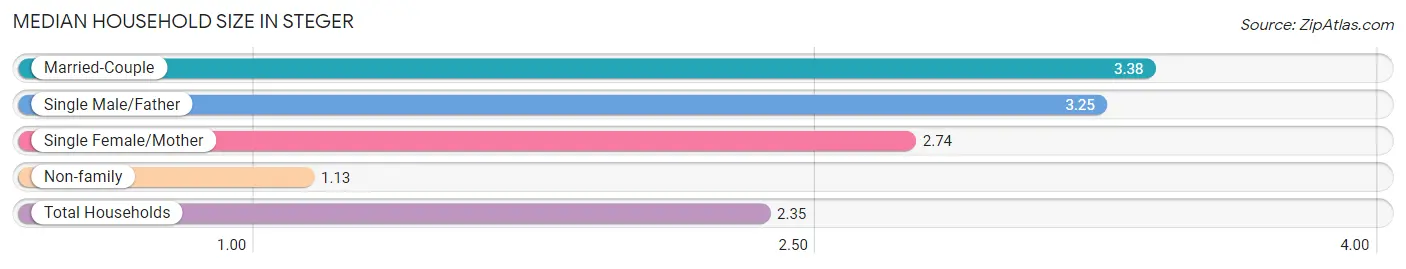
| Household Type | # Households | Household Size |
| Married-Couple | 1,520 (37.5%) | 3.38 |
| Single Male/Father | 300 (7.4%) | 3.25 |
| Single Female/Mother | 555 (13.7%) | 2.74 |
| Non-family | 1,675 (41.4%) | 1.13 |
| Total Households | 4,050 (100.0%) | 2.35 |
Household Size by Marriage Status in Steger
Out of a total of 4,050 households in Steger, 2,375 (58.6%) are family households, while 1,675 (41.4%) are nonfamily households. The most numerous type of family households are 2-person households, comprising 1,009, and the most common type of nonfamily households are 1-person households, comprising 1,477.
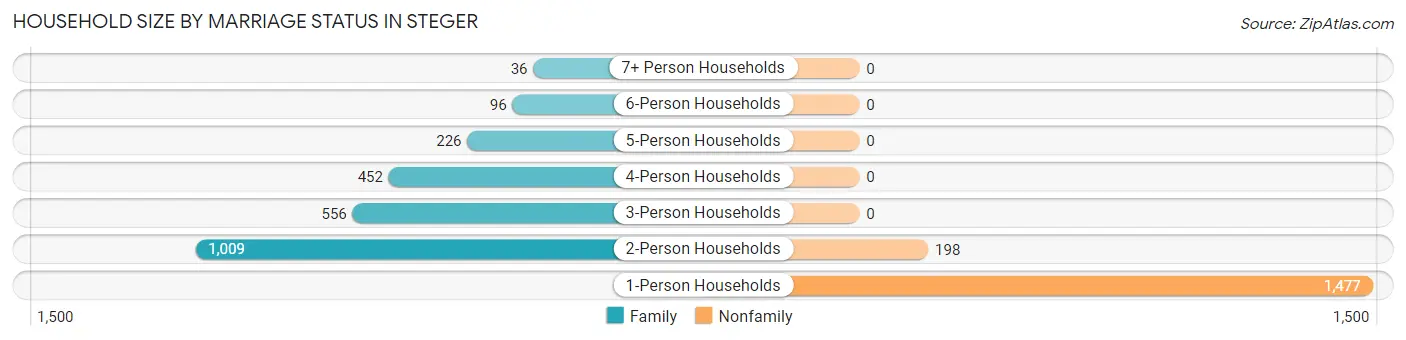
| Household Size | Family Households | Nonfamily Households |
| 1-Person Households | - | 1,477 (36.5%) |
| 2-Person Households | 1,009 (24.9%) | 198 (4.9%) |
| 3-Person Households | 556 (13.7%) | 0 (0.0%) |
| 4-Person Households | 452 (11.2%) | 0 (0.0%) |
| 5-Person Households | 226 (5.6%) | 0 (0.0%) |
| 6-Person Households | 96 (2.4%) | 0 (0.0%) |
| 7+ Person Households | 36 (0.9%) | 0 (0.0%) |
| Total | 2,375 (58.6%) | 1,675 (41.4%) |
Female Fertility in Steger
Fertility by Age in Steger
Average fertility rate in Steger is 103.0 births per 1,000 women. Women in the age bracket of 20 to 34 years have the highest fertility rate with 199.0 births per 1,000 women. Women in the age bracket of 20 to 34 years acount for 80.5% of all women with births.
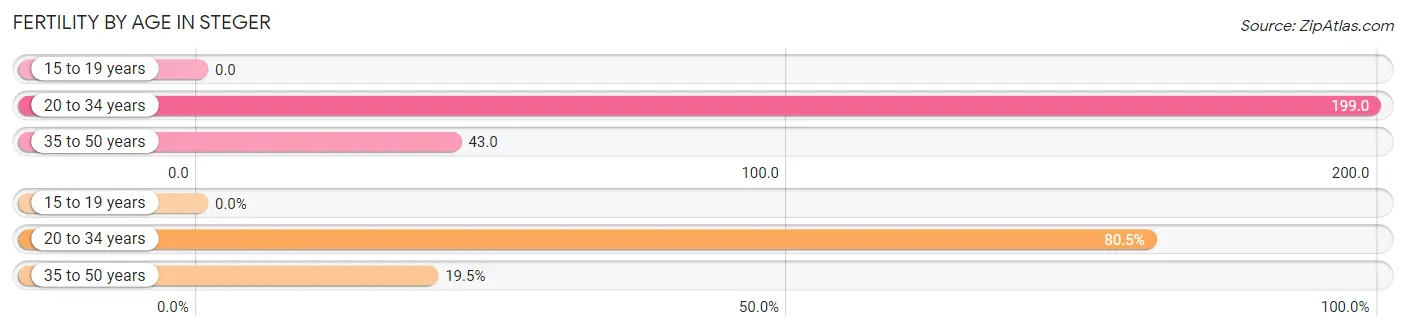
| Age Bracket | Women with Births | Births / 1,000 Women |
| 15 to 19 years | 0 (0.0%) | 0.0 |
| 20 to 34 years | 173 (80.5%) | 199.0 |
| 35 to 50 years | 42 (19.5%) | 43.0 |
| Total | 215 (100.0%) | 103.0 |
Fertility by Age by Marriage Status in Steger
60.0% of women with births (215) in Steger are married. The highest percentage of unmarried women with births falls into 20 to 34 years age bracket with 49.7% of them unmarried at the time of birth, while the lowest percentage of unmarried women with births belong to 35 to 50 years age bracket with 0.0% of them unmarried.
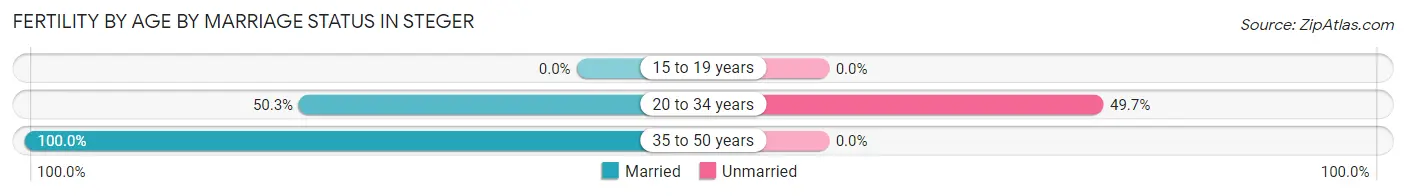
| Age Bracket | Married | Unmarried |
| 15 to 19 years | 0 (0.0%) | 0 (0.0%) |
| 20 to 34 years | 87 (50.3%) | 86 (49.7%) |
| 35 to 50 years | 42 (100.0%) | 0 (0.0%) |
| Total | 129 (60.0%) | 86 (40.0%) |
Fertility by Education in Steger
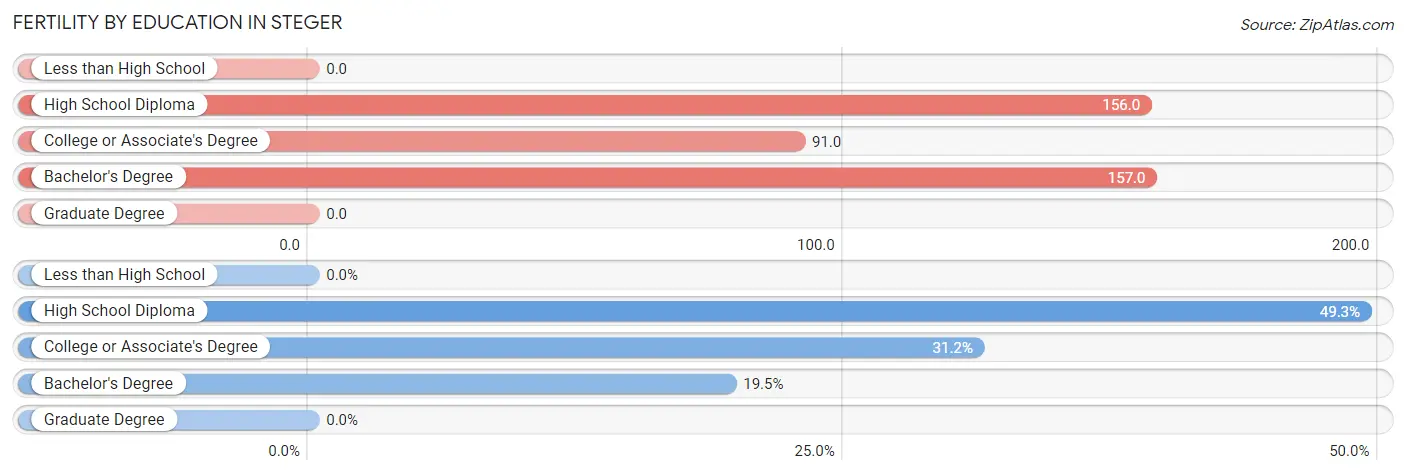
| Educational Attainment | Women with Births | Births / 1,000 Women |
| Less than High School | 0 (0.0%) | 0.0 |
| High School Diploma | 106 (49.3%) | 156.0 |
| College or Associate's Degree | 67 (31.2%) | 91.0 |
| Bachelor's Degree | 42 (19.5%) | 157.0 |
| Graduate Degree | 0 (0.0%) | 0.0 |
| Total | 215 (100.0%) | 103.0 |
Fertility by Education by Marriage Status in Steger
40.0% of women with births in Steger are unmarried. Women with the educational attainment of college or associate's degree are most likely to be married with 100.0% of them married at childbirth, while women with the educational attainment of high school diploma are least likely to be married with 81.1% of them unmarried at childbirth.
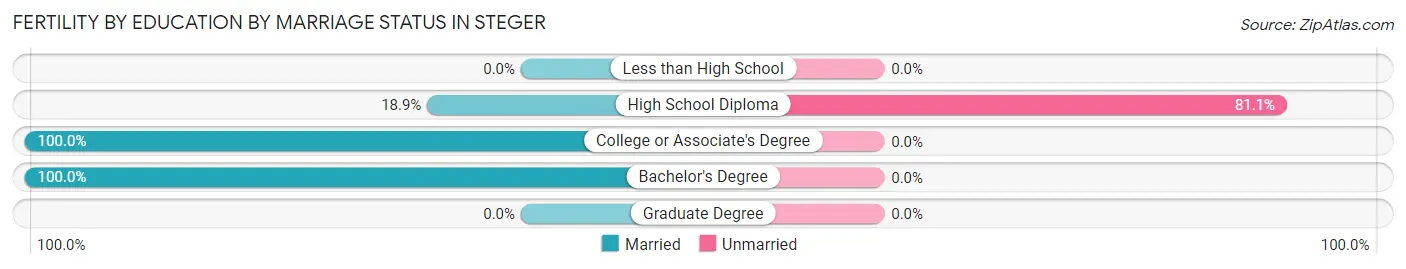
| Educational Attainment | Married | Unmarried |
| Less than High School | 0 (0.0%) | 0 (0.0%) |
| High School Diploma | 20 (18.9%) | 86 (81.1%) |
| College or Associate's Degree | 67 (100.0%) | 0 (0.0%) |
| Bachelor's Degree | 42 (100.0%) | 0 (0.0%) |
| Graduate Degree | 0 (0.0%) | 0 (0.0%) |
| Total | 129 (60.0%) | 86 (40.0%) |
Employment Characteristics in Steger
Employment by Class of Employer in Steger
Among the 4,266 employed individuals in Steger, private company employees (3,120 | 73.1%), local government employees (355 | 8.3%), and not-for-profit organizations (245 | 5.7%) make up the most common classes of employment.
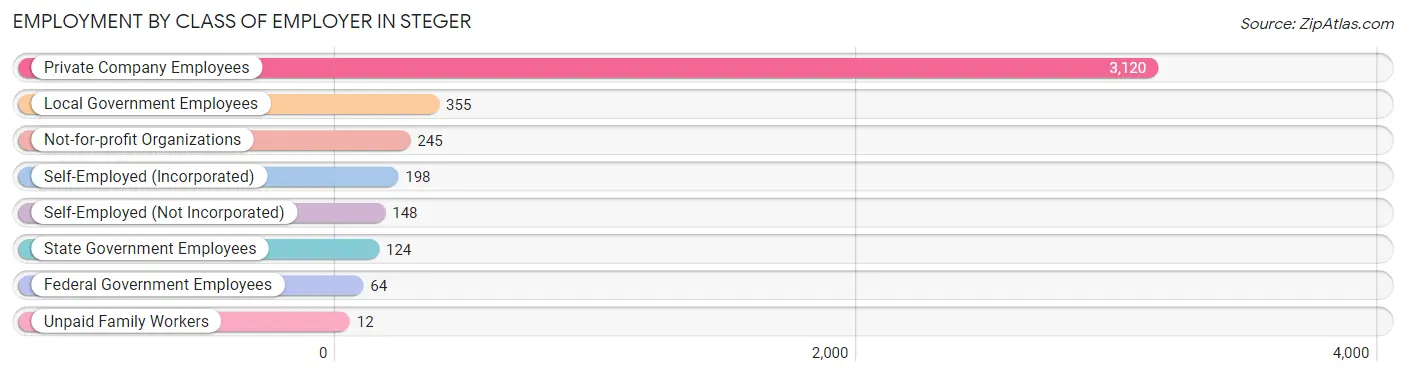
| Employer Class | # Employees | % Employees |
| Private Company Employees | 3,120 | 73.1% |
| Self-Employed (Incorporated) | 198 | 4.6% |
| Self-Employed (Not Incorporated) | 148 | 3.5% |
| Not-for-profit Organizations | 245 | 5.7% |
| Local Government Employees | 355 | 8.3% |
| State Government Employees | 124 | 2.9% |
| Federal Government Employees | 64 | 1.5% |
| Unpaid Family Workers | 12 | 0.3% |
| Total | 4,266 | 100.0% |
Employment Status by Age in Steger
According to the labor force statistics for Steger, out of the total population over 16 years of age (7,468), 61.5% or 4,593 individuals are in the labor force, with 4.5% or 207 of them unemployed. The age group with the highest labor force participation rate is 30 to 34 years, with 92.4% or 524 individuals in the labor force. Within the labor force, the 25 to 29 years age range has the highest percentage of unemployed individuals, with 12.6% or 54 of them being unemployed.
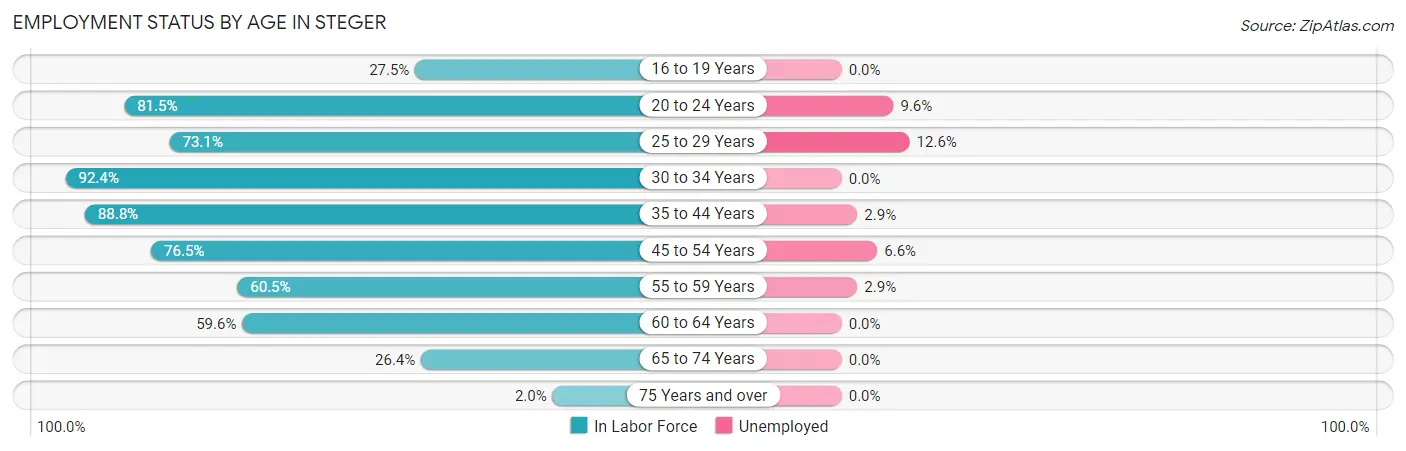
| Age Bracket | In Labor Force | Unemployed |
| 16 to 19 Years | 138 (27.5%) | 0 (0.0%) |
| 20 to 24 Years | 521 (81.5%) | 50 (9.6%) |
| 25 to 29 Years | 427 (73.1%) | 54 (12.6%) |
| 30 to 34 Years | 524 (92.4%) | 0 (0.0%) |
| 35 to 44 Years | 1,224 (88.8%) | 35 (2.9%) |
| 45 to 54 Years | 913 (76.5%) | 60 (6.6%) |
| 55 to 59 Years | 204 (60.5%) | 6 (2.9%) |
| 60 to 64 Years | 320 (59.6%) | 0 (0.0%) |
| 65 to 74 Years | 313 (26.4%) | 0 (0.0%) |
| 75 Years and over | 11 (2.0%) | 0 (0.0%) |
| Total | 4,593 (61.5%) | 207 (4.5%) |
Employment Status by Educational Attainment in Steger
According to labor force statistics for Steger, 78.6% of individuals (3,613) out of the total population between 25 and 64 years of age (4,597) are in the labor force, with 4.3% or 155 of them being unemployed. The group with the highest labor force participation rate are those with the educational attainment of bachelor's degree or higher, with 89.5% or 752 individuals in the labor force. Within the labor force, individuals with college / associate degree education have the highest percentage of unemployment, with 6.0% or 86 of them being unemployed.
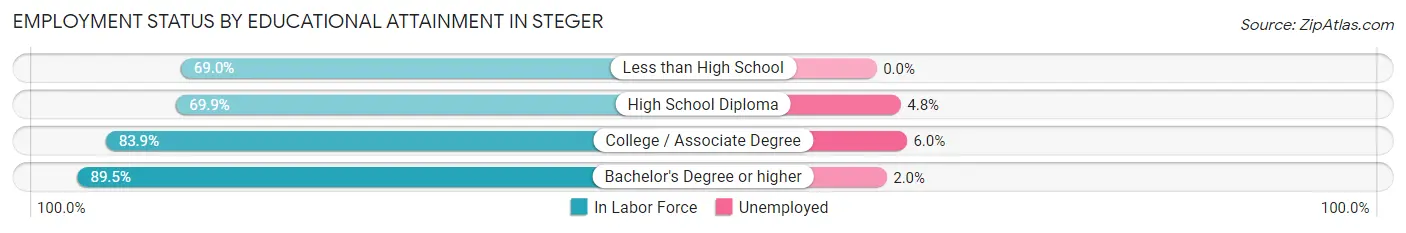
| Educational Attainment | In Labor Force | Unemployed |
| Less than High School | 319 (69.0%) | 0 (0.0%) |
| High School Diploma | 1,116 (69.9%) | 77 (4.8%) |
| College / Associate Degree | 1,425 (83.9%) | 102 (6.0%) |
| Bachelor's Degree or higher | 752 (89.5%) | 17 (2.0%) |
| Total | 3,613 (78.6%) | 198 (4.3%) |
Employment Occupations by Sex in Steger
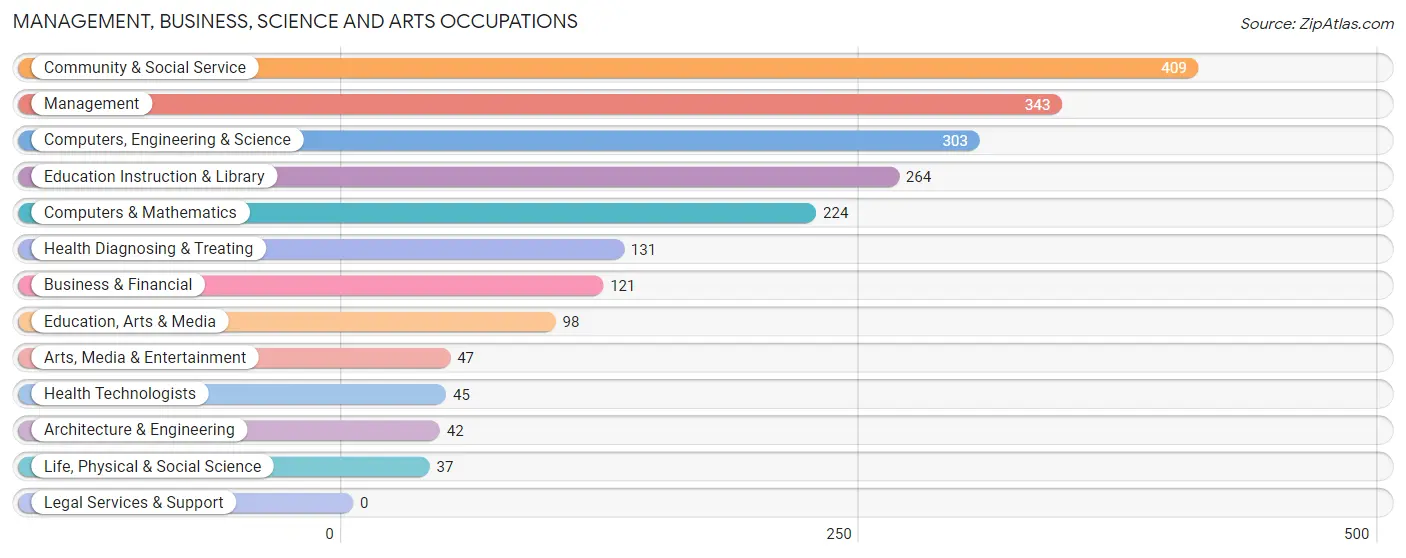
Management, Business, Science and Arts Occupations
The most common Management, Business, Science and Arts occupations in Steger are Community & Social Service (409 | 9.3%), Management (343 | 7.8%), Computers, Engineering & Science (303 | 6.9%), Education Instruction & Library (264 | 6.0%), and Computers & Mathematics (224 | 5.1%).
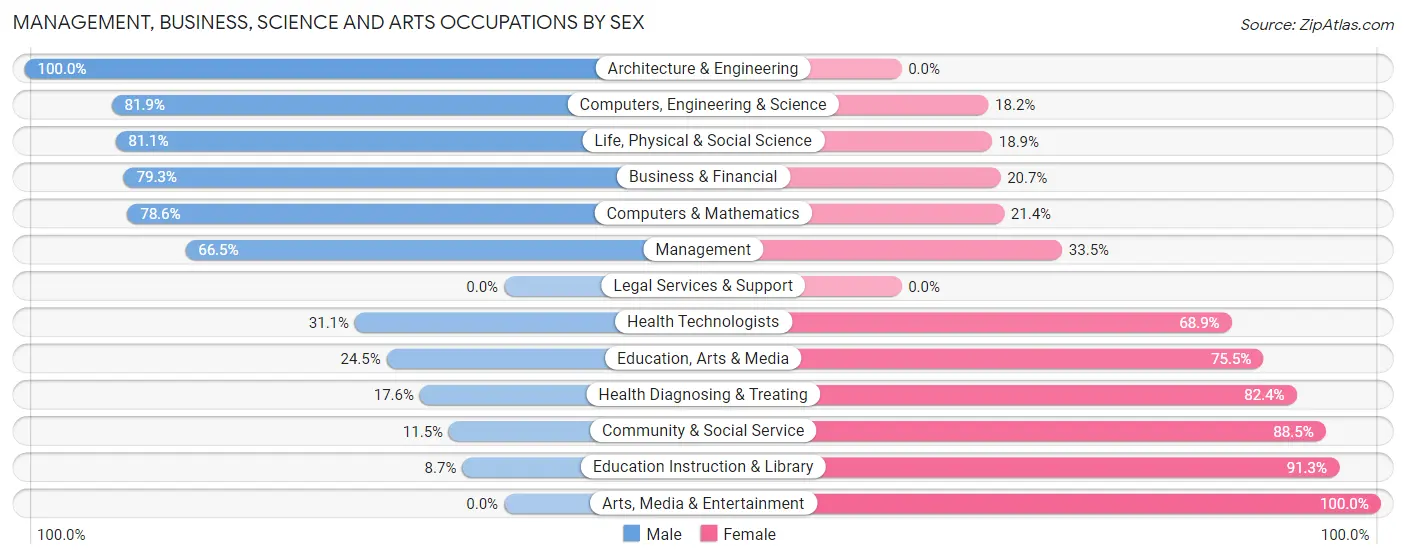
Management, Business, Science and Arts Occupations by Sex
Within the Management, Business, Science and Arts occupations in Steger, the most male-oriented occupations are Architecture & Engineering (100.0%), Computers, Engineering & Science (81.9%), and Life, Physical & Social Science (81.1%), while the most female-oriented occupations are Arts, Media & Entertainment (100.0%), Education Instruction & Library (91.3%), and Community & Social Service (88.5%).
| Occupation | Male | Female |
| Management | 228 (66.5%) | 115 (33.5%) |
| Business & Financial | 96 (79.3%) | 25 (20.7%) |
| Computers, Engineering & Science | 248 (81.9%) | 55 (18.1%) |
| Computers & Mathematics | 176 (78.6%) | 48 (21.4%) |
| Architecture & Engineering | 42 (100.0%) | 0 (0.0%) |
| Life, Physical & Social Science | 30 (81.1%) | 7 (18.9%) |
| Community & Social Service | 47 (11.5%) | 362 (88.5%) |
| Education, Arts & Media | 24 (24.5%) | 74 (75.5%) |
| Legal Services & Support | 0 (0.0%) | 0 (0.0%) |
| Education Instruction & Library | 23 (8.7%) | 241 (91.3%) |
| Arts, Media & Entertainment | 0 (0.0%) | 47 (100.0%) |
| Health Diagnosing & Treating | 23 (17.6%) | 108 (82.4%) |
| Health Technologists | 14 (31.1%) | 31 (68.9%) |
| Total (Category) | 642 (49.1%) | 665 (50.9%) |
| Total (Overall) | 2,291 (52.2%) | 2,099 (47.8%) |
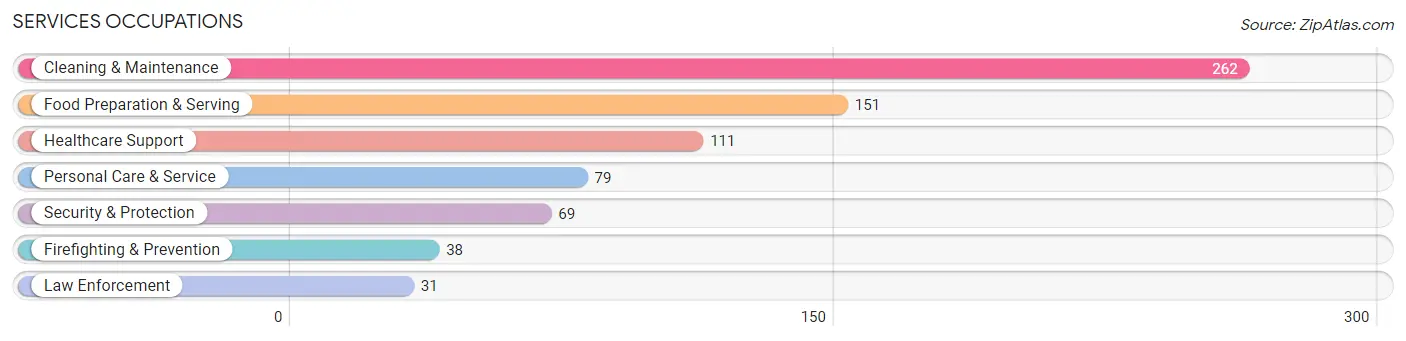
Services Occupations
The most common Services occupations in Steger are Cleaning & Maintenance (262 | 6.0%), Food Preparation & Serving (151 | 3.4%), Healthcare Support (111 | 2.5%), Personal Care & Service (79 | 1.8%), and Security & Protection (69 | 1.6%).
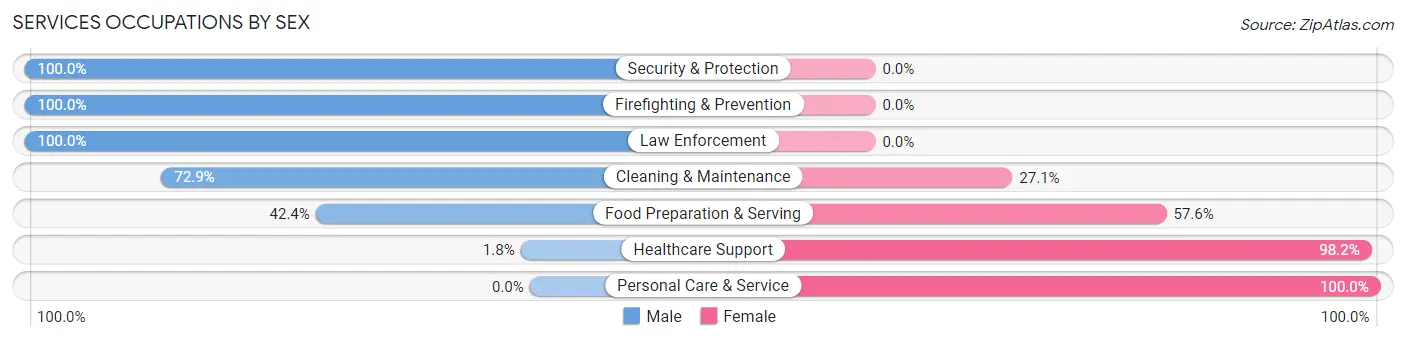
Services Occupations by Sex
Within the Services occupations in Steger, the most male-oriented occupations are Security & Protection (100.0%), Firefighting & Prevention (100.0%), and Law Enforcement (100.0%), while the most female-oriented occupations are Personal Care & Service (100.0%), Healthcare Support (98.2%), and Food Preparation & Serving (57.6%).
| Occupation | Male | Female |
| Healthcare Support | 2 (1.8%) | 109 (98.2%) |
| Security & Protection | 69 (100.0%) | 0 (0.0%) |
| Firefighting & Prevention | 38 (100.0%) | 0 (0.0%) |
| Law Enforcement | 31 (100.0%) | 0 (0.0%) |
| Food Preparation & Serving | 64 (42.4%) | 87 (57.6%) |
| Cleaning & Maintenance | 191 (72.9%) | 71 (27.1%) |
| Personal Care & Service | 0 (0.0%) | 79 (100.0%) |
| Total (Category) | 326 (48.5%) | 346 (51.5%) |
| Total (Overall) | 2,291 (52.2%) | 2,099 (47.8%) |
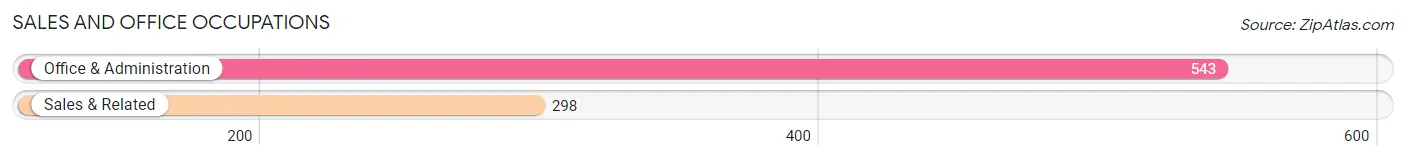
Sales and Office Occupations
The most common Sales and Office occupations in Steger are Office & Administration (543 | 12.4%), and Sales & Related (298 | 6.8%).
Sales and Office Occupations by Sex
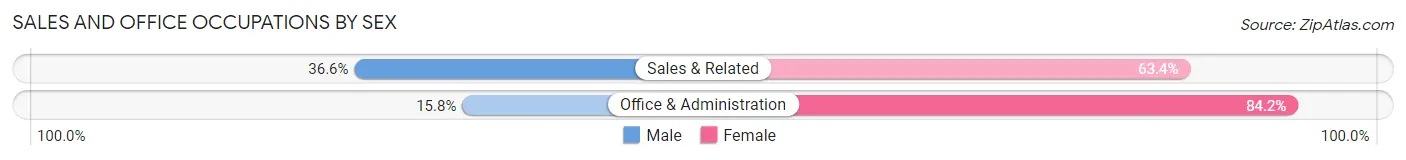
| Occupation | Male | Female |
| Sales & Related | 109 (36.6%) | 189 (63.4%) |
| Office & Administration | 86 (15.8%) | 457 (84.2%) |
| Total (Category) | 195 (23.2%) | 646 (76.8%) |
| Total (Overall) | 2,291 (52.2%) | 2,099 (47.8%) |
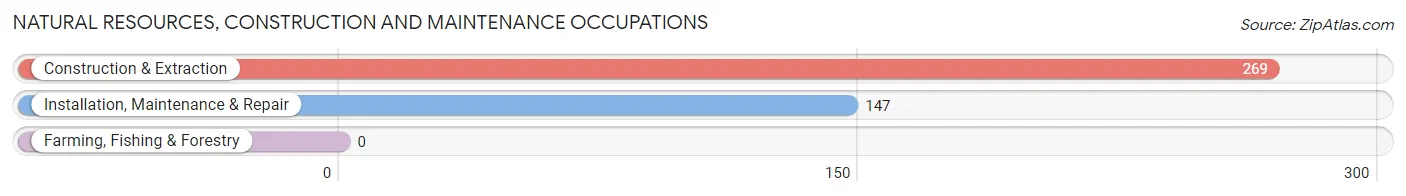
Natural Resources, Construction and Maintenance Occupations
The most common Natural Resources, Construction and Maintenance occupations in Steger are Construction & Extraction (269 | 6.1%), and Installation, Maintenance & Repair (147 | 3.4%).
Natural Resources, Construction and Maintenance Occupations by Sex
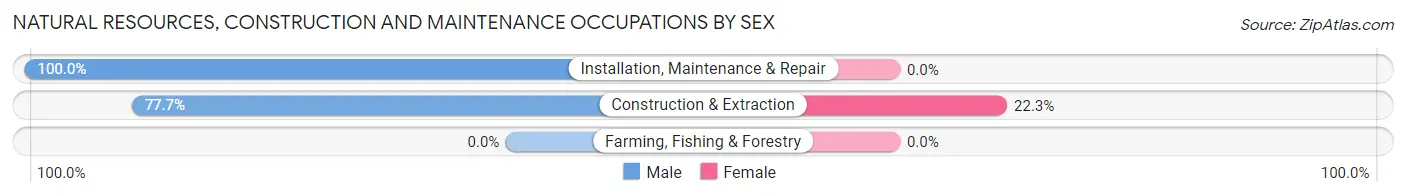
| Occupation | Male | Female |
| Farming, Fishing & Forestry | 0 (0.0%) | 0 (0.0%) |
| Construction & Extraction | 209 (77.7%) | 60 (22.3%) |
| Installation, Maintenance & Repair | 147 (100.0%) | 0 (0.0%) |
| Total (Category) | 356 (85.6%) | 60 (14.4%) |
| Total (Overall) | 2,291 (52.2%) | 2,099 (47.8%) |
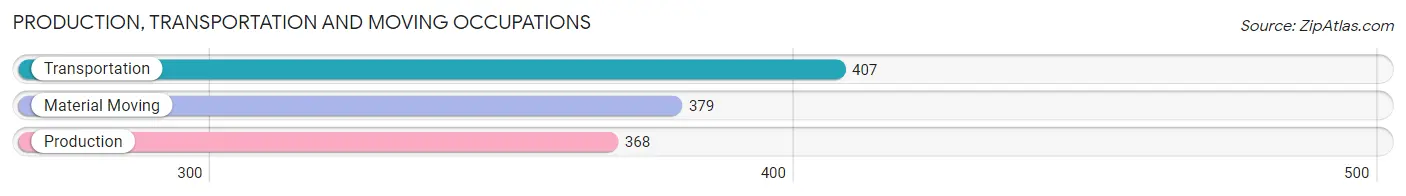
Production, Transportation and Moving Occupations
The most common Production, Transportation and Moving occupations in Steger are Transportation (407 | 9.3%), Material Moving (379 | 8.6%), and Production (368 | 8.4%).
Production, Transportation and Moving Occupations by Sex
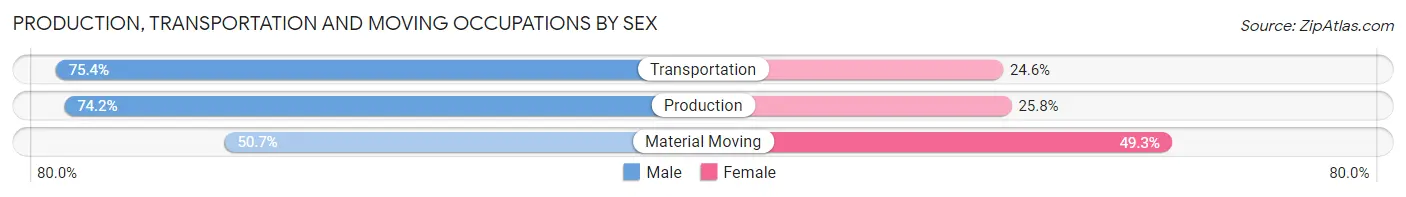
| Occupation | Male | Female |
| Production | 273 (74.2%) | 95 (25.8%) |
| Transportation | 307 (75.4%) | 100 (24.6%) |
| Material Moving | 192 (50.7%) | 187 (49.3%) |
| Total (Category) | 772 (66.9%) | 382 (33.1%) |
| Total (Overall) | 2,291 (52.2%) | 2,099 (47.8%) |
Employment Industries by Sex in Steger
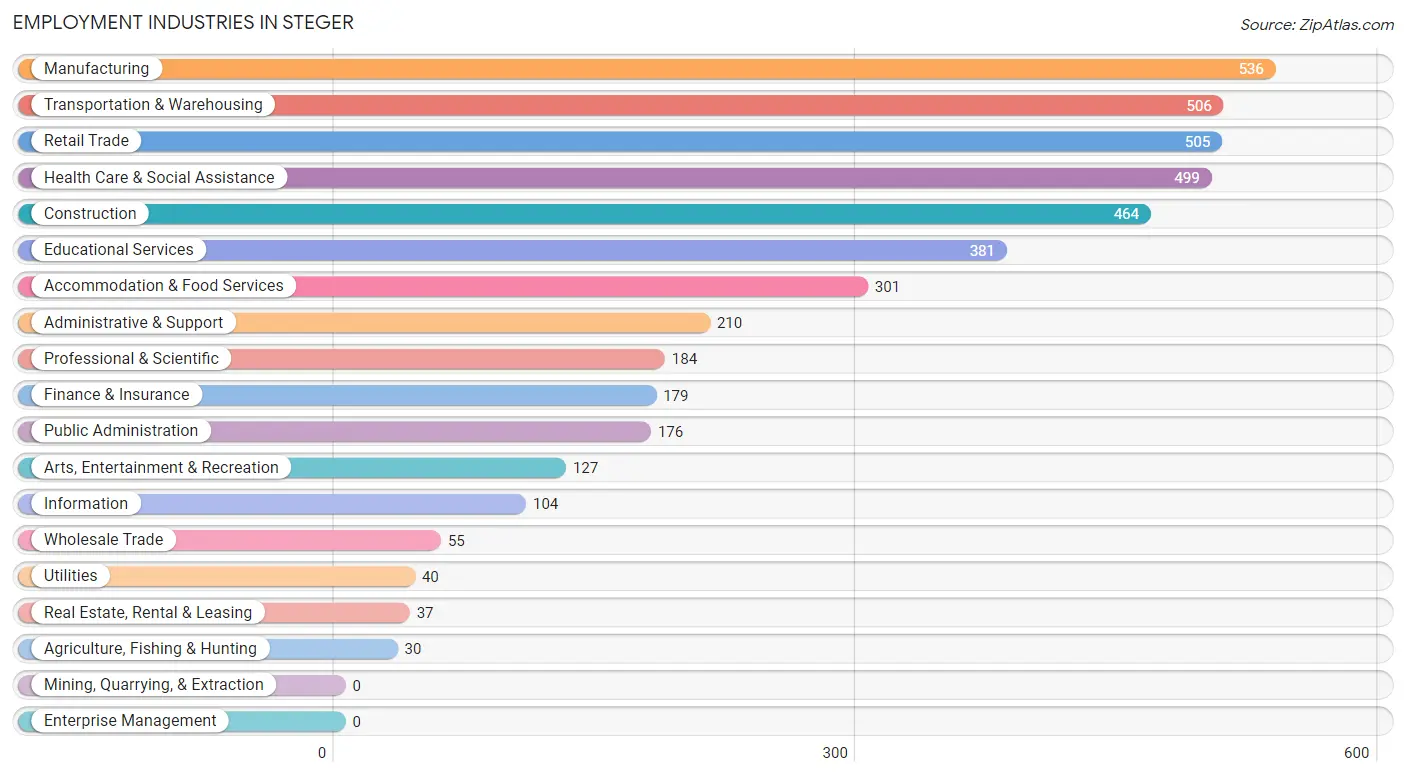
Employment Industries in Steger
The major employment industries in Steger include Manufacturing (536 | 12.2%), Transportation & Warehousing (506 | 11.5%), Retail Trade (505 | 11.5%), Health Care & Social Assistance (499 | 11.4%), and Construction (464 | 10.6%).
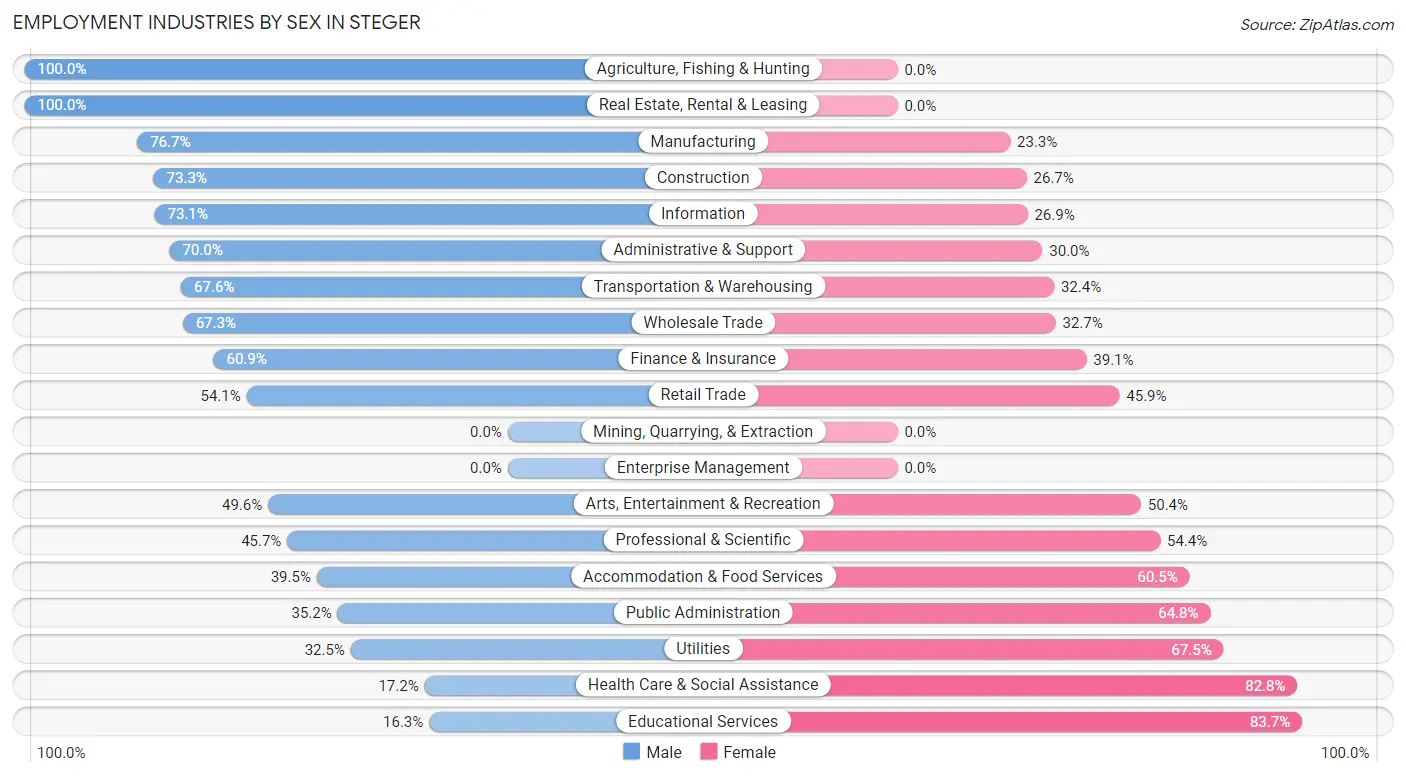
Employment Industries by Sex in Steger
The Steger industries that see more men than women are Agriculture, Fishing & Hunting (100.0%), Real Estate, Rental & Leasing (100.0%), and Manufacturing (76.7%), whereas the industries that tend to have a higher number of women are Educational Services (83.7%), Health Care & Social Assistance (82.8%), and Utilities (67.5%).
| Industry | Male | Female |
| Agriculture, Fishing & Hunting | 30 (100.0%) | 0 (0.0%) |
| Mining, Quarrying, & Extraction | 0 (0.0%) | 0 (0.0%) |
| Construction | 340 (73.3%) | 124 (26.7%) |
| Manufacturing | 411 (76.7%) | 125 (23.3%) |
| Wholesale Trade | 37 (67.3%) | 18 (32.7%) |
| Retail Trade | 273 (54.1%) | 232 (45.9%) |
| Transportation & Warehousing | 342 (67.6%) | 164 (32.4%) |
| Utilities | 13 (32.5%) | 27 (67.5%) |
| Information | 76 (73.1%) | 28 (26.9%) |
| Finance & Insurance | 109 (60.9%) | 70 (39.1%) |
| Real Estate, Rental & Leasing | 37 (100.0%) | 0 (0.0%) |
| Professional & Scientific | 84 (45.7%) | 100 (54.3%) |
| Enterprise Management | 0 (0.0%) | 0 (0.0%) |
| Administrative & Support | 147 (70.0%) | 63 (30.0%) |
| Educational Services | 62 (16.3%) | 319 (83.7%) |
| Health Care & Social Assistance | 86 (17.2%) | 413 (82.8%) |
| Arts, Entertainment & Recreation | 63 (49.6%) | 64 (50.4%) |
| Accommodation & Food Services | 119 (39.5%) | 182 (60.5%) |
| Public Administration | 62 (35.2%) | 114 (64.8%) |
| Total | 2,291 (52.2%) | 2,099 (47.8%) |
Education in Steger
School Enrollment in Steger
The most common levels of schooling among the 2,194 students in Steger are middle school (598 | 27.3%), high school (507 | 23.1%), and college / undergraduate (373 | 17.0%).
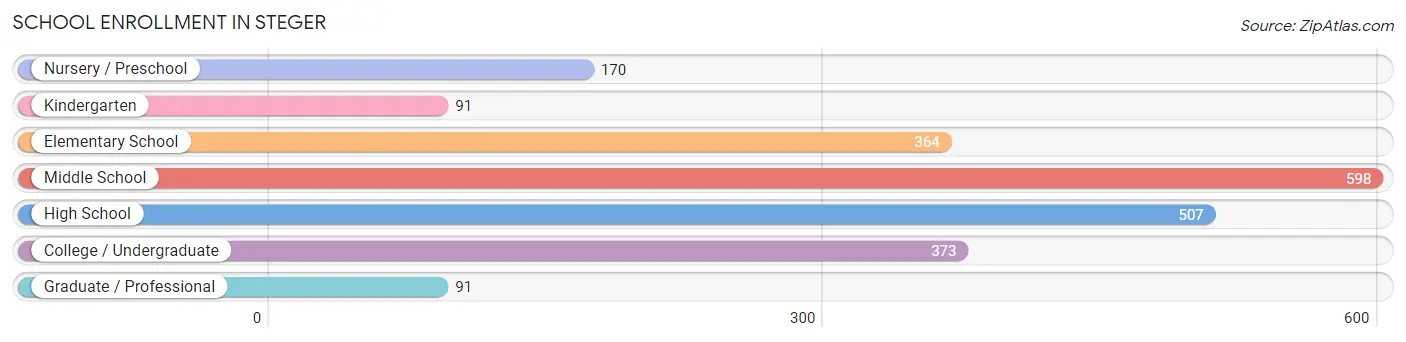
| School Level | # Students | % Students |
| Nursery / Preschool | 170 | 7.7% |
| Kindergarten | 91 | 4.2% |
| Elementary School | 364 | 16.6% |
| Middle School | 598 | 27.3% |
| High School | 507 | 23.1% |
| College / Undergraduate | 373 | 17.0% |
| Graduate / Professional | 91 | 4.2% |
| Total | 2,194 | 100.0% |
School Enrollment by Age by Funding Source in Steger
Out of a total of 2,194 students who are enrolled in schools in Steger, 476 (21.7%) attend a private institution, while the remaining 1,718 (78.3%) are enrolled in public schools. The age group of 15 to 17 year olds has the highest likelihood of being enrolled in private schools, with 152 (46.2% in the age bracket) enrolled. Conversely, the age group of 3 to 4 year olds has the lowest likelihood of being enrolled in a private school, with 95 (100.0% in the age bracket) attending a public institution.
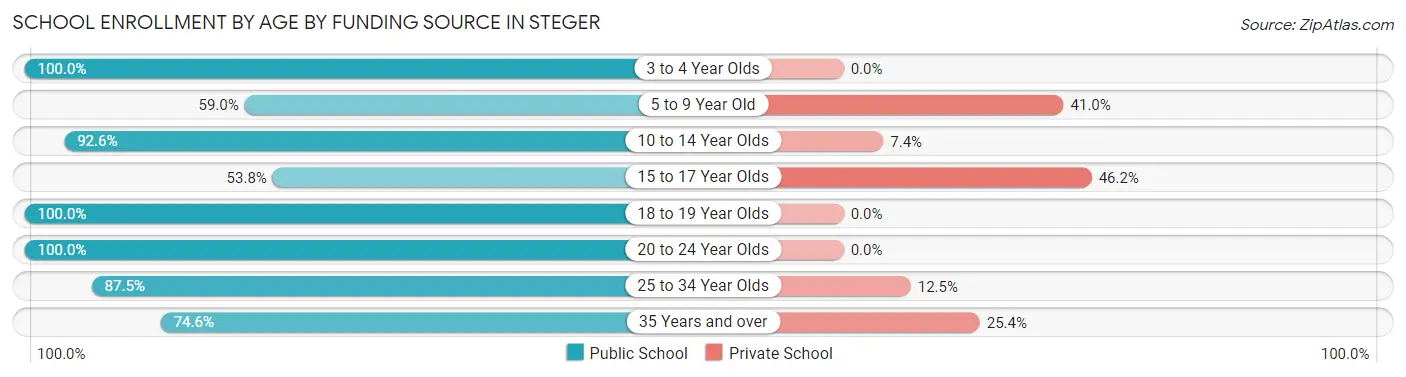
| Age Bracket | Public School | Private School |
| 3 to 4 Year Olds | 95 (100.0%) | 0 (0.0%) |
| 5 to 9 Year Old | 304 (59.0%) | 211 (41.0%) |
| 10 to 14 Year Olds | 627 (92.6%) | 50 (7.4%) |
| 15 to 17 Year Olds | 177 (53.8%) | 152 (46.2%) |
| 18 to 19 Year Olds | 149 (100.0%) | 0 (0.0%) |
| 20 to 24 Year Olds | 140 (100.0%) | 0 (0.0%) |
| 25 to 34 Year Olds | 70 (87.5%) | 10 (12.5%) |
| 35 Years and over | 156 (74.6%) | 53 (25.4%) |
| Total | 1,718 (78.3%) | 476 (21.7%) |
Educational Attainment by Field of Study in Steger
Education (346 | 30.2%), business (230 | 20.1%), computers & mathematics (147 | 12.8%), science & technology (136 | 11.9%), and communications (94 | 8.2%) are the most common fields of study among 1,147 individuals in Steger who have obtained a bachelor's degree or higher.
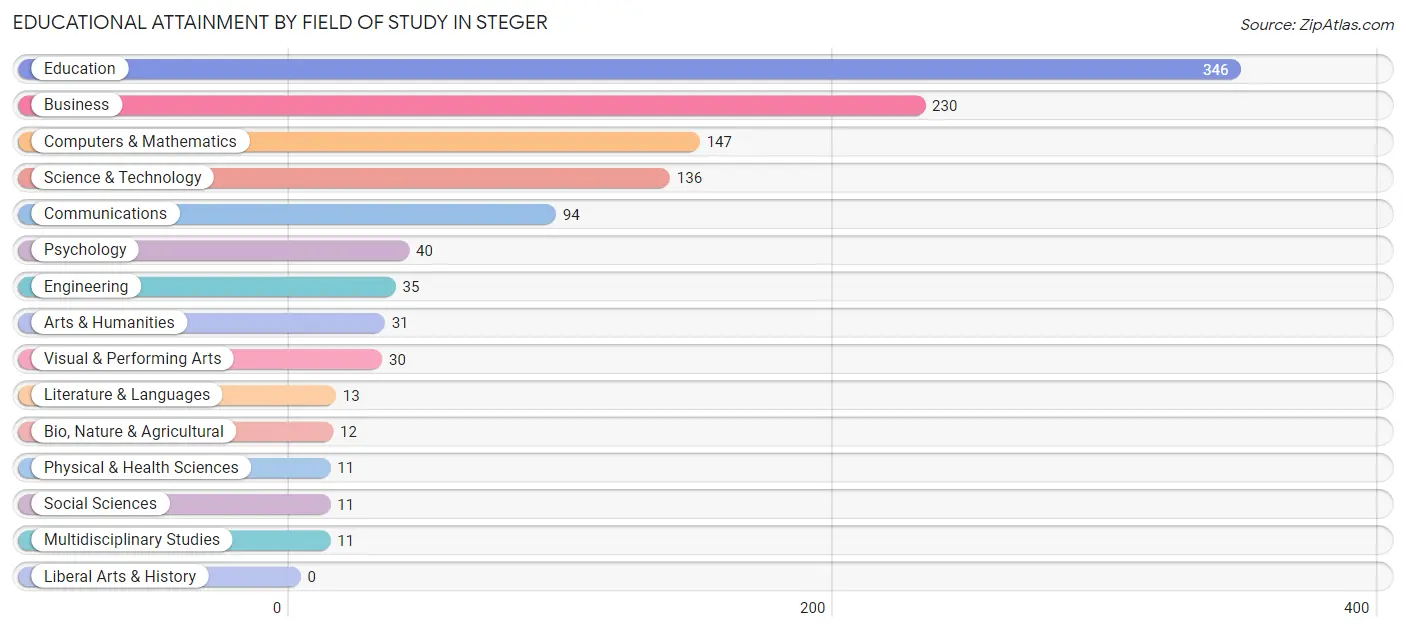
| Field of Study | # Graduates | % Graduates |
| Computers & Mathematics | 147 | 12.8% |
| Bio, Nature & Agricultural | 12 | 1.1% |
| Physical & Health Sciences | 11 | 1.0% |
| Psychology | 40 | 3.5% |
| Social Sciences | 11 | 1.0% |
| Engineering | 35 | 3.0% |
| Multidisciplinary Studies | 11 | 1.0% |
| Science & Technology | 136 | 11.9% |
| Business | 230 | 20.1% |
| Education | 346 | 30.2% |
| Literature & Languages | 13 | 1.1% |
| Liberal Arts & History | 0 | 0.0% |
| Visual & Performing Arts | 30 | 2.6% |
| Communications | 94 | 8.2% |
| Arts & Humanities | 31 | 2.7% |
| Total | 1,147 | 100.0% |
Transportation & Commute in Steger
Vehicle Availability by Sex in Steger
The most prevalent vehicle ownership categories in Steger are males with 2 vehicles (804, accounting for 35.9%) and females with 2 vehicles (612, making up 39.6%).
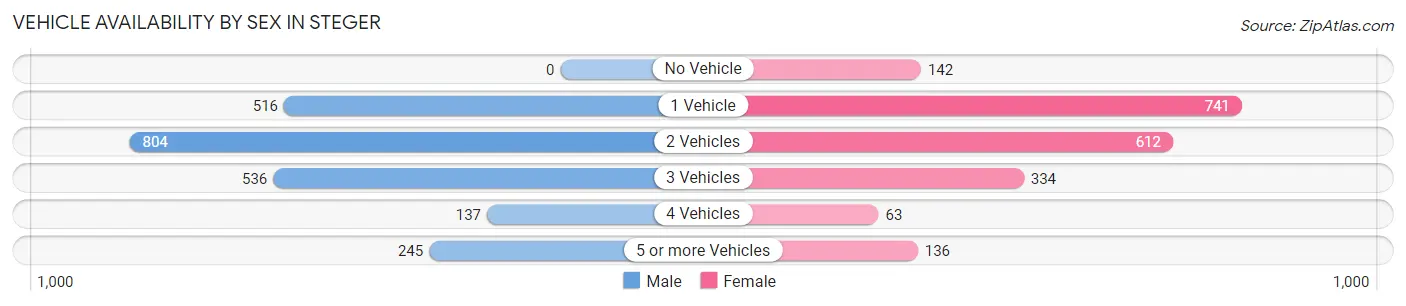
| Vehicles Available | Male | Female |
| No Vehicle | 0 (0.0%) | 142 (7.0%) |
| 1 Vehicle | 516 (23.1%) | 741 (36.5%) |
| 2 Vehicles | 804 (35.9%) | 612 (30.2%) |
| 3 Vehicles | 536 (23.9%) | 334 (16.5%) |
| 4 Vehicles | 137 (6.1%) | 63 (3.1%) |
| 5 or more Vehicles | 245 (11.0%) | 136 (6.7%) |
| Total | 2,238 (100.0%) | 2,028 (100.0%) |
Commute Time in Steger
The most frequently occuring commute durations in Steger are 30 to 34 minutes (643 commuters, 16.6%), 45 to 59 minutes (513 commuters, 13.2%), and 60 to 89 minutes (435 commuters, 11.2%).
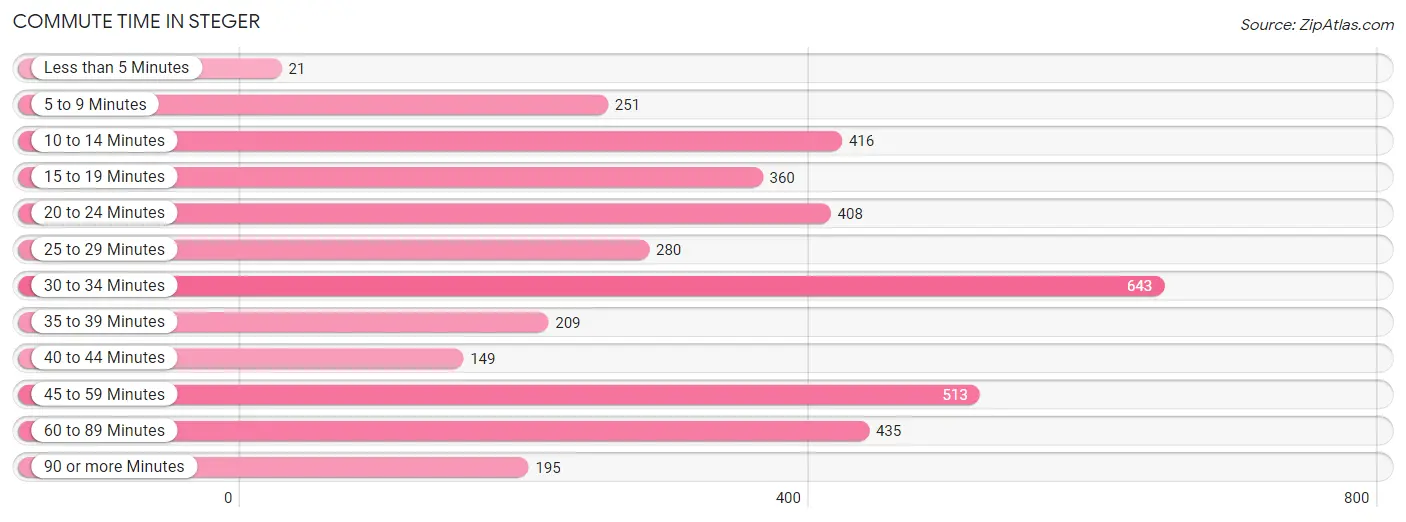
| Commute Time | # Commuters | % Commuters |
| Less than 5 Minutes | 21 | 0.5% |
| 5 to 9 Minutes | 251 | 6.5% |
| 10 to 14 Minutes | 416 | 10.7% |
| 15 to 19 Minutes | 360 | 9.3% |
| 20 to 24 Minutes | 408 | 10.5% |
| 25 to 29 Minutes | 280 | 7.2% |
| 30 to 34 Minutes | 643 | 16.6% |
| 35 to 39 Minutes | 209 | 5.4% |
| 40 to 44 Minutes | 149 | 3.8% |
| 45 to 59 Minutes | 513 | 13.2% |
| 60 to 89 Minutes | 435 | 11.2% |
| 90 or more Minutes | 195 | 5.0% |
Commute Time by Sex in Steger
The most common commute times in Steger are 30 to 34 minutes (320 commuters, 16.1%) for males and 30 to 34 minutes (323 commuters, 17.1%) for females.
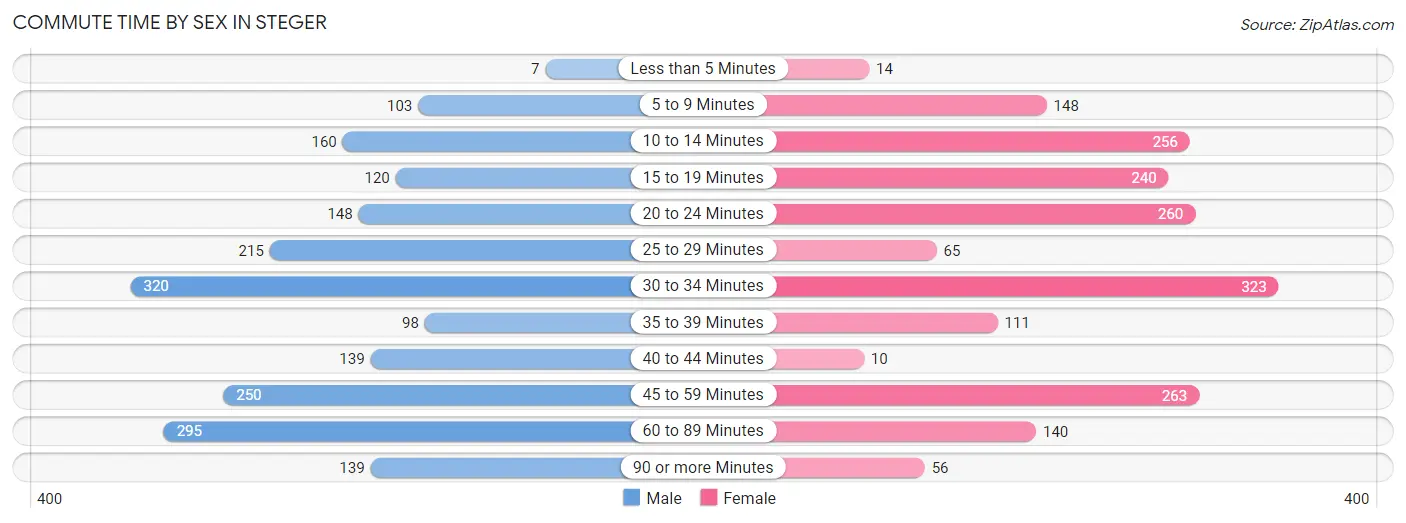
| Commute Time | Male | Female |
| Less than 5 Minutes | 7 (0.4%) | 14 (0.7%) |
| 5 to 9 Minutes | 103 (5.2%) | 148 (7.9%) |
| 10 to 14 Minutes | 160 (8.0%) | 256 (13.6%) |
| 15 to 19 Minutes | 120 (6.0%) | 240 (12.7%) |
| 20 to 24 Minutes | 148 (7.4%) | 260 (13.8%) |
| 25 to 29 Minutes | 215 (10.8%) | 65 (3.5%) |
| 30 to 34 Minutes | 320 (16.1%) | 323 (17.1%) |
| 35 to 39 Minutes | 98 (4.9%) | 111 (5.9%) |
| 40 to 44 Minutes | 139 (7.0%) | 10 (0.5%) |
| 45 to 59 Minutes | 250 (12.5%) | 263 (13.9%) |
| 60 to 89 Minutes | 295 (14.8%) | 140 (7.4%) |
| 90 or more Minutes | 139 (7.0%) | 56 (3.0%) |
Time of Departure to Work by Sex in Steger
The most frequent times of departure to work in Steger are 12:00 PM to 3:59 PM (287, 14.4%) for males and 7:30 AM to 7:59 AM (356, 18.9%) for females.
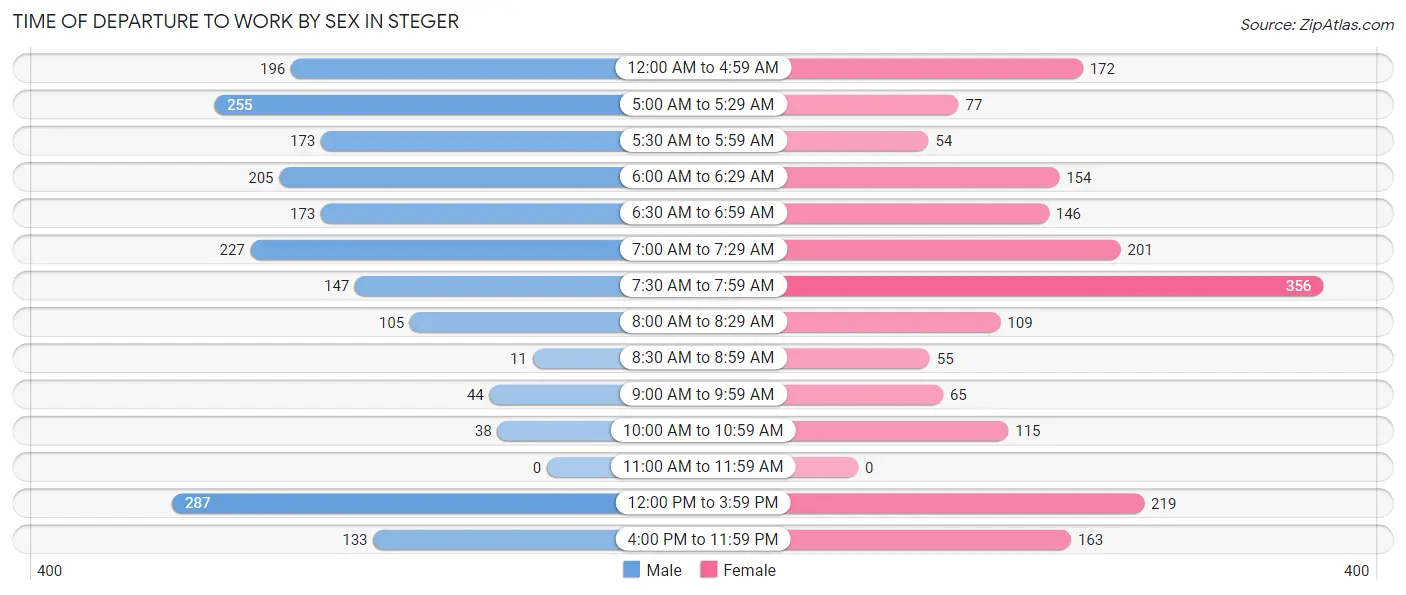
| Time of Departure | Male | Female |
| 12:00 AM to 4:59 AM | 196 (9.8%) | 172 (9.1%) |
| 5:00 AM to 5:29 AM | 255 (12.8%) | 77 (4.1%) |
| 5:30 AM to 5:59 AM | 173 (8.7%) | 54 (2.9%) |
| 6:00 AM to 6:29 AM | 205 (10.3%) | 154 (8.2%) |
| 6:30 AM to 6:59 AM | 173 (8.7%) | 146 (7.7%) |
| 7:00 AM to 7:29 AM | 227 (11.4%) | 201 (10.7%) |
| 7:30 AM to 7:59 AM | 147 (7.4%) | 356 (18.9%) |
| 8:00 AM to 8:29 AM | 105 (5.3%) | 109 (5.8%) |
| 8:30 AM to 8:59 AM | 11 (0.5%) | 55 (2.9%) |
| 9:00 AM to 9:59 AM | 44 (2.2%) | 65 (3.5%) |
| 10:00 AM to 10:59 AM | 38 (1.9%) | 115 (6.1%) |
| 11:00 AM to 11:59 AM | 0 (0.0%) | 0 (0.0%) |
| 12:00 PM to 3:59 PM | 287 (14.4%) | 219 (11.6%) |
| 4:00 PM to 11:59 PM | 133 (6.7%) | 163 (8.6%) |
| Total | 1,994 (100.0%) | 1,886 (100.0%) |
Housing Occupancy in Steger
Occupancy by Ownership in Steger
Of the total 4,050 dwellings in Steger, owner-occupied units account for 2,424 (59.9%), while renter-occupied units make up 1,626 (40.2%).
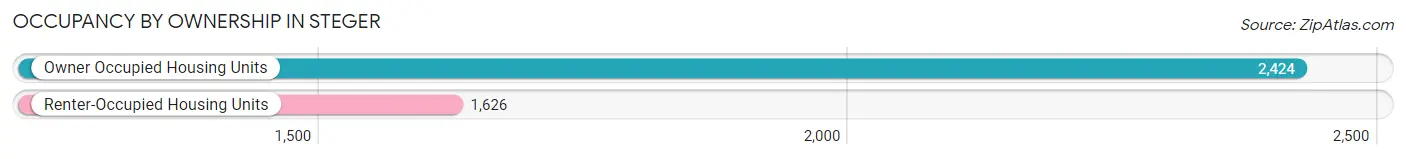
| Occupancy | # Housing Units | % Housing Units |
| Owner Occupied Housing Units | 2,424 | 59.9% |
| Renter-Occupied Housing Units | 1,626 | 40.2% |
| Total Occupied Housing Units | 4,050 | 100.0% |
Occupancy by Household Size in Steger
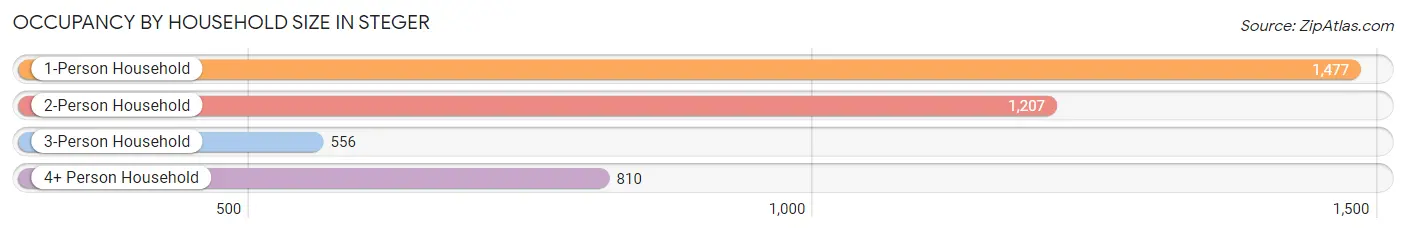
| Household Size | # Housing Units | % Housing Units |
| 1-Person Household | 1,477 | 36.5% |
| 2-Person Household | 1,207 | 29.8% |
| 3-Person Household | 556 | 13.7% |
| 4+ Person Household | 810 | 20.0% |
| Total Housing Units | 4,050 | 100.0% |
Occupancy by Ownership by Household Size in Steger
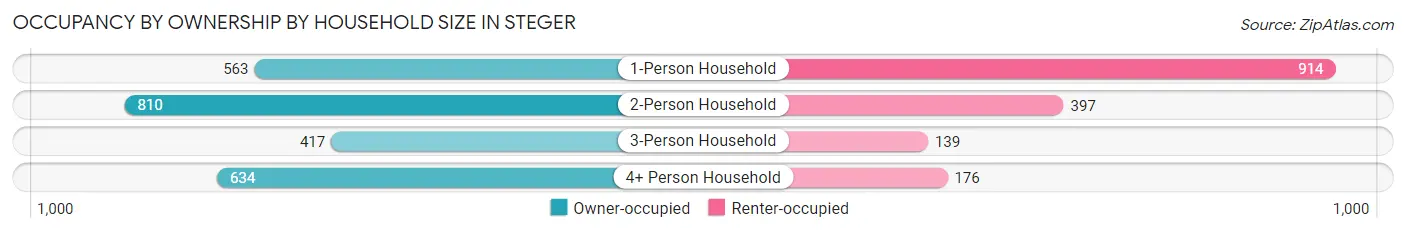
| Household Size | Owner-occupied | Renter-occupied |
| 1-Person Household | 563 (38.1%) | 914 (61.9%) |
| 2-Person Household | 810 (67.1%) | 397 (32.9%) |
| 3-Person Household | 417 (75.0%) | 139 (25.0%) |
| 4+ Person Household | 634 (78.3%) | 176 (21.7%) |
| Total Housing Units | 2,424 (59.9%) | 1,626 (40.2%) |
Occupancy by Educational Attainment in Steger
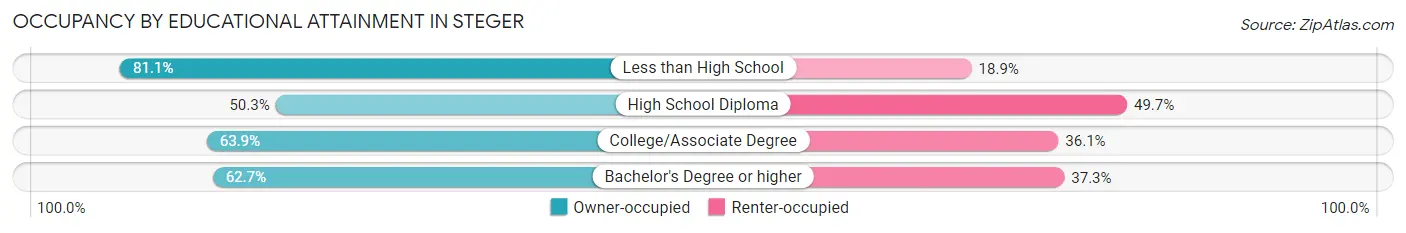
| Household Size | Owner-occupied | Renter-occupied |
| Less than High School | 274 (81.1%) | 64 (18.9%) |
| High School Diploma | 786 (50.3%) | 778 (49.7%) |
| College/Associate Degree | 944 (63.9%) | 534 (36.1%) |
| Bachelor's Degree or higher | 420 (62.7%) | 250 (37.3%) |
Occupancy by Age of Householder in Steger
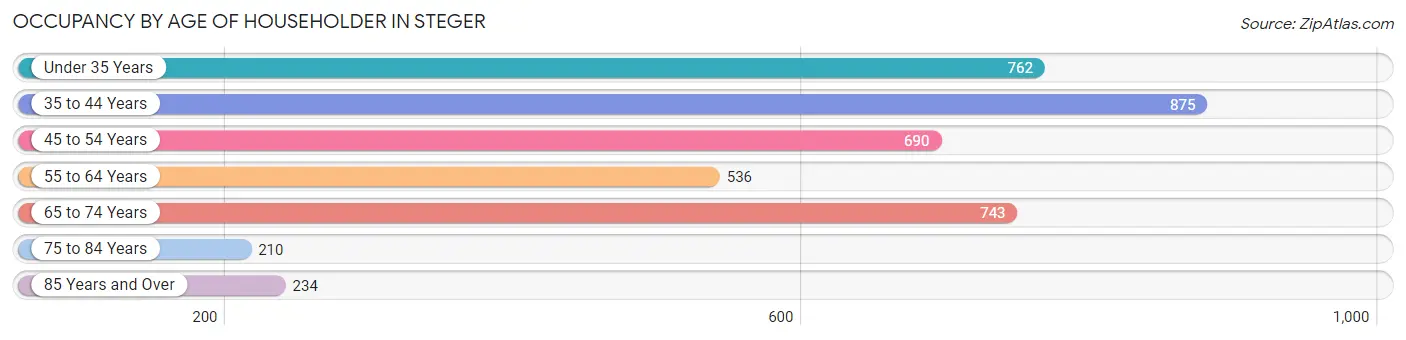
| Age Bracket | # Households | % Households |
| Under 35 Years | 762 | 18.8% |
| 35 to 44 Years | 875 | 21.6% |
| 45 to 54 Years | 690 | 17.0% |
| 55 to 64 Years | 536 | 13.2% |
| 65 to 74 Years | 743 | 18.3% |
| 75 to 84 Years | 210 | 5.2% |
| 85 Years and Over | 234 | 5.8% |
| Total | 4,050 | 100.0% |
Housing Finances in Steger
Median Income by Occupancy in Steger
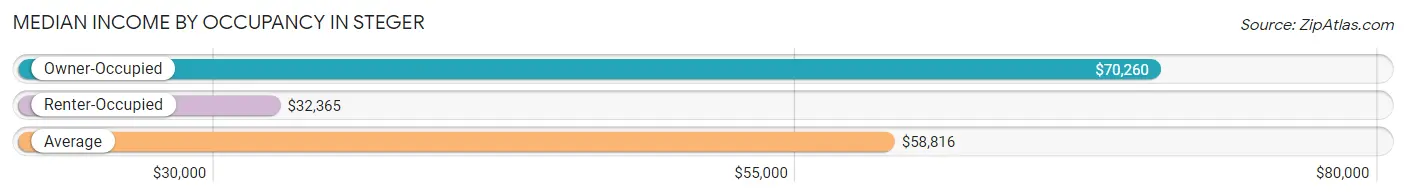
| Occupancy Type | # Households | Median Income |
| Owner-Occupied | 2,424 (59.9%) | $70,260 |
| Renter-Occupied | 1,626 (40.2%) | $32,365 |
| Average | 4,050 (100.0%) | $58,816 |
Occupancy by Householder Income Bracket in Steger
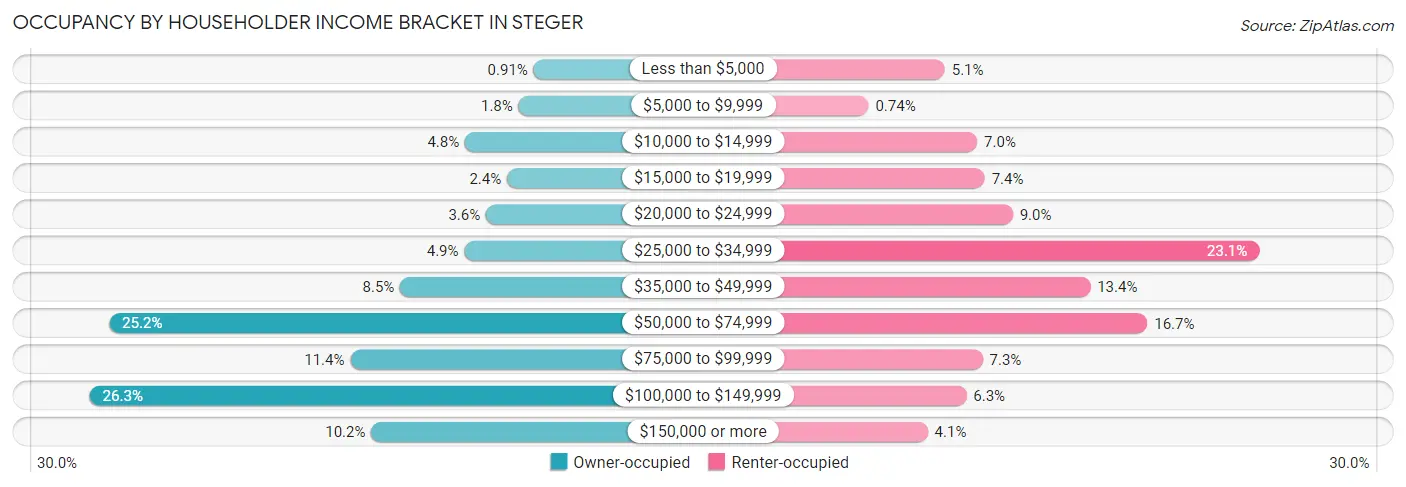
| Income Bracket | Owner-occupied | Renter-occupied |
| Less than $5,000 | 22 (0.9%) | 83 (5.1%) |
| $5,000 to $9,999 | 43 (1.8%) | 12 (0.7%) |
| $10,000 to $14,999 | 117 (4.8%) | 113 (7.0%) |
| $15,000 to $19,999 | 59 (2.4%) | 120 (7.4%) |
| $20,000 to $24,999 | 88 (3.6%) | 146 (9.0%) |
| $25,000 to $34,999 | 118 (4.9%) | 375 (23.1%) |
| $35,000 to $49,999 | 207 (8.5%) | 218 (13.4%) |
| $50,000 to $74,999 | 610 (25.2%) | 271 (16.7%) |
| $75,000 to $99,999 | 276 (11.4%) | 118 (7.3%) |
| $100,000 to $149,999 | 637 (26.3%) | 103 (6.3%) |
| $150,000 or more | 247 (10.2%) | 67 (4.1%) |
| Total | 2,424 (100.0%) | 1,626 (100.0%) |
Monthly Housing Cost Tiers in Steger
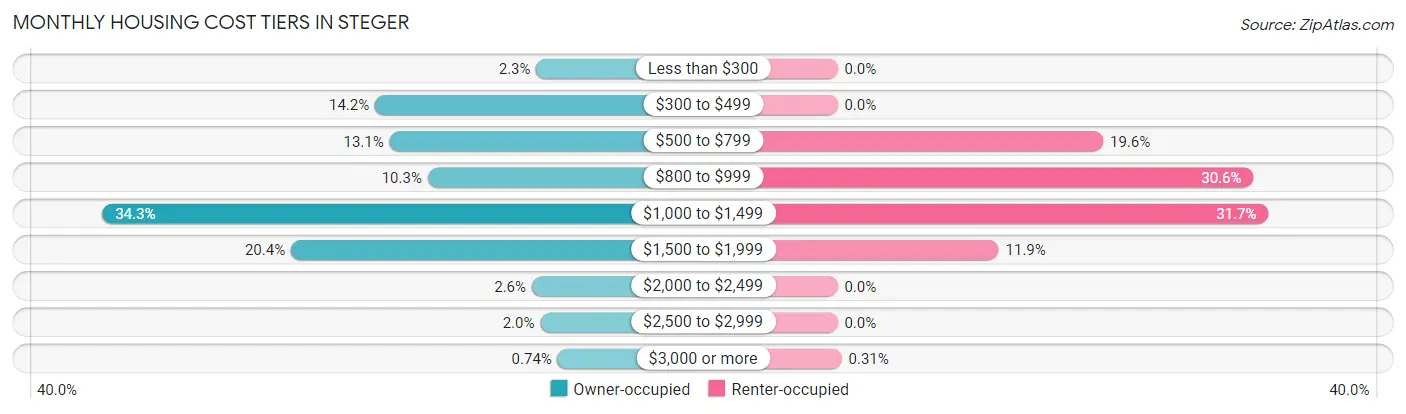
| Monthly Cost | Owner-occupied | Renter-occupied |
| Less than $300 | 56 (2.3%) | 0 (0.0%) |
| $300 to $499 | 344 (14.2%) | 0 (0.0%) |
| $500 to $799 | 318 (13.1%) | 318 (19.6%) |
| $800 to $999 | 250 (10.3%) | 498 (30.6%) |
| $1,000 to $1,499 | 831 (34.3%) | 516 (31.7%) |
| $1,500 to $1,999 | 494 (20.4%) | 193 (11.9%) |
| $2,000 to $2,499 | 64 (2.6%) | 0 (0.0%) |
| $2,500 to $2,999 | 49 (2.0%) | 0 (0.0%) |
| $3,000 or more | 18 (0.7%) | 5 (0.3%) |
| Total | 2,424 (100.0%) | 1,626 (100.0%) |
Physical Housing Characteristics in Steger
Housing Structures in Steger
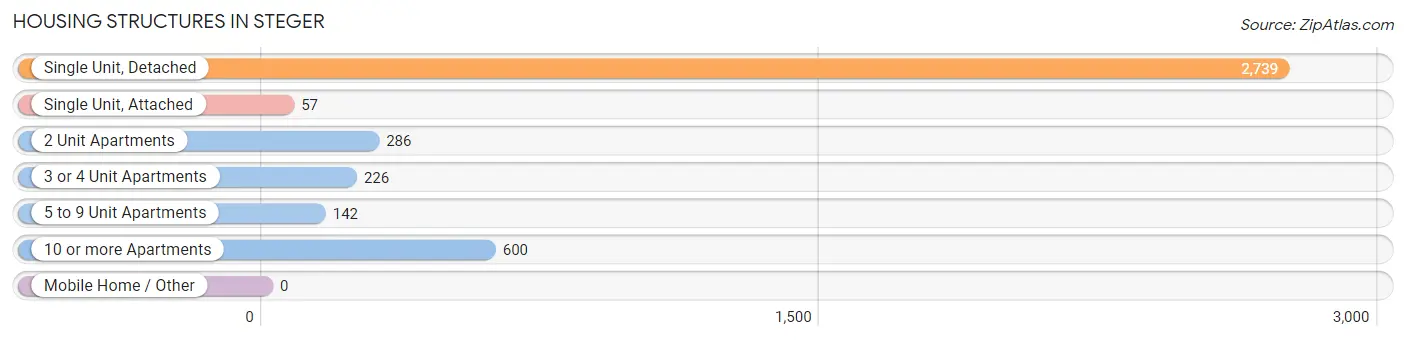
| Structure Type | # Housing Units | % Housing Units |
| Single Unit, Detached | 2,739 | 67.6% |
| Single Unit, Attached | 57 | 1.4% |
| 2 Unit Apartments | 286 | 7.1% |
| 3 or 4 Unit Apartments | 226 | 5.6% |
| 5 to 9 Unit Apartments | 142 | 3.5% |
| 10 or more Apartments | 600 | 14.8% |
| Mobile Home / Other | 0 | 0.0% |
| Total | 4,050 | 100.0% |
Housing Structures by Occupancy in Steger
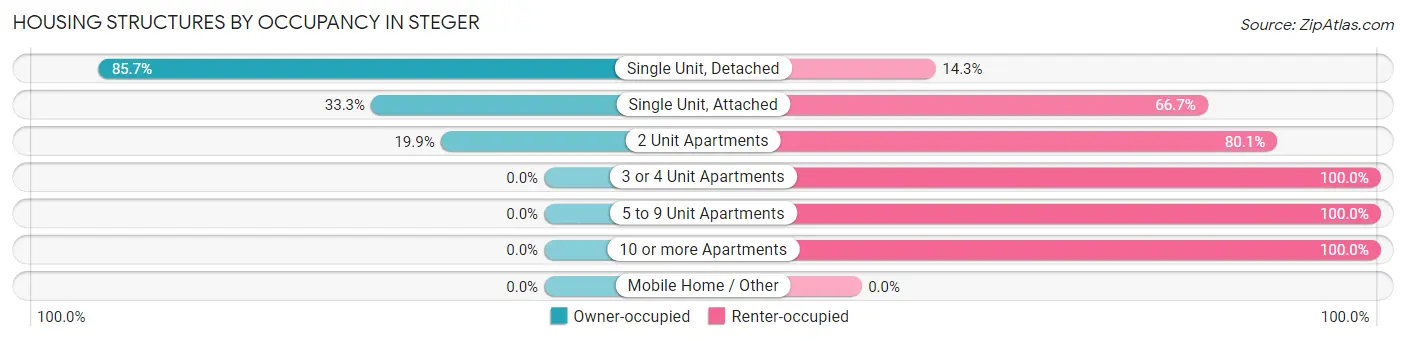
| Structure Type | Owner-occupied | Renter-occupied |
| Single Unit, Detached | 2,348 (85.7%) | 391 (14.3%) |
| Single Unit, Attached | 19 (33.3%) | 38 (66.7%) |
| 2 Unit Apartments | 57 (19.9%) | 229 (80.1%) |
| 3 or 4 Unit Apartments | 0 (0.0%) | 226 (100.0%) |
| 5 to 9 Unit Apartments | 0 (0.0%) | 142 (100.0%) |
| 10 or more Apartments | 0 (0.0%) | 600 (100.0%) |
| Mobile Home / Other | 0 (0.0%) | 0 (0.0%) |
| Total | 2,424 (59.9%) | 1,626 (40.2%) |
Housing Structures by Number of Rooms in Steger
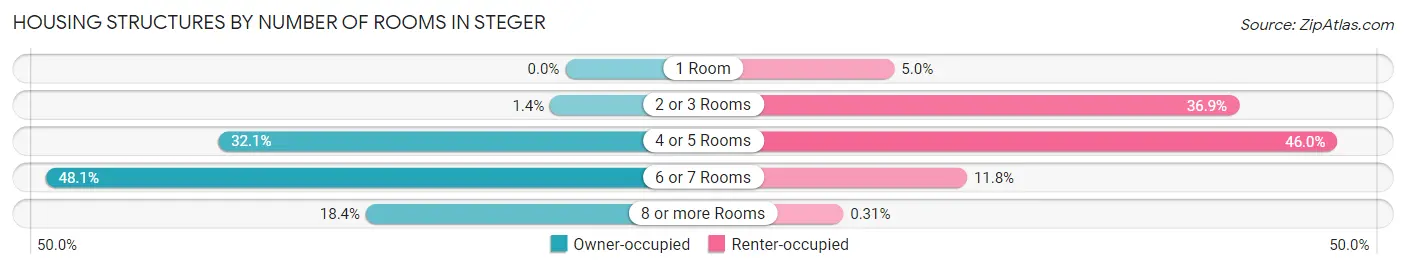
| Number of Rooms | Owner-occupied | Renter-occupied |
| 1 Room | 0 (0.0%) | 82 (5.0%) |
| 2 or 3 Rooms | 34 (1.4%) | 600 (36.9%) |
| 4 or 5 Rooms | 778 (32.1%) | 748 (46.0%) |
| 6 or 7 Rooms | 1,165 (48.1%) | 191 (11.7%) |
| 8 or more Rooms | 447 (18.4%) | 5 (0.3%) |
| Total | 2,424 (100.0%) | 1,626 (100.0%) |
Housing Structure by Heating Type in Steger
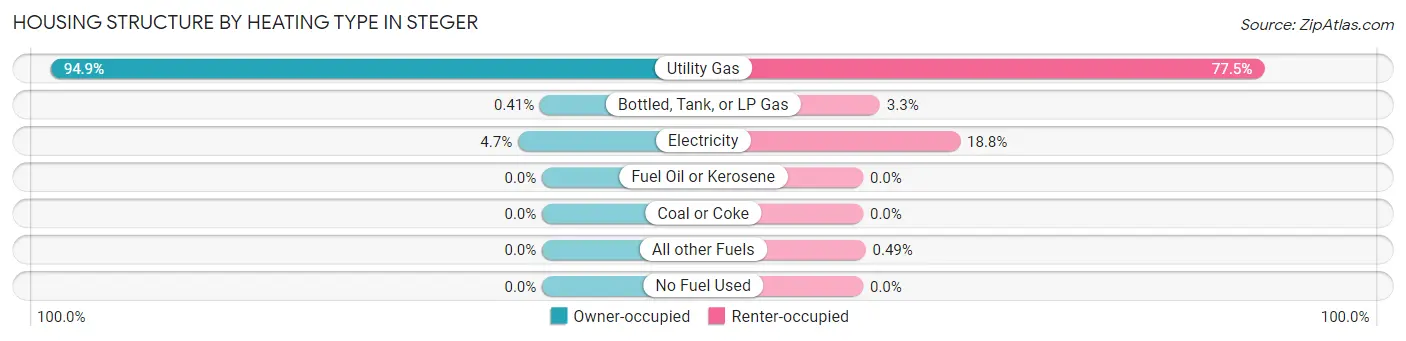
| Heating Type | Owner-occupied | Renter-occupied |
| Utility Gas | 2,301 (94.9%) | 1,260 (77.5%) |
| Bottled, Tank, or LP Gas | 10 (0.4%) | 53 (3.3%) |
| Electricity | 113 (4.7%) | 305 (18.8%) |
| Fuel Oil or Kerosene | 0 (0.0%) | 0 (0.0%) |
| Coal or Coke | 0 (0.0%) | 0 (0.0%) |
| All other Fuels | 0 (0.0%) | 8 (0.5%) |
| No Fuel Used | 0 (0.0%) | 0 (0.0%) |
| Total | 2,424 (100.0%) | 1,626 (100.0%) |
Household Vehicle Usage in Steger
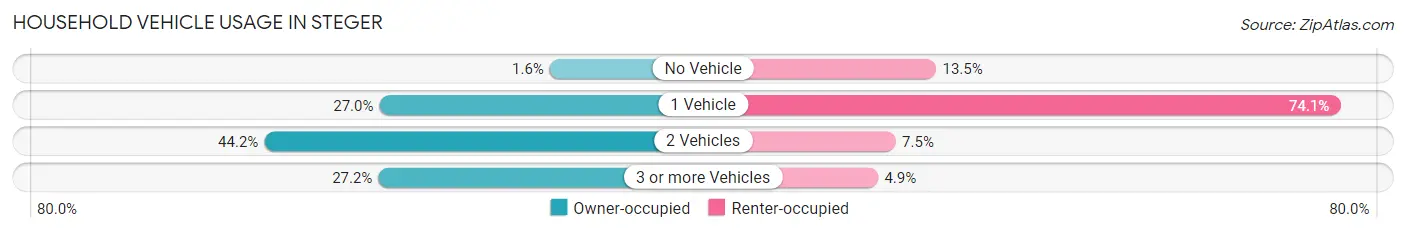
| Vehicles per Household | Owner-occupied | Renter-occupied |
| No Vehicle | 38 (1.6%) | 220 (13.5%) |
| 1 Vehicle | 655 (27.0%) | 1,205 (74.1%) |
| 2 Vehicles | 1,072 (44.2%) | 122 (7.5%) |
| 3 or more Vehicles | 659 (27.2%) | 79 (4.9%) |
| Total | 2,424 (100.0%) | 1,626 (100.0%) |
Real Estate & Mortgages in Steger
Real Estate and Mortgage Overview in Steger
| Characteristic | Without Mortgage | With Mortgage |
| Housing Units | 775 | 1,649 |
| Median Property Value | $97,700 | $132,100 |
| Median Household Income | $61,641 | $199 |
| Monthly Housing Costs | $519 | $18 |
| Real Estate Taxes | $2,651 | $28 |
Property Value by Mortgage Status in Steger
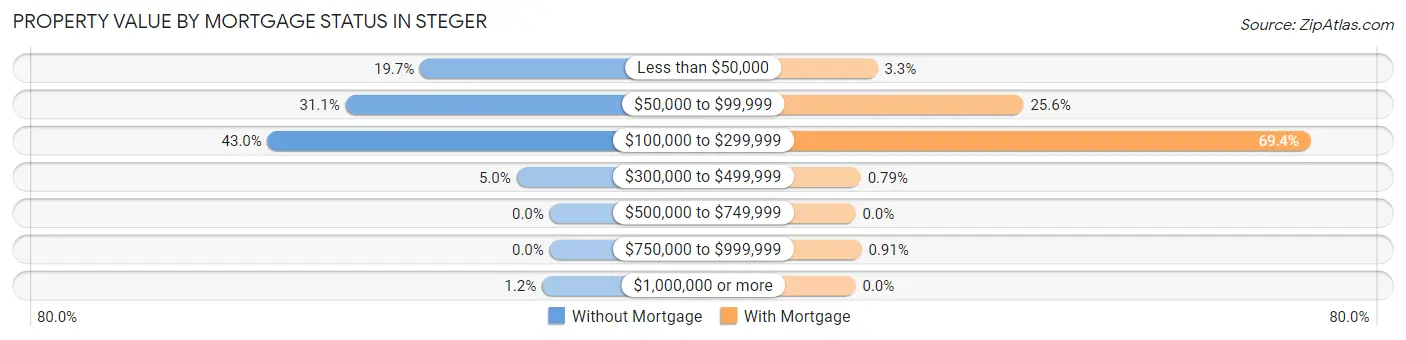
| Property Value | Without Mortgage | With Mortgage |
| Less than $50,000 | 153 (19.7%) | 55 (3.3%) |
| $50,000 to $99,999 | 241 (31.1%) | 422 (25.6%) |
| $100,000 to $299,999 | 333 (43.0%) | 1,144 (69.4%) |
| $300,000 to $499,999 | 39 (5.0%) | 13 (0.8%) |
| $500,000 to $749,999 | 0 (0.0%) | 0 (0.0%) |
| $750,000 to $999,999 | 0 (0.0%) | 15 (0.9%) |
| $1,000,000 or more | 9 (1.2%) | 0 (0.0%) |
| Total | 775 (100.0%) | 1,649 (100.0%) |
Household Income by Mortgage Status in Steger
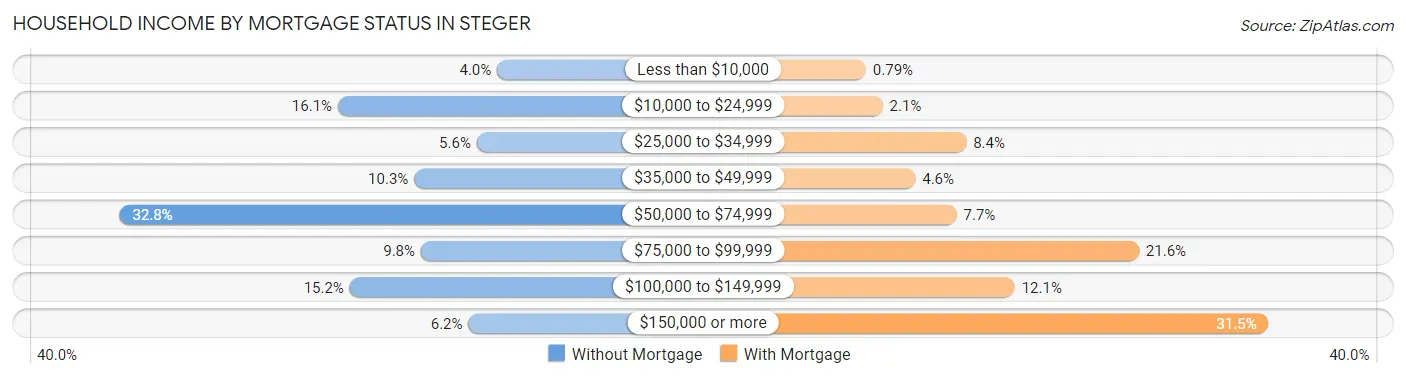
| Household Income | Without Mortgage | With Mortgage |
| Less than $10,000 | 31 (4.0%) | 13 (0.8%) |
| $10,000 to $24,999 | 125 (16.1%) | 34 (2.1%) |
| $25,000 to $34,999 | 43 (5.6%) | 139 (8.4%) |
| $35,000 to $49,999 | 80 (10.3%) | 75 (4.5%) |
| $50,000 to $74,999 | 254 (32.8%) | 127 (7.7%) |
| $75,000 to $99,999 | 76 (9.8%) | 356 (21.6%) |
| $100,000 to $149,999 | 118 (15.2%) | 200 (12.1%) |
| $150,000 or more | 48 (6.2%) | 519 (31.5%) |
| Total | 775 (100.0%) | 1,649 (100.0%) |
Property Value to Household Income Ratio in Steger
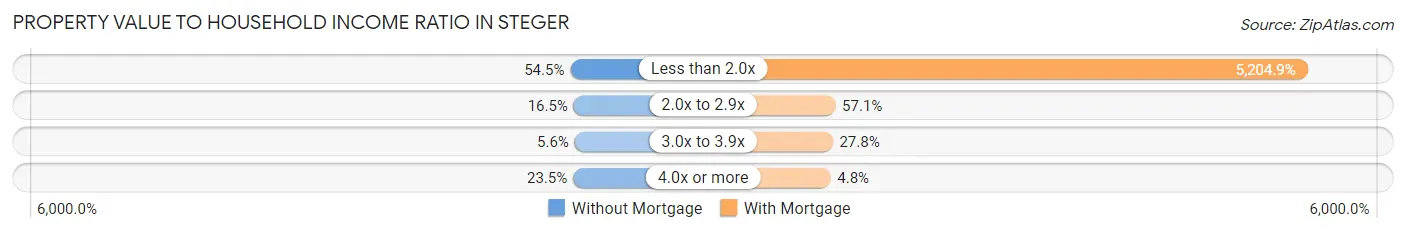
| Value-to-Income Ratio | Without Mortgage | With Mortgage |
| Less than 2.0x | 422 (54.4%) | 85,829 (5,204.9%) |
| 2.0x to 2.9x | 128 (16.5%) | 942 (57.1%) |
| 3.0x to 3.9x | 43 (5.6%) | 458 (27.8%) |
| 4.0x or more | 182 (23.5%) | 79 (4.8%) |
| Total | 775 (100.0%) | 1,649 (100.0%) |
Real Estate Taxes by Mortgage Status in Steger
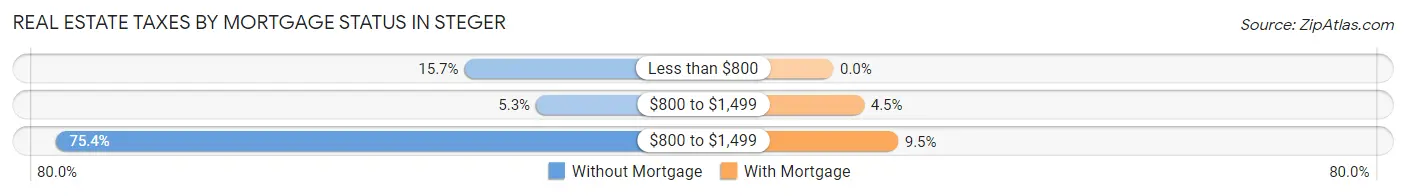
| Property Taxes | Without Mortgage | With Mortgage |
| Less than $800 | 122 (15.7%) | 0 (0.0%) |
| $800 to $1,499 | 41 (5.3%) | 74 (4.5%) |
| $800 to $1,499 | 584 (75.3%) | 156 (9.5%) |
| Total | 775 (100.0%) | 1,649 (100.0%) |
Health & Disability in Steger
Health Insurance Coverage by Age in Steger
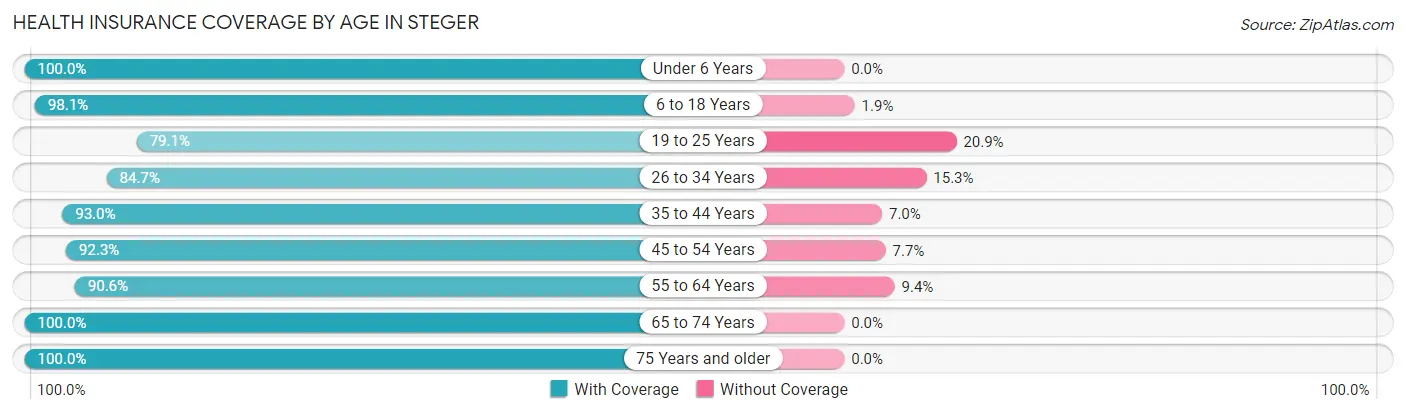
| Age Bracket | With Coverage | Without Coverage |
| Under 6 Years | 735 (100.0%) | 0 (0.0%) |
| 6 to 18 Years | 1,625 (98.1%) | 32 (1.9%) |
| 19 to 25 Years | 730 (79.1%) | 193 (20.9%) |
| 26 to 34 Years | 869 (84.7%) | 157 (15.3%) |
| 35 to 44 Years | 1,281 (93.0%) | 97 (7.0%) |
| 45 to 54 Years | 1,102 (92.3%) | 92 (7.7%) |
| 55 to 64 Years | 792 (90.6%) | 82 (9.4%) |
| 65 to 74 Years | 1,187 (100.0%) | 0 (0.0%) |
| 75 Years and older | 544 (100.0%) | 0 (0.0%) |
| Total | 8,865 (93.1%) | 653 (6.9%) |
Health Insurance Coverage by Citizenship Status in Steger
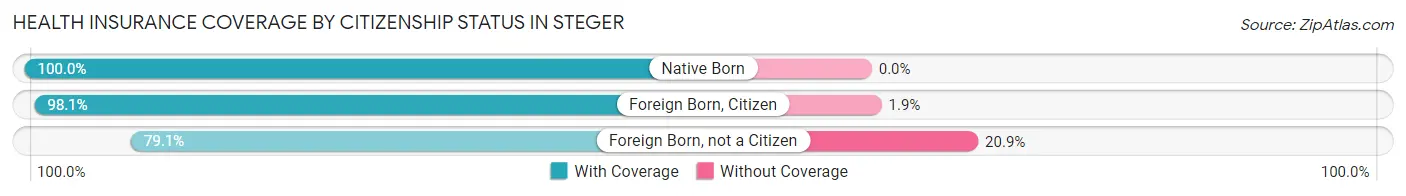
| Citizenship Status | With Coverage | Without Coverage |
| Native Born | 735 (100.0%) | 0 (0.0%) |
| Foreign Born, Citizen | 1,625 (98.1%) | 32 (1.9%) |
| Foreign Born, not a Citizen | 730 (79.1%) | 193 (20.9%) |
Health Insurance Coverage by Household Income in Steger
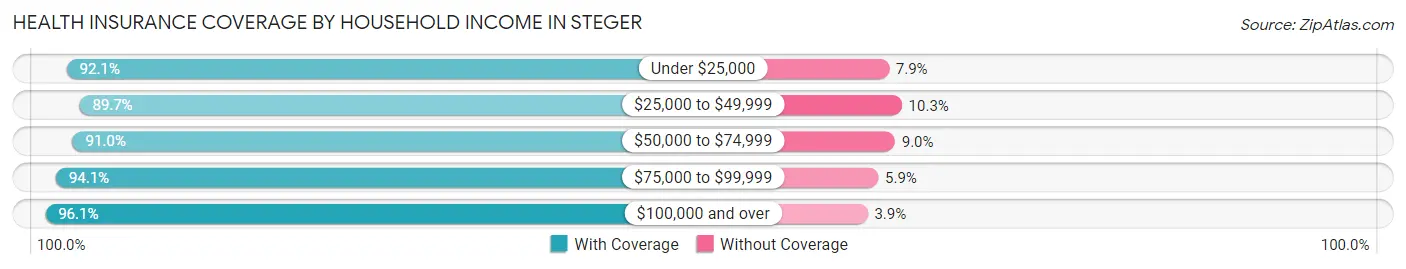
| Household Income | With Coverage | Without Coverage |
| Under $25,000 | 1,345 (92.1%) | 115 (7.9%) |
| $25,000 to $49,999 | 1,362 (89.7%) | 156 (10.3%) |
| $50,000 to $74,999 | 1,903 (91.0%) | 188 (9.0%) |
| $75,000 to $99,999 | 1,027 (94.1%) | 64 (5.9%) |
| $100,000 and over | 3,228 (96.1%) | 130 (3.9%) |
Public vs Private Health Insurance Coverage by Age in Steger
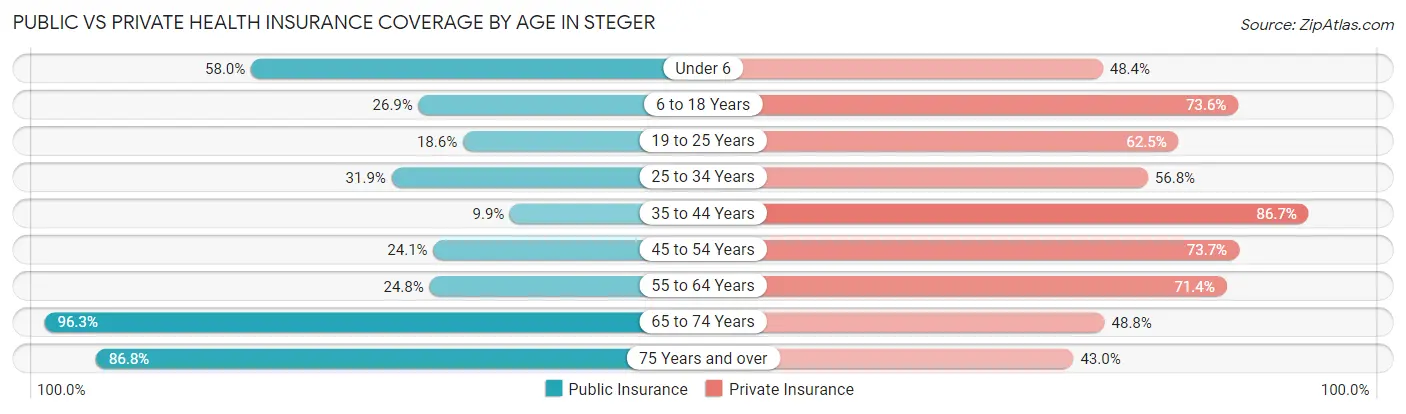
| Age Bracket | Public Insurance | Private Insurance |
| Under 6 | 426 (58.0%) | 356 (48.4%) |
| 6 to 18 Years | 445 (26.9%) | 1,219 (73.6%) |
| 19 to 25 Years | 172 (18.6%) | 577 (62.5%) |
| 25 to 34 Years | 327 (31.9%) | 583 (56.8%) |
| 35 to 44 Years | 136 (9.9%) | 1,194 (86.7%) |
| 45 to 54 Years | 288 (24.1%) | 880 (73.7%) |
| 55 to 64 Years | 217 (24.8%) | 624 (71.4%) |
| 65 to 74 Years | 1,143 (96.3%) | 579 (48.8%) |
| 75 Years and over | 472 (86.8%) | 234 (43.0%) |
| Total | 3,626 (38.1%) | 6,246 (65.6%) |
Disability Status by Sex by Age in Steger
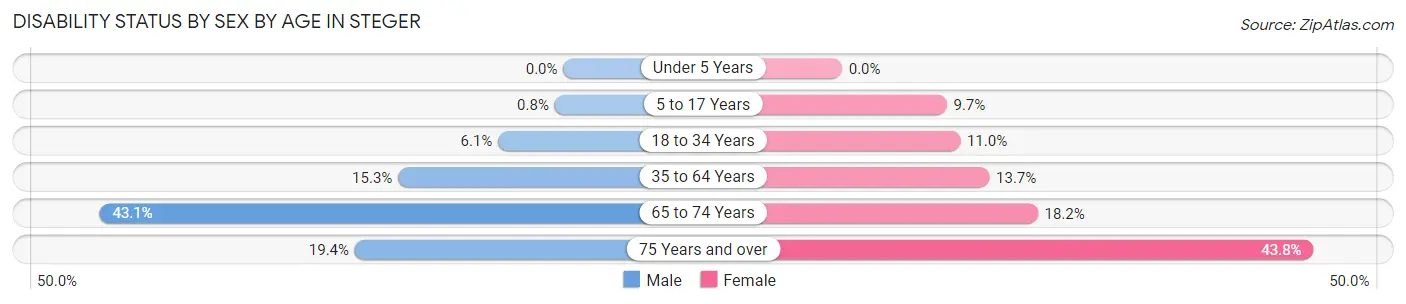
| Age Bracket | Male | Female |
| Under 5 Years | 0 (0.0%) | 0 (0.0%) |
| 5 to 17 Years | 7 (0.8%) | 76 (9.7%) |
| 18 to 34 Years | 70 (6.0%) | 105 (11.0%) |
| 35 to 64 Years | 276 (15.3%) | 225 (13.7%) |
| 65 to 74 Years | 229 (43.0%) | 119 (18.2%) |
| 75 Years and over | 54 (19.4%) | 116 (43.8%) |
Disability Class by Sex by Age in Steger
Disability Class: Hearing Difficulty
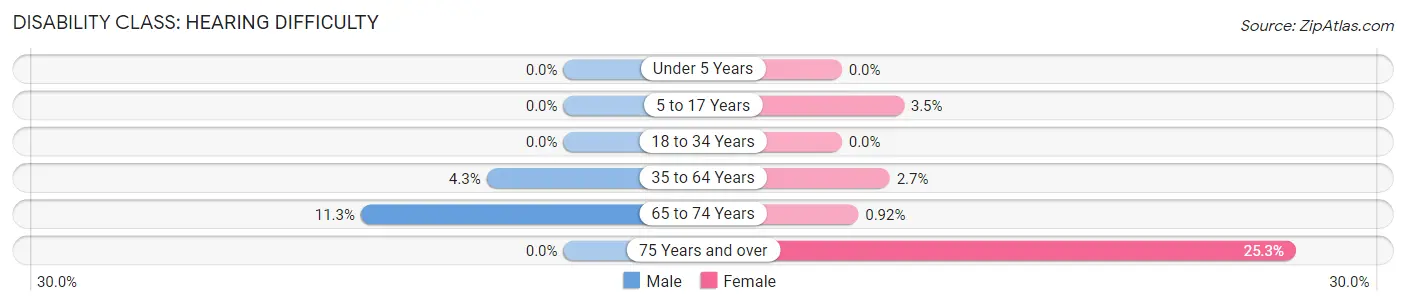
| Age Bracket | Male | Female |
| Under 5 Years | 0 (0.0%) | 0 (0.0%) |
| 5 to 17 Years | 0 (0.0%) | 27 (3.5%) |
| 18 to 34 Years | 0 (0.0%) | 0 (0.0%) |
| 35 to 64 Years | 77 (4.3%) | 44 (2.7%) |
| 65 to 74 Years | 60 (11.3%) | 6 (0.9%) |
| 75 Years and over | 0 (0.0%) | 67 (25.3%) |
Disability Class: Vision Difficulty
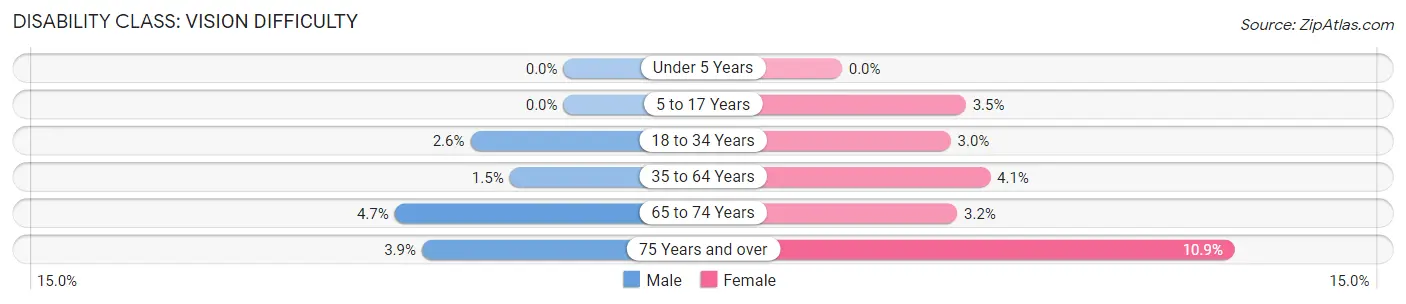
| Age Bracket | Male | Female |
| Under 5 Years | 0 (0.0%) | 0 (0.0%) |
| 5 to 17 Years | 0 (0.0%) | 27 (3.5%) |
| 18 to 34 Years | 30 (2.6%) | 29 (3.0%) |
| 35 to 64 Years | 27 (1.5%) | 68 (4.1%) |
| 65 to 74 Years | 25 (4.7%) | 21 (3.2%) |
| 75 Years and over | 11 (3.9%) | 29 (10.9%) |
Disability Class: Cognitive Difficulty
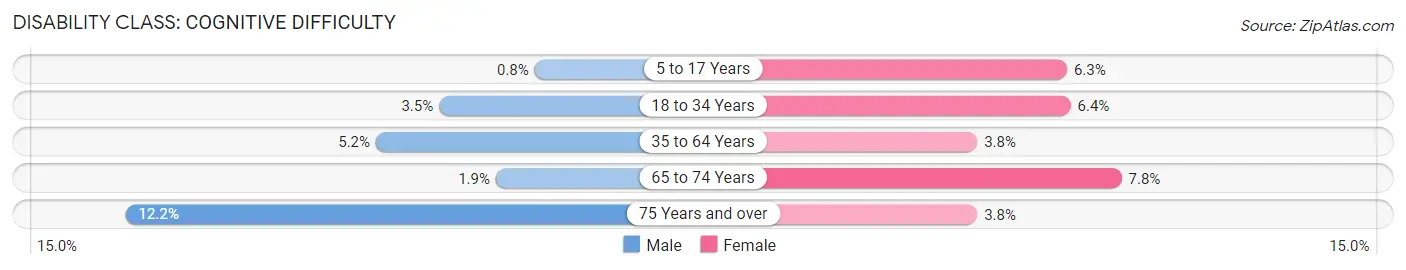
| Age Bracket | Male | Female |
| 5 to 17 Years | 7 (0.8%) | 49 (6.3%) |
| 18 to 34 Years | 40 (3.5%) | 61 (6.4%) |
| 35 to 64 Years | 94 (5.2%) | 62 (3.8%) |
| 65 to 74 Years | 10 (1.9%) | 51 (7.8%) |
| 75 Years and over | 34 (12.2%) | 10 (3.8%) |
Disability Class: Ambulatory Difficulty
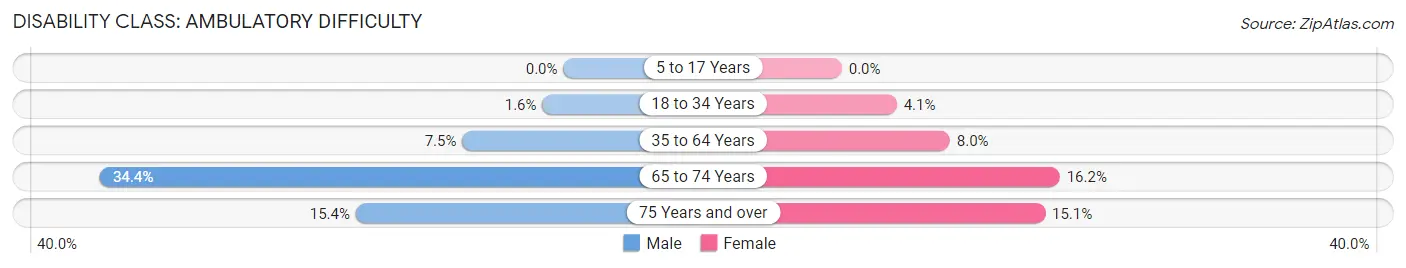
| Age Bracket | Male | Female |
| 5 to 17 Years | 0 (0.0%) | 0 (0.0%) |
| 18 to 34 Years | 18 (1.6%) | 39 (4.1%) |
| 35 to 64 Years | 135 (7.5%) | 132 (8.0%) |
| 65 to 74 Years | 183 (34.4%) | 106 (16.2%) |
| 75 Years and over | 43 (15.4%) | 40 (15.1%) |
Disability Class: Self-Care Difficulty
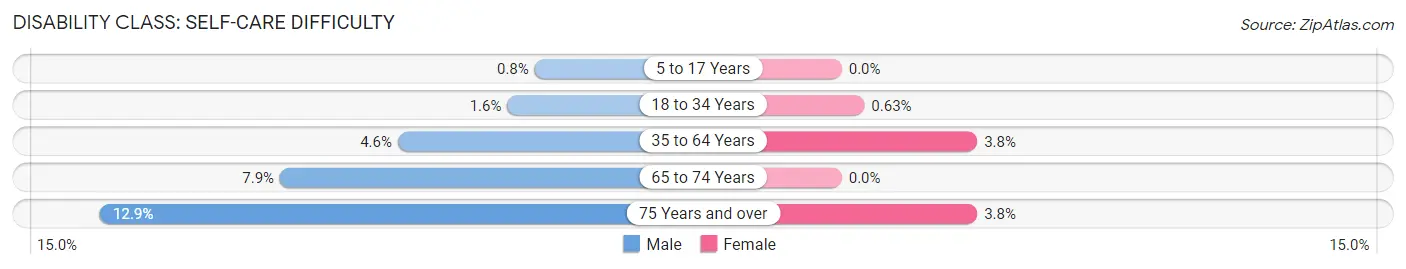
| Age Bracket | Male | Female |
| 5 to 17 Years | 7 (0.8%) | 0 (0.0%) |
| 18 to 34 Years | 18 (1.6%) | 6 (0.6%) |
| 35 to 64 Years | 83 (4.6%) | 62 (3.8%) |
| 65 to 74 Years | 42 (7.9%) | 0 (0.0%) |
| 75 Years and over | 36 (12.9%) | 10 (3.8%) |
Technology Access in Steger
Computing Device Access in Steger
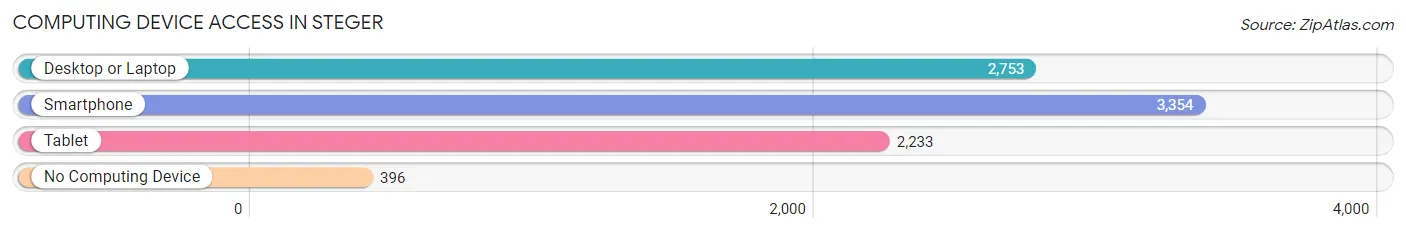
| Device Type | # Households | % Households |
| Desktop or Laptop | 2,753 | 68.0% |
| Smartphone | 3,354 | 82.8% |
| Tablet | 2,233 | 55.1% |
| No Computing Device | 396 | 9.8% |
| Total | 4,050 | 100.0% |
Internet Access in Steger
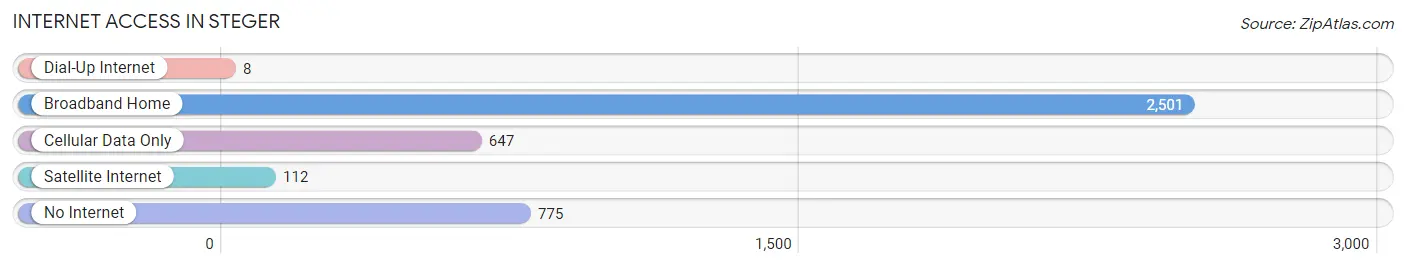
| Internet Type | # Households | % Households |
| Dial-Up Internet | 8 | 0.2% |
| Broadband Home | 2,501 | 61.8% |
| Cellular Data Only | 647 | 16.0% |
| Satellite Internet | 112 | 2.8% |
| No Internet | 775 | 19.1% |
| Total | 4,050 | 100.0% |
Steger Summary
Steger is a village located in Cook and Will Counties in the state of Illinois. It is a suburb of Chicago and is located about 30 miles south of the city. The population of Steger was 10,355 at the 2010 census.
History
Steger was founded in 1892 by German immigrant, John Steger. He purchased land in the area and began to develop it into a small town. He built a sawmill and a brick factory, which provided employment for many of the town's residents. The town was officially incorporated in 1896.
In the early 1900s, Steger experienced a period of growth and development. The town was home to several factories, including a steel mill, a brick factory, and a paper mill. These factories provided employment for many of the town's residents.
In the 1950s, Steger began to experience a decline in its industrial base. Many of the factories closed and the town's population began to decline. In the 1970s, the town began to experience a resurgence in its economy. Several new businesses opened in the area, including a shopping center and a movie theater.
Geography
Steger is located in Cook and Will Counties in the state of Illinois. It is a suburb of Chicago and is located about 30 miles south of the city. The village is situated on the banks of the Little Calumet River. The total area of the village is 4.2 square miles.
Economy
Steger's economy is largely based on manufacturing and retail. The village is home to several factories, including a steel mill, a brick factory, and a paper mill. These factories provide employment for many of the town's residents.
The village is also home to several retail stores, including a grocery store, a hardware store, and a pharmacy. There are also several restaurants and bars in the area.
Demographics
As of the 2010 census, the population of Steger was 10,355. The racial makeup of the village was 79.3% White, 14.2% African American, 0.3% Native American, 1.2% Asian, and 4.9% from other races. Hispanic or Latino of any race were 8.3% of the population.
The median household income in Steger was $50,945 in 2010. The per capita income for the village was $21,945. About 8.3% of the population was below the poverty line.
Common Questions
What is Per Capita Income in Steger?
Per Capita income in Steger is $29,533.
What is the Median Family Income in Steger?
Median Family Income in Steger is $69,959.
What is the Median Household income in Steger?
Median Household Income in Steger is $58,816.
What is Income or Wage Gap in Steger?
Income or Wage Gap in Steger is 43.3%.
Women in Steger earn 56.7 cents for every dollar earned by a man.
What is Inequality or Gini Index in Steger?
Inequality or Gini Index in Steger is 0.39.
What is the Total Population of Steger?
Total Population of Steger is 9,518.
What is the Total Male Population of Steger?
Total Male Population of Steger is 4,871.
What is the Total Female Population of Steger?
Total Female Population of Steger is 4,647.
What is the Ratio of Males per 100 Females in Steger?
There are 104.82 Males per 100 Females in Steger.
What is the Ratio of Females per 100 Males in Steger?
There are 95.40 Females per 100 Males in Steger.
What is the Median Population Age in Steger?
Median Population Age in Steger is 38.5 Years.
What is the Average Family Size in Steger
Average Family Size in Steger is 3.1 People.
What is the Average Household Size in Steger
Average Household Size in Steger is 2.4 People.
How Large is the Labor Force in Steger?
There are 4,593 People in the Labor Forcein in Steger.
What is the Percentage of People in the Labor Force in Steger?
61.5% of People are in the Labor Force in Steger.
What is the Unemployment Rate in Steger?
Unemployment Rate in Steger is 4.5%.