Edwardsville, IL Map & Demographics
Edwardsville Map
Edwardsville Overview
$44,305
PER CAPITA INCOME
$139,321
AVG FAMILY INCOME
$87,094
AVG HOUSEHOLD INCOME
45.0%
WAGE / INCOME GAP [ % ]
55.0¢/ $1
WAGE / INCOME GAP [ $ ]
$9,494
FAMILY INCOME DEFICIT
0.47
INEQUALITY / GINI INDEX
26,622
TOTAL POPULATION
12,615
MALE POPULATION
14,007
FEMALE POPULATION
90.06
MALES / 100 FEMALES
111.03
FEMALES / 100 MALES
30.6
MEDIAN AGE
3.1
AVG FAMILY SIZE
2.5
AVG HOUSEHOLD SIZE
13,890
LABOR FORCE [ PEOPLE ]
62.6%
PERCENT IN LABOR FORCE
6.3%
UNEMPLOYMENT RATE
Edwardsville Area Codes
Income in Edwardsville
Income Overview in Edwardsville
Per Capita Income in Edwardsville is $44,305, while median incomes of families and households are $139,321 and $87,094 respectively.
| Characteristic | Number | Measure |
| Per Capita Income | 26,622 | $44,305 |
| Median Family Income | 5,621 | $139,321 |
| Mean Family Income | 5,621 | $164,279 |
| Median Household Income | 9,359 | $87,094 |
| Mean Household Income | 9,359 | $123,531 |
| Income Deficit | 5,621 | $9,494 |
| Wage / Income Gap (%) | 26,622 | 44.98% |
| Wage / Income Gap ($) | 26,622 | 55.02¢ per $1 |
| Gini / Inequality Index | 26,622 | 0.47 |
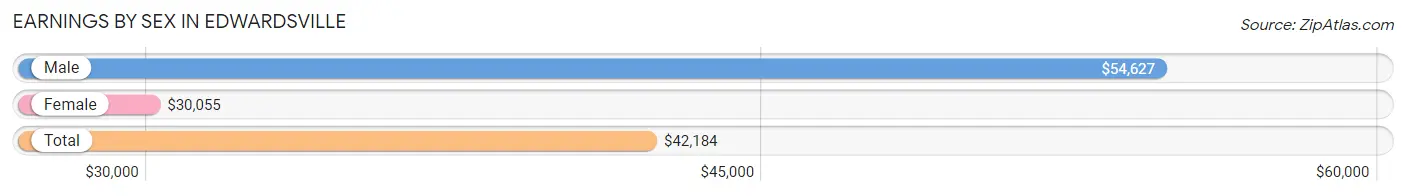
Earnings by Sex in Edwardsville
Average Earnings in Edwardsville are $42,184, $54,627 for men and $30,055 for women, a difference of 45.0%.
| Sex | Number | Average Earnings |
| Male | 7,564 (49.0%) | $54,627 |
| Female | 7,866 (51.0%) | $30,055 |
| Total | 15,430 (100.0%) | $42,184 |
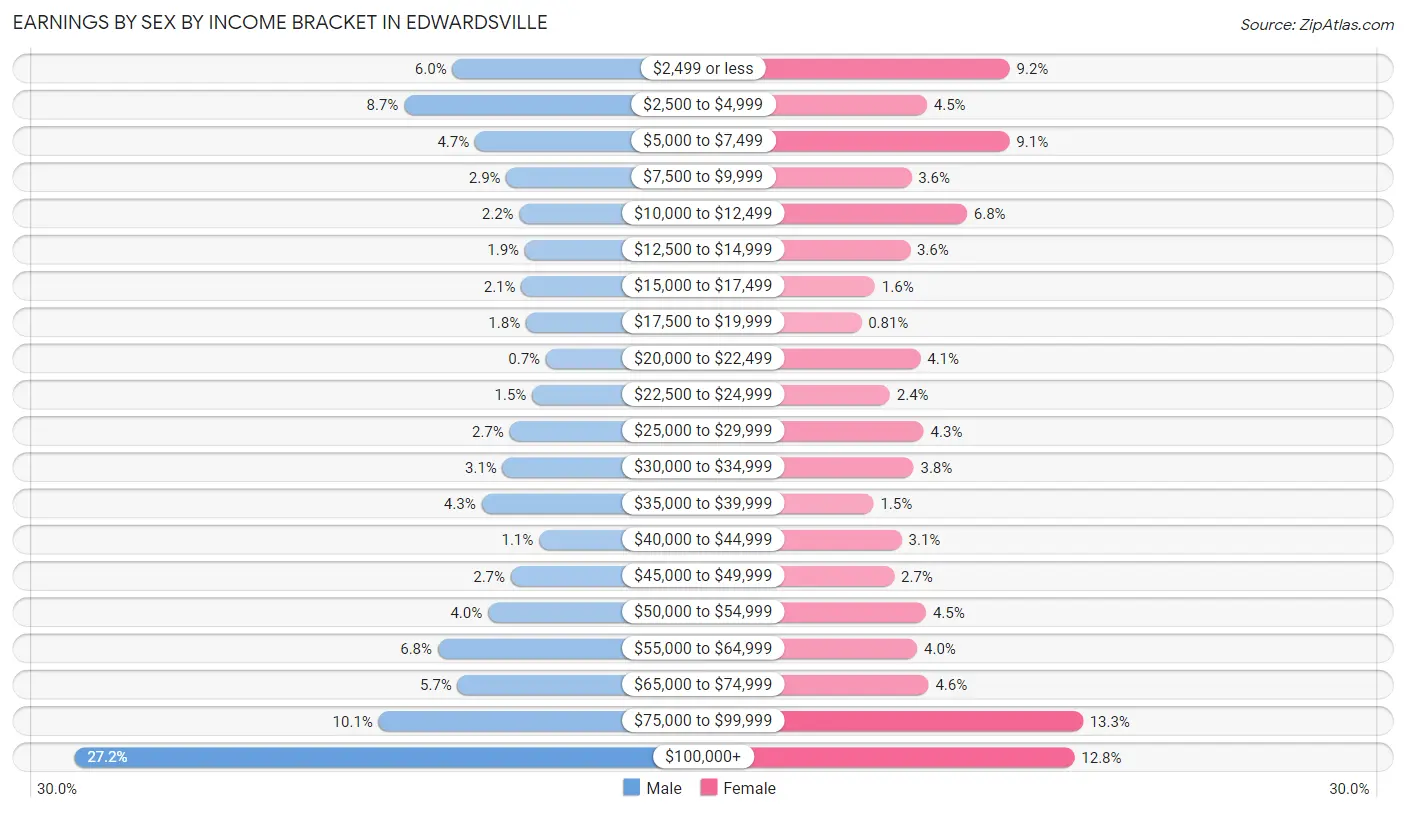
Earnings by Sex by Income Bracket in Edwardsville
The most common earnings brackets in Edwardsville are $100,000+ for men (2,058 | 27.2%) and $75,000 to $99,999 for women (1,043 | 13.3%).
| Income | Male | Female |
| $2,499 or less | 450 (5.9%) | 720 (9.1%) |
| $2,500 to $4,999 | 656 (8.7%) | 354 (4.5%) |
| $5,000 to $7,499 | 354 (4.7%) | 719 (9.1%) |
| $7,500 to $9,999 | 221 (2.9%) | 285 (3.6%) |
| $10,000 to $12,499 | 166 (2.2%) | 531 (6.8%) |
| $12,500 to $14,999 | 142 (1.9%) | 279 (3.5%) |
| $15,000 to $17,499 | 157 (2.1%) | 124 (1.6%) |
| $17,500 to $19,999 | 138 (1.8%) | 64 (0.8%) |
| $20,000 to $22,499 | 53 (0.7%) | 325 (4.1%) |
| $22,500 to $24,999 | 111 (1.5%) | 190 (2.4%) |
| $25,000 to $29,999 | 207 (2.7%) | 340 (4.3%) |
| $30,000 to $34,999 | 237 (3.1%) | 295 (3.7%) |
| $35,000 to $39,999 | 327 (4.3%) | 118 (1.5%) |
| $40,000 to $44,999 | 82 (1.1%) | 242 (3.1%) |
| $45,000 to $49,999 | 202 (2.7%) | 209 (2.7%) |
| $50,000 to $54,999 | 299 (4.0%) | 350 (4.4%) |
| $55,000 to $64,999 | 512 (6.8%) | 311 (4.0%) |
| $65,000 to $74,999 | 428 (5.7%) | 361 (4.6%) |
| $75,000 to $99,999 | 764 (10.1%) | 1,043 (13.3%) |
| $100,000+ | 2,058 (27.2%) | 1,006 (12.8%) |
| Total | 7,564 (100.0%) | 7,866 (100.0%) |
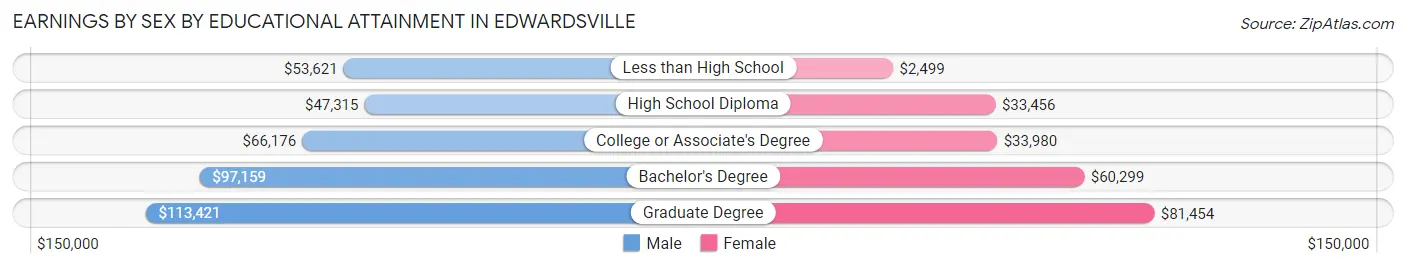
Earnings by Sex by Educational Attainment in Edwardsville
Average earnings in Edwardsville are $80,655 for men and $56,403 for women, a difference of 30.1%. Men with an educational attainment of graduate degree enjoy the highest average annual earnings of $113,421, while those with high school diploma education earn the least with $47,315. Women with an educational attainment of graduate degree earn the most with the average annual earnings of $81,454, while those with less than high school education have the smallest earnings of $2,499.
| Educational Attainment | Male Income | Female Income |
| Less than High School | $53,621 | $2,499 |
| High School Diploma | $47,315 | $33,456 |
| College or Associate's Degree | $66,176 | $33,980 |
| Bachelor's Degree | $97,159 | $60,299 |
| Graduate Degree | $113,421 | $81,454 |
| Total | $80,655 | $56,403 |
Family Income in Edwardsville
Family Income Brackets in Edwardsville
According to the Edwardsville family income data, there are 1,613 families falling into the $200,000+ income range, which is the most common income bracket and makes up 28.7% of all families. Conversely, the $10,000 to $14,999 income bracket is the least frequent group with only 22 families (0.4%) belonging to this category.
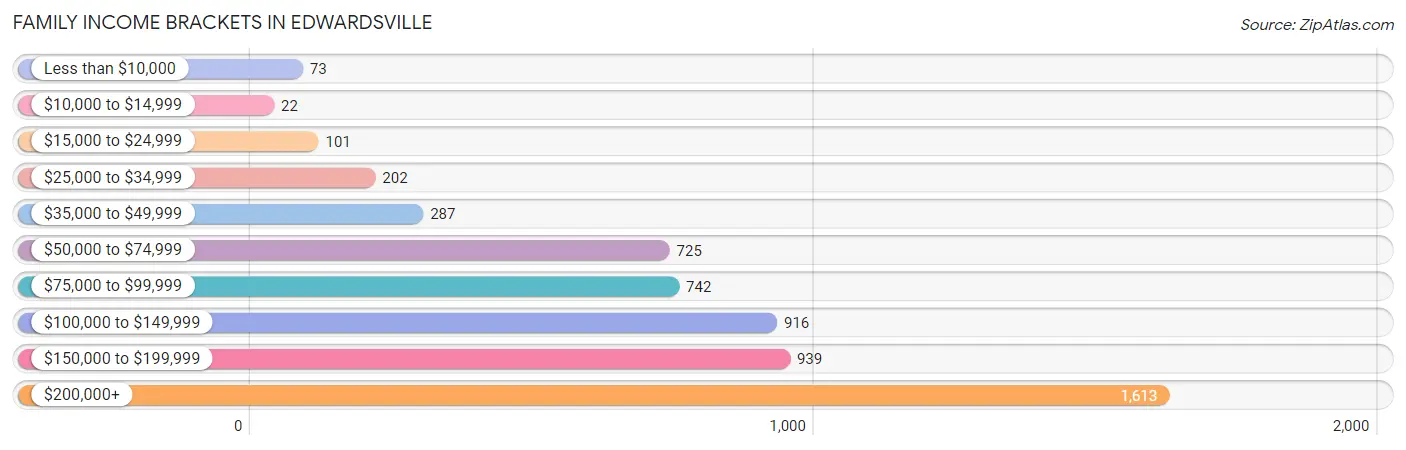
| Income Bracket | # Families | % Families |
| Less than $10,000 | 73 | 1.3% |
| $10,000 to $14,999 | 22 | 0.4% |
| $15,000 to $24,999 | 101 | 1.8% |
| $25,000 to $34,999 | 202 | 3.6% |
| $35,000 to $49,999 | 287 | 5.1% |
| $50,000 to $74,999 | 725 | 12.9% |
| $75,000 to $99,999 | 742 | 13.2% |
| $100,000 to $149,999 | 916 | 16.3% |
| $150,000 to $199,999 | 939 | 16.7% |
| $200,000+ | 1,613 | 28.7% |
Family Income by Famaliy Size in Edwardsville
6-person families (181 | 3.2%) account for the highest median family income in Edwardsville with $207,656 per family, while 2-person families (2,313 | 41.1%) have the highest median income of $47,312 per family member.
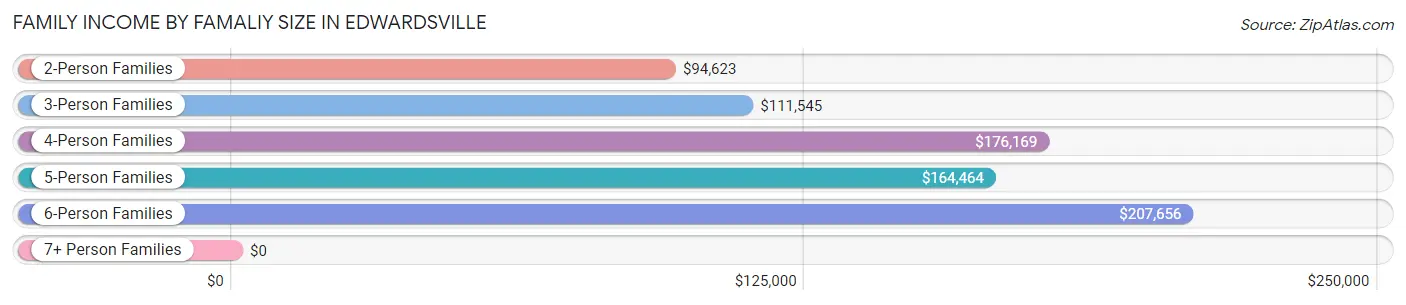
| Income Bracket | # Families | Median Income |
| 2-Person Families | 2,313 (41.1%) | $94,623 |
| 3-Person Families | 1,508 (26.8%) | $111,545 |
| 4-Person Families | 1,005 (17.9%) | $176,169 |
| 5-Person Families | 567 (10.1%) | $164,464 |
| 6-Person Families | 181 (3.2%) | $207,656 |
| 7+ Person Families | 47 (0.8%) | $0 |
| Total | 5,621 (100.0%) | $139,321 |
Family Income by Number of Earners in Edwardsville
The median family income in Edwardsville is $139,321, with families comprising 3+ earners (814) having the highest median family income of $195,909, while families with no earners (620) have the lowest median family income of $74,405, accounting for 14.5% and 11.0% of families, respectively.
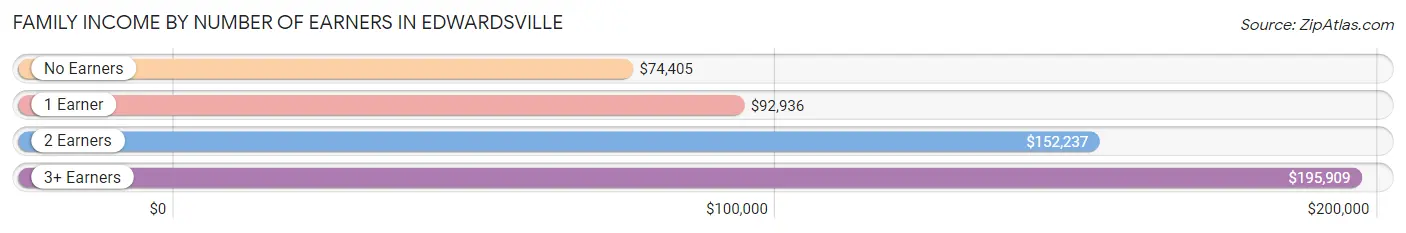
| Number of Earners | # Families | Median Income |
| No Earners | 620 (11.0%) | $74,405 |
| 1 Earner | 1,303 (23.2%) | $92,936 |
| 2 Earners | 2,884 (51.3%) | $152,237 |
| 3+ Earners | 814 (14.5%) | $195,909 |
| Total | 5,621 (100.0%) | $139,321 |
Household Income in Edwardsville
Household Income Brackets in Edwardsville
With 1,806 households falling in the category, the $200,000+ income range is the most frequent in Edwardsville, accounting for 19.3% of all households. In contrast, only 253 households (2.7%) fall into the $10,000 to $14,999 income bracket, making it the least populous group.
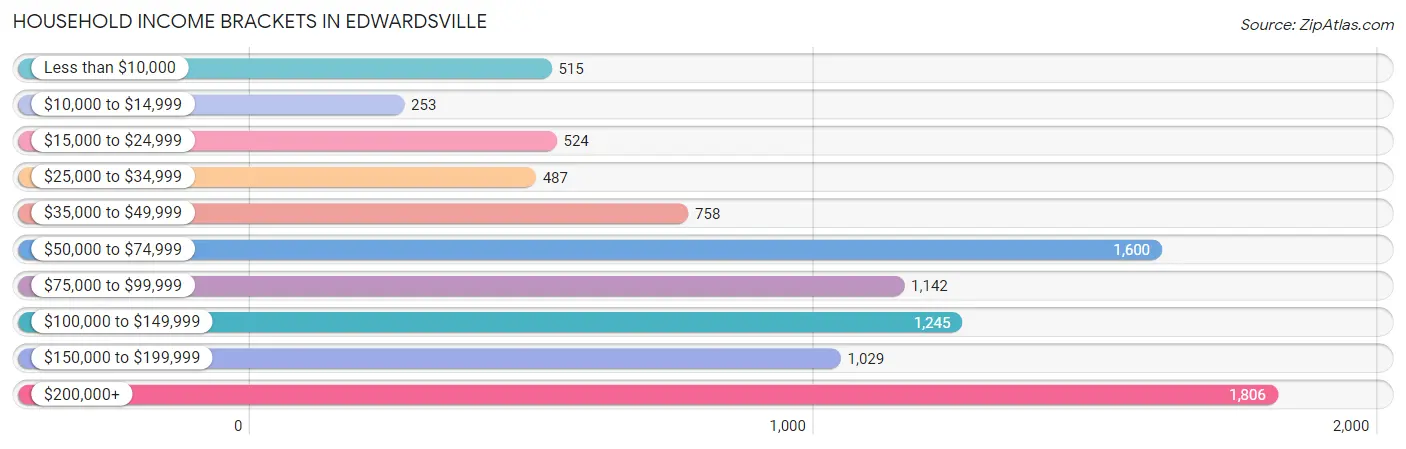
| Income Bracket | # Households | % Households |
| Less than $10,000 | 515 | 5.5% |
| $10,000 to $14,999 | 253 | 2.7% |
| $15,000 to $24,999 | 524 | 5.6% |
| $25,000 to $34,999 | 487 | 5.2% |
| $35,000 to $49,999 | 758 | 8.1% |
| $50,000 to $74,999 | 1,600 | 17.1% |
| $75,000 to $99,999 | 1,142 | 12.2% |
| $100,000 to $149,999 | 1,245 | 13.3% |
| $150,000 to $199,999 | 1,029 | 11.0% |
| $200,000+ | 1,806 | 19.3% |
Household Income by Householder Age in Edwardsville
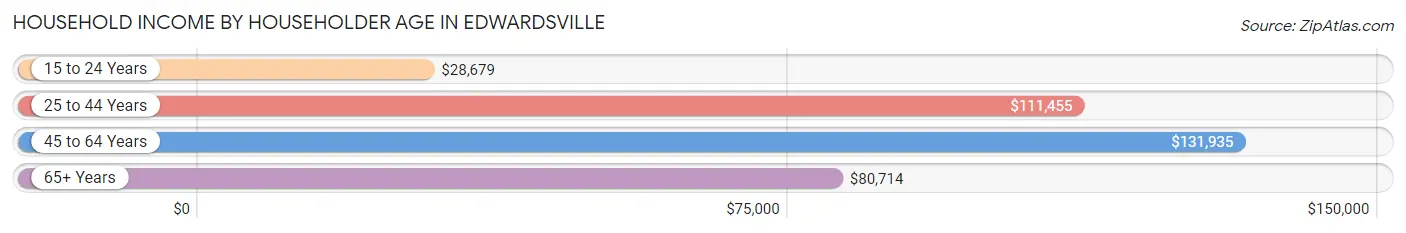
The median household income in Edwardsville is $87,094, with the highest median household income of $131,935 found in the 45 to 64 years age bracket for the primary householder. A total of 3,118 households (33.3%) fall into this category. Meanwhile, the 15 to 24 years age bracket for the primary householder has the lowest median household income of $28,679, with 1,431 households (15.3%) in this group.
| Income Bracket | # Households | Median Income |
| 15 to 24 Years | 1,431 (15.3%) | $28,679 |
| 25 to 44 Years | 2,826 (30.2%) | $111,455 |
| 45 to 64 Years | 3,118 (33.3%) | $131,935 |
| 65+ Years | 1,984 (21.2%) | $80,714 |
| Total | 9,359 (100.0%) | $87,094 |
Poverty in Edwardsville
Income Below Poverty by Sex and Age in Edwardsville
With 12.1% poverty level for males and 16.6% for females among the residents of Edwardsville, 18 to 24 year old males and 18 to 24 year old females are the most vulnerable to poverty, with 864 males (46.8%) and 1,448 females (55.3%) in their respective age groups living below the poverty level.
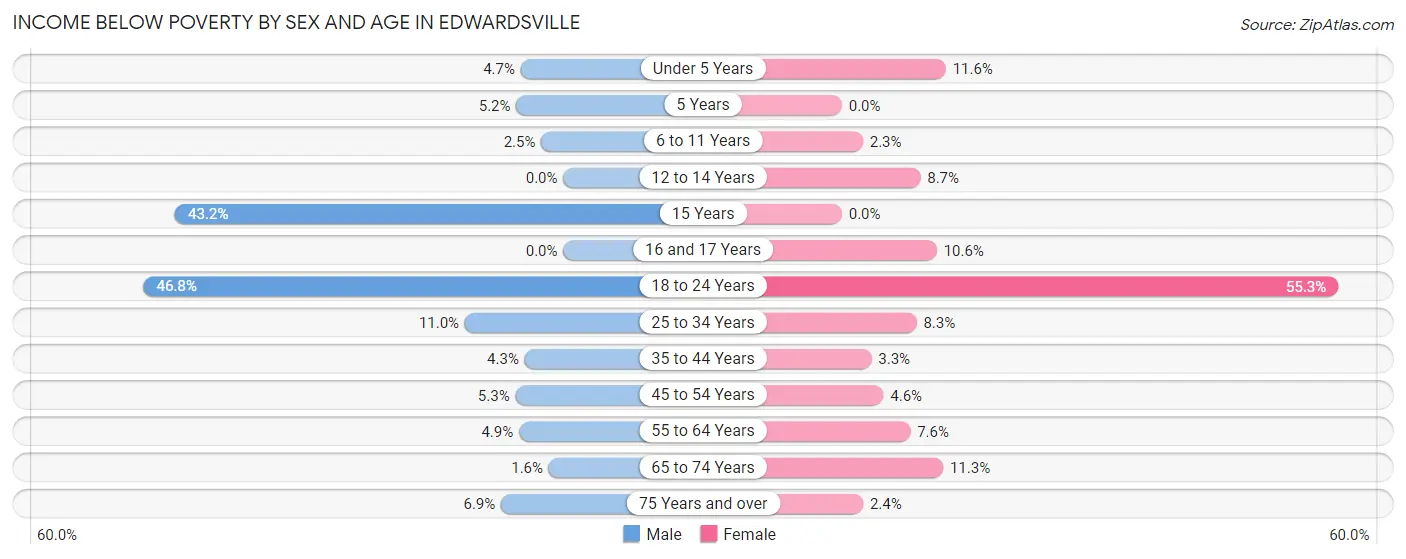
| Age Bracket | Male | Female |
| Under 5 Years | 28 (4.7%) | 92 (11.6%) |
| 5 Years | 9 (5.2%) | 0 (0.0%) |
| 6 to 11 Years | 18 (2.5%) | 20 (2.3%) |
| 12 to 14 Years | 0 (0.0%) | 32 (8.7%) |
| 15 Years | 32 (43.2%) | 0 (0.0%) |
| 16 and 17 Years | 0 (0.0%) | 24 (10.6%) |
| 18 to 24 Years | 864 (46.8%) | 1,448 (55.3%) |
| 25 to 34 Years | 152 (11.0%) | 124 (8.3%) |
| 35 to 44 Years | 60 (4.3%) | 43 (3.3%) |
| 45 to 54 Years | 84 (5.3%) | 71 (4.6%) |
| 55 to 64 Years | 59 (4.9%) | 105 (7.6%) |
| 65 to 74 Years | 12 (1.6%) | 112 (11.3%) |
| 75 Years and over | 33 (6.9%) | 16 (2.4%) |
| Total | 1,351 (12.1%) | 2,087 (16.6%) |
Income Above Poverty by Sex and Age in Edwardsville
According to the poverty statistics in Edwardsville, males aged 12 to 14 years and females aged 5 years are the age groups that are most secure financially, with 100.0% of males and 100.0% of females in these age groups living above the poverty line.
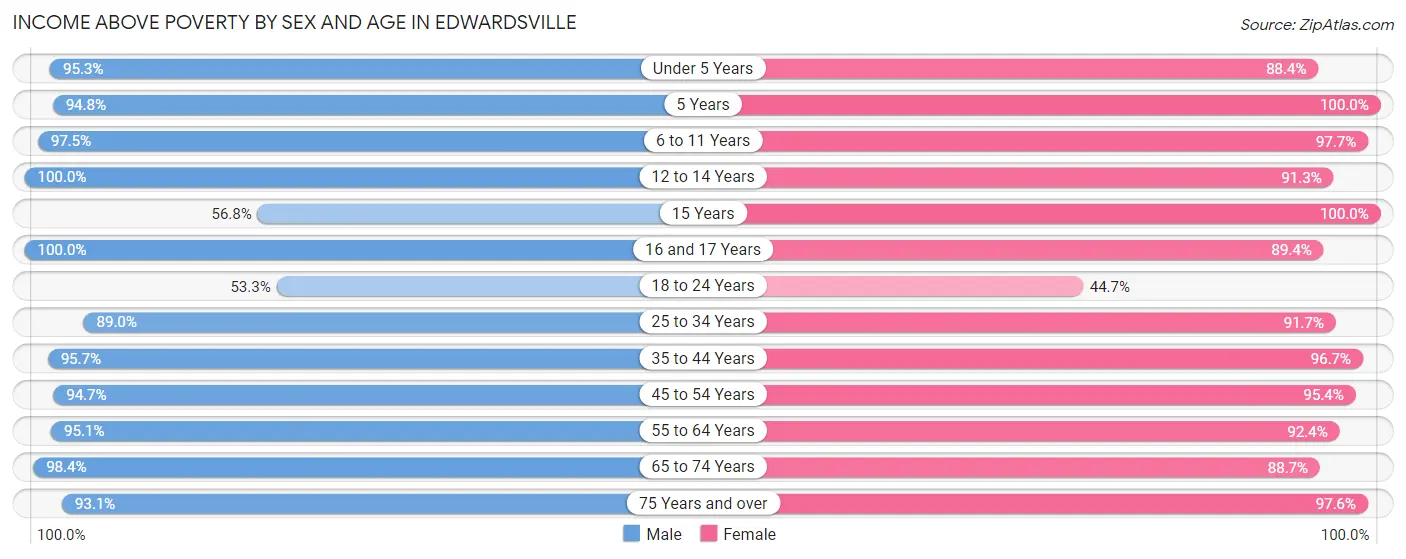
| Age Bracket | Male | Female |
| Under 5 Years | 563 (95.3%) | 703 (88.4%) |
| 5 Years | 163 (94.8%) | 142 (100.0%) |
| 6 to 11 Years | 715 (97.5%) | 835 (97.7%) |
| 12 to 14 Years | 519 (100.0%) | 334 (91.3%) |
| 15 Years | 42 (56.8%) | 179 (100.0%) |
| 16 and 17 Years | 463 (100.0%) | 203 (89.4%) |
| 18 to 24 Years | 984 (53.2%) | 1,172 (44.7%) |
| 25 to 34 Years | 1,235 (89.0%) | 1,366 (91.7%) |
| 35 to 44 Years | 1,335 (95.7%) | 1,263 (96.7%) |
| 45 to 54 Years | 1,491 (94.7%) | 1,464 (95.4%) |
| 55 to 64 Years | 1,137 (95.1%) | 1,273 (92.4%) |
| 65 to 74 Years | 734 (98.4%) | 882 (88.7%) |
| 75 Years and over | 443 (93.1%) | 662 (97.6%) |
| Total | 9,824 (87.9%) | 10,478 (83.4%) |
Income Below Poverty Among Married-Couple Families in Edwardsville
The poverty statistics for married-couple families in Edwardsville show that 1.6% or 77 of the total 4,704 families live below the poverty line. Families with 1 or 2 children have the highest poverty rate of 2.2%, comprising of 45 families. On the other hand, families with 5 or more children have the lowest poverty rate of 0.0%, which includes 0 families.
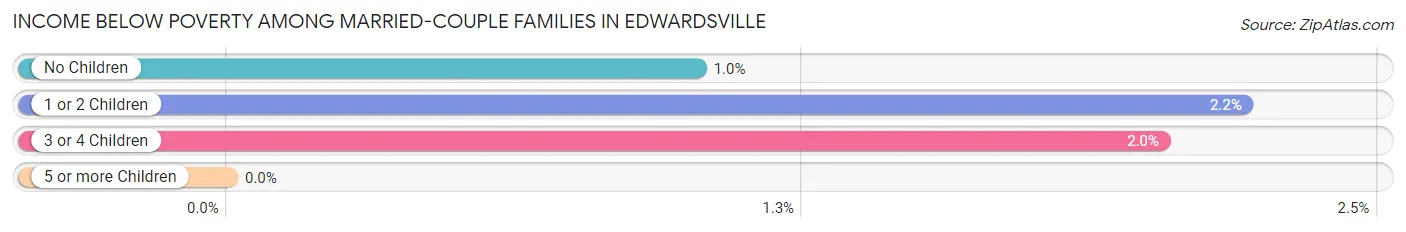
| Children | Above Poverty | Below Poverty |
| No Children | 2,137 (99.0%) | 22 (1.0%) |
| 1 or 2 Children | 1,987 (97.8%) | 45 (2.2%) |
| 3 or 4 Children | 483 (98.0%) | 10 (2.0%) |
| 5 or more Children | 20 (100.0%) | 0 (0.0%) |
| Total | 4,627 (98.4%) | 77 (1.6%) |
Income Below Poverty Among Single-Parent Households in Edwardsville
According to the poverty data in Edwardsville, 26.5% or 62 single-father households and 9.2% or 63 single-mother households are living below the poverty line. Among single-father households, those with 1 or 2 children have the highest poverty rate, with 50 households (54.9%) experiencing poverty. Likewise, among single-mother households, those with 1 or 2 children have the highest poverty rate, with 42 households (10.0%) falling below the poverty line.
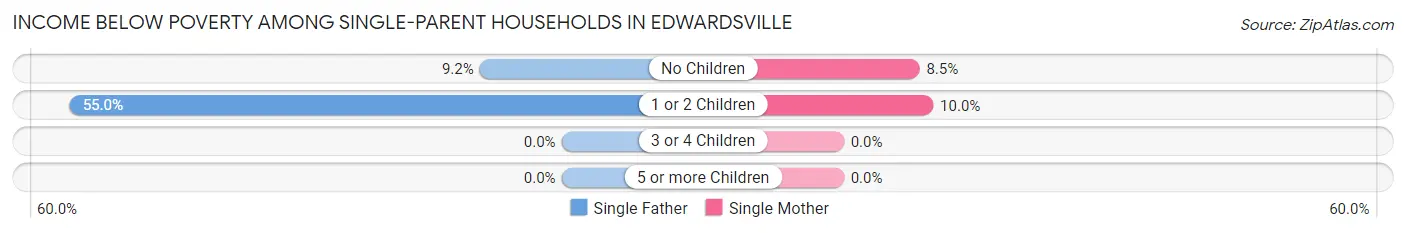
| Children | Single Father | Single Mother |
| No Children | 12 (9.2%) | 21 (8.5%) |
| 1 or 2 Children | 50 (54.9%) | 42 (10.0%) |
| 3 or 4 Children | 0 (0.0%) | 0 (0.0%) |
| 5 or more Children | 0 (0.0%) | 0 (0.0%) |
| Total | 62 (26.5%) | 63 (9.2%) |
Income Below Poverty Among Married-Couple vs Single-Parent Households in Edwardsville
The poverty data for Edwardsville shows that 77 of the married-couple family households (1.6%) and 125 of the single-parent households (13.6%) are living below the poverty level. Within the married-couple family households, those with 1 or 2 children have the highest poverty rate, with 45 households (2.2%) falling below the poverty line. Among the single-parent households, those with 1 or 2 children have the highest poverty rate, with 92 household (18.0%) living below poverty.
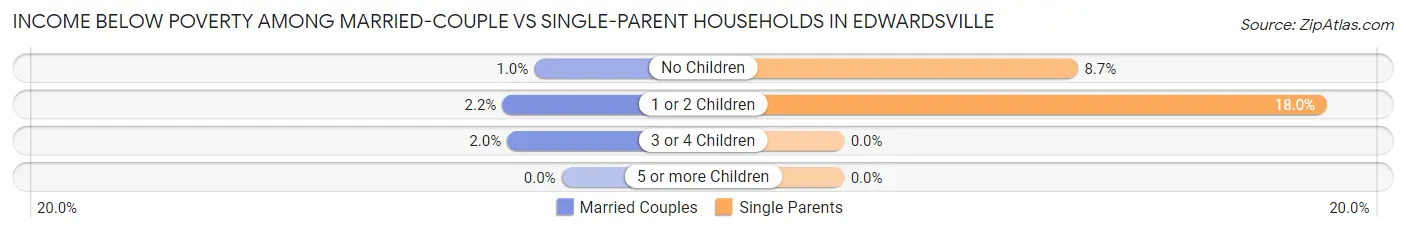
| Children | Married-Couple Families | Single-Parent Households |
| No Children | 22 (1.0%) | 33 (8.7%) |
| 1 or 2 Children | 45 (2.2%) | 92 (18.0%) |
| 3 or 4 Children | 10 (2.0%) | 0 (0.0%) |
| 5 or more Children | 0 (0.0%) | 0 (0.0%) |
| Total | 77 (1.6%) | 125 (13.6%) |
Race in Edwardsville
The most populous races in Edwardsville are White / Caucasian (22,927 | 86.1%), Black / African American (1,841 | 6.9%), and Two or more Races (1,066 | 4.0%).
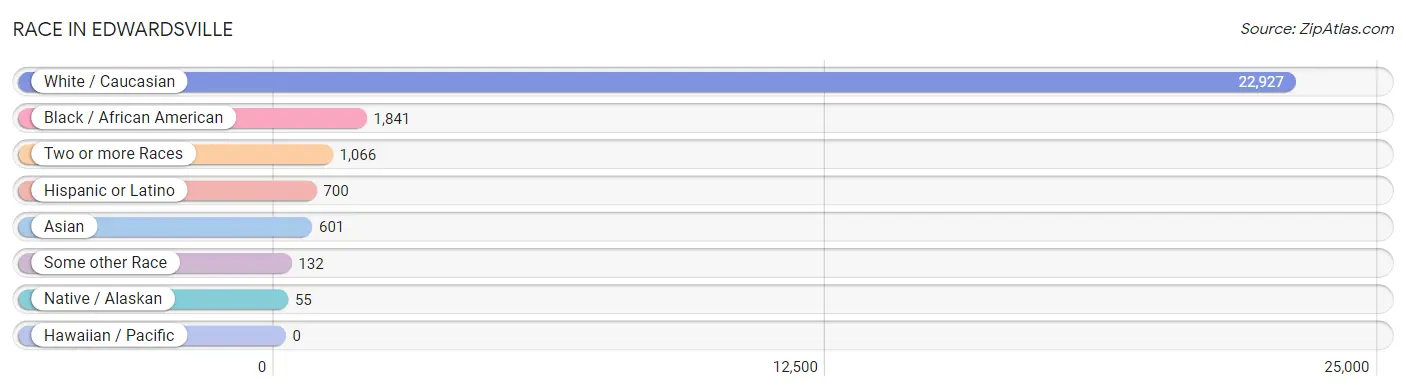
| Race | # Population | % Population |
| Asian | 601 | 2.3% |
| Black / African American | 1,841 | 6.9% |
| Hawaiian / Pacific | 0 | 0.0% |
| Hispanic or Latino | 700 | 2.6% |
| Native / Alaskan | 55 | 0.2% |
| White / Caucasian | 22,927 | 86.1% |
| Two or more Races | 1,066 | 4.0% |
| Some other Race | 132 | 0.5% |
| Total | 26,622 | 100.0% |
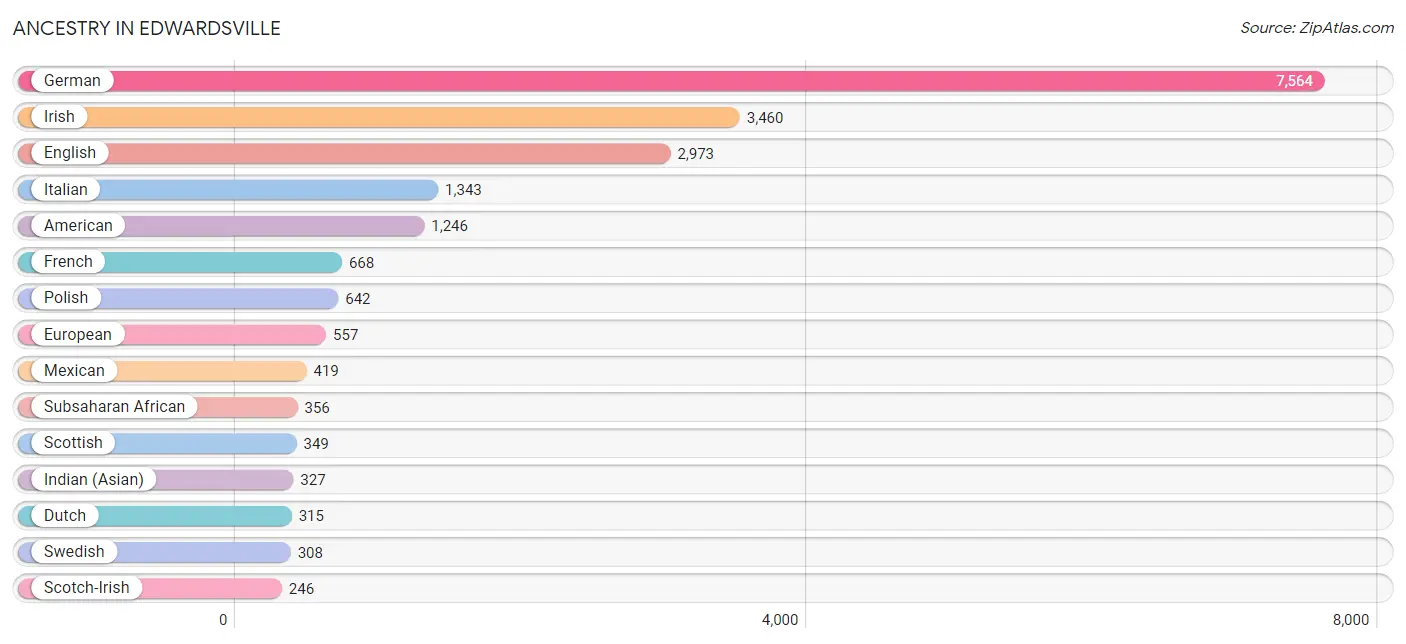
Ancestry in Edwardsville
The most populous ancestries reported in Edwardsville are German (7,564 | 28.4%), Irish (3,460 | 13.0%), English (2,973 | 11.2%), Italian (1,343 | 5.0%), and American (1,246 | 4.7%), together accounting for 62.3% of all Edwardsville residents.
| Ancestry | # Population | % Population |
| African | 90 | 0.3% |
| American | 1,246 | 4.7% |
| Armenian | 71 | 0.3% |
| Austrian | 58 | 0.2% |
| Belgian | 18 | 0.1% |
| Bhutanese | 27 | 0.1% |
| Blackfeet | 4 | 0.0% |
| Bolivian | 7 | 0.0% |
| British | 83 | 0.3% |
| Burmese | 22 | 0.1% |
| Canadian | 7 | 0.0% |
| Central American | 23 | 0.1% |
| Cherokee | 32 | 0.1% |
| Chickasaw | 10 | 0.0% |
| Colombian | 18 | 0.1% |
| Croatian | 225 | 0.9% |
| Cuban | 48 | 0.2% |
| Czech | 141 | 0.5% |
| Czechoslovakian | 54 | 0.2% |
| Danish | 54 | 0.2% |
| Dutch | 315 | 1.2% |
| Eastern European | 43 | 0.2% |
| English | 2,973 | 11.2% |
| European | 557 | 2.1% |
| French | 668 | 2.5% |
| French Canadian | 81 | 0.3% |
| German | 7,564 | 28.4% |
| Ghanaian | 199 | 0.7% |
| Greek | 172 | 0.6% |
| Guatemalan | 23 | 0.1% |
| Hungarian | 59 | 0.2% |
| Indian (Asian) | 327 | 1.2% |
| Iranian | 42 | 0.2% |
| Irish | 3,460 | 13.0% |
| Italian | 1,343 | 5.0% |
| Kenyan | 14 | 0.1% |
| Korean | 163 | 0.6% |
| Lithuanian | 114 | 0.4% |
| Lumbee | 10 | 0.0% |
| Macedonian | 23 | 0.1% |
| Mexican | 419 | 1.6% |
| Native Hawaiian | 7 | 0.0% |
| Navajo | 93 | 0.4% |
| New Zealander | 13 | 0.1% |
| Nigerian | 18 | 0.1% |
| Northern European | 102 | 0.4% |
| Norwegian | 231 | 0.9% |
| Pakistani | 85 | 0.3% |
| Pennsylvania German | 47 | 0.2% |
| Peruvian | 21 | 0.1% |
| Polish | 642 | 2.4% |
| Portuguese | 13 | 0.1% |
| Puerto Rican | 67 | 0.3% |
| Romanian | 35 | 0.1% |
| Russian | 77 | 0.3% |
| Scandinavian | 125 | 0.5% |
| Scotch-Irish | 246 | 0.9% |
| Scottish | 349 | 1.3% |
| Slovak | 23 | 0.1% |
| South American | 46 | 0.2% |
| Spanish | 44 | 0.2% |
| Sri Lankan | 40 | 0.2% |
| Subsaharan African | 356 | 1.3% |
| Swedish | 308 | 1.2% |
| Swiss | 181 | 0.7% |
| Thai | 208 | 0.8% |
| Turkish | 47 | 0.2% |
| Ukrainian | 97 | 0.4% |
| Welsh | 204 | 0.8% | View All 69 Rows |
Immigrants in Edwardsville
The most numerous immigrant groups reported in Edwardsville came from Asia (435 | 1.6%), Africa (187 | 0.7%), Eastern Asia (157 | 0.6%), China (135 | 0.5%), and Latin America (124 | 0.5%), together accounting for 3.9% of all Edwardsville residents.
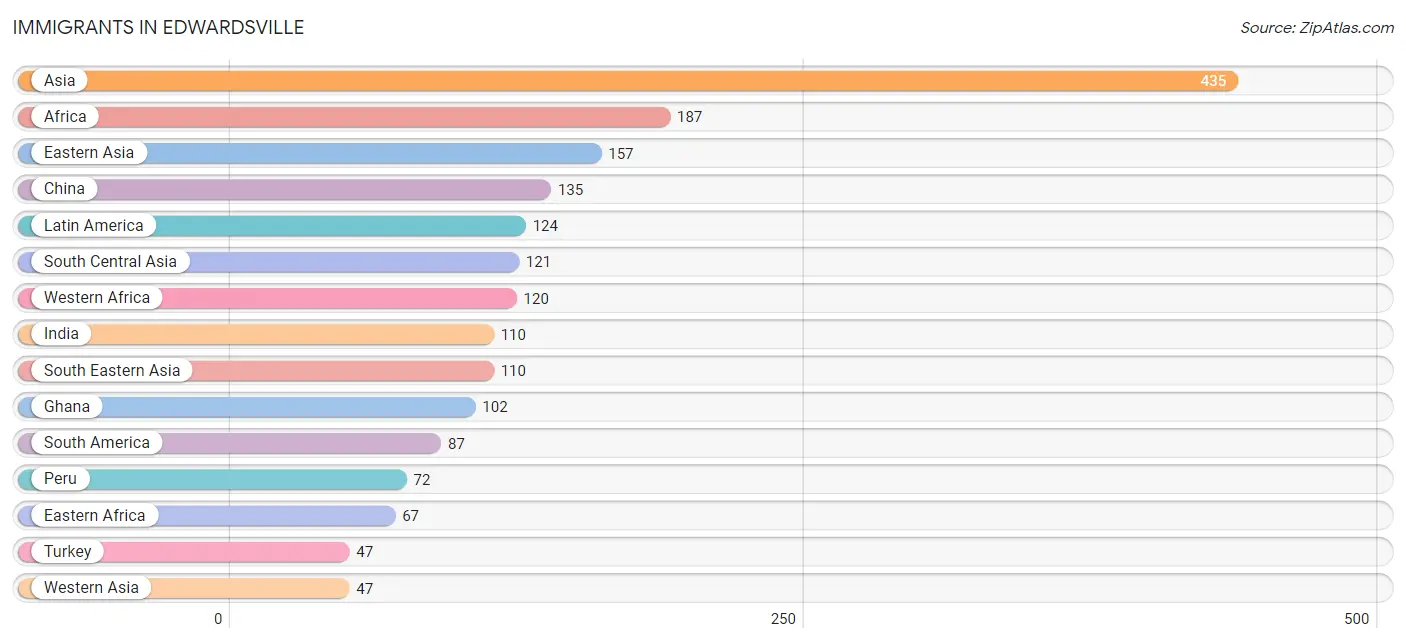
| Immigration Origin | # Population | % Population |
| Africa | 187 | 0.7% |
| Asia | 435 | 1.6% |
| Bolivia | 7 | 0.0% |
| Canada | 23 | 0.1% |
| Central America | 37 | 0.1% |
| China | 135 | 0.5% |
| Colombia | 8 | 0.0% |
| Eastern Africa | 67 | 0.3% |
| Eastern Asia | 157 | 0.6% |
| Eastern Europe | 29 | 0.1% |
| England | 7 | 0.0% |
| Europe | 36 | 0.1% |
| Ghana | 102 | 0.4% |
| Guatemala | 23 | 0.1% |
| India | 110 | 0.4% |
| Iran | 11 | 0.0% |
| Kenya | 43 | 0.2% |
| Korea | 22 | 0.1% |
| Laos | 12 | 0.1% |
| Latin America | 124 | 0.5% |
| Mexico | 14 | 0.1% |
| Nigeria | 18 | 0.1% |
| Northern Europe | 7 | 0.0% |
| Peru | 72 | 0.3% |
| Philippines | 41 | 0.2% |
| Romania | 6 | 0.0% |
| Russia | 2 | 0.0% |
| South America | 87 | 0.3% |
| South Central Asia | 121 | 0.4% |
| South Eastern Asia | 110 | 0.4% |
| Thailand | 17 | 0.1% |
| Turkey | 47 | 0.2% |
| Ukraine | 21 | 0.1% |
| Vietnam | 40 | 0.2% |
| Western Africa | 120 | 0.4% |
| Western Asia | 47 | 0.2% | View All 36 Rows |
Sex and Age in Edwardsville
Sex and Age in Edwardsville
The most populous age groups in Edwardsville are 20 to 24 Years (2,016 | 16.0%) for men and 20 to 24 Years (2,436 | 17.4%) for women.
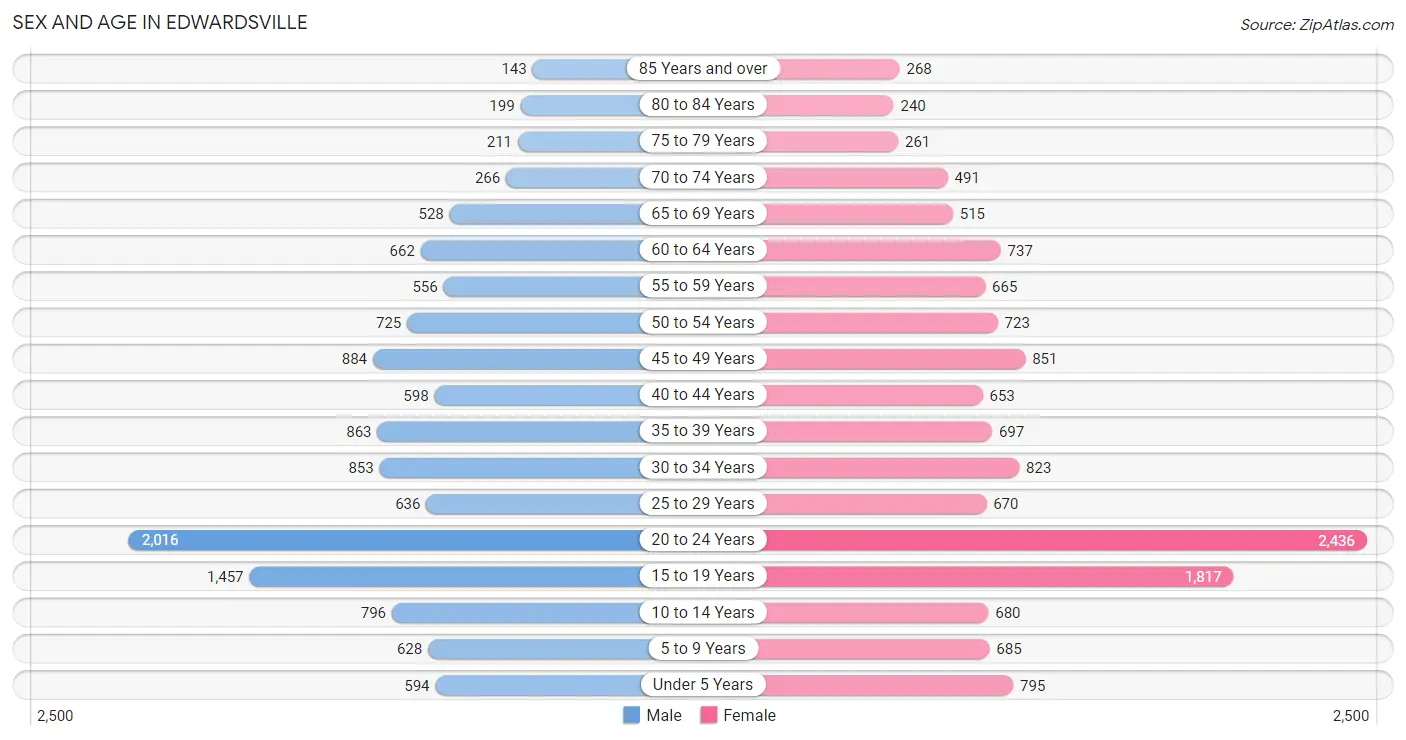
| Age Bracket | Male | Female |
| Under 5 Years | 594 (4.7%) | 795 (5.7%) |
| 5 to 9 Years | 628 (5.0%) | 685 (4.9%) |
| 10 to 14 Years | 796 (6.3%) | 680 (4.9%) |
| 15 to 19 Years | 1,457 (11.6%) | 1,817 (13.0%) |
| 20 to 24 Years | 2,016 (16.0%) | 2,436 (17.4%) |
| 25 to 29 Years | 636 (5.0%) | 670 (4.8%) |
| 30 to 34 Years | 853 (6.8%) | 823 (5.9%) |
| 35 to 39 Years | 863 (6.8%) | 697 (5.0%) |
| 40 to 44 Years | 598 (4.7%) | 653 (4.7%) |
| 45 to 49 Years | 884 (7.0%) | 851 (6.1%) |
| 50 to 54 Years | 725 (5.8%) | 723 (5.2%) |
| 55 to 59 Years | 556 (4.4%) | 665 (4.8%) |
| 60 to 64 Years | 662 (5.2%) | 737 (5.3%) |
| 65 to 69 Years | 528 (4.2%) | 515 (3.7%) |
| 70 to 74 Years | 266 (2.1%) | 491 (3.5%) |
| 75 to 79 Years | 211 (1.7%) | 261 (1.9%) |
| 80 to 84 Years | 199 (1.6%) | 240 (1.7%) |
| 85 Years and over | 143 (1.1%) | 268 (1.9%) |
| Total | 12,615 (100.0%) | 14,007 (100.0%) |
Families and Households in Edwardsville
Median Family Size in Edwardsville
The median family size in Edwardsville is 3.10 persons per family, with married-couple families (4,704 | 83.7%) accounting for the largest median family size of 3.22 persons per family. On the other hand, single male/father families (234 | 4.2%) represent the smallest median family size with 2.26 persons per family.
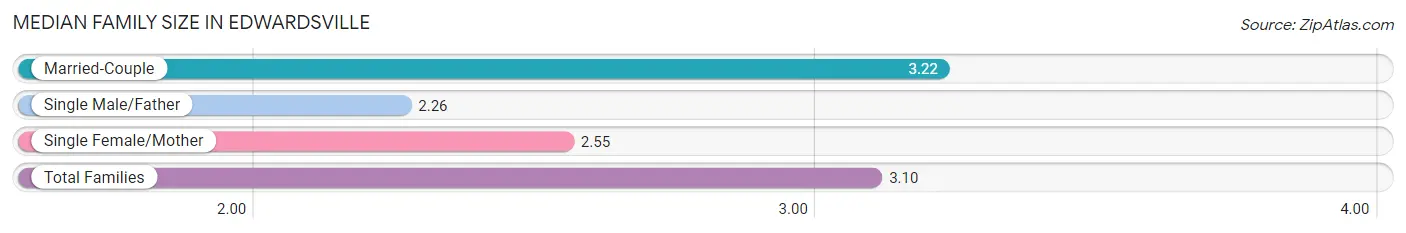
| Family Type | # Families | Family Size |
| Married-Couple | 4,704 (83.7%) | 3.22 |
| Single Male/Father | 234 (4.2%) | 2.26 |
| Single Female/Mother | 683 (12.1%) | 2.55 |
| Total Families | 5,621 (100.0%) | 3.10 |
Median Household Size in Edwardsville
The median household size in Edwardsville is 2.53 persons per household, with married-couple households (4,704 | 50.3%) accounting for the largest median household size of 3.22 persons per household. non-family households (3,738 | 39.9%) represent the smallest median household size with 1.61 persons per household.
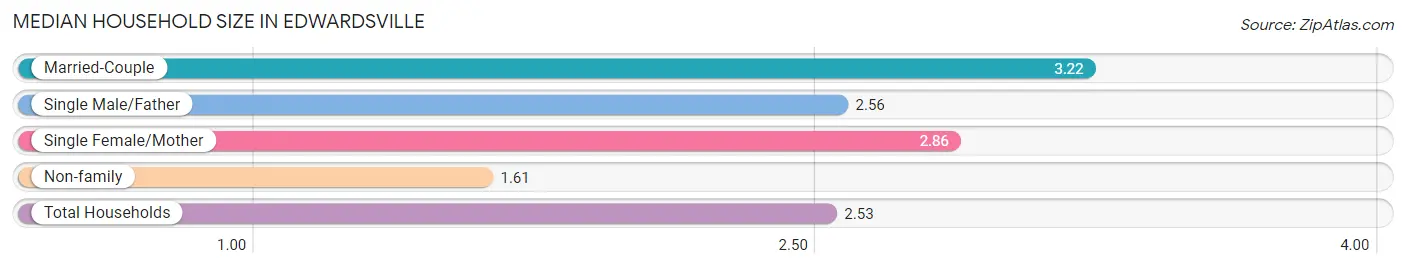
| Household Type | # Households | Household Size |
| Married-Couple | 4,704 (50.3%) | 3.22 |
| Single Male/Father | 234 (2.5%) | 2.56 |
| Single Female/Mother | 683 (7.3%) | 2.86 |
| Non-family | 3,738 (39.9%) | 1.61 |
| Total Households | 9,359 (100.0%) | 2.53 |
Household Size by Marriage Status in Edwardsville
Out of a total of 9,359 households in Edwardsville, 5,621 (60.1%) are family households, while 3,738 (39.9%) are nonfamily households. The most numerous type of family households are 2-person households, comprising 2,148, and the most common type of nonfamily households are 1-person households, comprising 2,369.
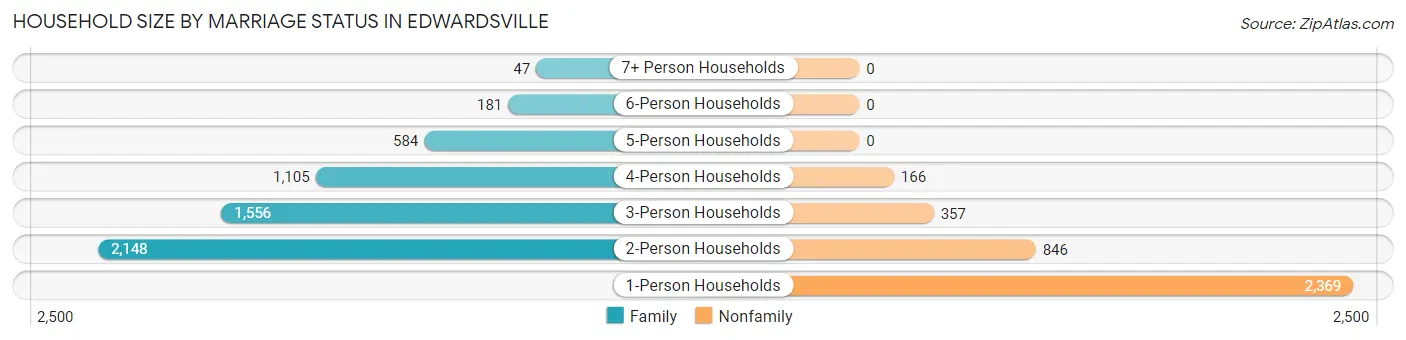
| Household Size | Family Households | Nonfamily Households |
| 1-Person Households | - | 2,369 (25.3%) |
| 2-Person Households | 2,148 (23.0%) | 846 (9.0%) |
| 3-Person Households | 1,556 (16.6%) | 357 (3.8%) |
| 4-Person Households | 1,105 (11.8%) | 166 (1.8%) |
| 5-Person Households | 584 (6.2%) | 0 (0.0%) |
| 6-Person Households | 181 (1.9%) | 0 (0.0%) |
| 7+ Person Households | 47 (0.5%) | 0 (0.0%) |
| Total | 5,621 (60.1%) | 3,738 (39.9%) |
Female Fertility in Edwardsville
Fertility by Age in Edwardsville
Average fertility rate in Edwardsville is 39.0 births per 1,000 women. Women in the age bracket of 20 to 34 years have the highest fertility rate with 57.0 births per 1,000 women. Women in the age bracket of 20 to 34 years acount for 70.5% of all women with births.
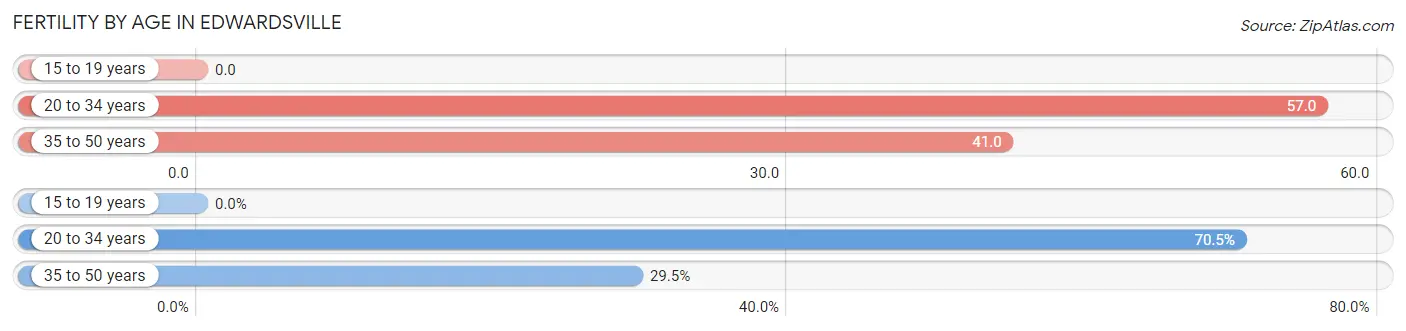
| Age Bracket | Women with Births | Births / 1,000 Women |
| 15 to 19 years | 0 (0.0%) | 0.0 |
| 20 to 34 years | 222 (70.5%) | 57.0 |
| 35 to 50 years | 93 (29.5%) | 41.0 |
| Total | 315 (100.0%) | 39.0 |
Fertility by Age by Marriage Status in Edwardsville
85.1% of women with births (315) in Edwardsville are married. The highest percentage of unmarried women with births falls into 20 to 34 years age bracket with 15.8% of them unmarried at the time of birth, while the lowest percentage of unmarried women with births belong to 35 to 50 years age bracket with 12.9% of them unmarried.
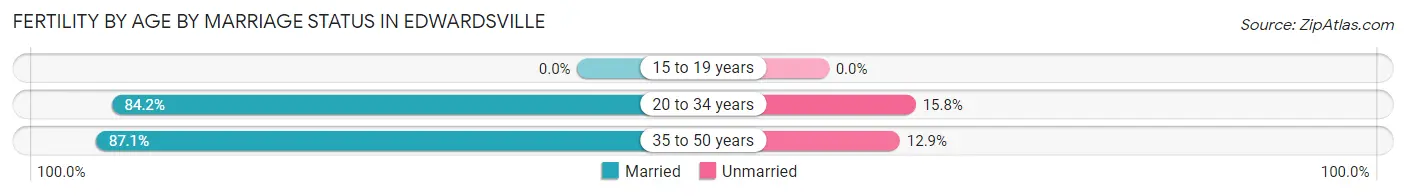
| Age Bracket | Married | Unmarried |
| 15 to 19 years | 0 (0.0%) | 0 (0.0%) |
| 20 to 34 years | 187 (84.2%) | 35 (15.8%) |
| 35 to 50 years | 81 (87.1%) | 12 (12.9%) |
| Total | 268 (85.1%) | 47 (14.9%) |
Fertility by Education in Edwardsville
Average fertility rate in Edwardsville is 39.0 births per 1,000 women. Women with the education attainment of graduate degree have the highest fertility rate of 142.0 births per 1,000 women, while women with the education attainment of less than high school have the lowest fertility at 3.0 births per 1,000 women. Women with the education attainment of graduate degree represent 51.7% of all women with births.
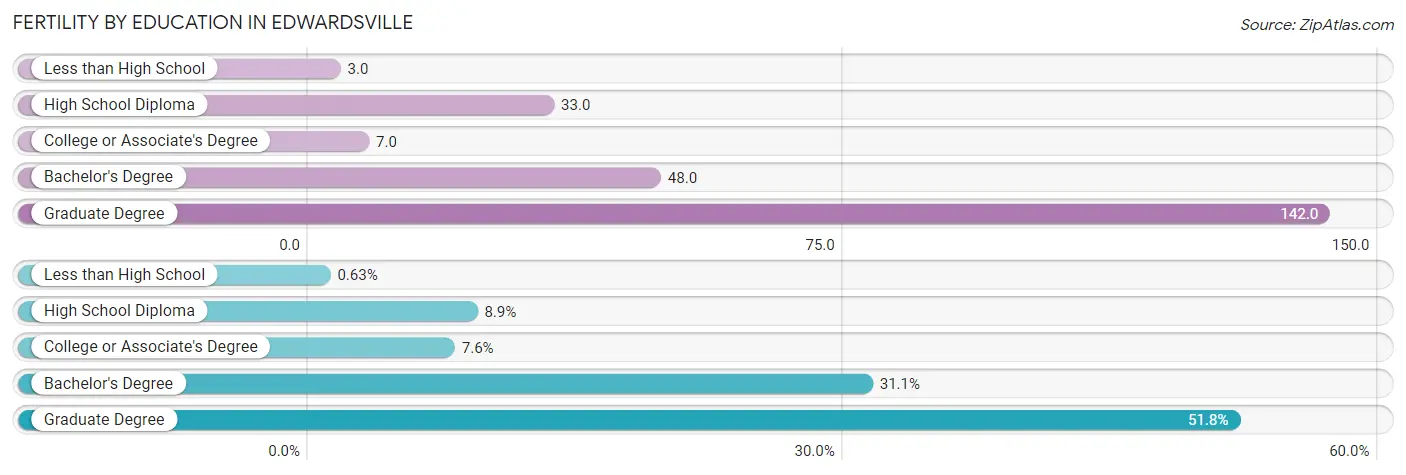
| Educational Attainment | Women with Births | Births / 1,000 Women |
| Less than High School | 2 (0.6%) | 3.0 |
| High School Diploma | 28 (8.9%) | 33.0 |
| College or Associate's Degree | 24 (7.6%) | 7.0 |
| Bachelor's Degree | 98 (31.1%) | 48.0 |
| Graduate Degree | 163 (51.7%) | 142.0 |
| Total | 315 (100.0%) | 39.0 |
Fertility by Education by Marriage Status in Edwardsville
14.9% of women with births in Edwardsville are unmarried. Women with the educational attainment of high school diploma are most likely to be married with 100.0% of them married at childbirth, while women with the educational attainment of less than high school are least likely to be married with 100.0% of them unmarried at childbirth.
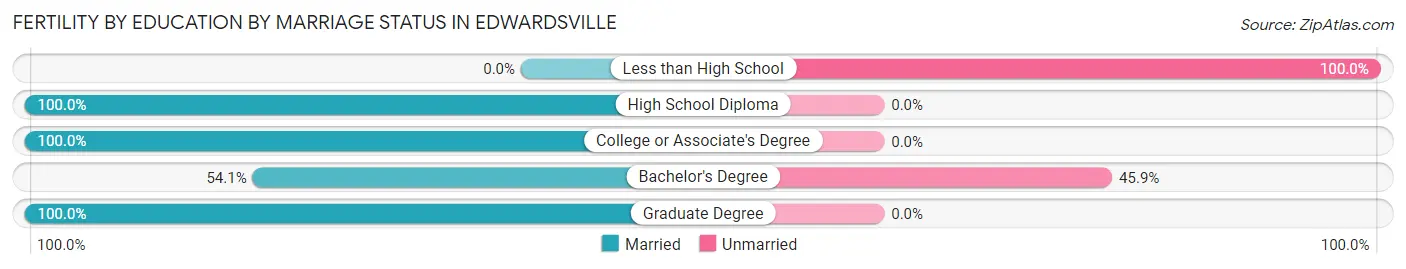
| Educational Attainment | Married | Unmarried |
| Less than High School | 0 (0.0%) | 2 (100.0%) |
| High School Diploma | 28 (100.0%) | 0 (0.0%) |
| College or Associate's Degree | 24 (100.0%) | 0 (0.0%) |
| Bachelor's Degree | 53 (54.1%) | 45 (45.9%) |
| Graduate Degree | 163 (100.0%) | 0 (0.0%) |
| Total | 268 (85.1%) | 47 (14.9%) |
Employment Characteristics in Edwardsville
Employment by Class of Employer in Edwardsville
Among the 12,866 employed individuals in Edwardsville, private company employees (8,473 | 65.9%), not-for-profit organizations (1,103 | 8.6%), and local government employees (1,071 | 8.3%) make up the most common classes of employment.
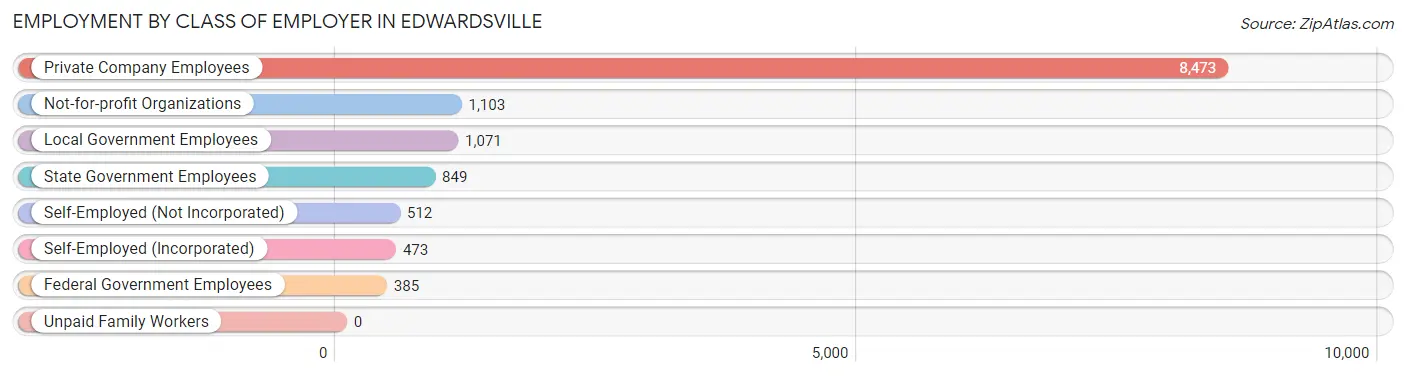
| Employer Class | # Employees | % Employees |
| Private Company Employees | 8,473 | 65.9% |
| Self-Employed (Incorporated) | 473 | 3.7% |
| Self-Employed (Not Incorporated) | 512 | 4.0% |
| Not-for-profit Organizations | 1,103 | 8.6% |
| Local Government Employees | 1,071 | 8.3% |
| State Government Employees | 849 | 6.6% |
| Federal Government Employees | 385 | 3.0% |
| Unpaid Family Workers | 0 | 0.0% |
| Total | 12,866 | 100.0% |
Employment Status by Age in Edwardsville
According to the labor force statistics for Edwardsville, out of the total population over 16 years of age (22,189), 62.6% or 13,890 individuals are in the labor force, with 6.3% or 875 of them unemployed. The age group with the highest labor force participation rate is 30 to 34 years, with 92.4% or 1,549 individuals in the labor force. Within the labor force, the 16 to 19 years age range has the highest percentage of unemployed individuals, with 16.0% or 173 of them being unemployed.
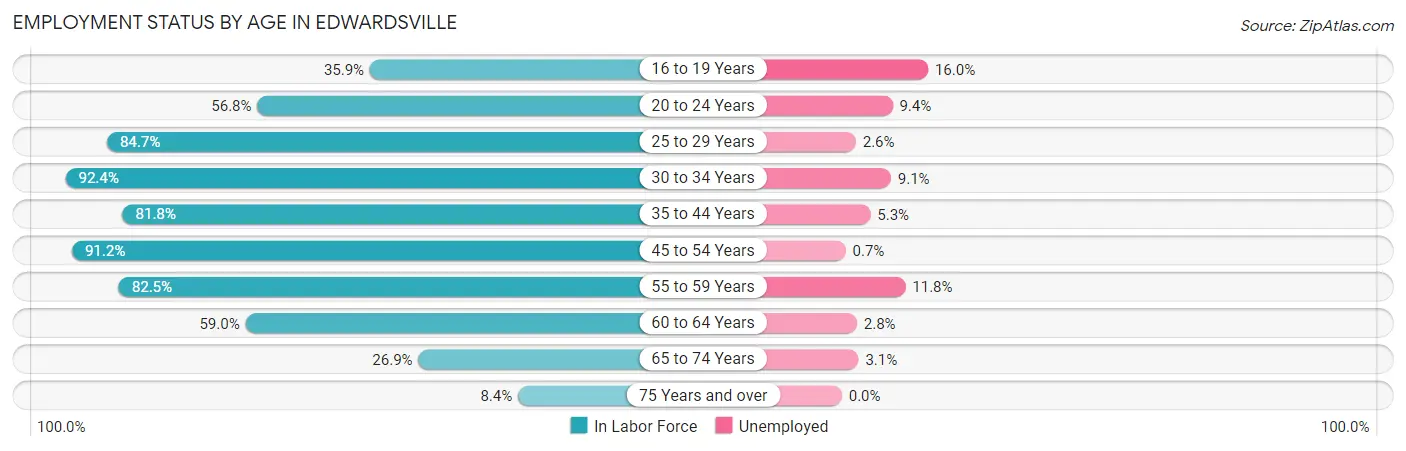
| Age Bracket | In Labor Force | Unemployed |
| 16 to 19 Years | 1,084 (35.9%) | 173 (16.0%) |
| 20 to 24 Years | 2,529 (56.8%) | 238 (9.4%) |
| 25 to 29 Years | 1,106 (84.7%) | 29 (2.6%) |
| 30 to 34 Years | 1,549 (92.4%) | 141 (9.1%) |
| 35 to 44 Years | 2,299 (81.8%) | 122 (5.3%) |
| 45 to 54 Years | 2,903 (91.2%) | 20 (0.7%) |
| 55 to 59 Years | 1,007 (82.5%) | 119 (11.8%) |
| 60 to 64 Years | 825 (59.0%) | 23 (2.8%) |
| 65 to 74 Years | 484 (26.9%) | 15 (3.1%) |
| 75 Years and over | 111 (8.4%) | 0 (0.0%) |
| Total | 13,890 (62.6%) | 875 (6.3%) |
Employment Status by Educational Attainment in Edwardsville
According to labor force statistics for Edwardsville, 83.6% of individuals (9,694) out of the total population between 25 and 64 years of age (11,596) are in the labor force, with 4.7% or 456 of them being unemployed. The group with the highest labor force participation rate are those with the educational attainment of bachelor's degree or higher, with 89.9% or 5,813 individuals in the labor force. Within the labor force, individuals with less than high school education have the highest percentage of unemployment, with 55.9% or 123 of them being unemployed.
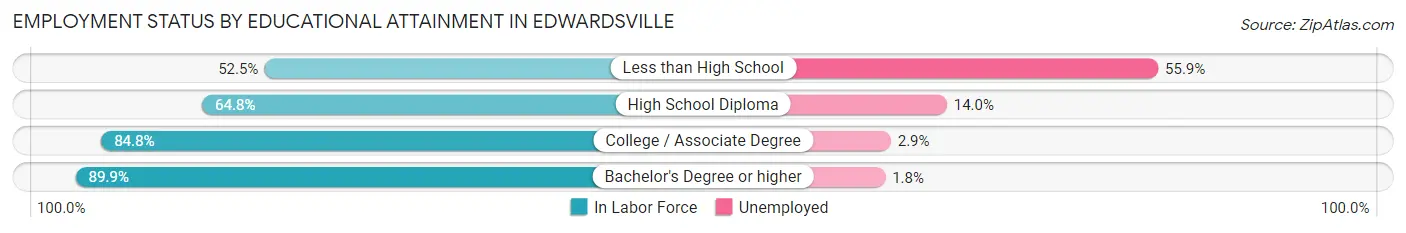
| Educational Attainment | In Labor Force | Unemployed |
| Less than High School | 220 (52.5%) | 234 (55.9%) |
| High School Diploma | 1,082 (64.8%) | 234 (14.0%) |
| College / Associate Degree | 2,579 (84.8%) | 88 (2.9%) |
| Bachelor's Degree or higher | 5,813 (89.9%) | 116 (1.8%) |
| Total | 9,694 (83.6%) | 545 (4.7%) |
Employment Occupations by Sex in Edwardsville
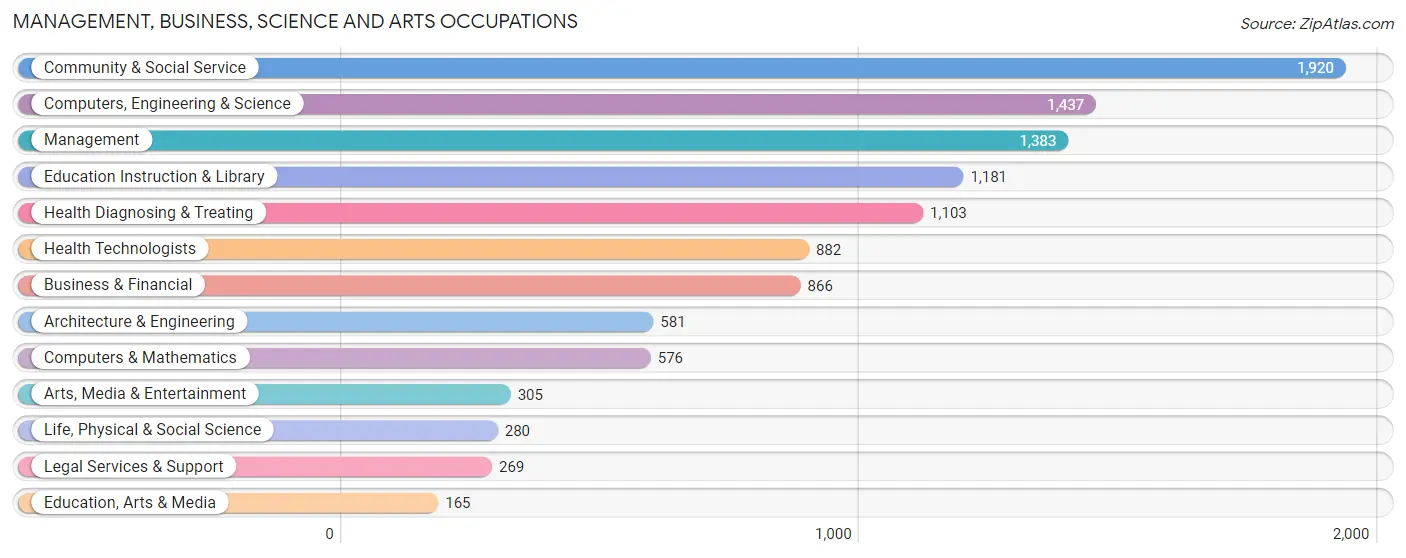
Management, Business, Science and Arts Occupations
The most common Management, Business, Science and Arts occupations in Edwardsville are Community & Social Service (1,920 | 14.7%), Computers, Engineering & Science (1,437 | 11.0%), Management (1,383 | 10.6%), Education Instruction & Library (1,181 | 9.1%), and Health Diagnosing & Treating (1,103 | 8.5%).
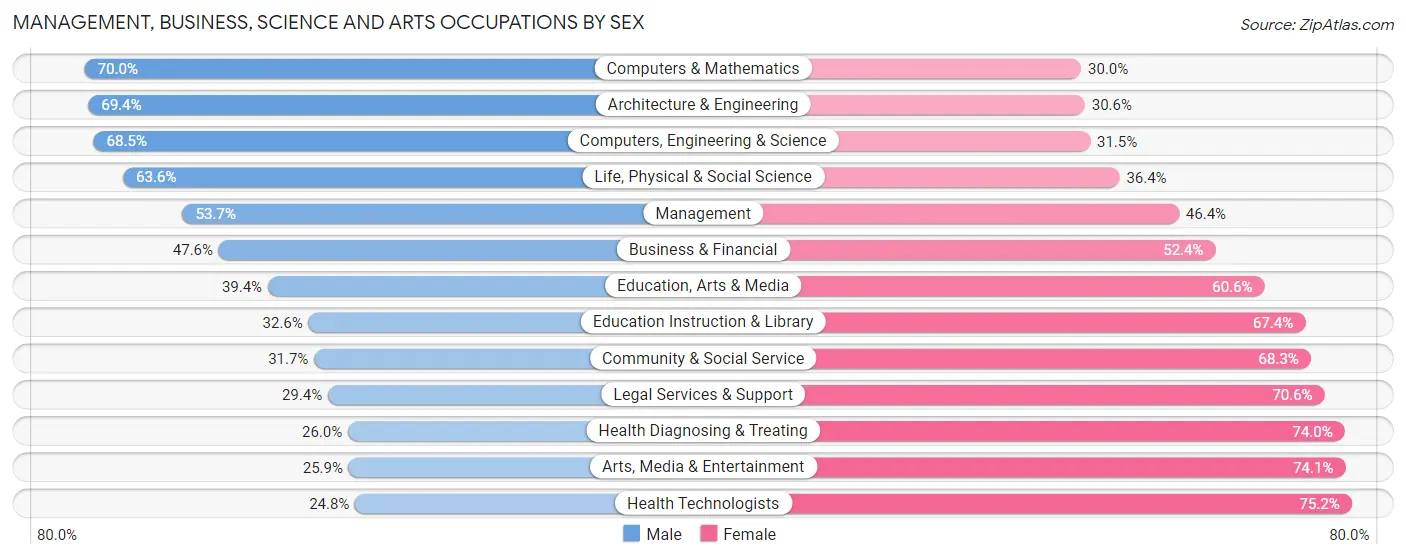
Management, Business, Science and Arts Occupations by Sex
Within the Management, Business, Science and Arts occupations in Edwardsville, the most male-oriented occupations are Computers & Mathematics (70.0%), Architecture & Engineering (69.4%), and Computers, Engineering & Science (68.5%), while the most female-oriented occupations are Health Technologists (75.2%), Arts, Media & Entertainment (74.1%), and Health Diagnosing & Treating (74.0%).
| Occupation | Male | Female |
| Management | 742 (53.6%) | 641 (46.4%) |
| Business & Financial | 412 (47.6%) | 454 (52.4%) |
| Computers, Engineering & Science | 984 (68.5%) | 453 (31.5%) |
| Computers & Mathematics | 403 (70.0%) | 173 (30.0%) |
| Architecture & Engineering | 403 (69.4%) | 178 (30.6%) |
| Life, Physical & Social Science | 178 (63.6%) | 102 (36.4%) |
| Community & Social Service | 608 (31.7%) | 1,312 (68.3%) |
| Education, Arts & Media | 65 (39.4%) | 100 (60.6%) |
| Legal Services & Support | 79 (29.4%) | 190 (70.6%) |
| Education Instruction & Library | 385 (32.6%) | 796 (67.4%) |
| Arts, Media & Entertainment | 79 (25.9%) | 226 (74.1%) |
| Health Diagnosing & Treating | 287 (26.0%) | 816 (74.0%) |
| Health Technologists | 219 (24.8%) | 663 (75.2%) |
| Total (Category) | 3,033 (45.2%) | 3,676 (54.8%) |
| Total (Overall) | 6,321 (48.6%) | 6,693 (51.4%) |
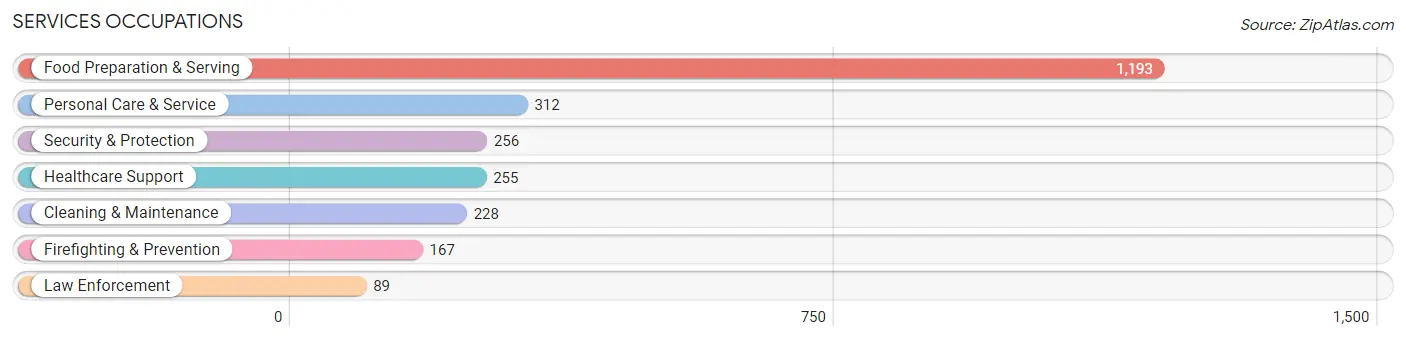
Services Occupations
The most common Services occupations in Edwardsville are Food Preparation & Serving (1,193 | 9.2%), Personal Care & Service (312 | 2.4%), Security & Protection (256 | 2.0%), Healthcare Support (255 | 2.0%), and Cleaning & Maintenance (228 | 1.8%).
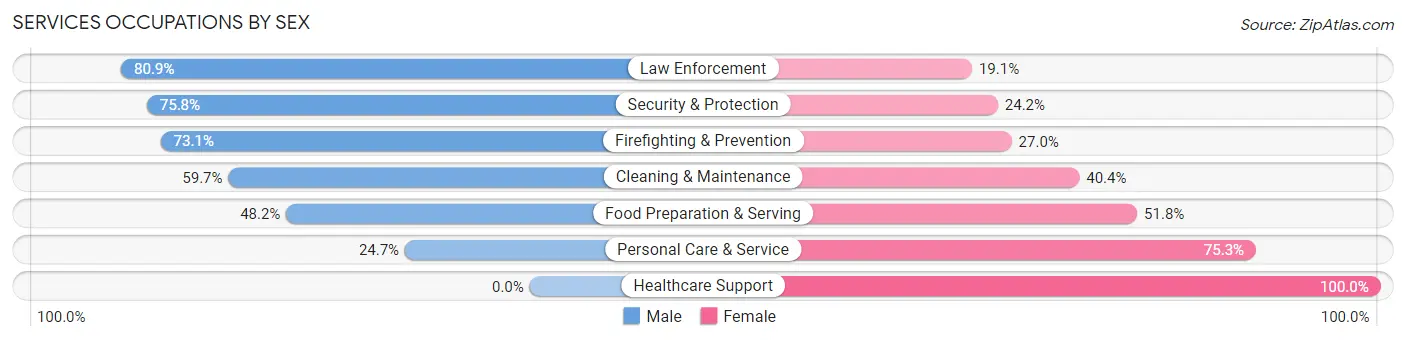
Services Occupations by Sex
Within the Services occupations in Edwardsville, the most male-oriented occupations are Law Enforcement (80.9%), Security & Protection (75.8%), and Firefighting & Prevention (73.1%), while the most female-oriented occupations are Healthcare Support (100.0%), Personal Care & Service (75.3%), and Food Preparation & Serving (51.8%).
| Occupation | Male | Female |
| Healthcare Support | 0 (0.0%) | 255 (100.0%) |
| Security & Protection | 194 (75.8%) | 62 (24.2%) |
| Firefighting & Prevention | 122 (73.1%) | 45 (27.0%) |
| Law Enforcement | 72 (80.9%) | 17 (19.1%) |
| Food Preparation & Serving | 575 (48.2%) | 618 (51.8%) |
| Cleaning & Maintenance | 136 (59.7%) | 92 (40.4%) |
| Personal Care & Service | 77 (24.7%) | 235 (75.3%) |
| Total (Category) | 982 (43.8%) | 1,262 (56.2%) |
| Total (Overall) | 6,321 (48.6%) | 6,693 (51.4%) |
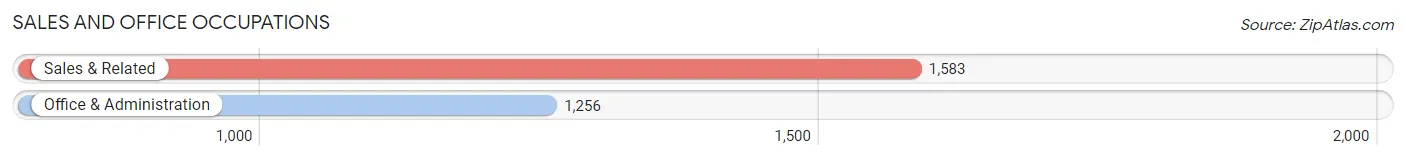
Sales and Office Occupations
The most common Sales and Office occupations in Edwardsville are Sales & Related (1,583 | 12.2%), and Office & Administration (1,256 | 9.7%).
Sales and Office Occupations by Sex
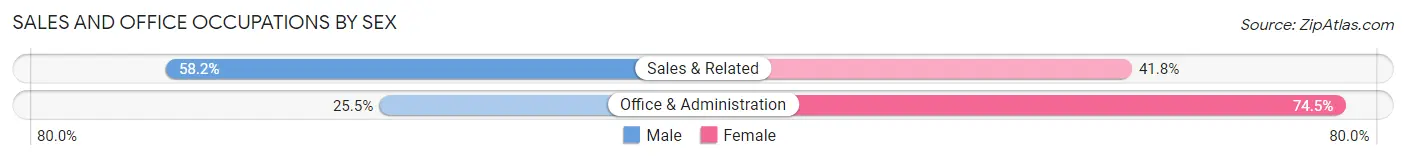
| Occupation | Male | Female |
| Sales & Related | 922 (58.2%) | 661 (41.8%) |
| Office & Administration | 320 (25.5%) | 936 (74.5%) |
| Total (Category) | 1,242 (43.8%) | 1,597 (56.2%) |
| Total (Overall) | 6,321 (48.6%) | 6,693 (51.4%) |
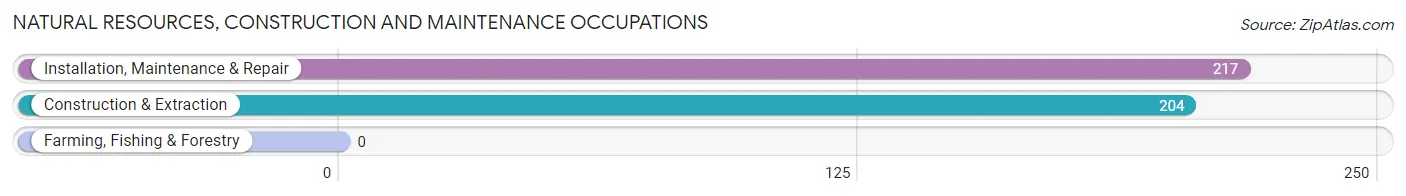
Natural Resources, Construction and Maintenance Occupations
The most common Natural Resources, Construction and Maintenance occupations in Edwardsville are Installation, Maintenance & Repair (217 | 1.7%), and Construction & Extraction (204 | 1.6%).
Natural Resources, Construction and Maintenance Occupations by Sex
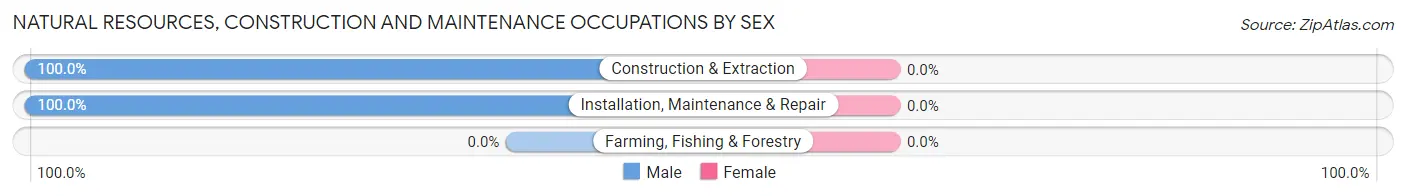
| Occupation | Male | Female |
| Farming, Fishing & Forestry | 0 (0.0%) | 0 (0.0%) |
| Construction & Extraction | 204 (100.0%) | 0 (0.0%) |
| Installation, Maintenance & Repair | 217 (100.0%) | 0 (0.0%) |
| Total (Category) | 421 (100.0%) | 0 (0.0%) |
| Total (Overall) | 6,321 (48.6%) | 6,693 (51.4%) |
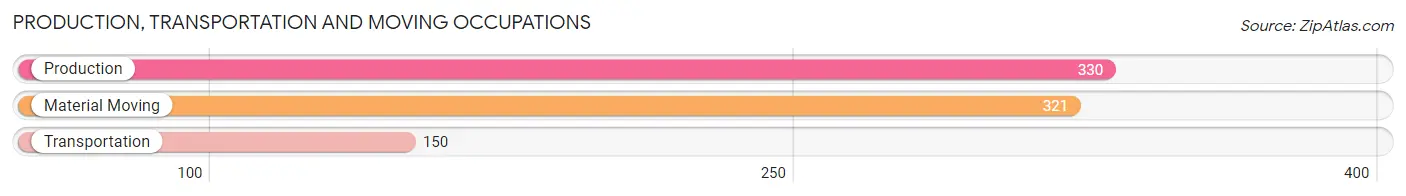
Production, Transportation and Moving Occupations
The most common Production, Transportation and Moving occupations in Edwardsville are Production (330 | 2.5%), Material Moving (321 | 2.5%), and Transportation (150 | 1.1%).
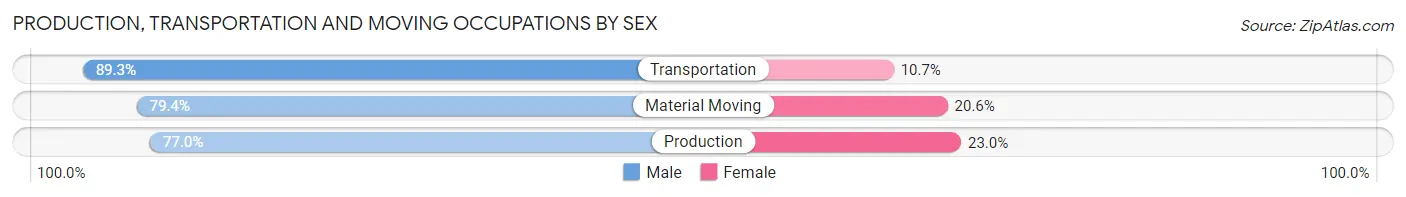
Production, Transportation and Moving Occupations by Sex
| Occupation | Male | Female |
| Production | 254 (77.0%) | 76 (23.0%) |
| Transportation | 134 (89.3%) | 16 (10.7%) |
| Material Moving | 255 (79.4%) | 66 (20.6%) |
| Total (Category) | 643 (80.3%) | 158 (19.7%) |
| Total (Overall) | 6,321 (48.6%) | 6,693 (51.4%) |
Employment Industries by Sex in Edwardsville
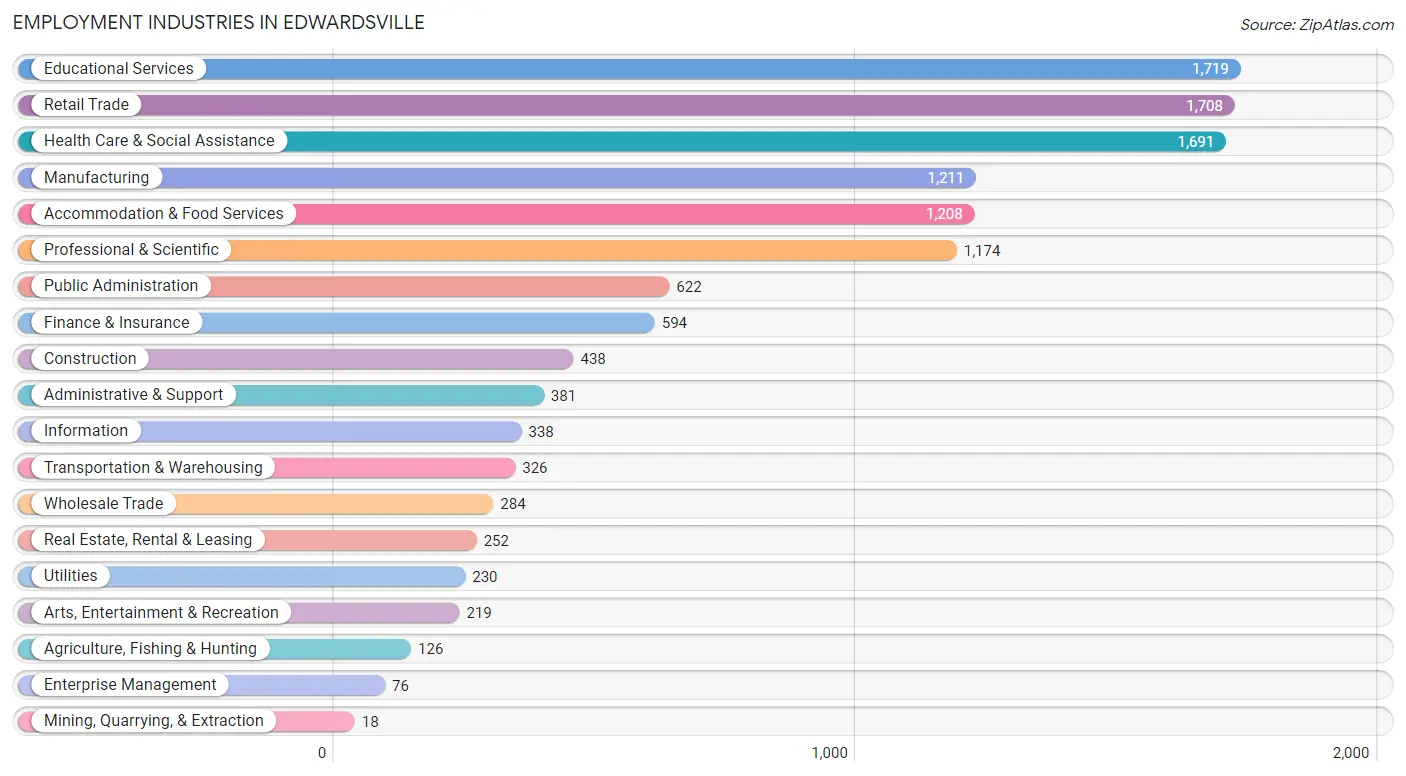
Employment Industries in Edwardsville
The major employment industries in Edwardsville include Educational Services (1,719 | 13.2%), Retail Trade (1,708 | 13.1%), Health Care & Social Assistance (1,691 | 13.0%), Manufacturing (1,211 | 9.3%), and Accommodation & Food Services (1,208 | 9.3%).
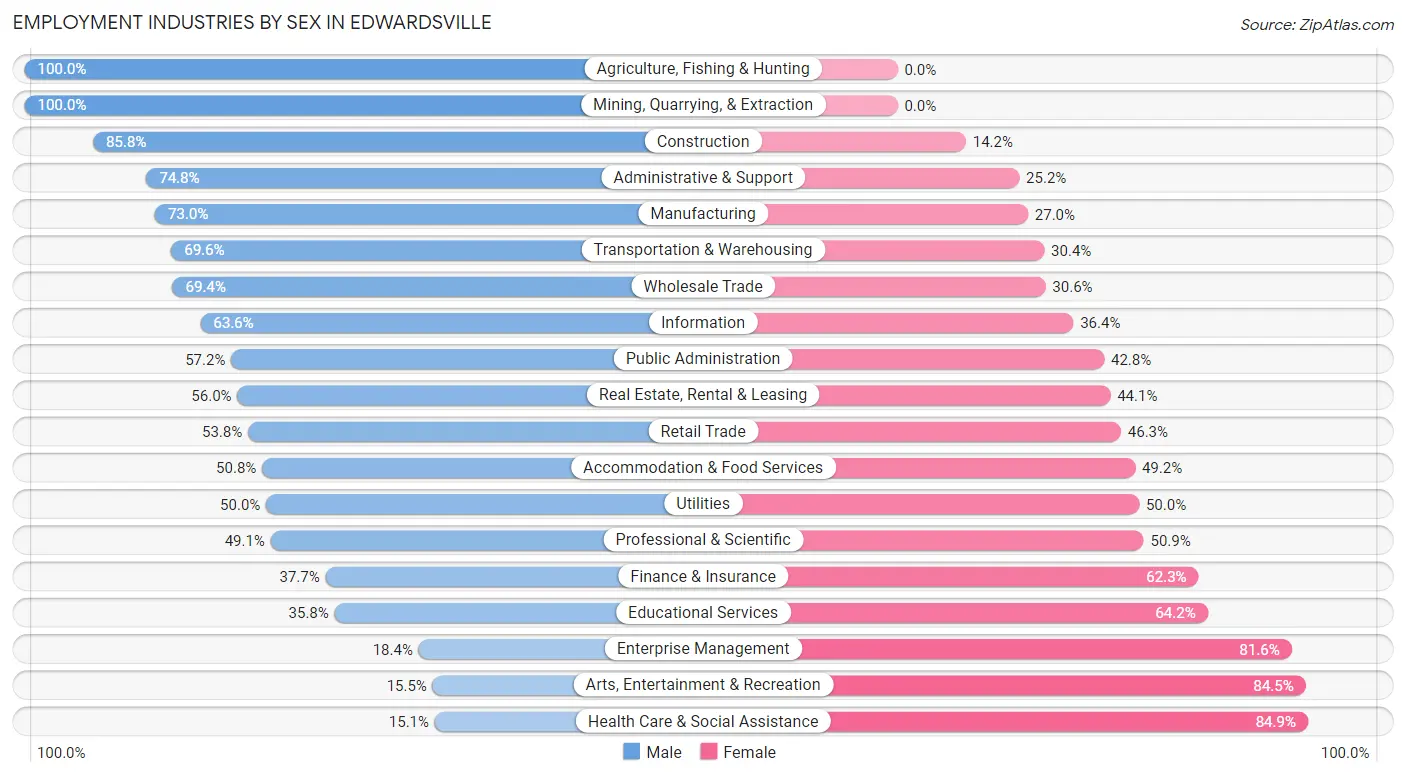
Employment Industries by Sex in Edwardsville
The Edwardsville industries that see more men than women are Agriculture, Fishing & Hunting (100.0%), Mining, Quarrying, & Extraction (100.0%), and Construction (85.8%), whereas the industries that tend to have a higher number of women are Health Care & Social Assistance (84.9%), Arts, Entertainment & Recreation (84.5%), and Enterprise Management (81.6%).
| Industry | Male | Female |
| Agriculture, Fishing & Hunting | 126 (100.0%) | 0 (0.0%) |
| Mining, Quarrying, & Extraction | 18 (100.0%) | 0 (0.0%) |
| Construction | 376 (85.8%) | 62 (14.2%) |
| Manufacturing | 884 (73.0%) | 327 (27.0%) |
| Wholesale Trade | 197 (69.4%) | 87 (30.6%) |
| Retail Trade | 918 (53.7%) | 790 (46.3%) |
| Transportation & Warehousing | 227 (69.6%) | 99 (30.4%) |
| Utilities | 115 (50.0%) | 115 (50.0%) |
| Information | 215 (63.6%) | 123 (36.4%) |
| Finance & Insurance | 224 (37.7%) | 370 (62.3%) |
| Real Estate, Rental & Leasing | 141 (55.9%) | 111 (44.1%) |
| Professional & Scientific | 576 (49.1%) | 598 (50.9%) |
| Enterprise Management | 14 (18.4%) | 62 (81.6%) |
| Administrative & Support | 285 (74.8%) | 96 (25.2%) |
| Educational Services | 616 (35.8%) | 1,103 (64.2%) |
| Health Care & Social Assistance | 255 (15.1%) | 1,436 (84.9%) |
| Arts, Entertainment & Recreation | 34 (15.5%) | 185 (84.5%) |
| Accommodation & Food Services | 614 (50.8%) | 594 (49.2%) |
| Public Administration | 356 (57.2%) | 266 (42.8%) |
| Total | 6,321 (48.6%) | 6,693 (51.4%) |
Education in Edwardsville
School Enrollment in Edwardsville
The most common levels of schooling among the 10,460 students in Edwardsville are college / undergraduate (5,702 | 54.5%), high school (1,280 | 12.2%), and middle school (1,123 | 10.7%).
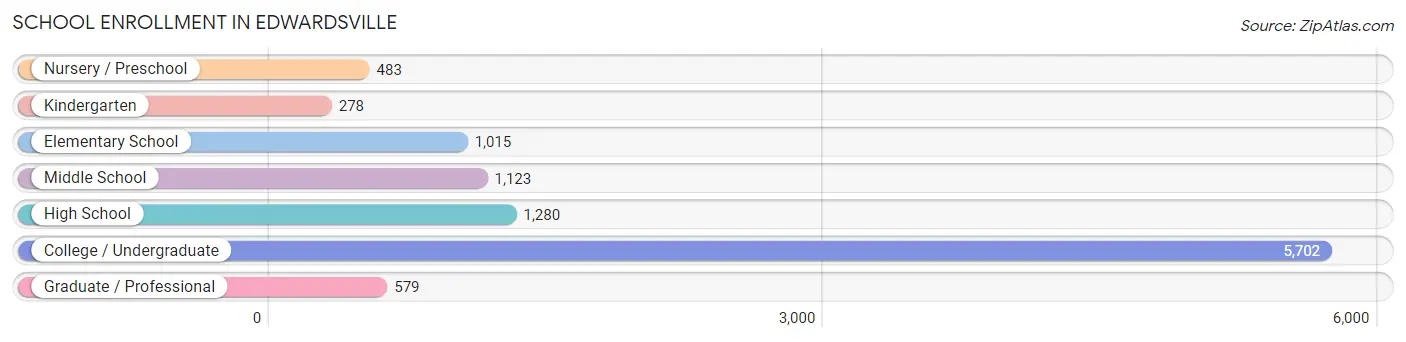
| School Level | # Students | % Students |
| Nursery / Preschool | 483 | 4.6% |
| Kindergarten | 278 | 2.7% |
| Elementary School | 1,015 | 9.7% |
| Middle School | 1,123 | 10.7% |
| High School | 1,280 | 12.2% |
| College / Undergraduate | 5,702 | 54.5% |
| Graduate / Professional | 579 | 5.5% |
| Total | 10,460 | 100.0% |
School Enrollment by Age by Funding Source in Edwardsville
Out of a total of 10,460 students who are enrolled in schools in Edwardsville, 1,172 (11.2%) attend a private institution, while the remaining 9,288 (88.8%) are enrolled in public schools. The age group of 3 to 4 year olds has the highest likelihood of being enrolled in private schools, with 182 (58.7% in the age bracket) enrolled. Conversely, the age group of 25 to 34 year olds has the lowest likelihood of being enrolled in a private school, with 628 (100.0% in the age bracket) attending a public institution.
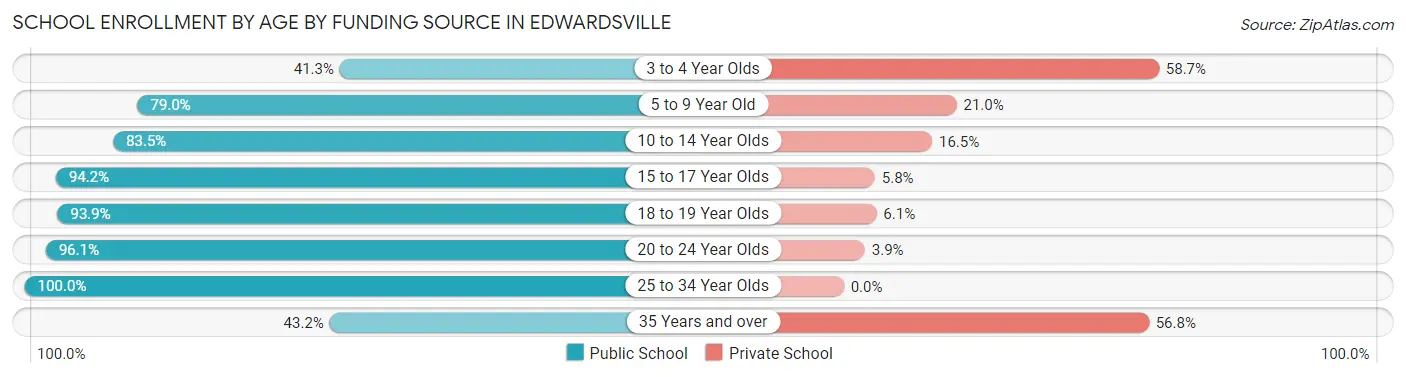
| Age Bracket | Public School | Private School |
| 3 to 4 Year Olds | 128 (41.3%) | 182 (58.7%) |
| 5 to 9 Year Old | 1,018 (79.0%) | 271 (21.0%) |
| 10 to 14 Year Olds | 1,233 (83.5%) | 243 (16.5%) |
| 15 to 17 Year Olds | 859 (94.2%) | 53 (5.8%) |
| 18 to 19 Year Olds | 2,094 (93.9%) | 136 (6.1%) |
| 20 to 24 Year Olds | 3,219 (96.1%) | 132 (3.9%) |
| 25 to 34 Year Olds | 628 (100.0%) | 0 (0.0%) |
| 35 Years and over | 114 (43.2%) | 150 (56.8%) |
| Total | 9,288 (88.8%) | 1,172 (11.2%) |
Educational Attainment by Field of Study in Edwardsville
Business (1,780 | 19.8%), education (1,433 | 16.0%), science & technology (1,253 | 14.0%), social sciences (750 | 8.4%), and bio, nature & agricultural (480 | 5.3%) are the most common fields of study among 8,970 individuals in Edwardsville who have obtained a bachelor's degree or higher.
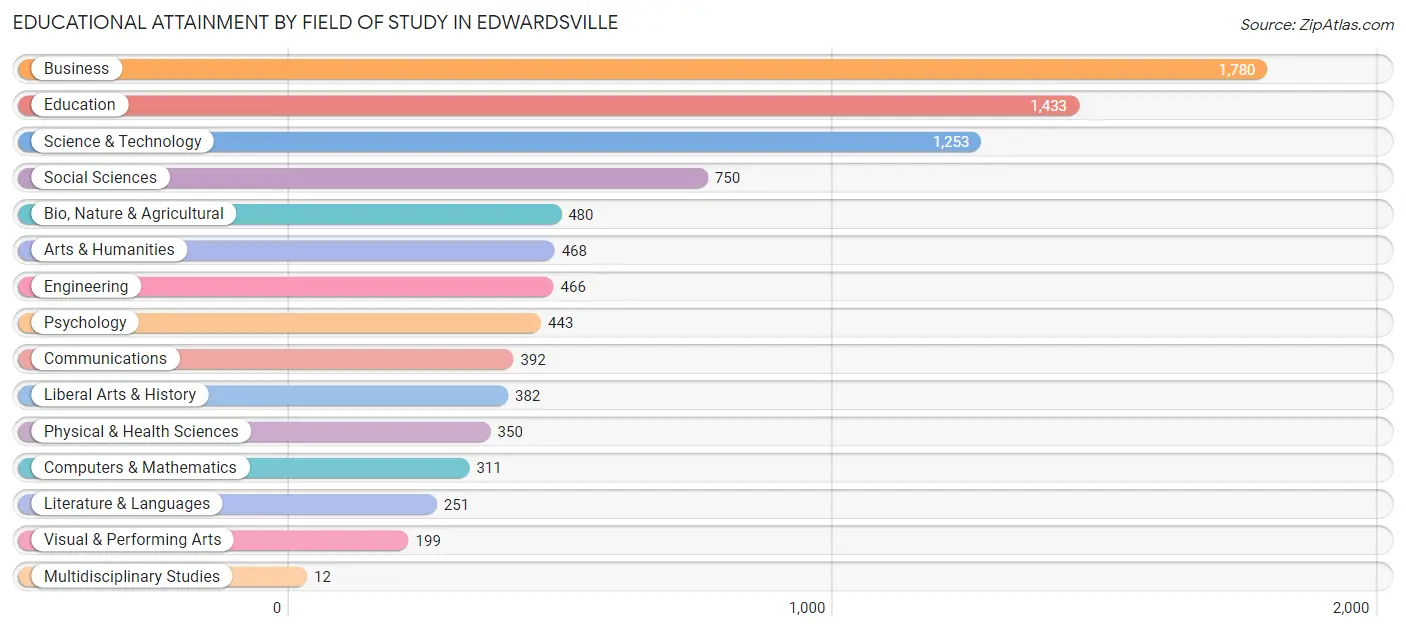
| Field of Study | # Graduates | % Graduates |
| Computers & Mathematics | 311 | 3.5% |
| Bio, Nature & Agricultural | 480 | 5.3% |
| Physical & Health Sciences | 350 | 3.9% |
| Psychology | 443 | 4.9% |
| Social Sciences | 750 | 8.4% |
| Engineering | 466 | 5.2% |
| Multidisciplinary Studies | 12 | 0.1% |
| Science & Technology | 1,253 | 14.0% |
| Business | 1,780 | 19.8% |
| Education | 1,433 | 16.0% |
| Literature & Languages | 251 | 2.8% |
| Liberal Arts & History | 382 | 4.3% |
| Visual & Performing Arts | 199 | 2.2% |
| Communications | 392 | 4.4% |
| Arts & Humanities | 468 | 5.2% |
| Total | 8,970 | 100.0% |
Transportation & Commute in Edwardsville
Vehicle Availability by Sex in Edwardsville
The most prevalent vehicle ownership categories in Edwardsville are males with 2 vehicles (2,778, accounting for 45.6%) and females with 2 vehicles (2,776, making up 43.0%).
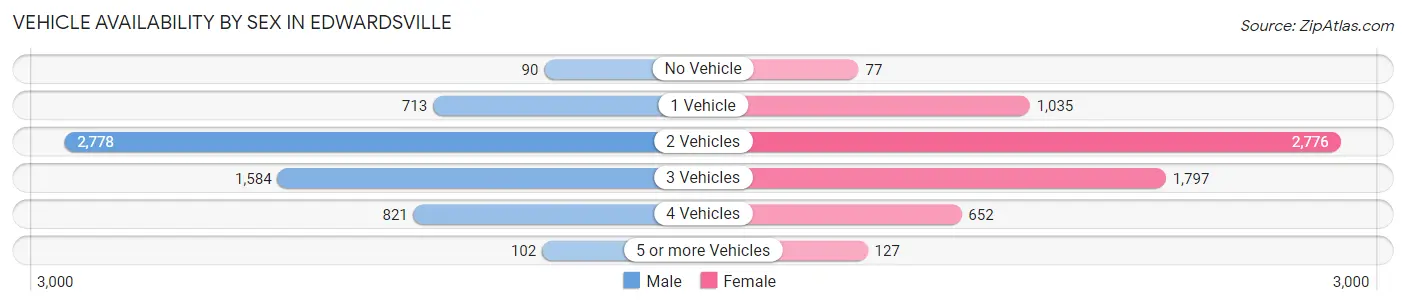
| Vehicles Available | Male | Female |
| No Vehicle | 90 (1.5%) | 77 (1.2%) |
| 1 Vehicle | 713 (11.7%) | 1,035 (16.0%) |
| 2 Vehicles | 2,778 (45.6%) | 2,776 (42.9%) |
| 3 Vehicles | 1,584 (26.0%) | 1,797 (27.8%) |
| 4 Vehicles | 821 (13.5%) | 652 (10.1%) |
| 5 or more Vehicles | 102 (1.7%) | 127 (2.0%) |
| Total | 6,088 (100.0%) | 6,464 (100.0%) |
Commute Time in Edwardsville
The most frequently occuring commute durations in Edwardsville are 5 to 9 minutes (2,107 commuters, 18.8%), 30 to 34 minutes (1,658 commuters, 14.8%), and 10 to 14 minutes (1,578 commuters, 14.1%).
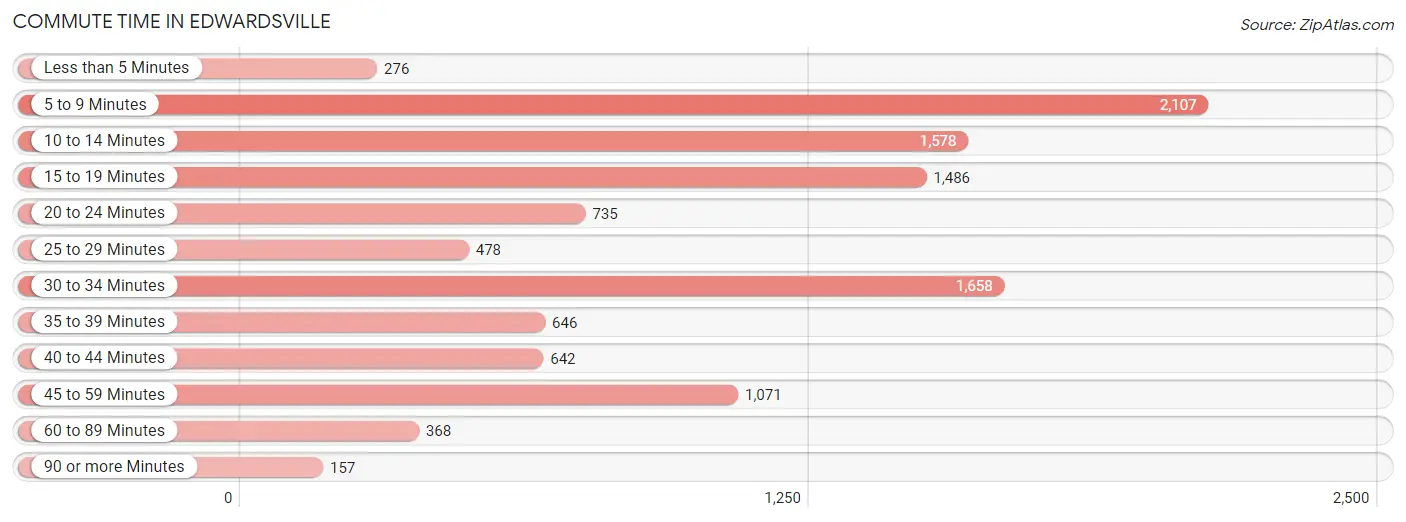
| Commute Time | # Commuters | % Commuters |
| Less than 5 Minutes | 276 | 2.5% |
| 5 to 9 Minutes | 2,107 | 18.8% |
| 10 to 14 Minutes | 1,578 | 14.1% |
| 15 to 19 Minutes | 1,486 | 13.3% |
| 20 to 24 Minutes | 735 | 6.6% |
| 25 to 29 Minutes | 478 | 4.3% |
| 30 to 34 Minutes | 1,658 | 14.8% |
| 35 to 39 Minutes | 646 | 5.8% |
| 40 to 44 Minutes | 642 | 5.7% |
| 45 to 59 Minutes | 1,071 | 9.6% |
| 60 to 89 Minutes | 368 | 3.3% |
| 90 or more Minutes | 157 | 1.4% |
Commute Time by Sex in Edwardsville
The most common commute times in Edwardsville are 5 to 9 minutes (976 commuters, 17.8%) for males and 5 to 9 minutes (1,131 commuters, 19.8%) for females.
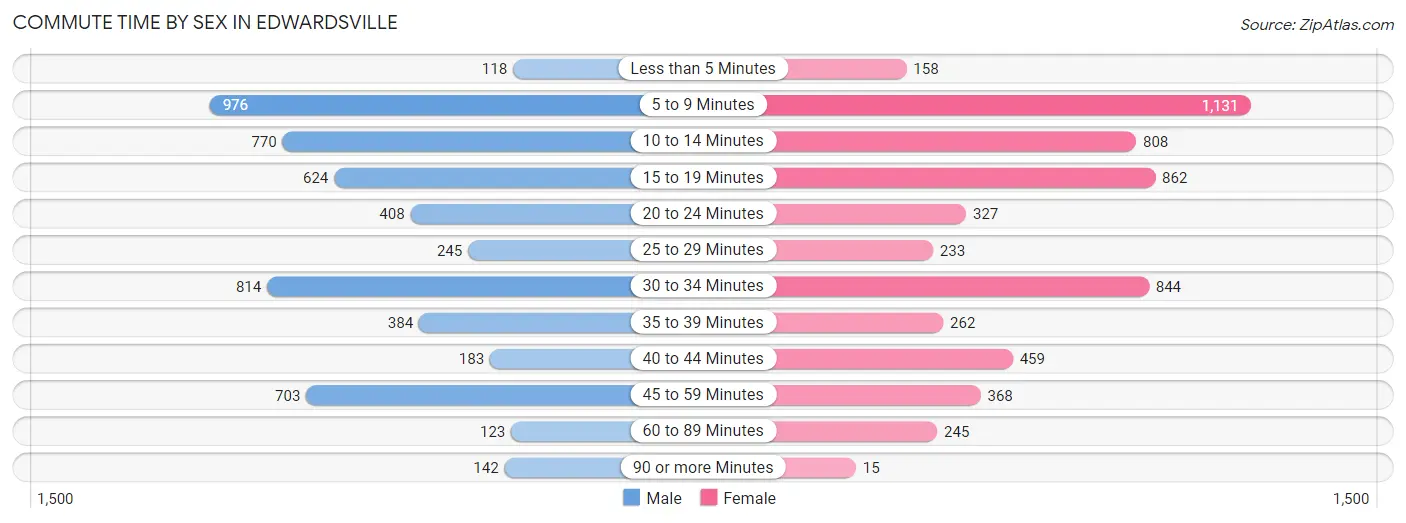
| Commute Time | Male | Female |
| Less than 5 Minutes | 118 (2.1%) | 158 (2.8%) |
| 5 to 9 Minutes | 976 (17.8%) | 1,131 (19.8%) |
| 10 to 14 Minutes | 770 (14.0%) | 808 (14.1%) |
| 15 to 19 Minutes | 624 (11.4%) | 862 (15.1%) |
| 20 to 24 Minutes | 408 (7.4%) | 327 (5.7%) |
| 25 to 29 Minutes | 245 (4.5%) | 233 (4.1%) |
| 30 to 34 Minutes | 814 (14.8%) | 844 (14.8%) |
| 35 to 39 Minutes | 384 (7.0%) | 262 (4.6%) |
| 40 to 44 Minutes | 183 (3.3%) | 459 (8.0%) |
| 45 to 59 Minutes | 703 (12.8%) | 368 (6.4%) |
| 60 to 89 Minutes | 123 (2.2%) | 245 (4.3%) |
| 90 or more Minutes | 142 (2.6%) | 15 (0.3%) |
Time of Departure to Work by Sex in Edwardsville
The most frequent times of departure to work in Edwardsville are 7:00 AM to 7:29 AM (1,023, 18.6%) for males and 7:30 AM to 7:59 AM (983, 17.2%) for females.
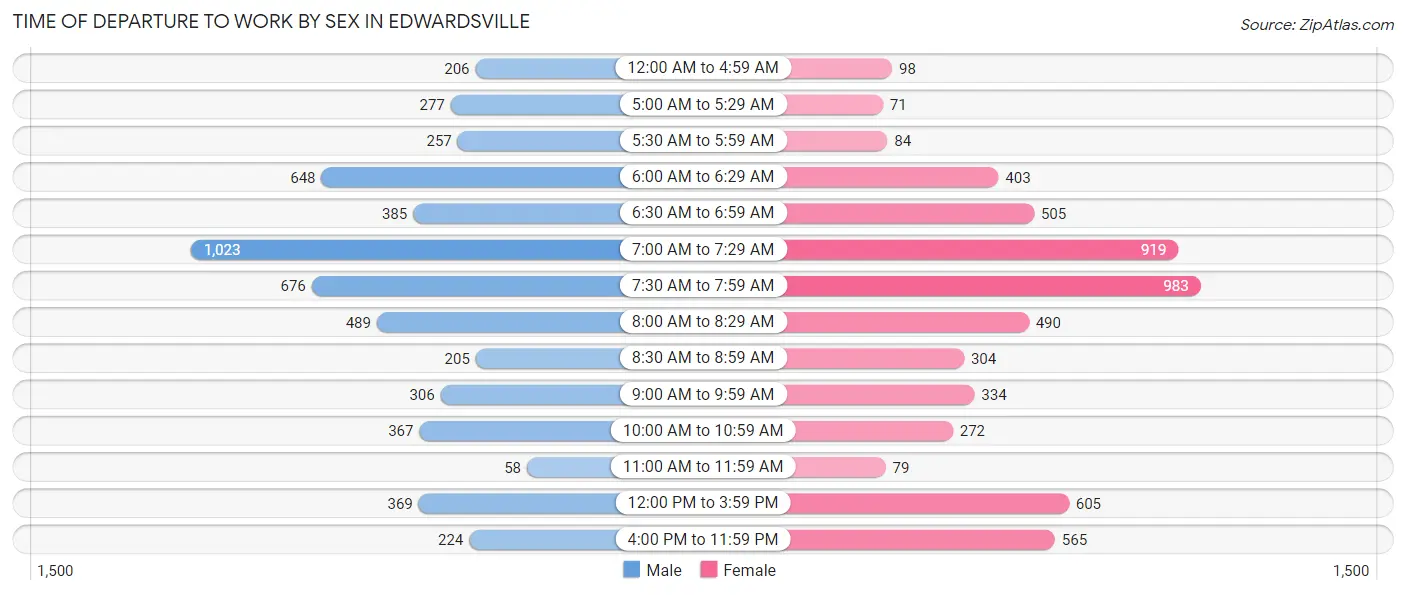
| Time of Departure | Male | Female |
| 12:00 AM to 4:59 AM | 206 (3.7%) | 98 (1.7%) |
| 5:00 AM to 5:29 AM | 277 (5.1%) | 71 (1.2%) |
| 5:30 AM to 5:59 AM | 257 (4.7%) | 84 (1.5%) |
| 6:00 AM to 6:29 AM | 648 (11.8%) | 403 (7.1%) |
| 6:30 AM to 6:59 AM | 385 (7.0%) | 505 (8.8%) |
| 7:00 AM to 7:29 AM | 1,023 (18.6%) | 919 (16.1%) |
| 7:30 AM to 7:59 AM | 676 (12.3%) | 983 (17.2%) |
| 8:00 AM to 8:29 AM | 489 (8.9%) | 490 (8.6%) |
| 8:30 AM to 8:59 AM | 205 (3.7%) | 304 (5.3%) |
| 9:00 AM to 9:59 AM | 306 (5.6%) | 334 (5.9%) |
| 10:00 AM to 10:59 AM | 367 (6.7%) | 272 (4.8%) |
| 11:00 AM to 11:59 AM | 58 (1.1%) | 79 (1.4%) |
| 12:00 PM to 3:59 PM | 369 (6.7%) | 605 (10.6%) |
| 4:00 PM to 11:59 PM | 224 (4.1%) | 565 (9.9%) |
| Total | 5,490 (100.0%) | 5,712 (100.0%) |
Housing Occupancy in Edwardsville
Occupancy by Ownership in Edwardsville
Of the total 9,359 dwellings in Edwardsville, owner-occupied units account for 6,171 (65.9%), while renter-occupied units make up 3,188 (34.1%).
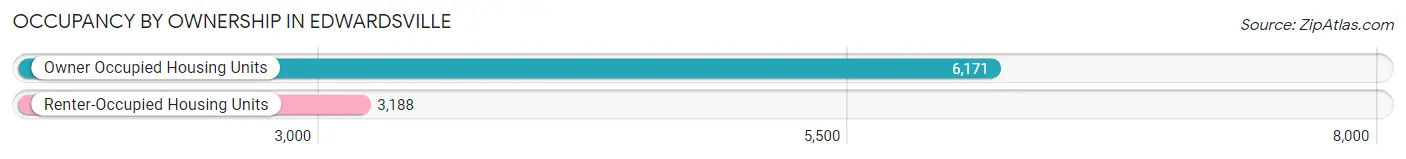
| Occupancy | # Housing Units | % Housing Units |
| Owner Occupied Housing Units | 6,171 | 65.9% |
| Renter-Occupied Housing Units | 3,188 | 34.1% |
| Total Occupied Housing Units | 9,359 | 100.0% |
Occupancy by Household Size in Edwardsville
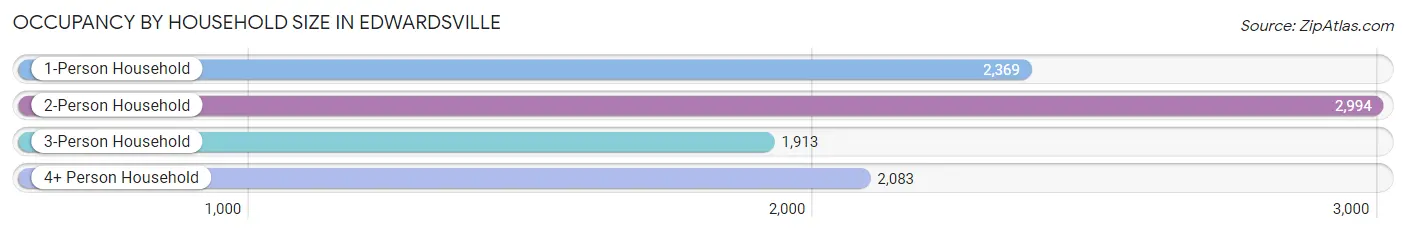
| Household Size | # Housing Units | % Housing Units |
| 1-Person Household | 2,369 | 25.3% |
| 2-Person Household | 2,994 | 32.0% |
| 3-Person Household | 1,913 | 20.4% |
| 4+ Person Household | 2,083 | 22.3% |
| Total Housing Units | 9,359 | 100.0% |
Occupancy by Ownership by Household Size in Edwardsville
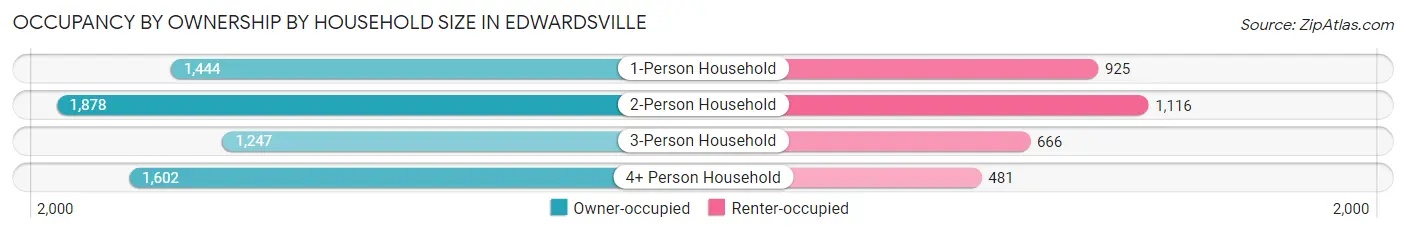
| Household Size | Owner-occupied | Renter-occupied |
| 1-Person Household | 1,444 (61.0%) | 925 (39.1%) |
| 2-Person Household | 1,878 (62.7%) | 1,116 (37.3%) |
| 3-Person Household | 1,247 (65.2%) | 666 (34.8%) |
| 4+ Person Household | 1,602 (76.9%) | 481 (23.1%) |
| Total Housing Units | 6,171 (65.9%) | 3,188 (34.1%) |
Occupancy by Educational Attainment in Edwardsville
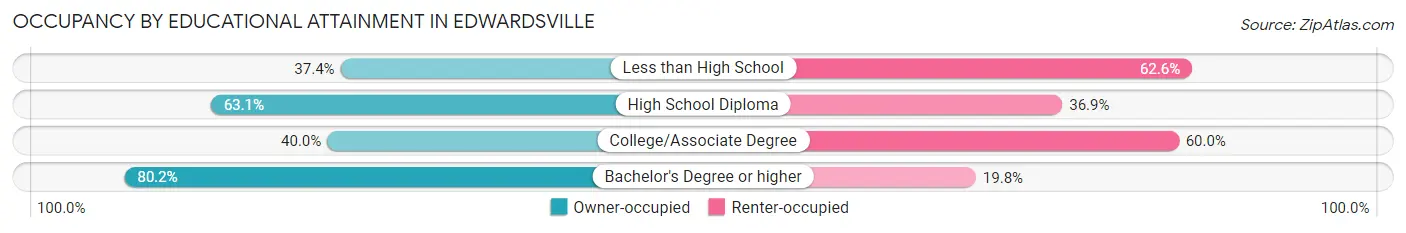
| Household Size | Owner-occupied | Renter-occupied |
| Less than High School | 83 (37.4%) | 139 (62.6%) |
| High School Diploma | 711 (63.1%) | 416 (36.9%) |
| College/Associate Degree | 1,044 (40.0%) | 1,565 (60.0%) |
| Bachelor's Degree or higher | 4,333 (80.2%) | 1,068 (19.8%) |
Occupancy by Age of Householder in Edwardsville
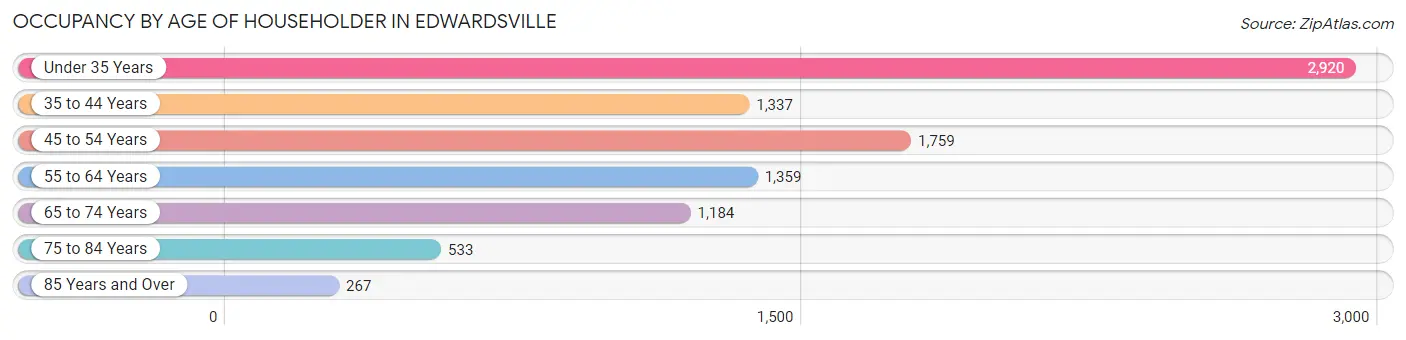
| Age Bracket | # Households | % Households |
| Under 35 Years | 2,920 | 31.2% |
| 35 to 44 Years | 1,337 | 14.3% |
| 45 to 54 Years | 1,759 | 18.8% |
| 55 to 64 Years | 1,359 | 14.5% |
| 65 to 74 Years | 1,184 | 12.7% |
| 75 to 84 Years | 533 | 5.7% |
| 85 Years and Over | 267 | 2.9% |
| Total | 9,359 | 100.0% |
Housing Finances in Edwardsville
Median Income by Occupancy in Edwardsville
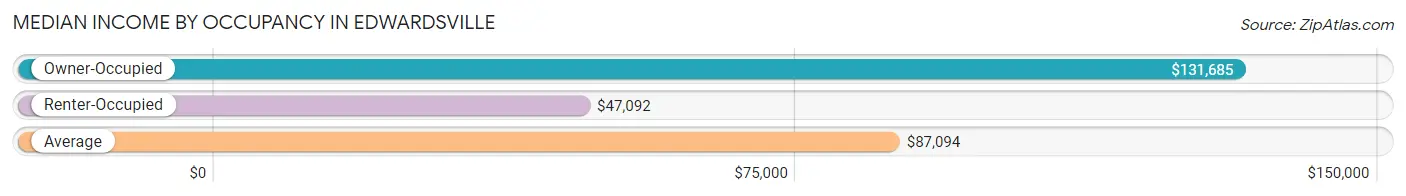
| Occupancy Type | # Households | Median Income |
| Owner-Occupied | 6,171 (65.9%) | $131,685 |
| Renter-Occupied | 3,188 (34.1%) | $47,092 |
| Average | 9,359 (100.0%) | $87,094 |
Occupancy by Householder Income Bracket in Edwardsville
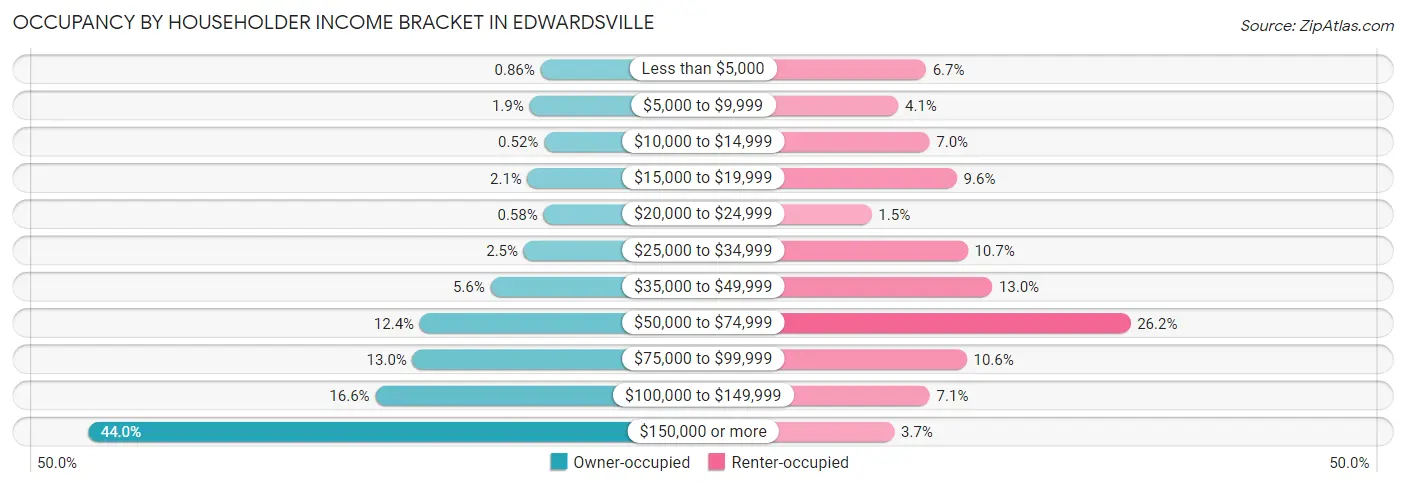
| Income Bracket | Owner-occupied | Renter-occupied |
| Less than $5,000 | 53 (0.9%) | 213 (6.7%) |
| $5,000 to $9,999 | 118 (1.9%) | 129 (4.1%) |
| $10,000 to $14,999 | 32 (0.5%) | 224 (7.0%) |
| $15,000 to $19,999 | 129 (2.1%) | 307 (9.6%) |
| $20,000 to $24,999 | 36 (0.6%) | 48 (1.5%) |
| $25,000 to $34,999 | 151 (2.5%) | 340 (10.7%) |
| $35,000 to $49,999 | 347 (5.6%) | 414 (13.0%) |
| $50,000 to $74,999 | 762 (12.3%) | 834 (26.2%) |
| $75,000 to $99,999 | 805 (13.0%) | 337 (10.6%) |
| $100,000 to $149,999 | 1,024 (16.6%) | 225 (7.1%) |
| $150,000 or more | 2,714 (44.0%) | 117 (3.7%) |
| Total | 6,171 (100.0%) | 3,188 (100.0%) |
Monthly Housing Cost Tiers in Edwardsville
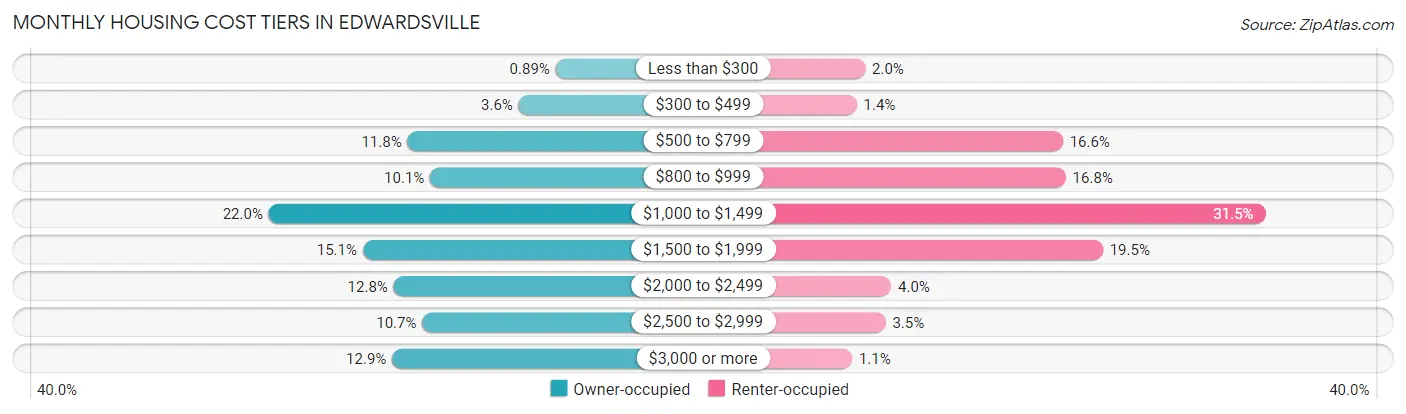
| Monthly Cost | Owner-occupied | Renter-occupied |
| Less than $300 | 55 (0.9%) | 65 (2.0%) |
| $300 to $499 | 223 (3.6%) | 45 (1.4%) |
| $500 to $799 | 728 (11.8%) | 529 (16.6%) |
| $800 to $999 | 625 (10.1%) | 536 (16.8%) |
| $1,000 to $1,499 | 1,359 (22.0%) | 1,005 (31.5%) |
| $1,500 to $1,999 | 931 (15.1%) | 623 (19.5%) |
| $2,000 to $2,499 | 791 (12.8%) | 126 (4.0%) |
| $2,500 to $2,999 | 661 (10.7%) | 113 (3.5%) |
| $3,000 or more | 798 (12.9%) | 34 (1.1%) |
| Total | 6,171 (100.0%) | 3,188 (100.0%) |
Physical Housing Characteristics in Edwardsville
Housing Structures in Edwardsville
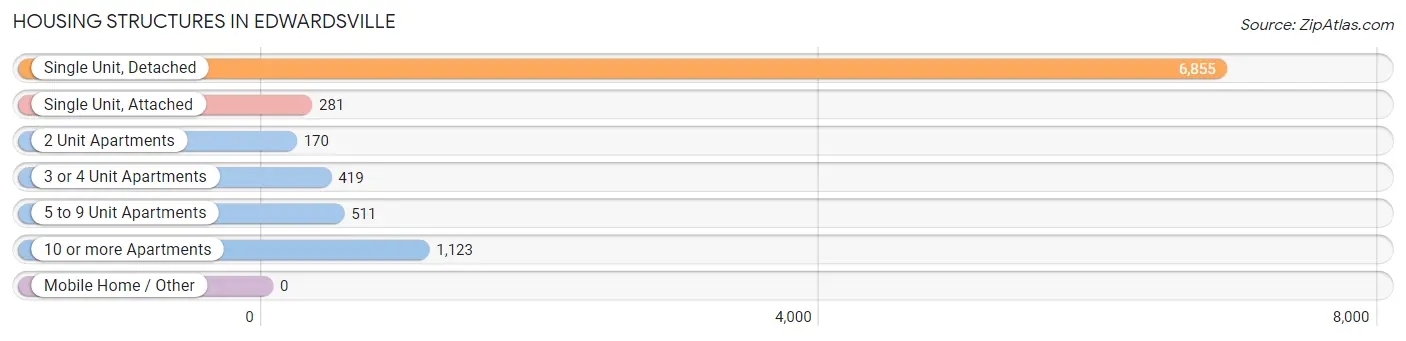
| Structure Type | # Housing Units | % Housing Units |
| Single Unit, Detached | 6,855 | 73.3% |
| Single Unit, Attached | 281 | 3.0% |
| 2 Unit Apartments | 170 | 1.8% |
| 3 or 4 Unit Apartments | 419 | 4.5% |
| 5 to 9 Unit Apartments | 511 | 5.5% |
| 10 or more Apartments | 1,123 | 12.0% |
| Mobile Home / Other | 0 | 0.0% |
| Total | 9,359 | 100.0% |
Housing Structures by Occupancy in Edwardsville
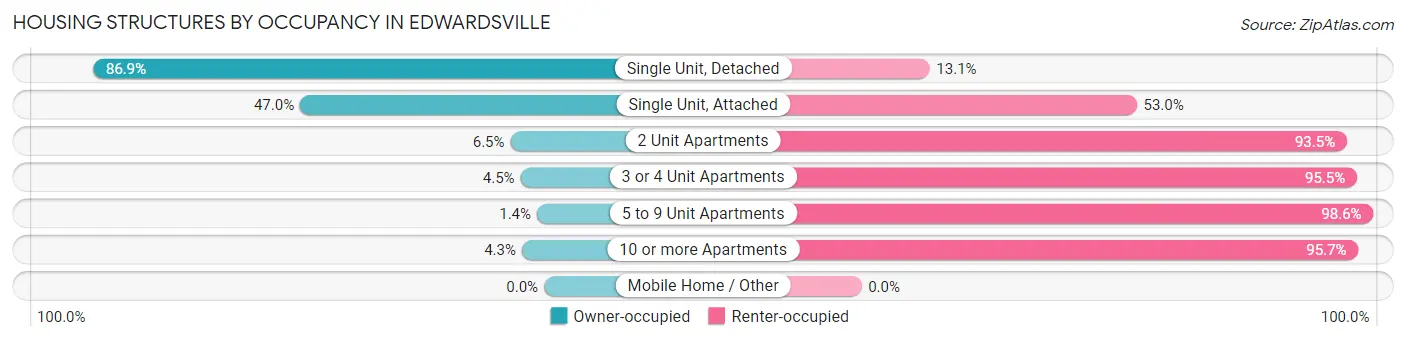
| Structure Type | Owner-occupied | Renter-occupied |
| Single Unit, Detached | 5,954 (86.9%) | 901 (13.1%) |
| Single Unit, Attached | 132 (47.0%) | 149 (53.0%) |
| 2 Unit Apartments | 11 (6.5%) | 159 (93.5%) |
| 3 or 4 Unit Apartments | 19 (4.5%) | 400 (95.5%) |
| 5 to 9 Unit Apartments | 7 (1.4%) | 504 (98.6%) |
| 10 or more Apartments | 48 (4.3%) | 1,075 (95.7%) |
| Mobile Home / Other | 0 (0.0%) | 0 (0.0%) |
| Total | 6,171 (65.9%) | 3,188 (34.1%) |
Housing Structures by Number of Rooms in Edwardsville
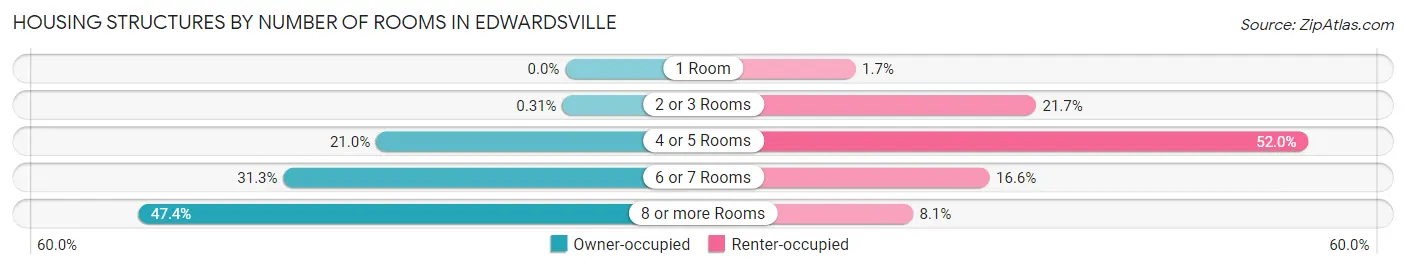
| Number of Rooms | Owner-occupied | Renter-occupied |
| 1 Room | 0 (0.0%) | 54 (1.7%) |
| 2 or 3 Rooms | 19 (0.3%) | 692 (21.7%) |
| 4 or 5 Rooms | 1,296 (21.0%) | 1,657 (52.0%) |
| 6 or 7 Rooms | 1,930 (31.3%) | 528 (16.6%) |
| 8 or more Rooms | 2,926 (47.4%) | 257 (8.1%) |
| Total | 6,171 (100.0%) | 3,188 (100.0%) |
Housing Structure by Heating Type in Edwardsville
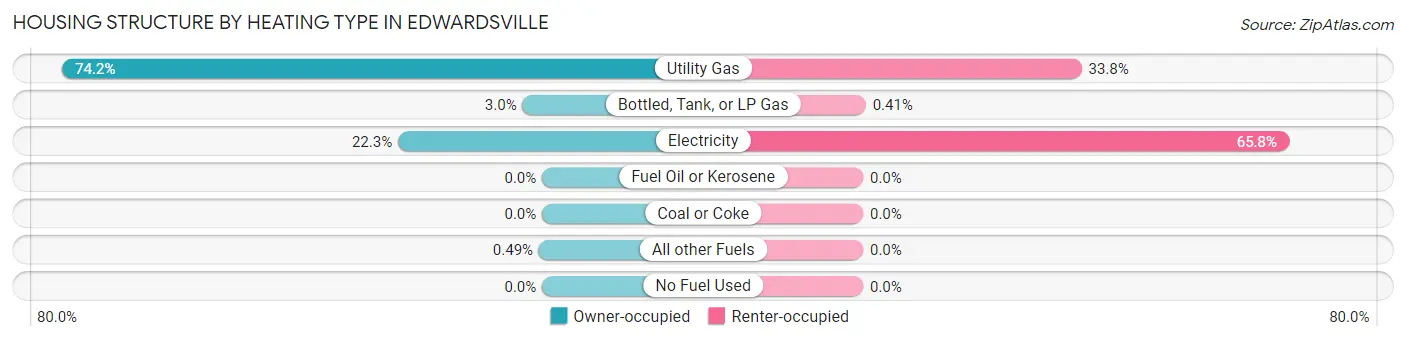
| Heating Type | Owner-occupied | Renter-occupied |
| Utility Gas | 4,579 (74.2%) | 1,077 (33.8%) |
| Bottled, Tank, or LP Gas | 187 (3.0%) | 13 (0.4%) |
| Electricity | 1,375 (22.3%) | 2,098 (65.8%) |
| Fuel Oil or Kerosene | 0 (0.0%) | 0 (0.0%) |
| Coal or Coke | 0 (0.0%) | 0 (0.0%) |
| All other Fuels | 30 (0.5%) | 0 (0.0%) |
| No Fuel Used | 0 (0.0%) | 0 (0.0%) |
| Total | 6,171 (100.0%) | 3,188 (100.0%) |
Household Vehicle Usage in Edwardsville
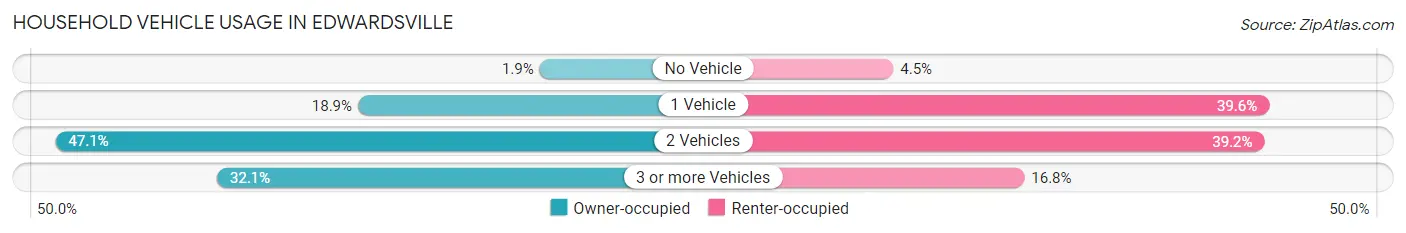
| Vehicles per Household | Owner-occupied | Renter-occupied |
| No Vehicle | 119 (1.9%) | 144 (4.5%) |
| 1 Vehicle | 1,166 (18.9%) | 1,262 (39.6%) |
| 2 Vehicles | 2,908 (47.1%) | 1,248 (39.2%) |
| 3 or more Vehicles | 1,978 (32.1%) | 534 (16.8%) |
| Total | 6,171 (100.0%) | 3,188 (100.0%) |
Real Estate & Mortgages in Edwardsville
Real Estate and Mortgage Overview in Edwardsville
| Characteristic | Without Mortgage | With Mortgage |
| Housing Units | 2,009 | 4,162 |
| Median Property Value | $232,900 | $295,000 |
| Median Household Income | $88,075 | $2,103 |
| Monthly Housing Costs | $814 | $798 |
| Real Estate Taxes | $4,706 | $14 |
Property Value by Mortgage Status in Edwardsville
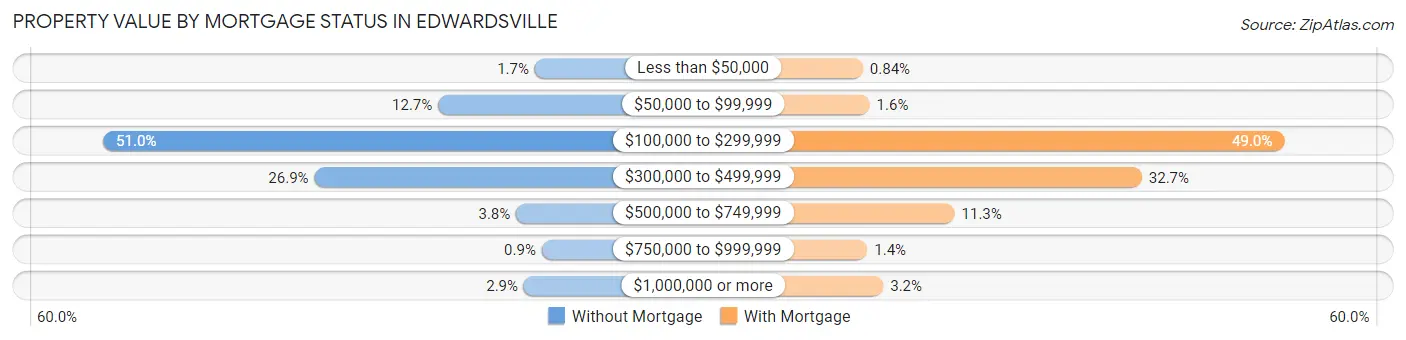
| Property Value | Without Mortgage | With Mortgage |
| Less than $50,000 | 34 (1.7%) | 35 (0.8%) |
| $50,000 to $99,999 | 256 (12.7%) | 67 (1.6%) |
| $100,000 to $299,999 | 1,025 (51.0%) | 2,039 (49.0%) |
| $300,000 to $499,999 | 540 (26.9%) | 1,362 (32.7%) |
| $500,000 to $749,999 | 77 (3.8%) | 471 (11.3%) |
| $750,000 to $999,999 | 18 (0.9%) | 56 (1.3%) |
| $1,000,000 or more | 59 (2.9%) | 132 (3.2%) |
| Total | 2,009 (100.0%) | 4,162 (100.0%) |
Household Income by Mortgage Status in Edwardsville
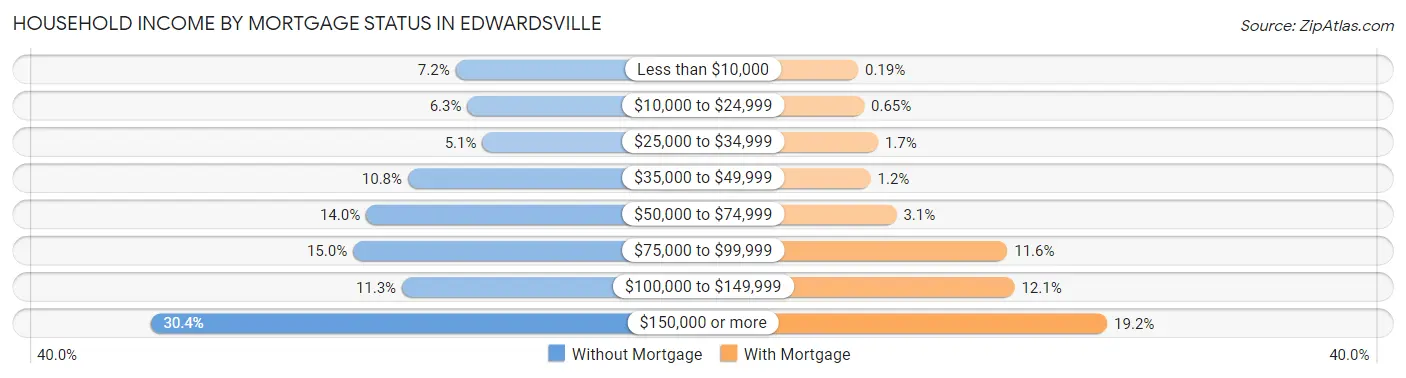
| Household Income | Without Mortgage | With Mortgage |
| Less than $10,000 | 144 (7.2%) | 8 (0.2%) |
| $10,000 to $24,999 | 126 (6.3%) | 27 (0.6%) |
| $25,000 to $34,999 | 103 (5.1%) | 71 (1.7%) |
| $35,000 to $49,999 | 217 (10.8%) | 48 (1.1%) |
| $50,000 to $74,999 | 281 (14.0%) | 130 (3.1%) |
| $75,000 to $99,999 | 301 (15.0%) | 481 (11.6%) |
| $100,000 to $149,999 | 226 (11.3%) | 504 (12.1%) |
| $150,000 or more | 611 (30.4%) | 798 (19.2%) |
| Total | 2,009 (100.0%) | 4,162 (100.0%) |
Property Value to Household Income Ratio in Edwardsville
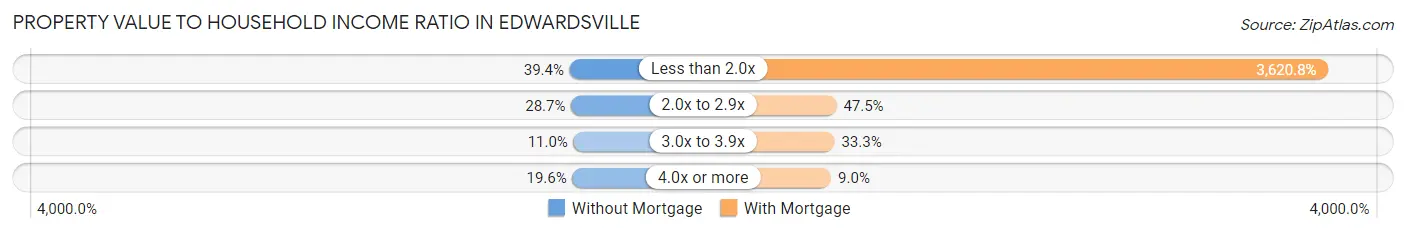
| Value-to-Income Ratio | Without Mortgage | With Mortgage |
| Less than 2.0x | 791 (39.4%) | 150,696 (3,620.8%) |
| 2.0x to 2.9x | 576 (28.7%) | 1,976 (47.5%) |
| 3.0x to 3.9x | 220 (11.0%) | 1,387 (33.3%) |
| 4.0x or more | 393 (19.6%) | 376 (9.0%) |
| Total | 2,009 (100.0%) | 4,162 (100.0%) |
Real Estate Taxes by Mortgage Status in Edwardsville
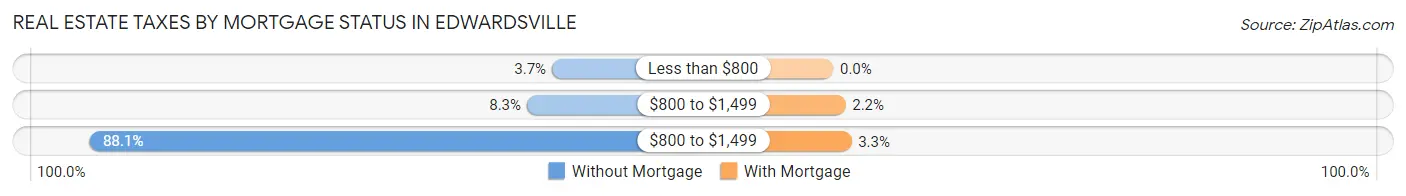
| Property Taxes | Without Mortgage | With Mortgage |
| Less than $800 | 74 (3.7%) | 0 (0.0%) |
| $800 to $1,499 | 166 (8.3%) | 93 (2.2%) |
| $800 to $1,499 | 1,769 (88.0%) | 138 (3.3%) |
| Total | 2,009 (100.0%) | 4,162 (100.0%) |
Health & Disability in Edwardsville
Health Insurance Coverage by Age in Edwardsville
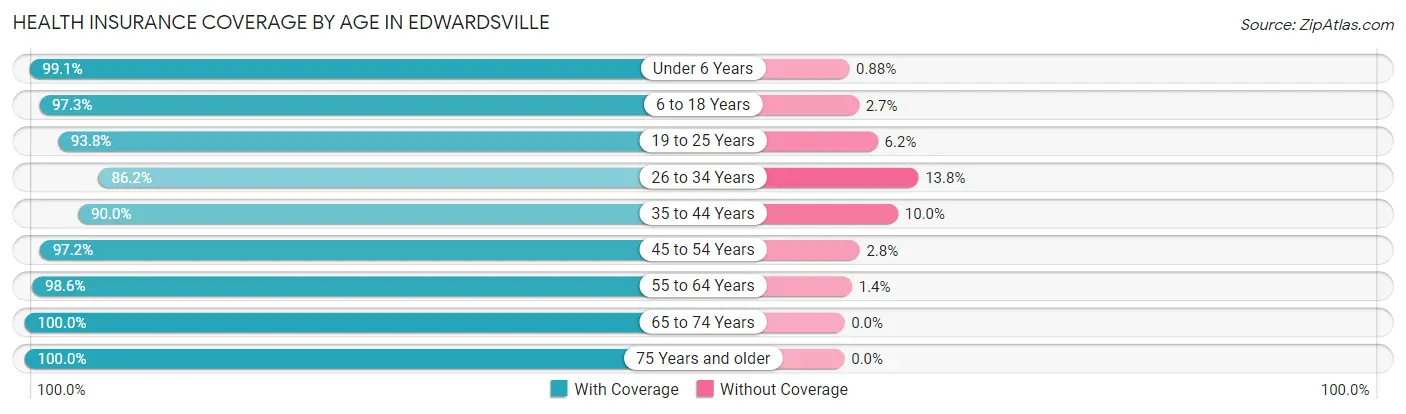
| Age Bracket | With Coverage | Without Coverage |
| Under 6 Years | 1,688 (99.1%) | 15 (0.9%) |
| 6 to 18 Years | 4,602 (97.3%) | 127 (2.7%) |
| 19 to 25 Years | 5,397 (93.8%) | 358 (6.2%) |
| 26 to 34 Years | 2,207 (86.2%) | 353 (13.8%) |
| 35 to 44 Years | 2,425 (90.0%) | 269 (10.0%) |
| 45 to 54 Years | 3,022 (97.2%) | 88 (2.8%) |
| 55 to 64 Years | 2,538 (98.6%) | 36 (1.4%) |
| 65 to 74 Years | 1,740 (100.0%) | 0 (0.0%) |
| 75 Years and older | 1,154 (100.0%) | 0 (0.0%) |
| Total | 24,773 (95.2%) | 1,246 (4.8%) |
Health Insurance Coverage by Citizenship Status in Edwardsville
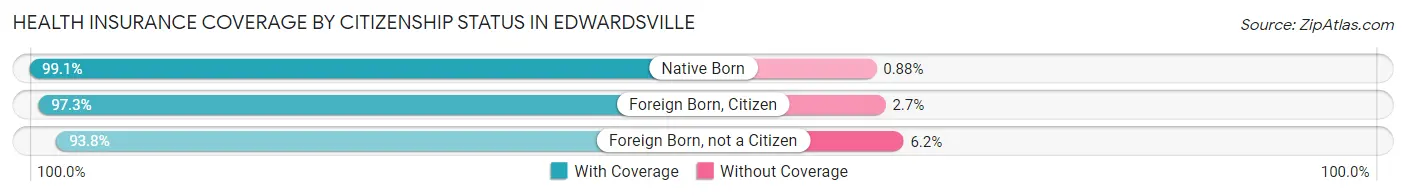
| Citizenship Status | With Coverage | Without Coverage |
| Native Born | 1,688 (99.1%) | 15 (0.9%) |
| Foreign Born, Citizen | 4,602 (97.3%) | 127 (2.7%) |
| Foreign Born, not a Citizen | 5,397 (93.8%) | 358 (6.2%) |
Health Insurance Coverage by Household Income in Edwardsville
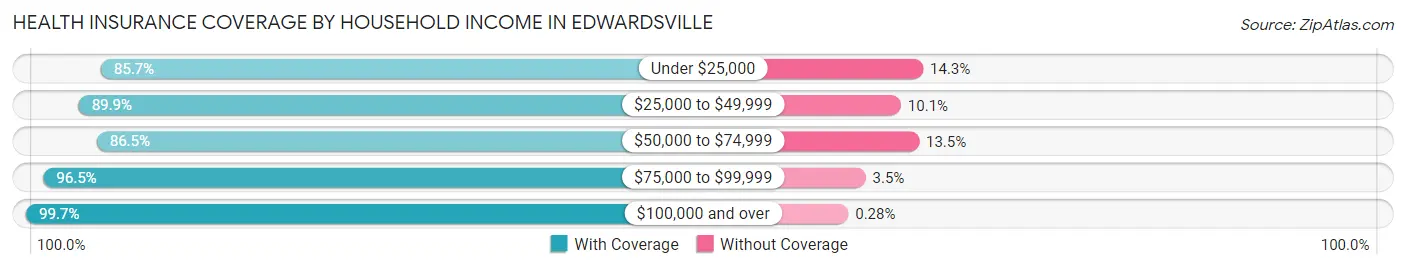
| Household Income | With Coverage | Without Coverage |
| Under $25,000 | 2,074 (85.7%) | 346 (14.3%) |
| $25,000 to $49,999 | 2,047 (89.9%) | 231 (10.1%) |
| $50,000 to $74,999 | 3,252 (86.5%) | 509 (13.5%) |
| $75,000 to $99,999 | 2,325 (96.5%) | 85 (3.5%) |
| $100,000 and over | 12,794 (99.7%) | 36 (0.3%) |
Public vs Private Health Insurance Coverage by Age in Edwardsville
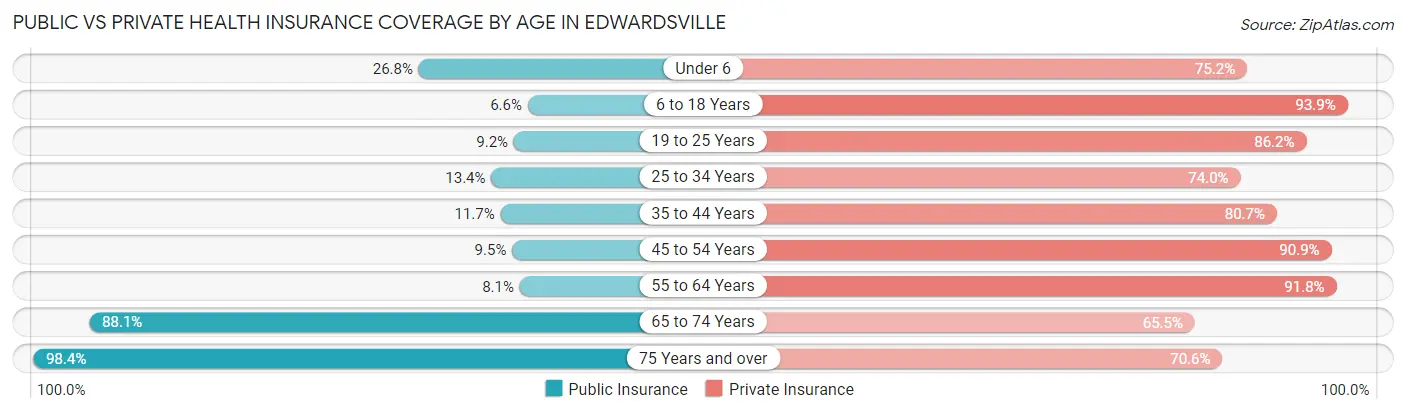
| Age Bracket | Public Insurance | Private Insurance |
| Under 6 | 457 (26.8%) | 1,281 (75.2%) |
| 6 to 18 Years | 312 (6.6%) | 4,439 (93.9%) |
| 19 to 25 Years | 528 (9.2%) | 4,962 (86.2%) |
| 25 to 34 Years | 342 (13.4%) | 1,894 (74.0%) |
| 35 to 44 Years | 314 (11.7%) | 2,175 (80.7%) |
| 45 to 54 Years | 295 (9.5%) | 2,826 (90.9%) |
| 55 to 64 Years | 208 (8.1%) | 2,363 (91.8%) |
| 65 to 74 Years | 1,532 (88.0%) | 1,140 (65.5%) |
| 75 Years and over | 1,136 (98.4%) | 815 (70.6%) |
| Total | 5,124 (19.7%) | 21,895 (84.2%) |
Disability Status by Sex by Age in Edwardsville
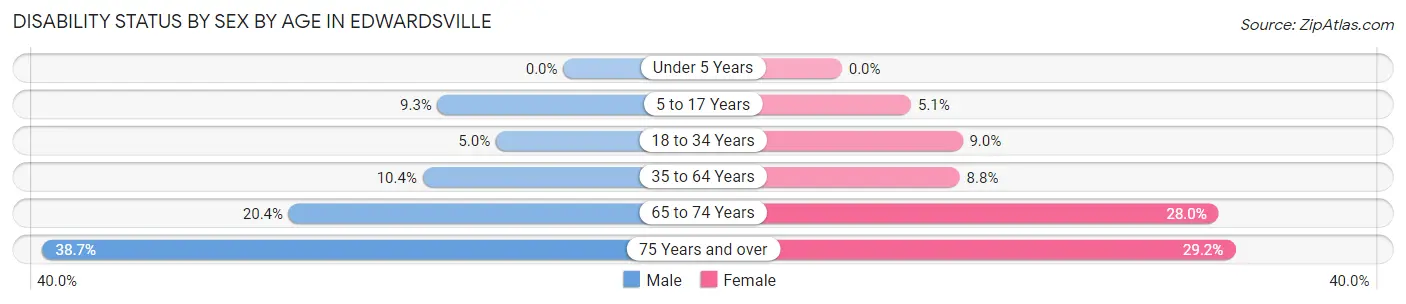
| Age Bracket | Male | Female |
| Under 5 Years | 0 (0.0%) | 0 (0.0%) |
| 5 to 17 Years | 183 (9.3%) | 91 (5.1%) |
| 18 to 34 Years | 215 (5.0%) | 477 (9.0%) |
| 35 to 64 Years | 434 (10.4%) | 369 (8.7%) |
| 65 to 74 Years | 152 (20.4%) | 278 (28.0%) |
| 75 Years and over | 184 (38.7%) | 198 (29.2%) |
Disability Class by Sex by Age in Edwardsville
Disability Class: Hearing Difficulty
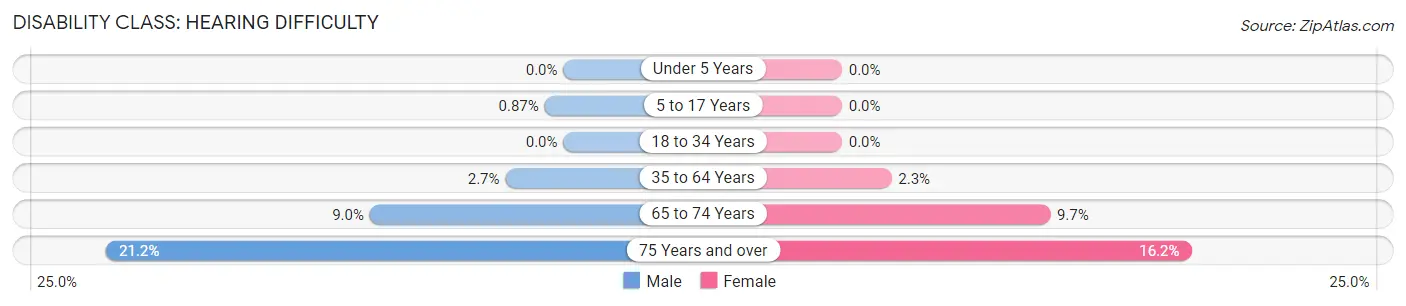
| Age Bracket | Male | Female |
| Under 5 Years | 0 (0.0%) | 0 (0.0%) |
| 5 to 17 Years | 17 (0.9%) | 0 (0.0%) |
| 18 to 34 Years | 0 (0.0%) | 0 (0.0%) |
| 35 to 64 Years | 112 (2.7%) | 97 (2.3%) |
| 65 to 74 Years | 67 (9.0%) | 96 (9.7%) |
| 75 Years and over | 101 (21.2%) | 110 (16.2%) |
Disability Class: Vision Difficulty
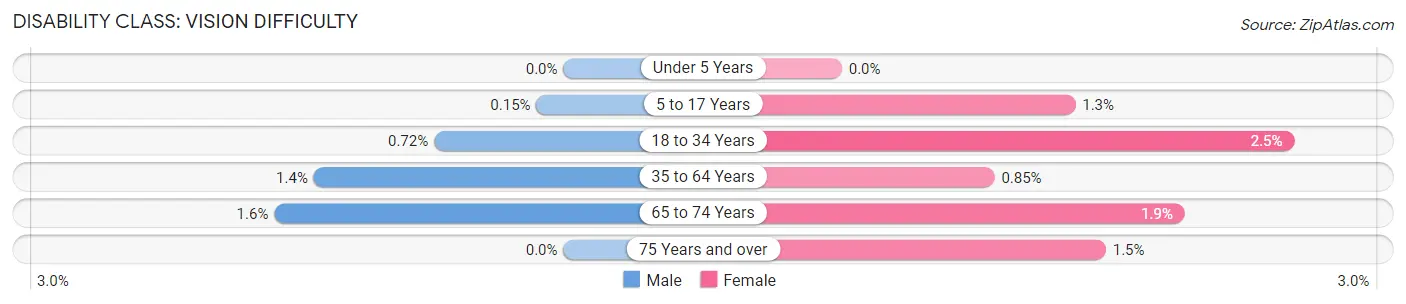
| Age Bracket | Male | Female |
| Under 5 Years | 0 (0.0%) | 0 (0.0%) |
| 5 to 17 Years | 3 (0.2%) | 23 (1.3%) |
| 18 to 34 Years | 31 (0.7%) | 134 (2.5%) |
| 35 to 64 Years | 58 (1.4%) | 36 (0.9%) |
| 65 to 74 Years | 12 (1.6%) | 19 (1.9%) |
| 75 Years and over | 0 (0.0%) | 10 (1.5%) |
Disability Class: Cognitive Difficulty
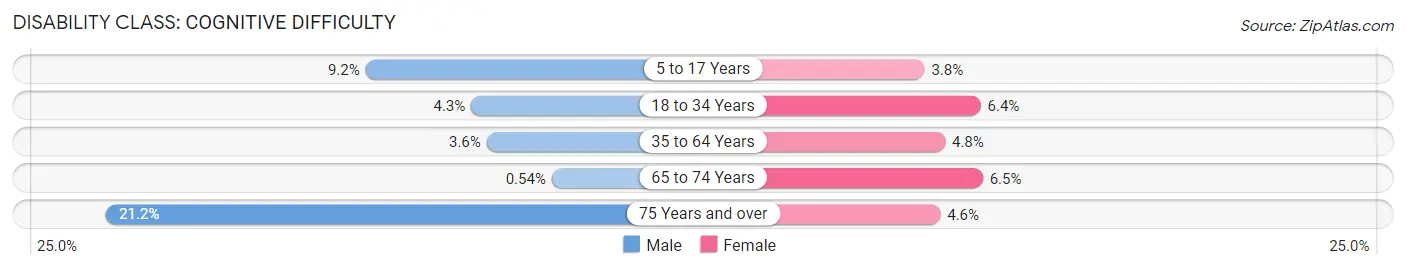
| Age Bracket | Male | Female |
| 5 to 17 Years | 180 (9.2%) | 68 (3.8%) |
| 18 to 34 Years | 184 (4.3%) | 343 (6.4%) |
| 35 to 64 Years | 148 (3.6%) | 202 (4.8%) |
| 65 to 74 Years | 4 (0.5%) | 65 (6.5%) |
| 75 Years and over | 101 (21.2%) | 31 (4.6%) |
Disability Class: Ambulatory Difficulty
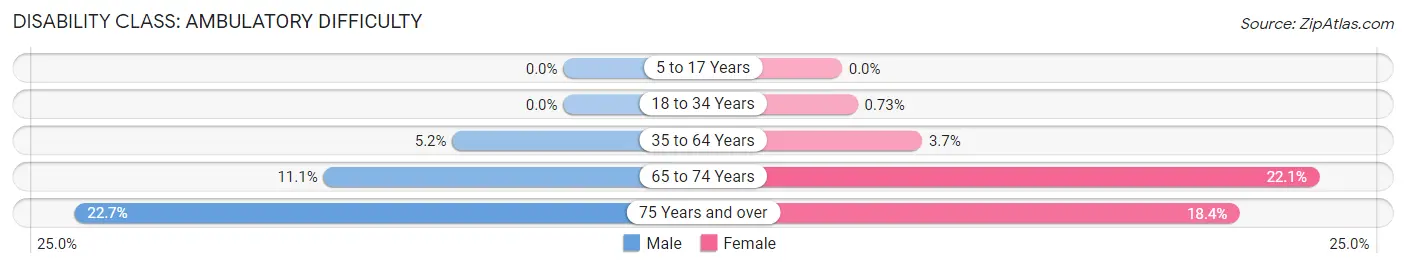
| Age Bracket | Male | Female |
| 5 to 17 Years | 0 (0.0%) | 0 (0.0%) |
| 18 to 34 Years | 0 (0.0%) | 39 (0.7%) |
| 35 to 64 Years | 214 (5.1%) | 157 (3.7%) |
| 65 to 74 Years | 83 (11.1%) | 220 (22.1%) |
| 75 Years and over | 108 (22.7%) | 125 (18.4%) |
Disability Class: Self-Care Difficulty
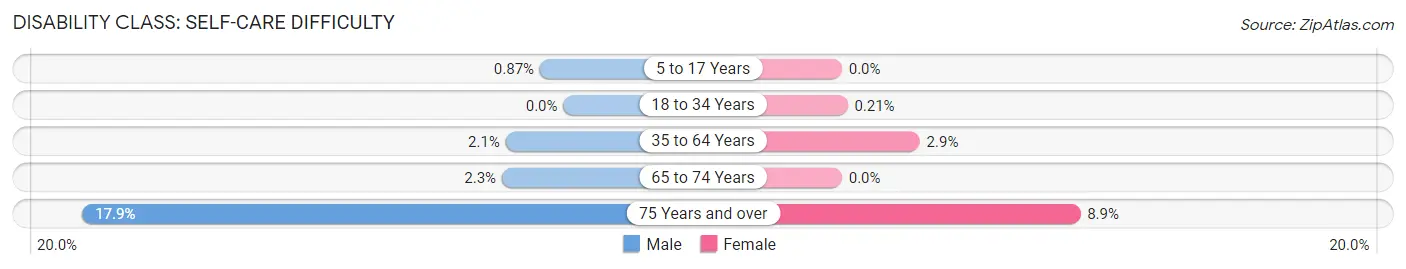
| Age Bracket | Male | Female |
| 5 to 17 Years | 17 (0.9%) | 0 (0.0%) |
| 18 to 34 Years | 0 (0.0%) | 11 (0.2%) |
| 35 to 64 Years | 89 (2.1%) | 122 (2.9%) |
| 65 to 74 Years | 17 (2.3%) | 0 (0.0%) |
| 75 Years and over | 85 (17.9%) | 60 (8.8%) |
Technology Access in Edwardsville
Computing Device Access in Edwardsville
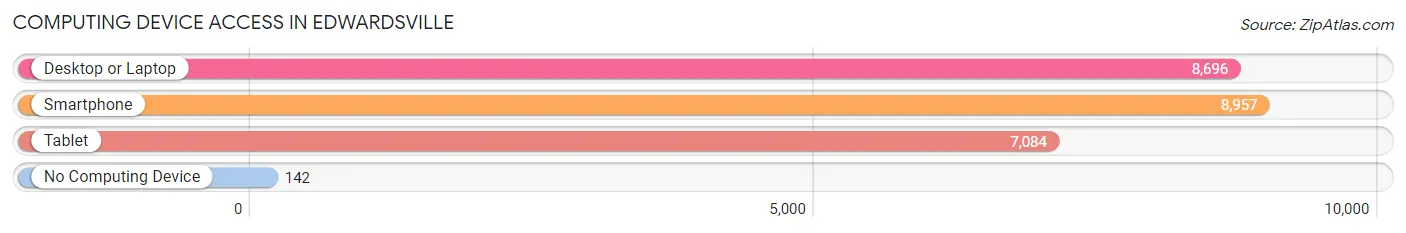
| Device Type | # Households | % Households |
| Desktop or Laptop | 8,696 | 92.9% |
| Smartphone | 8,957 | 95.7% |
| Tablet | 7,084 | 75.7% |
| No Computing Device | 142 | 1.5% |
| Total | 9,359 | 100.0% |
Internet Access in Edwardsville
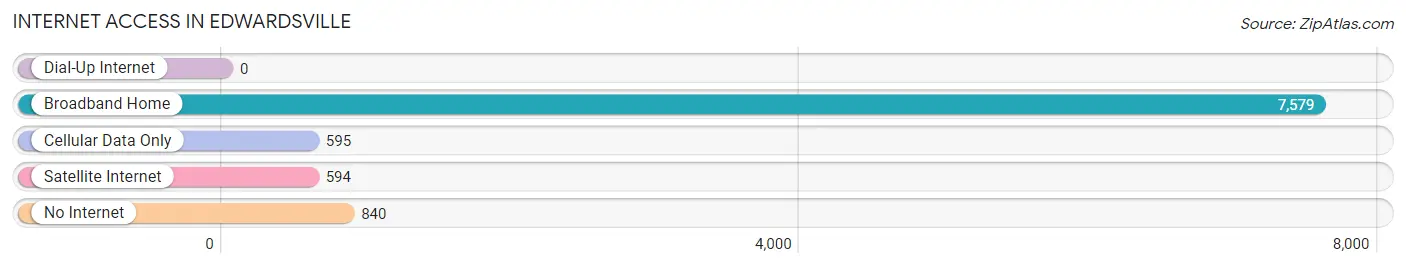
| Internet Type | # Households | % Households |
| Dial-Up Internet | 0 | 0.0% |
| Broadband Home | 7,579 | 81.0% |
| Cellular Data Only | 595 | 6.4% |
| Satellite Internet | 594 | 6.4% |
| No Internet | 840 | 9.0% |
| Total | 9,359 | 100.0% |
Edwardsville Summary
Edwardsville, Illinois is a city located in Madison County, Illinois, United States. It is the county seat of Madison County and is located just 25 miles northeast of St. Louis, Missouri. The city is part of the Metro-East region of the Greater St. Louis metropolitan area. As of the 2010 census, the city had a population of 24,293.
History
Edwardsville was founded in 1809 by Ninian Edwards, the Governor of the Illinois Territory. Edwardsville was named in his honor and became the county seat of Madison County. The city was incorporated in 1818 and has grown steadily since then.
In the early 19th century, Edwardsville was a major stop on the National Road, which connected the Midwest to the East Coast. The road was a major factor in the city’s growth and development.
In the late 19th century, Edwardsville was a major center for coal mining. The city was home to several coal mines, which provided jobs for many of the city’s residents.
Geography
Edwardsville is located in southwestern Illinois at 38°47′N 89°54′W (38.78, -89.90). It is situated on the bluffs of the Mississippi River, about 25 miles northeast of St. Louis, Missouri.
The city has a total area of 11.2 square miles, of which 11.1 square miles is land and 0.1 square miles is water.
Economy
Edwardsville’s economy is largely based on education, healthcare, and manufacturing. The city is home to Southern Illinois University Edwardsville, which is a major employer in the area. The university also provides a large number of jobs in the area.
Edwardsville is also home to several major healthcare providers, including Anderson Hospital, St. Elizabeth’s Hospital, and Gateway Regional Medical Center. These hospitals provide a large number of jobs in the area.
Edwardsville is also home to several major manufacturing companies, including Olin Corporation, which produces ammunition and chemicals, and GKN Sinter Metals, which produces automotive components. These companies provide a large number of jobs in the area.
Demographics
As of the 2010 census, there were 24,293 people, 9,845 households, and 5,945 families residing in the city. The population density was 2,179.2 people per square mile. The racial makeup of the city was 87.2% White, 8.2% African American, 0.3% Native American, 1.7% Asian, 0.1% Pacific Islander, 0.9% from other races, and 1.6% from two or more races. Hispanic or Latino of any race were 3.2% of the population.
The median income for a household in the city was $50,902, and the median income for a family was $63,945. Males had a median income of $45,945 versus $32,945 for females. The per capita income for the city was $25,945. About 6.2% of families and 10.2% of the population were below the poverty line, including 11.2% of those under age 18 and 6.2% of those age 65 or over.
Common Questions
What is Per Capita Income in Edwardsville?
Per Capita income in Edwardsville is $44,305.
What is the Median Family Income in Edwardsville?
Median Family Income in Edwardsville is $139,321.
What is the Median Household income in Edwardsville?
Median Household Income in Edwardsville is $87,094.
What is Income or Wage Gap in Edwardsville?
Income or Wage Gap in Edwardsville is 45.0%.
Women in Edwardsville earn 55.0 cents for every dollar earned by a man.
What is Family Income Deficit in Edwardsville?
Family Income Deficit in Edwardsville is $9,494.
Families that are below poverty line in Edwardsville earn $9,494 less on average than the poverty threshold level.
What is Inequality or Gini Index in Edwardsville?
Inequality or Gini Index in Edwardsville is 0.47.
What is the Total Population of Edwardsville?
Total Population of Edwardsville is 26,622.
What is the Total Male Population of Edwardsville?
Total Male Population of Edwardsville is 12,615.
What is the Total Female Population of Edwardsville?
Total Female Population of Edwardsville is 14,007.
What is the Ratio of Males per 100 Females in Edwardsville?
There are 90.06 Males per 100 Females in Edwardsville.
What is the Ratio of Females per 100 Males in Edwardsville?
There are 111.03 Females per 100 Males in Edwardsville.
What is the Median Population Age in Edwardsville?
Median Population Age in Edwardsville is 30.6 Years.
What is the Average Family Size in Edwardsville
Average Family Size in Edwardsville is 3.1 People.
What is the Average Household Size in Edwardsville
Average Household Size in Edwardsville is 2.5 People.
How Large is the Labor Force in Edwardsville?
There are 13,890 People in the Labor Forcein in Edwardsville.
What is the Percentage of People in the Labor Force in Edwardsville?
62.6% of People are in the Labor Force in Edwardsville.
What is the Unemployment Rate in Edwardsville?
Unemployment Rate in Edwardsville is 6.3%.