Bradley, IL Map & Demographics
Bradley Map
Bradley Overview
$31,801
PER CAPITA INCOME
$69,077
AVG FAMILY INCOME
$59,746
AVG HOUSEHOLD INCOME
34.0%
WAGE / INCOME GAP [ % ]
66.0¢/ $1
WAGE / INCOME GAP [ $ ]
$12,063
FAMILY INCOME DEFICIT
0.39
INEQUALITY / GINI INDEX
15,379
TOTAL POPULATION
7,540
MALE POPULATION
7,839
FEMALE POPULATION
96.19
MALES / 100 FEMALES
103.97
FEMALES / 100 MALES
36.0
MEDIAN AGE
3.1
AVG FAMILY SIZE
2.5
AVG HOUSEHOLD SIZE
8,455
LABOR FORCE [ PEOPLE ]
67.7%
PERCENT IN LABOR FORCE
4.3%
UNEMPLOYMENT RATE
Bradley Zip Codes
Bradley Area Codes
Income in Bradley
Income Overview in Bradley
Per Capita Income in Bradley is $31,801, while median incomes of families and households are $69,077 and $59,746 respectively.
| Characteristic | Number | Measure |
| Per Capita Income | 15,379 | $31,801 |
| Median Family Income | 3,642 | $69,077 |
| Mean Family Income | 3,642 | $90,472 |
| Median Household Income | 5,987 | $59,746 |
| Mean Household Income | 5,987 | $79,152 |
| Income Deficit | 3,642 | $12,063 |
| Wage / Income Gap (%) | 15,379 | 33.97% |
| Wage / Income Gap ($) | 15,379 | 66.03¢ per $1 |
| Gini / Inequality Index | 15,379 | 0.39 |
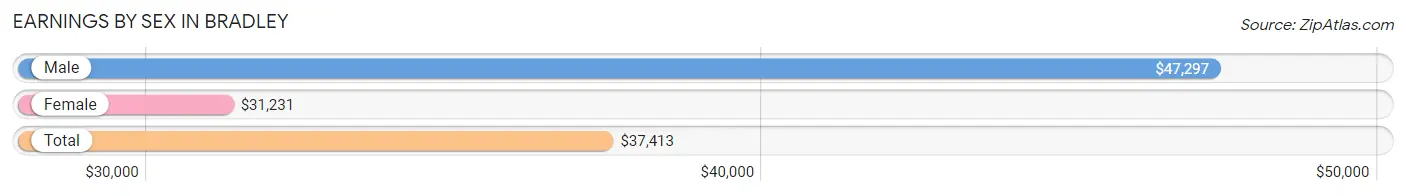
Earnings by Sex in Bradley
Average Earnings in Bradley are $37,413, $47,297 for men and $31,231 for women, a difference of 34.0%.
| Sex | Number | Average Earnings |
| Male | 4,475 (52.9%) | $47,297 |
| Female | 3,985 (47.1%) | $31,231 |
| Total | 8,460 (100.0%) | $37,413 |
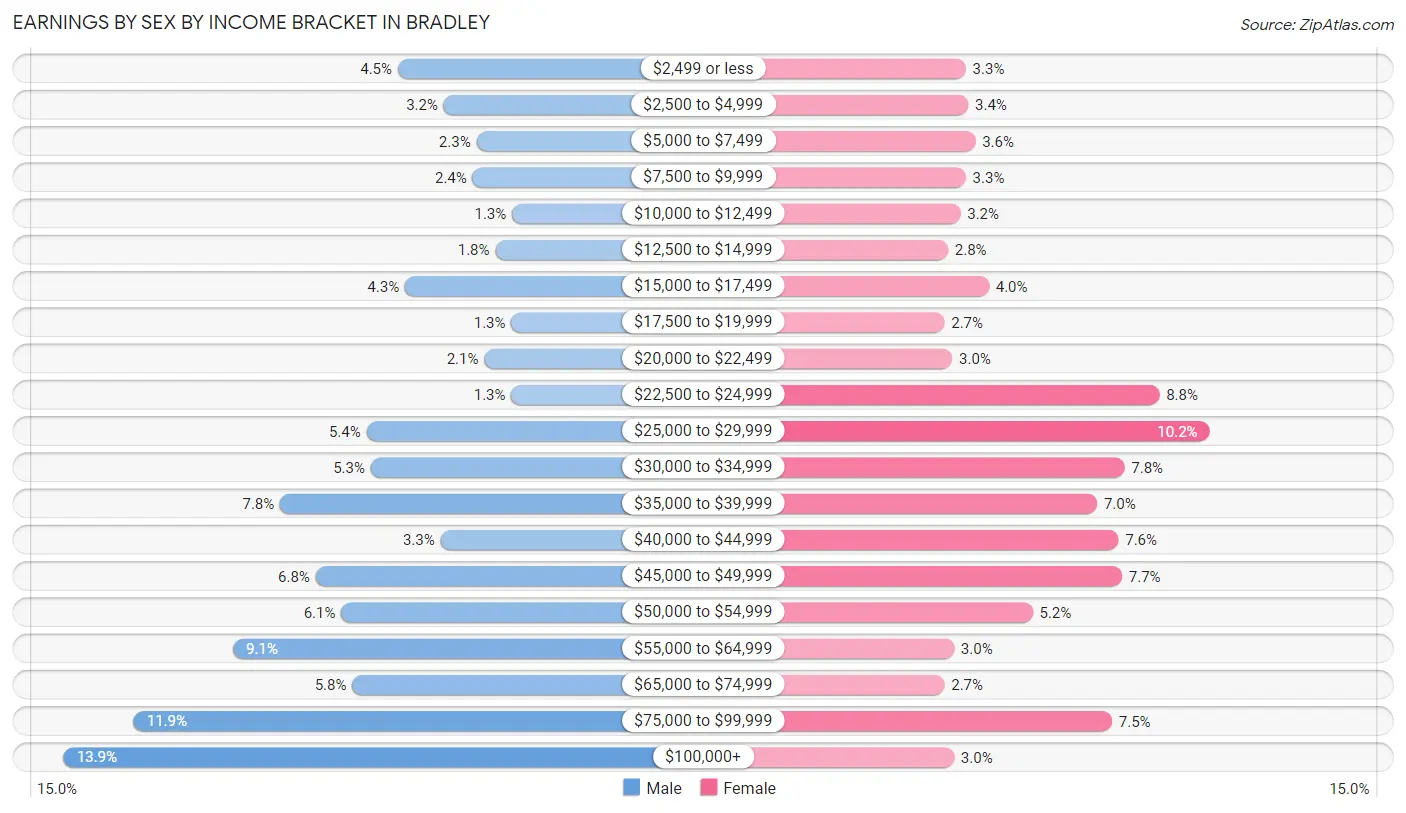
Earnings by Sex by Income Bracket in Bradley
The most common earnings brackets in Bradley are $100,000+ for men (622 | 13.9%) and $25,000 to $29,999 for women (406 | 10.2%).
| Income | Male | Female |
| $2,499 or less | 202 (4.5%) | 133 (3.3%) |
| $2,500 to $4,999 | 144 (3.2%) | 136 (3.4%) |
| $5,000 to $7,499 | 103 (2.3%) | 144 (3.6%) |
| $7,500 to $9,999 | 108 (2.4%) | 133 (3.3%) |
| $10,000 to $12,499 | 58 (1.3%) | 127 (3.2%) |
| $12,500 to $14,999 | 79 (1.8%) | 113 (2.8%) |
| $15,000 to $17,499 | 193 (4.3%) | 159 (4.0%) |
| $17,500 to $19,999 | 59 (1.3%) | 109 (2.7%) |
| $20,000 to $22,499 | 93 (2.1%) | 118 (3.0%) |
| $22,500 to $24,999 | 59 (1.3%) | 350 (8.8%) |
| $25,000 to $29,999 | 241 (5.4%) | 406 (10.2%) |
| $30,000 to $34,999 | 236 (5.3%) | 311 (7.8%) |
| $35,000 to $39,999 | 350 (7.8%) | 280 (7.0%) |
| $40,000 to $44,999 | 148 (3.3%) | 304 (7.6%) |
| $45,000 to $49,999 | 305 (6.8%) | 308 (7.7%) |
| $50,000 to $54,999 | 273 (6.1%) | 208 (5.2%) |
| $55,000 to $64,999 | 409 (9.1%) | 120 (3.0%) |
| $65,000 to $74,999 | 259 (5.8%) | 109 (2.7%) |
| $75,000 to $99,999 | 534 (11.9%) | 297 (7.4%) |
| $100,000+ | 622 (13.9%) | 120 (3.0%) |
| Total | 4,475 (100.0%) | 3,985 (100.0%) |
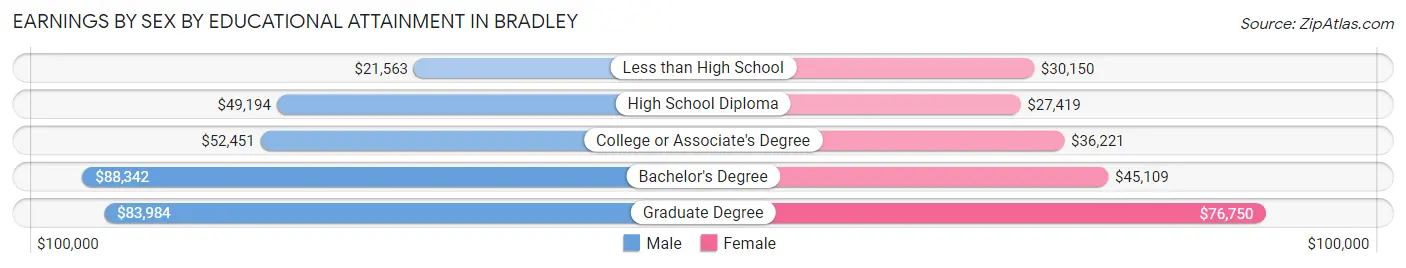
Earnings by Sex by Educational Attainment in Bradley
Average earnings in Bradley are $56,250 for men and $35,872 for women, a difference of 36.2%. Men with an educational attainment of bachelor's degree enjoy the highest average annual earnings of $88,342, while those with less than high school education earn the least with $21,563. Women with an educational attainment of graduate degree earn the most with the average annual earnings of $76,750, while those with high school diploma education have the smallest earnings of $27,419.
| Educational Attainment | Male Income | Female Income |
| Less than High School | $21,563 | $30,150 |
| High School Diploma | $49,194 | $27,419 |
| College or Associate's Degree | $52,451 | $36,221 |
| Bachelor's Degree | $88,342 | $45,109 |
| Graduate Degree | $83,984 | $76,750 |
| Total | $56,250 | $35,872 |
Family Income in Bradley
Family Income Brackets in Bradley
According to the Bradley family income data, there are 754 families falling into the $50,000 to $74,999 income range, which is the most common income bracket and makes up 20.7% of all families. Conversely, the $10,000 to $14,999 income bracket is the least frequent group with only 69 families (1.9%) belonging to this category.
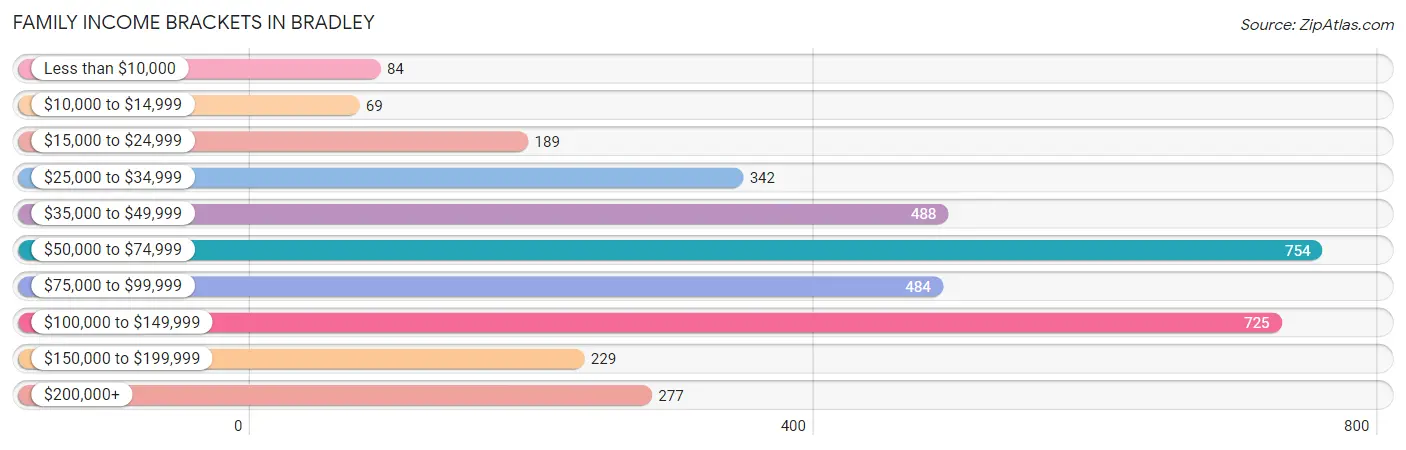
| Income Bracket | # Families | % Families |
| Less than $10,000 | 84 | 2.3% |
| $10,000 to $14,999 | 69 | 1.9% |
| $15,000 to $24,999 | 189 | 5.2% |
| $25,000 to $34,999 | 342 | 9.4% |
| $35,000 to $49,999 | 488 | 13.4% |
| $50,000 to $74,999 | 754 | 20.7% |
| $75,000 to $99,999 | 484 | 13.3% |
| $100,000 to $149,999 | 725 | 19.9% |
| $150,000 to $199,999 | 229 | 6.3% |
| $200,000+ | 277 | 7.6% |
Family Income by Famaliy Size in Bradley
6-person families (68 | 1.9%) account for the highest median family income in Bradley with $148,816 per family, while 4-person families (670 | 18.4%) have the highest median income of $31,934 per family member.
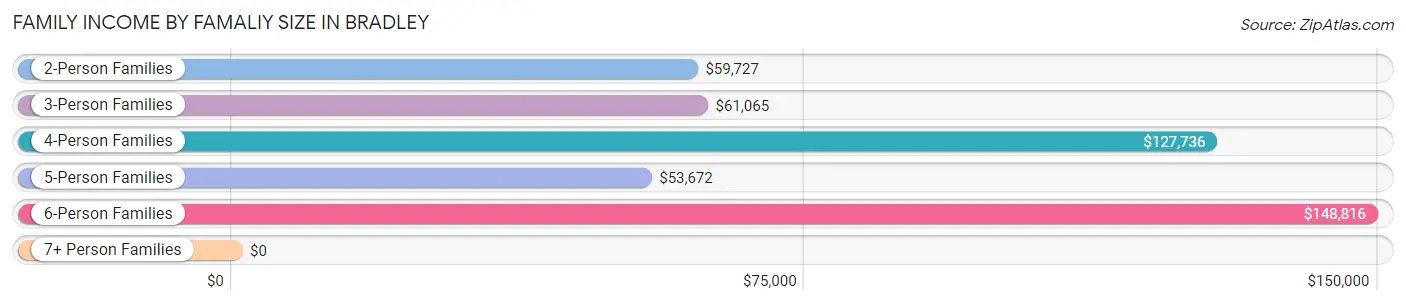
| Income Bracket | # Families | Median Income |
| 2-Person Families | 1,747 (48.0%) | $59,727 |
| 3-Person Families | 753 (20.7%) | $61,065 |
| 4-Person Families | 670 (18.4%) | $127,736 |
| 5-Person Families | 400 (11.0%) | $53,672 |
| 6-Person Families | 68 (1.9%) | $148,816 |
| 7+ Person Families | 4 (0.1%) | $0 |
| Total | 3,642 (100.0%) | $69,077 |
Family Income by Number of Earners in Bradley
The median family income in Bradley is $69,077, with families comprising 3+ earners (561) having the highest median family income of $148,664, while families with no earners (663) have the lowest median family income of $45,777, accounting for 15.4% and 18.2% of families, respectively.
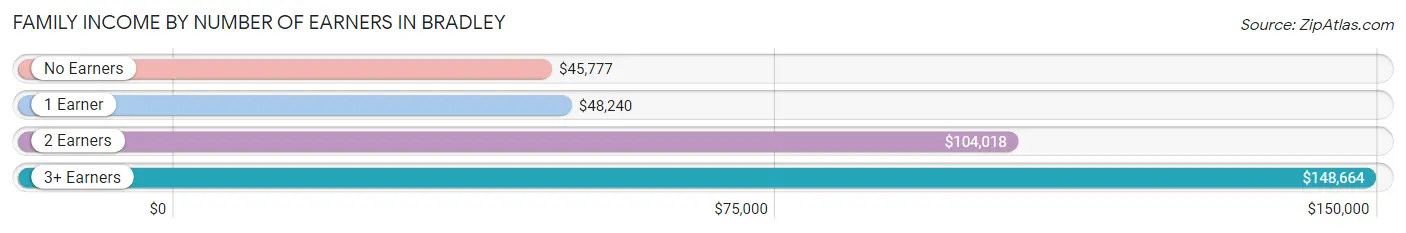
| Number of Earners | # Families | Median Income |
| No Earners | 663 (18.2%) | $45,777 |
| 1 Earner | 1,115 (30.6%) | $48,240 |
| 2 Earners | 1,303 (35.8%) | $104,018 |
| 3+ Earners | 561 (15.4%) | $148,664 |
| Total | 3,642 (100.0%) | $69,077 |
Household Income in Bradley
Household Income Brackets in Bradley
With 1,257 households falling in the category, the $50,000 to $74,999 income range is the most frequent in Bradley, accounting for 21.0% of all households. In contrast, only 150 households (2.5%) fall into the less than $10,000 income bracket, making it the least populous group.
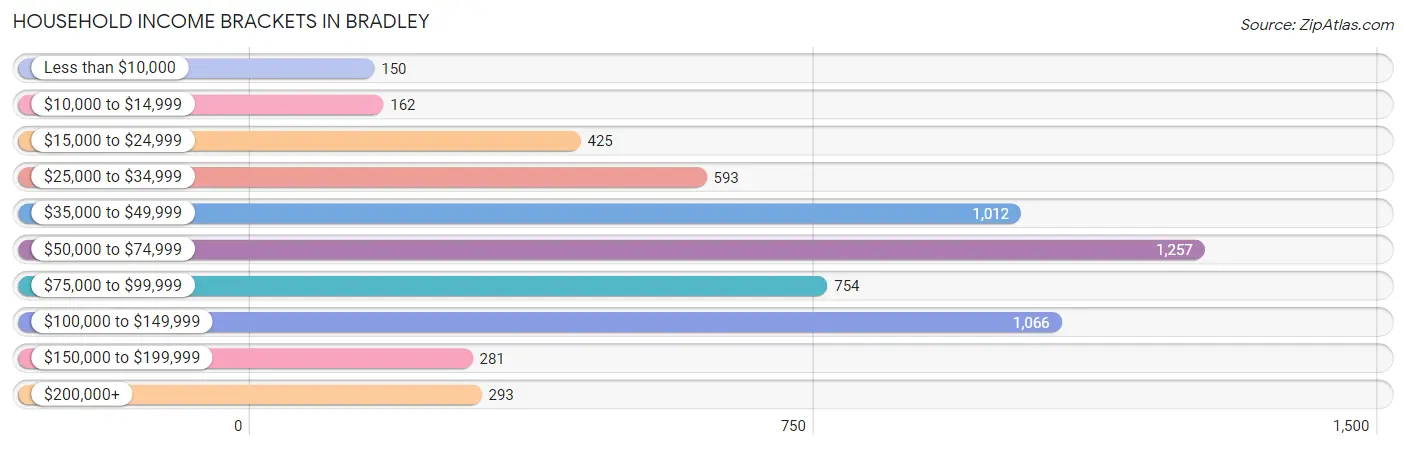
| Income Bracket | # Households | % Households |
| Less than $10,000 | 150 | 2.5% |
| $10,000 to $14,999 | 162 | 2.7% |
| $15,000 to $24,999 | 425 | 7.1% |
| $25,000 to $34,999 | 593 | 9.9% |
| $35,000 to $49,999 | 1,012 | 16.9% |
| $50,000 to $74,999 | 1,257 | 21.0% |
| $75,000 to $99,999 | 754 | 12.6% |
| $100,000 to $149,999 | 1,066 | 17.8% |
| $150,000 to $199,999 | 281 | 4.7% |
| $200,000+ | 293 | 4.9% |
Household Income by Householder Age in Bradley
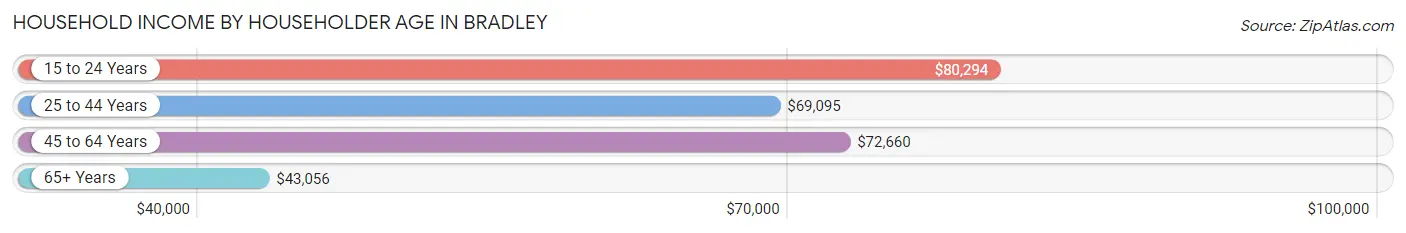
The median household income in Bradley is $59,746, with the highest median household income of $80,294 found in the 15 to 24 years age bracket for the primary householder. A total of 324 households (5.4%) fall into this category. Meanwhile, the 65+ years age bracket for the primary householder has the lowest median household income of $43,056, with 1,452 households (24.2%) in this group.
| Income Bracket | # Households | Median Income |
| 15 to 24 Years | 324 (5.4%) | $80,294 |
| 25 to 44 Years | 1,964 (32.8%) | $69,095 |
| 45 to 64 Years | 2,247 (37.5%) | $72,660 |
| 65+ Years | 1,452 (24.2%) | $43,056 |
| Total | 5,987 (100.0%) | $59,746 |
Poverty in Bradley
Income Below Poverty by Sex and Age in Bradley
With 9.2% poverty level for males and 15.0% for females among the residents of Bradley, 5 year old males and 15 year old females are the most vulnerable to poverty, with 22 males (19.3%) and 20 females (64.5%) in their respective age groups living below the poverty level.
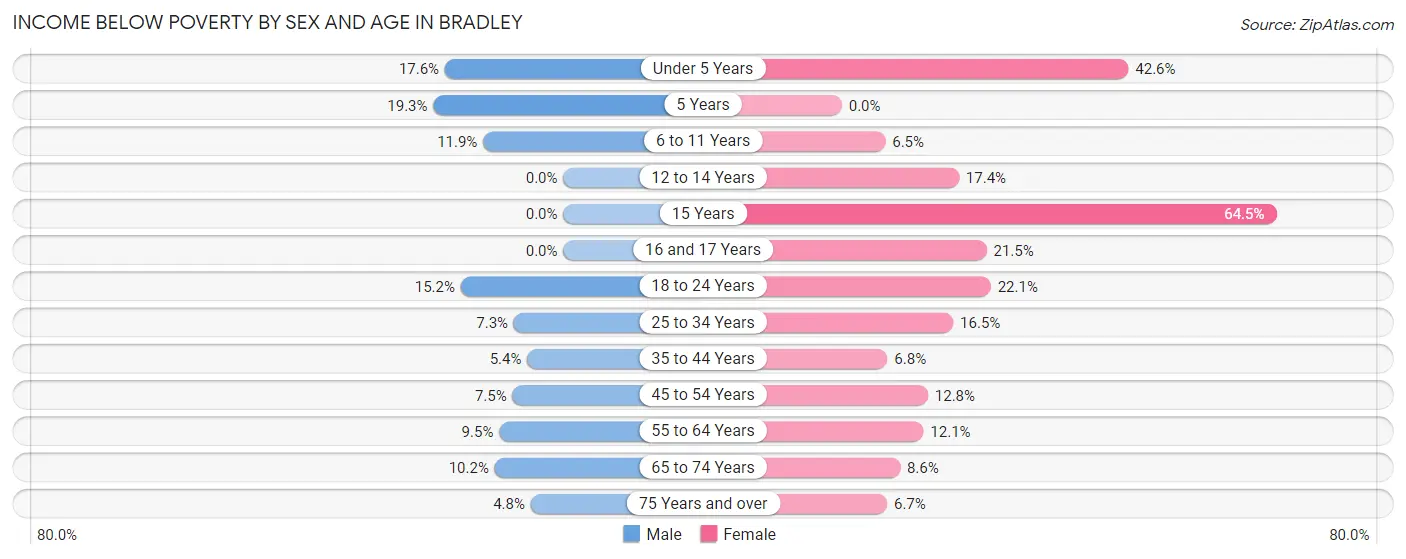
| Age Bracket | Male | Female |
| Under 5 Years | 77 (17.6%) | 234 (42.5%) |
| 5 Years | 22 (19.3%) | 0 (0.0%) |
| 6 to 11 Years | 60 (11.9%) | 29 (6.5%) |
| 12 to 14 Years | 0 (0.0%) | 56 (17.4%) |
| 15 Years | 0 (0.0%) | 20 (64.5%) |
| 16 and 17 Years | 0 (0.0%) | 49 (21.5%) |
| 18 to 24 Years | 169 (15.2%) | 196 (22.1%) |
| 25 to 34 Years | 82 (7.3%) | 178 (16.5%) |
| 35 to 44 Years | 47 (5.3%) | 69 (6.8%) |
| 45 to 54 Years | 64 (7.5%) | 131 (12.8%) |
| 55 to 64 Years | 95 (9.5%) | 99 (12.1%) |
| 65 to 74 Years | 49 (10.2%) | 68 (8.6%) |
| 75 Years and over | 24 (4.8%) | 33 (6.7%) |
| Total | 689 (9.2%) | 1,162 (15.0%) |
Income Above Poverty by Sex and Age in Bradley
According to the poverty statistics in Bradley, males aged 12 to 14 years and females aged 5 years are the age groups that are most secure financially, with 100.0% of males and 100.0% of females in these age groups living above the poverty line.
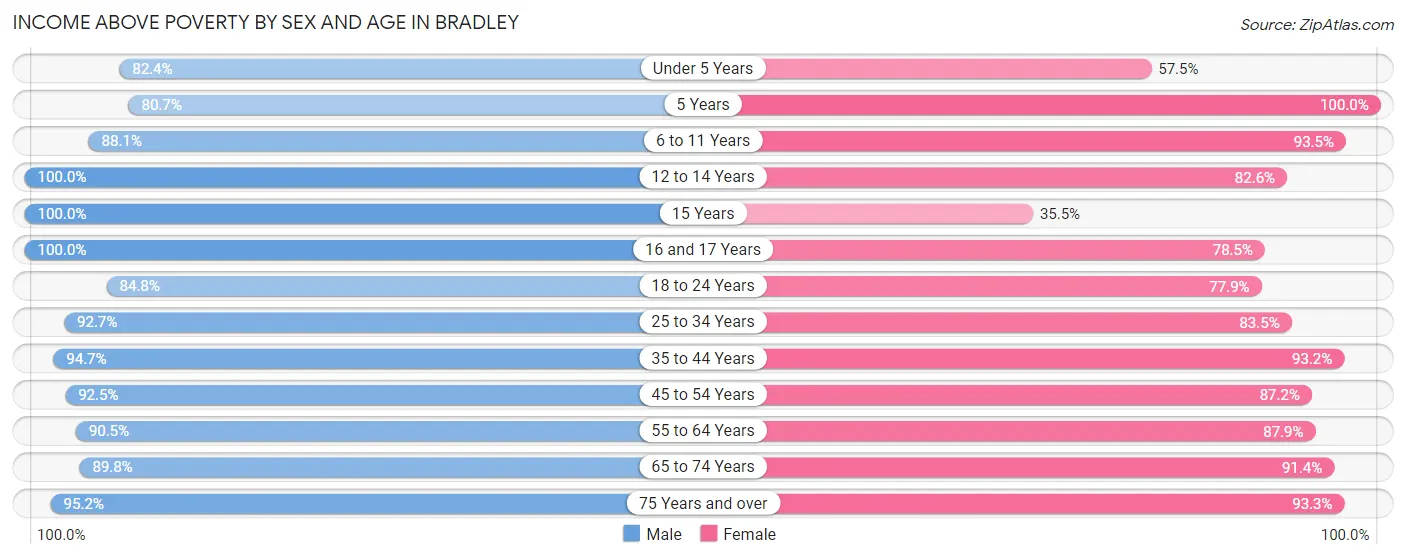
| Age Bracket | Male | Female |
| Under 5 Years | 361 (82.4%) | 316 (57.5%) |
| 5 Years | 92 (80.7%) | 60 (100.0%) |
| 6 to 11 Years | 444 (88.1%) | 420 (93.5%) |
| 12 to 14 Years | 166 (100.0%) | 266 (82.6%) |
| 15 Years | 158 (100.0%) | 11 (35.5%) |
| 16 and 17 Years | 153 (100.0%) | 179 (78.5%) |
| 18 to 24 Years | 941 (84.8%) | 690 (77.9%) |
| 25 to 34 Years | 1,035 (92.7%) | 898 (83.5%) |
| 35 to 44 Years | 831 (94.7%) | 950 (93.2%) |
| 45 to 54 Years | 785 (92.5%) | 894 (87.2%) |
| 55 to 64 Years | 903 (90.5%) | 718 (87.9%) |
| 65 to 74 Years | 432 (89.8%) | 719 (91.4%) |
| 75 Years and over | 472 (95.2%) | 458 (93.3%) |
| Total | 6,773 (90.8%) | 6,579 (85.0%) |
Income Below Poverty Among Married-Couple Families in Bradley
The poverty statistics for married-couple families in Bradley show that 4.5% or 115 of the total 2,540 families live below the poverty line. Families with 1 or 2 children have the highest poverty rate of 9.5%, comprising of 85 families. On the other hand, families with 3 or 4 children have the lowest poverty rate of 0.0%, which includes 0 families.
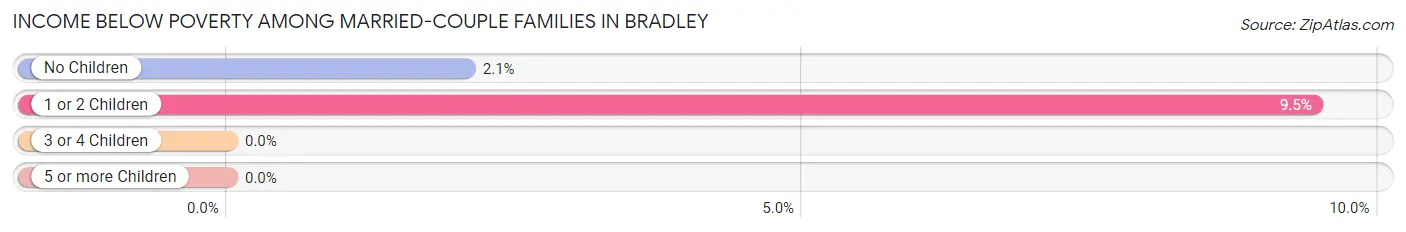
| Children | Above Poverty | Below Poverty |
| No Children | 1,417 (97.9%) | 30 (2.1%) |
| 1 or 2 Children | 814 (90.5%) | 85 (9.5%) |
| 3 or 4 Children | 190 (100.0%) | 0 (0.0%) |
| 5 or more Children | 4 (100.0%) | 0 (0.0%) |
| Total | 2,425 (95.5%) | 115 (4.5%) |
Income Below Poverty Among Single-Parent Households in Bradley
According to the poverty data in Bradley, 14.5% or 57 single-father households and 17.5% or 124 single-mother households are living below the poverty line. Among single-father households, those with 3 or 4 children have the highest poverty rate, with 11 households (50.0%) experiencing poverty. Likewise, among single-mother households, those with 3 or 4 children have the highest poverty rate, with 24 households (47.1%) falling below the poverty line.
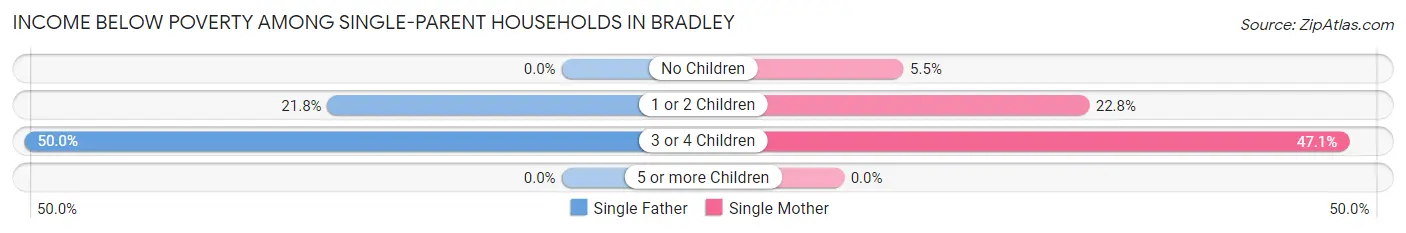
| Children | Single Father | Single Mother |
| No Children | 0 (0.0%) | 16 (5.5%) |
| 1 or 2 Children | 46 (21.8%) | 84 (22.8%) |
| 3 or 4 Children | 11 (50.0%) | 24 (47.1%) |
| 5 or more Children | 0 (0.0%) | 0 (0.0%) |
| Total | 57 (14.5%) | 124 (17.5%) |
Income Below Poverty Among Married-Couple vs Single-Parent Households in Bradley
The poverty data for Bradley shows that 115 of the married-couple family households (4.5%) and 181 of the single-parent households (16.4%) are living below the poverty level. Within the married-couple family households, those with 1 or 2 children have the highest poverty rate, with 85 households (9.5%) falling below the poverty line. Among the single-parent households, those with 3 or 4 children have the highest poverty rate, with 35 household (47.9%) living below poverty.
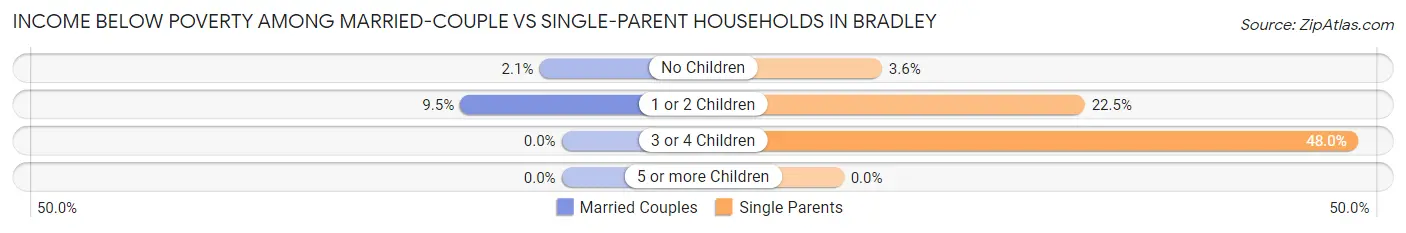
| Children | Married-Couple Families | Single-Parent Households |
| No Children | 30 (2.1%) | 16 (3.6%) |
| 1 or 2 Children | 85 (9.5%) | 130 (22.5%) |
| 3 or 4 Children | 0 (0.0%) | 35 (47.9%) |
| 5 or more Children | 0 (0.0%) | 0 (0.0%) |
| Total | 115 (4.5%) | 181 (16.4%) |
Race in Bradley
The most populous races in Bradley are White / Caucasian (12,901 | 83.9%), Hispanic or Latino (1,634 | 10.6%), and Black / African American (1,097 | 7.1%).
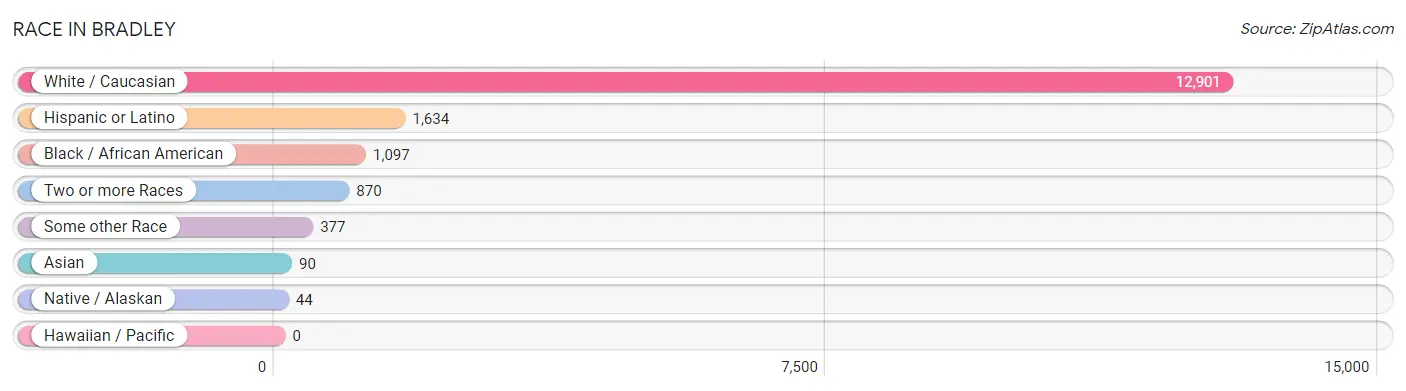
| Race | # Population | % Population |
| Asian | 90 | 0.6% |
| Black / African American | 1,097 | 7.1% |
| Hawaiian / Pacific | 0 | 0.0% |
| Hispanic or Latino | 1,634 | 10.6% |
| Native / Alaskan | 44 | 0.3% |
| White / Caucasian | 12,901 | 83.9% |
| Two or more Races | 870 | 5.7% |
| Some other Race | 377 | 2.5% |
| Total | 15,379 | 100.0% |
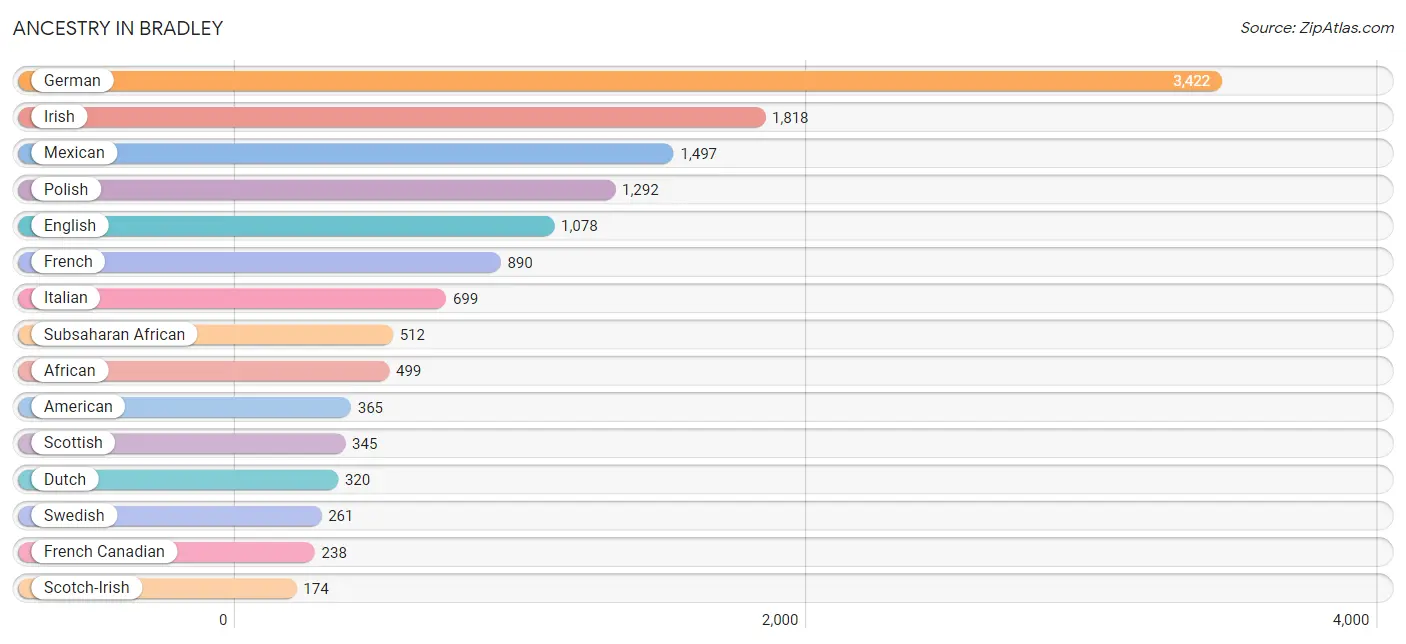
Ancestry in Bradley
The most populous ancestries reported in Bradley are German (3,422 | 22.3%), Irish (1,818 | 11.8%), Mexican (1,497 | 9.7%), Polish (1,292 | 8.4%), and English (1,078 | 7.0%), together accounting for 59.2% of all Bradley residents.
| Ancestry | # Population | % Population |
| African | 499 | 3.2% |
| American | 365 | 2.4% |
| Apache | 4 | 0.0% |
| Arab | 16 | 0.1% |
| Austrian | 75 | 0.5% |
| Belgian | 7 | 0.1% |
| Bhutanese | 16 | 0.1% |
| British | 17 | 0.1% |
| Burmese | 37 | 0.2% |
| Canadian | 37 | 0.2% |
| Central American | 39 | 0.3% |
| Central American Indian | 39 | 0.3% |
| Cherokee | 4 | 0.0% |
| Croatian | 22 | 0.1% |
| Cuban | 25 | 0.2% |
| Czech | 37 | 0.2% |
| Czechoslovakian | 12 | 0.1% |
| Danish | 107 | 0.7% |
| Delaware | 10 | 0.1% |
| Dutch | 320 | 2.1% |
| Eastern European | 12 | 0.1% |
| English | 1,078 | 7.0% |
| European | 82 | 0.5% |
| Finnish | 33 | 0.2% |
| French | 890 | 5.8% |
| French Canadian | 238 | 1.5% |
| German | 3,422 | 22.3% |
| Ghanaian | 5 | 0.0% |
| Greek | 25 | 0.2% |
| Guatemalan | 39 | 0.3% |
| Haitian | 44 | 0.3% |
| Hungarian | 53 | 0.3% |
| Irish | 1,818 | 11.8% |
| Italian | 699 | 4.5% |
| Kenyan | 1 | 0.0% |
| Korean | 39 | 0.3% |
| Lebanese | 16 | 0.1% |
| Lithuanian | 123 | 0.8% |
| Mexican | 1,497 | 9.7% |
| Mexican American Indian | 31 | 0.2% |
| Native Hawaiian | 26 | 0.2% |
| Nigerian | 7 | 0.1% |
| Northern European | 18 | 0.1% |
| Norwegian | 97 | 0.6% |
| Polish | 1,292 | 8.4% |
| Puerto Rican | 53 | 0.3% |
| Russian | 33 | 0.2% |
| Scandinavian | 98 | 0.6% |
| Scotch-Irish | 174 | 1.1% |
| Scottish | 345 | 2.2% |
| Serbian | 21 | 0.1% |
| Slovak | 7 | 0.1% |
| Slovene | 6 | 0.0% |
| Spanish | 15 | 0.1% |
| Sri Lankan | 14 | 0.1% |
| Subsaharan African | 512 | 3.3% |
| Swedish | 261 | 1.7% |
| Swiss | 53 | 0.3% |
| Welsh | 48 | 0.3% | View All 59 Rows |
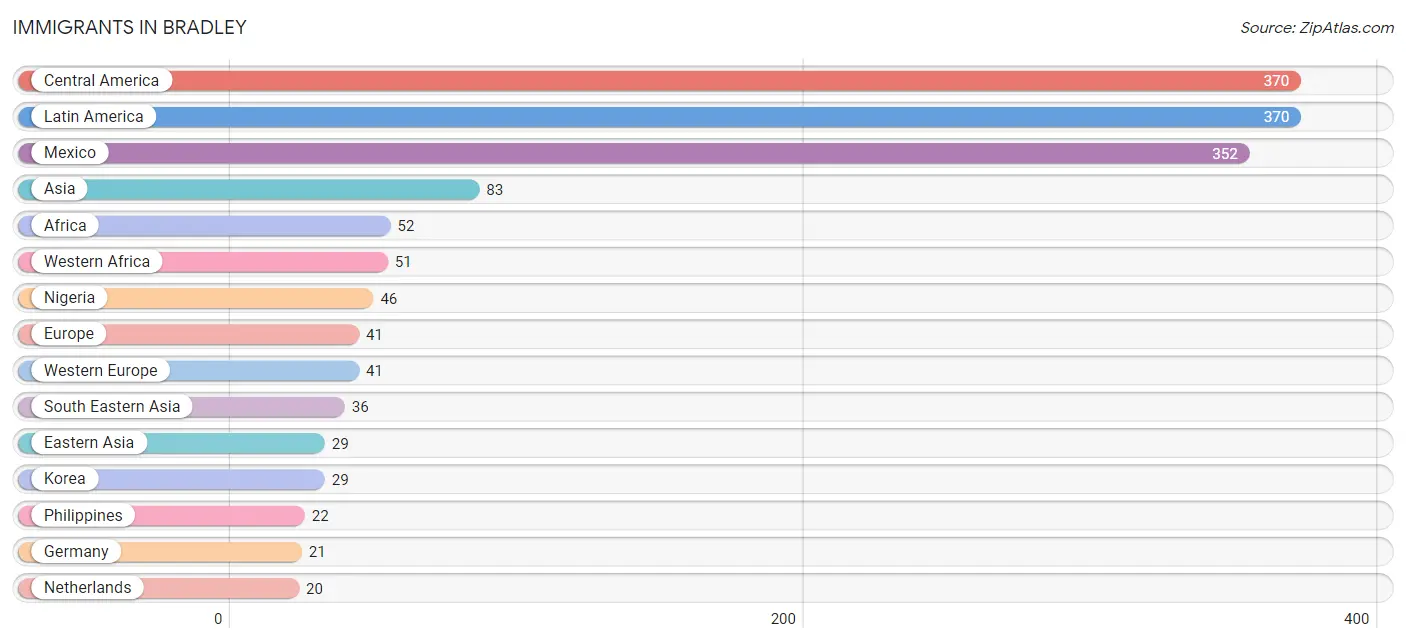
Immigrants in Bradley
The most numerous immigrant groups reported in Bradley came from Central America (370 | 2.4%), Latin America (370 | 2.4%), Mexico (352 | 2.3%), Asia (83 | 0.5%), and Africa (52 | 0.3%), together accounting for 8.0% of all Bradley residents.
| Immigration Origin | # Population | % Population |
| Africa | 52 | 0.3% |
| Asia | 83 | 0.5% |
| Canada | 19 | 0.1% |
| Central America | 370 | 2.4% |
| Eastern Africa | 1 | 0.0% |
| Eastern Asia | 29 | 0.2% |
| Europe | 41 | 0.3% |
| Germany | 21 | 0.1% |
| Ghana | 5 | 0.0% |
| Guatemala | 18 | 0.1% |
| Kenya | 1 | 0.0% |
| Korea | 29 | 0.2% |
| Latin America | 370 | 2.4% |
| Mexico | 352 | 2.3% |
| Netherlands | 20 | 0.1% |
| Nigeria | 46 | 0.3% |
| Philippines | 22 | 0.1% |
| South Eastern Asia | 36 | 0.2% |
| Turkey | 18 | 0.1% |
| Vietnam | 14 | 0.1% |
| Western Africa | 51 | 0.3% |
| Western Asia | 18 | 0.1% |
| Western Europe | 41 | 0.3% | View All 23 Rows |
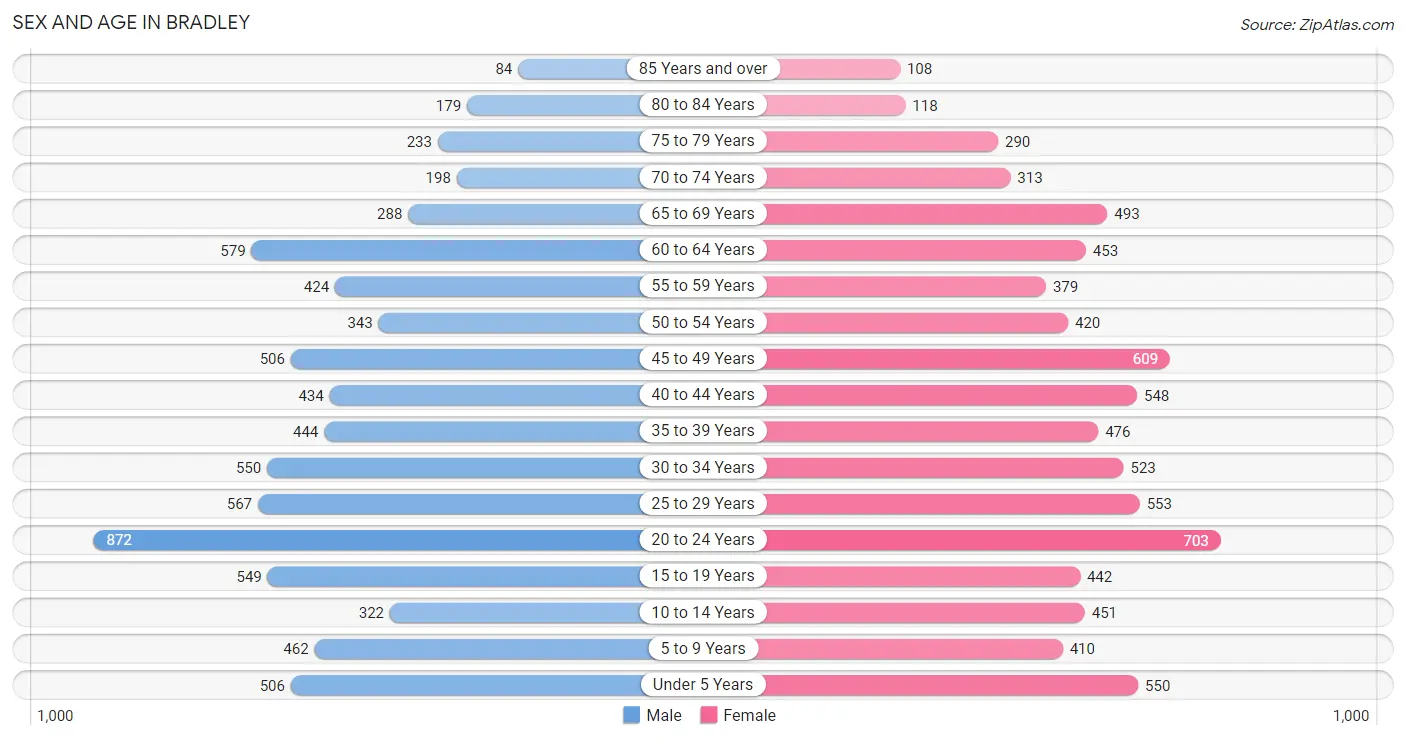
Sex and Age in Bradley
Sex and Age in Bradley
The most populous age groups in Bradley are 20 to 24 Years (872 | 11.6%) for men and 20 to 24 Years (703 | 9.0%) for women.
| Age Bracket | Male | Female |
| Under 5 Years | 506 (6.7%) | 550 (7.0%) |
| 5 to 9 Years | 462 (6.1%) | 410 (5.2%) |
| 10 to 14 Years | 322 (4.3%) | 451 (5.8%) |
| 15 to 19 Years | 549 (7.3%) | 442 (5.6%) |
| 20 to 24 Years | 872 (11.6%) | 703 (9.0%) |
| 25 to 29 Years | 567 (7.5%) | 553 (7.0%) |
| 30 to 34 Years | 550 (7.3%) | 523 (6.7%) |
| 35 to 39 Years | 444 (5.9%) | 476 (6.1%) |
| 40 to 44 Years | 434 (5.8%) | 548 (7.0%) |
| 45 to 49 Years | 506 (6.7%) | 609 (7.8%) |
| 50 to 54 Years | 343 (4.5%) | 420 (5.4%) |
| 55 to 59 Years | 424 (5.6%) | 379 (4.8%) |
| 60 to 64 Years | 579 (7.7%) | 453 (5.8%) |
| 65 to 69 Years | 288 (3.8%) | 493 (6.3%) |
| 70 to 74 Years | 198 (2.6%) | 313 (4.0%) |
| 75 to 79 Years | 233 (3.1%) | 290 (3.7%) |
| 80 to 84 Years | 179 (2.4%) | 118 (1.5%) |
| 85 Years and over | 84 (1.1%) | 108 (1.4%) |
| Total | 7,540 (100.0%) | 7,839 (100.0%) |
Families and Households in Bradley
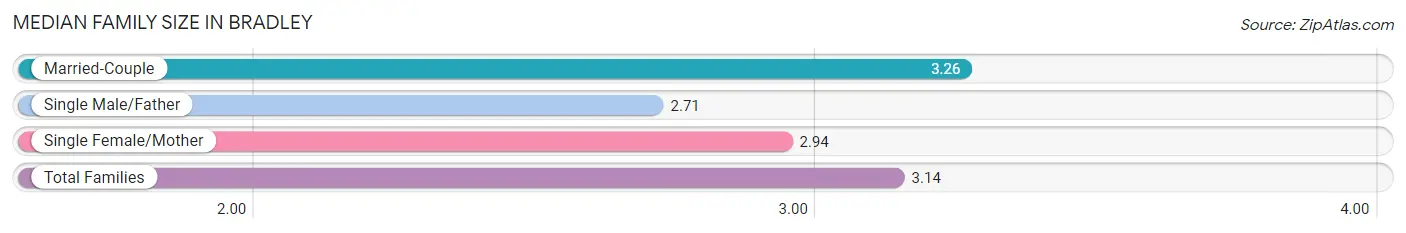
Median Family Size in Bradley
The median family size in Bradley is 3.14 persons per family, with married-couple families (2,540 | 69.7%) accounting for the largest median family size of 3.26 persons per family. On the other hand, single male/father families (394 | 10.8%) represent the smallest median family size with 2.71 persons per family.
| Family Type | # Families | Family Size |
| Married-Couple | 2,540 (69.7%) | 3.26 |
| Single Male/Father | 394 (10.8%) | 2.71 |
| Single Female/Mother | 708 (19.4%) | 2.94 |
| Total Families | 3,642 (100.0%) | 3.14 |
Median Household Size in Bradley
The median household size in Bradley is 2.55 persons per household, with single male/father households (394 | 6.6%) accounting for the largest median household size of 3.39 persons per household. non-family households (2,345 | 39.2%) represent the smallest median household size with 1.39 persons per household.

| Household Type | # Households | Household Size |
| Married-Couple | 2,540 (42.4%) | 3.32 |
| Single Male/Father | 394 (6.6%) | 3.39 |
| Single Female/Mother | 708 (11.8%) | 3.12 |
| Non-family | 2,345 (39.2%) | 1.39 |
| Total Households | 5,987 (100.0%) | 2.55 |
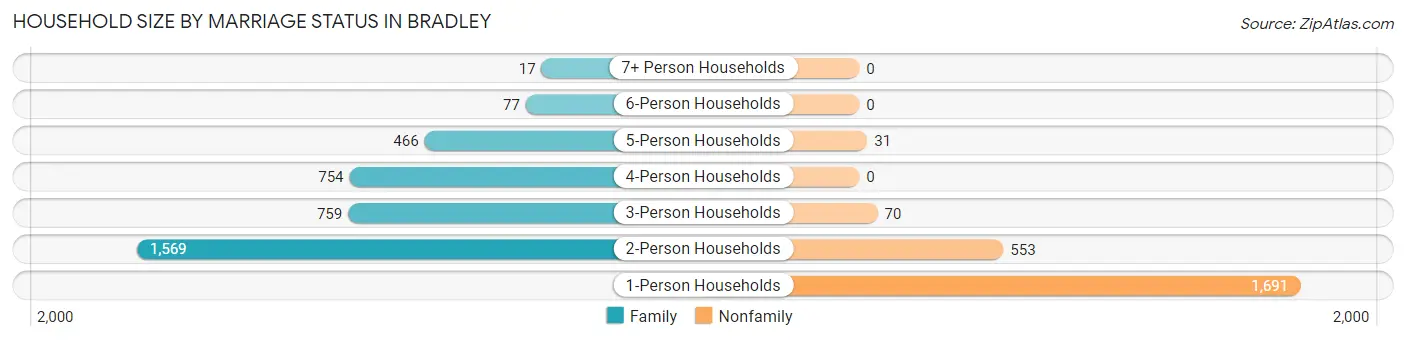
Household Size by Marriage Status in Bradley
Out of a total of 5,987 households in Bradley, 3,642 (60.8%) are family households, while 2,345 (39.2%) are nonfamily households. The most numerous type of family households are 2-person households, comprising 1,569, and the most common type of nonfamily households are 1-person households, comprising 1,691.
| Household Size | Family Households | Nonfamily Households |
| 1-Person Households | - | 1,691 (28.2%) |
| 2-Person Households | 1,569 (26.2%) | 553 (9.2%) |
| 3-Person Households | 759 (12.7%) | 70 (1.2%) |
| 4-Person Households | 754 (12.6%) | 0 (0.0%) |
| 5-Person Households | 466 (7.8%) | 31 (0.5%) |
| 6-Person Households | 77 (1.3%) | 0 (0.0%) |
| 7+ Person Households | 17 (0.3%) | 0 (0.0%) |
| Total | 3,642 (60.8%) | 2,345 (39.2%) |
Female Fertility in Bradley
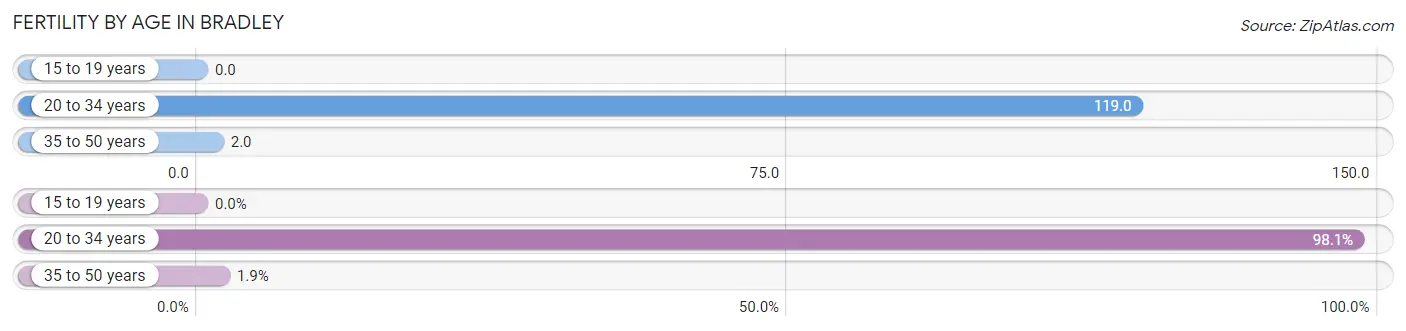
Fertility by Age in Bradley
Average fertility rate in Bradley is 54.0 births per 1,000 women. Women in the age bracket of 20 to 34 years have the highest fertility rate with 119.0 births per 1,000 women. Women in the age bracket of 20 to 34 years acount for 98.1% of all women with births.
| Age Bracket | Women with Births | Births / 1,000 Women |
| 15 to 19 years | 0 (0.0%) | 0.0 |
| 20 to 34 years | 211 (98.1%) | 119.0 |
| 35 to 50 years | 4 (1.9%) | 2.0 |
| Total | 215 (100.0%) | 54.0 |
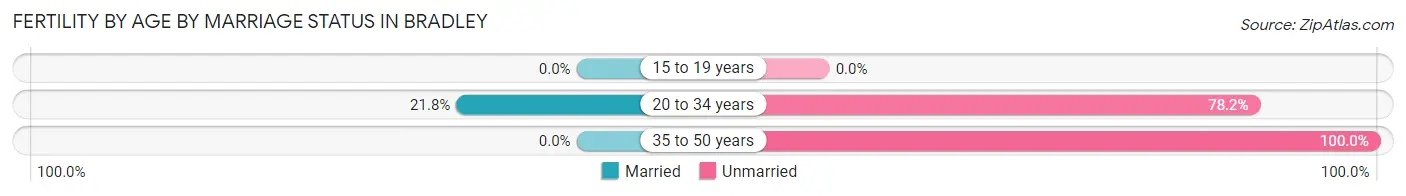
Fertility by Age by Marriage Status in Bradley
21.4% of women with births (215) in Bradley are married. The highest percentage of unmarried women with births falls into 35 to 50 years age bracket with 100.0% of them unmarried at the time of birth, while the lowest percentage of unmarried women with births belong to 20 to 34 years age bracket with 78.2% of them unmarried.
| Age Bracket | Married | Unmarried |
| 15 to 19 years | 0 (0.0%) | 0 (0.0%) |
| 20 to 34 years | 46 (21.8%) | 165 (78.2%) |
| 35 to 50 years | 0 (0.0%) | 4 (100.0%) |
| Total | 46 (21.4%) | 169 (78.6%) |
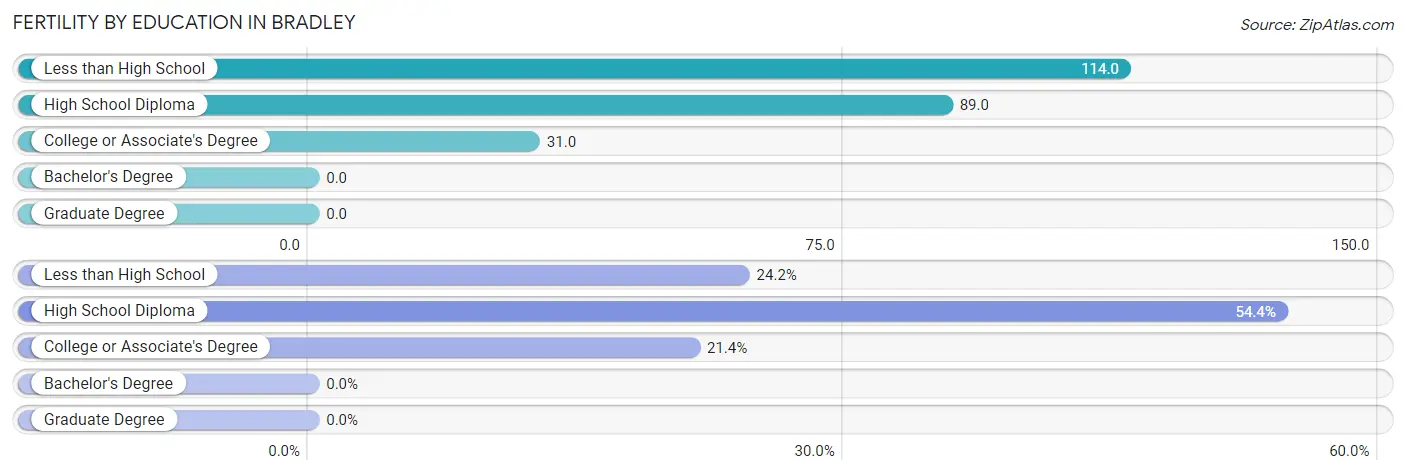
Fertility by Education in Bradley
| Educational Attainment | Women with Births | Births / 1,000 Women |
| Less than High School | 52 (24.2%) | 114.0 |
| High School Diploma | 117 (54.4%) | 89.0 |
| College or Associate's Degree | 46 (21.4%) | 31.0 |
| Bachelor's Degree | 0 (0.0%) | 0.0 |
| Graduate Degree | 0 (0.0%) | 0.0 |
| Total | 215 (100.0%) | 54.0 |
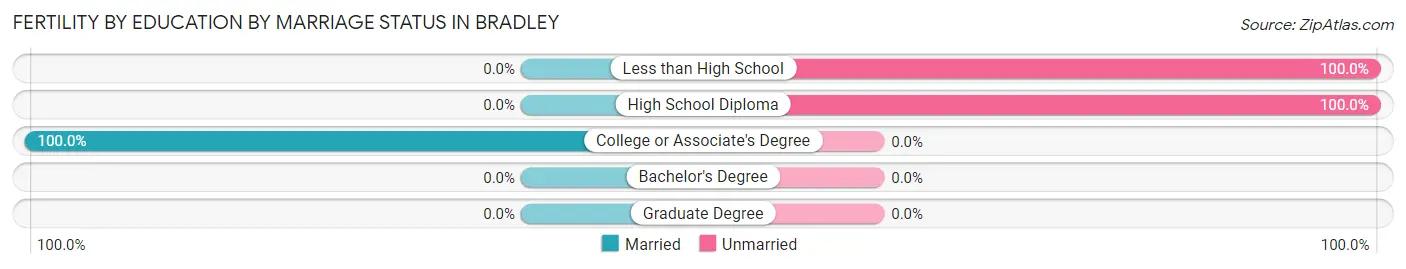
Fertility by Education by Marriage Status in Bradley
78.6% of women with births in Bradley are unmarried. Women with the educational attainment of college or associate's degree are most likely to be married with 100.0% of them married at childbirth, while women with the educational attainment of less than high school are least likely to be married with 100.0% of them unmarried at childbirth.
| Educational Attainment | Married | Unmarried |
| Less than High School | 0 (0.0%) | 52 (100.0%) |
| High School Diploma | 0 (0.0%) | 117 (100.0%) |
| College or Associate's Degree | 46 (100.0%) | 0 (0.0%) |
| Bachelor's Degree | 0 (0.0%) | 0 (0.0%) |
| Graduate Degree | 0 (0.0%) | 0 (0.0%) |
| Total | 46 (21.4%) | 169 (78.6%) |
Employment Characteristics in Bradley
Employment by Class of Employer in Bradley
Among the 7,954 employed individuals in Bradley, private company employees (5,976 | 75.1%), local government employees (641 | 8.1%), and not-for-profit organizations (597 | 7.5%) make up the most common classes of employment.
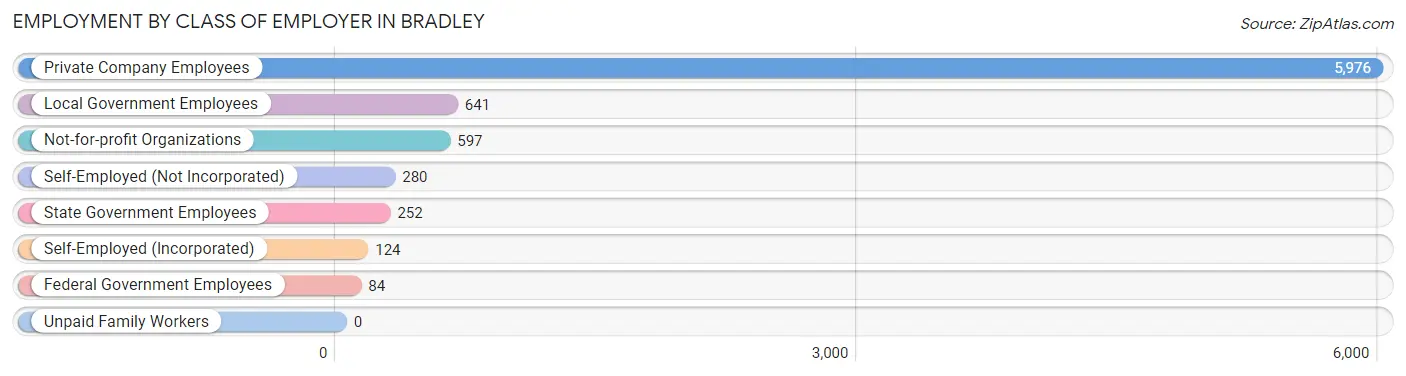
| Employer Class | # Employees | % Employees |
| Private Company Employees | 5,976 | 75.1% |
| Self-Employed (Incorporated) | 124 | 1.6% |
| Self-Employed (Not Incorporated) | 280 | 3.5% |
| Not-for-profit Organizations | 597 | 7.5% |
| Local Government Employees | 641 | 8.1% |
| State Government Employees | 252 | 3.2% |
| Federal Government Employees | 84 | 1.1% |
| Unpaid Family Workers | 0 | 0.0% |
| Total | 7,954 | 100.0% |
Employment Status by Age in Bradley
According to the labor force statistics for Bradley, out of the total population over 16 years of age (12,489), 67.7% or 8,455 individuals are in the labor force, with 4.3% or 364 of them unemployed. The age group with the highest labor force participation rate is 35 to 44 years, with 90.0% or 1,712 individuals in the labor force. Within the labor force, the 75 years and over age range has the highest percentage of unemployed individuals, with 37.0% or 10 of them being unemployed.
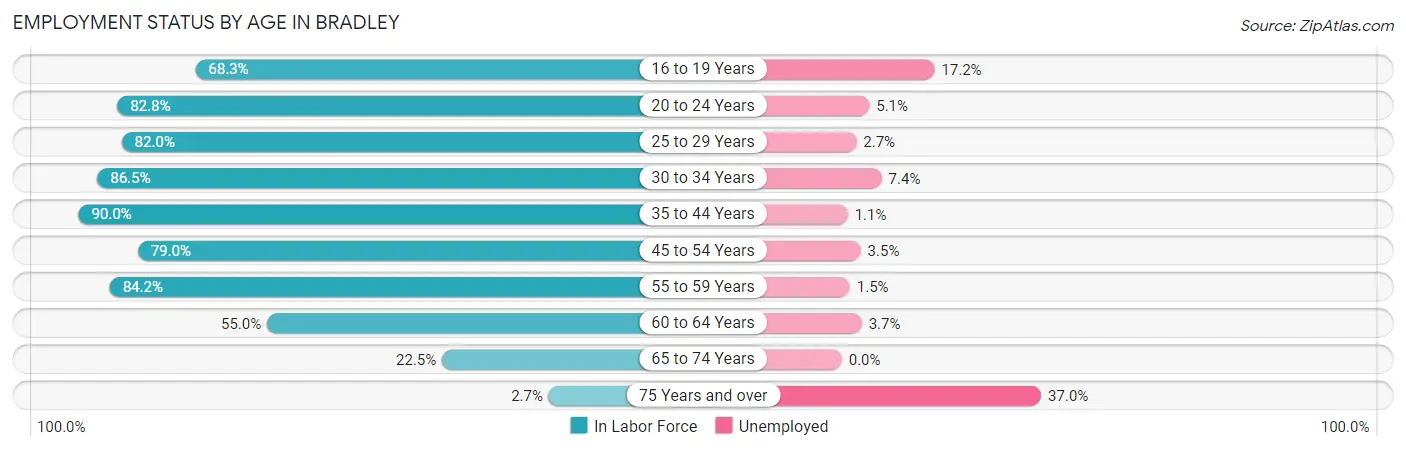
| Age Bracket | In Labor Force | Unemployed |
| 16 to 19 Years | 548 (68.3%) | 94 (17.2%) |
| 20 to 24 Years | 1,304 (82.8%) | 67 (5.1%) |
| 25 to 29 Years | 918 (82.0%) | 25 (2.7%) |
| 30 to 34 Years | 928 (86.5%) | 69 (7.4%) |
| 35 to 44 Years | 1,712 (90.0%) | 19 (1.1%) |
| 45 to 54 Years | 1,484 (79.0%) | 52 (3.5%) |
| 55 to 59 Years | 676 (84.2%) | 10 (1.5%) |
| 60 to 64 Years | 568 (55.0%) | 21 (3.7%) |
| 65 to 74 Years | 291 (22.5%) | 0 (0.0%) |
| 75 Years and over | 27 (2.7%) | 10 (37.0%) |
| Total | 8,455 (67.7%) | 364 (4.3%) |
Employment Status by Educational Attainment in Bradley
According to labor force statistics for Bradley, 80.5% of individuals (6,285) out of the total population between 25 and 64 years of age (7,808) are in the labor force, with 3.1% or 195 of them being unemployed. The group with the highest labor force participation rate are those with the educational attainment of bachelor's degree or higher, with 94.3% or 1,225 individuals in the labor force. Within the labor force, individuals with high school diploma education have the highest percentage of unemployment, with 3.9% or 78 of them being unemployed.
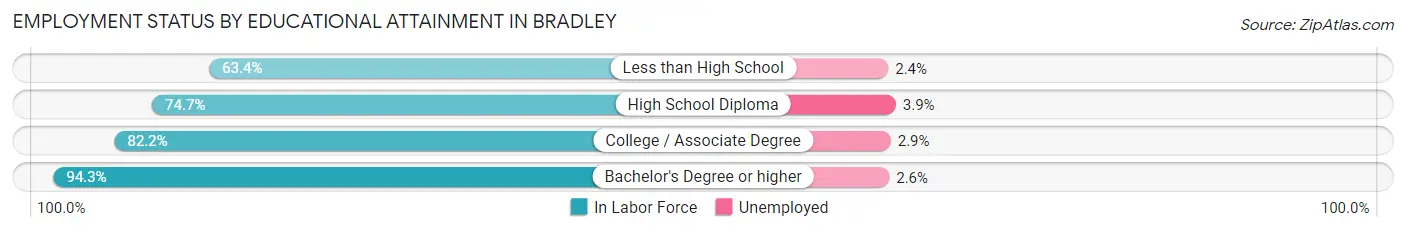
| Educational Attainment | In Labor Force | Unemployed |
| Less than High School | 296 (63.4%) | 11 (2.4%) |
| High School Diploma | 2,006 (74.7%) | 105 (3.9%) |
| College / Associate Degree | 2,759 (82.2%) | 97 (2.9%) |
| Bachelor's Degree or higher | 1,225 (94.3%) | 34 (2.6%) |
| Total | 6,285 (80.5%) | 242 (3.1%) |
Employment Occupations by Sex in Bradley
Management, Business, Science and Arts Occupations
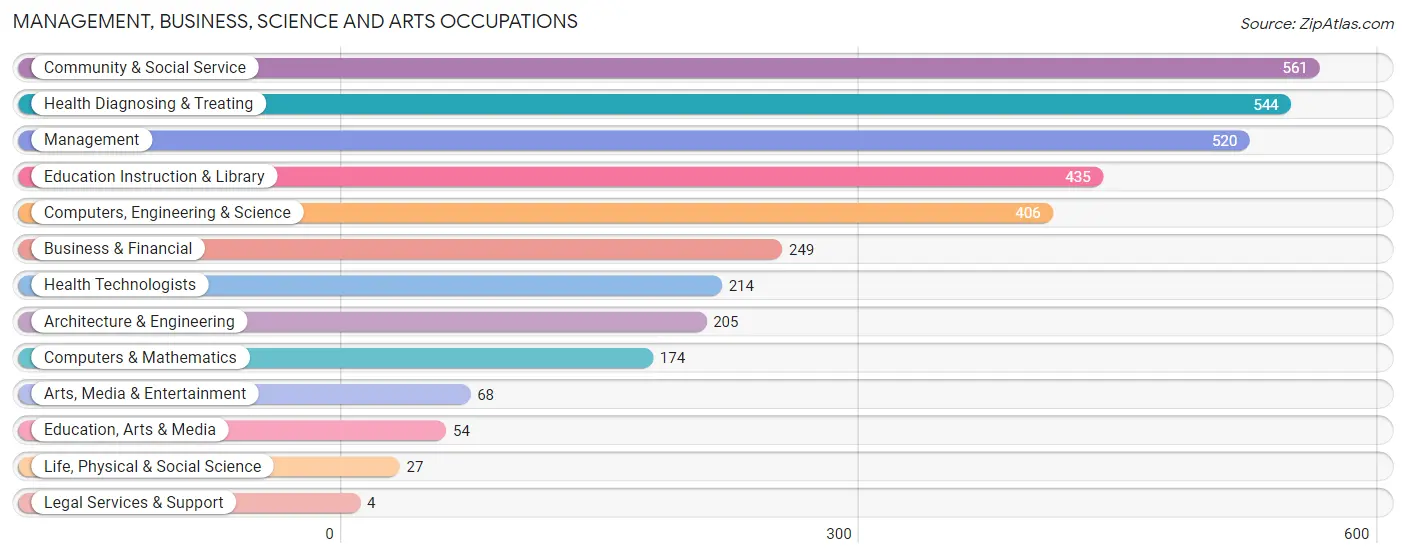
The most common Management, Business, Science and Arts occupations in Bradley are Community & Social Service (561 | 6.9%), Health Diagnosing & Treating (544 | 6.7%), Management (520 | 6.4%), Education Instruction & Library (435 | 5.4%), and Computers, Engineering & Science (406 | 5.0%).
Management, Business, Science and Arts Occupations by Sex
Within the Management, Business, Science and Arts occupations in Bradley, the most male-oriented occupations are Architecture & Engineering (100.0%), Computers, Engineering & Science (90.9%), and Computers & Mathematics (87.4%), while the most female-oriented occupations are Legal Services & Support (100.0%), Health Technologists (100.0%), and Health Diagnosing & Treating (90.6%).
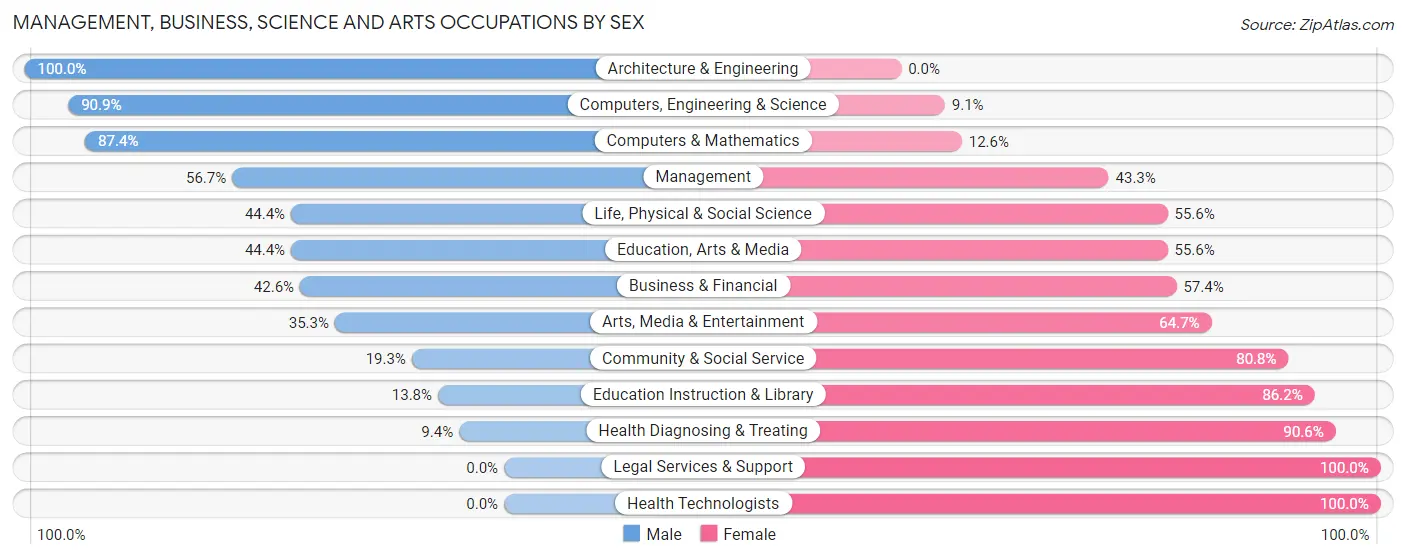
| Occupation | Male | Female |
| Management | 295 (56.7%) | 225 (43.3%) |
| Business & Financial | 106 (42.6%) | 143 (57.4%) |
| Computers, Engineering & Science | 369 (90.9%) | 37 (9.1%) |
| Computers & Mathematics | 152 (87.4%) | 22 (12.6%) |
| Architecture & Engineering | 205 (100.0%) | 0 (0.0%) |
| Life, Physical & Social Science | 12 (44.4%) | 15 (55.6%) |
| Community & Social Service | 108 (19.3%) | 453 (80.7%) |
| Education, Arts & Media | 24 (44.4%) | 30 (55.6%) |
| Legal Services & Support | 0 (0.0%) | 4 (100.0%) |
| Education Instruction & Library | 60 (13.8%) | 375 (86.2%) |
| Arts, Media & Entertainment | 24 (35.3%) | 44 (64.7%) |
| Health Diagnosing & Treating | 51 (9.4%) | 493 (90.6%) |
| Health Technologists | 0 (0.0%) | 214 (100.0%) |
| Total (Category) | 929 (40.7%) | 1,351 (59.3%) |
| Total (Overall) | 4,217 (52.2%) | 3,863 (47.8%) |
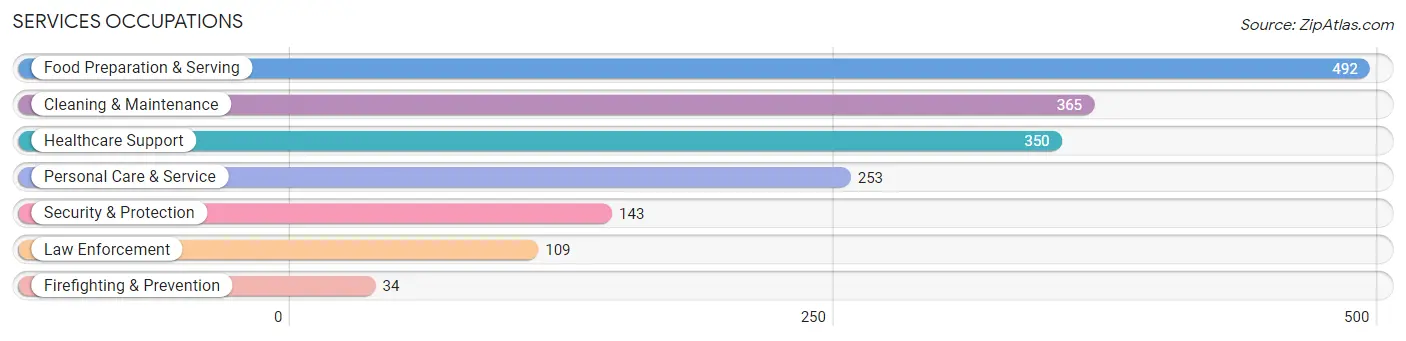
Services Occupations
The most common Services occupations in Bradley are Food Preparation & Serving (492 | 6.1%), Cleaning & Maintenance (365 | 4.5%), Healthcare Support (350 | 4.3%), Personal Care & Service (253 | 3.1%), and Security & Protection (143 | 1.8%).
Services Occupations by Sex
Within the Services occupations in Bradley, the most male-oriented occupations are Firefighting & Prevention (100.0%), Security & Protection (83.9%), and Law Enforcement (78.9%), while the most female-oriented occupations are Healthcare Support (91.4%), Personal Care & Service (86.6%), and Food Preparation & Serving (66.9%).
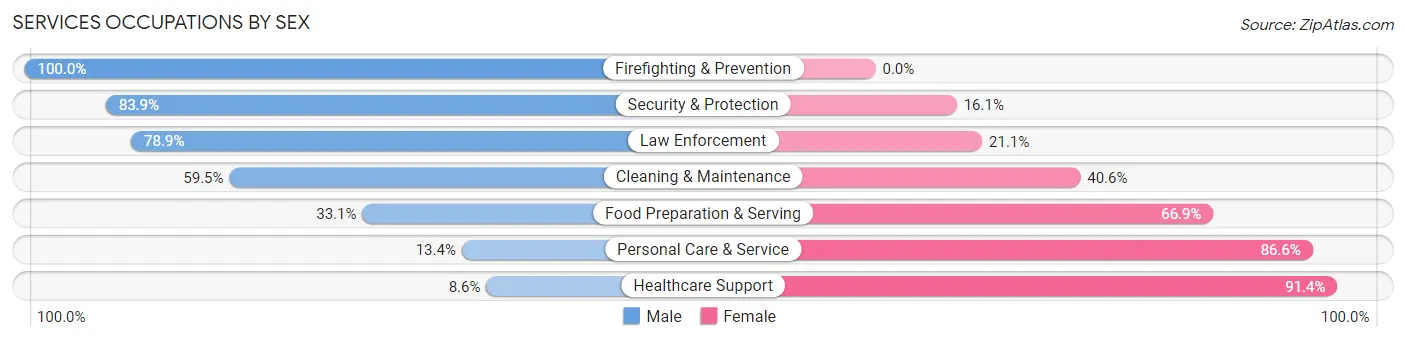
| Occupation | Male | Female |
| Healthcare Support | 30 (8.6%) | 320 (91.4%) |
| Security & Protection | 120 (83.9%) | 23 (16.1%) |
| Firefighting & Prevention | 34 (100.0%) | 0 (0.0%) |
| Law Enforcement | 86 (78.9%) | 23 (21.1%) |
| Food Preparation & Serving | 163 (33.1%) | 329 (66.9%) |
| Cleaning & Maintenance | 217 (59.5%) | 148 (40.6%) |
| Personal Care & Service | 34 (13.4%) | 219 (86.6%) |
| Total (Category) | 564 (35.2%) | 1,039 (64.8%) |
| Total (Overall) | 4,217 (52.2%) | 3,863 (47.8%) |
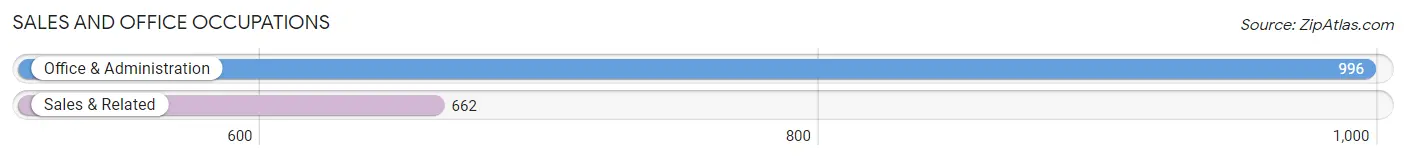
Sales and Office Occupations
The most common Sales and Office occupations in Bradley are Office & Administration (996 | 12.3%), and Sales & Related (662 | 8.2%).
Sales and Office Occupations by Sex
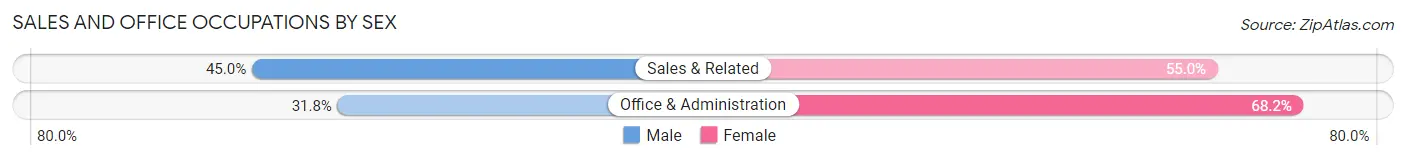
| Occupation | Male | Female |
| Sales & Related | 298 (45.0%) | 364 (55.0%) |
| Office & Administration | 317 (31.8%) | 679 (68.2%) |
| Total (Category) | 615 (37.1%) | 1,043 (62.9%) |
| Total (Overall) | 4,217 (52.2%) | 3,863 (47.8%) |
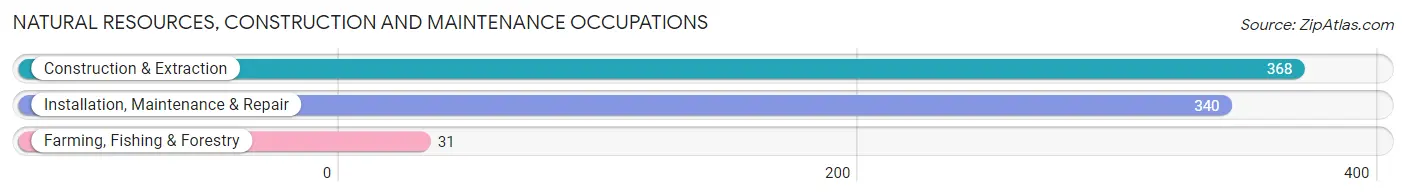
Natural Resources, Construction and Maintenance Occupations
The most common Natural Resources, Construction and Maintenance occupations in Bradley are Construction & Extraction (368 | 4.5%), Installation, Maintenance & Repair (340 | 4.2%), and Farming, Fishing & Forestry (31 | 0.4%).
Natural Resources, Construction and Maintenance Occupations by Sex
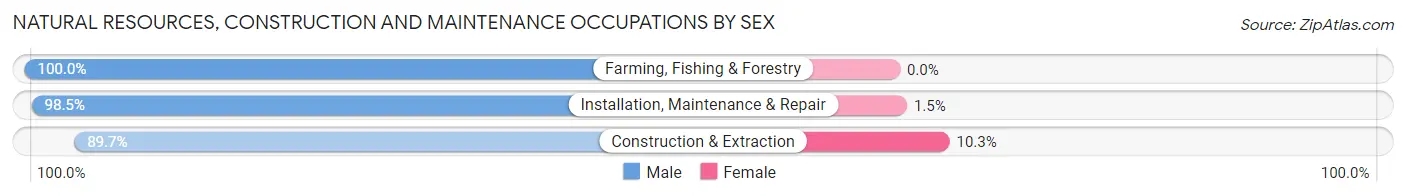
| Occupation | Male | Female |
| Farming, Fishing & Forestry | 31 (100.0%) | 0 (0.0%) |
| Construction & Extraction | 330 (89.7%) | 38 (10.3%) |
| Installation, Maintenance & Repair | 335 (98.5%) | 5 (1.5%) |
| Total (Category) | 696 (94.2%) | 43 (5.8%) |
| Total (Overall) | 4,217 (52.2%) | 3,863 (47.8%) |
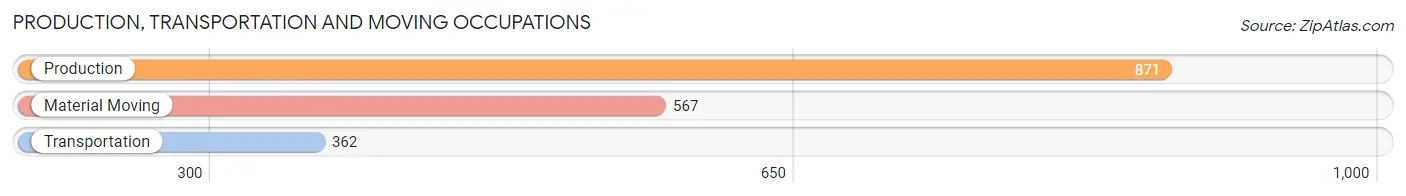
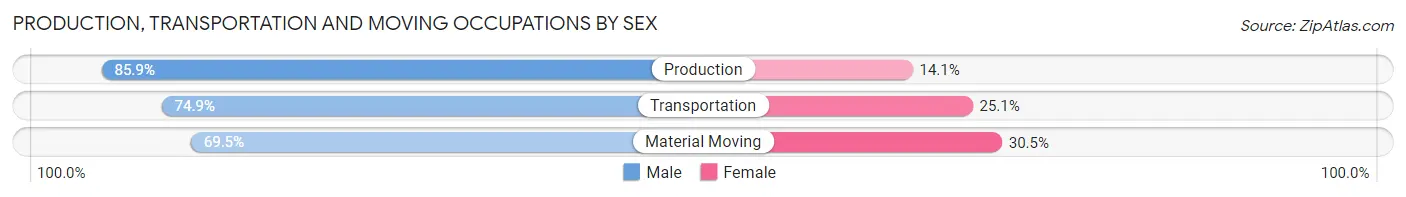
Production, Transportation and Moving Occupations
The most common Production, Transportation and Moving occupations in Bradley are Production (871 | 10.8%), Material Moving (567 | 7.0%), and Transportation (362 | 4.5%).
Production, Transportation and Moving Occupations by Sex
| Occupation | Male | Female |
| Production | 748 (85.9%) | 123 (14.1%) |
| Transportation | 271 (74.9%) | 91 (25.1%) |
| Material Moving | 394 (69.5%) | 173 (30.5%) |
| Total (Category) | 1,413 (78.5%) | 387 (21.5%) |
| Total (Overall) | 4,217 (52.2%) | 3,863 (47.8%) |
Employment Industries by Sex in Bradley
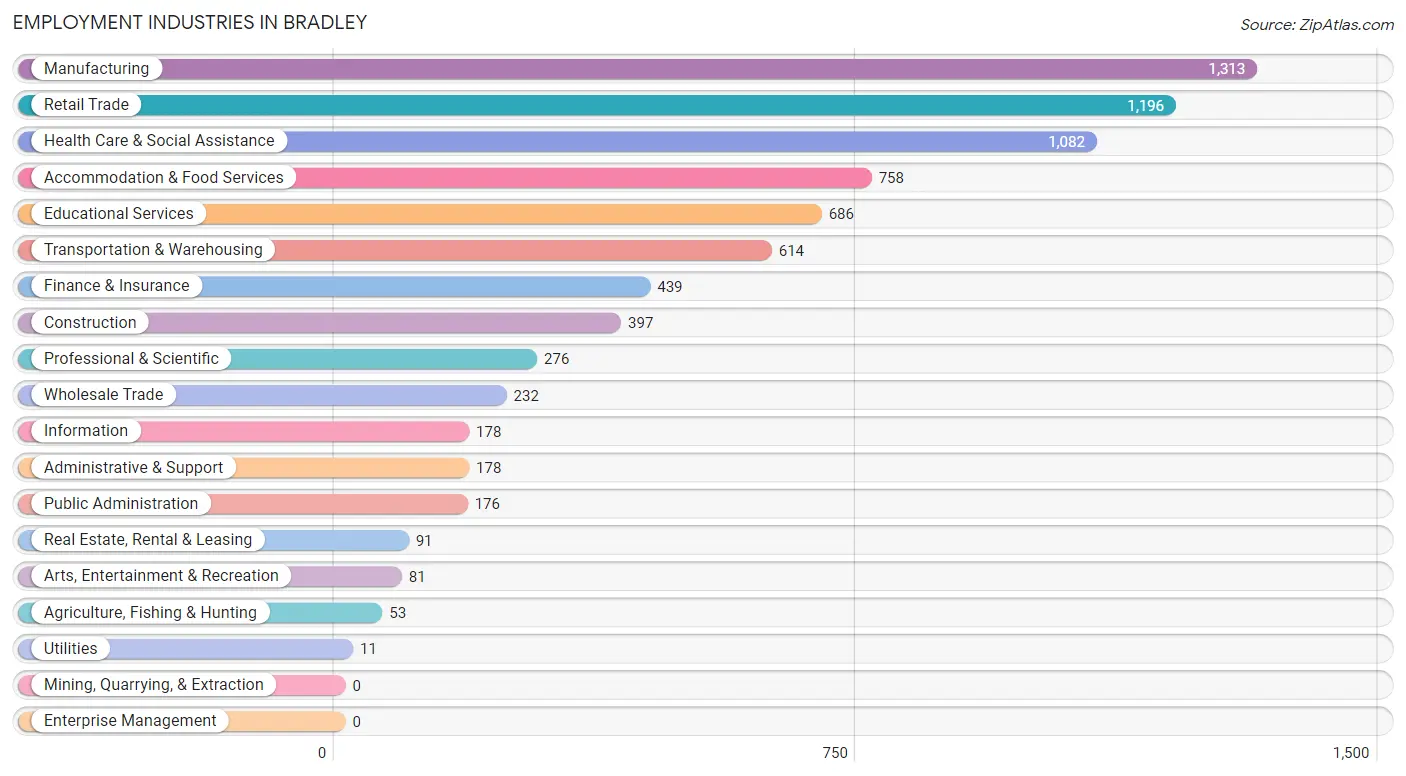
Employment Industries in Bradley
The major employment industries in Bradley include Manufacturing (1,313 | 16.3%), Retail Trade (1,196 | 14.8%), Health Care & Social Assistance (1,082 | 13.4%), Accommodation & Food Services (758 | 9.4%), and Educational Services (686 | 8.5%).
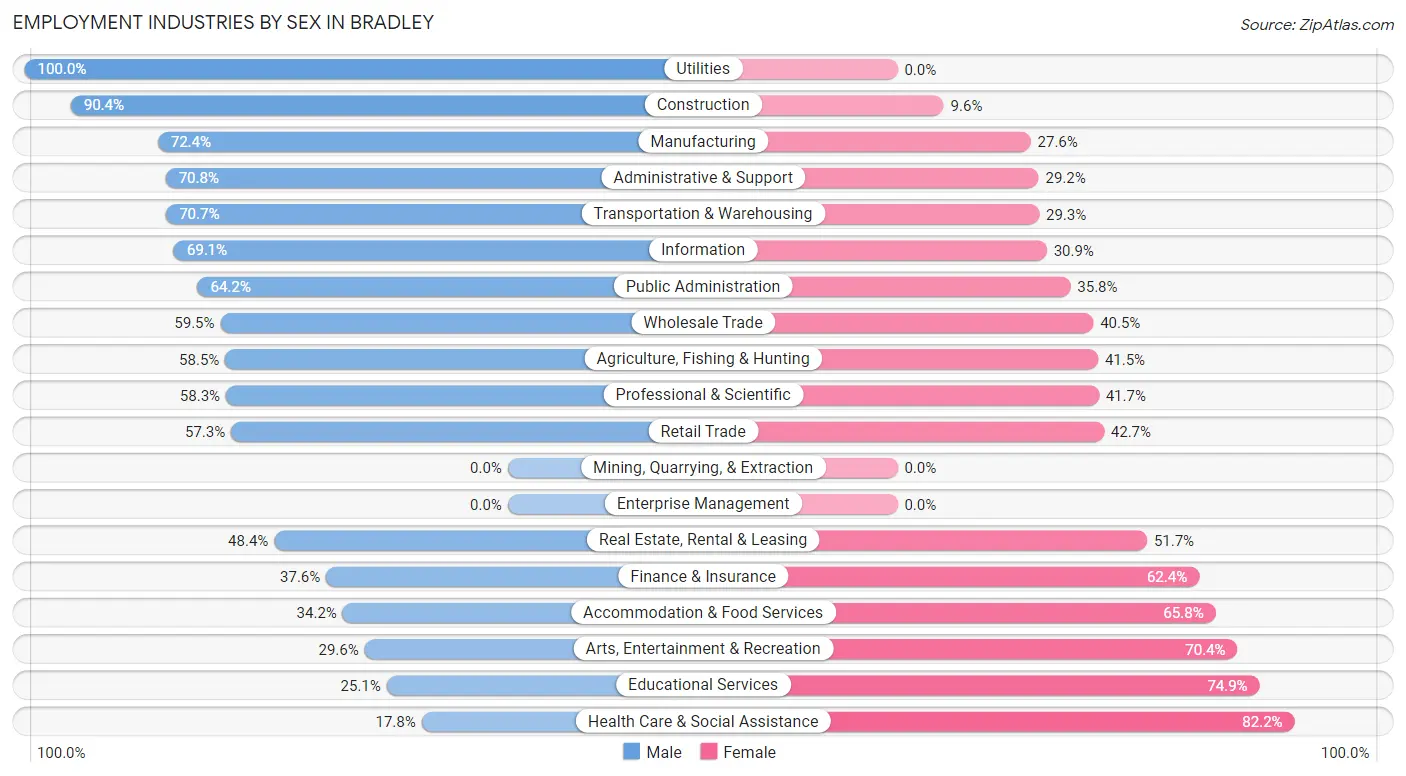
Employment Industries by Sex in Bradley
The Bradley industries that see more men than women are Utilities (100.0%), Construction (90.4%), and Manufacturing (72.4%), whereas the industries that tend to have a higher number of women are Health Care & Social Assistance (82.2%), Educational Services (74.9%), and Arts, Entertainment & Recreation (70.4%).
| Industry | Male | Female |
| Agriculture, Fishing & Hunting | 31 (58.5%) | 22 (41.5%) |
| Mining, Quarrying, & Extraction | 0 (0.0%) | 0 (0.0%) |
| Construction | 359 (90.4%) | 38 (9.6%) |
| Manufacturing | 951 (72.4%) | 362 (27.6%) |
| Wholesale Trade | 138 (59.5%) | 94 (40.5%) |
| Retail Trade | 685 (57.3%) | 511 (42.7%) |
| Transportation & Warehousing | 434 (70.7%) | 180 (29.3%) |
| Utilities | 11 (100.0%) | 0 (0.0%) |
| Information | 123 (69.1%) | 55 (30.9%) |
| Finance & Insurance | 165 (37.6%) | 274 (62.4%) |
| Real Estate, Rental & Leasing | 44 (48.3%) | 47 (51.6%) |
| Professional & Scientific | 161 (58.3%) | 115 (41.7%) |
| Enterprise Management | 0 (0.0%) | 0 (0.0%) |
| Administrative & Support | 126 (70.8%) | 52 (29.2%) |
| Educational Services | 172 (25.1%) | 514 (74.9%) |
| Health Care & Social Assistance | 193 (17.8%) | 889 (82.2%) |
| Arts, Entertainment & Recreation | 24 (29.6%) | 57 (70.4%) |
| Accommodation & Food Services | 259 (34.2%) | 499 (65.8%) |
| Public Administration | 113 (64.2%) | 63 (35.8%) |
| Total | 4,217 (52.2%) | 3,863 (47.8%) |
Education in Bradley
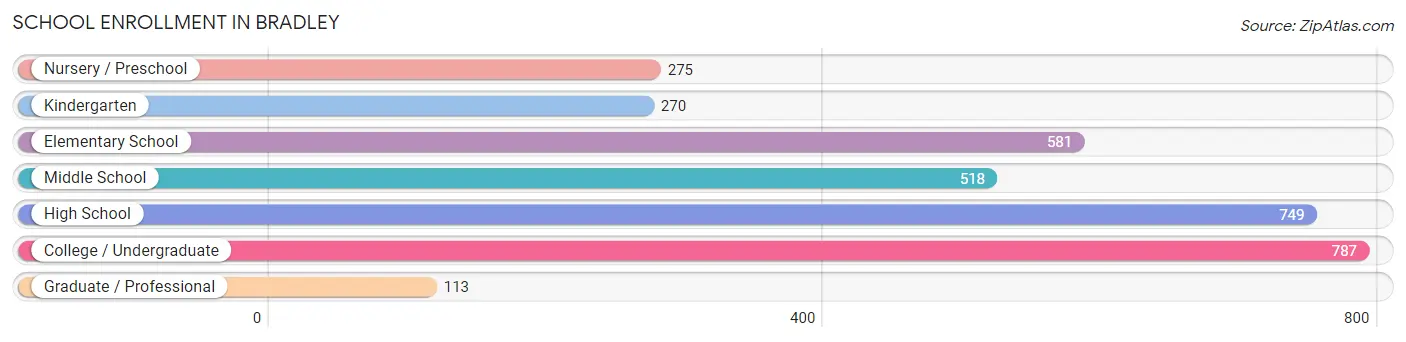
School Enrollment in Bradley
The most common levels of schooling among the 3,293 students in Bradley are college / undergraduate (787 | 23.9%), high school (749 | 22.8%), and elementary school (581 | 17.6%).
| School Level | # Students | % Students |
| Nursery / Preschool | 275 | 8.4% |
| Kindergarten | 270 | 8.2% |
| Elementary School | 581 | 17.6% |
| Middle School | 518 | 15.7% |
| High School | 749 | 22.8% |
| College / Undergraduate | 787 | 23.9% |
| Graduate / Professional | 113 | 3.4% |
| Total | 3,293 | 100.0% |
School Enrollment by Age by Funding Source in Bradley
Out of a total of 3,293 students who are enrolled in schools in Bradley, 339 (10.3%) attend a private institution, while the remaining 2,954 (89.7%) are enrolled in public schools. The age group of 25 to 34 year olds has the highest likelihood of being enrolled in private schools, with 70 (22.4% in the age bracket) enrolled. Conversely, the age group of 10 to 14 year olds has the lowest likelihood of being enrolled in a private school, with 712 (95.1% in the age bracket) attending a public institution.
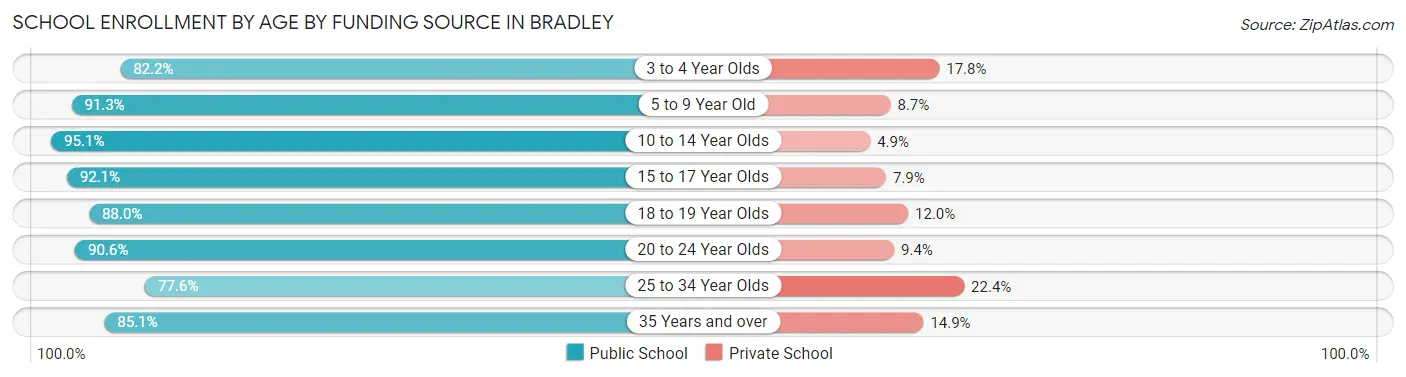
| Age Bracket | Public School | Private School |
| 3 to 4 Year Olds | 203 (82.2%) | 44 (17.8%) |
| 5 to 9 Year Old | 721 (91.3%) | 69 (8.7%) |
| 10 to 14 Year Olds | 712 (95.1%) | 37 (4.9%) |
| 15 to 17 Year Olds | 421 (92.1%) | 36 (7.9%) |
| 18 to 19 Year Olds | 154 (88.0%) | 21 (12.0%) |
| 20 to 24 Year Olds | 376 (90.6%) | 39 (9.4%) |
| 25 to 34 Year Olds | 242 (77.6%) | 70 (22.4%) |
| 35 Years and over | 126 (85.1%) | 22 (14.9%) |
| Total | 2,954 (89.7%) | 339 (10.3%) |
Educational Attainment by Field of Study in Bradley
Education (340 | 21.6%), business (289 | 18.4%), arts & humanities (154 | 9.8%), engineering (150 | 9.6%), and psychology (147 | 9.4%) are the most common fields of study among 1,571 individuals in Bradley who have obtained a bachelor's degree or higher.
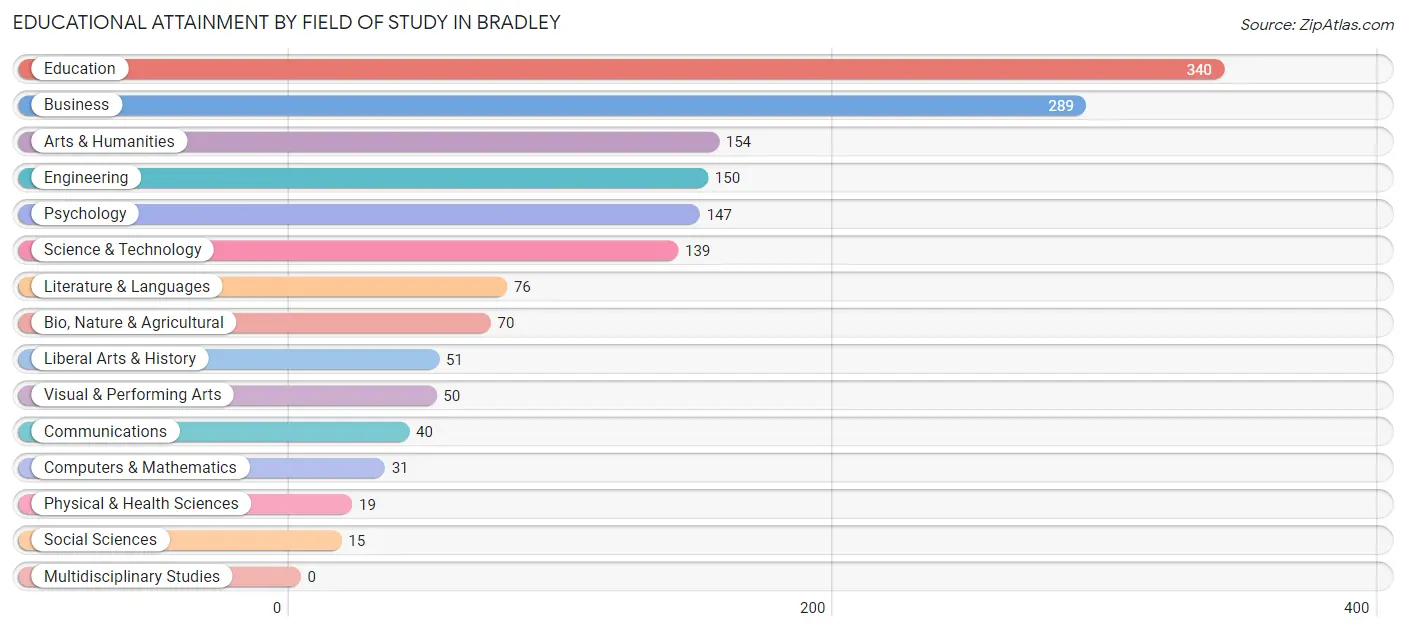
| Field of Study | # Graduates | % Graduates |
| Computers & Mathematics | 31 | 2.0% |
| Bio, Nature & Agricultural | 70 | 4.5% |
| Physical & Health Sciences | 19 | 1.2% |
| Psychology | 147 | 9.4% |
| Social Sciences | 15 | 0.9% |
| Engineering | 150 | 9.6% |
| Multidisciplinary Studies | 0 | 0.0% |
| Science & Technology | 139 | 8.8% |
| Business | 289 | 18.4% |
| Education | 340 | 21.6% |
| Literature & Languages | 76 | 4.8% |
| Liberal Arts & History | 51 | 3.3% |
| Visual & Performing Arts | 50 | 3.2% |
| Communications | 40 | 2.5% |
| Arts & Humanities | 154 | 9.8% |
| Total | 1,571 | 100.0% |
Transportation & Commute in Bradley
Vehicle Availability by Sex in Bradley
The most prevalent vehicle ownership categories in Bradley are males with 2 vehicles (2,013, accounting for 48.6%) and females with 2 vehicles (1,815, making up 53.1%).
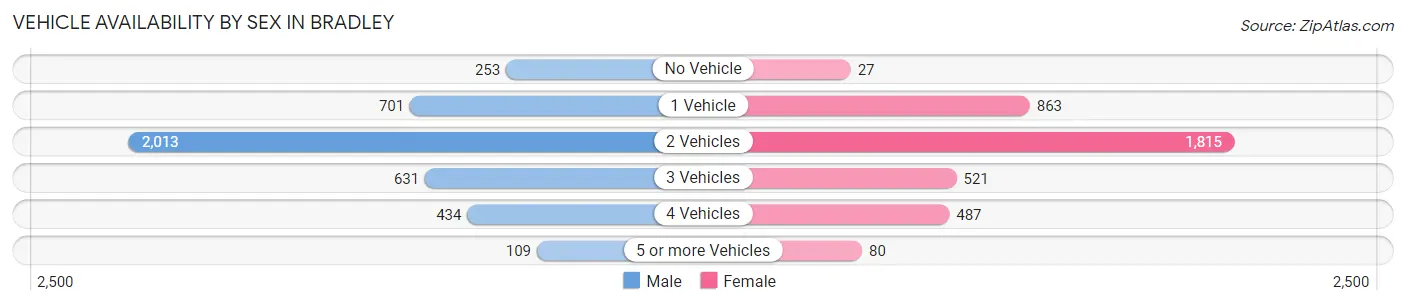
| Vehicles Available | Male | Female |
| No Vehicle | 253 (6.1%) | 27 (0.7%) |
| 1 Vehicle | 701 (16.9%) | 863 (22.8%) |
| 2 Vehicles | 2,013 (48.6%) | 1,815 (47.8%) |
| 3 Vehicles | 631 (15.2%) | 521 (13.7%) |
| 4 Vehicles | 434 (10.5%) | 487 (12.8%) |
| 5 or more Vehicles | 109 (2.6%) | 80 (2.1%) |
| Total | 4,141 (100.0%) | 3,793 (100.0%) |
Commute Time in Bradley
The most frequently occuring commute durations in Bradley are 10 to 14 minutes (1,677 commuters, 22.1%), 15 to 19 minutes (1,330 commuters, 17.5%), and 5 to 9 minutes (1,225 commuters, 16.1%).
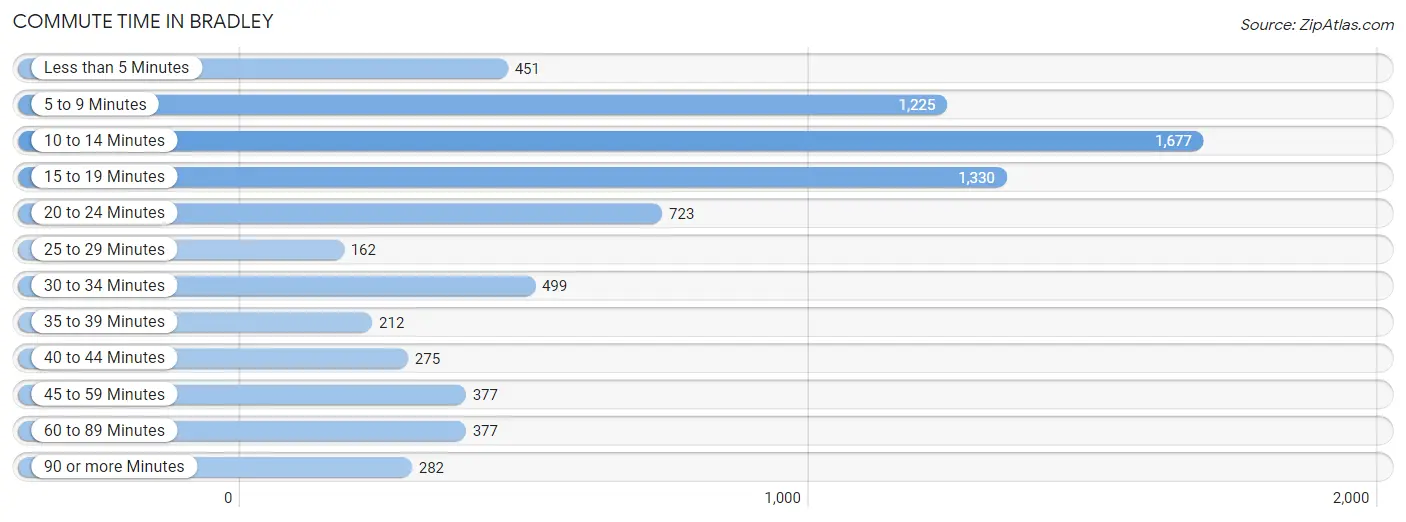
| Commute Time | # Commuters | % Commuters |
| Less than 5 Minutes | 451 | 5.9% |
| 5 to 9 Minutes | 1,225 | 16.1% |
| 10 to 14 Minutes | 1,677 | 22.1% |
| 15 to 19 Minutes | 1,330 | 17.5% |
| 20 to 24 Minutes | 723 | 9.5% |
| 25 to 29 Minutes | 162 | 2.1% |
| 30 to 34 Minutes | 499 | 6.6% |
| 35 to 39 Minutes | 212 | 2.8% |
| 40 to 44 Minutes | 275 | 3.6% |
| 45 to 59 Minutes | 377 | 5.0% |
| 60 to 89 Minutes | 377 | 5.0% |
| 90 or more Minutes | 282 | 3.7% |
Commute Time by Sex in Bradley
The most common commute times in Bradley are 10 to 14 minutes (783 commuters, 19.3%) for males and 10 to 14 minutes (894 commuters, 25.2%) for females.
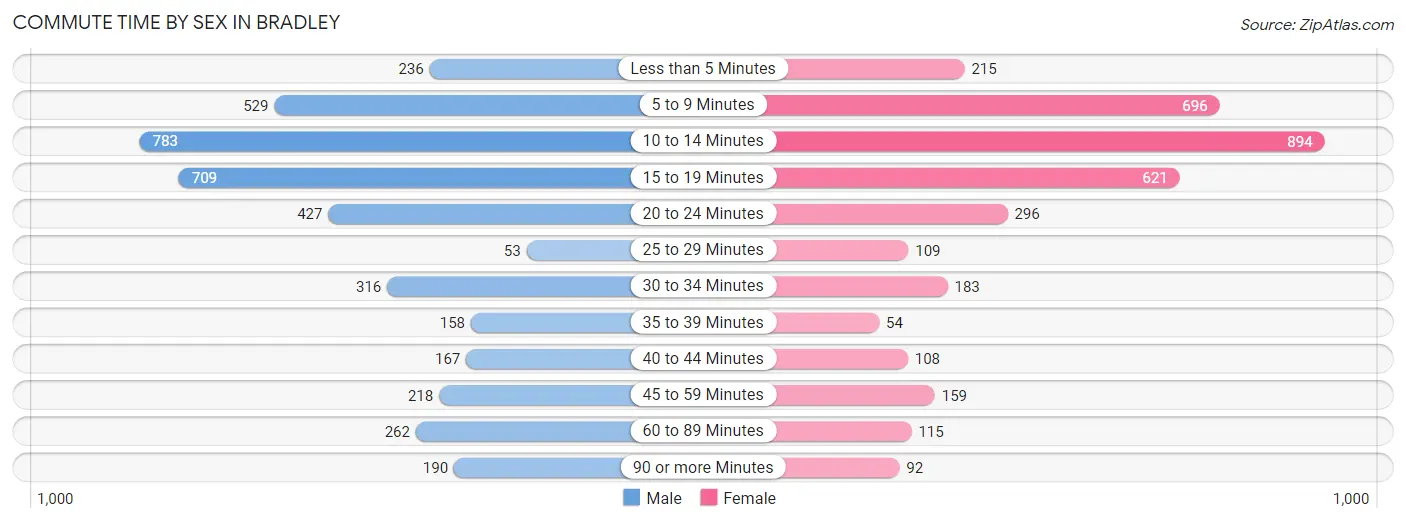
| Commute Time | Male | Female |
| Less than 5 Minutes | 236 (5.8%) | 215 (6.1%) |
| 5 to 9 Minutes | 529 (13.1%) | 696 (19.7%) |
| 10 to 14 Minutes | 783 (19.3%) | 894 (25.2%) |
| 15 to 19 Minutes | 709 (17.5%) | 621 (17.5%) |
| 20 to 24 Minutes | 427 (10.5%) | 296 (8.4%) |
| 25 to 29 Minutes | 53 (1.3%) | 109 (3.1%) |
| 30 to 34 Minutes | 316 (7.8%) | 183 (5.2%) |
| 35 to 39 Minutes | 158 (3.9%) | 54 (1.5%) |
| 40 to 44 Minutes | 167 (4.1%) | 108 (3.0%) |
| 45 to 59 Minutes | 218 (5.4%) | 159 (4.5%) |
| 60 to 89 Minutes | 262 (6.5%) | 115 (3.3%) |
| 90 or more Minutes | 190 (4.7%) | 92 (2.6%) |
Time of Departure to Work by Sex in Bradley
The most frequent times of departure to work in Bradley are 8:00 AM to 8:29 AM (636, 15.7%) for males and 7:30 AM to 7:59 AM (542, 15.3%) for females.
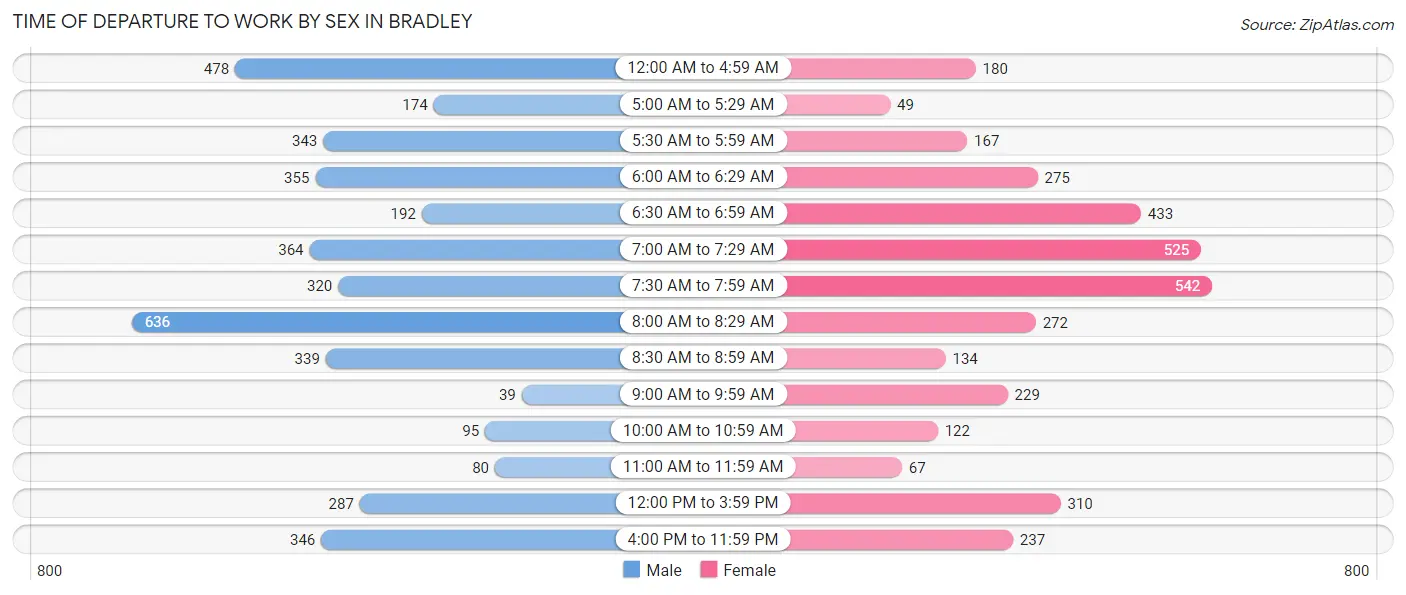
| Time of Departure | Male | Female |
| 12:00 AM to 4:59 AM | 478 (11.8%) | 180 (5.1%) |
| 5:00 AM to 5:29 AM | 174 (4.3%) | 49 (1.4%) |
| 5:30 AM to 5:59 AM | 343 (8.5%) | 167 (4.7%) |
| 6:00 AM to 6:29 AM | 355 (8.8%) | 275 (7.8%) |
| 6:30 AM to 6:59 AM | 192 (4.7%) | 433 (12.2%) |
| 7:00 AM to 7:29 AM | 364 (9.0%) | 525 (14.8%) |
| 7:30 AM to 7:59 AM | 320 (7.9%) | 542 (15.3%) |
| 8:00 AM to 8:29 AM | 636 (15.7%) | 272 (7.7%) |
| 8:30 AM to 8:59 AM | 339 (8.4%) | 134 (3.8%) |
| 9:00 AM to 9:59 AM | 39 (1.0%) | 229 (6.5%) |
| 10:00 AM to 10:59 AM | 95 (2.4%) | 122 (3.4%) |
| 11:00 AM to 11:59 AM | 80 (2.0%) | 67 (1.9%) |
| 12:00 PM to 3:59 PM | 287 (7.1%) | 310 (8.7%) |
| 4:00 PM to 11:59 PM | 346 (8.6%) | 237 (6.7%) |
| Total | 4,048 (100.0%) | 3,542 (100.0%) |
Housing Occupancy in Bradley
Occupancy by Ownership in Bradley
Of the total 5,987 dwellings in Bradley, owner-occupied units account for 3,798 (63.4%), while renter-occupied units make up 2,189 (36.6%).
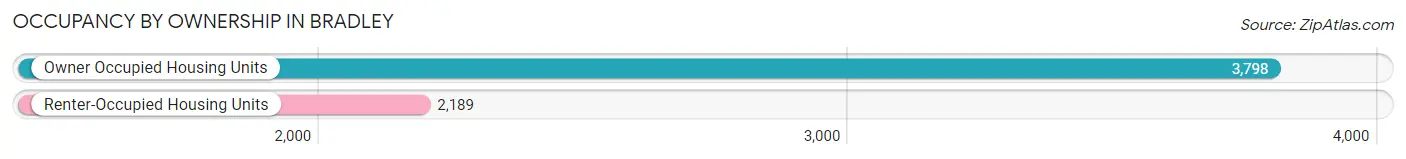
| Occupancy | # Housing Units | % Housing Units |
| Owner Occupied Housing Units | 3,798 | 63.4% |
| Renter-Occupied Housing Units | 2,189 | 36.6% |
| Total Occupied Housing Units | 5,987 | 100.0% |
Occupancy by Household Size in Bradley
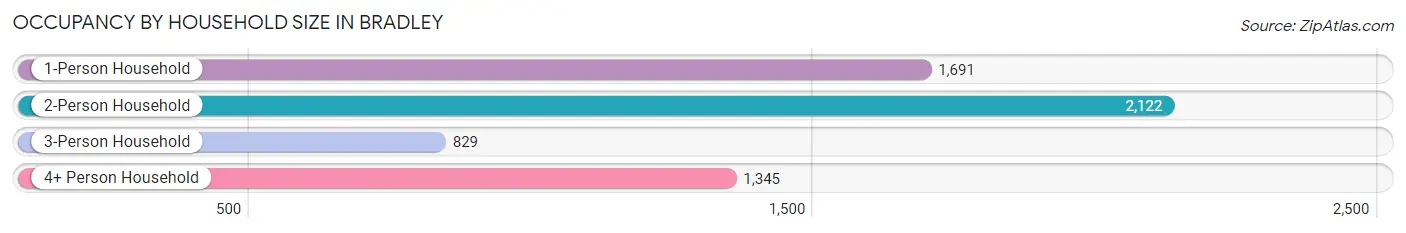
| Household Size | # Housing Units | % Housing Units |
| 1-Person Household | 1,691 | 28.2% |
| 2-Person Household | 2,122 | 35.4% |
| 3-Person Household | 829 | 13.9% |
| 4+ Person Household | 1,345 | 22.5% |
| Total Housing Units | 5,987 | 100.0% |
Occupancy by Ownership by Household Size in Bradley
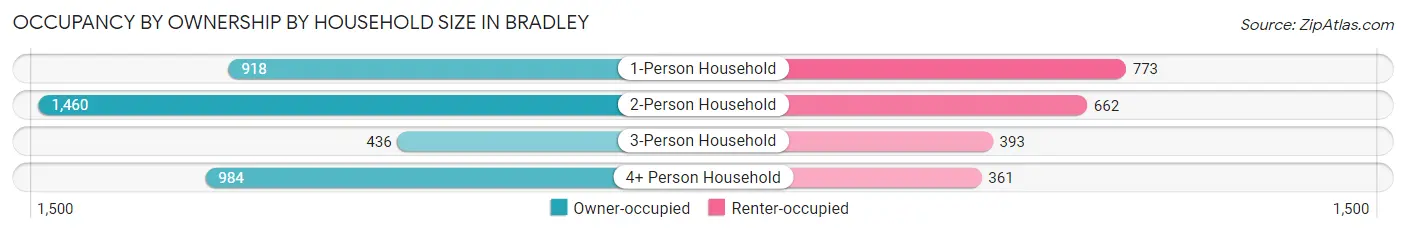
| Household Size | Owner-occupied | Renter-occupied |
| 1-Person Household | 918 (54.3%) | 773 (45.7%) |
| 2-Person Household | 1,460 (68.8%) | 662 (31.2%) |
| 3-Person Household | 436 (52.6%) | 393 (47.4%) |
| 4+ Person Household | 984 (73.2%) | 361 (26.8%) |
| Total Housing Units | 3,798 (63.4%) | 2,189 (36.6%) |
Occupancy by Educational Attainment in Bradley
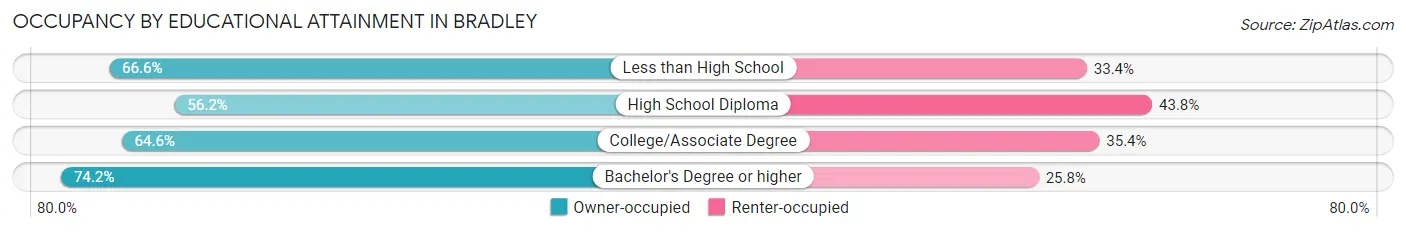
| Household Size | Owner-occupied | Renter-occupied |
| Less than High School | 253 (66.6%) | 127 (33.4%) |
| High School Diploma | 1,156 (56.2%) | 900 (43.8%) |
| College/Associate Degree | 1,655 (64.6%) | 907 (35.4%) |
| Bachelor's Degree or higher | 734 (74.2%) | 255 (25.8%) |
Occupancy by Age of Householder in Bradley
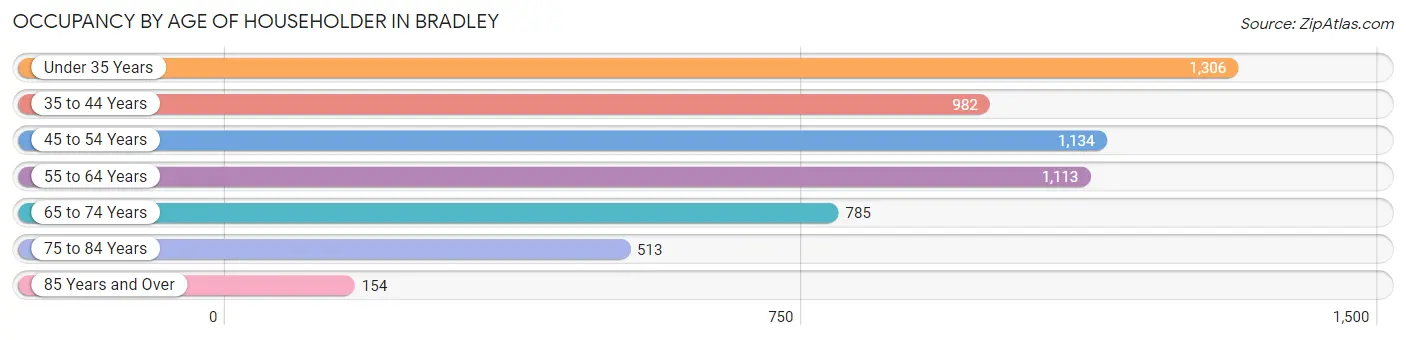
| Age Bracket | # Households | % Households |
| Under 35 Years | 1,306 | 21.8% |
| 35 to 44 Years | 982 | 16.4% |
| 45 to 54 Years | 1,134 | 18.9% |
| 55 to 64 Years | 1,113 | 18.6% |
| 65 to 74 Years | 785 | 13.1% |
| 75 to 84 Years | 513 | 8.6% |
| 85 Years and Over | 154 | 2.6% |
| Total | 5,987 | 100.0% |
Housing Finances in Bradley
Median Income by Occupancy in Bradley
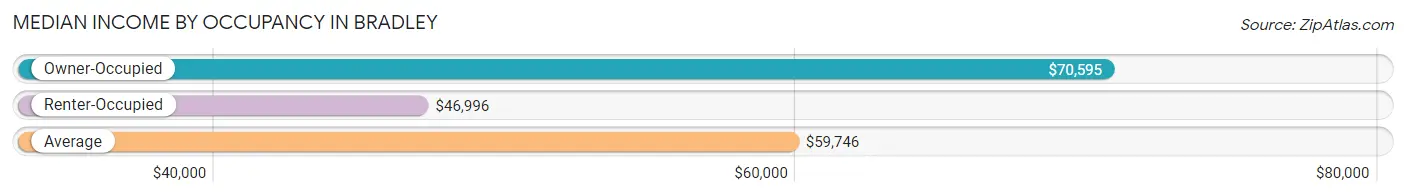
| Occupancy Type | # Households | Median Income |
| Owner-Occupied | 3,798 (63.4%) | $70,595 |
| Renter-Occupied | 2,189 (36.6%) | $46,996 |
| Average | 5,987 (100.0%) | $59,746 |
Occupancy by Householder Income Bracket in Bradley
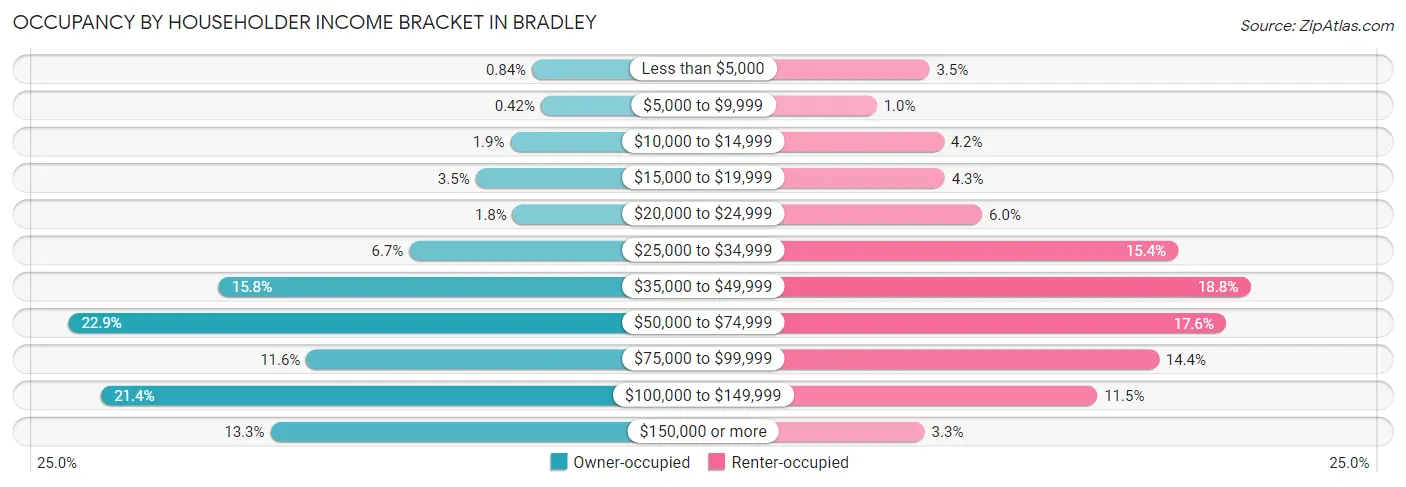
| Income Bracket | Owner-occupied | Renter-occupied |
| Less than $5,000 | 32 (0.8%) | 77 (3.5%) |
| $5,000 to $9,999 | 16 (0.4%) | 22 (1.0%) |
| $10,000 to $14,999 | 71 (1.9%) | 92 (4.2%) |
| $15,000 to $19,999 | 134 (3.5%) | 93 (4.3%) |
| $20,000 to $24,999 | 67 (1.8%) | 132 (6.0%) |
| $25,000 to $34,999 | 254 (6.7%) | 336 (15.3%) |
| $35,000 to $49,999 | 598 (15.8%) | 411 (18.8%) |
| $50,000 to $74,999 | 870 (22.9%) | 386 (17.6%) |
| $75,000 to $99,999 | 440 (11.6%) | 316 (14.4%) |
| $100,000 to $149,999 | 811 (21.3%) | 252 (11.5%) |
| $150,000 or more | 505 (13.3%) | 72 (3.3%) |
| Total | 3,798 (100.0%) | 2,189 (100.0%) |
Monthly Housing Cost Tiers in Bradley
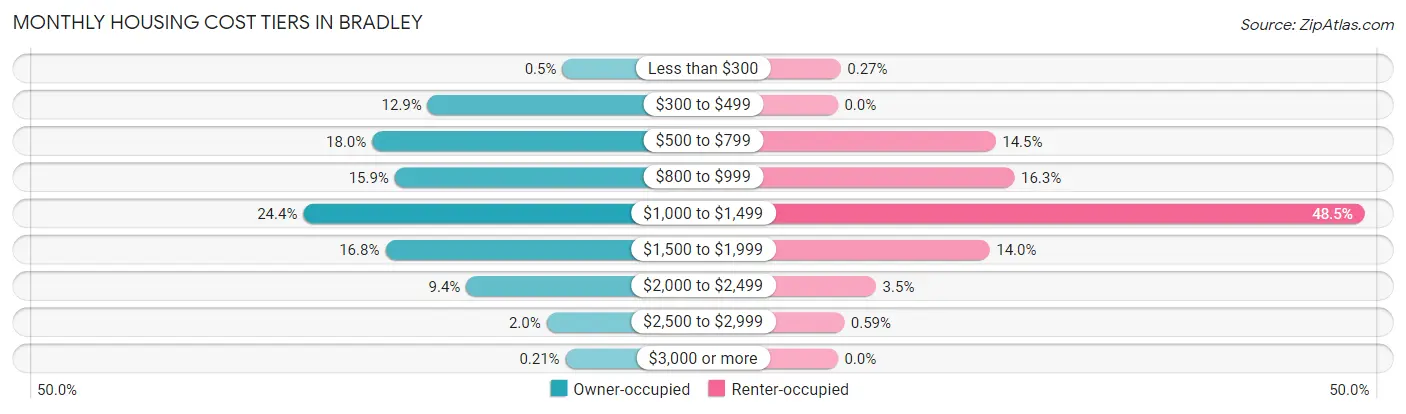
| Monthly Cost | Owner-occupied | Renter-occupied |
| Less than $300 | 19 (0.5%) | 6 (0.3%) |
| $300 to $499 | 490 (12.9%) | 0 (0.0%) |
| $500 to $799 | 684 (18.0%) | 318 (14.5%) |
| $800 to $999 | 605 (15.9%) | 356 (16.3%) |
| $1,000 to $1,499 | 925 (24.3%) | 1,062 (48.5%) |
| $1,500 to $1,999 | 638 (16.8%) | 306 (14.0%) |
| $2,000 to $2,499 | 355 (9.3%) | 77 (3.5%) |
| $2,500 to $2,999 | 74 (1.9%) | 13 (0.6%) |
| $3,000 or more | 8 (0.2%) | 0 (0.0%) |
| Total | 3,798 (100.0%) | 2,189 (100.0%) |
Physical Housing Characteristics in Bradley
Housing Structures in Bradley
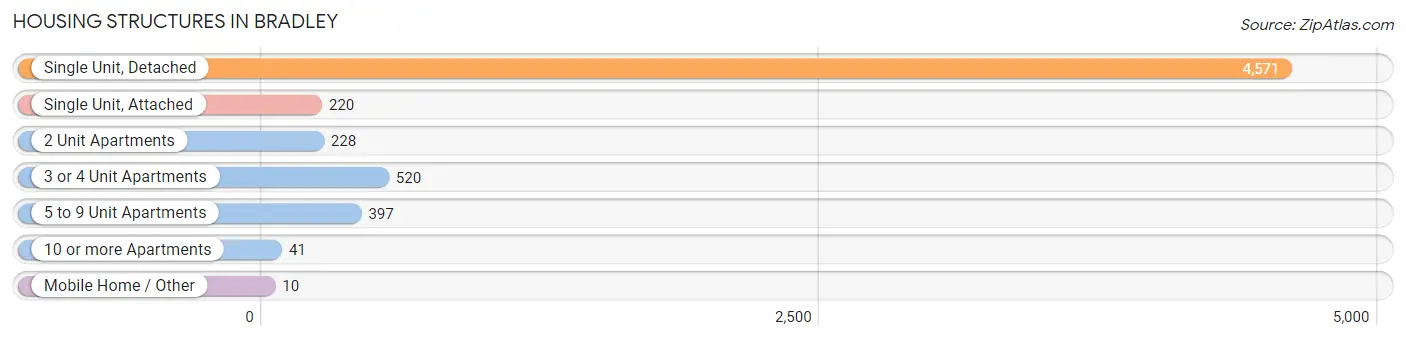
| Structure Type | # Housing Units | % Housing Units |
| Single Unit, Detached | 4,571 | 76.3% |
| Single Unit, Attached | 220 | 3.7% |
| 2 Unit Apartments | 228 | 3.8% |
| 3 or 4 Unit Apartments | 520 | 8.7% |
| 5 to 9 Unit Apartments | 397 | 6.6% |
| 10 or more Apartments | 41 | 0.7% |
| Mobile Home / Other | 10 | 0.2% |
| Total | 5,987 | 100.0% |
Housing Structures by Occupancy in Bradley
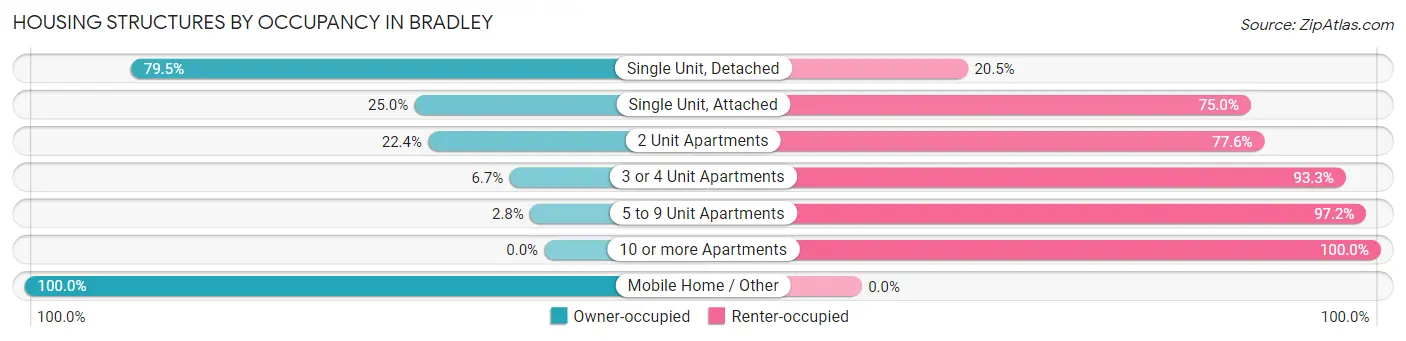
| Structure Type | Owner-occupied | Renter-occupied |
| Single Unit, Detached | 3,636 (79.5%) | 935 (20.5%) |
| Single Unit, Attached | 55 (25.0%) | 165 (75.0%) |
| 2 Unit Apartments | 51 (22.4%) | 177 (77.6%) |
| 3 or 4 Unit Apartments | 35 (6.7%) | 485 (93.3%) |
| 5 to 9 Unit Apartments | 11 (2.8%) | 386 (97.2%) |
| 10 or more Apartments | 0 (0.0%) | 41 (100.0%) |
| Mobile Home / Other | 10 (100.0%) | 0 (0.0%) |
| Total | 3,798 (63.4%) | 2,189 (36.6%) |
Housing Structures by Number of Rooms in Bradley
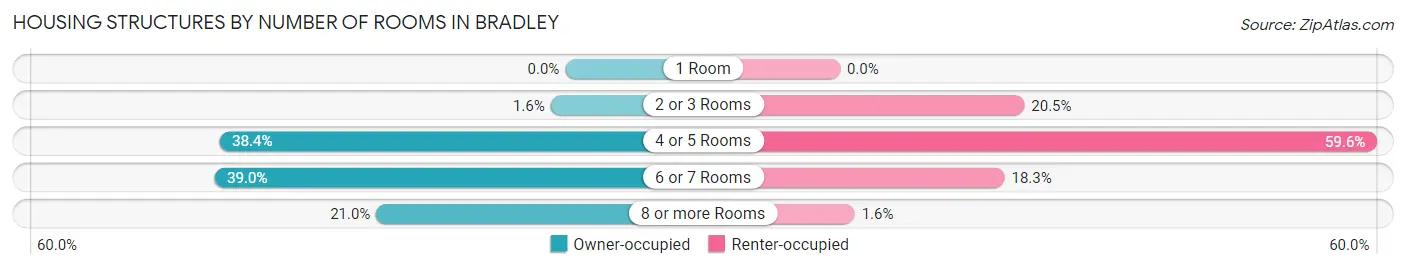
| Number of Rooms | Owner-occupied | Renter-occupied |
| 1 Room | 0 (0.0%) | 0 (0.0%) |
| 2 or 3 Rooms | 62 (1.6%) | 448 (20.5%) |
| 4 or 5 Rooms | 1,459 (38.4%) | 1,305 (59.6%) |
| 6 or 7 Rooms | 1,480 (39.0%) | 400 (18.3%) |
| 8 or more Rooms | 797 (21.0%) | 36 (1.6%) |
| Total | 3,798 (100.0%) | 2,189 (100.0%) |
Housing Structure by Heating Type in Bradley
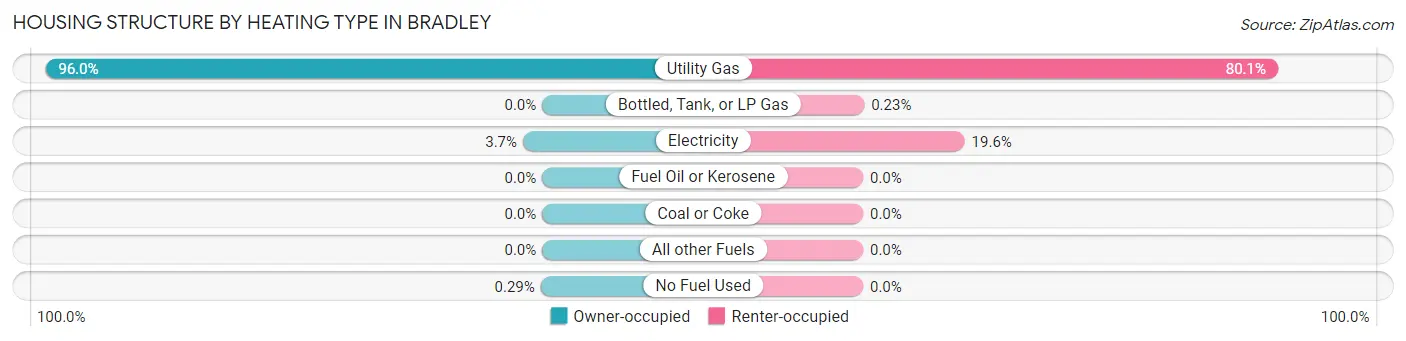
| Heating Type | Owner-occupied | Renter-occupied |
| Utility Gas | 3,646 (96.0%) | 1,754 (80.1%) |
| Bottled, Tank, or LP Gas | 0 (0.0%) | 5 (0.2%) |
| Electricity | 141 (3.7%) | 430 (19.6%) |
| Fuel Oil or Kerosene | 0 (0.0%) | 0 (0.0%) |
| Coal or Coke | 0 (0.0%) | 0 (0.0%) |
| All other Fuels | 0 (0.0%) | 0 (0.0%) |
| No Fuel Used | 11 (0.3%) | 0 (0.0%) |
| Total | 3,798 (100.0%) | 2,189 (100.0%) |
Household Vehicle Usage in Bradley
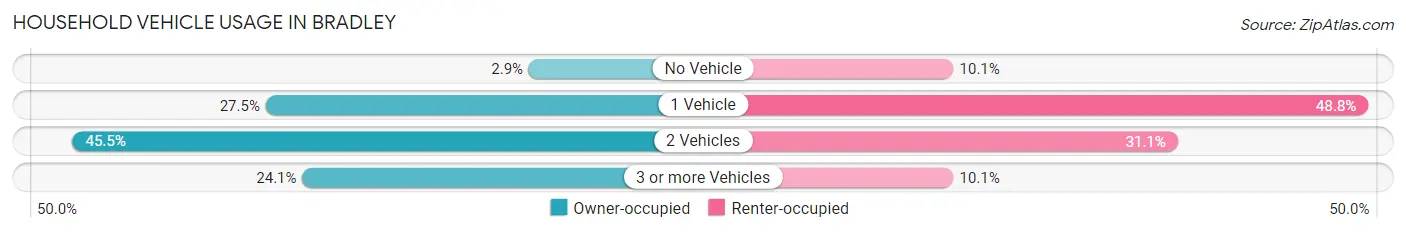
| Vehicles per Household | Owner-occupied | Renter-occupied |
| No Vehicle | 111 (2.9%) | 220 (10.1%) |
| 1 Vehicle | 1,044 (27.5%) | 1,069 (48.8%) |
| 2 Vehicles | 1,729 (45.5%) | 680 (31.1%) |
| 3 or more Vehicles | 914 (24.1%) | 220 (10.1%) |
| Total | 3,798 (100.0%) | 2,189 (100.0%) |
Real Estate & Mortgages in Bradley
Real Estate and Mortgage Overview in Bradley
| Characteristic | Without Mortgage | With Mortgage |
| Housing Units | 1,391 | 2,407 |
| Median Property Value | $140,500 | $162,200 |
| Median Household Income | $52,777 | $385 |
| Monthly Housing Costs | $551 | $8 |
| Real Estate Taxes | $2,933 | $72 |
Property Value by Mortgage Status in Bradley
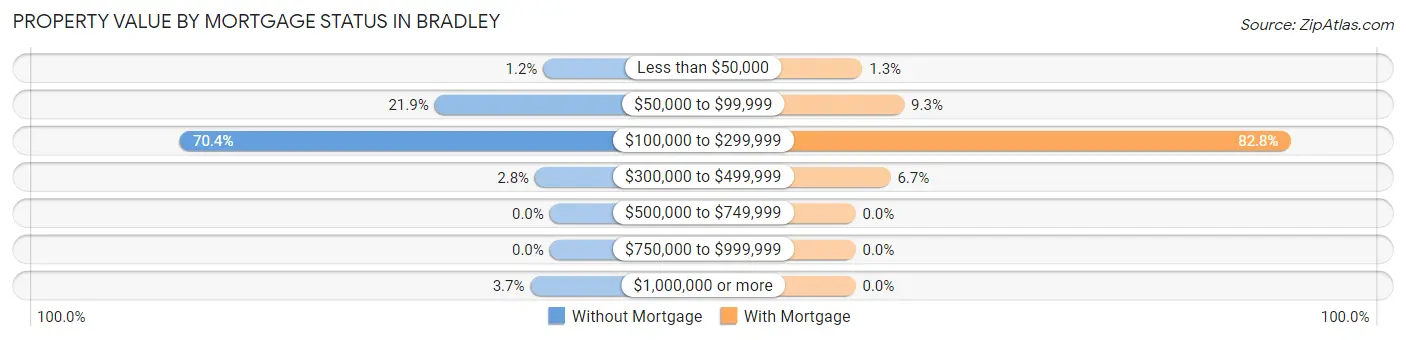
| Property Value | Without Mortgage | With Mortgage |
| Less than $50,000 | 17 (1.2%) | 31 (1.3%) |
| $50,000 to $99,999 | 305 (21.9%) | 223 (9.3%) |
| $100,000 to $299,999 | 979 (70.4%) | 1,993 (82.8%) |
| $300,000 to $499,999 | 39 (2.8%) | 160 (6.7%) |
| $500,000 to $749,999 | 0 (0.0%) | 0 (0.0%) |
| $750,000 to $999,999 | 0 (0.0%) | 0 (0.0%) |
| $1,000,000 or more | 51 (3.7%) | 0 (0.0%) |
| Total | 1,391 (100.0%) | 2,407 (100.0%) |
Household Income by Mortgage Status in Bradley
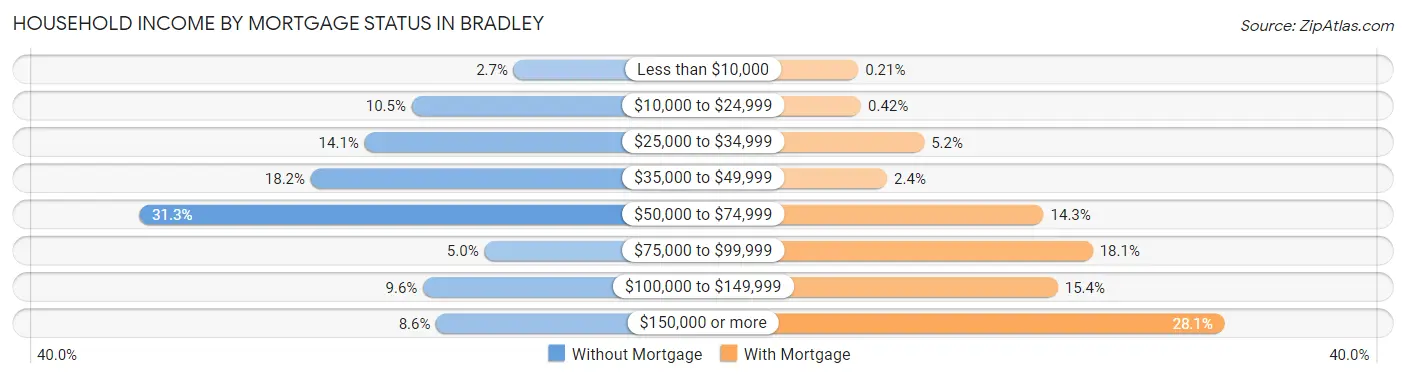
| Household Income | Without Mortgage | With Mortgage |
| Less than $10,000 | 38 (2.7%) | 5 (0.2%) |
| $10,000 to $24,999 | 146 (10.5%) | 10 (0.4%) |
| $25,000 to $34,999 | 196 (14.1%) | 126 (5.2%) |
| $35,000 to $49,999 | 253 (18.2%) | 58 (2.4%) |
| $50,000 to $74,999 | 435 (31.3%) | 345 (14.3%) |
| $75,000 to $99,999 | 69 (5.0%) | 435 (18.1%) |
| $100,000 to $149,999 | 134 (9.6%) | 371 (15.4%) |
| $150,000 or more | 120 (8.6%) | 677 (28.1%) |
| Total | 1,391 (100.0%) | 2,407 (100.0%) |
Property Value to Household Income Ratio in Bradley
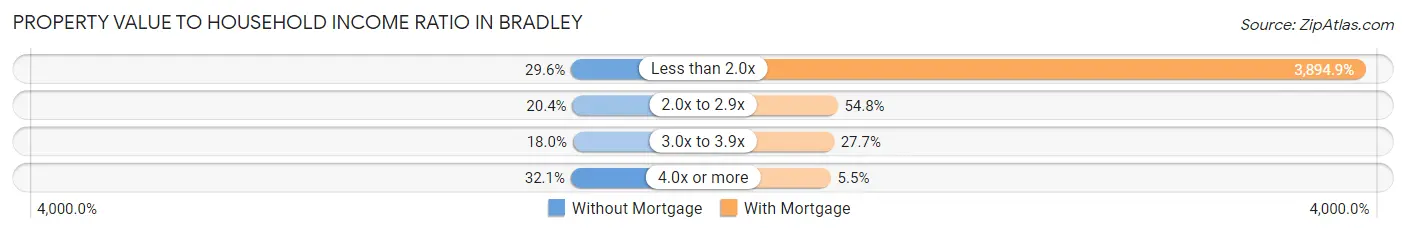
| Value-to-Income Ratio | Without Mortgage | With Mortgage |
| Less than 2.0x | 412 (29.6%) | 93,750 (3,894.9%) |
| 2.0x to 2.9x | 283 (20.3%) | 1,318 (54.8%) |
| 3.0x to 3.9x | 250 (18.0%) | 666 (27.7%) |
| 4.0x or more | 446 (32.1%) | 133 (5.5%) |
| Total | 1,391 (100.0%) | 2,407 (100.0%) |
Real Estate Taxes by Mortgage Status in Bradley
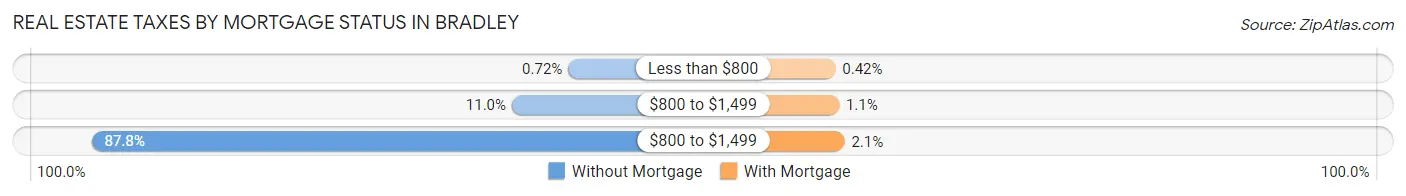
| Property Taxes | Without Mortgage | With Mortgage |
| Less than $800 | 10 (0.7%) | 10 (0.4%) |
| $800 to $1,499 | 153 (11.0%) | 26 (1.1%) |
| $800 to $1,499 | 1,221 (87.8%) | 50 (2.1%) |
| Total | 1,391 (100.0%) | 2,407 (100.0%) |
Health & Disability in Bradley
Health Insurance Coverage by Age in Bradley
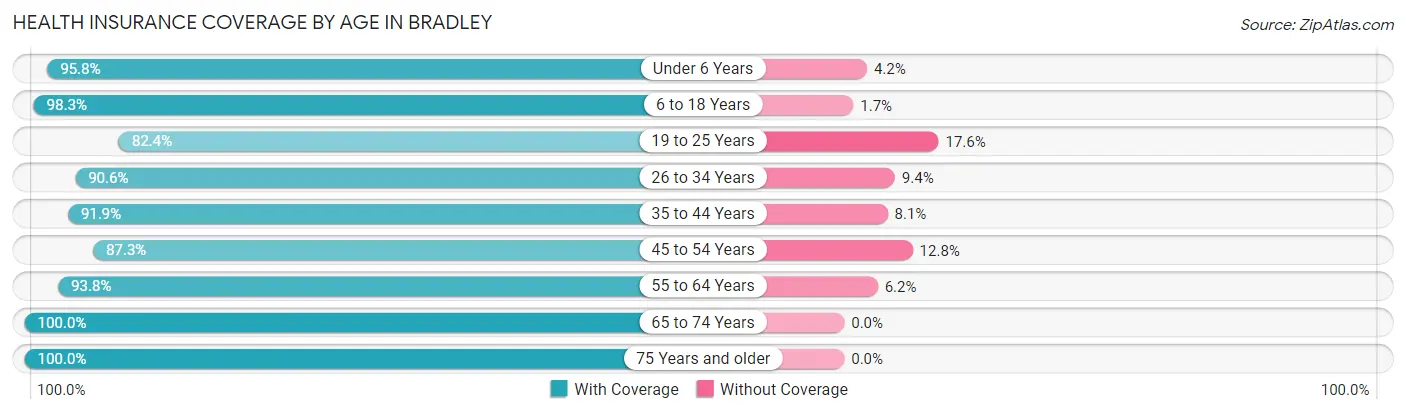
| Age Bracket | With Coverage | Without Coverage |
| Under 6 Years | 1,178 (95.8%) | 52 (4.2%) |
| 6 to 18 Years | 2,216 (98.3%) | 38 (1.7%) |
| 19 to 25 Years | 1,594 (82.4%) | 340 (17.6%) |
| 26 to 34 Years | 1,841 (90.6%) | 192 (9.4%) |
| 35 to 44 Years | 1,744 (91.9%) | 153 (8.1%) |
| 45 to 54 Years | 1,635 (87.3%) | 239 (12.8%) |
| 55 to 64 Years | 1,702 (93.8%) | 113 (6.2%) |
| 65 to 74 Years | 1,268 (100.0%) | 0 (0.0%) |
| 75 Years and older | 987 (100.0%) | 0 (0.0%) |
| Total | 14,165 (92.6%) | 1,127 (7.4%) |
Health Insurance Coverage by Citizenship Status in Bradley
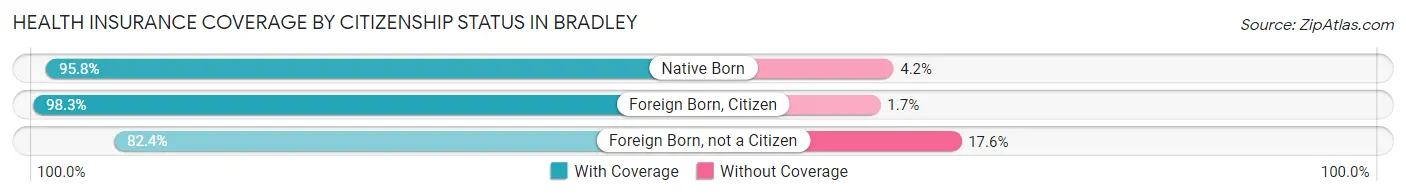
| Citizenship Status | With Coverage | Without Coverage |
| Native Born | 1,178 (95.8%) | 52 (4.2%) |
| Foreign Born, Citizen | 2,216 (98.3%) | 38 (1.7%) |
| Foreign Born, not a Citizen | 1,594 (82.4%) | 340 (17.6%) |
Health Insurance Coverage by Household Income in Bradley
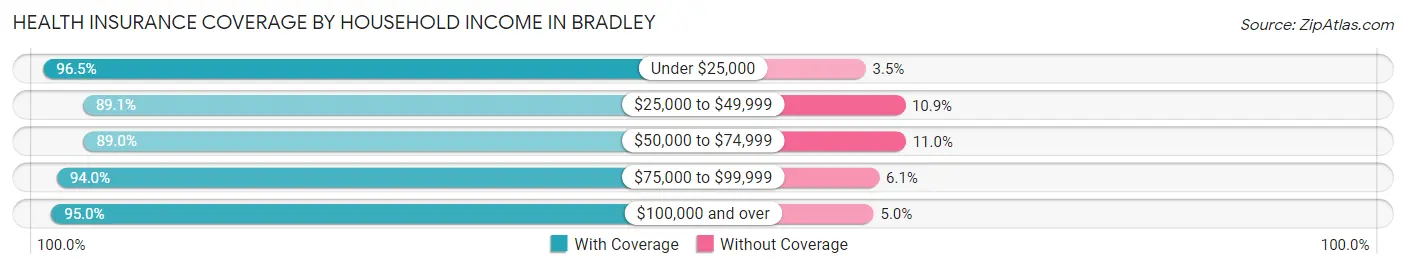
| Household Income | With Coverage | Without Coverage |
| Under $25,000 | 1,451 (96.5%) | 53 (3.5%) |
| $25,000 to $49,999 | 2,840 (89.1%) | 347 (10.9%) |
| $50,000 to $74,999 | 2,612 (89.0%) | 324 (11.0%) |
| $75,000 to $99,999 | 1,941 (94.0%) | 125 (6.0%) |
| $100,000 and over | 5,266 (95.0%) | 278 (5.0%) |
Public vs Private Health Insurance Coverage by Age in Bradley
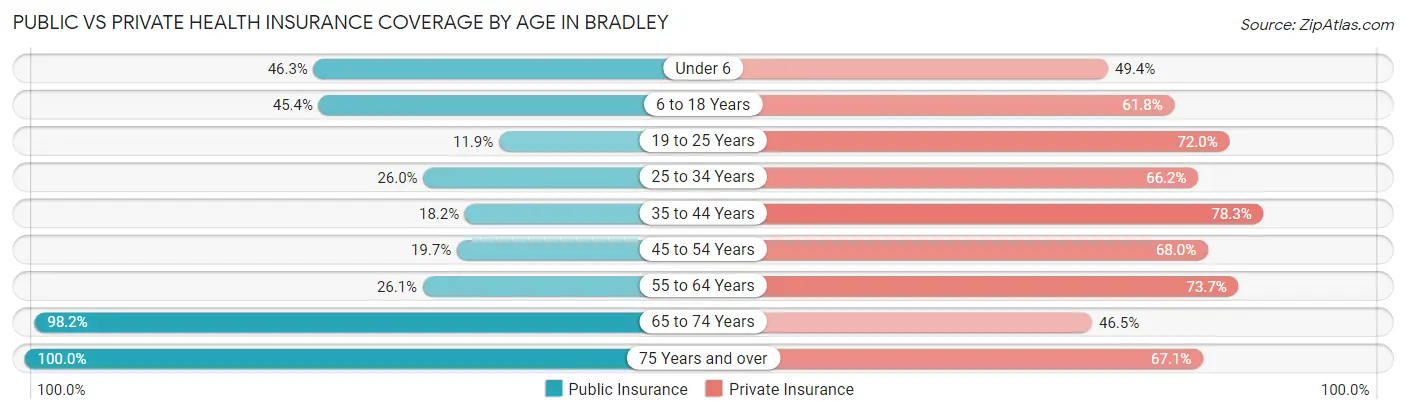
| Age Bracket | Public Insurance | Private Insurance |
| Under 6 | 570 (46.3%) | 608 (49.4%) |
| 6 to 18 Years | 1,023 (45.4%) | 1,392 (61.8%) |
| 19 to 25 Years | 231 (11.9%) | 1,392 (72.0%) |
| 25 to 34 Years | 528 (26.0%) | 1,345 (66.2%) |
| 35 to 44 Years | 346 (18.2%) | 1,485 (78.3%) |
| 45 to 54 Years | 370 (19.7%) | 1,274 (68.0%) |
| 55 to 64 Years | 473 (26.1%) | 1,337 (73.7%) |
| 65 to 74 Years | 1,245 (98.2%) | 589 (46.5%) |
| 75 Years and over | 987 (100.0%) | 662 (67.1%) |
| Total | 5,773 (37.8%) | 10,084 (65.9%) |
Disability Status by Sex by Age in Bradley
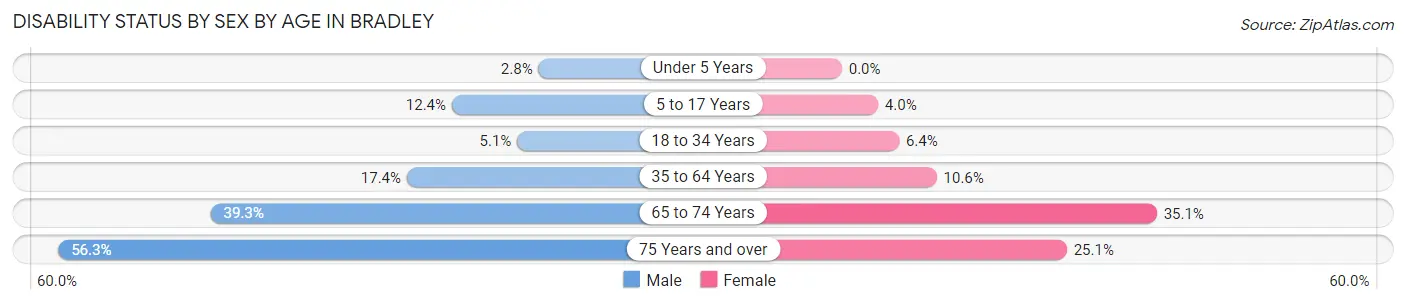
| Age Bracket | Male | Female |
| Under 5 Years | 14 (2.8%) | 0 (0.0%) |
| 5 to 17 Years | 136 (12.4%) | 45 (4.0%) |
| 18 to 34 Years | 114 (5.1%) | 125 (6.4%) |
| 35 to 64 Years | 475 (17.4%) | 302 (10.6%) |
| 65 to 74 Years | 189 (39.3%) | 276 (35.1%) |
| 75 Years and over | 279 (56.2%) | 123 (25.1%) |
Disability Class by Sex by Age in Bradley
Disability Class: Hearing Difficulty
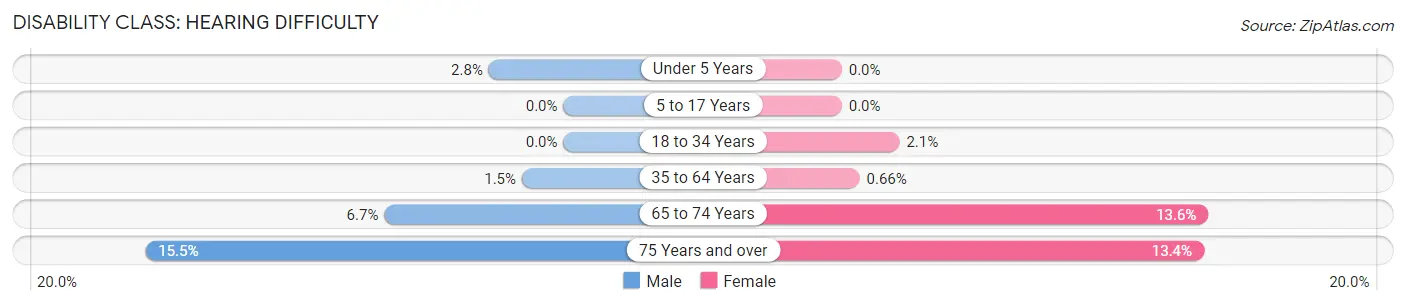
| Age Bracket | Male | Female |
| Under 5 Years | 14 (2.8%) | 0 (0.0%) |
| 5 to 17 Years | 0 (0.0%) | 0 (0.0%) |
| 18 to 34 Years | 0 (0.0%) | 42 (2.1%) |
| 35 to 64 Years | 42 (1.5%) | 19 (0.7%) |
| 65 to 74 Years | 32 (6.7%) | 107 (13.6%) |
| 75 Years and over | 77 (15.5%) | 66 (13.4%) |
Disability Class: Vision Difficulty
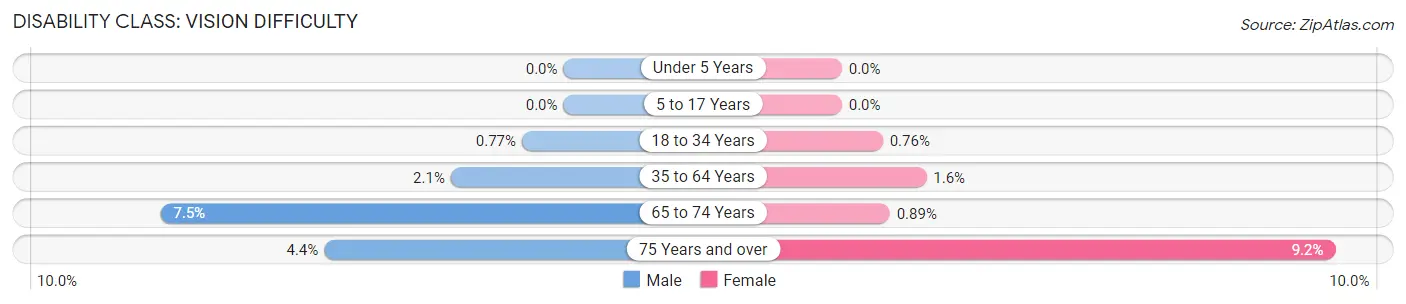
| Age Bracket | Male | Female |
| Under 5 Years | 0 (0.0%) | 0 (0.0%) |
| 5 to 17 Years | 0 (0.0%) | 0 (0.0%) |
| 18 to 34 Years | 17 (0.8%) | 15 (0.8%) |
| 35 to 64 Years | 57 (2.1%) | 45 (1.6%) |
| 65 to 74 Years | 36 (7.5%) | 7 (0.9%) |
| 75 Years and over | 22 (4.4%) | 45 (9.2%) |
Disability Class: Cognitive Difficulty
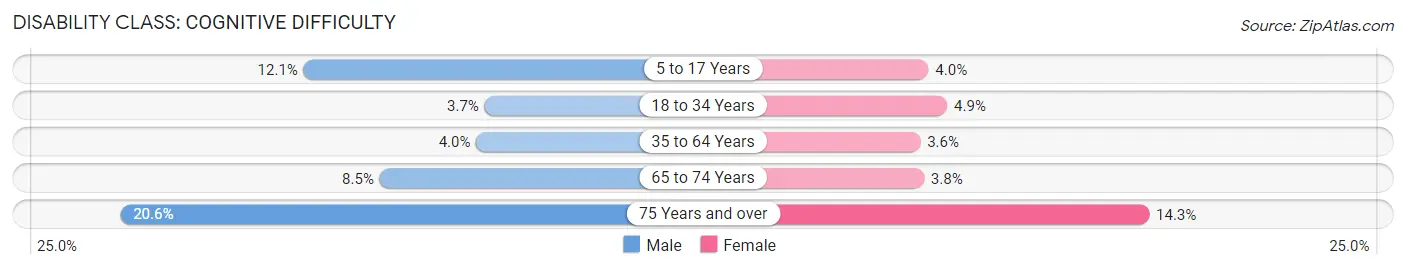
| Age Bracket | Male | Female |
| 5 to 17 Years | 132 (12.0%) | 45 (4.0%) |
| 18 to 34 Years | 81 (3.6%) | 96 (4.9%) |
| 35 to 64 Years | 110 (4.0%) | 104 (3.6%) |
| 65 to 74 Years | 41 (8.5%) | 30 (3.8%) |
| 75 Years and over | 102 (20.6%) | 70 (14.3%) |
Disability Class: Ambulatory Difficulty
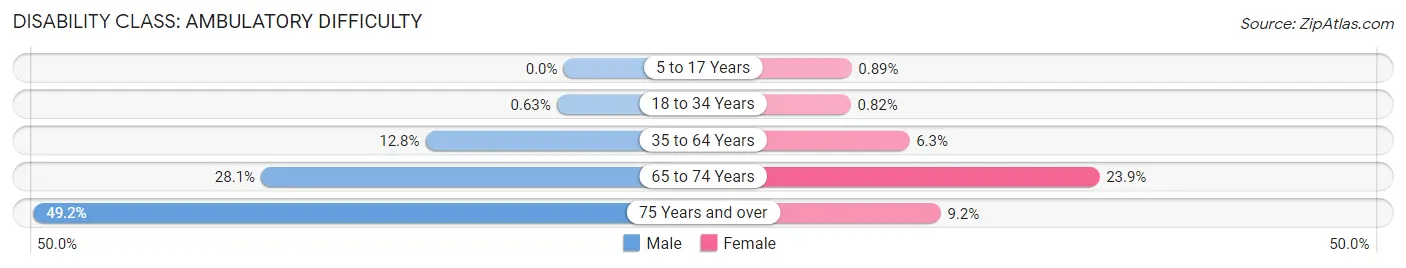
| Age Bracket | Male | Female |
| 5 to 17 Years | 0 (0.0%) | 10 (0.9%) |
| 18 to 34 Years | 14 (0.6%) | 16 (0.8%) |
| 35 to 64 Years | 349 (12.8%) | 179 (6.3%) |
| 65 to 74 Years | 135 (28.1%) | 188 (23.9%) |
| 75 Years and over | 244 (49.2%) | 45 (9.2%) |
Disability Class: Self-Care Difficulty
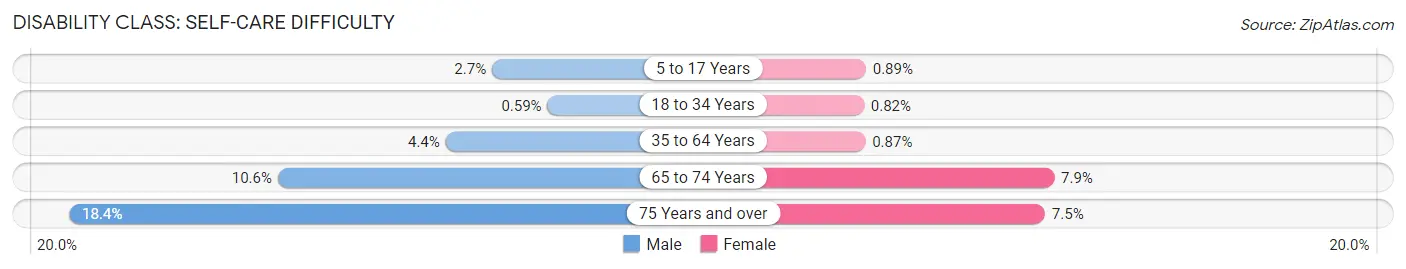
| Age Bracket | Male | Female |
| 5 to 17 Years | 29 (2.6%) | 10 (0.9%) |
| 18 to 34 Years | 13 (0.6%) | 16 (0.8%) |
| 35 to 64 Years | 119 (4.4%) | 25 (0.9%) |
| 65 to 74 Years | 51 (10.6%) | 62 (7.9%) |
| 75 Years and over | 91 (18.3%) | 37 (7.5%) |
Technology Access in Bradley
Computing Device Access in Bradley
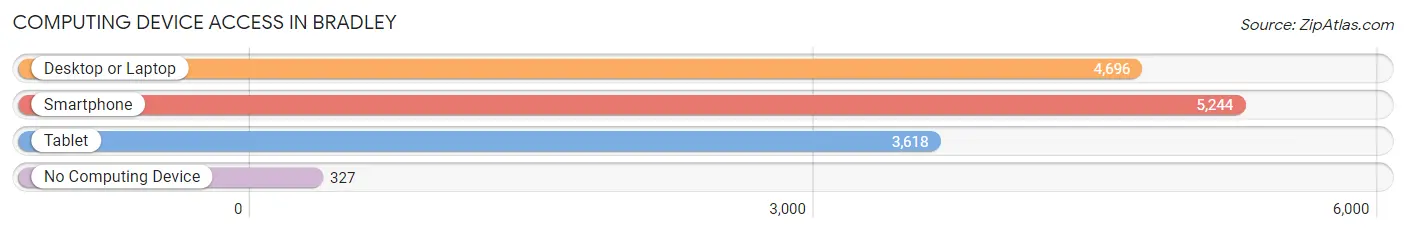
| Device Type | # Households | % Households |
| Desktop or Laptop | 4,696 | 78.4% |
| Smartphone | 5,244 | 87.6% |
| Tablet | 3,618 | 60.4% |
| No Computing Device | 327 | 5.5% |
| Total | 5,987 | 100.0% |
Internet Access in Bradley
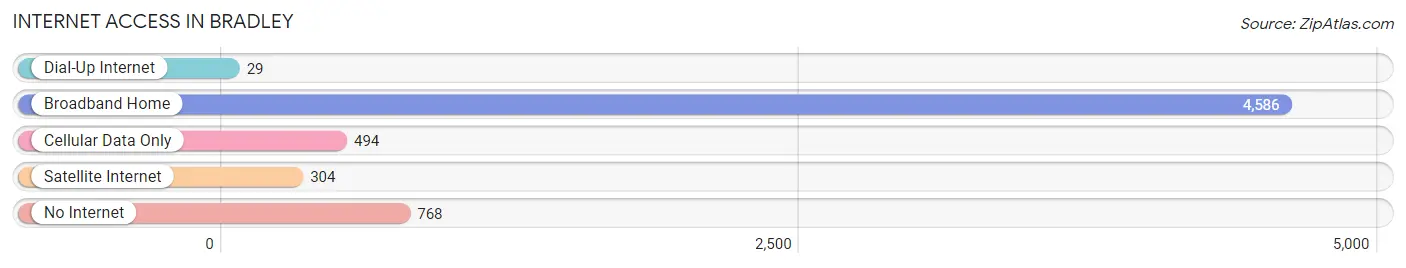
| Internet Type | # Households | % Households |
| Dial-Up Internet | 29 | 0.5% |
| Broadband Home | 4,586 | 76.6% |
| Cellular Data Only | 494 | 8.3% |
| Satellite Internet | 304 | 5.1% |
| No Internet | 768 | 12.8% |
| Total | 5,987 | 100.0% |
Bradley Summary
Bradley, Illinois is a small village located in Kankakee County, Illinois. It is situated about 60 miles south of Chicago and is part of the Kankakee-Bradley Metropolitan Statistical Area. The village has a population of approximately 8,000 people and is known for its small-town charm and friendly atmosphere.
Geography
Bradley is located in the northern part of Kankakee County, Illinois. It is situated on the Kankakee River, which is a tributary of the Illinois River. The village is surrounded by farmland and is located near the Kankakee River State Park. The village is also close to the Iroquois County line.
The village has a total area of 2.2 square miles, all of which is land. The village is located at an elevation of 645 feet above sea level. The climate in Bradley is classified as humid continental, with hot summers and cold winters.
Economy
The economy of Bradley is largely based on agriculture and manufacturing. The village is home to several large manufacturing companies, including Caterpillar, Inc., which produces construction and mining equipment. Other major employers in the village include the Kankakee County Health Department, Kankakee Community College, and the Kankakee County Sheriff's Office.
The village also has a thriving retail sector, with several small businesses located in the downtown area. The village is also home to several restaurants, bars, and other entertainment venues.
Demographics
As of the 2010 census, the population of Bradley was 8,097. The racial makeup of the village was 79.2% White, 15.2% African American, 0.3% Native American, 0.7% Asian, 0.1% Pacific Islander, and 4.5% from other races. Hispanic or Latino of any race were 4.7% of the population.
The median income for a household in the village was $45,938, and the median income for a family was $54,938. The per capita income for the village was $20,938. About 8.2% of families and 10.2% of the population were below the poverty line, including 14.2% of those under age 18 and 6.2% of those age 65 or over.
Conclusion
Bradley, Illinois is a small village located in Kankakee County, Illinois. It is situated about 60 miles south of Chicago and is part of the Kankakee-Bradley Metropolitan Statistical Area. The village has a population of approximately 8,000 people and is known for its small-town charm and friendly atmosphere. The economy of Bradley is largely based on agriculture and manufacturing, and the village is home to several large employers. The racial makeup of the village is predominantly White, with African Americans, Native Americans, Asians, and Pacific Islanders making up the remainder of the population. The median income for a household in the village is $45,938, and the per capita income for the village is $20,938.
Common Questions
What is Per Capita Income in Bradley?
Per Capita income in Bradley is $31,801.
What is the Median Family Income in Bradley?
Median Family Income in Bradley is $69,077.
What is the Median Household income in Bradley?
Median Household Income in Bradley is $59,746.
What is Income or Wage Gap in Bradley?
Income or Wage Gap in Bradley is 34.0%.
Women in Bradley earn 66.0 cents for every dollar earned by a man.
What is Family Income Deficit in Bradley?
Family Income Deficit in Bradley is $12,063.
Families that are below poverty line in Bradley earn $12,063 less on average than the poverty threshold level.
What is Inequality or Gini Index in Bradley?
Inequality or Gini Index in Bradley is 0.39.
What is the Total Population of Bradley?
Total Population of Bradley is 15,379.
What is the Total Male Population of Bradley?
Total Male Population of Bradley is 7,540.
What is the Total Female Population of Bradley?
Total Female Population of Bradley is 7,839.
What is the Ratio of Males per 100 Females in Bradley?
There are 96.19 Males per 100 Females in Bradley.
What is the Ratio of Females per 100 Males in Bradley?
There are 103.97 Females per 100 Males in Bradley.
What is the Median Population Age in Bradley?
Median Population Age in Bradley is 36.0 Years.
What is the Average Family Size in Bradley
Average Family Size in Bradley is 3.1 People.
What is the Average Household Size in Bradley
Average Household Size in Bradley is 2.5 People.
How Large is the Labor Force in Bradley?
There are 8,455 People in the Labor Forcein in Bradley.
What is the Percentage of People in the Labor Force in Bradley?
67.7% of People are in the Labor Force in Bradley.
What is the Unemployment Rate in Bradley?
Unemployment Rate in Bradley is 4.3%.