Ashland, AL Map & Demographics
Ashland Map
Ashland Overview
$23,183
PER CAPITA INCOME
$34,053
AVG FAMILY INCOME
$30,850
AVG HOUSEHOLD INCOME
54.1%
WAGE / INCOME GAP [ % ]
45.9¢/ $1
WAGE / INCOME GAP [ $ ]
0.56
INEQUALITY / GINI INDEX
1,674
TOTAL POPULATION
793
MALE POPULATION
881
FEMALE POPULATION
90.01
MALES / 100 FEMALES
111.10
FEMALES / 100 MALES
42.0
MEDIAN AGE
3.0
AVG FAMILY SIZE
2.2
AVG HOUSEHOLD SIZE
608
LABOR FORCE [ PEOPLE ]
44.1%
PERCENT IN LABOR FORCE
8.9%
UNEMPLOYMENT RATE
Ashland Zip Codes
Ashland Area Codes
Income in Ashland
Income Overview in Ashland
Per Capita Income in Ashland is $23,183, while median incomes of families and households are $34,053 and $30,850 respectively.
| Characteristic | Number | Measure |
| Per Capita Income | 1,674 | $23,183 |
| Median Family Income | 391 | $34,053 |
| Mean Family Income | 391 | $44,788 |
| Median Household Income | 709 | $30,850 |
| Mean Household Income | 709 | $50,530 |
| Income Deficit | 391 | $0 |
| Wage / Income Gap (%) | 1,674 | 54.13% |
| Wage / Income Gap ($) | 1,674 | 45.87¢ per $1 |
| Gini / Inequality Index | 1,674 | 0.56 |
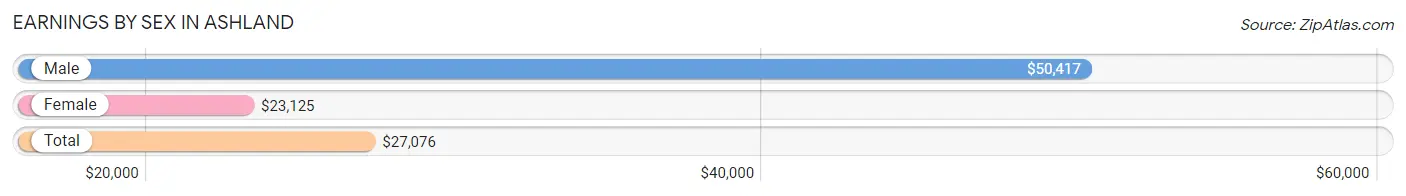
Earnings by Sex in Ashland
Average Earnings in Ashland are $27,076, $50,417 for men and $23,125 for women, a difference of 54.1%.
| Sex | Number | Average Earnings |
| Male | 287 (42.6%) | $50,417 |
| Female | 386 (57.4%) | $23,125 |
| Total | 673 (100.0%) | $27,076 |
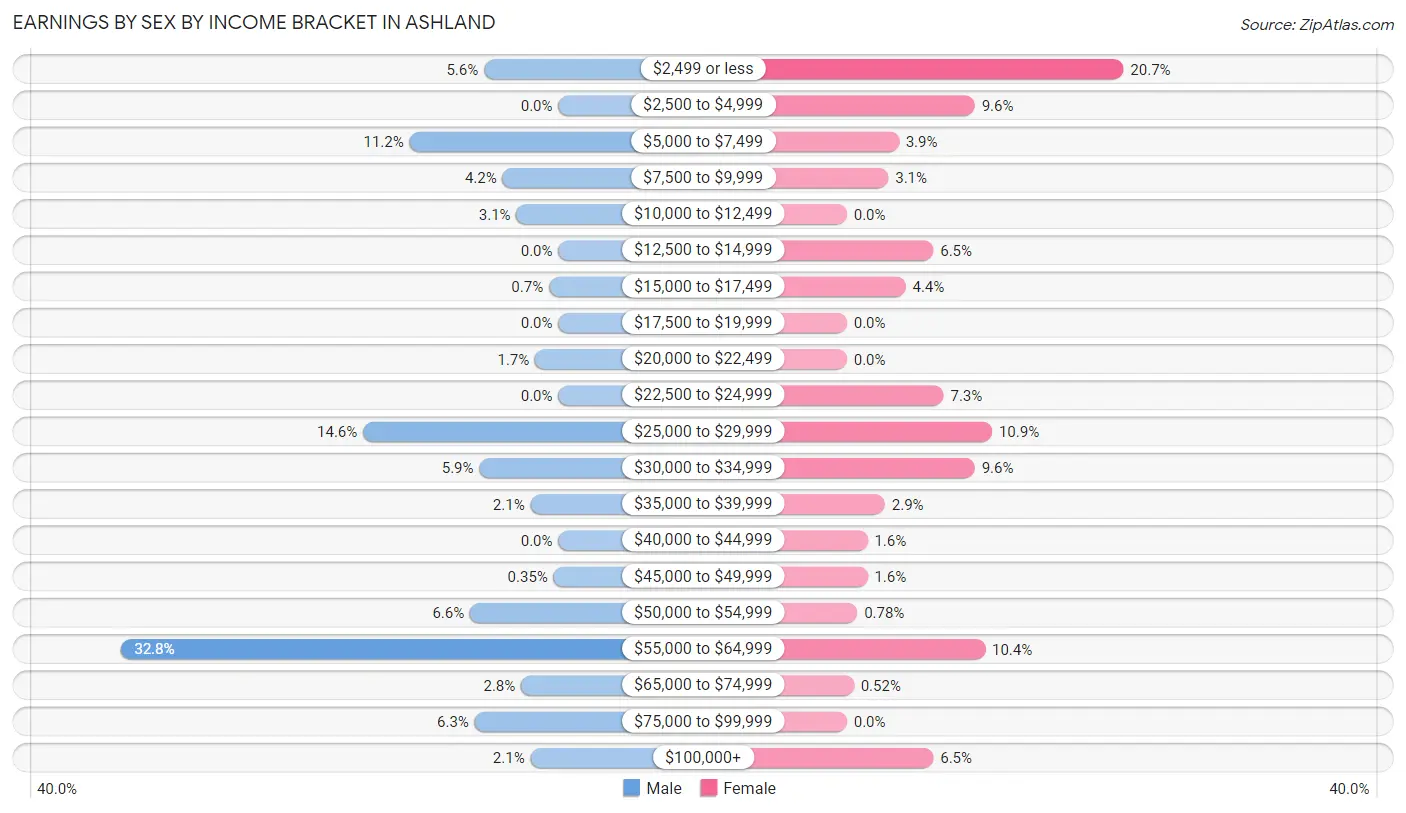
Earnings by Sex by Income Bracket in Ashland
The most common earnings brackets in Ashland are $55,000 to $64,999 for men (94 | 32.8%) and $2,499 or less for women (80 | 20.7%).
| Income | Male | Female |
| $2,499 or less | 16 (5.6%) | 80 (20.7%) |
| $2,500 to $4,999 | 0 (0.0%) | 37 (9.6%) |
| $5,000 to $7,499 | 32 (11.2%) | 15 (3.9%) |
| $7,500 to $9,999 | 12 (4.2%) | 12 (3.1%) |
| $10,000 to $12,499 | 9 (3.1%) | 0 (0.0%) |
| $12,500 to $14,999 | 0 (0.0%) | 25 (6.5%) |
| $15,000 to $17,499 | 2 (0.7%) | 17 (4.4%) |
| $17,500 to $19,999 | 0 (0.0%) | 0 (0.0%) |
| $20,000 to $22,499 | 5 (1.7%) | 0 (0.0%) |
| $22,500 to $24,999 | 0 (0.0%) | 28 (7.2%) |
| $25,000 to $29,999 | 42 (14.6%) | 42 (10.9%) |
| $30,000 to $34,999 | 17 (5.9%) | 37 (9.6%) |
| $35,000 to $39,999 | 6 (2.1%) | 11 (2.9%) |
| $40,000 to $44,999 | 0 (0.0%) | 6 (1.5%) |
| $45,000 to $49,999 | 1 (0.4%) | 6 (1.5%) |
| $50,000 to $54,999 | 19 (6.6%) | 3 (0.8%) |
| $55,000 to $64,999 | 94 (32.8%) | 40 (10.4%) |
| $65,000 to $74,999 | 8 (2.8%) | 2 (0.5%) |
| $75,000 to $99,999 | 18 (6.3%) | 0 (0.0%) |
| $100,000+ | 6 (2.1%) | 25 (6.5%) |
| Total | 287 (100.0%) | 386 (100.0%) |
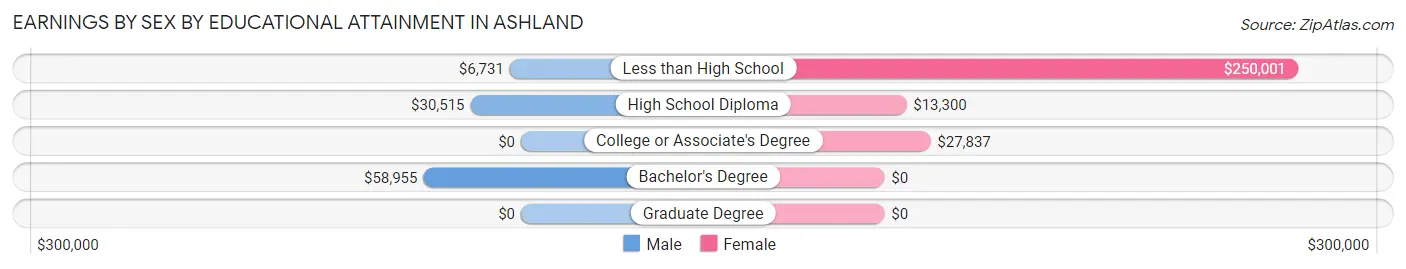
Earnings by Sex by Educational Attainment in Ashland
Average earnings in Ashland are $51,389 for men and $27,679 for women, a difference of 46.1%. Men with an educational attainment of bachelor's degree enjoy the highest average annual earnings of $58,955, while those with less than high school education earn the least with $6,731. Women with an educational attainment of less than high school earn the most with the average annual earnings of $250,001, while those with high school diploma education have the smallest earnings of $13,300.
| Educational Attainment | Male Income | Female Income |
| Less than High School | $6,731 | $250,001 |
| High School Diploma | $30,515 | $13,300 |
| College or Associate's Degree | - | - |
| Bachelor's Degree | $58,955 | $0 |
| Graduate Degree | - | - |
| Total | $51,389 | $27,679 |
Family Income in Ashland
Family Income Brackets in Ashland
According to the Ashland family income data, there are 93 families falling into the $25,000 to $34,999 income range, which is the most common income bracket and makes up 23.8% of all families.
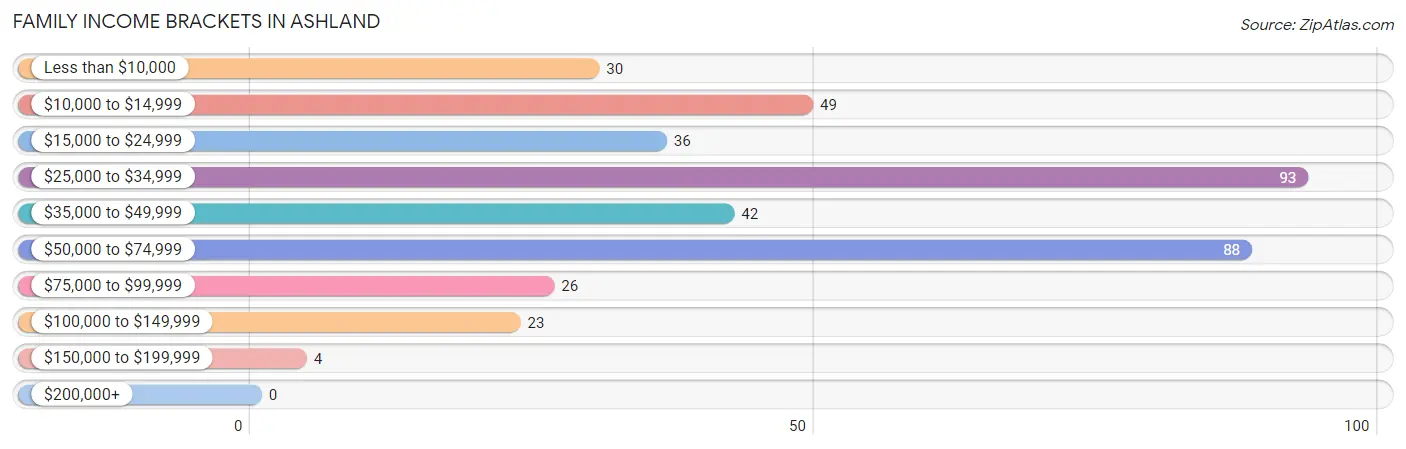
| Income Bracket | # Families | % Families |
| Less than $10,000 | 30 | 7.7% |
| $10,000 to $14,999 | 49 | 12.5% |
| $15,000 to $24,999 | 36 | 9.2% |
| $25,000 to $34,999 | 93 | 23.8% |
| $35,000 to $49,999 | 42 | 10.7% |
| $50,000 to $74,999 | 88 | 22.5% |
| $75,000 to $99,999 | 26 | 6.6% |
| $100,000 to $149,999 | 23 | 5.9% |
| $150,000 to $199,999 | 4 | 1.0% |
| $200,000+ | 0 | 0.0% |
Family Income by Famaliy Size in Ashland
3-person families (134 | 34.3%) account for the highest median family income in Ashland with $60,560 per family, while 3-person families (134 | 34.3%) have the highest median income of $20,187 per family member.
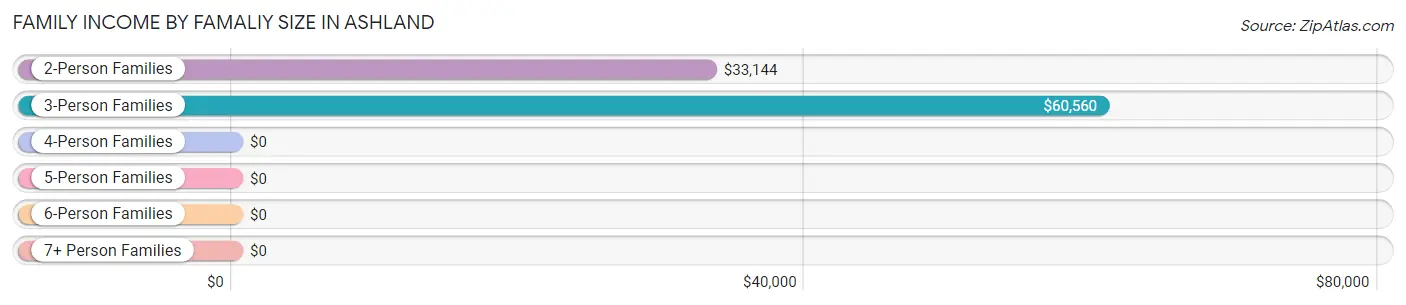
| Income Bracket | # Families | Median Income |
| 2-Person Families | 203 (51.9%) | $33,144 |
| 3-Person Families | 134 (34.3%) | $60,560 |
| 4-Person Families | 10 (2.6%) | $0 |
| 5-Person Families | 32 (8.2%) | $0 |
| 6-Person Families | 12 (3.1%) | $0 |
| 7+ Person Families | 0 (0.0%) | $0 |
| Total | 391 (100.0%) | $34,053 |
Family Income by Number of Earners in Ashland
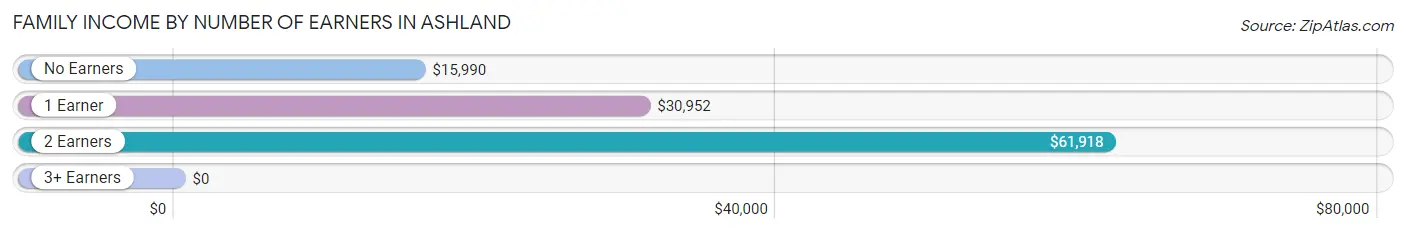
| Number of Earners | # Families | Median Income |
| No Earners | 111 (28.4%) | $15,990 |
| 1 Earner | 116 (29.7%) | $30,952 |
| 2 Earners | 163 (41.7%) | $61,918 |
| 3+ Earners | 1 (0.3%) | $0 |
| Total | 391 (100.0%) | $34,053 |
Household Income in Ashland
Household Income Brackets in Ashland
With 142 households falling in the category, the $25,000 to $34,999 income range is the most frequent in Ashland, accounting for 20.0% of all households. In contrast, only 4 households (0.6%) fall into the $150,000 to $199,999 income bracket, making it the least populous group.
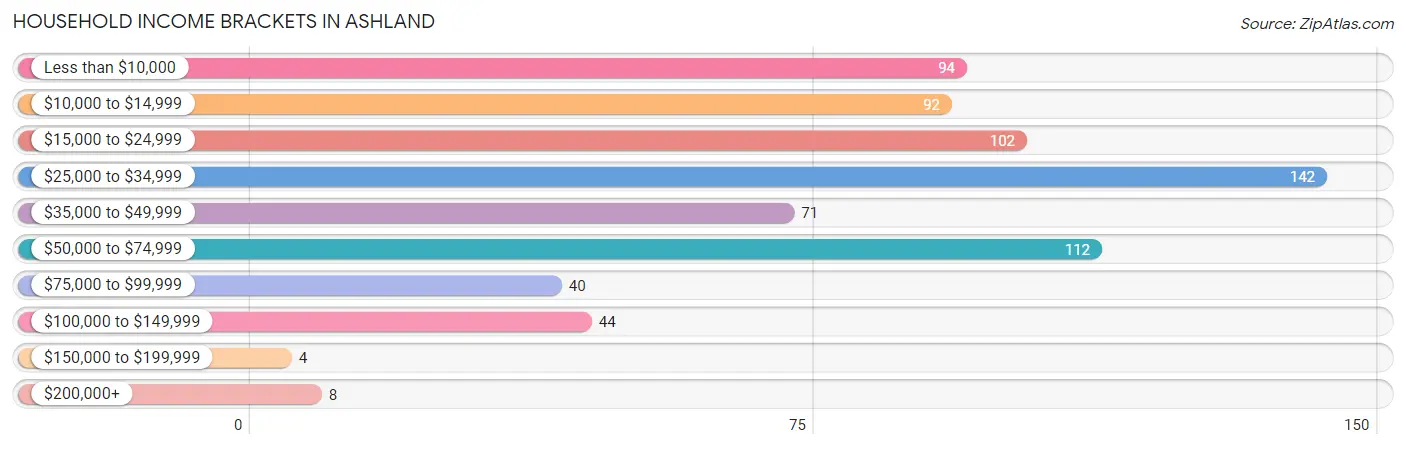
| Income Bracket | # Households | % Households |
| Less than $10,000 | 94 | 13.3% |
| $10,000 to $14,999 | 92 | 13.0% |
| $15,000 to $24,999 | 102 | 14.4% |
| $25,000 to $34,999 | 142 | 20.0% |
| $35,000 to $49,999 | 71 | 10.0% |
| $50,000 to $74,999 | 112 | 15.8% |
| $75,000 to $99,999 | 40 | 5.6% |
| $100,000 to $149,999 | 44 | 6.2% |
| $150,000 to $199,999 | 4 | 0.6% |
| $200,000+ | 8 | 1.1% |
Household Income by Householder Age in Ashland
The median household income in Ashland is $30,850, with the highest median household income of $60,022 found in the 25 to 44 years age bracket for the primary householder. A total of 211 households (29.8%) fall into this category. Meanwhile, the 65+ years age bracket for the primary householder has the lowest median household income of $17,258, with 206 households (29.1%) in this group.
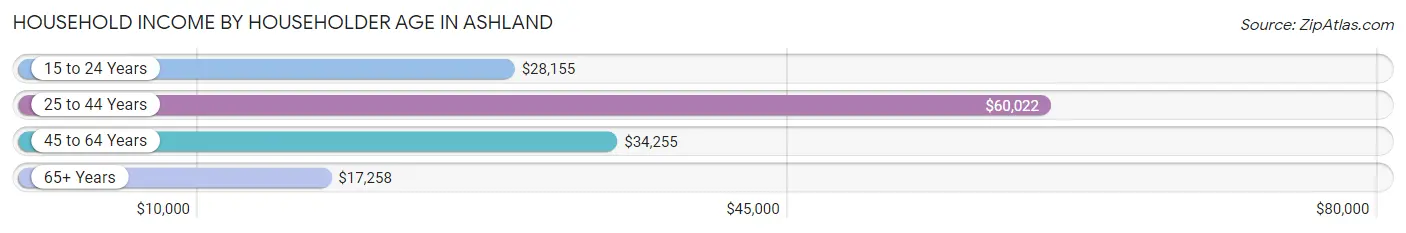
| Income Bracket | # Households | Median Income |
| 15 to 24 Years | 31 (4.4%) | $28,155 |
| 25 to 44 Years | 211 (29.8%) | $60,022 |
| 45 to 64 Years | 261 (36.8%) | $34,255 |
| 65+ Years | 206 (29.1%) | $17,258 |
| Total | 709 (100.0%) | $30,850 |
Poverty in Ashland
Income Below Poverty by Sex and Age in Ashland
With 46.4% poverty level for males and 31.6% for females among the residents of Ashland, 18 to 24 year old males and 12 to 14 year old females are the most vulnerable to poverty, with 66 males (93.0%) and 13 females (100.0%) in their respective age groups living below the poverty level.
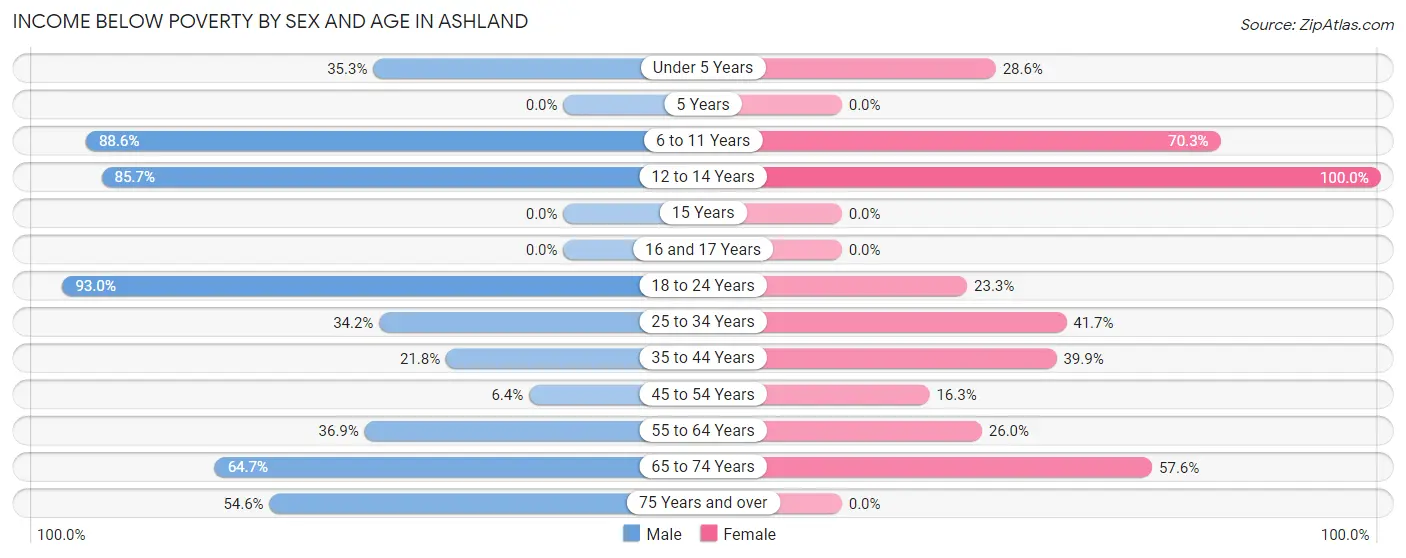
| Age Bracket | Male | Female |
| Under 5 Years | 24 (35.3%) | 14 (28.6%) |
| 5 Years | 0 (0.0%) | 0 (0.0%) |
| 6 to 11 Years | 101 (88.6%) | 26 (70.3%) |
| 12 to 14 Years | 12 (85.7%) | 13 (100.0%) |
| 15 Years | 0 (0.0%) | 0 (0.0%) |
| 16 and 17 Years | 0 (0.0%) | 0 (0.0%) |
| 18 to 24 Years | 66 (93.0%) | 20 (23.3%) |
| 25 to 34 Years | 27 (34.2%) | 15 (41.7%) |
| 35 to 44 Years | 22 (21.8%) | 53 (39.9%) |
| 45 to 54 Years | 7 (6.4%) | 28 (16.3%) |
| 55 to 64 Years | 38 (36.9%) | 13 (26.0%) |
| 65 to 74 Years | 22 (64.7%) | 72 (57.6%) |
| 75 Years and over | 24 (54.5%) | 0 (0.0%) |
| Total | 343 (46.4%) | 254 (31.6%) |
Income Above Poverty by Sex and Age in Ashland
According to the poverty statistics in Ashland, males aged 16 and 17 years and females aged 16 and 17 years are the age groups that are most secure financially, with 100.0% of males and 100.0% of females in these age groups living above the poverty line.
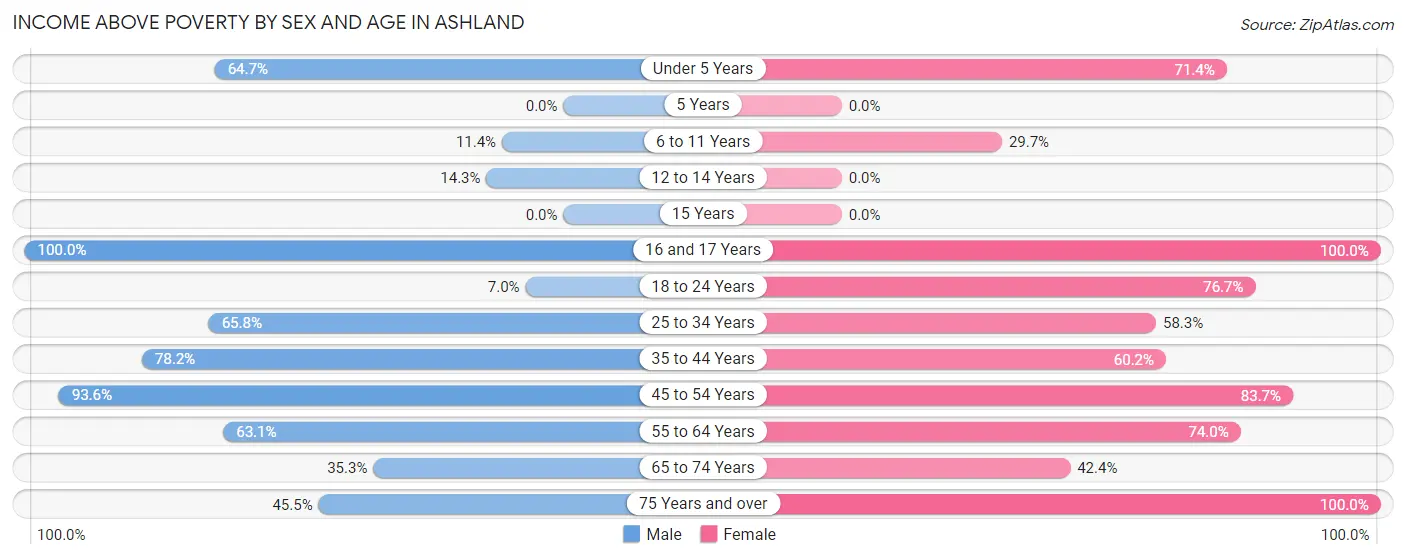
| Age Bracket | Male | Female |
| Under 5 Years | 44 (64.7%) | 35 (71.4%) |
| 5 Years | 0 (0.0%) | 0 (0.0%) |
| 6 to 11 Years | 13 (11.4%) | 11 (29.7%) |
| 12 to 14 Years | 2 (14.3%) | 0 (0.0%) |
| 15 Years | 0 (0.0%) | 0 (0.0%) |
| 16 and 17 Years | 1 (100.0%) | 58 (100.0%) |
| 18 to 24 Years | 5 (7.0%) | 66 (76.7%) |
| 25 to 34 Years | 52 (65.8%) | 21 (58.3%) |
| 35 to 44 Years | 79 (78.2%) | 80 (60.2%) |
| 45 to 54 Years | 103 (93.6%) | 144 (83.7%) |
| 55 to 64 Years | 65 (63.1%) | 37 (74.0%) |
| 65 to 74 Years | 12 (35.3%) | 53 (42.4%) |
| 75 Years and over | 20 (45.5%) | 46 (100.0%) |
| Total | 396 (53.6%) | 551 (68.4%) |
Income Below Poverty Among Married-Couple Families in Ashland
The poverty statistics for married-couple families in Ashland show that 14.9% or 35 of the total 235 families live below the poverty line. Families with no children have the highest poverty rate of 22.7%, comprising of 32 families. On the other hand, families with 1 or 2 children have the lowest poverty rate of 0.0%, which includes 0 families.
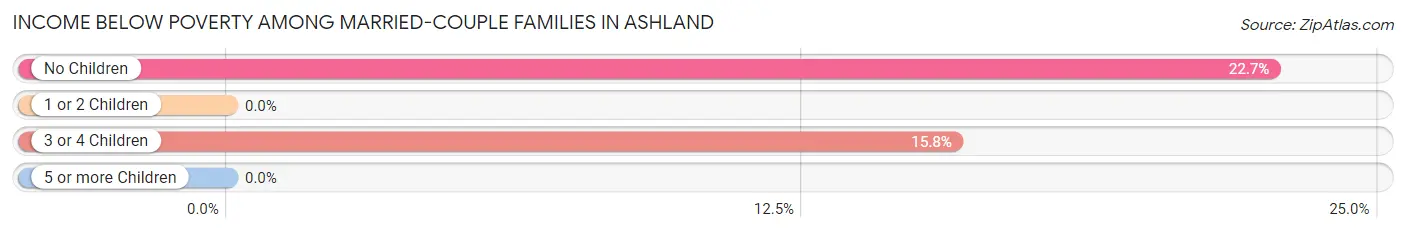
| Children | Above Poverty | Below Poverty |
| No Children | 109 (77.3%) | 32 (22.7%) |
| 1 or 2 Children | 75 (100.0%) | 0 (0.0%) |
| 3 or 4 Children | 16 (84.2%) | 3 (15.8%) |
| 5 or more Children | 0 (0.0%) | 0 (0.0%) |
| Total | 200 (85.1%) | 35 (14.9%) |
Income Below Poverty Among Single-Parent Households in Ashland
According to the poverty data in Ashland, 76.2% or 16 single-father households and 50.4% or 68 single-mother households are living below the poverty line. Among single-father households, those with no children have the highest poverty rate, with 16 households (76.2%) experiencing poverty. Likewise, among single-mother households, those with 3 or 4 children have the highest poverty rate, with 13 households (100.0%) falling below the poverty line.
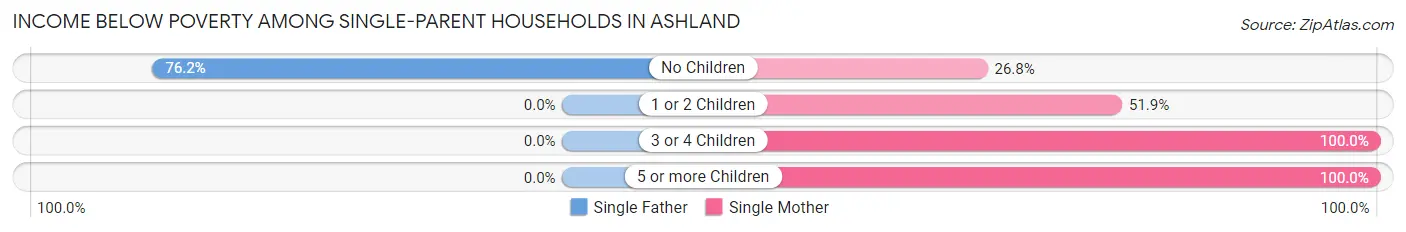
| Children | Single Father | Single Mother |
| No Children | 16 (76.2%) | 15 (26.8%) |
| 1 or 2 Children | 0 (0.0%) | 28 (51.8%) |
| 3 or 4 Children | 0 (0.0%) | 13 (100.0%) |
| 5 or more Children | 0 (0.0%) | 12 (100.0%) |
| Total | 16 (76.2%) | 68 (50.4%) |
Income Below Poverty Among Married-Couple vs Single-Parent Households in Ashland
The poverty data for Ashland shows that 35 of the married-couple family households (14.9%) and 84 of the single-parent households (53.8%) are living below the poverty level. Within the married-couple family households, those with no children have the highest poverty rate, with 32 households (22.7%) falling below the poverty line. Among the single-parent households, those with 3 or 4 children have the highest poverty rate, with 13 household (100.0%) living below poverty.
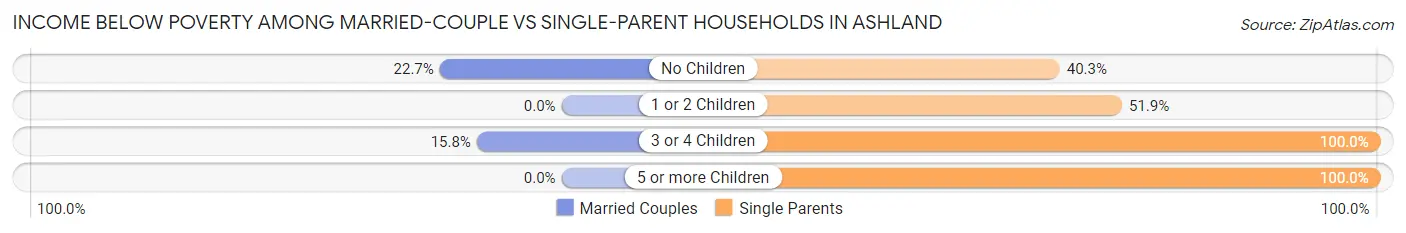
| Children | Married-Couple Families | Single-Parent Households |
| No Children | 32 (22.7%) | 31 (40.3%) |
| 1 or 2 Children | 0 (0.0%) | 28 (51.8%) |
| 3 or 4 Children | 3 (15.8%) | 13 (100.0%) |
| 5 or more Children | 0 (0.0%) | 12 (100.0%) |
| Total | 35 (14.9%) | 84 (53.8%) |
Race in Ashland
The most populous races in Ashland are White / Caucasian (1,217 | 72.7%), Black / African American (368 | 22.0%), and Two or more Races (81 | 4.8%).
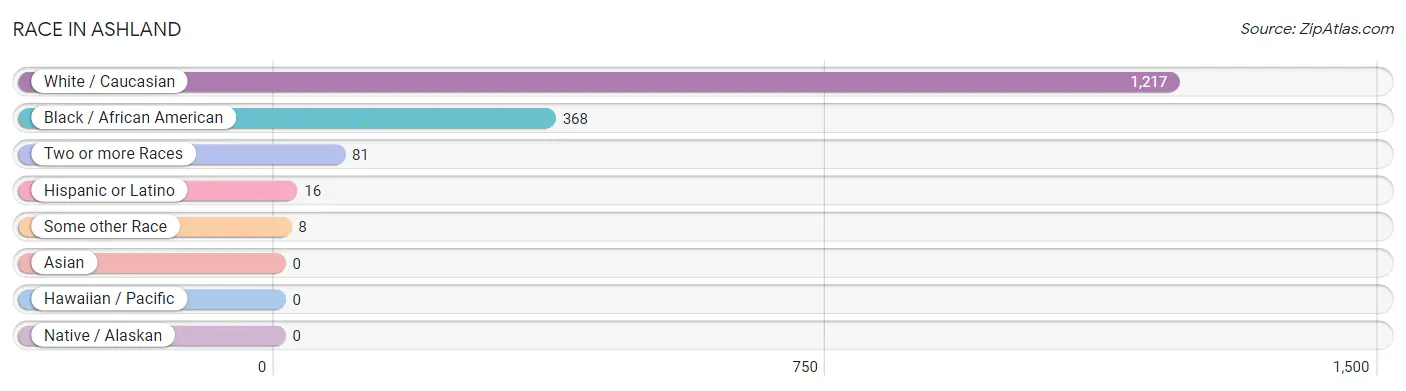
| Race | # Population | % Population |
| Asian | 0 | 0.0% |
| Black / African American | 368 | 22.0% |
| Hawaiian / Pacific | 0 | 0.0% |
| Hispanic or Latino | 16 | 1.0% |
| Native / Alaskan | 0 | 0.0% |
| White / Caucasian | 1,217 | 72.7% |
| Two or more Races | 81 | 4.8% |
| Some other Race | 8 | 0.5% |
| Total | 1,674 | 100.0% |
Ancestry in Ashland
The most populous ancestries reported in Ashland are American (400 | 23.9%), English (158 | 9.4%), Irish (40 | 2.4%), German (29 | 1.7%), and Scotch-Irish (25 | 1.5%), together accounting for 38.9% of all Ashland residents.
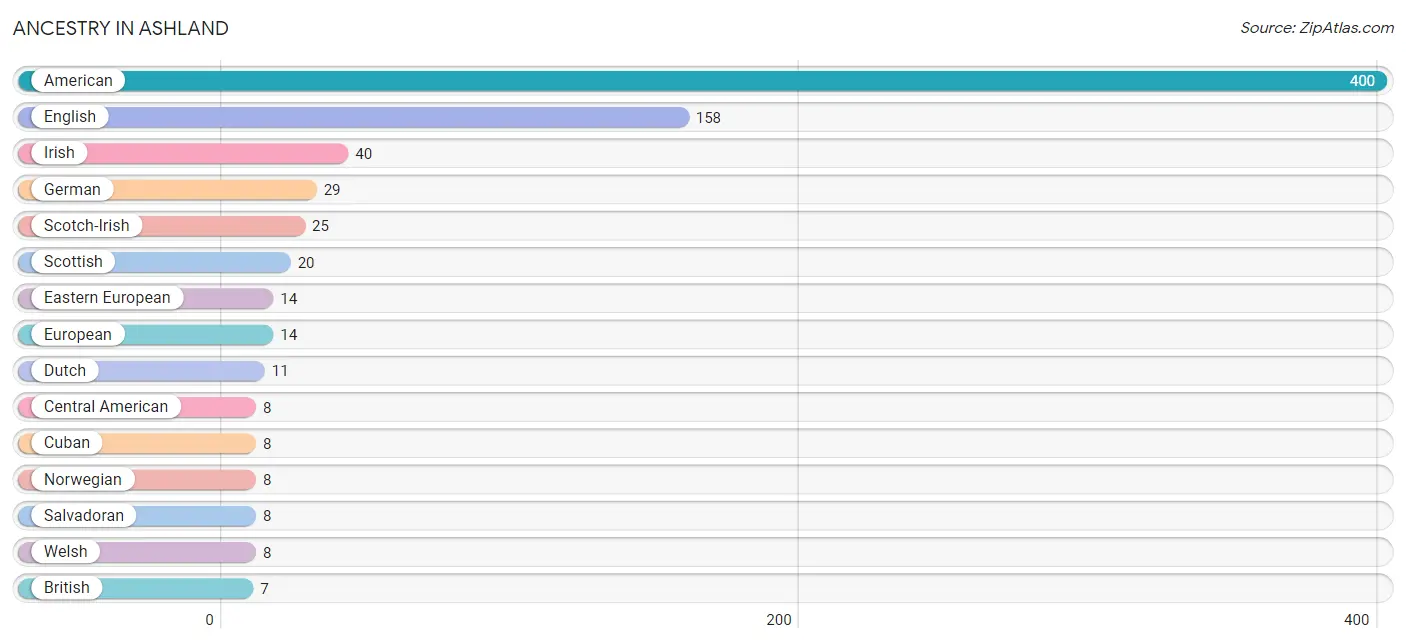
| Ancestry | # Population | % Population |
| African | 2 | 0.1% |
| American | 400 | 23.9% |
| British | 7 | 0.4% |
| Central American | 8 | 0.5% |
| Cuban | 8 | 0.5% |
| Dutch | 11 | 0.7% |
| Eastern European | 14 | 0.8% |
| English | 158 | 9.4% |
| European | 14 | 0.8% |
| German | 29 | 1.7% |
| Irish | 40 | 2.4% |
| Italian | 6 | 0.4% |
| Norwegian | 8 | 0.5% |
| Salvadoran | 8 | 0.5% |
| Scotch-Irish | 25 | 1.5% |
| Scottish | 20 | 1.2% |
| Subsaharan African | 2 | 0.1% |
| Swedish | 6 | 0.4% |
| Welsh | 8 | 0.5% | View All 19 Rows |
Immigrants in Ashland
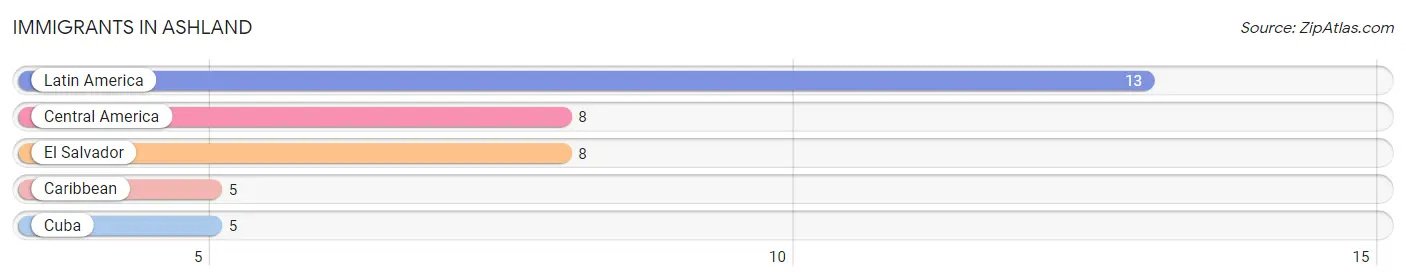
The most numerous immigrant groups reported in Ashland came from Latin America (13 | 0.8%), Central America (8 | 0.5%), El Salvador (8 | 0.5%), Caribbean (5 | 0.3%), and Cuba (5 | 0.3%), together accounting for 2.3% of all Ashland residents.
| Immigration Origin | # Population | % Population |
| Caribbean | 5 | 0.3% |
| Central America | 8 | 0.5% |
| Cuba | 5 | 0.3% |
| El Salvador | 8 | 0.5% |
| Latin America | 13 | 0.8% | View All 5 Rows |
Sex and Age in Ashland
Sex and Age in Ashland
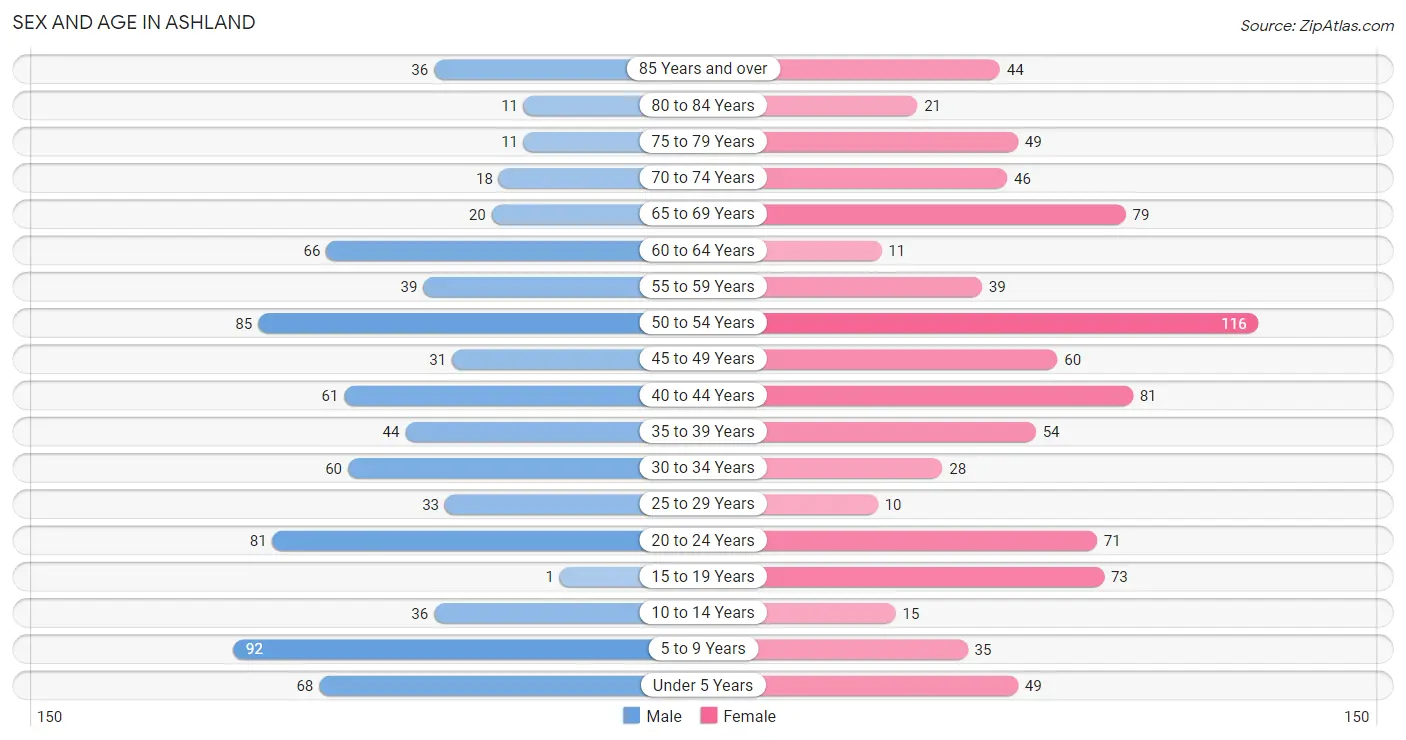
The most populous age groups in Ashland are 5 to 9 Years (92 | 11.6%) for men and 50 to 54 Years (116 | 13.2%) for women.
| Age Bracket | Male | Female |
| Under 5 Years | 68 (8.6%) | 49 (5.6%) |
| 5 to 9 Years | 92 (11.6%) | 35 (4.0%) |
| 10 to 14 Years | 36 (4.5%) | 15 (1.7%) |
| 15 to 19 Years | 1 (0.1%) | 73 (8.3%) |
| 20 to 24 Years | 81 (10.2%) | 71 (8.1%) |
| 25 to 29 Years | 33 (4.2%) | 10 (1.1%) |
| 30 to 34 Years | 60 (7.6%) | 28 (3.2%) |
| 35 to 39 Years | 44 (5.6%) | 54 (6.1%) |
| 40 to 44 Years | 61 (7.7%) | 81 (9.2%) |
| 45 to 49 Years | 31 (3.9%) | 60 (6.8%) |
| 50 to 54 Years | 85 (10.7%) | 116 (13.2%) |
| 55 to 59 Years | 39 (4.9%) | 39 (4.4%) |
| 60 to 64 Years | 66 (8.3%) | 11 (1.3%) |
| 65 to 69 Years | 20 (2.5%) | 79 (9.0%) |
| 70 to 74 Years | 18 (2.3%) | 46 (5.2%) |
| 75 to 79 Years | 11 (1.4%) | 49 (5.6%) |
| 80 to 84 Years | 11 (1.4%) | 21 (2.4%) |
| 85 Years and over | 36 (4.5%) | 44 (5.0%) |
| Total | 793 (100.0%) | 881 (100.0%) |
Families and Households in Ashland
Median Family Size in Ashland
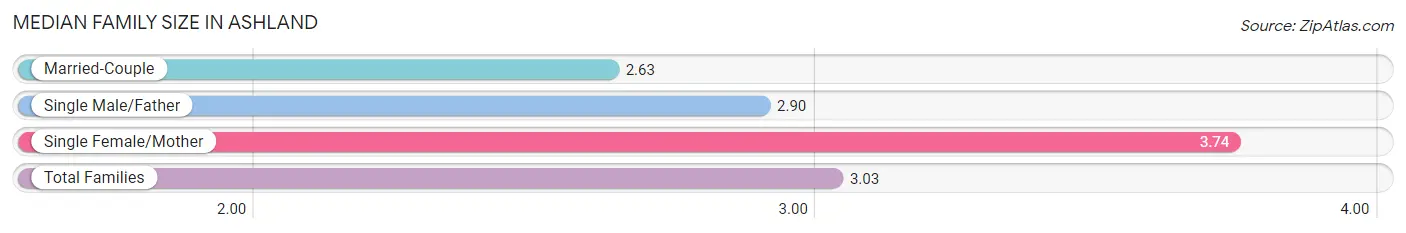
The median family size in Ashland is 3.03 persons per family, with single female/mother families (135 | 34.5%) accounting for the largest median family size of 3.74 persons per family. On the other hand, married-couple families (235 | 60.1%) represent the smallest median family size with 2.63 persons per family.
| Family Type | # Families | Family Size |
| Married-Couple | 235 (60.1%) | 2.63 |
| Single Male/Father | 21 (5.4%) | 2.90 |
| Single Female/Mother | 135 (34.5%) | 3.74 |
| Total Families | 391 (100.0%) | 3.03 |
Median Household Size in Ashland
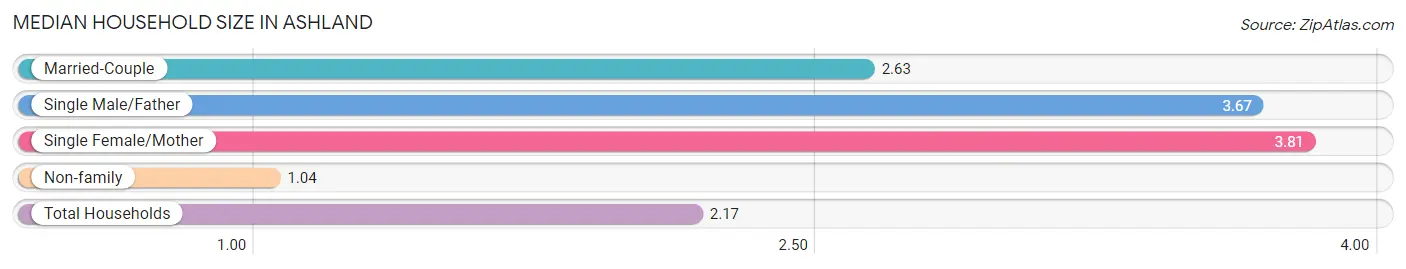
The median household size in Ashland is 2.17 persons per household, with single female/mother households (135 | 19.0%) accounting for the largest median household size of 3.81 persons per household. non-family households (318 | 44.9%) represent the smallest median household size with 1.04 persons per household.
| Household Type | # Households | Household Size |
| Married-Couple | 235 (33.2%) | 2.63 |
| Single Male/Father | 21 (3.0%) | 3.67 |
| Single Female/Mother | 135 (19.0%) | 3.81 |
| Non-family | 318 (44.9%) | 1.04 |
| Total Households | 709 (100.0%) | 2.17 |
Household Size by Marriage Status in Ashland
Out of a total of 709 households in Ashland, 391 (55.1%) are family households, while 318 (44.9%) are nonfamily households. The most numerous type of family households are 2-person households, comprising 192, and the most common type of nonfamily households are 1-person households, comprising 303.
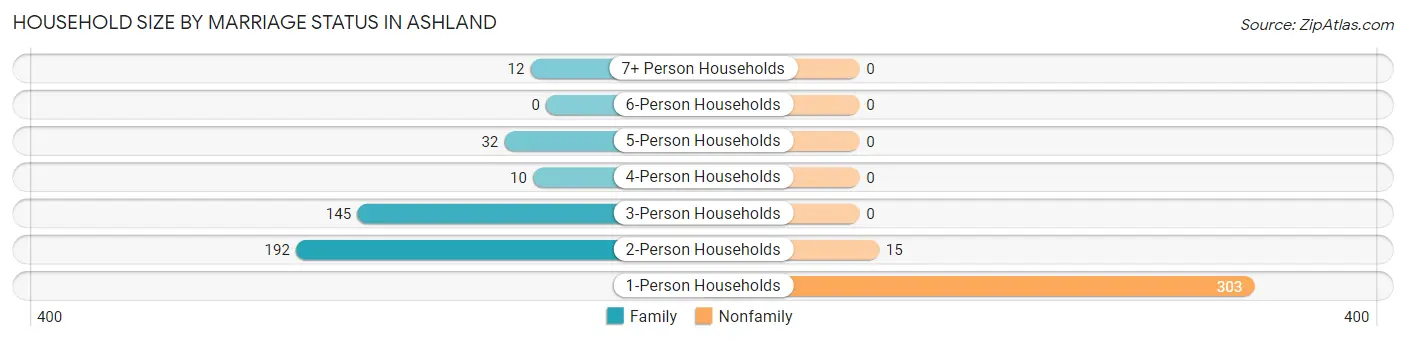
| Household Size | Family Households | Nonfamily Households |
| 1-Person Households | - | 303 (42.7%) |
| 2-Person Households | 192 (27.1%) | 15 (2.1%) |
| 3-Person Households | 145 (20.4%) | 0 (0.0%) |
| 4-Person Households | 10 (1.4%) | 0 (0.0%) |
| 5-Person Households | 32 (4.5%) | 0 (0.0%) |
| 6-Person Households | 0 (0.0%) | 0 (0.0%) |
| 7+ Person Households | 12 (1.7%) | 0 (0.0%) |
| Total | 391 (55.1%) | 318 (44.9%) |
Female Fertility in Ashland
Fertility by Age in Ashland
Average fertility rate in Ashland is 39.0 births per 1,000 women. Women in the age bracket of 20 to 34 years have the highest fertility rate with 101.0 births per 1,000 women. Women in the age bracket of 20 to 34 years acount for 68.8% of all women with births.
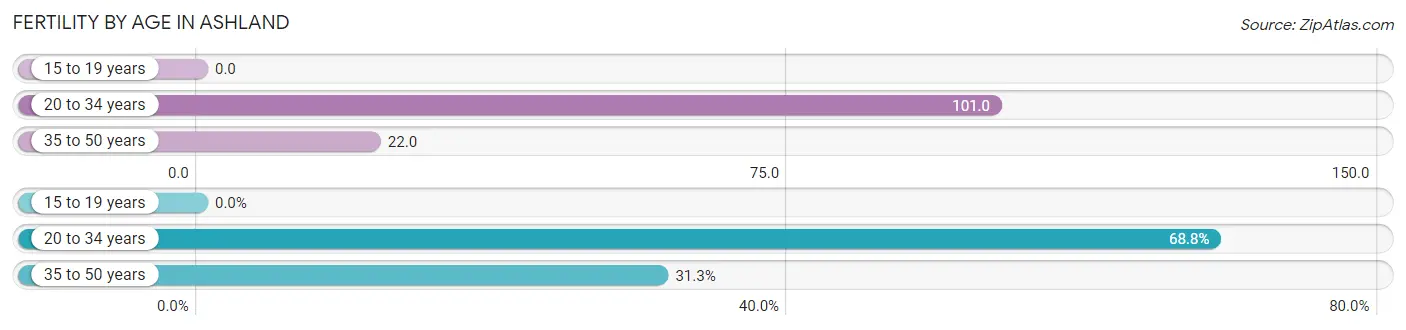
| Age Bracket | Women with Births | Births / 1,000 Women |
| 15 to 19 years | 0 (0.0%) | 0.0 |
| 20 to 34 years | 11 (68.8%) | 101.0 |
| 35 to 50 years | 5 (31.2%) | 22.0 |
| Total | 16 (100.0%) | 39.0 |
Fertility by Age by Marriage Status in Ashland
87.5% of women with births (16) in Ashland are married. The highest percentage of unmarried women with births falls into 20 to 34 years age bracket with 18.2% of them unmarried at the time of birth, while the lowest percentage of unmarried women with births belong to 35 to 50 years age bracket with 0.0% of them unmarried.
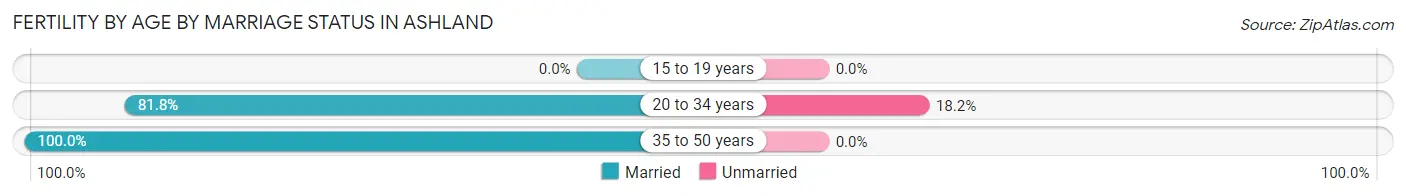
| Age Bracket | Married | Unmarried |
| 15 to 19 years | 0 (0.0%) | 0 (0.0%) |
| 20 to 34 years | 9 (81.8%) | 2 (18.2%) |
| 35 to 50 years | 5 (100.0%) | 0 (0.0%) |
| Total | 14 (87.5%) | 2 (12.5%) |
Fertility by Education in Ashland
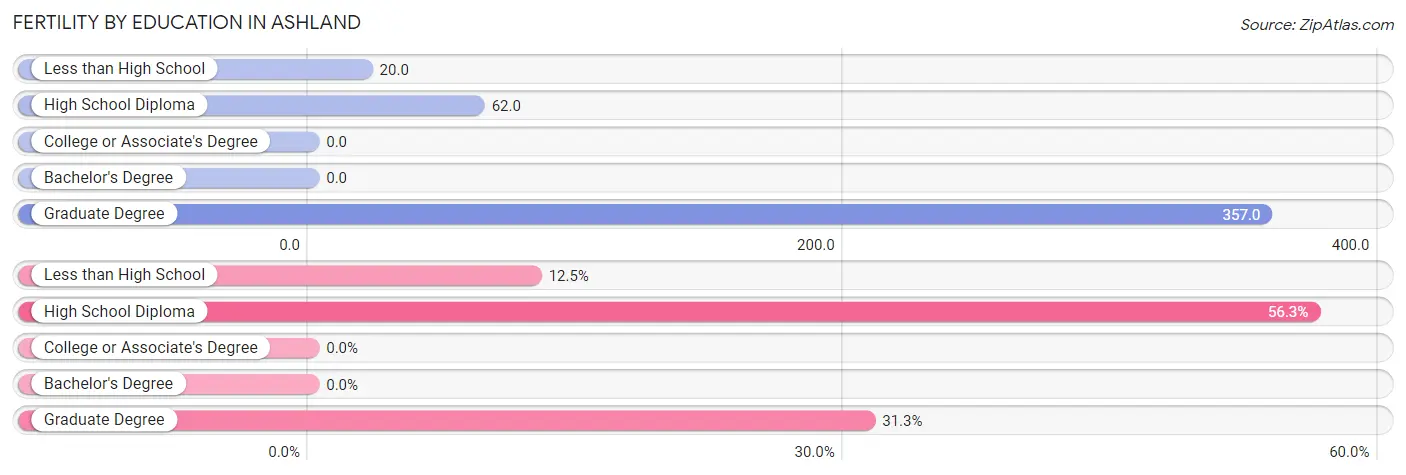
| Educational Attainment | Women with Births | Births / 1,000 Women |
| Less than High School | 2 (12.5%) | 20.0 |
| High School Diploma | 9 (56.2%) | 62.0 |
| College or Associate's Degree | 0 (0.0%) | 0.0 |
| Bachelor's Degree | 0 (0.0%) | 0.0 |
| Graduate Degree | 5 (31.2%) | 357.0 |
| Total | 16 (100.0%) | 39.0 |
Fertility by Education by Marriage Status in Ashland
12.5% of women with births in Ashland are unmarried. Women with the educational attainment of high school diploma are most likely to be married with 100.0% of them married at childbirth, while women with the educational attainment of less than high school are least likely to be married with 100.0% of them unmarried at childbirth.
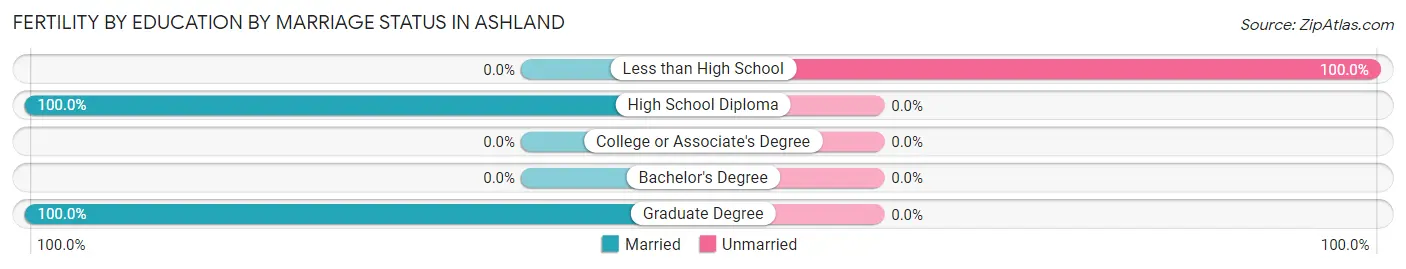
| Educational Attainment | Married | Unmarried |
| Less than High School | 0 (0.0%) | 2 (100.0%) |
| High School Diploma | 9 (100.0%) | 0 (0.0%) |
| College or Associate's Degree | 0 (0.0%) | 0 (0.0%) |
| Bachelor's Degree | 0 (0.0%) | 0 (0.0%) |
| Graduate Degree | 5 (100.0%) | 0 (0.0%) |
| Total | 14 (87.5%) | 2 (12.5%) |
Employment Characteristics in Ashland
Employment by Class of Employer in Ashland
Among the 554 employed individuals in Ashland, private company employees (374 | 67.5%), self-employed (not incorporated) (67 | 12.1%), and not-for-profit organizations (60 | 10.8%) make up the most common classes of employment.
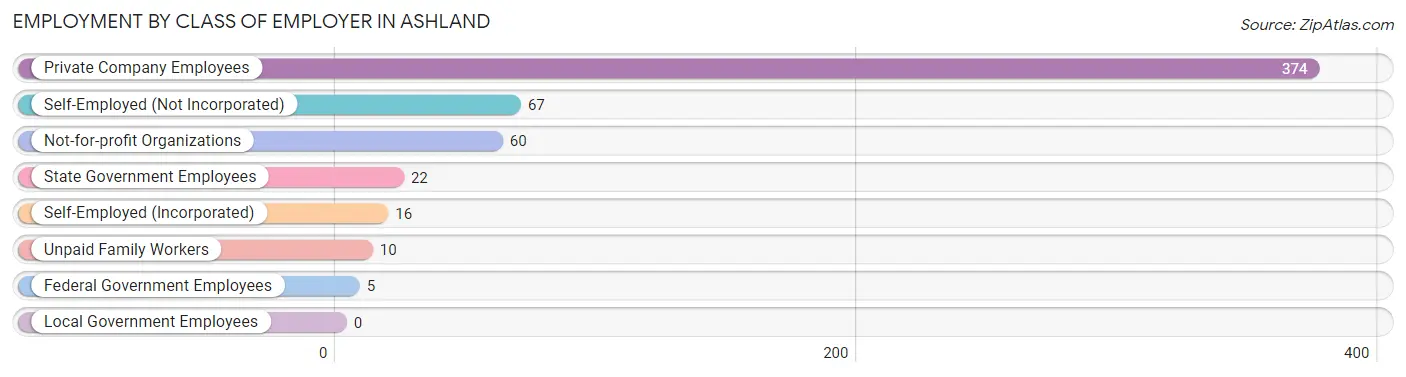
| Employer Class | # Employees | % Employees |
| Private Company Employees | 374 | 67.5% |
| Self-Employed (Incorporated) | 16 | 2.9% |
| Self-Employed (Not Incorporated) | 67 | 12.1% |
| Not-for-profit Organizations | 60 | 10.8% |
| Local Government Employees | 0 | 0.0% |
| State Government Employees | 22 | 4.0% |
| Federal Government Employees | 5 | 0.9% |
| Unpaid Family Workers | 10 | 1.8% |
| Total | 554 | 100.0% |
Employment Status by Age in Ashland
According to the labor force statistics for Ashland, out of the total population over 16 years of age (1,379), 44.1% or 608 individuals are in the labor force, with 8.9% or 54 of them unemployed. The age group with the highest labor force participation rate is 45 to 54 years, with 74.3% or 217 individuals in the labor force. Within the labor force, the 20 to 24 years age range has the highest percentage of unemployed individuals, with 45.1% or 32 of them being unemployed.
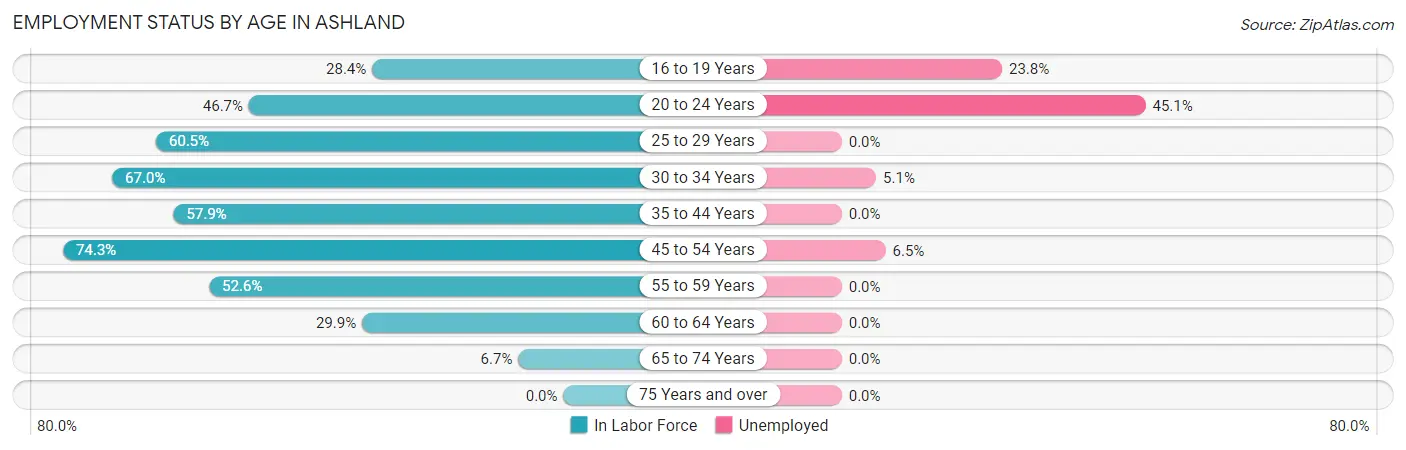
| Age Bracket | In Labor Force | Unemployed |
| 16 to 19 Years | 21 (28.4%) | 5 (23.8%) |
| 20 to 24 Years | 71 (46.7%) | 32 (45.1%) |
| 25 to 29 Years | 26 (60.5%) | 0 (0.0%) |
| 30 to 34 Years | 59 (67.0%) | 3 (5.1%) |
| 35 to 44 Years | 139 (57.9%) | 0 (0.0%) |
| 45 to 54 Years | 217 (74.3%) | 14 (6.5%) |
| 55 to 59 Years | 41 (52.6%) | 0 (0.0%) |
| 60 to 64 Years | 23 (29.9%) | 0 (0.0%) |
| 65 to 74 Years | 11 (6.7%) | 0 (0.0%) |
| 75 Years and over | 0 (0.0%) | 0 (0.0%) |
| Total | 608 (44.1%) | 54 (8.9%) |
Employment Status by Educational Attainment in Ashland
According to labor force statistics for Ashland, 61.7% of individuals (505) out of the total population between 25 and 64 years of age (818) are in the labor force, with 3.4% or 17 of them being unemployed. The group with the highest labor force participation rate are those with the educational attainment of bachelor's degree or higher, with 85.3% or 139 individuals in the labor force. Within the labor force, individuals with high school diploma education have the highest percentage of unemployment, with 9.7% or 14 of them being unemployed.
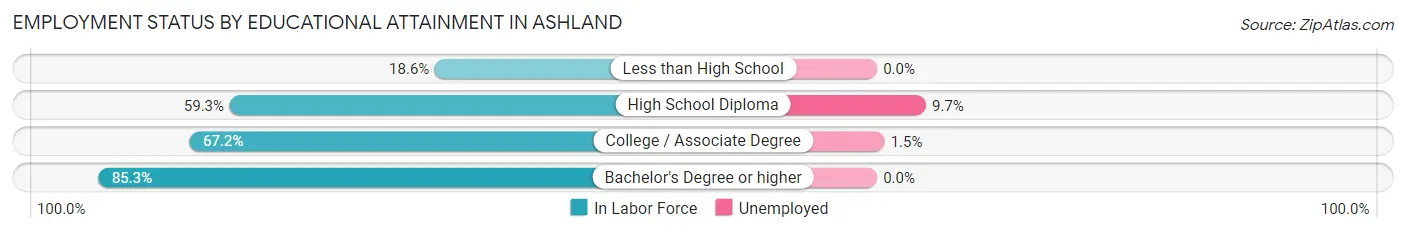
| Educational Attainment | In Labor Force | Unemployed |
| Less than High School | 21 (18.6%) | 0 (0.0%) |
| High School Diploma | 144 (59.3%) | 24 (9.7%) |
| College / Associate Degree | 201 (67.2%) | 4 (1.5%) |
| Bachelor's Degree or higher | 139 (85.3%) | 0 (0.0%) |
| Total | 505 (61.7%) | 28 (3.4%) |
Employment Occupations by Sex in Ashland
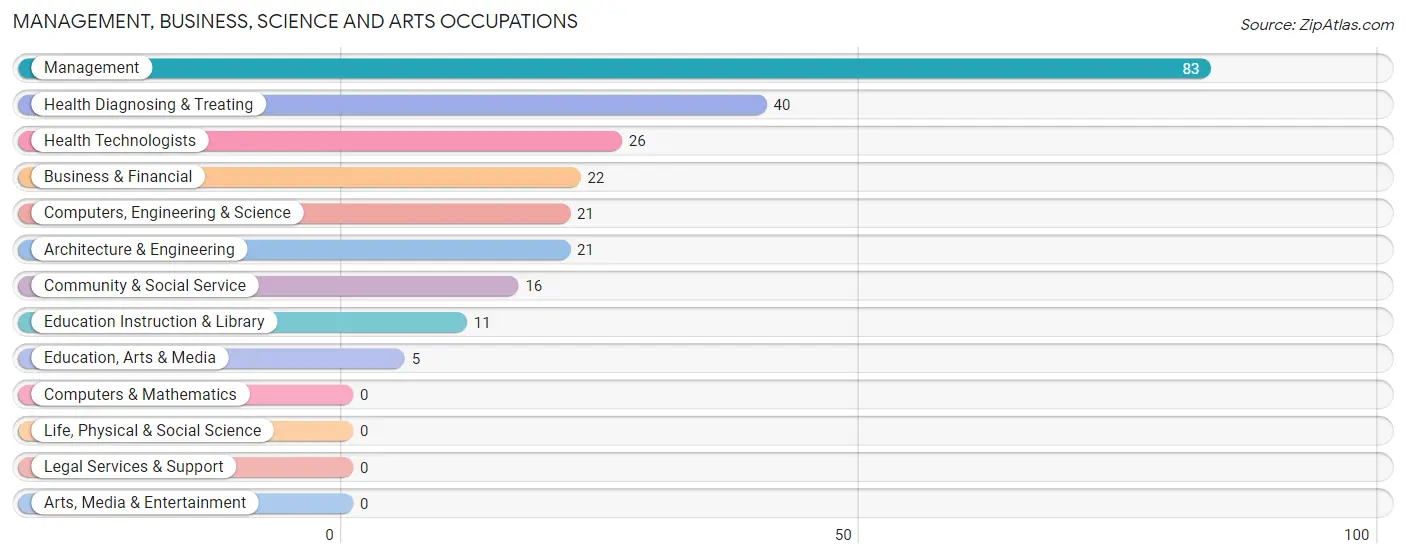
Management, Business, Science and Arts Occupations
The most common Management, Business, Science and Arts occupations in Ashland are Management (83 | 15.0%), Health Diagnosing & Treating (40 | 7.2%), Health Technologists (26 | 4.7%), Business & Financial (22 | 4.0%), and Computers, Engineering & Science (21 | 3.8%).
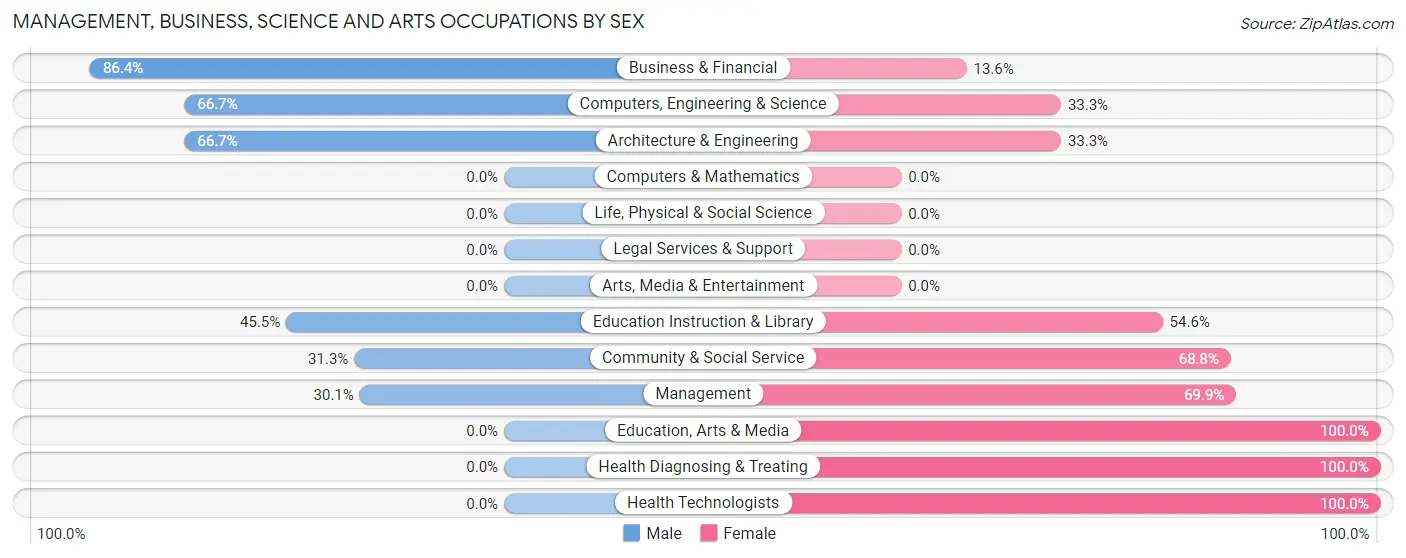
Management, Business, Science and Arts Occupations by Sex
Within the Management, Business, Science and Arts occupations in Ashland, the most male-oriented occupations are Business & Financial (86.4%), Computers, Engineering & Science (66.7%), and Architecture & Engineering (66.7%), while the most female-oriented occupations are Education, Arts & Media (100.0%), Health Diagnosing & Treating (100.0%), and Health Technologists (100.0%).
| Occupation | Male | Female |
| Management | 25 (30.1%) | 58 (69.9%) |
| Business & Financial | 19 (86.4%) | 3 (13.6%) |
| Computers, Engineering & Science | 14 (66.7%) | 7 (33.3%) |
| Computers & Mathematics | 0 (0.0%) | 0 (0.0%) |
| Architecture & Engineering | 14 (66.7%) | 7 (33.3%) |
| Life, Physical & Social Science | 0 (0.0%) | 0 (0.0%) |
| Community & Social Service | 5 (31.2%) | 11 (68.8%) |
| Education, Arts & Media | 0 (0.0%) | 5 (100.0%) |
| Legal Services & Support | 0 (0.0%) | 0 (0.0%) |
| Education Instruction & Library | 5 (45.5%) | 6 (54.5%) |
| Arts, Media & Entertainment | 0 (0.0%) | 0 (0.0%) |
| Health Diagnosing & Treating | 0 (0.0%) | 40 (100.0%) |
| Health Technologists | 0 (0.0%) | 26 (100.0%) |
| Total (Category) | 63 (34.6%) | 119 (65.4%) |
| Total (Overall) | 238 (43.0%) | 316 (57.0%) |
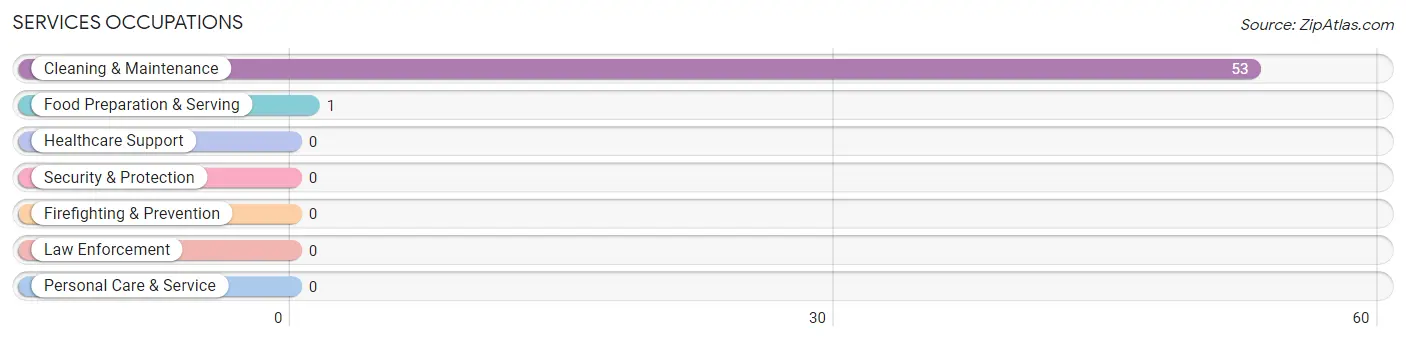
Services Occupations
The most common Services occupations in Ashland are Cleaning & Maintenance (53 | 9.6%), and Food Preparation & Serving (1 | 0.2%).
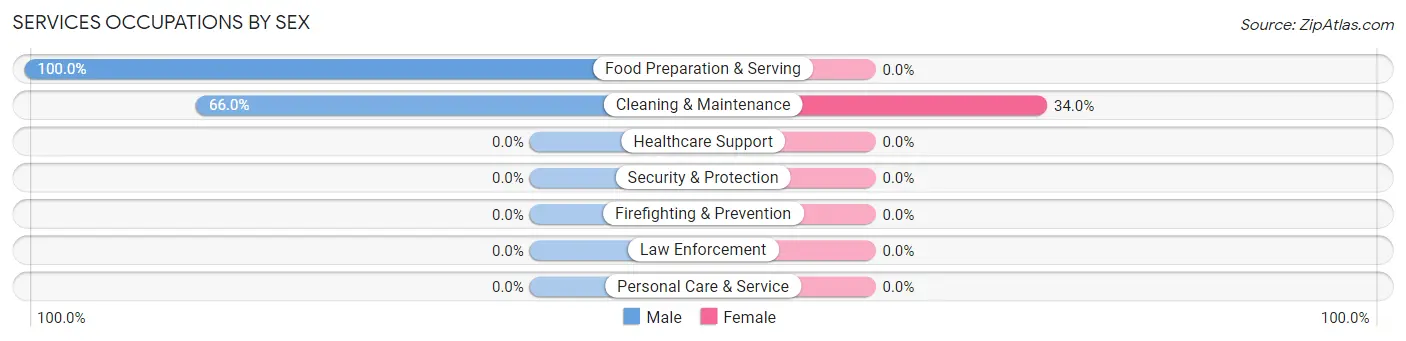
Services Occupations by Sex
| Occupation | Male | Female |
| Healthcare Support | 0 (0.0%) | 0 (0.0%) |
| Security & Protection | 0 (0.0%) | 0 (0.0%) |
| Firefighting & Prevention | 0 (0.0%) | 0 (0.0%) |
| Law Enforcement | 0 (0.0%) | 0 (0.0%) |
| Food Preparation & Serving | 1 (100.0%) | 0 (0.0%) |
| Cleaning & Maintenance | 35 (66.0%) | 18 (34.0%) |
| Personal Care & Service | 0 (0.0%) | 0 (0.0%) |
| Total (Category) | 36 (66.7%) | 18 (33.3%) |
| Total (Overall) | 238 (43.0%) | 316 (57.0%) |
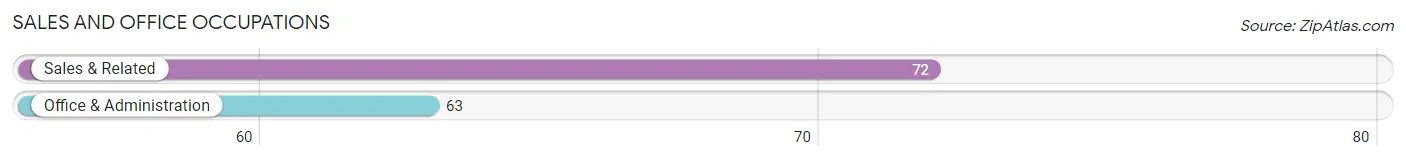
Sales and Office Occupations
The most common Sales and Office occupations in Ashland are Sales & Related (72 | 13.0%), and Office & Administration (63 | 11.4%).
Sales and Office Occupations by Sex

| Occupation | Male | Female |
| Sales & Related | 72 (100.0%) | 0 (0.0%) |
| Office & Administration | 9 (14.3%) | 54 (85.7%) |
| Total (Category) | 81 (60.0%) | 54 (40.0%) |
| Total (Overall) | 238 (43.0%) | 316 (57.0%) |
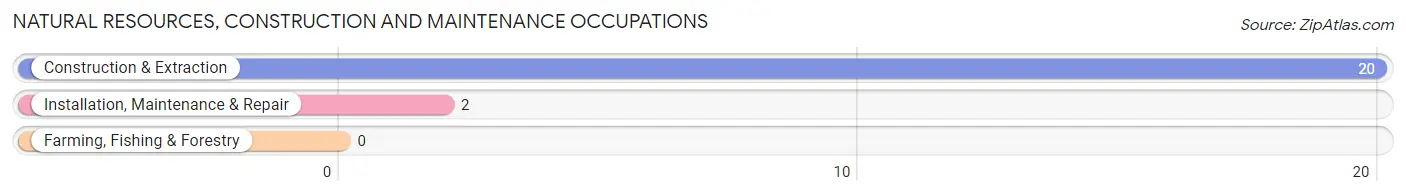
Natural Resources, Construction and Maintenance Occupations
The most common Natural Resources, Construction and Maintenance occupations in Ashland are Construction & Extraction (20 | 3.6%), and Installation, Maintenance & Repair (2 | 0.4%).
Natural Resources, Construction and Maintenance Occupations by Sex
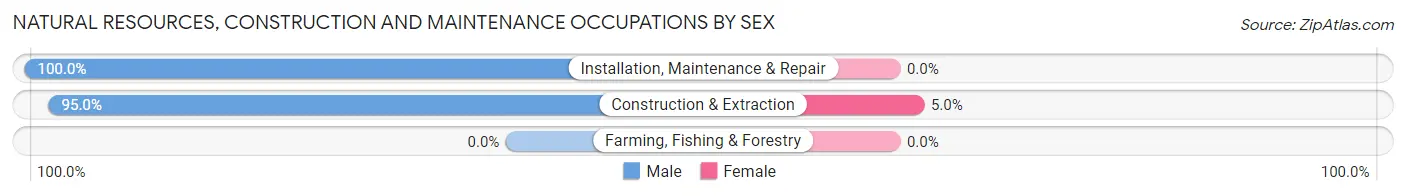
| Occupation | Male | Female |
| Farming, Fishing & Forestry | 0 (0.0%) | 0 (0.0%) |
| Construction & Extraction | 19 (95.0%) | 1 (5.0%) |
| Installation, Maintenance & Repair | 2 (100.0%) | 0 (0.0%) |
| Total (Category) | 21 (95.5%) | 1 (4.5%) |
| Total (Overall) | 238 (43.0%) | 316 (57.0%) |
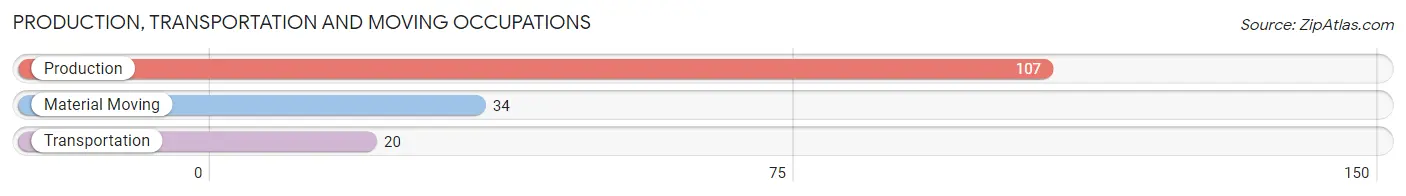
Production, Transportation and Moving Occupations
The most common Production, Transportation and Moving occupations in Ashland are Production (107 | 19.3%), Material Moving (34 | 6.1%), and Transportation (20 | 3.6%).
Production, Transportation and Moving Occupations by Sex
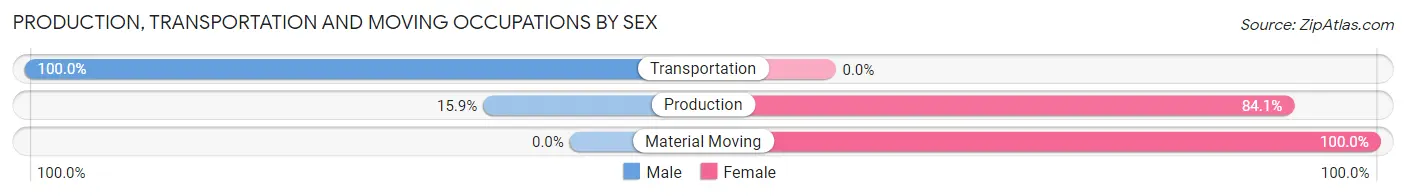
| Occupation | Male | Female |
| Production | 17 (15.9%) | 90 (84.1%) |
| Transportation | 20 (100.0%) | 0 (0.0%) |
| Material Moving | 0 (0.0%) | 34 (100.0%) |
| Total (Category) | 37 (23.0%) | 124 (77.0%) |
| Total (Overall) | 238 (43.0%) | 316 (57.0%) |
Employment Industries by Sex in Ashland
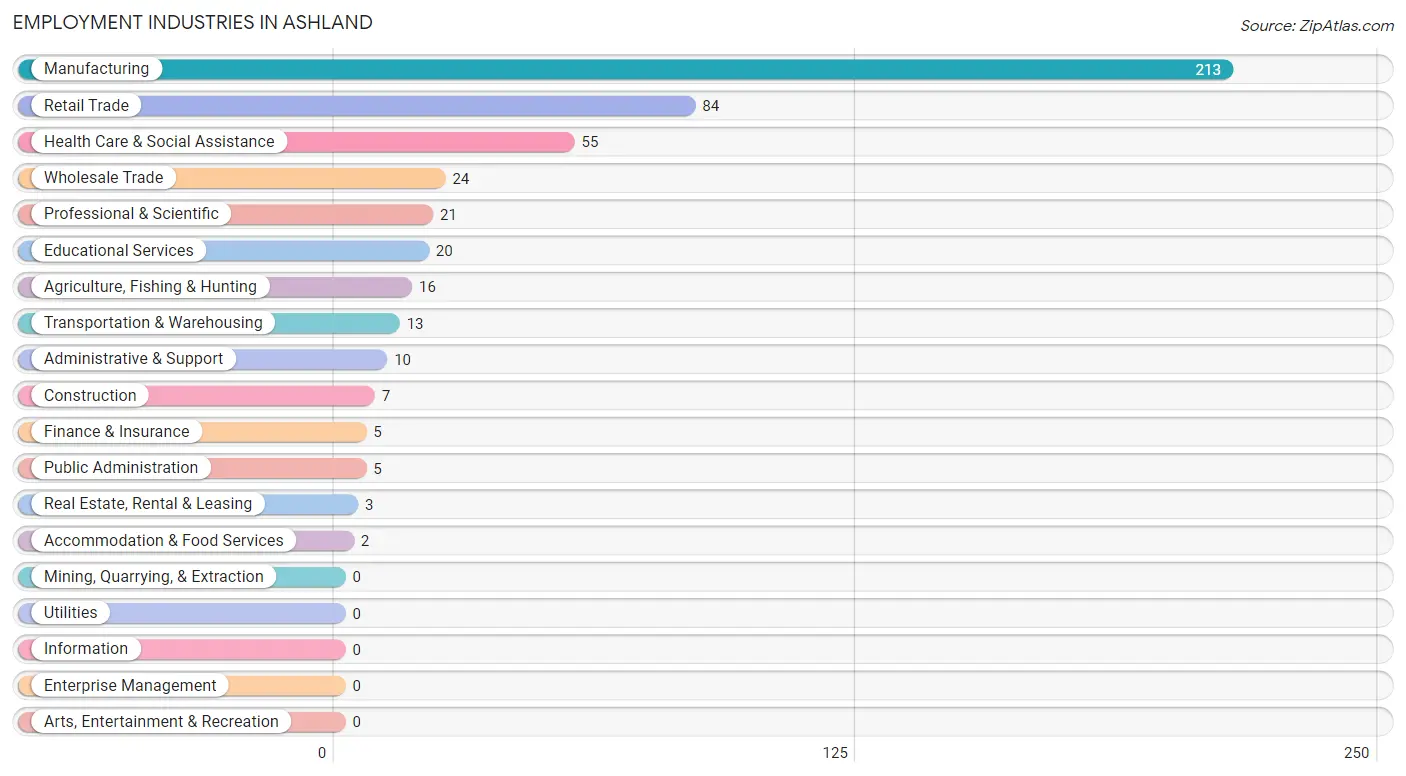
Employment Industries in Ashland
The major employment industries in Ashland include Manufacturing (213 | 38.5%), Retail Trade (84 | 15.2%), Health Care & Social Assistance (55 | 9.9%), Wholesale Trade (24 | 4.3%), and Professional & Scientific (21 | 3.8%).
Employment Industries by Sex in Ashland
The Ashland industries that see more men than women are Agriculture, Fishing & Hunting (100.0%), Construction (100.0%), and Transportation & Warehousing (100.0%), whereas the industries that tend to have a higher number of women are Wholesale Trade (100.0%), Real Estate, Rental & Leasing (100.0%), and Administrative & Support (100.0%).
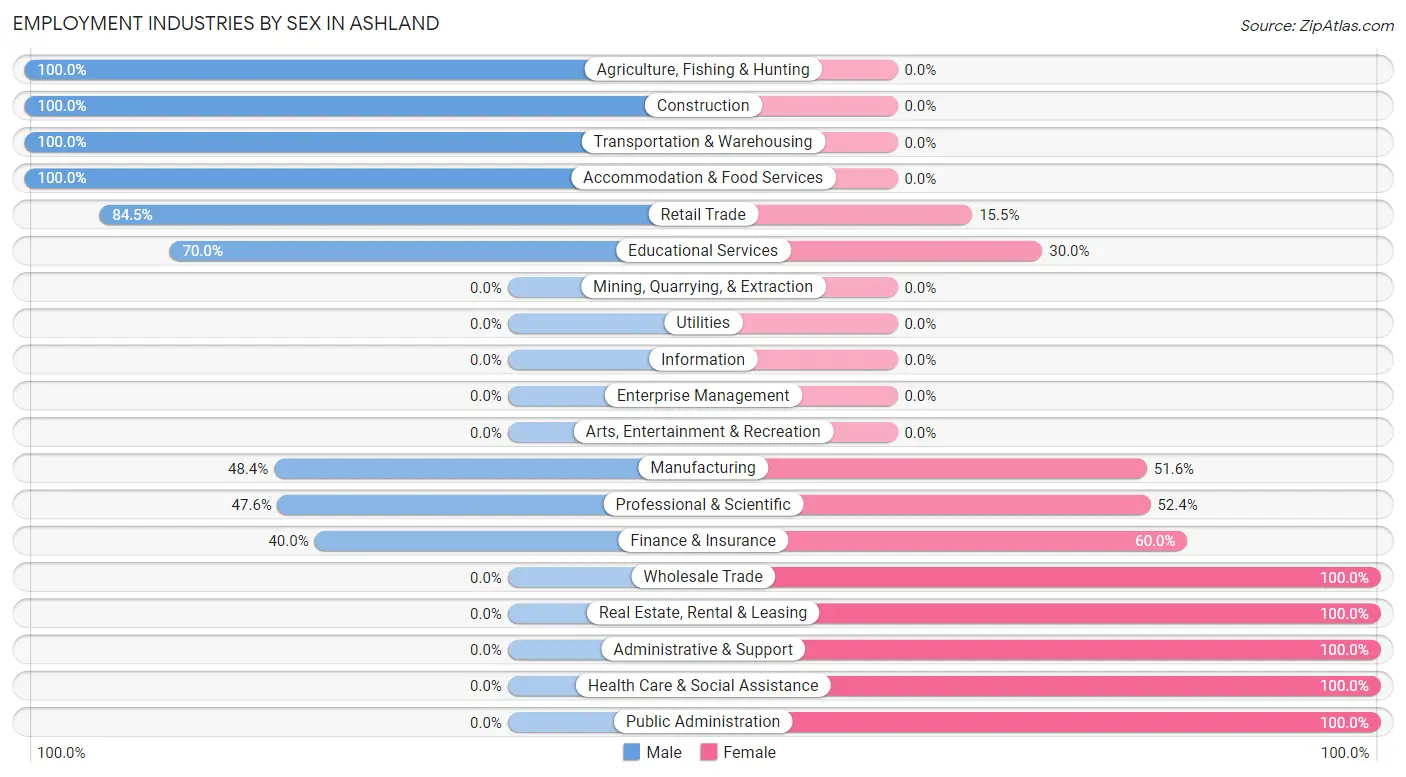
| Industry | Male | Female |
| Agriculture, Fishing & Hunting | 16 (100.0%) | 0 (0.0%) |
| Mining, Quarrying, & Extraction | 0 (0.0%) | 0 (0.0%) |
| Construction | 7 (100.0%) | 0 (0.0%) |
| Manufacturing | 103 (48.4%) | 110 (51.6%) |
| Wholesale Trade | 0 (0.0%) | 24 (100.0%) |
| Retail Trade | 71 (84.5%) | 13 (15.5%) |
| Transportation & Warehousing | 13 (100.0%) | 0 (0.0%) |
| Utilities | 0 (0.0%) | 0 (0.0%) |
| Information | 0 (0.0%) | 0 (0.0%) |
| Finance & Insurance | 2 (40.0%) | 3 (60.0%) |
| Real Estate, Rental & Leasing | 0 (0.0%) | 3 (100.0%) |
| Professional & Scientific | 10 (47.6%) | 11 (52.4%) |
| Enterprise Management | 0 (0.0%) | 0 (0.0%) |
| Administrative & Support | 0 (0.0%) | 10 (100.0%) |
| Educational Services | 14 (70.0%) | 6 (30.0%) |
| Health Care & Social Assistance | 0 (0.0%) | 55 (100.0%) |
| Arts, Entertainment & Recreation | 0 (0.0%) | 0 (0.0%) |
| Accommodation & Food Services | 2 (100.0%) | 0 (0.0%) |
| Public Administration | 0 (0.0%) | 5 (100.0%) |
| Total | 238 (43.0%) | 316 (57.0%) |
Education in Ashland
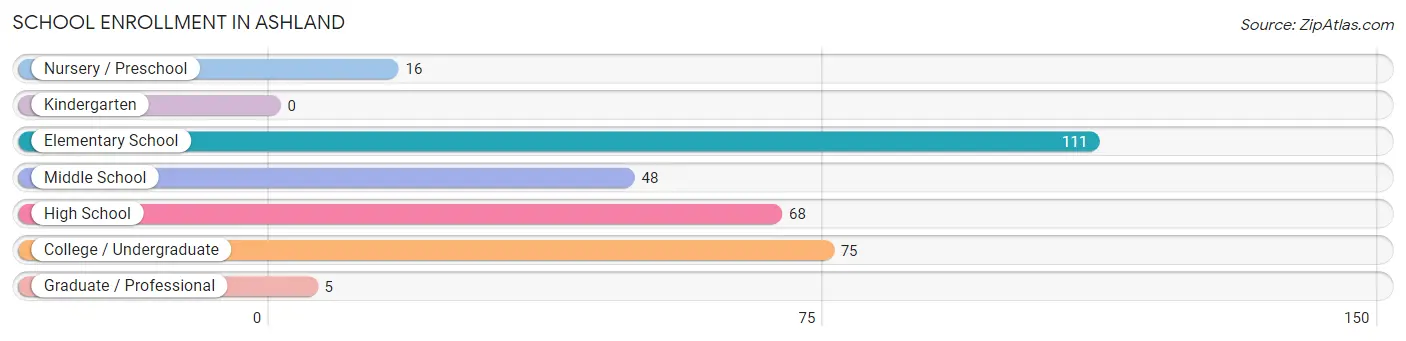
School Enrollment in Ashland
The most common levels of schooling among the 323 students in Ashland are elementary school (111 | 34.4%), college / undergraduate (75 | 23.2%), and high school (68 | 21.0%).
| School Level | # Students | % Students |
| Nursery / Preschool | 16 | 5.0% |
| Kindergarten | 0 | 0.0% |
| Elementary School | 111 | 34.4% |
| Middle School | 48 | 14.9% |
| High School | 68 | 21.0% |
| College / Undergraduate | 75 | 23.2% |
| Graduate / Professional | 5 | 1.5% |
| Total | 323 | 100.0% |
School Enrollment by Age by Funding Source in Ashland
Out of a total of 323 students who are enrolled in schools in Ashland, 12 (3.7%) attend a private institution, while the remaining 311 (96.3%) are enrolled in public schools. The age group of 3 to 4 year olds has the highest likelihood of being enrolled in private schools, with 12 (75.0% in the age bracket) enrolled. Conversely, the age group of 5 to 9 year old has the lowest likelihood of being enrolled in a private school, with 108 (100.0% in the age bracket) attending a public institution.
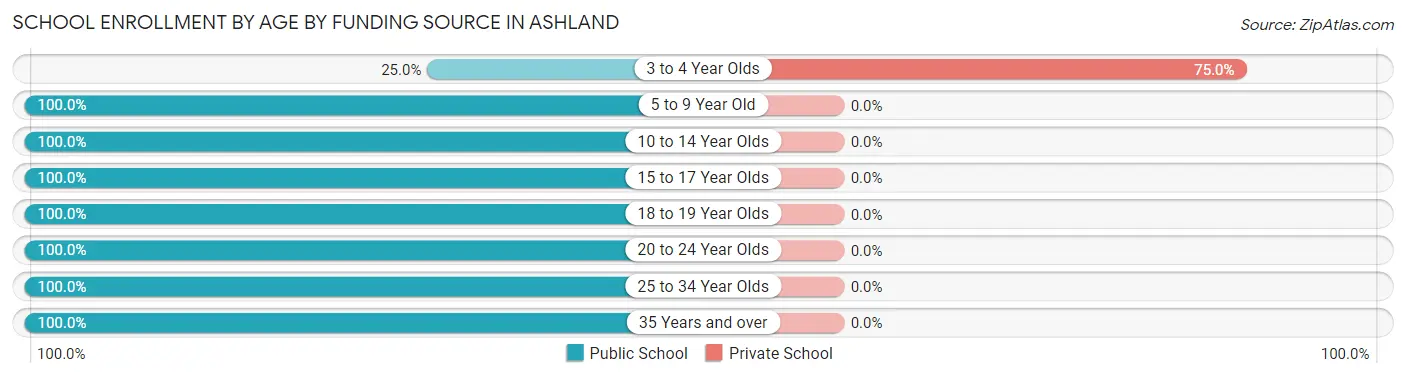
| Age Bracket | Public School | Private School |
| 3 to 4 Year Olds | 4 (25.0%) | 12 (75.0%) |
| 5 to 9 Year Old | 108 (100.0%) | 0 (0.0%) |
| 10 to 14 Year Olds | 51 (100.0%) | 0 (0.0%) |
| 15 to 17 Year Olds | 58 (100.0%) | 0 (0.0%) |
| 18 to 19 Year Olds | 15 (100.0%) | 0 (0.0%) |
| 20 to 24 Year Olds | 40 (100.0%) | 0 (0.0%) |
| 25 to 34 Year Olds | 14 (100.0%) | 0 (0.0%) |
| 35 Years and over | 21 (100.0%) | 0 (0.0%) |
| Total | 311 (96.3%) | 12 (3.7%) |
Educational Attainment by Field of Study in Ashland
Education (90 | 47.1%), business (44 | 23.0%), science & technology (24 | 12.6%), arts & humanities (14 | 7.3%), and computers & mathematics (6 | 3.1%) are the most common fields of study among 191 individuals in Ashland who have obtained a bachelor's degree or higher.
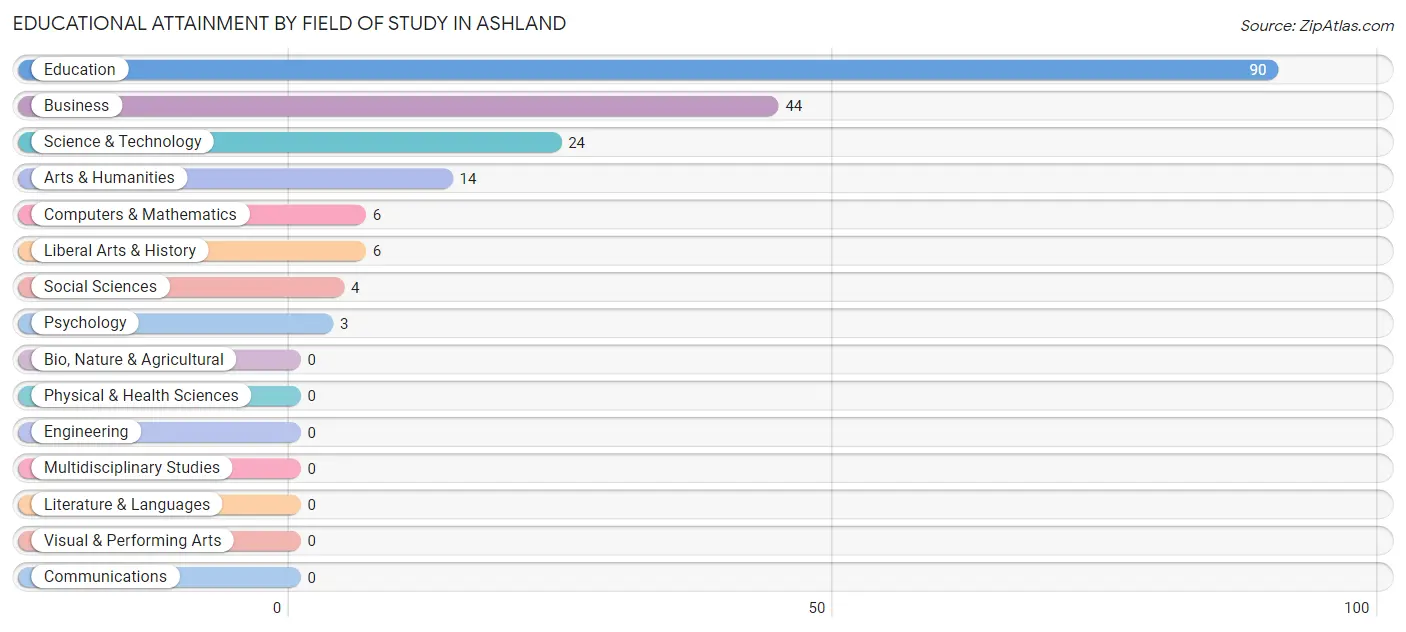
| Field of Study | # Graduates | % Graduates |
| Computers & Mathematics | 6 | 3.1% |
| Bio, Nature & Agricultural | 0 | 0.0% |
| Physical & Health Sciences | 0 | 0.0% |
| Psychology | 3 | 1.6% |
| Social Sciences | 4 | 2.1% |
| Engineering | 0 | 0.0% |
| Multidisciplinary Studies | 0 | 0.0% |
| Science & Technology | 24 | 12.6% |
| Business | 44 | 23.0% |
| Education | 90 | 47.1% |
| Literature & Languages | 0 | 0.0% |
| Liberal Arts & History | 6 | 3.1% |
| Visual & Performing Arts | 0 | 0.0% |
| Communications | 0 | 0.0% |
| Arts & Humanities | 14 | 7.3% |
| Total | 191 | 100.0% |
Transportation & Commute in Ashland
Vehicle Availability by Sex in Ashland
The most prevalent vehicle ownership categories in Ashland are males with 2 vehicles (77, accounting for 32.4%) and females with 2 vehicles (103, making up 24.4%).
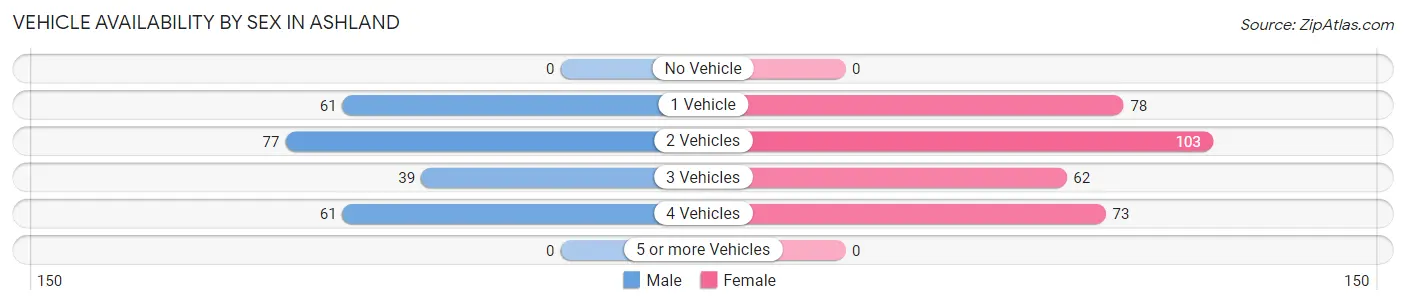
| Vehicles Available | Male | Female |
| No Vehicle | 0 (0.0%) | 0 (0.0%) |
| 1 Vehicle | 61 (25.6%) | 78 (24.7%) |
| 2 Vehicles | 77 (32.4%) | 103 (32.6%) |
| 3 Vehicles | 39 (16.4%) | 62 (19.6%) |
| 4 Vehicles | 61 (25.6%) | 73 (23.1%) |
| 5 or more Vehicles | 0 (0.0%) | 0 (0.0%) |
| Total | 238 (100.0%) | 316 (100.0%) |
Commute Time in Ashland
The most frequently occuring commute durations in Ashland are 5 to 9 minutes (132 commuters, 23.8%), less than 5 minutes (94 commuters, 17.0%), and 40 to 44 minutes (77 commuters, 13.9%).
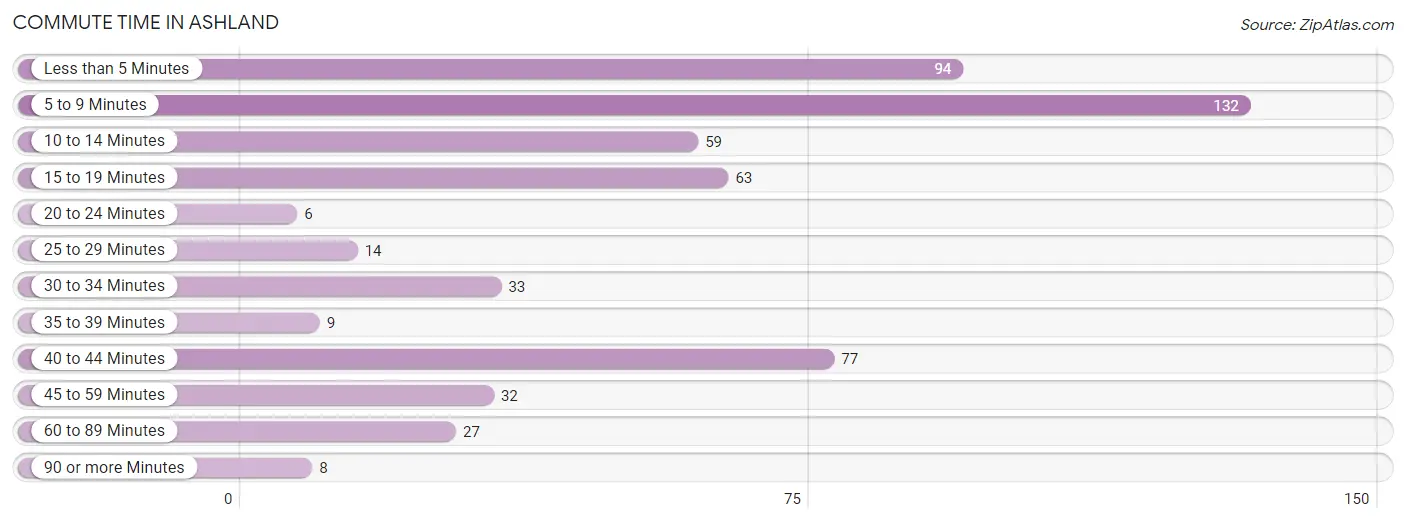
| Commute Time | # Commuters | % Commuters |
| Less than 5 Minutes | 94 | 17.0% |
| 5 to 9 Minutes | 132 | 23.8% |
| 10 to 14 Minutes | 59 | 10.6% |
| 15 to 19 Minutes | 63 | 11.4% |
| 20 to 24 Minutes | 6 | 1.1% |
| 25 to 29 Minutes | 14 | 2.5% |
| 30 to 34 Minutes | 33 | 6.0% |
| 35 to 39 Minutes | 9 | 1.6% |
| 40 to 44 Minutes | 77 | 13.9% |
| 45 to 59 Minutes | 32 | 5.8% |
| 60 to 89 Minutes | 27 | 4.9% |
| 90 or more Minutes | 8 | 1.4% |
Commute Time by Sex in Ashland
The most common commute times in Ashland are 40 to 44 minutes (77 commuters, 32.4%) for males and 5 to 9 minutes (107 commuters, 33.9%) for females.
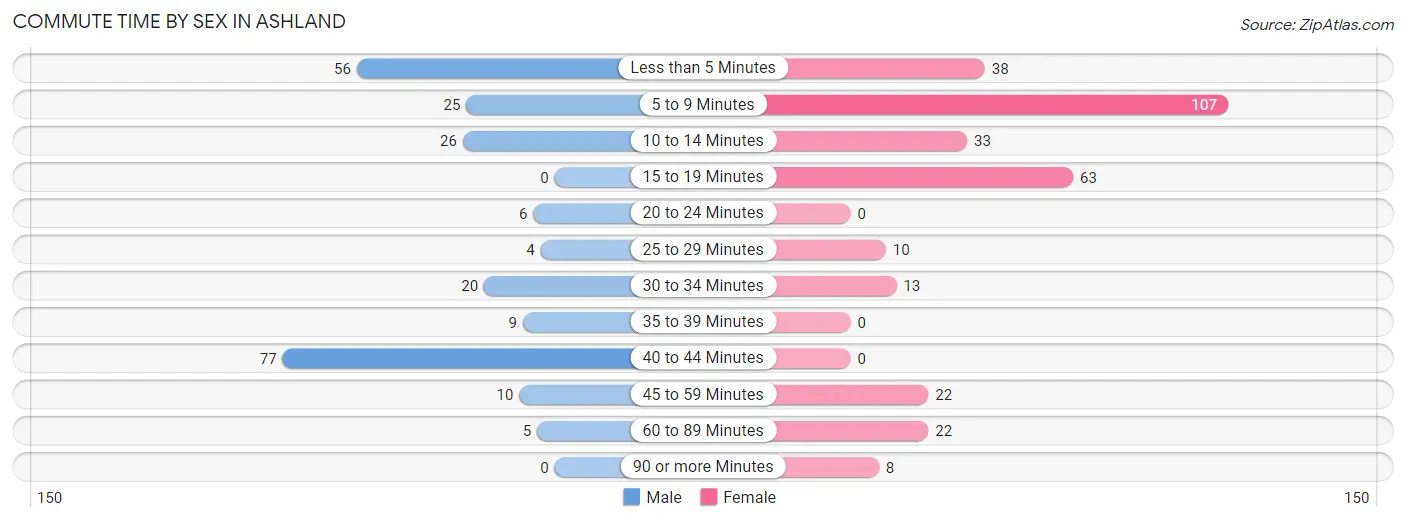
| Commute Time | Male | Female |
| Less than 5 Minutes | 56 (23.5%) | 38 (12.0%) |
| 5 to 9 Minutes | 25 (10.5%) | 107 (33.9%) |
| 10 to 14 Minutes | 26 (10.9%) | 33 (10.4%) |
| 15 to 19 Minutes | 0 (0.0%) | 63 (19.9%) |
| 20 to 24 Minutes | 6 (2.5%) | 0 (0.0%) |
| 25 to 29 Minutes | 4 (1.7%) | 10 (3.2%) |
| 30 to 34 Minutes | 20 (8.4%) | 13 (4.1%) |
| 35 to 39 Minutes | 9 (3.8%) | 0 (0.0%) |
| 40 to 44 Minutes | 77 (32.4%) | 0 (0.0%) |
| 45 to 59 Minutes | 10 (4.2%) | 22 (7.0%) |
| 60 to 89 Minutes | 5 (2.1%) | 22 (7.0%) |
| 90 or more Minutes | 0 (0.0%) | 8 (2.5%) |
Time of Departure to Work by Sex in Ashland
The most frequent times of departure to work in Ashland are 5:00 AM to 5:29 AM (63, 26.5%) for males and 7:00 AM to 7:29 AM (89, 28.2%) for females.
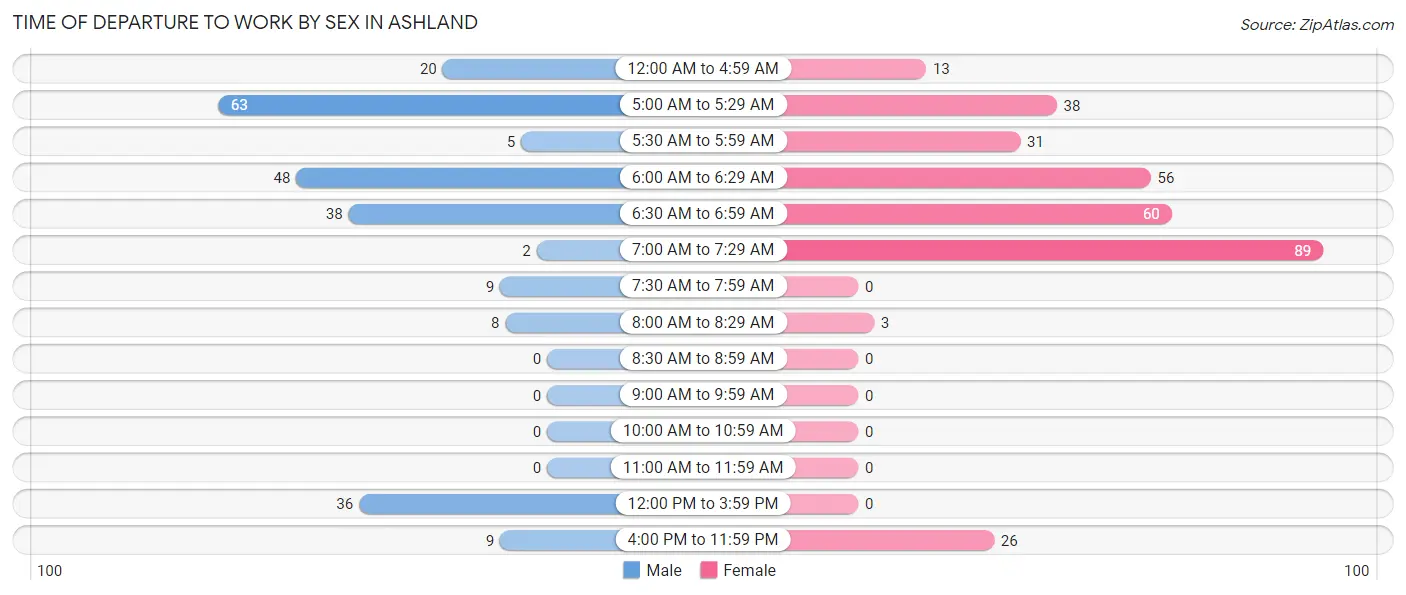
| Time of Departure | Male | Female |
| 12:00 AM to 4:59 AM | 20 (8.4%) | 13 (4.1%) |
| 5:00 AM to 5:29 AM | 63 (26.5%) | 38 (12.0%) |
| 5:30 AM to 5:59 AM | 5 (2.1%) | 31 (9.8%) |
| 6:00 AM to 6:29 AM | 48 (20.2%) | 56 (17.7%) |
| 6:30 AM to 6:59 AM | 38 (16.0%) | 60 (19.0%) |
| 7:00 AM to 7:29 AM | 2 (0.8%) | 89 (28.2%) |
| 7:30 AM to 7:59 AM | 9 (3.8%) | 0 (0.0%) |
| 8:00 AM to 8:29 AM | 8 (3.4%) | 3 (0.9%) |
| 8:30 AM to 8:59 AM | 0 (0.0%) | 0 (0.0%) |
| 9:00 AM to 9:59 AM | 0 (0.0%) | 0 (0.0%) |
| 10:00 AM to 10:59 AM | 0 (0.0%) | 0 (0.0%) |
| 11:00 AM to 11:59 AM | 0 (0.0%) | 0 (0.0%) |
| 12:00 PM to 3:59 PM | 36 (15.1%) | 0 (0.0%) |
| 4:00 PM to 11:59 PM | 9 (3.8%) | 26 (8.2%) |
| Total | 238 (100.0%) | 316 (100.0%) |
Housing Occupancy in Ashland
Occupancy by Ownership in Ashland
Of the total 709 dwellings in Ashland, owner-occupied units account for 365 (51.5%), while renter-occupied units make up 344 (48.5%).
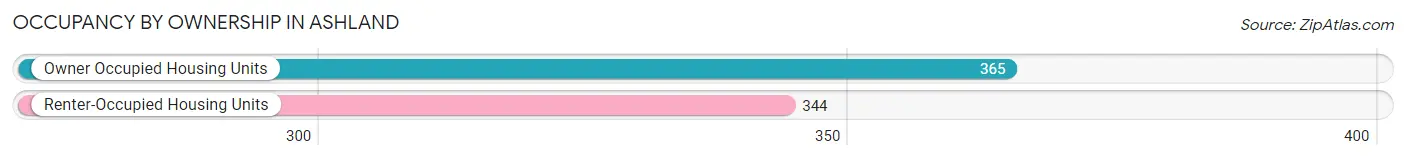
| Occupancy | # Housing Units | % Housing Units |
| Owner Occupied Housing Units | 365 | 51.5% |
| Renter-Occupied Housing Units | 344 | 48.5% |
| Total Occupied Housing Units | 709 | 100.0% |
Occupancy by Household Size in Ashland
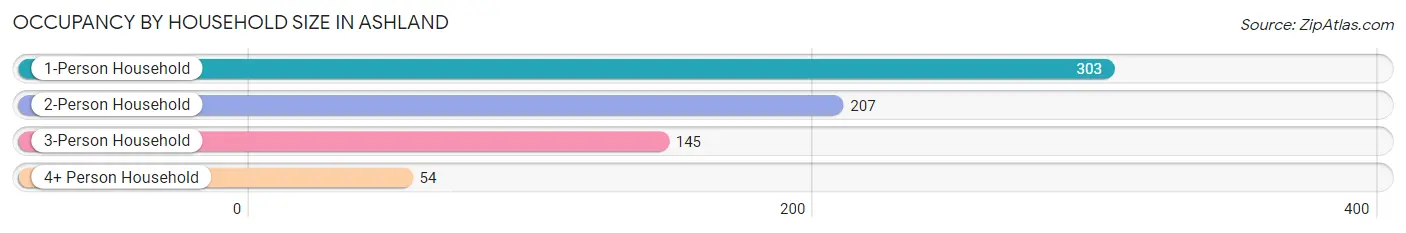
| Household Size | # Housing Units | % Housing Units |
| 1-Person Household | 303 | 42.7% |
| 2-Person Household | 207 | 29.2% |
| 3-Person Household | 145 | 20.4% |
| 4+ Person Household | 54 | 7.6% |
| Total Housing Units | 709 | 100.0% |
Occupancy by Ownership by Household Size in Ashland
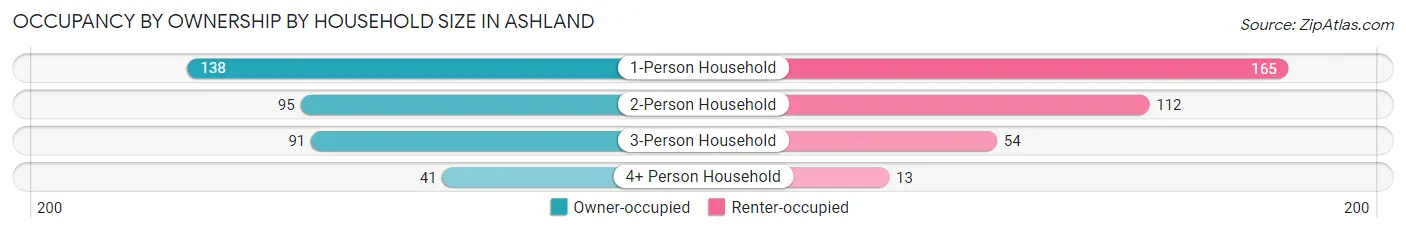
| Household Size | Owner-occupied | Renter-occupied |
| 1-Person Household | 138 (45.5%) | 165 (54.5%) |
| 2-Person Household | 95 (45.9%) | 112 (54.1%) |
| 3-Person Household | 91 (62.8%) | 54 (37.2%) |
| 4+ Person Household | 41 (75.9%) | 13 (24.1%) |
| Total Housing Units | 365 (51.5%) | 344 (48.5%) |
Occupancy by Educational Attainment in Ashland
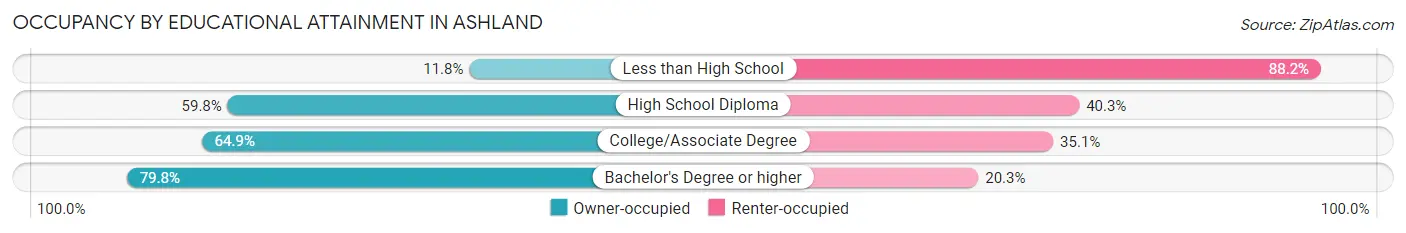
| Household Size | Owner-occupied | Renter-occupied |
| Less than High School | 22 (11.8%) | 164 (88.2%) |
| High School Diploma | 95 (59.8%) | 64 (40.3%) |
| College/Associate Degree | 185 (64.9%) | 100 (35.1%) |
| Bachelor's Degree or higher | 63 (79.7%) | 16 (20.3%) |
Occupancy by Age of Householder in Ashland
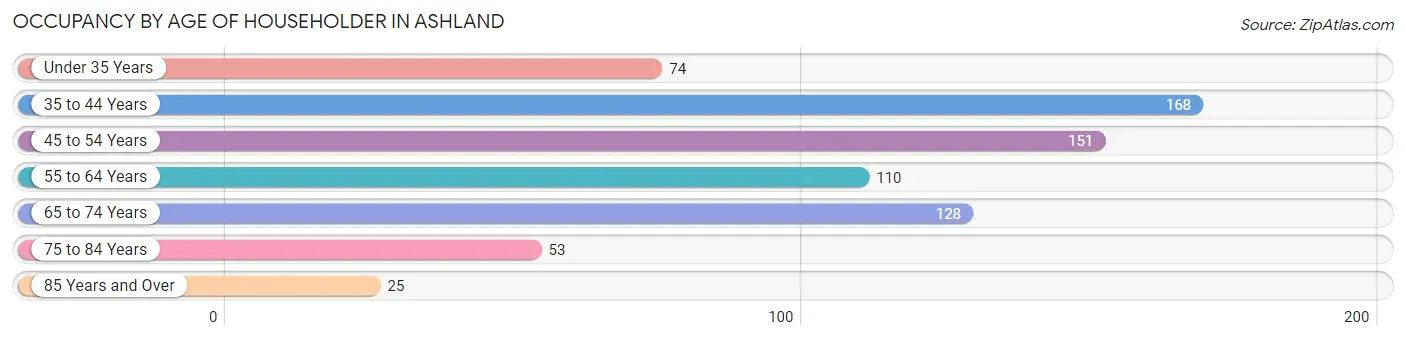
| Age Bracket | # Households | % Households |
| Under 35 Years | 74 | 10.4% |
| 35 to 44 Years | 168 | 23.7% |
| 45 to 54 Years | 151 | 21.3% |
| 55 to 64 Years | 110 | 15.5% |
| 65 to 74 Years | 128 | 18.0% |
| 75 to 84 Years | 53 | 7.5% |
| 85 Years and Over | 25 | 3.5% |
| Total | 709 | 100.0% |
Housing Finances in Ashland
Median Income by Occupancy in Ashland
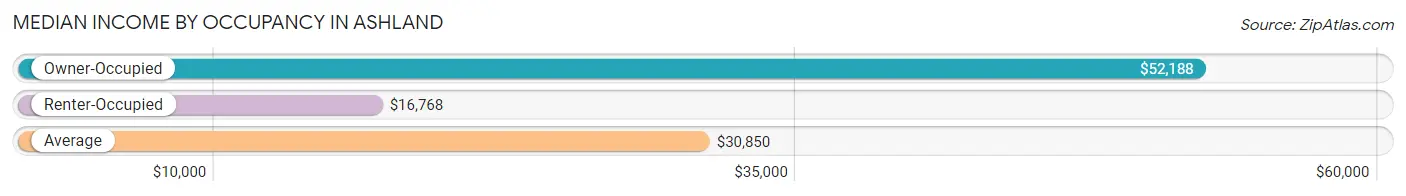
| Occupancy Type | # Households | Median Income |
| Owner-Occupied | 365 (51.5%) | $52,188 |
| Renter-Occupied | 344 (48.5%) | $16,768 |
| Average | 709 (100.0%) | $30,850 |
Occupancy by Householder Income Bracket in Ashland
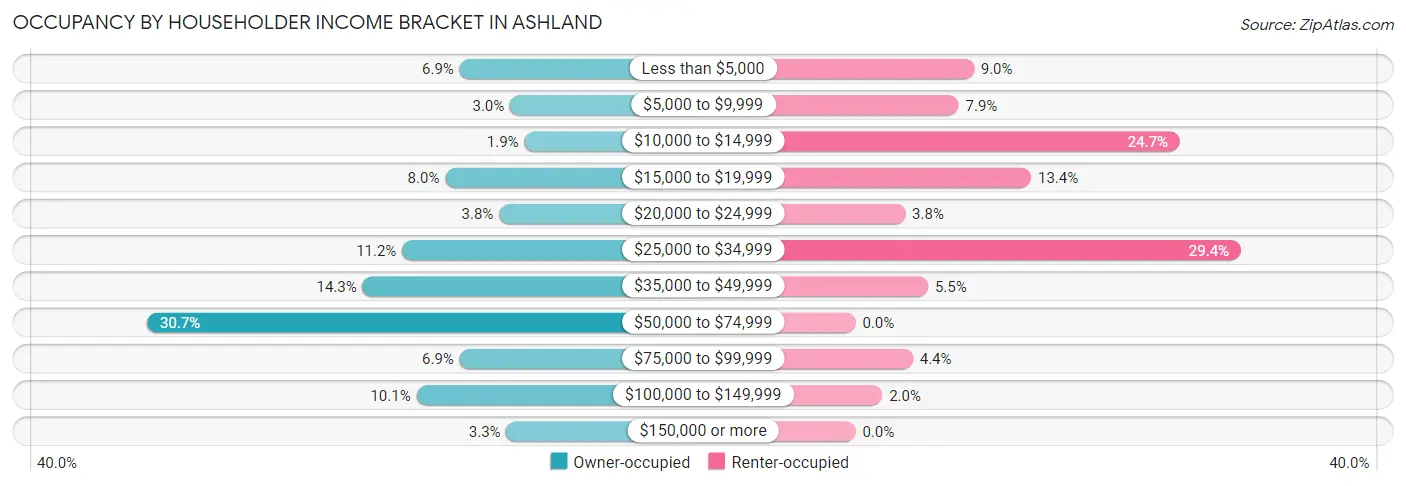
| Income Bracket | Owner-occupied | Renter-occupied |
| Less than $5,000 | 25 (6.9%) | 31 (9.0%) |
| $5,000 to $9,999 | 11 (3.0%) | 27 (7.9%) |
| $10,000 to $14,999 | 7 (1.9%) | 85 (24.7%) |
| $15,000 to $19,999 | 29 (8.0%) | 46 (13.4%) |
| $20,000 to $24,999 | 14 (3.8%) | 13 (3.8%) |
| $25,000 to $34,999 | 41 (11.2%) | 101 (29.4%) |
| $35,000 to $49,999 | 52 (14.2%) | 19 (5.5%) |
| $50,000 to $74,999 | 112 (30.7%) | 0 (0.0%) |
| $75,000 to $99,999 | 25 (6.9%) | 15 (4.4%) |
| $100,000 to $149,999 | 37 (10.1%) | 7 (2.0%) |
| $150,000 or more | 12 (3.3%) | 0 (0.0%) |
| Total | 365 (100.0%) | 344 (100.0%) |
Monthly Housing Cost Tiers in Ashland
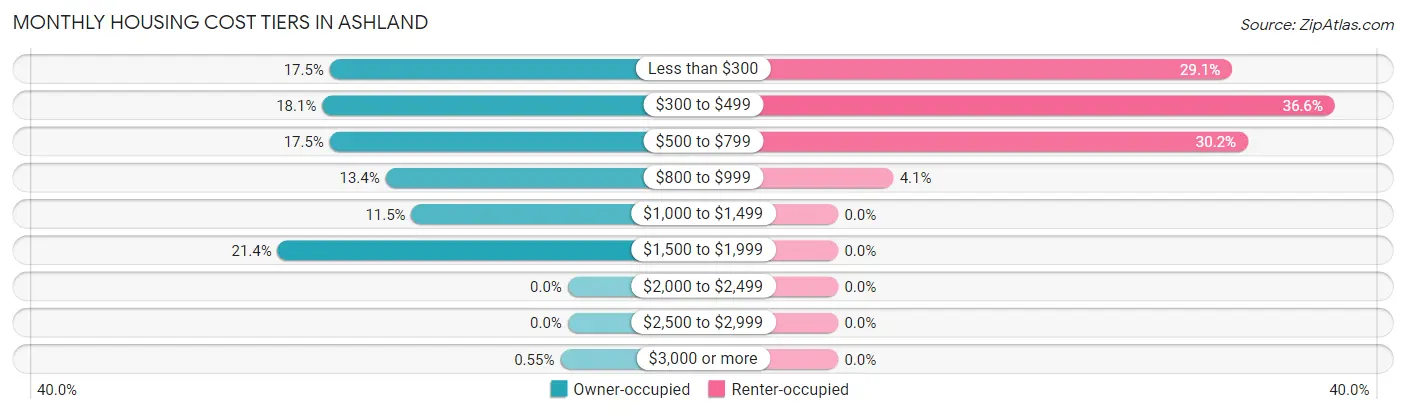
| Monthly Cost | Owner-occupied | Renter-occupied |
| Less than $300 | 64 (17.5%) | 100 (29.1%) |
| $300 to $499 | 66 (18.1%) | 126 (36.6%) |
| $500 to $799 | 64 (17.5%) | 104 (30.2%) |
| $800 to $999 | 49 (13.4%) | 14 (4.1%) |
| $1,000 to $1,499 | 42 (11.5%) | 0 (0.0%) |
| $1,500 to $1,999 | 78 (21.4%) | 0 (0.0%) |
| $2,000 to $2,499 | 0 (0.0%) | 0 (0.0%) |
| $2,500 to $2,999 | 0 (0.0%) | 0 (0.0%) |
| $3,000 or more | 2 (0.5%) | 0 (0.0%) |
| Total | 365 (100.0%) | 344 (100.0%) |
Physical Housing Characteristics in Ashland
Housing Structures in Ashland
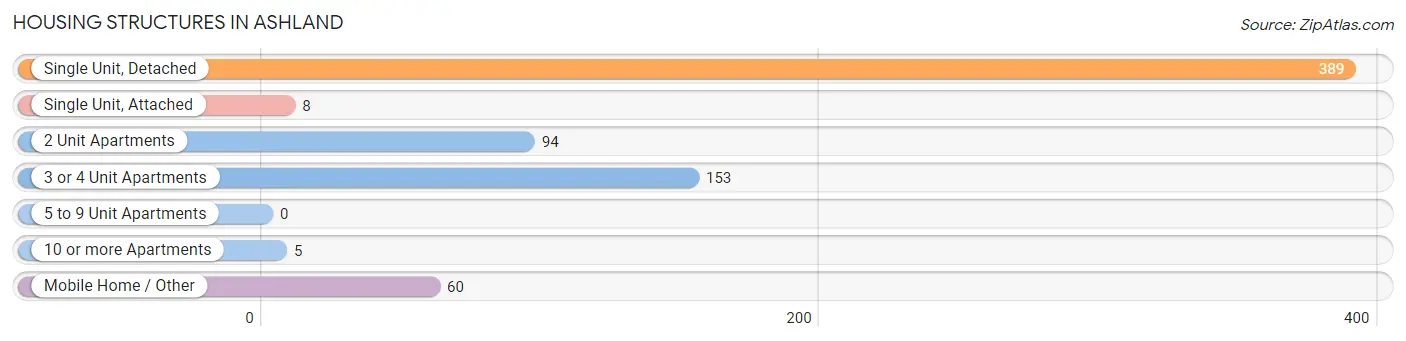
| Structure Type | # Housing Units | % Housing Units |
| Single Unit, Detached | 389 | 54.9% |
| Single Unit, Attached | 8 | 1.1% |
| 2 Unit Apartments | 94 | 13.3% |
| 3 or 4 Unit Apartments | 153 | 21.6% |
| 5 to 9 Unit Apartments | 0 | 0.0% |
| 10 or more Apartments | 5 | 0.7% |
| Mobile Home / Other | 60 | 8.5% |
| Total | 709 | 100.0% |
Housing Structures by Occupancy in Ashland
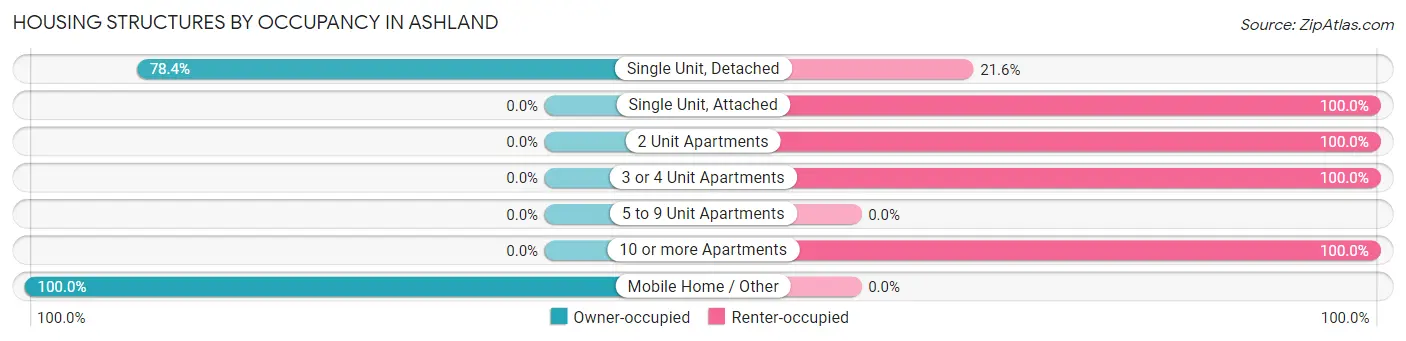
| Structure Type | Owner-occupied | Renter-occupied |
| Single Unit, Detached | 305 (78.4%) | 84 (21.6%) |
| Single Unit, Attached | 0 (0.0%) | 8 (100.0%) |
| 2 Unit Apartments | 0 (0.0%) | 94 (100.0%) |
| 3 or 4 Unit Apartments | 0 (0.0%) | 153 (100.0%) |
| 5 to 9 Unit Apartments | 0 (0.0%) | 0 (0.0%) |
| 10 or more Apartments | 0 (0.0%) | 5 (100.0%) |
| Mobile Home / Other | 60 (100.0%) | 0 (0.0%) |
| Total | 365 (51.5%) | 344 (48.5%) |
Housing Structures by Number of Rooms in Ashland
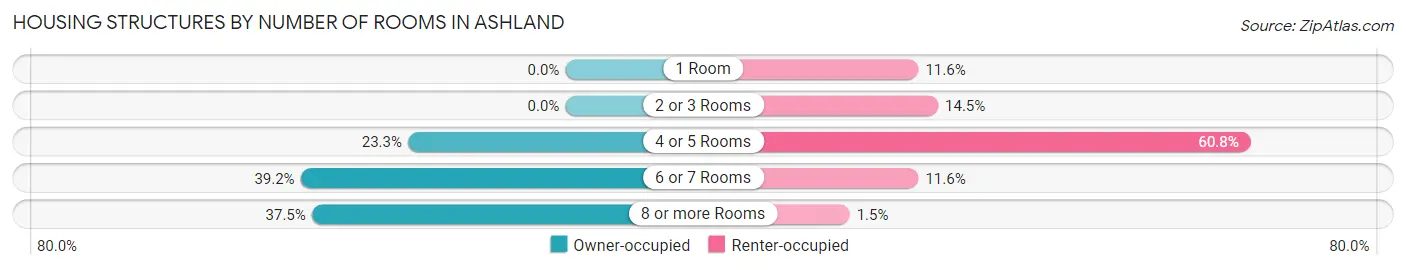
| Number of Rooms | Owner-occupied | Renter-occupied |
| 1 Room | 0 (0.0%) | 40 (11.6%) |
| 2 or 3 Rooms | 0 (0.0%) | 50 (14.5%) |
| 4 or 5 Rooms | 85 (23.3%) | 209 (60.8%) |
| 6 or 7 Rooms | 143 (39.2%) | 40 (11.6%) |
| 8 or more Rooms | 137 (37.5%) | 5 (1.5%) |
| Total | 365 (100.0%) | 344 (100.0%) |
Housing Structure by Heating Type in Ashland
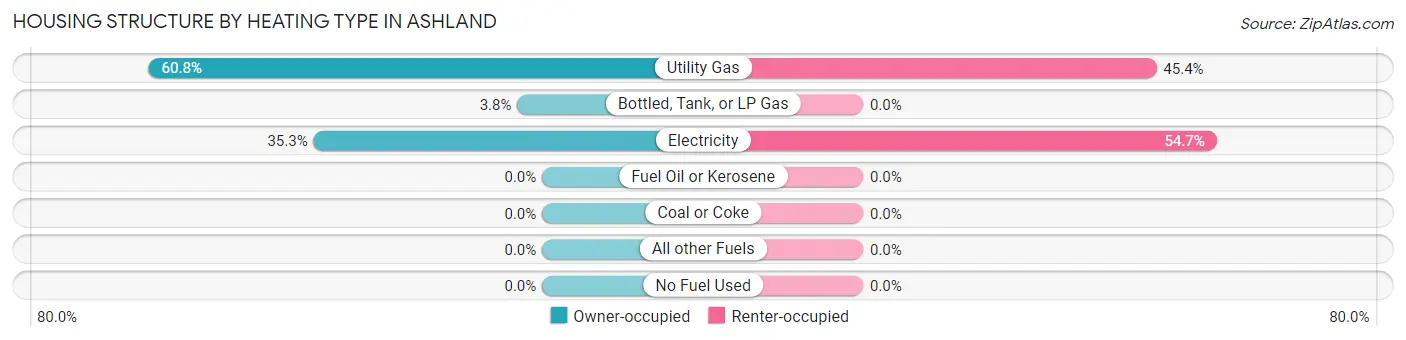
| Heating Type | Owner-occupied | Renter-occupied |
| Utility Gas | 222 (60.8%) | 156 (45.4%) |
| Bottled, Tank, or LP Gas | 14 (3.8%) | 0 (0.0%) |
| Electricity | 129 (35.3%) | 188 (54.6%) |
| Fuel Oil or Kerosene | 0 (0.0%) | 0 (0.0%) |
| Coal or Coke | 0 (0.0%) | 0 (0.0%) |
| All other Fuels | 0 (0.0%) | 0 (0.0%) |
| No Fuel Used | 0 (0.0%) | 0 (0.0%) |
| Total | 365 (100.0%) | 344 (100.0%) |
Household Vehicle Usage in Ashland
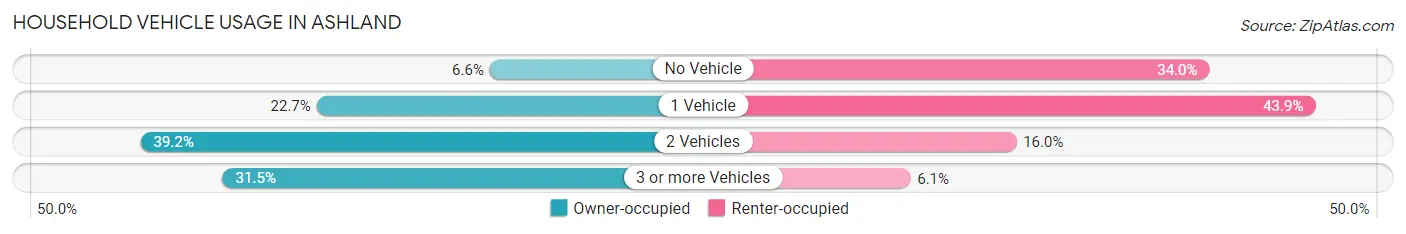
| Vehicles per Household | Owner-occupied | Renter-occupied |
| No Vehicle | 24 (6.6%) | 117 (34.0%) |
| 1 Vehicle | 83 (22.7%) | 151 (43.9%) |
| 2 Vehicles | 143 (39.2%) | 55 (16.0%) |
| 3 or more Vehicles | 115 (31.5%) | 21 (6.1%) |
| Total | 365 (100.0%) | 344 (100.0%) |
Real Estate & Mortgages in Ashland
Real Estate and Mortgage Overview in Ashland
| Characteristic | Without Mortgage | With Mortgage |
| Housing Units | 149 | 216 |
| Median Property Value | $84,800 | $144,000 |
| Median Household Income | $28,839 | $2 |
| Monthly Housing Costs | $315 | $2 |
| Real Estate Taxes | $295 | $0 |
Property Value by Mortgage Status in Ashland
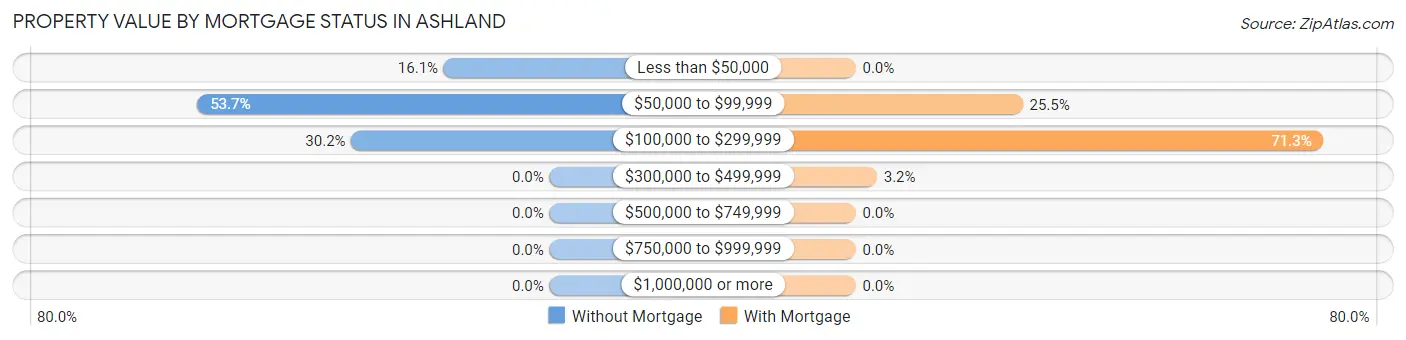
| Property Value | Without Mortgage | With Mortgage |
| Less than $50,000 | 24 (16.1%) | 0 (0.0%) |
| $50,000 to $99,999 | 80 (53.7%) | 55 (25.5%) |
| $100,000 to $299,999 | 45 (30.2%) | 154 (71.3%) |
| $300,000 to $499,999 | 0 (0.0%) | 7 (3.2%) |
| $500,000 to $749,999 | 0 (0.0%) | 0 (0.0%) |
| $750,000 to $999,999 | 0 (0.0%) | 0 (0.0%) |
| $1,000,000 or more | 0 (0.0%) | 0 (0.0%) |
| Total | 149 (100.0%) | 216 (100.0%) |
Household Income by Mortgage Status in Ashland
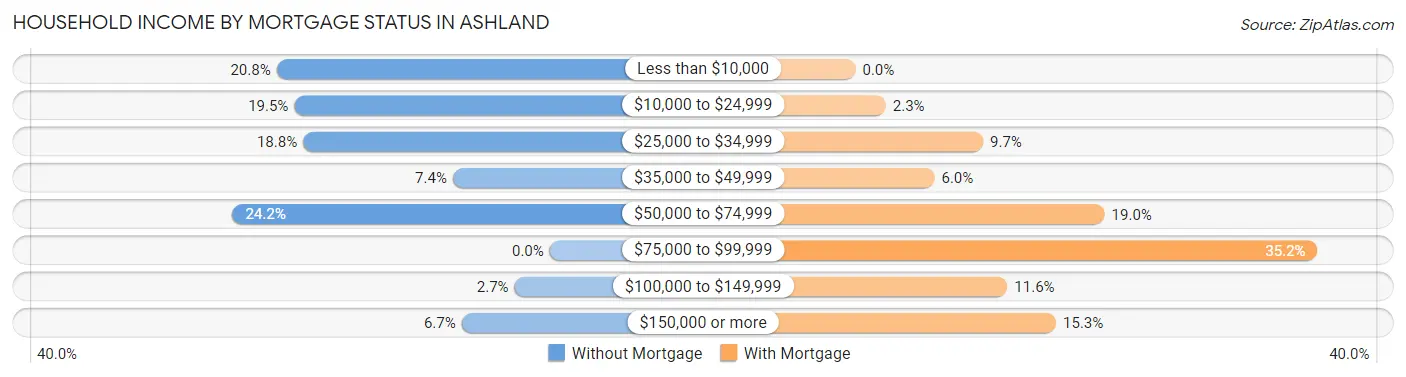
| Household Income | Without Mortgage | With Mortgage |
| Less than $10,000 | 31 (20.8%) | 0 (0.0%) |
| $10,000 to $24,999 | 29 (19.5%) | 5 (2.3%) |
| $25,000 to $34,999 | 28 (18.8%) | 21 (9.7%) |
| $35,000 to $49,999 | 11 (7.4%) | 13 (6.0%) |
| $50,000 to $74,999 | 36 (24.2%) | 41 (19.0%) |
| $75,000 to $99,999 | 0 (0.0%) | 76 (35.2%) |
| $100,000 to $149,999 | 4 (2.7%) | 25 (11.6%) |
| $150,000 or more | 10 (6.7%) | 33 (15.3%) |
| Total | 149 (100.0%) | 216 (100.0%) |
Property Value to Household Income Ratio in Ashland
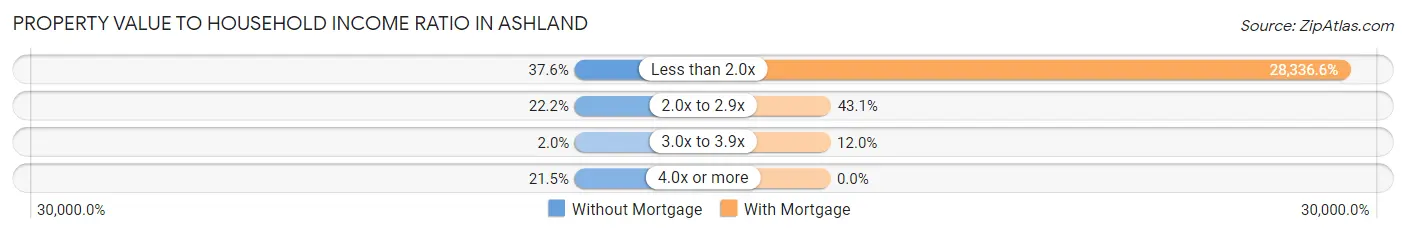
| Value-to-Income Ratio | Without Mortgage | With Mortgage |
| Less than 2.0x | 56 (37.6%) | 61,207 (28,336.6%) |
| 2.0x to 2.9x | 33 (22.2%) | 93 (43.1%) |
| 3.0x to 3.9x | 3 (2.0%) | 26 (12.0%) |
| 4.0x or more | 32 (21.5%) | 0 (0.0%) |
| Total | 149 (100.0%) | 216 (100.0%) |
Real Estate Taxes by Mortgage Status in Ashland
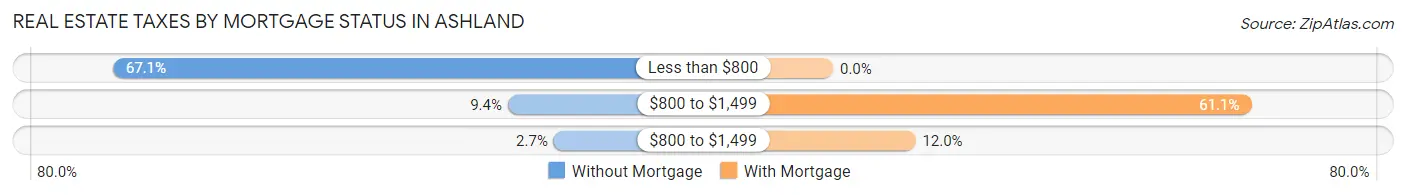
| Property Taxes | Without Mortgage | With Mortgage |
| Less than $800 | 100 (67.1%) | 0 (0.0%) |
| $800 to $1,499 | 14 (9.4%) | 132 (61.1%) |
| $800 to $1,499 | 4 (2.7%) | 26 (12.0%) |
| Total | 149 (100.0%) | 216 (100.0%) |
Health & Disability in Ashland
Health Insurance Coverage by Age in Ashland
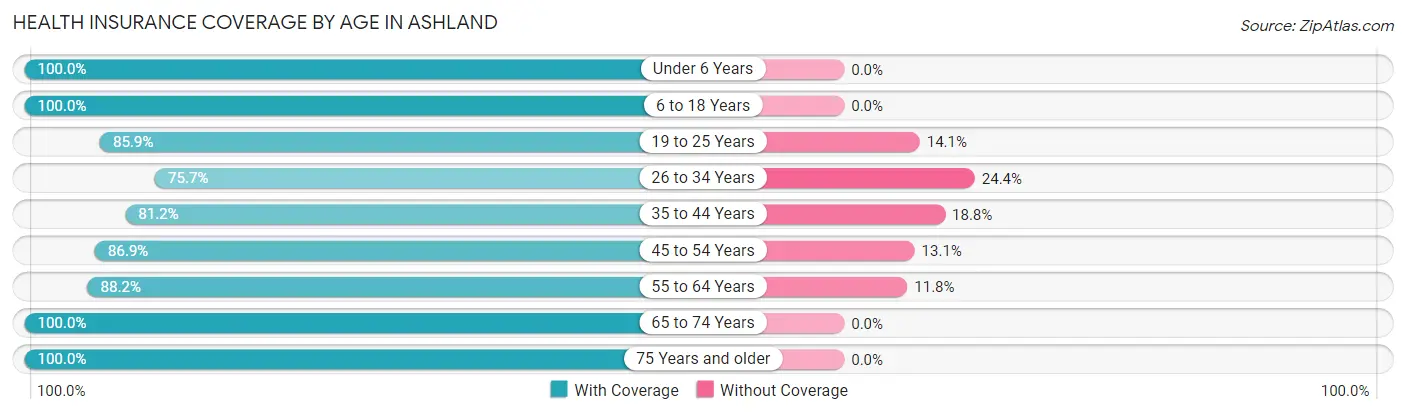
| Age Bracket | With Coverage | Without Coverage |
| Under 6 Years | 117 (100.0%) | 0 (0.0%) |
| 6 to 18 Years | 252 (100.0%) | 0 (0.0%) |
| 19 to 25 Years | 122 (85.9%) | 20 (14.1%) |
| 26 to 34 Years | 87 (75.6%) | 28 (24.3%) |
| 35 to 44 Years | 190 (81.2%) | 44 (18.8%) |
| 45 to 54 Years | 245 (86.9%) | 37 (13.1%) |
| 55 to 64 Years | 135 (88.2%) | 18 (11.8%) |
| 65 to 74 Years | 159 (100.0%) | 0 (0.0%) |
| 75 Years and older | 90 (100.0%) | 0 (0.0%) |
| Total | 1,397 (90.5%) | 147 (9.5%) |
Health Insurance Coverage by Citizenship Status in Ashland
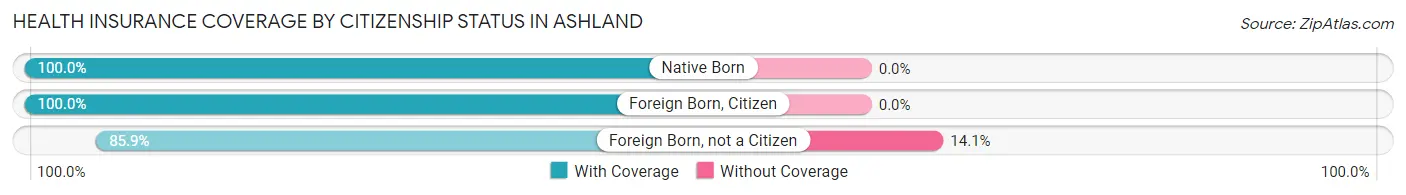
| Citizenship Status | With Coverage | Without Coverage |
| Native Born | 117 (100.0%) | 0 (0.0%) |
| Foreign Born, Citizen | 252 (100.0%) | 0 (0.0%) |
| Foreign Born, not a Citizen | 122 (85.9%) | 20 (14.1%) |
Health Insurance Coverage by Household Income in Ashland
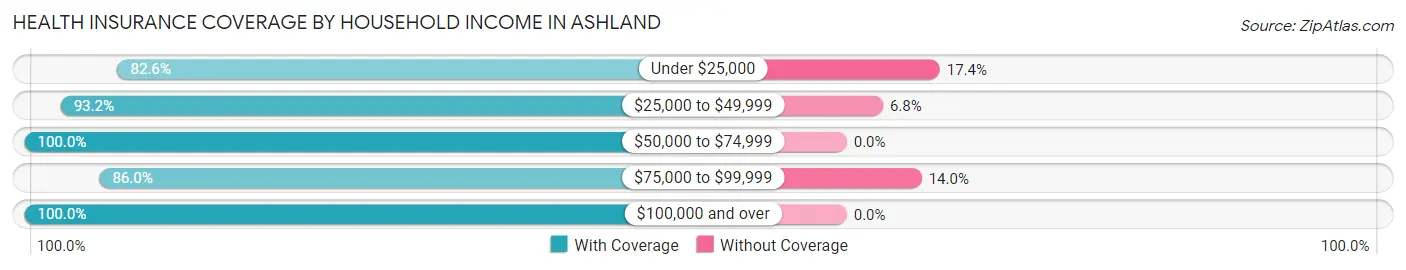
| Household Income | With Coverage | Without Coverage |
| Under $25,000 | 469 (82.6%) | 99 (17.4%) |
| $25,000 to $49,999 | 440 (93.2%) | 32 (6.8%) |
| $50,000 to $74,999 | 258 (100.0%) | 0 (0.0%) |
| $75,000 to $99,999 | 98 (86.0%) | 16 (14.0%) |
| $100,000 and over | 129 (100.0%) | 0 (0.0%) |
Public vs Private Health Insurance Coverage by Age in Ashland
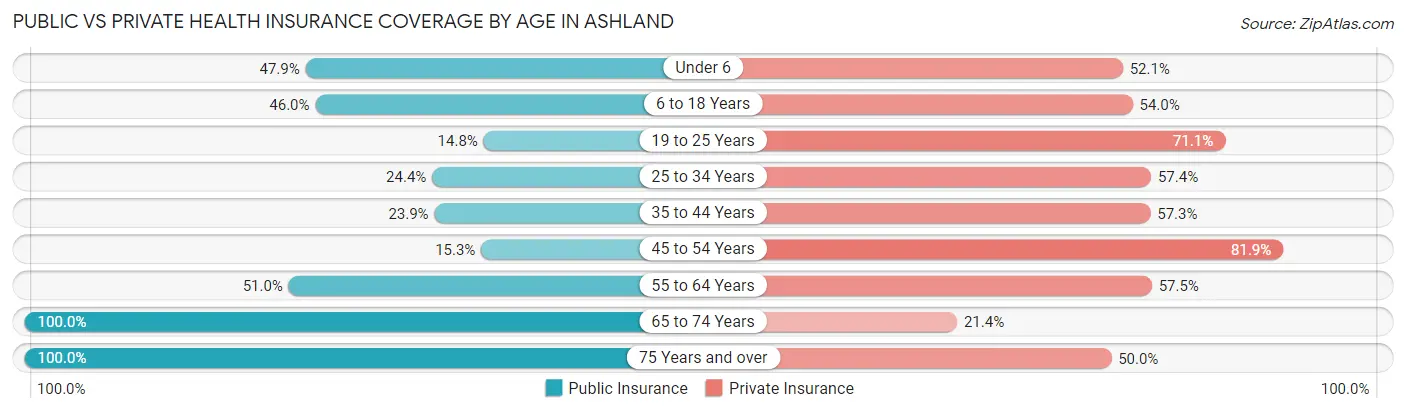
| Age Bracket | Public Insurance | Private Insurance |
| Under 6 | 56 (47.9%) | 61 (52.1%) |
| 6 to 18 Years | 116 (46.0%) | 136 (54.0%) |
| 19 to 25 Years | 21 (14.8%) | 101 (71.1%) |
| 25 to 34 Years | 28 (24.3%) | 66 (57.4%) |
| 35 to 44 Years | 56 (23.9%) | 134 (57.3%) |
| 45 to 54 Years | 43 (15.2%) | 231 (81.9%) |
| 55 to 64 Years | 78 (51.0%) | 88 (57.5%) |
| 65 to 74 Years | 159 (100.0%) | 34 (21.4%) |
| 75 Years and over | 90 (100.0%) | 45 (50.0%) |
| Total | 647 (41.9%) | 896 (58.0%) |
Disability Status by Sex by Age in Ashland
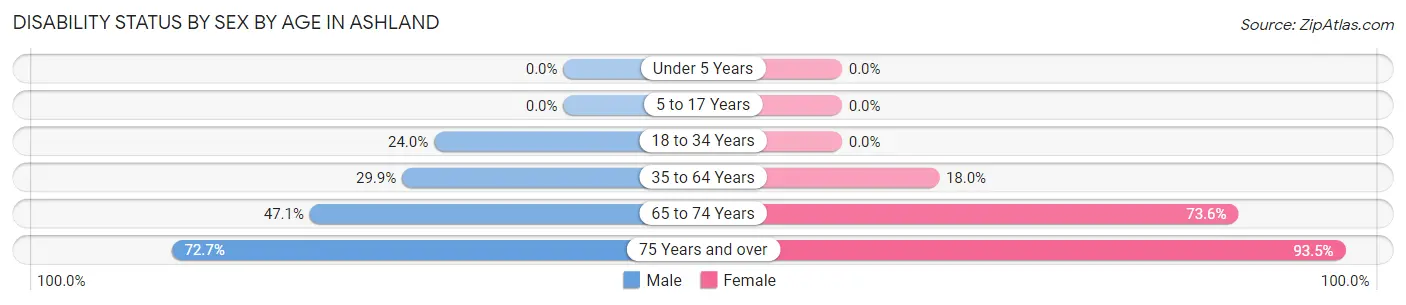
| Age Bracket | Male | Female |
| Under 5 Years | 0 (0.0%) | 0 (0.0%) |
| 5 to 17 Years | 0 (0.0%) | 0 (0.0%) |
| 18 to 34 Years | 36 (24.0%) | 0 (0.0%) |
| 35 to 64 Years | 94 (29.9%) | 64 (18.0%) |
| 65 to 74 Years | 16 (47.1%) | 92 (73.6%) |
| 75 Years and over | 32 (72.7%) | 43 (93.5%) |
Disability Class by Sex by Age in Ashland
Disability Class: Hearing Difficulty
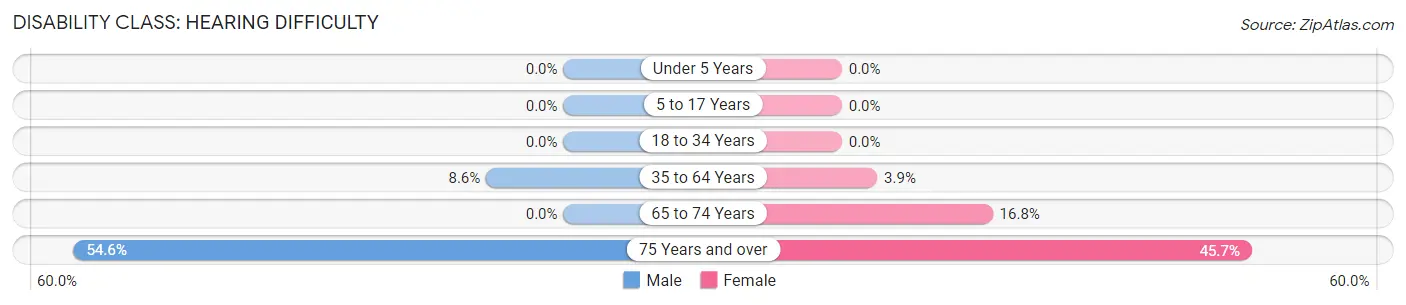
| Age Bracket | Male | Female |
| Under 5 Years | 0 (0.0%) | 0 (0.0%) |
| 5 to 17 Years | 0 (0.0%) | 0 (0.0%) |
| 18 to 34 Years | 0 (0.0%) | 0 (0.0%) |
| 35 to 64 Years | 27 (8.6%) | 14 (3.9%) |
| 65 to 74 Years | 0 (0.0%) | 21 (16.8%) |
| 75 Years and over | 24 (54.5%) | 21 (45.7%) |
Disability Class: Vision Difficulty
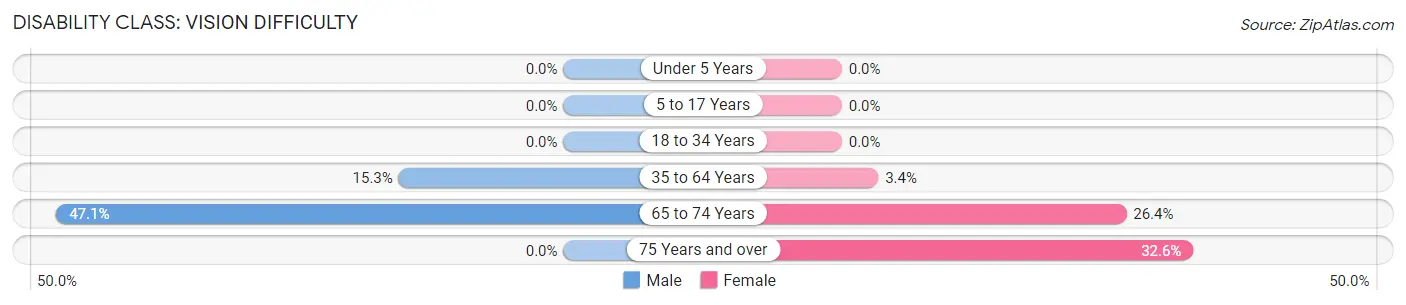
| Age Bracket | Male | Female |
| Under 5 Years | 0 (0.0%) | 0 (0.0%) |
| 5 to 17 Years | 0 (0.0%) | 0 (0.0%) |
| 18 to 34 Years | 0 (0.0%) | 0 (0.0%) |
| 35 to 64 Years | 48 (15.3%) | 12 (3.4%) |
| 65 to 74 Years | 16 (47.1%) | 33 (26.4%) |
| 75 Years and over | 0 (0.0%) | 15 (32.6%) |
Disability Class: Cognitive Difficulty
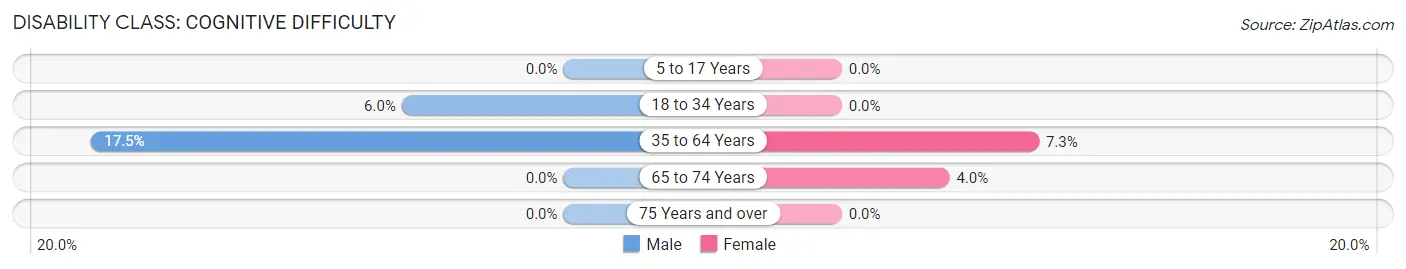
| Age Bracket | Male | Female |
| 5 to 17 Years | 0 (0.0%) | 0 (0.0%) |
| 18 to 34 Years | 9 (6.0%) | 0 (0.0%) |
| 35 to 64 Years | 55 (17.5%) | 26 (7.3%) |
| 65 to 74 Years | 0 (0.0%) | 5 (4.0%) |
| 75 Years and over | 0 (0.0%) | 0 (0.0%) |
Disability Class: Ambulatory Difficulty
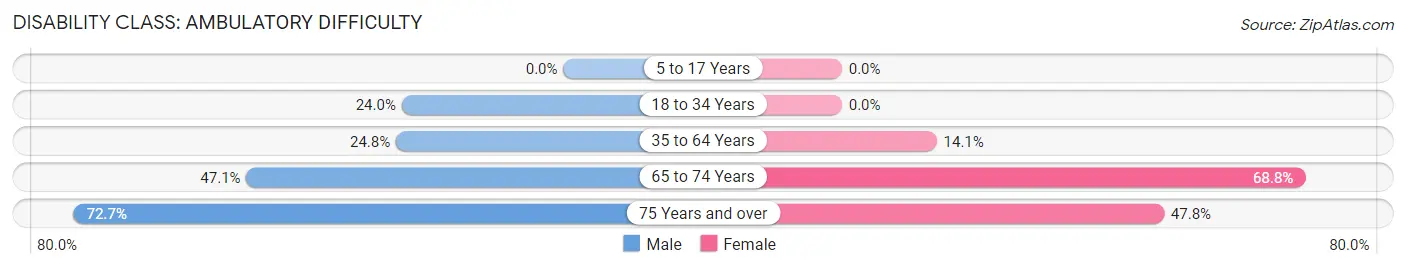
| Age Bracket | Male | Female |
| 5 to 17 Years | 0 (0.0%) | 0 (0.0%) |
| 18 to 34 Years | 36 (24.0%) | 0 (0.0%) |
| 35 to 64 Years | 78 (24.8%) | 50 (14.1%) |
| 65 to 74 Years | 16 (47.1%) | 86 (68.8%) |
| 75 Years and over | 32 (72.7%) | 22 (47.8%) |
Disability Class: Self-Care Difficulty
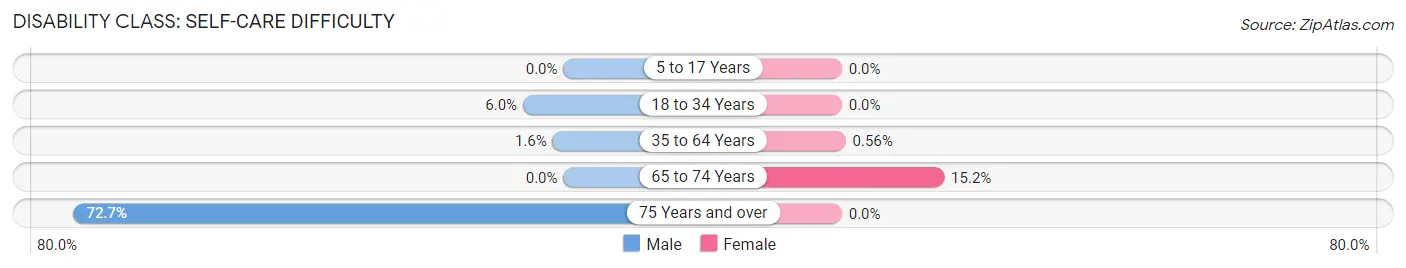
| Age Bracket | Male | Female |
| 5 to 17 Years | 0 (0.0%) | 0 (0.0%) |
| 18 to 34 Years | 9 (6.0%) | 0 (0.0%) |
| 35 to 64 Years | 5 (1.6%) | 2 (0.6%) |
| 65 to 74 Years | 0 (0.0%) | 19 (15.2%) |
| 75 Years and over | 32 (72.7%) | 0 (0.0%) |
Technology Access in Ashland
Computing Device Access in Ashland
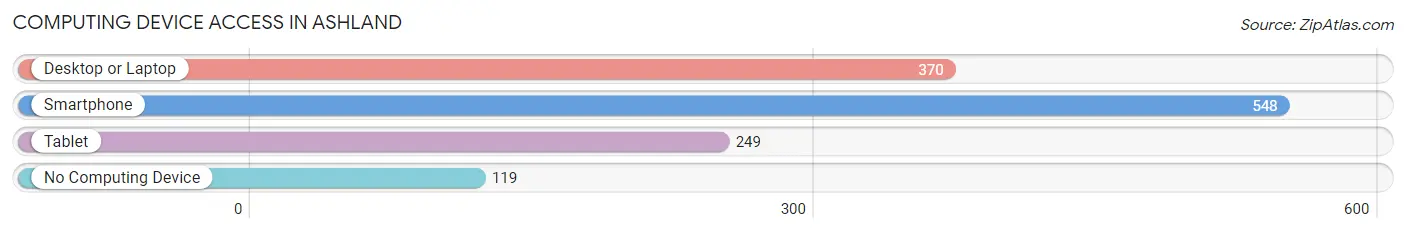
| Device Type | # Households | % Households |
| Desktop or Laptop | 370 | 52.2% |
| Smartphone | 548 | 77.3% |
| Tablet | 249 | 35.1% |
| No Computing Device | 119 | 16.8% |
| Total | 709 | 100.0% |
Internet Access in Ashland
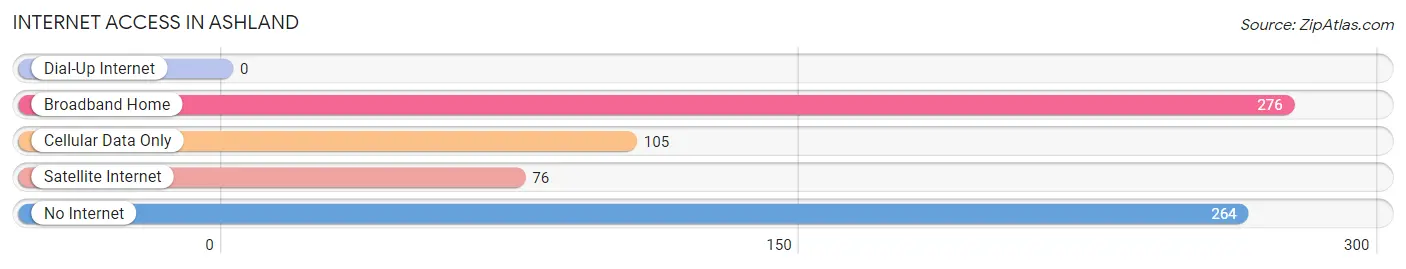
| Internet Type | # Households | % Households |
| Dial-Up Internet | 0 | 0.0% |
| Broadband Home | 276 | 38.9% |
| Cellular Data Only | 105 | 14.8% |
| Satellite Internet | 76 | 10.7% |
| No Internet | 264 | 37.2% |
| Total | 709 | 100.0% |
Ashland Summary
Ashland, Alabama is a small town located in Clay County, Alabama. It is situated in the foothills of the Appalachian Mountains and is part of the Birmingham-Hoover Metropolitan Statistical Area. The town has a population of approximately 1,500 people and is known for its rural charm and friendly atmosphere.
History
The area that is now Ashland was first settled in the early 1800s by settlers from North Carolina and Virginia. The town was originally known as “Mountain Springs” and was later renamed “Ashland” in 1887. The name was chosen to honor the birthplace of Henry Clay, a prominent statesman from Kentucky.
The town was incorporated in 1891 and quickly became a center of commerce and industry. The town was home to several sawmills, gristmills, and other businesses. The town also had a railroad station, which allowed for the transportation of goods and people.
In the early 1900s, the town experienced a period of growth and prosperity. The population increased from 500 in 1900 to 1,500 in 1930. During this time, the town was home to several churches, schools, and businesses.
Geography
Ashland is located in Clay County, Alabama. It is situated in the foothills of the Appalachian Mountains and is part of the Birmingham-Hoover Metropolitan Statistical Area. The town is located at the intersection of US Highway 78 and Alabama State Route 9.
The town is located in a rural area and is surrounded by rolling hills and forests. The town is located approximately 30 miles from Birmingham and is approximately 90 miles from Atlanta, Georgia.
Economy
The economy of Ashland is largely based on agriculture and forestry. The town is home to several farms and timber companies. The town is also home to several small businesses, including restaurants, retail stores, and service providers.
The town is also home to several manufacturing companies, including a furniture factory and a paper mill. The town is also home to several educational institutions, including a community college and a technical school.
Demographics
As of the 2010 census, the population of Ashland was 1,521. The racial makeup of the town was 95.3% White, 2.2% African American, 0.2% Native American, 0.2% Asian, 0.2% from other races, and 1.9% from two or more races. Hispanic or Latino of any race were 1.2% of the population.
The median income for a household in the town was $30,938, and the median income for a family was $37,500. The per capita income for the town was $15,945. About 17.2% of families and 20.2% of the population were below the poverty line, including 28.3% of those under age 18 and 11.2% of those age 65 or over.
Conclusion
Ashland, Alabama is a small town located in Clay County, Alabama. It is situated in the foothills of the Appalachian Mountains and is part of the Birmingham-Hoover Metropolitan Statistical Area. The town has a population of approximately 1,500 people and is known for its rural charm and friendly atmosphere. The economy of Ashland is largely based on agriculture and forestry, and the town is home to several small businesses, manufacturing companies, and educational institutions. The racial makeup of the town is predominantly White, with African Americans, Native Americans, Asians, and other races making up the remainder of the population. The median income for a household in the town is $30,938, and the per capita income for the town is $15,945.
Common Questions
What is Per Capita Income in Ashland?
Per Capita income in Ashland is $23,183.
What is the Median Family Income in Ashland?
Median Family Income in Ashland is $34,053.
What is the Median Household income in Ashland?
Median Household Income in Ashland is $30,850.
What is Income or Wage Gap in Ashland?
Income or Wage Gap in Ashland is 54.1%.
Women in Ashland earn 45.9 cents for every dollar earned by a man.
What is Inequality or Gini Index in Ashland?
Inequality or Gini Index in Ashland is 0.56.
What is the Total Population of Ashland?
Total Population of Ashland is 1,674.
What is the Total Male Population of Ashland?
Total Male Population of Ashland is 793.
What is the Total Female Population of Ashland?
Total Female Population of Ashland is 881.
What is the Ratio of Males per 100 Females in Ashland?
There are 90.01 Males per 100 Females in Ashland.
What is the Ratio of Females per 100 Males in Ashland?
There are 111.10 Females per 100 Males in Ashland.
What is the Median Population Age in Ashland?
Median Population Age in Ashland is 42.0 Years.
What is the Average Family Size in Ashland
Average Family Size in Ashland is 3.0 People.
What is the Average Household Size in Ashland
Average Household Size in Ashland is 2.2 People.
How Large is the Labor Force in Ashland?
There are 608 People in the Labor Forcein in Ashland.
What is the Percentage of People in the Labor Force in Ashland?
44.1% of People are in the Labor Force in Ashland.
What is the Unemployment Rate in Ashland?
Unemployment Rate in Ashland is 8.9%.