Brilliant, AL Map & Demographics
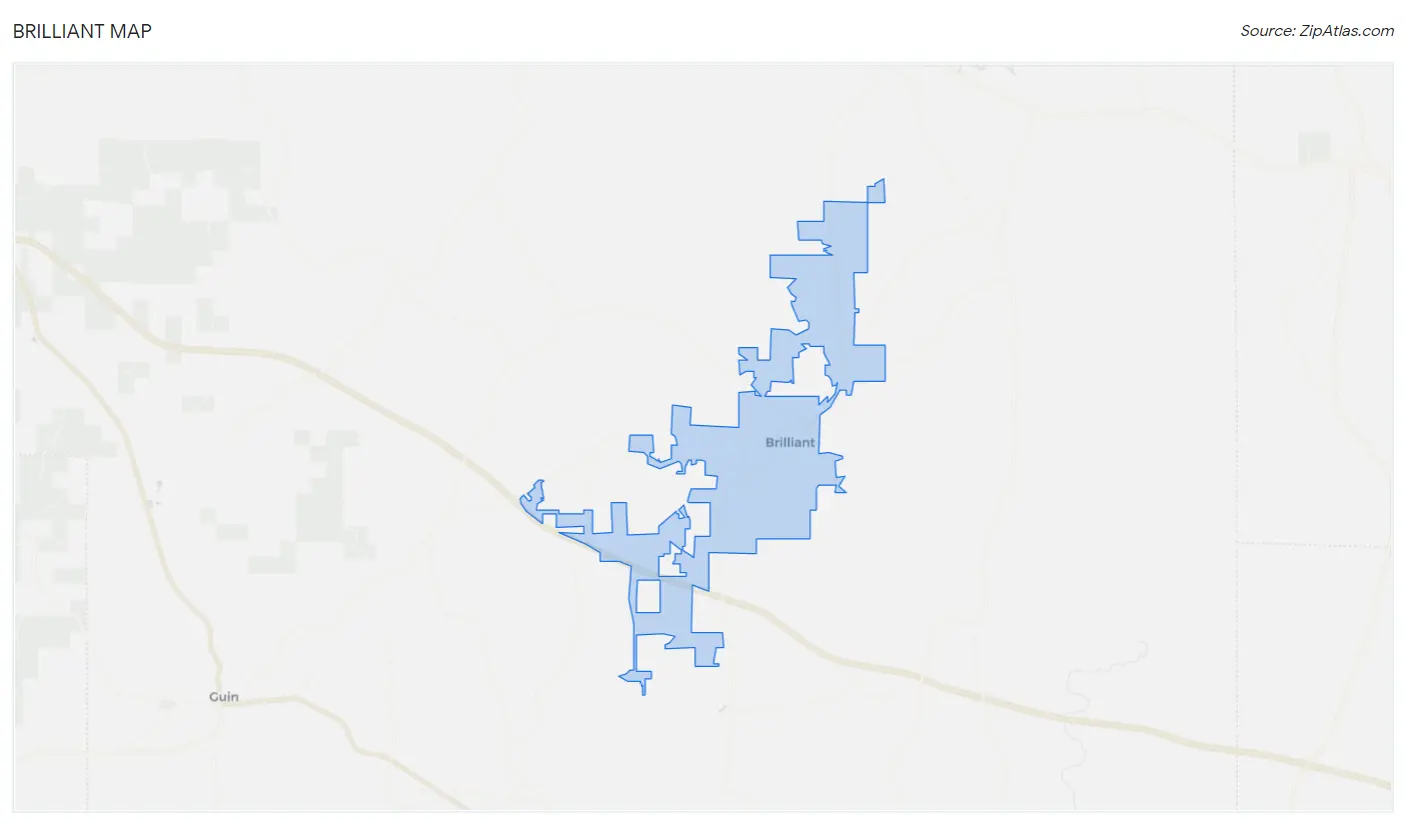
Brilliant Map
Brilliant Overview
$21,458
PER CAPITA INCOME
$45,250
AVG FAMILY INCOME
$39,318
AVG HOUSEHOLD INCOME
28.1%
WAGE / INCOME GAP [ % ]
71.9¢/ $1
WAGE / INCOME GAP [ $ ]
0.44
INEQUALITY / GINI INDEX
1,145
TOTAL POPULATION
578
MALE POPULATION
567
FEMALE POPULATION
101.94
MALES / 100 FEMALES
98.10
FEMALES / 100 MALES
53.4
MEDIAN AGE
2.7
AVG FAMILY SIZE
2.1
AVG HOUSEHOLD SIZE
433
LABOR FORCE [ PEOPLE ]
46.7%
PERCENT IN LABOR FORCE
15.5%
UNEMPLOYMENT RATE
Brilliant Zip Codes
Brilliant Area Codes
Income in Brilliant
Income Overview in Brilliant
Per Capita Income in Brilliant is $21,458, while median incomes of families and households are $45,250 and $39,318 respectively.
| Characteristic | Number | Measure |
| Per Capita Income | 1,145 | $21,458 |
| Median Family Income | 253 | $45,250 |
| Mean Family Income | 253 | $53,098 |
| Median Household Income | 552 | $39,318 |
| Mean Household Income | 552 | $45,730 |
| Income Deficit | 253 | $0 |
| Wage / Income Gap (%) | 1,145 | 28.13% |
| Wage / Income Gap ($) | 1,145 | 71.87¢ per $1 |
| Gini / Inequality Index | 1,145 | 0.44 |
Earnings by Sex in Brilliant
Average Earnings in Brilliant are $42,941, $45,702 for men and $32,847 for women, a difference of 28.1%.
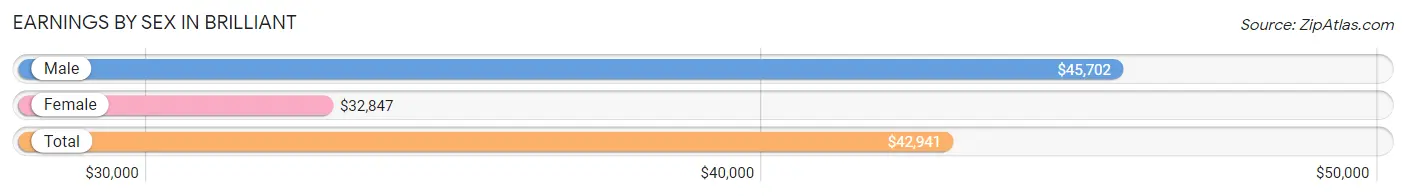
| Sex | Number | Average Earnings |
| Male | 281 (65.6%) | $45,702 |
| Female | 147 (34.4%) | $32,847 |
| Total | 428 (100.0%) | $42,941 |
Earnings by Sex by Income Bracket in Brilliant
The most common earnings brackets in Brilliant are $45,000 to $49,999 for men (73 | 26.0%) and $2,499 or less for women (19 | 12.9%).
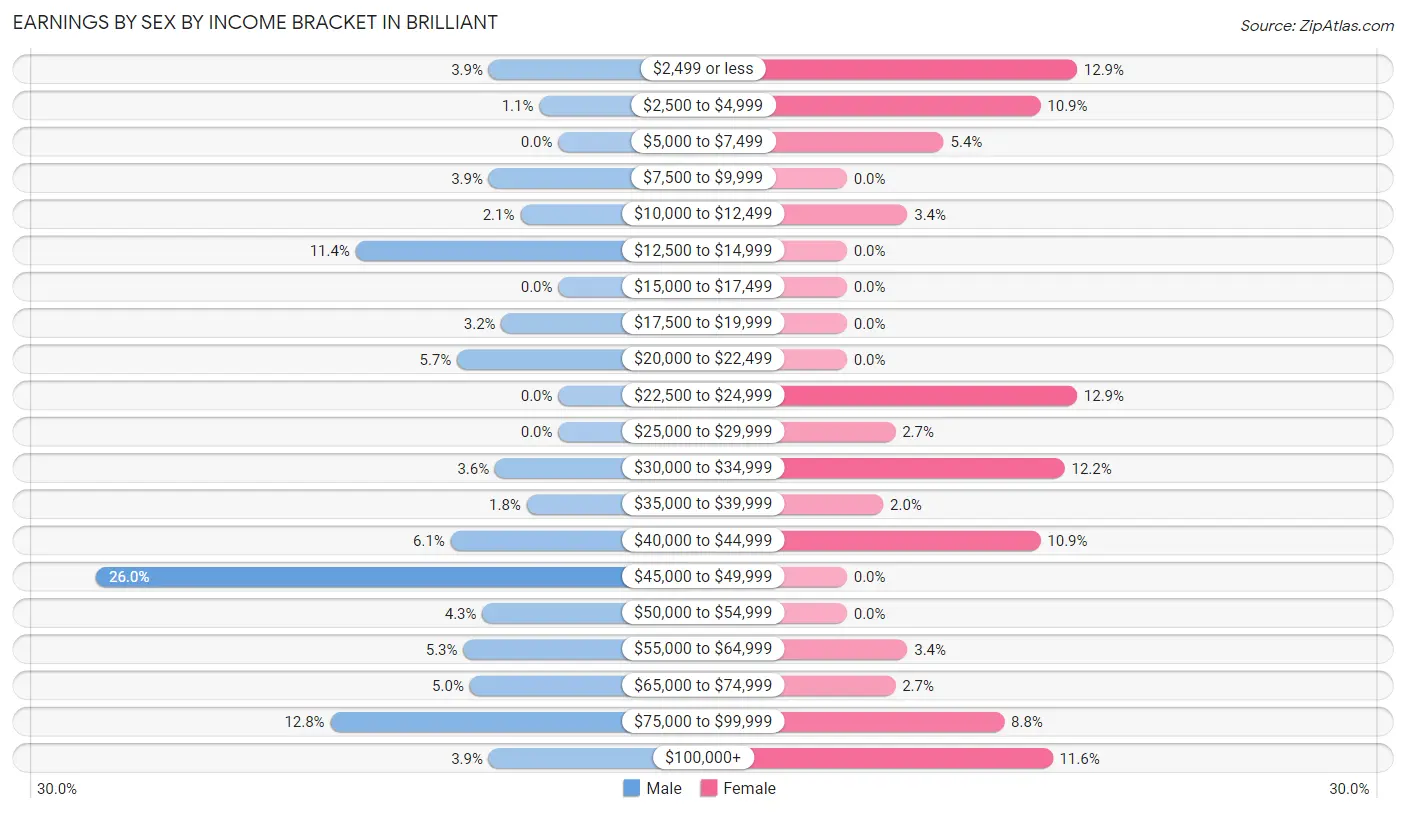
| Income | Male | Female |
| $2,499 or less | 11 (3.9%) | 19 (12.9%) |
| $2,500 to $4,999 | 3 (1.1%) | 16 (10.9%) |
| $5,000 to $7,499 | 0 (0.0%) | 8 (5.4%) |
| $7,500 to $9,999 | 11 (3.9%) | 0 (0.0%) |
| $10,000 to $12,499 | 6 (2.1%) | 5 (3.4%) |
| $12,500 to $14,999 | 32 (11.4%) | 0 (0.0%) |
| $15,000 to $17,499 | 0 (0.0%) | 0 (0.0%) |
| $17,500 to $19,999 | 9 (3.2%) | 0 (0.0%) |
| $20,000 to $22,499 | 16 (5.7%) | 0 (0.0%) |
| $22,500 to $24,999 | 0 (0.0%) | 19 (12.9%) |
| $25,000 to $29,999 | 0 (0.0%) | 4 (2.7%) |
| $30,000 to $34,999 | 10 (3.6%) | 18 (12.2%) |
| $35,000 to $39,999 | 5 (1.8%) | 3 (2.0%) |
| $40,000 to $44,999 | 17 (6.0%) | 16 (10.9%) |
| $45,000 to $49,999 | 73 (26.0%) | 0 (0.0%) |
| $50,000 to $54,999 | 12 (4.3%) | 0 (0.0%) |
| $55,000 to $64,999 | 15 (5.3%) | 5 (3.4%) |
| $65,000 to $74,999 | 14 (5.0%) | 4 (2.7%) |
| $75,000 to $99,999 | 36 (12.8%) | 13 (8.8%) |
| $100,000+ | 11 (3.9%) | 17 (11.6%) |
| Total | 281 (100.0%) | 147 (100.0%) |
Earnings by Sex by Educational Attainment in Brilliant
Average earnings in Brilliant are $45,993 for men and $33,542 for women, a difference of 27.1%. Men with an educational attainment of college or associate's degree enjoy the highest average annual earnings of $46,557, while those with high school diploma education earn the least with $44,327. Women with an educational attainment of high school diploma earn the most with the average annual earnings of $23,026, while those with high school diploma education have the smallest earnings of $23,026.
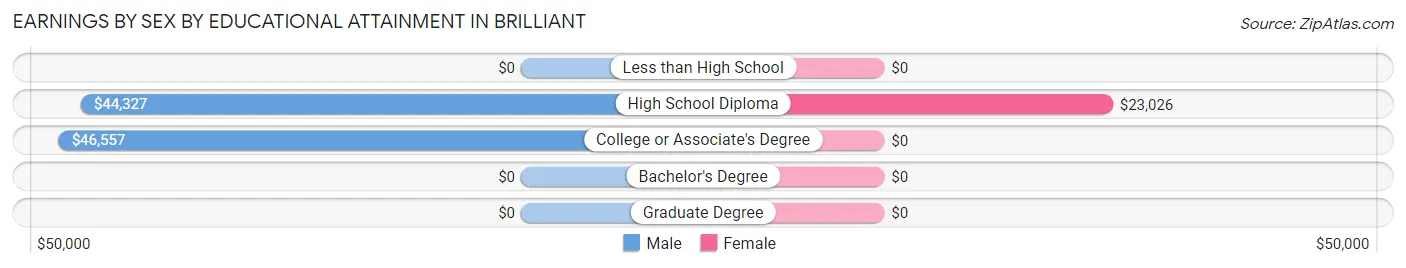
| Educational Attainment | Male Income | Female Income |
| Less than High School | - | - |
| High School Diploma | $44,327 | $23,026 |
| College or Associate's Degree | $46,557 | $0 |
| Bachelor's Degree | - | - |
| Graduate Degree | - | - |
| Total | $45,993 | $33,542 |
Family Income in Brilliant
Family Income Brackets in Brilliant
According to the Brilliant family income data, there are 56 families falling into the $50,000 to $74,999 income range, which is the most common income bracket and makes up 22.1% of all families. Conversely, the $150,000 to $199,999 income bracket is the least frequent group with only 4 families (1.6%) belonging to this category.
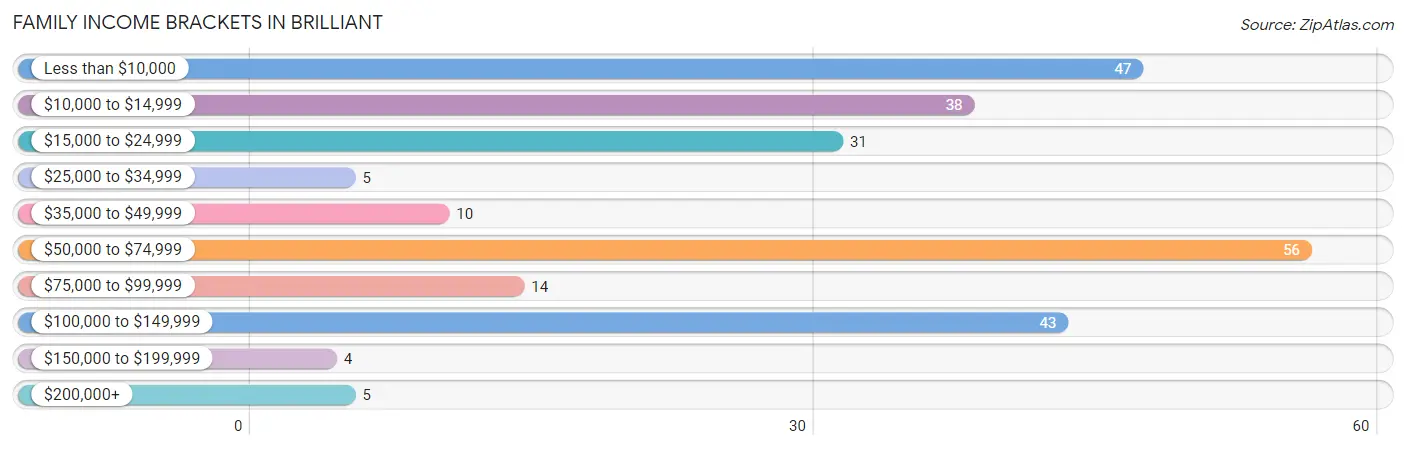
| Income Bracket | # Families | % Families |
| Less than $10,000 | 47 | 18.6% |
| $10,000 to $14,999 | 38 | 15.0% |
| $15,000 to $24,999 | 31 | 12.3% |
| $25,000 to $34,999 | 5 | 2.0% |
| $35,000 to $49,999 | 10 | 4.0% |
| $50,000 to $74,999 | 56 | 22.1% |
| $75,000 to $99,999 | 14 | 5.5% |
| $100,000 to $149,999 | 43 | 17.0% |
| $150,000 to $199,999 | 4 | 1.6% |
| $200,000+ | 5 | 2.0% |
Family Income by Famaliy Size in Brilliant
3-person families (51 | 20.2%) account for the highest median family income in Brilliant with $110,703 per family, while 3-person families (51 | 20.2%) have the highest median income of $36,901 per family member.
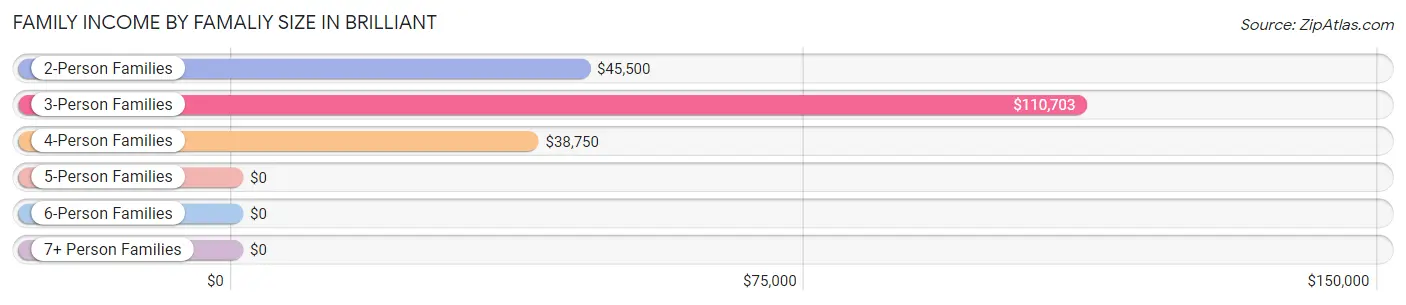
| Income Bracket | # Families | Median Income |
| 2-Person Families | 148 (58.5%) | $45,500 |
| 3-Person Families | 51 (20.2%) | $110,703 |
| 4-Person Families | 19 (7.5%) | $38,750 |
| 5-Person Families | 30 (11.9%) | $0 |
| 6-Person Families | 5 (2.0%) | $0 |
| 7+ Person Families | 0 (0.0%) | $0 |
| Total | 253 (100.0%) | $45,250 |
Family Income by Number of Earners in Brilliant
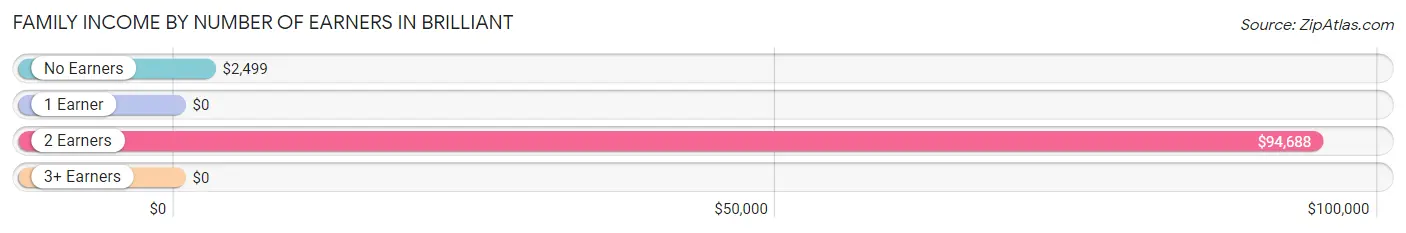
| Number of Earners | # Families | Median Income |
| No Earners | 82 (32.4%) | $2,499 |
| 1 Earner | 102 (40.3%) | $0 |
| 2 Earners | 69 (27.3%) | $94,688 |
| 3+ Earners | 0 (0.0%) | $0 |
| Total | 253 (100.0%) | $45,250 |
Household Income in Brilliant
Household Income Brackets in Brilliant
With 102 households falling in the category, the $15,000 to $24,999 income range is the most frequent in Brilliant, accounting for 18.5% of all households. In contrast, only 4 households (0.7%) fall into the $150,000 to $199,999 income bracket, making it the least populous group.
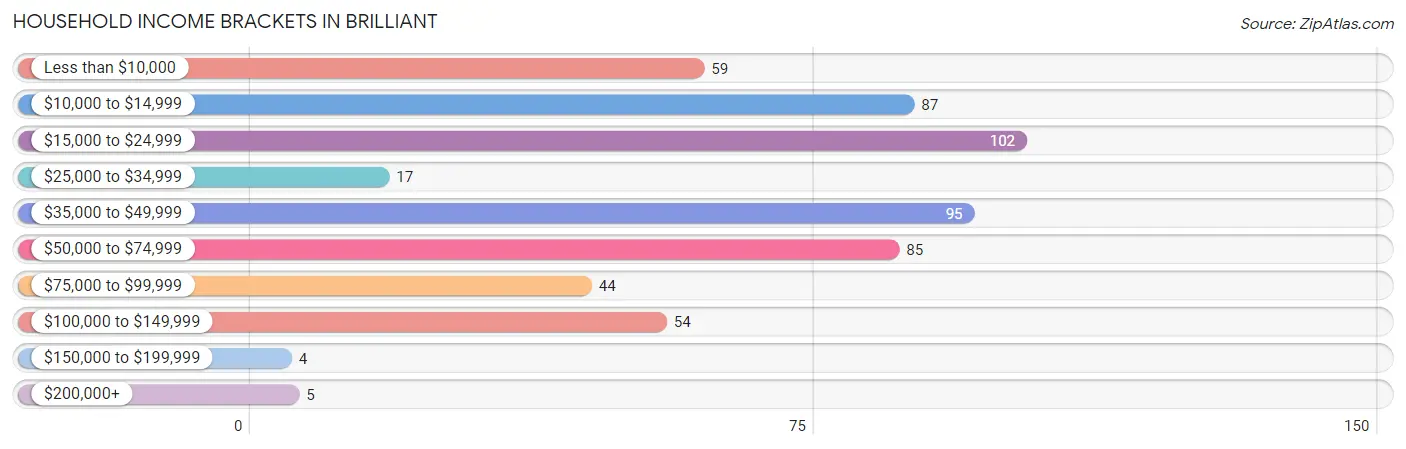
| Income Bracket | # Households | % Households |
| Less than $10,000 | 59 | 10.7% |
| $10,000 to $14,999 | 87 | 15.8% |
| $15,000 to $24,999 | 102 | 18.5% |
| $25,000 to $34,999 | 17 | 3.1% |
| $35,000 to $49,999 | 95 | 17.2% |
| $50,000 to $74,999 | 85 | 15.4% |
| $75,000 to $99,999 | 44 | 8.0% |
| $100,000 to $149,999 | 54 | 9.8% |
| $150,000 to $199,999 | 4 | 0.7% |
| $200,000+ | 5 | 0.9% |
Household Income by Householder Age in Brilliant
The median household income in Brilliant is $39,318, with the highest median household income of $46,865 found in the 45 to 64 years age bracket for the primary householder. A total of 269 households (48.7%) fall into this category. Meanwhile, the 15 to 24 years age bracket for the primary householder has the lowest median household income of $0, with 15 households (2.7%) in this group.
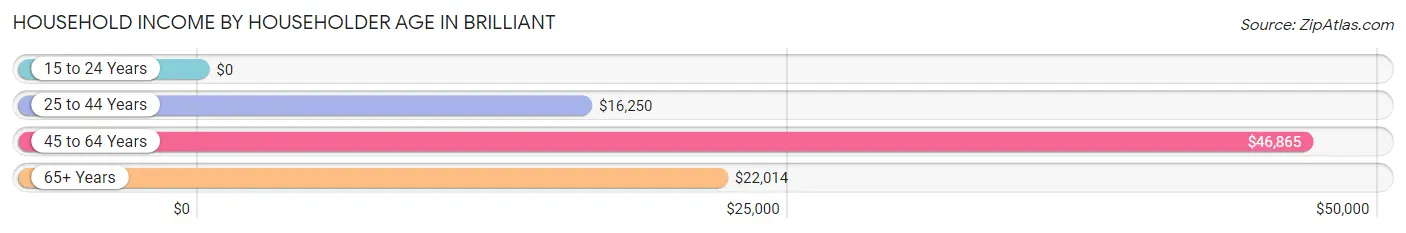
| Income Bracket | # Households | Median Income |
| 15 to 24 Years | 15 (2.7%) | $0 |
| 25 to 44 Years | 130 (23.5%) | $16,250 |
| 45 to 64 Years | 269 (48.7%) | $46,865 |
| 65+ Years | 138 (25.0%) | $22,014 |
| Total | 552 (100.0%) | $39,318 |
Poverty in Brilliant
Income Below Poverty by Sex and Age in Brilliant
With 35.2% poverty level for males and 53.4% for females among the residents of Brilliant, 6 to 11 year old males and 5 year old females are the most vulnerable to poverty, with 34 males (91.9%) and 16 females (100.0%) in their respective age groups living below the poverty level.
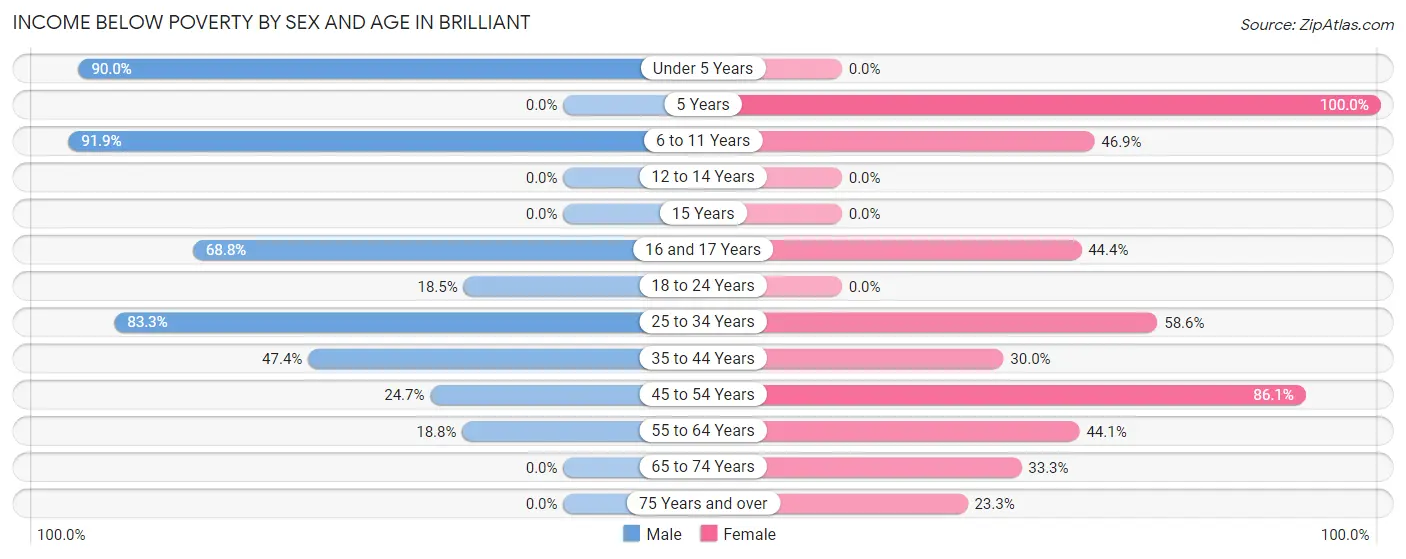
| Age Bracket | Male | Female |
| Under 5 Years | 54 (90.0%) | 0 (0.0%) |
| 5 Years | 0 (0.0%) | 16 (100.0%) |
| 6 to 11 Years | 34 (91.9%) | 30 (46.9%) |
| 12 to 14 Years | 0 (0.0%) | 0 (0.0%) |
| 15 Years | 0 (0.0%) | 0 (0.0%) |
| 16 and 17 Years | 11 (68.8%) | 4 (44.4%) |
| 18 to 24 Years | 5 (18.5%) | 0 (0.0%) |
| 25 to 34 Years | 30 (83.3%) | 65 (58.6%) |
| 35 to 44 Years | 9 (47.4%) | 12 (30.0%) |
| 45 to 54 Years | 20 (24.7%) | 130 (86.1%) |
| 55 to 64 Years | 39 (18.8%) | 15 (44.1%) |
| 65 to 74 Years | 0 (0.0%) | 24 (33.3%) |
| 75 Years and over | 0 (0.0%) | 7 (23.3%) |
| Total | 202 (35.2%) | 303 (53.4%) |
Income Above Poverty by Sex and Age in Brilliant
According to the poverty statistics in Brilliant, males aged 15 years and females aged under 5 years are the age groups that are most secure financially, with 100.0% of males and 100.0% of females in these age groups living above the poverty line.
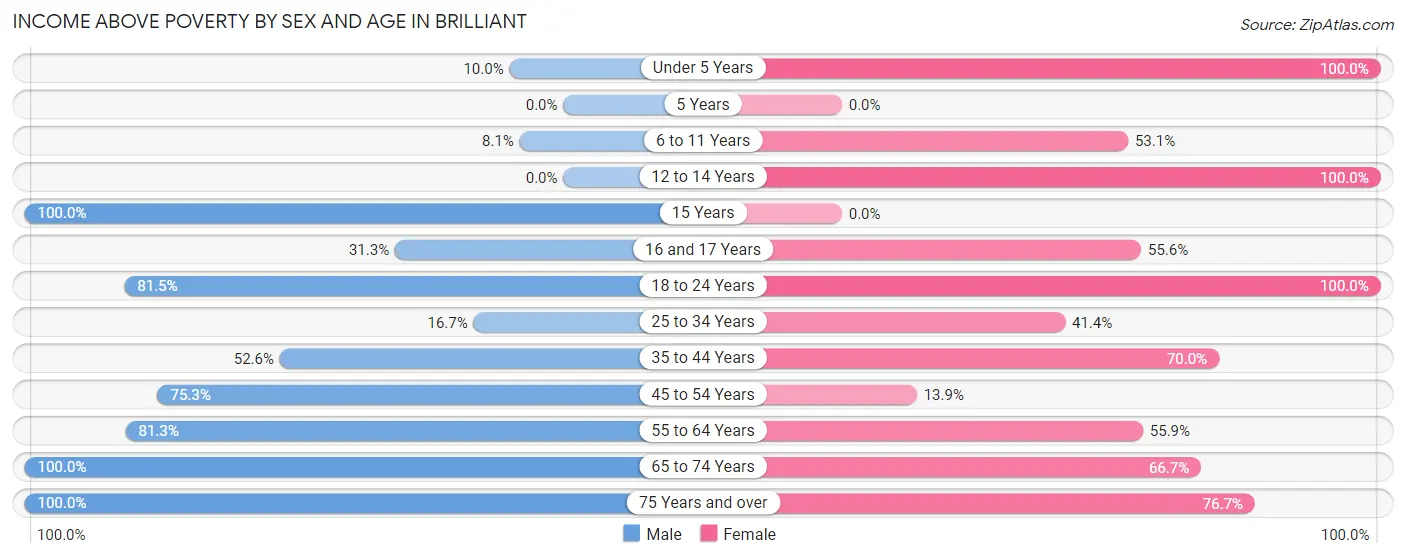
| Age Bracket | Male | Female |
| Under 5 Years | 6 (10.0%) | 23 (100.0%) |
| 5 Years | 0 (0.0%) | 0 (0.0%) |
| 6 to 11 Years | 3 (8.1%) | 34 (53.1%) |
| 12 to 14 Years | 0 (0.0%) | 2 (100.0%) |
| 15 Years | 11 (100.0%) | 0 (0.0%) |
| 16 and 17 Years | 5 (31.2%) | 5 (55.6%) |
| 18 to 24 Years | 22 (81.5%) | 15 (100.0%) |
| 25 to 34 Years | 6 (16.7%) | 46 (41.4%) |
| 35 to 44 Years | 10 (52.6%) | 28 (70.0%) |
| 45 to 54 Years | 61 (75.3%) | 21 (13.9%) |
| 55 to 64 Years | 169 (81.2%) | 19 (55.9%) |
| 65 to 74 Years | 26 (100.0%) | 48 (66.7%) |
| 75 Years and over | 53 (100.0%) | 23 (76.7%) |
| Total | 372 (64.8%) | 264 (46.6%) |
Income Below Poverty Among Married-Couple Families in Brilliant
The poverty statistics for married-couple families in Brilliant show that 22.0% or 37 of the total 168 families live below the poverty line. Families with 3 or 4 children have the highest poverty rate of 85.7%, comprising of 30 families. On the other hand, families with no children have the lowest poverty rate of 0.0%, which includes 0 families.
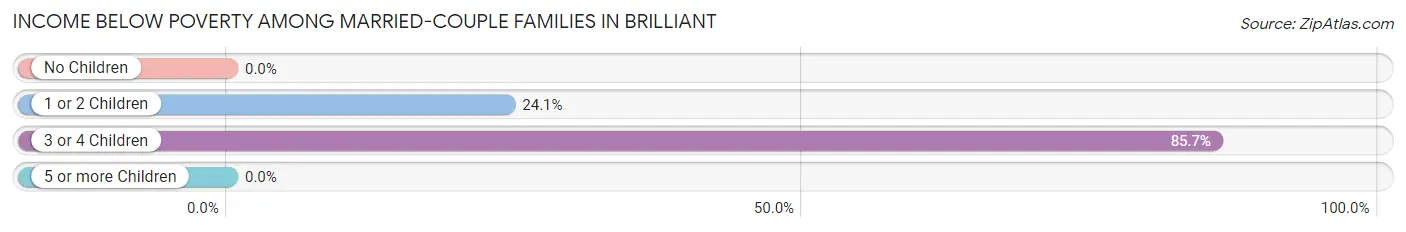
| Children | Above Poverty | Below Poverty |
| No Children | 104 (100.0%) | 0 (0.0%) |
| 1 or 2 Children | 22 (75.9%) | 7 (24.1%) |
| 3 or 4 Children | 5 (14.3%) | 30 (85.7%) |
| 5 or more Children | 0 (0.0%) | 0 (0.0%) |
| Total | 131 (78.0%) | 37 (22.0%) |
Income Below Poverty Among Single-Parent Households in Brilliant
According to the poverty data in Brilliant, 56.7% or 17 single-father households and 69.1% or 38 single-mother households are living below the poverty line. Among single-father households, those with 1 or 2 children have the highest poverty rate, with 17 households (68.0%) experiencing poverty. Likewise, among single-mother households, those with no children have the highest poverty rate, with 4 households (100.0%) falling below the poverty line.
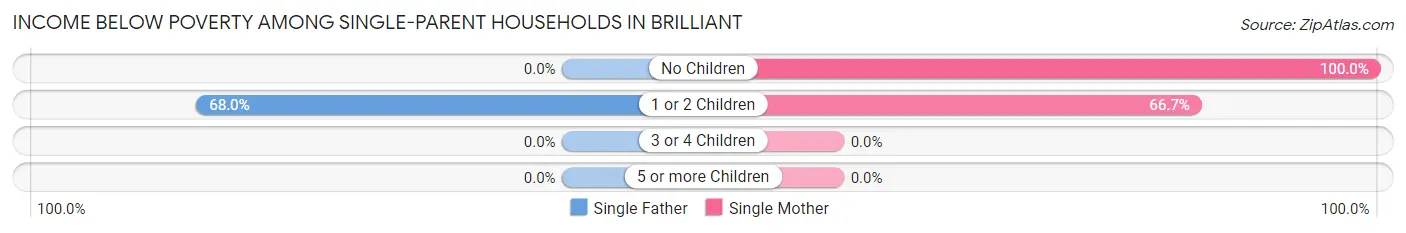
| Children | Single Father | Single Mother |
| No Children | 0 (0.0%) | 4 (100.0%) |
| 1 or 2 Children | 17 (68.0%) | 34 (66.7%) |
| 3 or 4 Children | 0 (0.0%) | 0 (0.0%) |
| 5 or more Children | 0 (0.0%) | 0 (0.0%) |
| Total | 17 (56.7%) | 38 (69.1%) |
Income Below Poverty Among Married-Couple vs Single-Parent Households in Brilliant
The poverty data for Brilliant shows that 37 of the married-couple family households (22.0%) and 55 of the single-parent households (64.7%) are living below the poverty level. Within the married-couple family households, those with 3 or 4 children have the highest poverty rate, with 30 households (85.7%) falling below the poverty line. Among the single-parent households, those with 1 or 2 children have the highest poverty rate, with 51 household (67.1%) living below poverty.
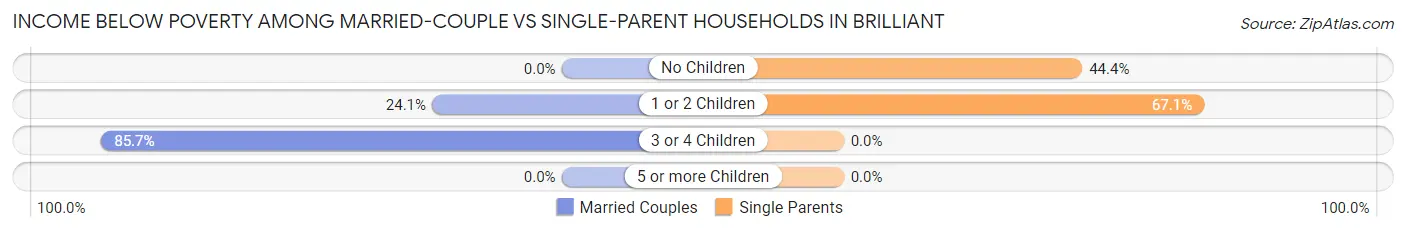
| Children | Married-Couple Families | Single-Parent Households |
| No Children | 0 (0.0%) | 4 (44.4%) |
| 1 or 2 Children | 7 (24.1%) | 51 (67.1%) |
| 3 or 4 Children | 30 (85.7%) | 0 (0.0%) |
| 5 or more Children | 0 (0.0%) | 0 (0.0%) |
| Total | 37 (22.0%) | 55 (64.7%) |
Race in Brilliant
The most populous races in Brilliant are White / Caucasian (1,116 | 97.5%), Black / African American (25 | 2.2%), and Hispanic or Latino (17 | 1.5%).
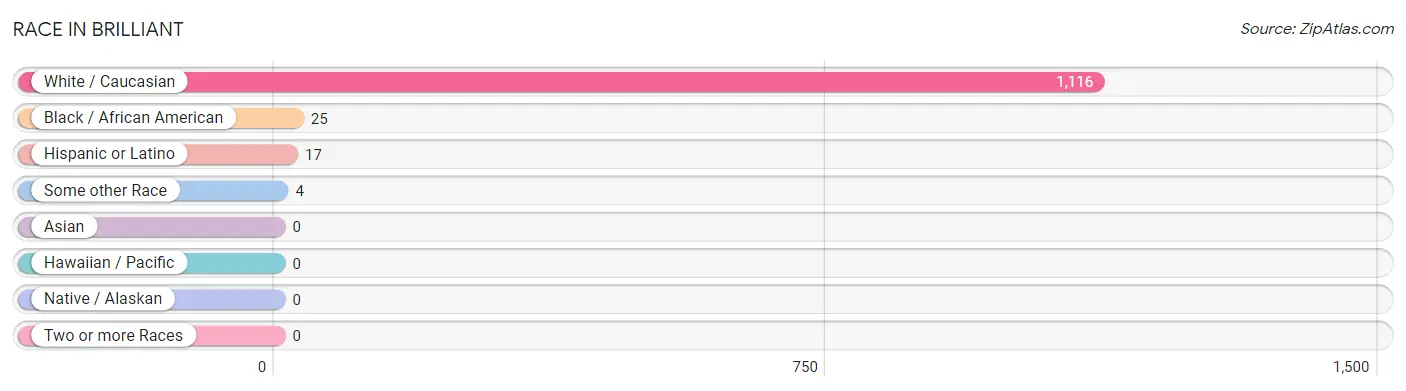
| Race | # Population | % Population |
| Asian | 0 | 0.0% |
| Black / African American | 25 | 2.2% |
| Hawaiian / Pacific | 0 | 0.0% |
| Hispanic or Latino | 17 | 1.5% |
| Native / Alaskan | 0 | 0.0% |
| White / Caucasian | 1,116 | 97.5% |
| Two or more Races | 0 | 0.0% |
| Some other Race | 4 | 0.4% |
| Total | 1,145 | 100.0% |
Ancestry in Brilliant
The most populous ancestries reported in Brilliant are German (210 | 18.3%), American (157 | 13.7%), English (102 | 8.9%), Irish (80 | 7.0%), and Welsh (64 | 5.6%), together accounting for 53.5% of all Brilliant residents.
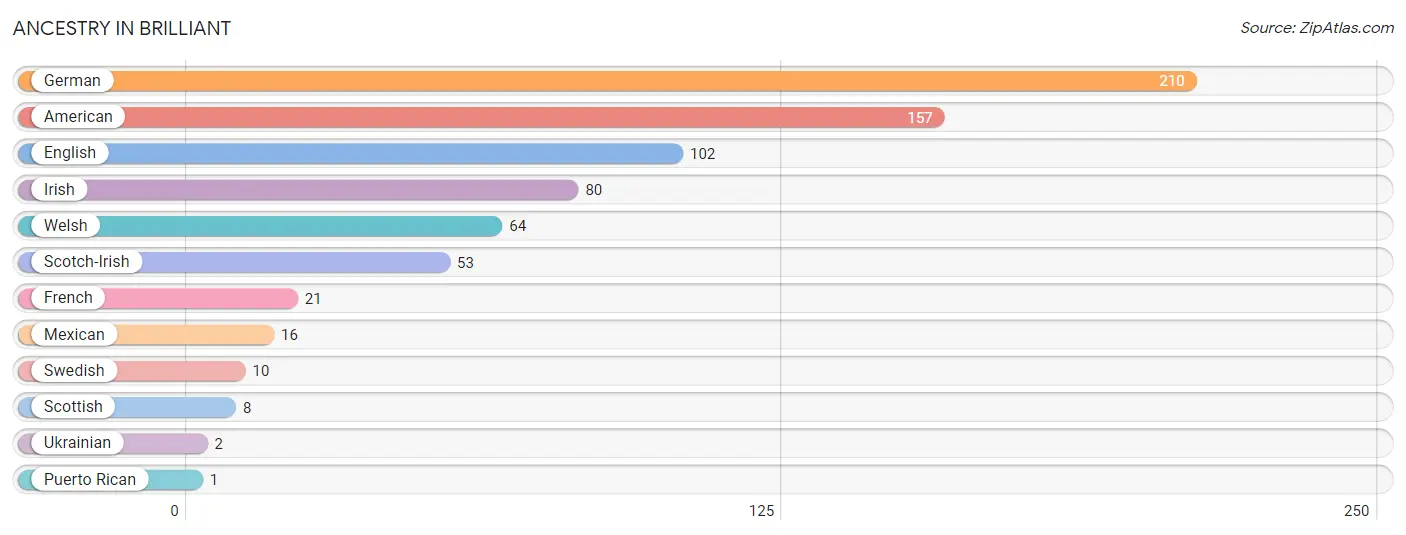
| Ancestry | # Population | % Population |
| American | 157 | 13.7% |
| English | 102 | 8.9% |
| French | 21 | 1.8% |
| German | 210 | 18.3% |
| Irish | 80 | 7.0% |
| Mexican | 16 | 1.4% |
| Puerto Rican | 1 | 0.1% |
| Scotch-Irish | 53 | 4.6% |
| Scottish | 8 | 0.7% |
| Swedish | 10 | 0.9% |
| Ukrainian | 2 | 0.2% |
| Welsh | 64 | 5.6% | View All 12 Rows |
Immigrants in Brilliant

| Immigration Origin | # Population | % Population | View All 0 Rows |
Sex and Age in Brilliant
Sex and Age in Brilliant
The most populous age groups in Brilliant are 55 to 59 Years (129 | 22.3%) for men and 50 to 54 Years (151 | 26.6%) for women.
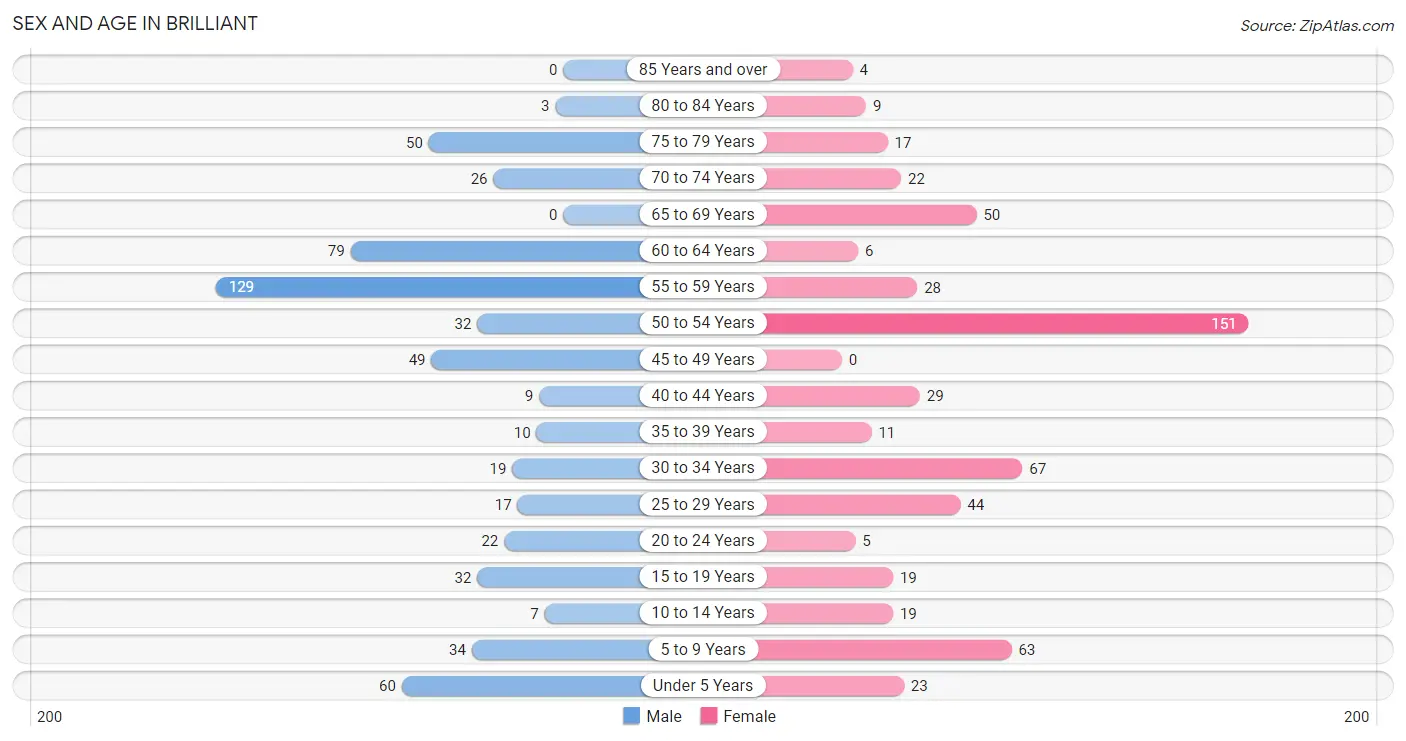
| Age Bracket | Male | Female |
| Under 5 Years | 60 (10.4%) | 23 (4.1%) |
| 5 to 9 Years | 34 (5.9%) | 63 (11.1%) |
| 10 to 14 Years | 7 (1.2%) | 19 (3.4%) |
| 15 to 19 Years | 32 (5.5%) | 19 (3.4%) |
| 20 to 24 Years | 22 (3.8%) | 5 (0.9%) |
| 25 to 29 Years | 17 (2.9%) | 44 (7.8%) |
| 30 to 34 Years | 19 (3.3%) | 67 (11.8%) |
| 35 to 39 Years | 10 (1.7%) | 11 (1.9%) |
| 40 to 44 Years | 9 (1.6%) | 29 (5.1%) |
| 45 to 49 Years | 49 (8.5%) | 0 (0.0%) |
| 50 to 54 Years | 32 (5.5%) | 151 (26.6%) |
| 55 to 59 Years | 129 (22.3%) | 28 (4.9%) |
| 60 to 64 Years | 79 (13.7%) | 6 (1.1%) |
| 65 to 69 Years | 0 (0.0%) | 50 (8.8%) |
| 70 to 74 Years | 26 (4.5%) | 22 (3.9%) |
| 75 to 79 Years | 50 (8.6%) | 17 (3.0%) |
| 80 to 84 Years | 3 (0.5%) | 9 (1.6%) |
| 85 Years and over | 0 (0.0%) | 4 (0.7%) |
| Total | 578 (100.0%) | 567 (100.0%) |
Families and Households in Brilliant
Median Family Size in Brilliant
The median family size in Brilliant is 2.69 persons per family, with married-couple families (168 | 66.4%) accounting for the largest median family size of 2.85 persons per family. On the other hand, single male/father families (30 | 11.9%) represent the smallest median family size with 2.00 persons per family.
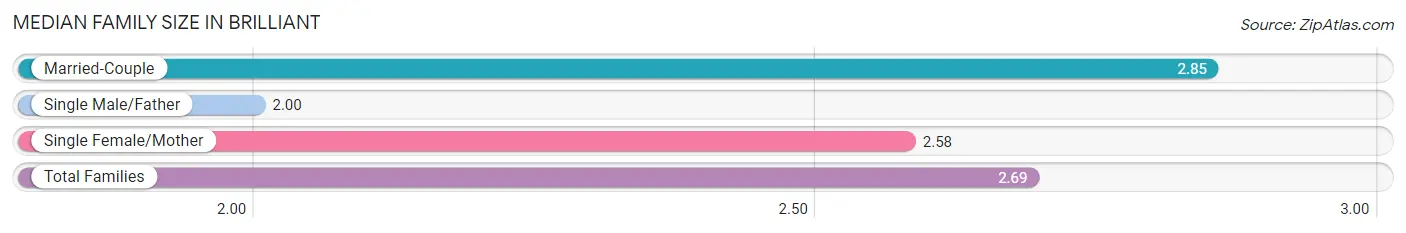
| Family Type | # Families | Family Size |
| Married-Couple | 168 (66.4%) | 2.85 |
| Single Male/Father | 30 (11.9%) | 2.00 |
| Single Female/Mother | 55 (21.7%) | 2.58 |
| Total Families | 253 (100.0%) | 2.69 |
Median Household Size in Brilliant
The median household size in Brilliant is 2.07 persons per household, with married-couple households (168 | 30.4%) accounting for the largest median household size of 2.88 persons per household. non-family households (299 | 54.2%) represent the smallest median household size with 1.43 persons per household.
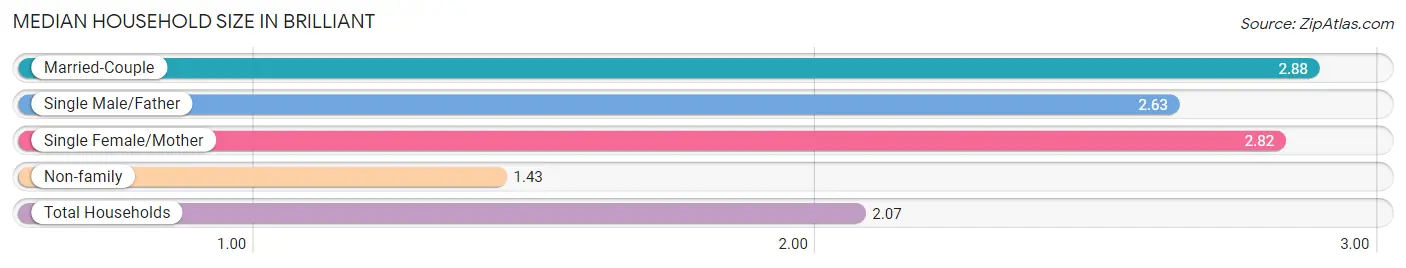
| Household Type | # Households | Household Size |
| Married-Couple | 168 (30.4%) | 2.88 |
| Single Male/Father | 30 (5.4%) | 2.63 |
| Single Female/Mother | 55 (10.0%) | 2.82 |
| Non-family | 299 (54.2%) | 1.43 |
| Total Households | 552 (100.0%) | 2.07 |
Household Size by Marriage Status in Brilliant
Out of a total of 552 households in Brilliant, 253 (45.8%) are family households, while 299 (54.2%) are nonfamily households. The most numerous type of family households are 2-person households, comprising 110, and the most common type of nonfamily households are 1-person households, comprising 261.
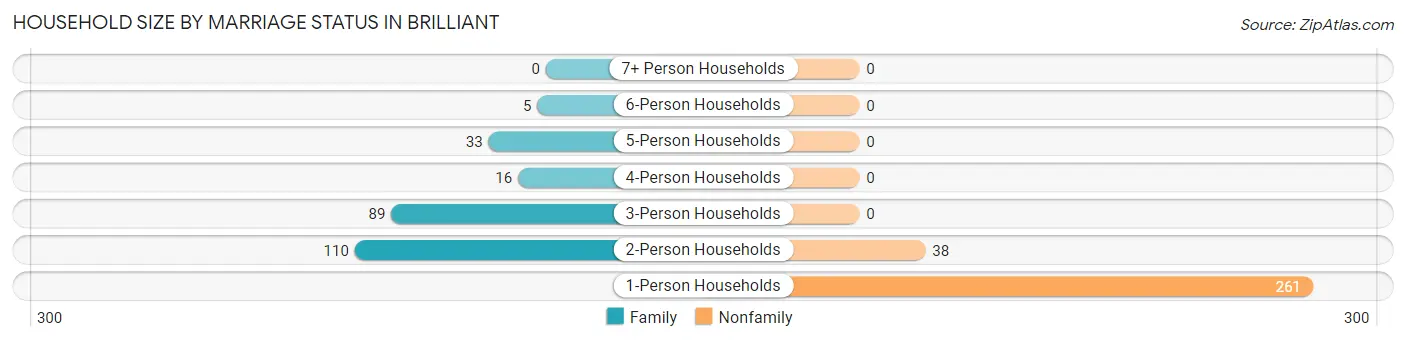
| Household Size | Family Households | Nonfamily Households |
| 1-Person Households | - | 261 (47.3%) |
| 2-Person Households | 110 (19.9%) | 38 (6.9%) |
| 3-Person Households | 89 (16.1%) | 0 (0.0%) |
| 4-Person Households | 16 (2.9%) | 0 (0.0%) |
| 5-Person Households | 33 (6.0%) | 0 (0.0%) |
| 6-Person Households | 5 (0.9%) | 0 (0.0%) |
| 7+ Person Households | 0 (0.0%) | 0 (0.0%) |
| Total | 253 (45.8%) | 299 (54.2%) |
Female Fertility in Brilliant
Fertility by Age in Brilliant
Average fertility rate in Brilliant is 194.0 births per 1,000 women. Women in the age bracket of 20 to 34 years have the highest fertility rate with 302.0 births per 1,000 women. Women in the age bracket of 20 to 34 years acount for 100.0% of all women with births.
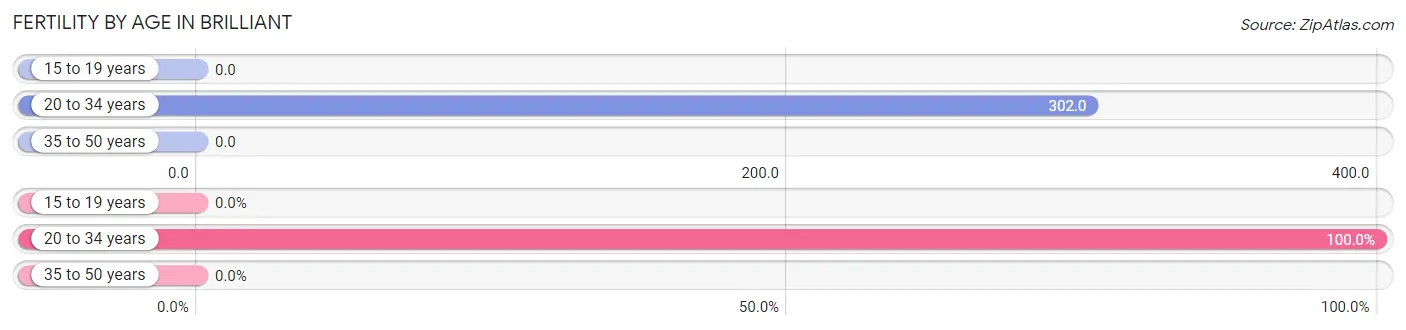
| Age Bracket | Women with Births | Births / 1,000 Women |
| 15 to 19 years | 0 (0.0%) | 0.0 |
| 20 to 34 years | 35 (100.0%) | 302.0 |
| 35 to 50 years | 0 (0.0%) | 0.0 |
| Total | 35 (100.0%) | 194.0 |
Fertility by Age by Marriage Status in Brilliant
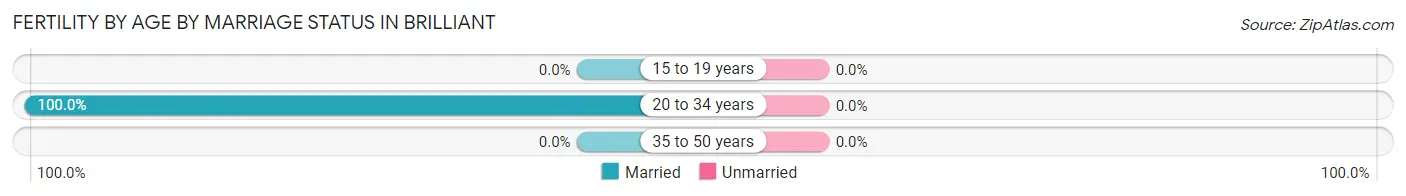
| Age Bracket | Married | Unmarried |
| 15 to 19 years | 0 (0.0%) | 0 (0.0%) |
| 20 to 34 years | 35 (100.0%) | 0 (0.0%) |
| 35 to 50 years | 0 (0.0%) | 0 (0.0%) |
| Total | 35 (100.0%) | 0 (0.0%) |
Fertility by Education in Brilliant
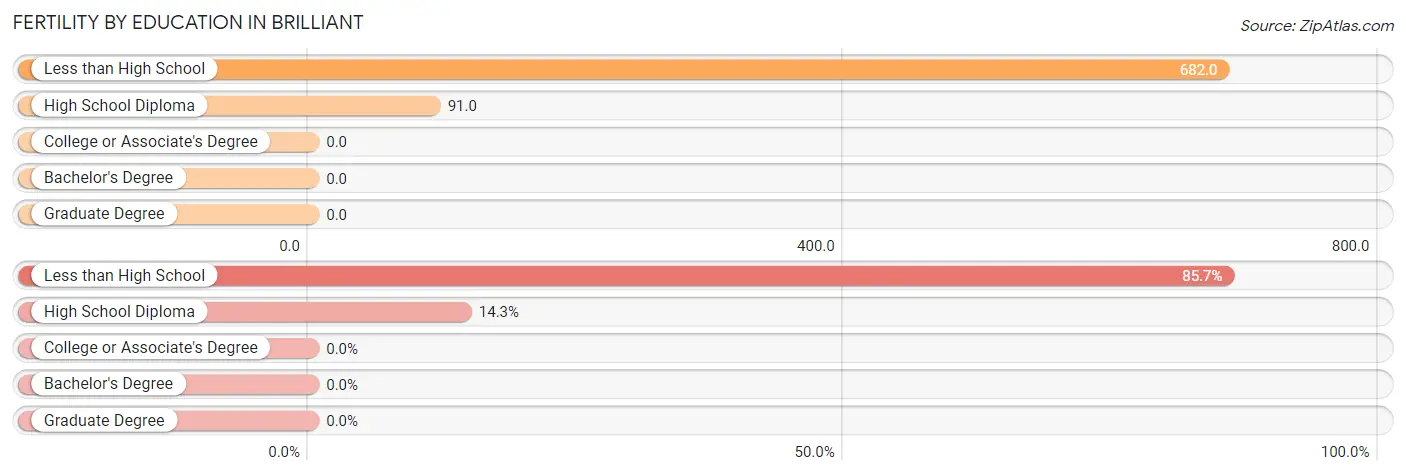
| Educational Attainment | Women with Births | Births / 1,000 Women |
| Less than High School | 30 (85.7%) | 682.0 |
| High School Diploma | 5 (14.3%) | 91.0 |
| College or Associate's Degree | 0 (0.0%) | 0.0 |
| Bachelor's Degree | 0 (0.0%) | 0.0 |
| Graduate Degree | 0 (0.0%) | 0.0 |
| Total | 35 (100.0%) | 194.0 |
Fertility by Education by Marriage Status in Brilliant
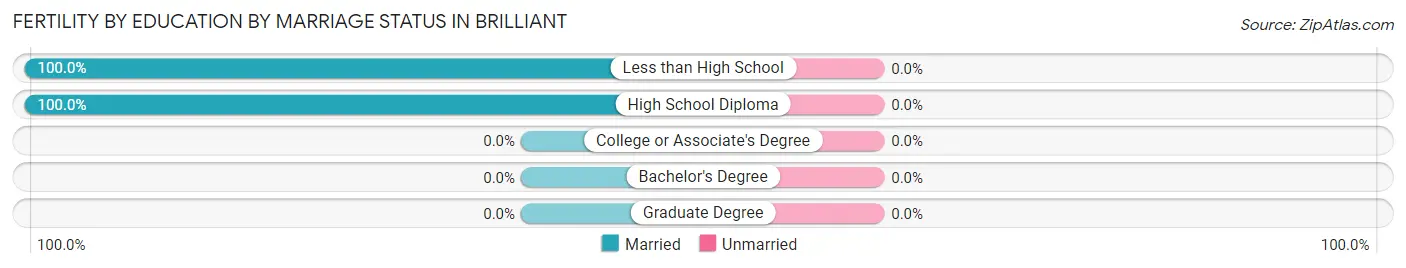
| Educational Attainment | Married | Unmarried |
| Less than High School | 30 (100.0%) | 0 (0.0%) |
| High School Diploma | 5 (100.0%) | 0 (0.0%) |
| College or Associate's Degree | 0 (0.0%) | 0 (0.0%) |
| Bachelor's Degree | 0 (0.0%) | 0 (0.0%) |
| Graduate Degree | 0 (0.0%) | 0 (0.0%) |
| Total | 35 (100.0%) | 0 (0.0%) |
Employment Characteristics in Brilliant
Employment by Class of Employer in Brilliant
Among the 356 employed individuals in Brilliant, private company employees (181 | 50.8%), local government employees (80 | 22.5%), and self-employed (not incorporated) (48 | 13.5%) make up the most common classes of employment.
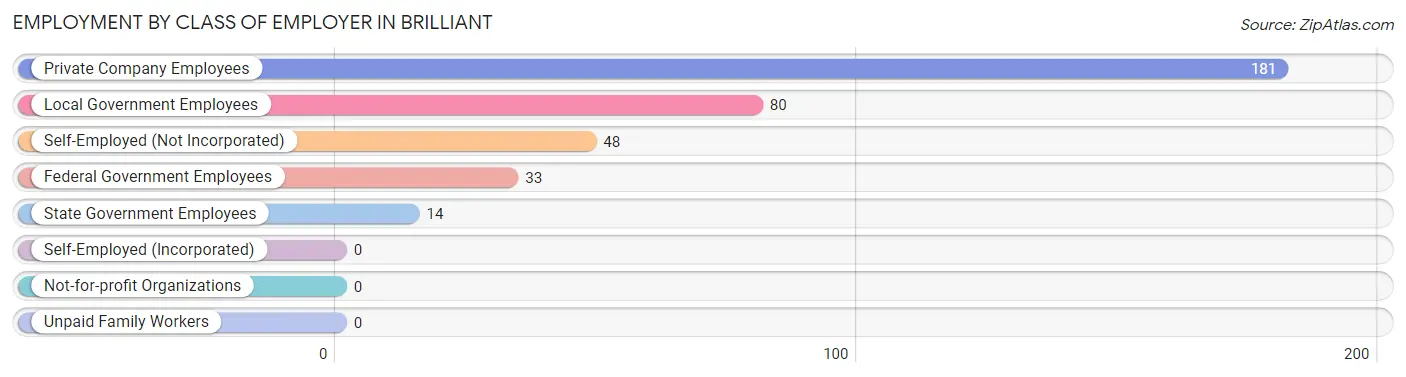
| Employer Class | # Employees | % Employees |
| Private Company Employees | 181 | 50.8% |
| Self-Employed (Incorporated) | 0 | 0.0% |
| Self-Employed (Not Incorporated) | 48 | 13.5% |
| Not-for-profit Organizations | 0 | 0.0% |
| Local Government Employees | 80 | 22.5% |
| State Government Employees | 14 | 3.9% |
| Federal Government Employees | 33 | 9.3% |
| Unpaid Family Workers | 0 | 0.0% |
| Total | 356 | 100.0% |
Employment Status by Age in Brilliant
According to the labor force statistics for Brilliant, out of the total population over 16 years of age (928), 46.7% or 433 individuals are in the labor force, with 15.5% or 67 of them unemployed. The age group with the highest labor force participation rate is 20 to 24 years, with 100.0% or 27 individuals in the labor force. Within the labor force, the 16 to 19 years age range has the highest percentage of unemployed individuals, with 68.8% or 11 of them being unemployed.
| Age Bracket | In Labor Force | Unemployed |
| 16 to 19 Years | 16 (40.0%) | 11 (68.8%) |
| 20 to 24 Years | 27 (100.0%) | 12 (44.4%) |
| 25 to 29 Years | 61 (100.0%) | 35 (57.4%) |
| 30 to 34 Years | 27 (31.4%) | 0 (0.0%) |
| 35 to 44 Years | 39 (66.1%) | 0 (0.0%) |
| 45 to 54 Years | 84 (36.2%) | 0 (0.0%) |
| 55 to 59 Years | 96 (61.1%) | 4 (4.2%) |
| 60 to 64 Years | 56 (65.9%) | 4 (7.1%) |
| 65 to 74 Years | 23 (23.5%) | 0 (0.0%) |
| 75 Years and over | 4 (4.8%) | 0 (0.0%) |
| Total | 433 (46.7%) | 67 (15.5%) |
Employment Status by Educational Attainment in Brilliant
According to labor force statistics for Brilliant, 53.4% of individuals (363) out of the total population between 25 and 64 years of age (680) are in the labor force, with 12.0% or 44 of them being unemployed. The group with the highest labor force participation rate are those with the educational attainment of bachelor's degree or higher, with 87.8% or 36 individuals in the labor force. Within the labor force, individuals with bachelor's degree or higher education have the highest percentage of unemployment, with 60.0% or 22 of them being unemployed.
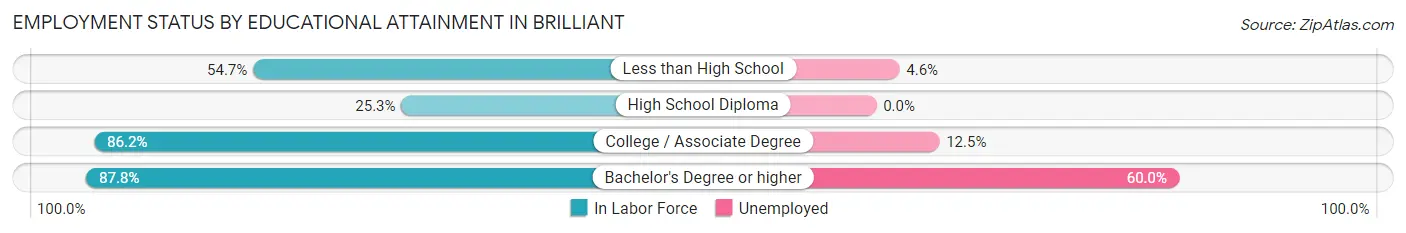
| Educational Attainment | In Labor Force | Unemployed |
| Less than High School | 87 (54.7%) | 7 (4.6%) |
| High School Diploma | 72 (25.3%) | 0 (0.0%) |
| College / Associate Degree | 168 (86.2%) | 24 (12.5%) |
| Bachelor's Degree or higher | 36 (87.8%) | 25 (60.0%) |
| Total | 363 (53.4%) | 82 (12.0%) |
Employment Occupations by Sex in Brilliant
Management, Business, Science and Arts Occupations
The most common Management, Business, Science and Arts occupations in Brilliant are Health Diagnosing & Treating (32 | 8.9%), Health Technologists (32 | 8.9%), Community & Social Service (19 | 5.3%), Management (10 | 2.8%), and Arts, Media & Entertainment (8 | 2.2%).
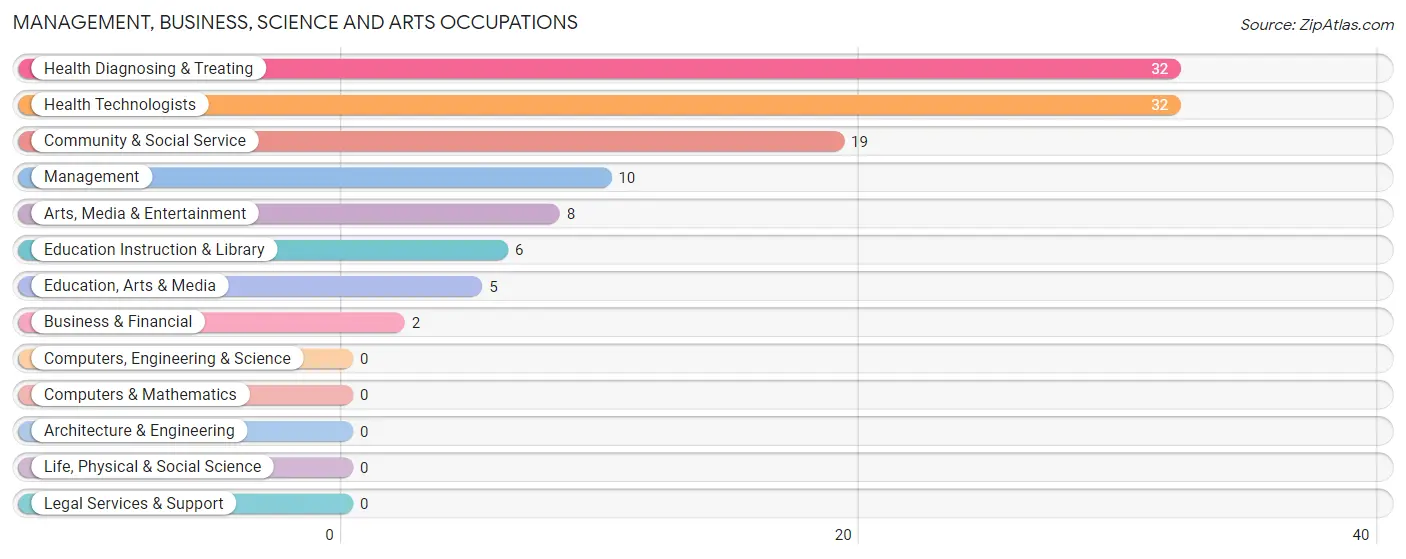
Management, Business, Science and Arts Occupations by Sex
Within the Management, Business, Science and Arts occupations in Brilliant, the most male-oriented occupations are Management (100.0%), Arts, Media & Entertainment (100.0%), and Community & Social Service (52.6%), while the most female-oriented occupations are Business & Financial (100.0%), Education, Arts & Media (100.0%), and Health Diagnosing & Treating (100.0%).
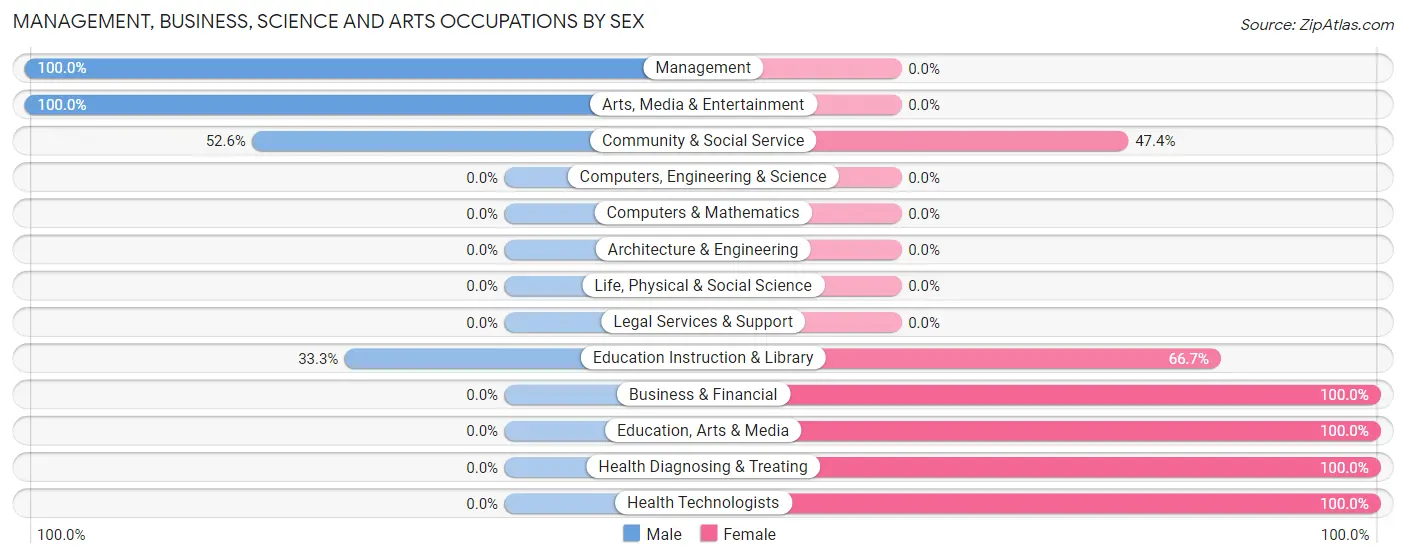
| Occupation | Male | Female |
| Management | 10 (100.0%) | 0 (0.0%) |
| Business & Financial | 0 (0.0%) | 2 (100.0%) |
| Computers, Engineering & Science | 0 (0.0%) | 0 (0.0%) |
| Computers & Mathematics | 0 (0.0%) | 0 (0.0%) |
| Architecture & Engineering | 0 (0.0%) | 0 (0.0%) |
| Life, Physical & Social Science | 0 (0.0%) | 0 (0.0%) |
| Community & Social Service | 10 (52.6%) | 9 (47.4%) |
| Education, Arts & Media | 0 (0.0%) | 5 (100.0%) |
| Legal Services & Support | 0 (0.0%) | 0 (0.0%) |
| Education Instruction & Library | 2 (33.3%) | 4 (66.7%) |
| Arts, Media & Entertainment | 8 (100.0%) | 0 (0.0%) |
| Health Diagnosing & Treating | 0 (0.0%) | 32 (100.0%) |
| Health Technologists | 0 (0.0%) | 32 (100.0%) |
| Total (Category) | 20 (31.8%) | 43 (68.2%) |
| Total (Overall) | 241 (66.8%) | 120 (33.2%) |
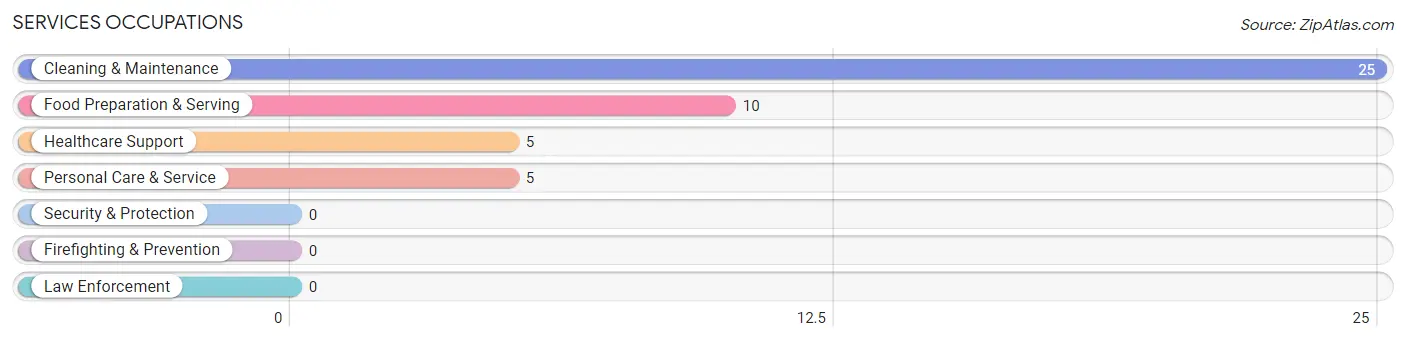
Services Occupations
The most common Services occupations in Brilliant are Cleaning & Maintenance (25 | 6.9%), Food Preparation & Serving (10 | 2.8%), Healthcare Support (5 | 1.4%), and Personal Care & Service (5 | 1.4%).
Services Occupations by Sex
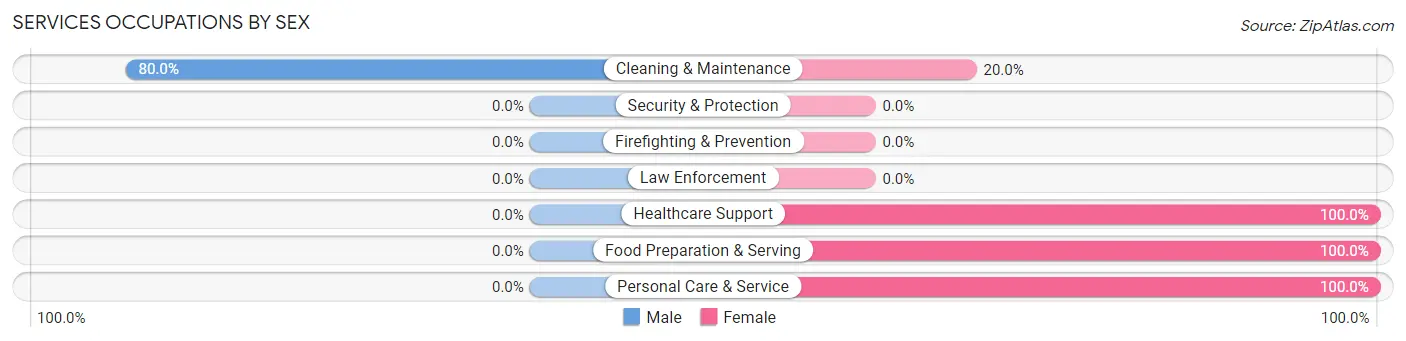
| Occupation | Male | Female |
| Healthcare Support | 0 (0.0%) | 5 (100.0%) |
| Security & Protection | 0 (0.0%) | 0 (0.0%) |
| Firefighting & Prevention | 0 (0.0%) | 0 (0.0%) |
| Law Enforcement | 0 (0.0%) | 0 (0.0%) |
| Food Preparation & Serving | 0 (0.0%) | 10 (100.0%) |
| Cleaning & Maintenance | 20 (80.0%) | 5 (20.0%) |
| Personal Care & Service | 0 (0.0%) | 5 (100.0%) |
| Total (Category) | 20 (44.4%) | 25 (55.6%) |
| Total (Overall) | 241 (66.8%) | 120 (33.2%) |
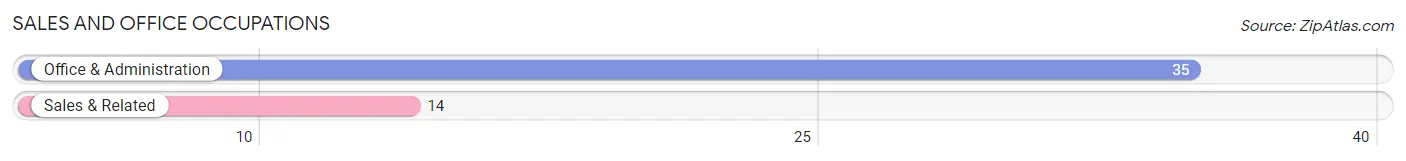
Sales and Office Occupations
The most common Sales and Office occupations in Brilliant are Office & Administration (35 | 9.7%), and Sales & Related (14 | 3.9%).
Sales and Office Occupations by Sex
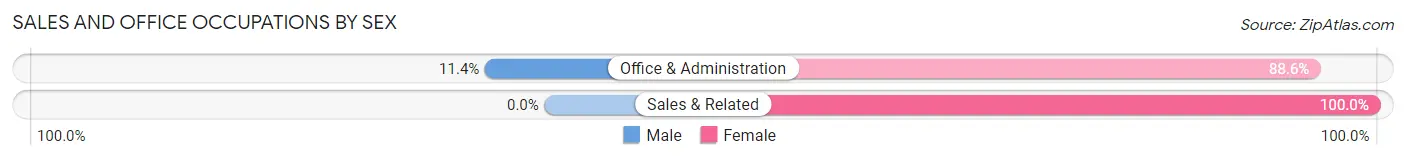
| Occupation | Male | Female |
| Sales & Related | 0 (0.0%) | 14 (100.0%) |
| Office & Administration | 4 (11.4%) | 31 (88.6%) |
| Total (Category) | 4 (8.2%) | 45 (91.8%) |
| Total (Overall) | 241 (66.8%) | 120 (33.2%) |
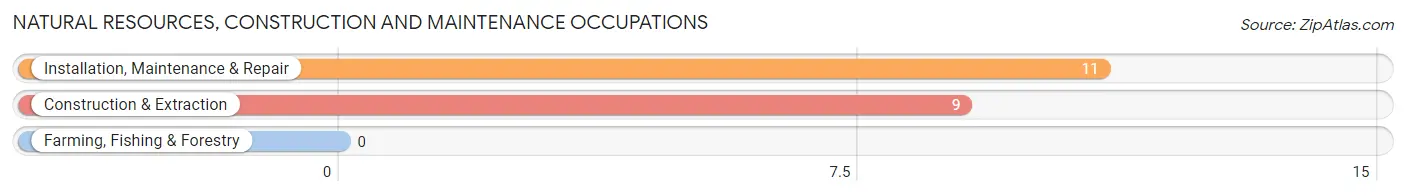
Natural Resources, Construction and Maintenance Occupations
The most common Natural Resources, Construction and Maintenance occupations in Brilliant are Installation, Maintenance & Repair (11 | 3.0%), and Construction & Extraction (9 | 2.5%).
Natural Resources, Construction and Maintenance Occupations by Sex
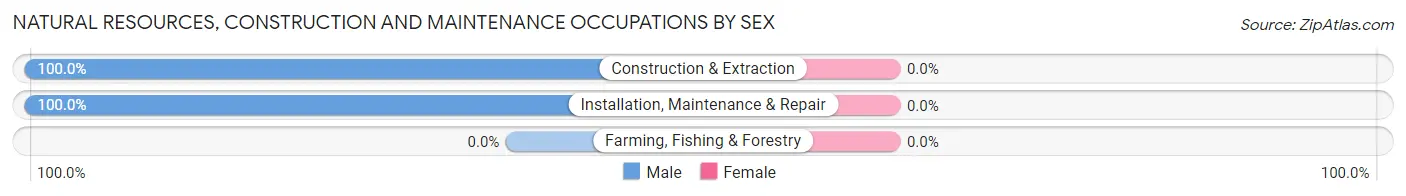
| Occupation | Male | Female |
| Farming, Fishing & Forestry | 0 (0.0%) | 0 (0.0%) |
| Construction & Extraction | 9 (100.0%) | 0 (0.0%) |
| Installation, Maintenance & Repair | 11 (100.0%) | 0 (0.0%) |
| Total (Category) | 20 (100.0%) | 0 (0.0%) |
| Total (Overall) | 241 (66.8%) | 120 (33.2%) |
Production, Transportation and Moving Occupations
The most common Production, Transportation and Moving occupations in Brilliant are Production (95 | 26.3%), Transportation (60 | 16.6%), and Material Moving (29 | 8.0%).
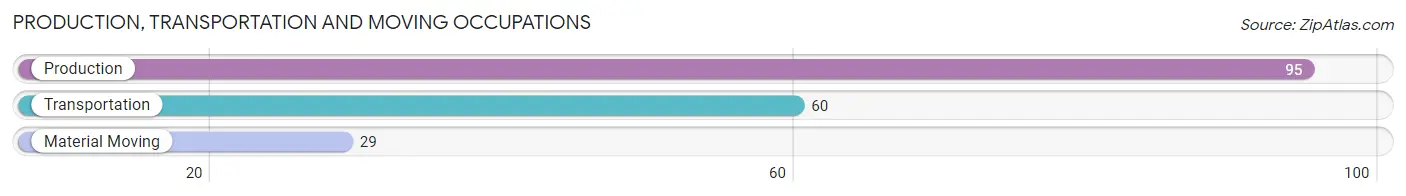
Production, Transportation and Moving Occupations by Sex
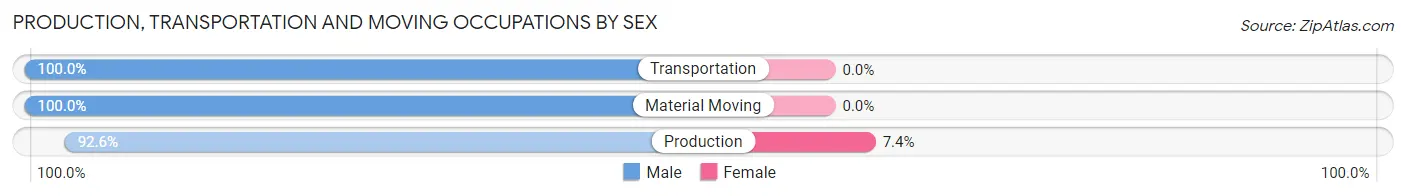
| Occupation | Male | Female |
| Production | 88 (92.6%) | 7 (7.4%) |
| Transportation | 60 (100.0%) | 0 (0.0%) |
| Material Moving | 29 (100.0%) | 0 (0.0%) |
| Total (Category) | 177 (96.2%) | 7 (3.8%) |
| Total (Overall) | 241 (66.8%) | 120 (33.2%) |
Employment Industries by Sex in Brilliant
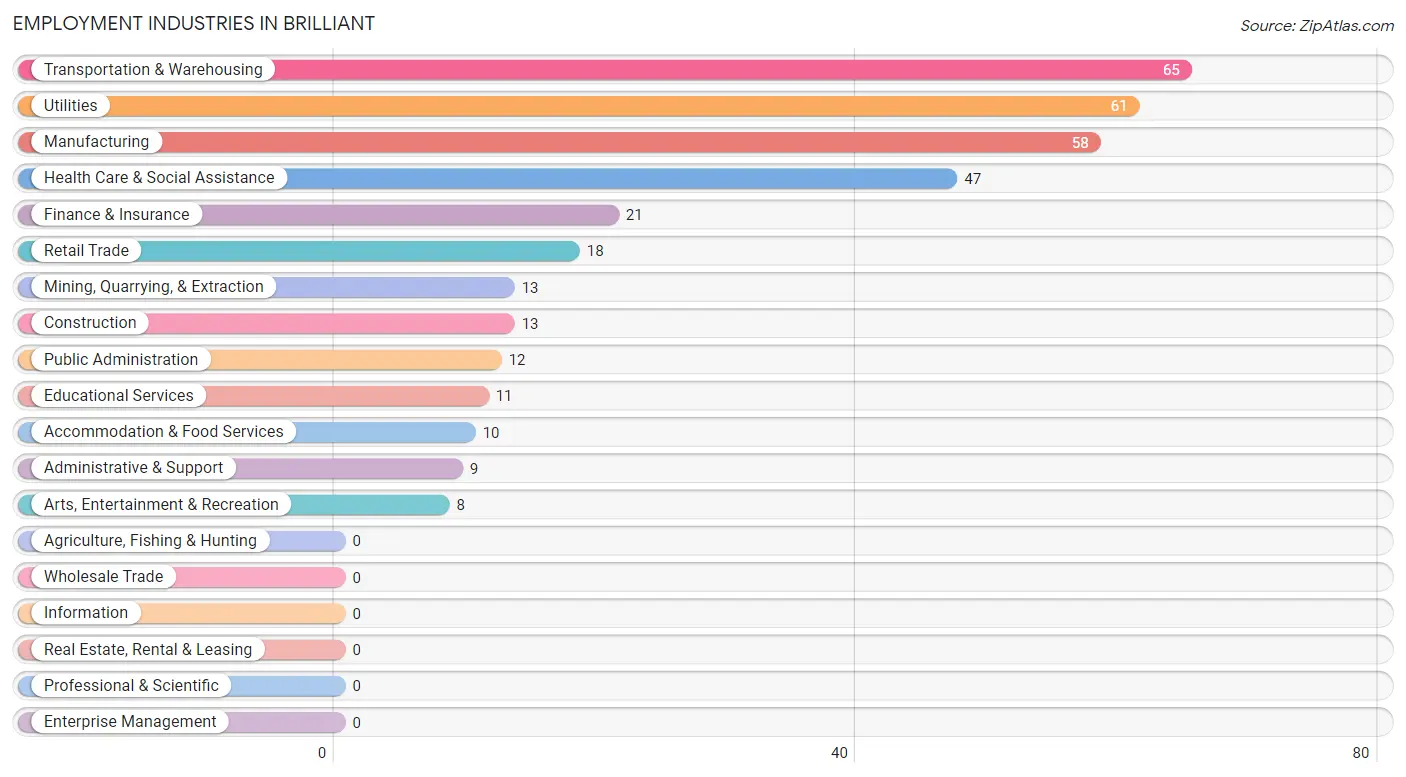
Employment Industries in Brilliant
The major employment industries in Brilliant include Transportation & Warehousing (65 | 18.0%), Utilities (61 | 16.9%), Manufacturing (58 | 16.1%), Health Care & Social Assistance (47 | 13.0%), and Finance & Insurance (21 | 5.8%).
Employment Industries by Sex in Brilliant
The Brilliant industries that see more men than women are Mining, Quarrying, & Extraction (100.0%), Construction (100.0%), and Transportation & Warehousing (100.0%), whereas the industries that tend to have a higher number of women are Finance & Insurance (100.0%), Accommodation & Food Services (100.0%), and Public Administration (100.0%).
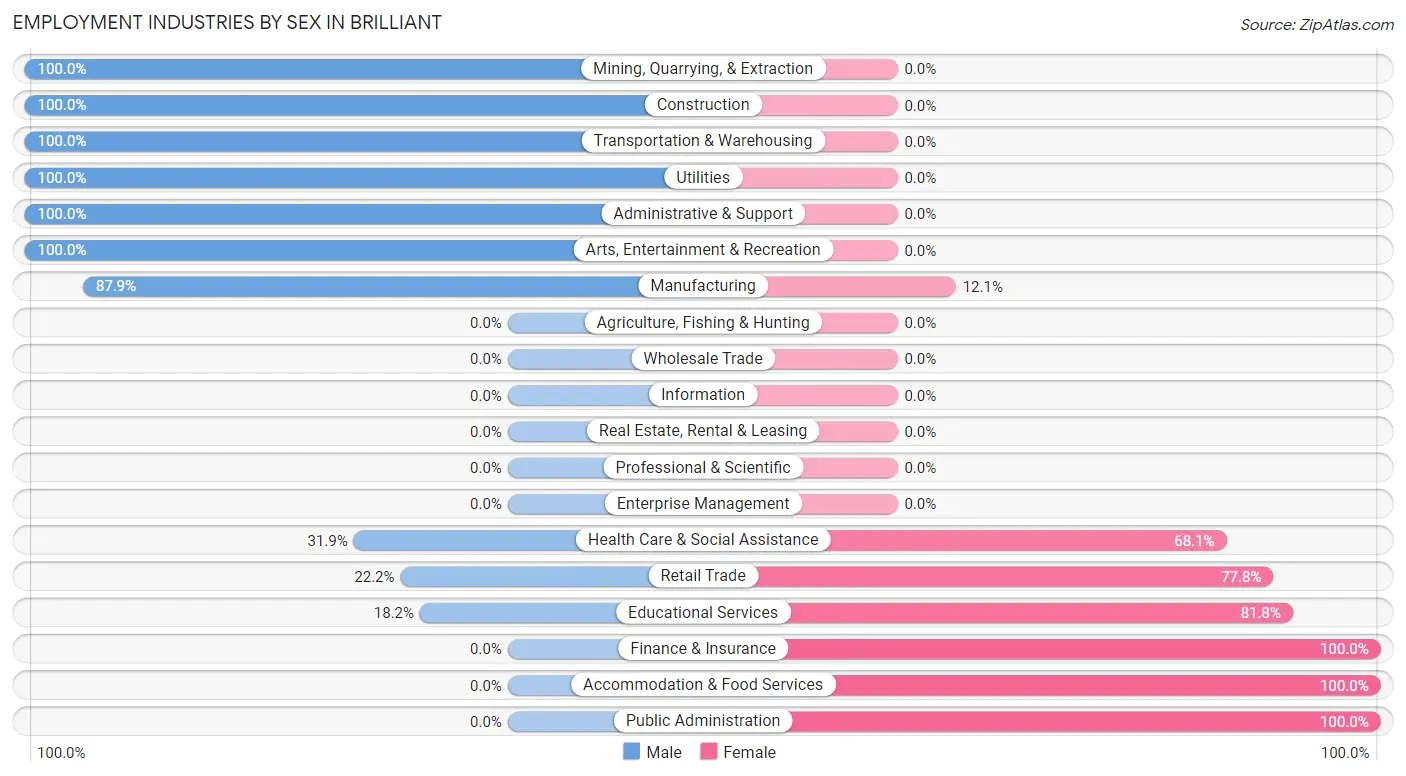
| Industry | Male | Female |
| Agriculture, Fishing & Hunting | 0 (0.0%) | 0 (0.0%) |
| Mining, Quarrying, & Extraction | 13 (100.0%) | 0 (0.0%) |
| Construction | 13 (100.0%) | 0 (0.0%) |
| Manufacturing | 51 (87.9%) | 7 (12.1%) |
| Wholesale Trade | 0 (0.0%) | 0 (0.0%) |
| Retail Trade | 4 (22.2%) | 14 (77.8%) |
| Transportation & Warehousing | 65 (100.0%) | 0 (0.0%) |
| Utilities | 61 (100.0%) | 0 (0.0%) |
| Information | 0 (0.0%) | 0 (0.0%) |
| Finance & Insurance | 0 (0.0%) | 21 (100.0%) |
| Real Estate, Rental & Leasing | 0 (0.0%) | 0 (0.0%) |
| Professional & Scientific | 0 (0.0%) | 0 (0.0%) |
| Enterprise Management | 0 (0.0%) | 0 (0.0%) |
| Administrative & Support | 9 (100.0%) | 0 (0.0%) |
| Educational Services | 2 (18.2%) | 9 (81.8%) |
| Health Care & Social Assistance | 15 (31.9%) | 32 (68.1%) |
| Arts, Entertainment & Recreation | 8 (100.0%) | 0 (0.0%) |
| Accommodation & Food Services | 0 (0.0%) | 10 (100.0%) |
| Public Administration | 0 (0.0%) | 12 (100.0%) |
| Total | 241 (66.8%) | 120 (33.2%) |
Education in Brilliant
School Enrollment in Brilliant
The most common levels of schooling among the 166 students in Brilliant are high school (41 | 24.7%), elementary school (40 | 24.1%), and kindergarten (38 | 22.9%).
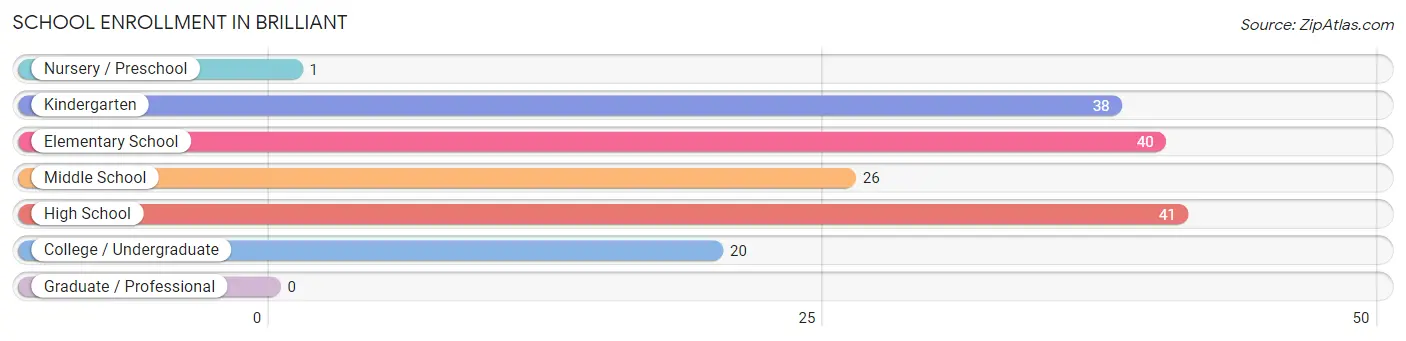
| School Level | # Students | % Students |
| Nursery / Preschool | 1 | 0.6% |
| Kindergarten | 38 | 22.9% |
| Elementary School | 40 | 24.1% |
| Middle School | 26 | 15.7% |
| High School | 41 | 24.7% |
| College / Undergraduate | 20 | 12.0% |
| Graduate / Professional | 0 | 0.0% |
| Total | 166 | 100.0% |
School Enrollment by Age by Funding Source in Brilliant
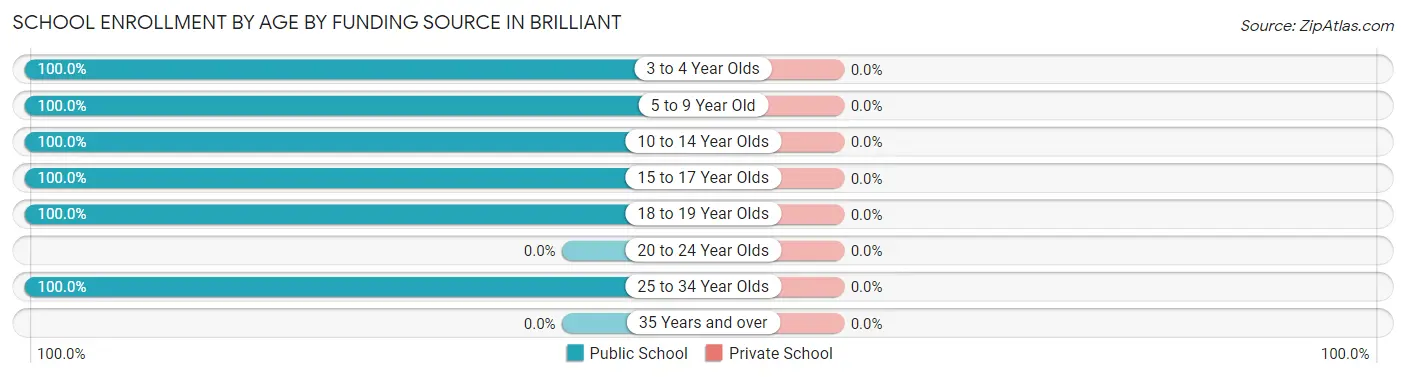
| Age Bracket | Public School | Private School |
| 3 to 4 Year Olds | 1 (100.0%) | 0 (0.0%) |
| 5 to 9 Year Old | 78 (100.0%) | 0 (0.0%) |
| 10 to 14 Year Olds | 26 (100.0%) | 0 (0.0%) |
| 15 to 17 Year Olds | 36 (100.0%) | 0 (0.0%) |
| 18 to 19 Year Olds | 15 (100.0%) | 0 (0.0%) |
| 20 to 24 Year Olds | 0 (0.0%) | 0 (0.0%) |
| 25 to 34 Year Olds | 10 (100.0%) | 0 (0.0%) |
| 35 Years and over | 0 (0.0%) | 0 (0.0%) |
| Total | 166 (100.0%) | 0 (0.0%) |
Educational Attainment by Field of Study in Brilliant
Bio, nature & agricultural (18 | 30.0%), education (15 | 25.0%), business (14 | 23.3%), arts & humanities (11 | 18.3%), and computers & mathematics (1 | 1.7%) are the most common fields of study among 60 individuals in Brilliant who have obtained a bachelor's degree or higher.
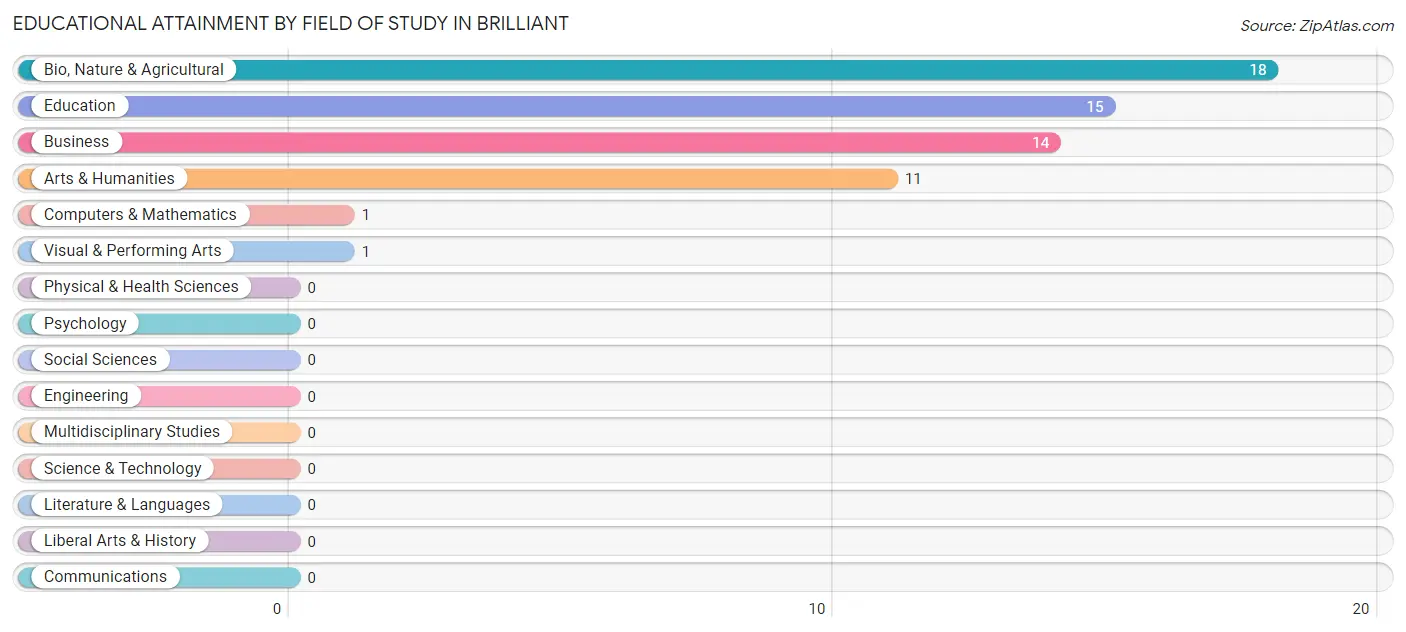
| Field of Study | # Graduates | % Graduates |
| Computers & Mathematics | 1 | 1.7% |
| Bio, Nature & Agricultural | 18 | 30.0% |
| Physical & Health Sciences | 0 | 0.0% |
| Psychology | 0 | 0.0% |
| Social Sciences | 0 | 0.0% |
| Engineering | 0 | 0.0% |
| Multidisciplinary Studies | 0 | 0.0% |
| Science & Technology | 0 | 0.0% |
| Business | 14 | 23.3% |
| Education | 15 | 25.0% |
| Literature & Languages | 0 | 0.0% |
| Liberal Arts & History | 0 | 0.0% |
| Visual & Performing Arts | 1 | 1.7% |
| Communications | 0 | 0.0% |
| Arts & Humanities | 11 | 18.3% |
| Total | 60 | 100.0% |
Transportation & Commute in Brilliant
Vehicle Availability by Sex in Brilliant
The most prevalent vehicle ownership categories in Brilliant are males with 2 vehicles (135, accounting for 57.2%) and females with 2 vehicles (47, making up 112.5%).
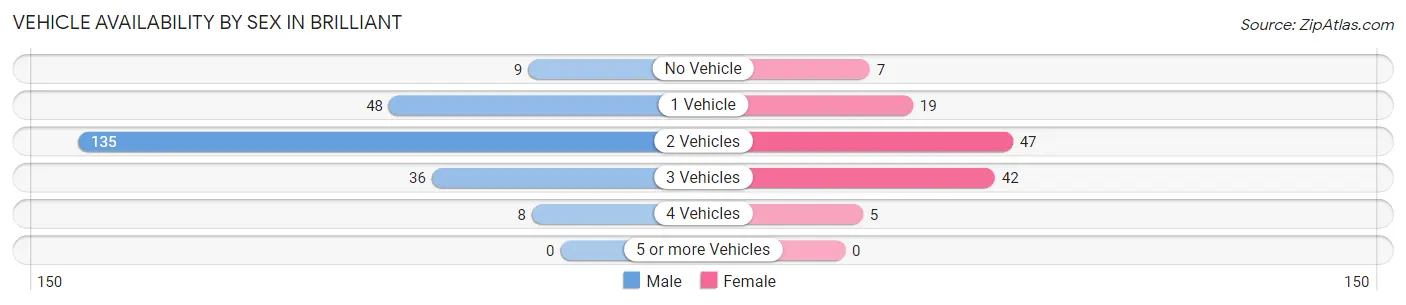
| Vehicles Available | Male | Female |
| No Vehicle | 9 (3.8%) | 7 (5.8%) |
| 1 Vehicle | 48 (20.3%) | 19 (15.8%) |
| 2 Vehicles | 135 (57.2%) | 47 (39.2%) |
| 3 Vehicles | 36 (15.2%) | 42 (35.0%) |
| 4 Vehicles | 8 (3.4%) | 5 (4.2%) |
| 5 or more Vehicles | 0 (0.0%) | 0 (0.0%) |
| Total | 236 (100.0%) | 120 (100.0%) |
Commute Time in Brilliant
The most frequently occuring commute durations in Brilliant are less than 5 minutes (68 commuters, 22.6%), 30 to 34 minutes (61 commuters, 20.3%), and 15 to 19 minutes (46 commuters, 15.3%).
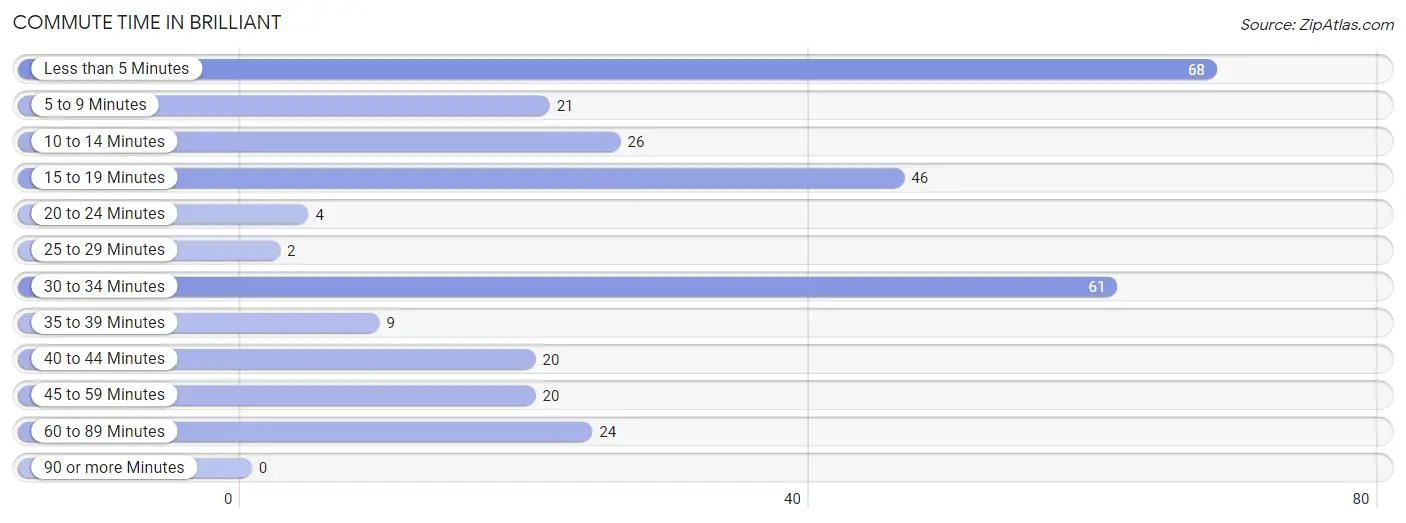
| Commute Time | # Commuters | % Commuters |
| Less than 5 Minutes | 68 | 22.6% |
| 5 to 9 Minutes | 21 | 7.0% |
| 10 to 14 Minutes | 26 | 8.6% |
| 15 to 19 Minutes | 46 | 15.3% |
| 20 to 24 Minutes | 4 | 1.3% |
| 25 to 29 Minutes | 2 | 0.7% |
| 30 to 34 Minutes | 61 | 20.3% |
| 35 to 39 Minutes | 9 | 3.0% |
| 40 to 44 Minutes | 20 | 6.6% |
| 45 to 59 Minutes | 20 | 6.6% |
| 60 to 89 Minutes | 24 | 8.0% |
| 90 or more Minutes | 0 | 0.0% |
Commute Time by Sex in Brilliant
The most common commute times in Brilliant are less than 5 minutes (66 commuters, 33.3%) for males and 10 to 14 minutes (24 commuters, 23.3%) for females.
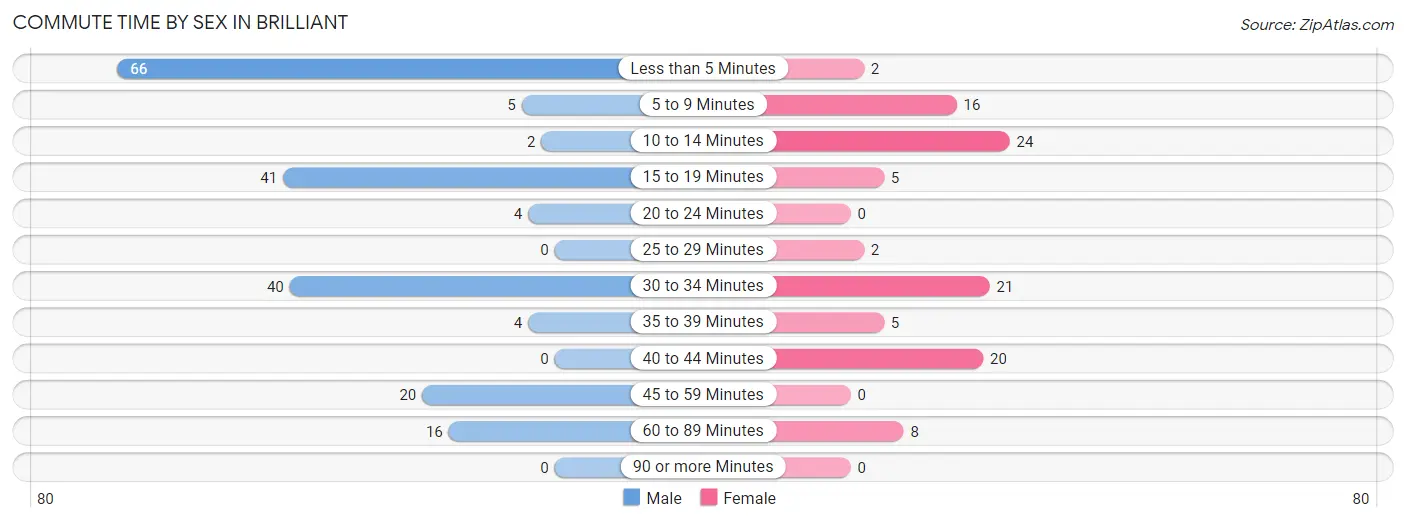
| Commute Time | Male | Female |
| Less than 5 Minutes | 66 (33.3%) | 2 (1.9%) |
| 5 to 9 Minutes | 5 (2.5%) | 16 (15.5%) |
| 10 to 14 Minutes | 2 (1.0%) | 24 (23.3%) |
| 15 to 19 Minutes | 41 (20.7%) | 5 (4.9%) |
| 20 to 24 Minutes | 4 (2.0%) | 0 (0.0%) |
| 25 to 29 Minutes | 0 (0.0%) | 2 (1.9%) |
| 30 to 34 Minutes | 40 (20.2%) | 21 (20.4%) |
| 35 to 39 Minutes | 4 (2.0%) | 5 (4.9%) |
| 40 to 44 Minutes | 0 (0.0%) | 20 (19.4%) |
| 45 to 59 Minutes | 20 (10.1%) | 0 (0.0%) |
| 60 to 89 Minutes | 16 (8.1%) | 8 (7.8%) |
| 90 or more Minutes | 0 (0.0%) | 0 (0.0%) |
Time of Departure to Work by Sex in Brilliant
The most frequent times of departure to work in Brilliant are 7:00 AM to 7:29 AM (77, 38.9%) for males and 12:00 AM to 4:59 AM (29, 28.2%) for females.
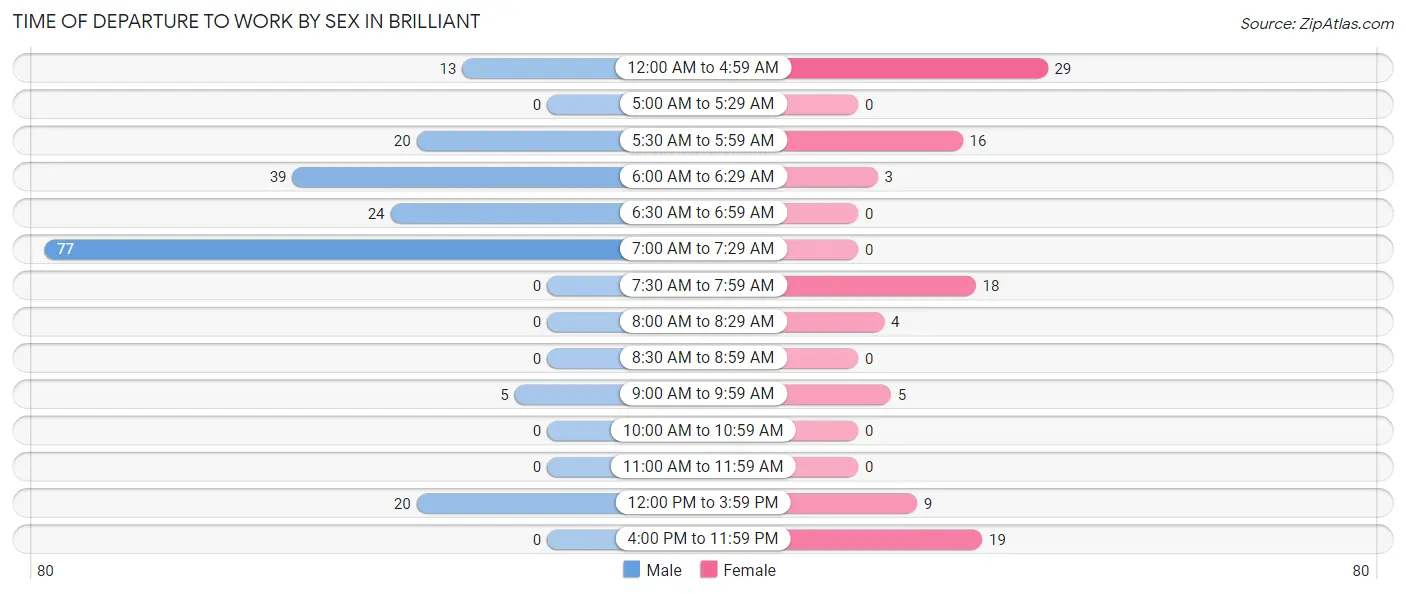
| Time of Departure | Male | Female |
| 12:00 AM to 4:59 AM | 13 (6.6%) | 29 (28.2%) |
| 5:00 AM to 5:29 AM | 0 (0.0%) | 0 (0.0%) |
| 5:30 AM to 5:59 AM | 20 (10.1%) | 16 (15.5%) |
| 6:00 AM to 6:29 AM | 39 (19.7%) | 3 (2.9%) |
| 6:30 AM to 6:59 AM | 24 (12.1%) | 0 (0.0%) |
| 7:00 AM to 7:29 AM | 77 (38.9%) | 0 (0.0%) |
| 7:30 AM to 7:59 AM | 0 (0.0%) | 18 (17.5%) |
| 8:00 AM to 8:29 AM | 0 (0.0%) | 4 (3.9%) |
| 8:30 AM to 8:59 AM | 0 (0.0%) | 0 (0.0%) |
| 9:00 AM to 9:59 AM | 5 (2.5%) | 5 (4.9%) |
| 10:00 AM to 10:59 AM | 0 (0.0%) | 0 (0.0%) |
| 11:00 AM to 11:59 AM | 0 (0.0%) | 0 (0.0%) |
| 12:00 PM to 3:59 PM | 20 (10.1%) | 9 (8.7%) |
| 4:00 PM to 11:59 PM | 0 (0.0%) | 19 (18.4%) |
| Total | 198 (100.0%) | 103 (100.0%) |
Housing Occupancy in Brilliant
Occupancy by Ownership in Brilliant
Of the total 552 dwellings in Brilliant, owner-occupied units account for 377 (68.3%), while renter-occupied units make up 175 (31.7%).
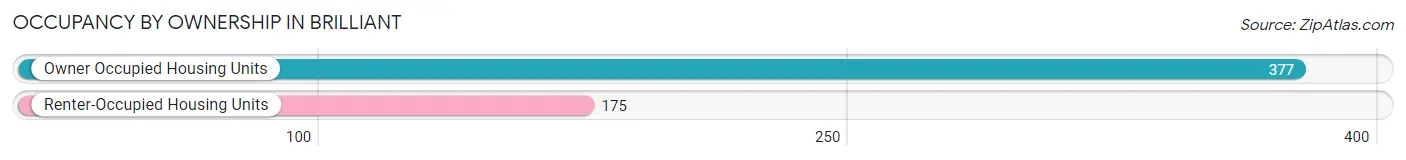
| Occupancy | # Housing Units | % Housing Units |
| Owner Occupied Housing Units | 377 | 68.3% |
| Renter-Occupied Housing Units | 175 | 31.7% |
| Total Occupied Housing Units | 552 | 100.0% |
Occupancy by Household Size in Brilliant
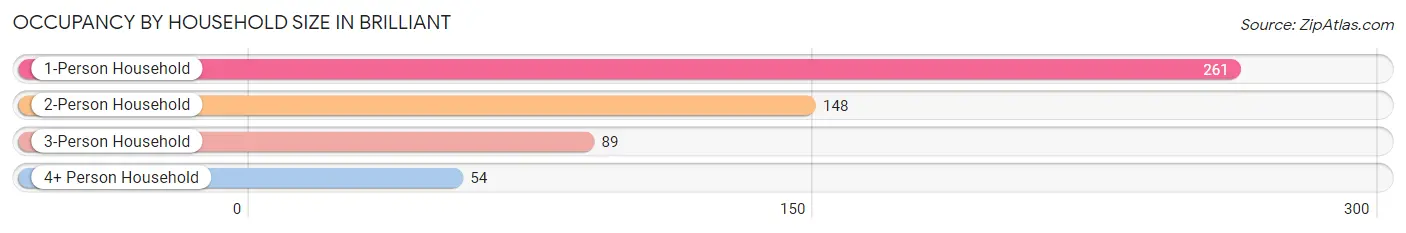
| Household Size | # Housing Units | % Housing Units |
| 1-Person Household | 261 | 47.3% |
| 2-Person Household | 148 | 26.8% |
| 3-Person Household | 89 | 16.1% |
| 4+ Person Household | 54 | 9.8% |
| Total Housing Units | 552 | 100.0% |
Occupancy by Ownership by Household Size in Brilliant
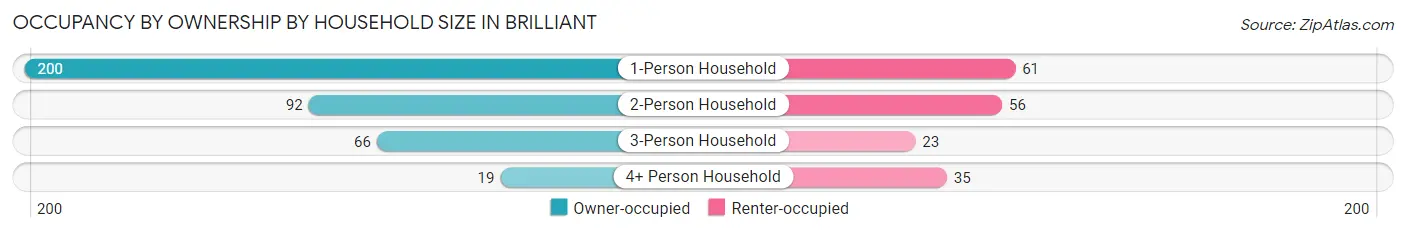
| Household Size | Owner-occupied | Renter-occupied |
| 1-Person Household | 200 (76.6%) | 61 (23.4%) |
| 2-Person Household | 92 (62.2%) | 56 (37.8%) |
| 3-Person Household | 66 (74.2%) | 23 (25.8%) |
| 4+ Person Household | 19 (35.2%) | 35 (64.8%) |
| Total Housing Units | 377 (68.3%) | 175 (31.7%) |
Occupancy by Educational Attainment in Brilliant
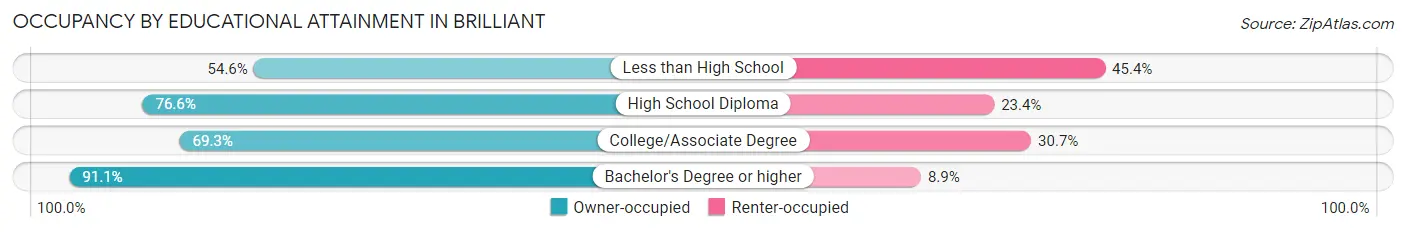
| Household Size | Owner-occupied | Renter-occupied |
| Less than High School | 95 (54.6%) | 79 (45.4%) |
| High School Diploma | 108 (76.6%) | 33 (23.4%) |
| College/Associate Degree | 133 (69.3%) | 59 (30.7%) |
| Bachelor's Degree or higher | 41 (91.1%) | 4 (8.9%) |
Occupancy by Age of Householder in Brilliant
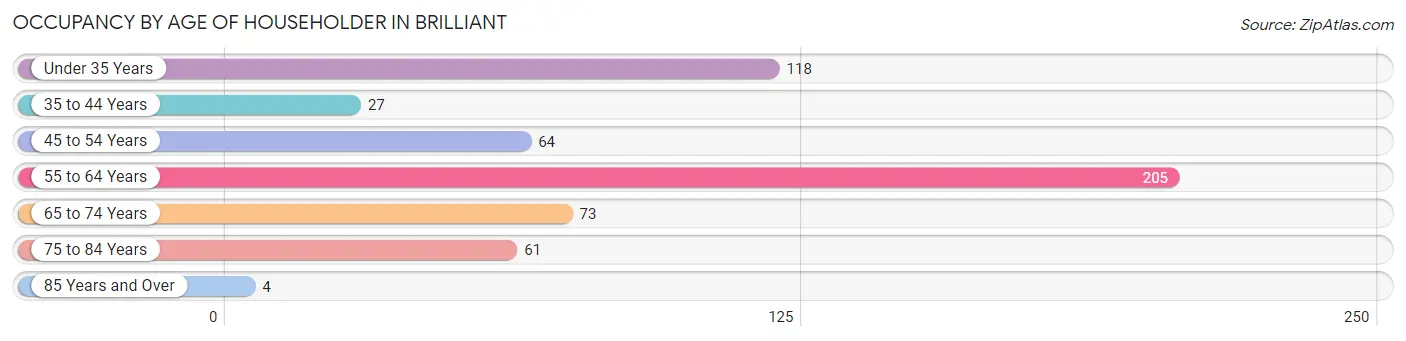
| Age Bracket | # Households | % Households |
| Under 35 Years | 118 | 21.4% |
| 35 to 44 Years | 27 | 4.9% |
| 45 to 54 Years | 64 | 11.6% |
| 55 to 64 Years | 205 | 37.1% |
| 65 to 74 Years | 73 | 13.2% |
| 75 to 84 Years | 61 | 11.1% |
| 85 Years and Over | 4 | 0.7% |
| Total | 552 | 100.0% |
Housing Finances in Brilliant
Median Income by Occupancy in Brilliant
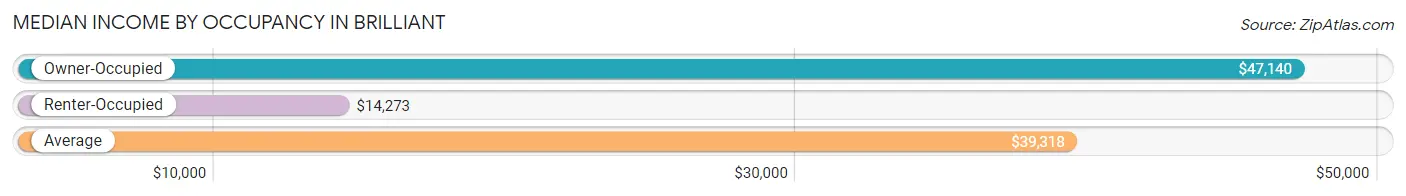
| Occupancy Type | # Households | Median Income |
| Owner-Occupied | 377 (68.3%) | $47,140 |
| Renter-Occupied | 175 (31.7%) | $14,273 |
| Average | 552 (100.0%) | $39,318 |
Occupancy by Householder Income Bracket in Brilliant
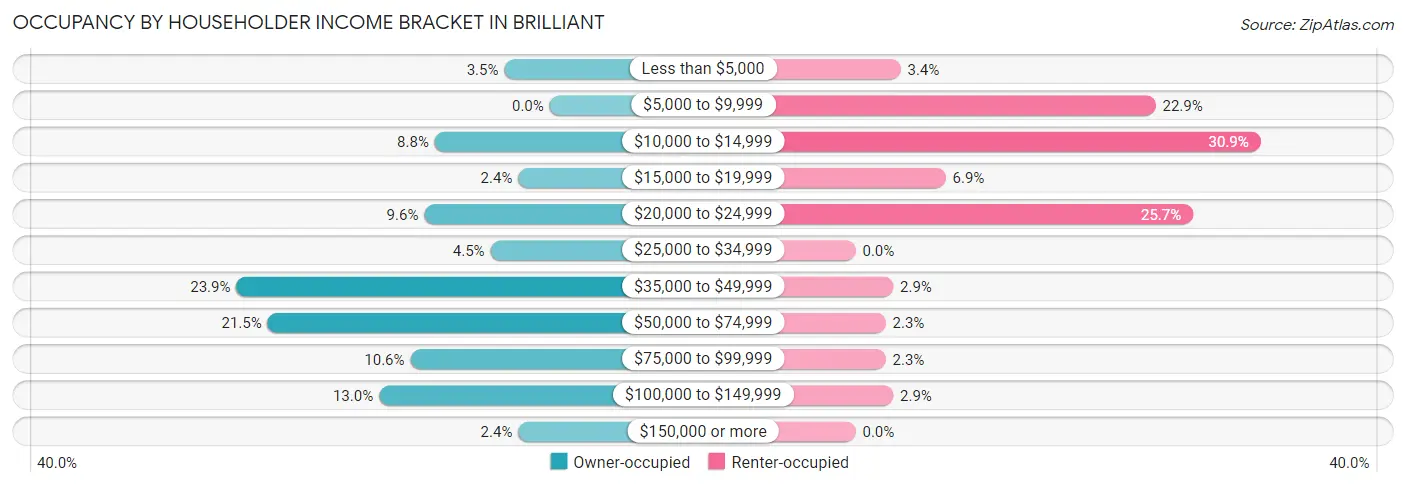
| Income Bracket | Owner-occupied | Renter-occupied |
| Less than $5,000 | 13 (3.5%) | 6 (3.4%) |
| $5,000 to $9,999 | 0 (0.0%) | 40 (22.9%) |
| $10,000 to $14,999 | 33 (8.7%) | 54 (30.9%) |
| $15,000 to $19,999 | 9 (2.4%) | 12 (6.9%) |
| $20,000 to $24,999 | 36 (9.6%) | 45 (25.7%) |
| $25,000 to $34,999 | 17 (4.5%) | 0 (0.0%) |
| $35,000 to $49,999 | 90 (23.9%) | 5 (2.9%) |
| $50,000 to $74,999 | 81 (21.5%) | 4 (2.3%) |
| $75,000 to $99,999 | 40 (10.6%) | 4 (2.3%) |
| $100,000 to $149,999 | 49 (13.0%) | 5 (2.9%) |
| $150,000 or more | 9 (2.4%) | 0 (0.0%) |
| Total | 377 (100.0%) | 175 (100.0%) |
Monthly Housing Cost Tiers in Brilliant
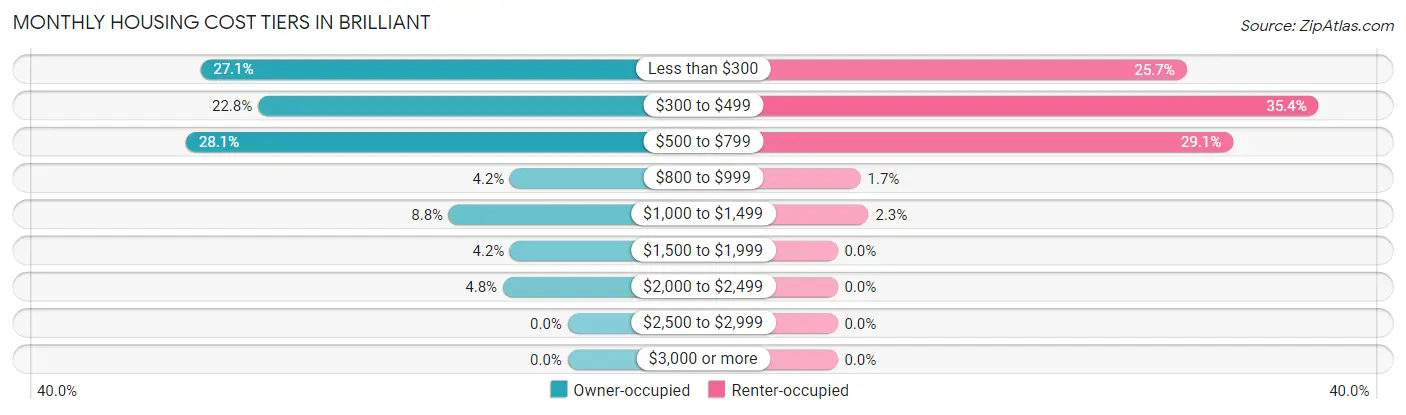
| Monthly Cost | Owner-occupied | Renter-occupied |
| Less than $300 | 102 (27.1%) | 45 (25.7%) |
| $300 to $499 | 86 (22.8%) | 62 (35.4%) |
| $500 to $799 | 106 (28.1%) | 51 (29.1%) |
| $800 to $999 | 16 (4.2%) | 3 (1.7%) |
| $1,000 to $1,499 | 33 (8.7%) | 4 (2.3%) |
| $1,500 to $1,999 | 16 (4.2%) | 0 (0.0%) |
| $2,000 to $2,499 | 18 (4.8%) | 0 (0.0%) |
| $2,500 to $2,999 | 0 (0.0%) | 0 (0.0%) |
| $3,000 or more | 0 (0.0%) | 0 (0.0%) |
| Total | 377 (100.0%) | 175 (100.0%) |
Physical Housing Characteristics in Brilliant
Housing Structures in Brilliant
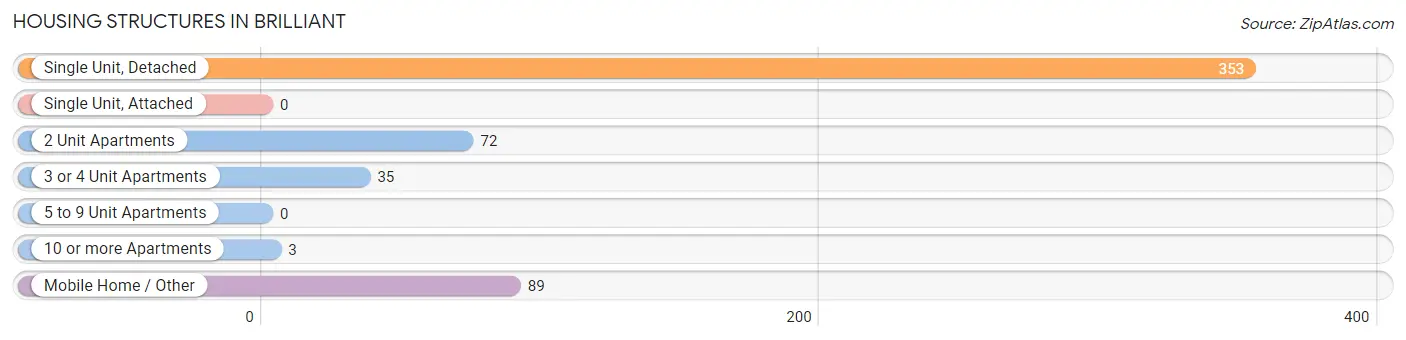
| Structure Type | # Housing Units | % Housing Units |
| Single Unit, Detached | 353 | 63.9% |
| Single Unit, Attached | 0 | 0.0% |
| 2 Unit Apartments | 72 | 13.0% |
| 3 or 4 Unit Apartments | 35 | 6.3% |
| 5 to 9 Unit Apartments | 0 | 0.0% |
| 10 or more Apartments | 3 | 0.5% |
| Mobile Home / Other | 89 | 16.1% |
| Total | 552 | 100.0% |
Housing Structures by Occupancy in Brilliant
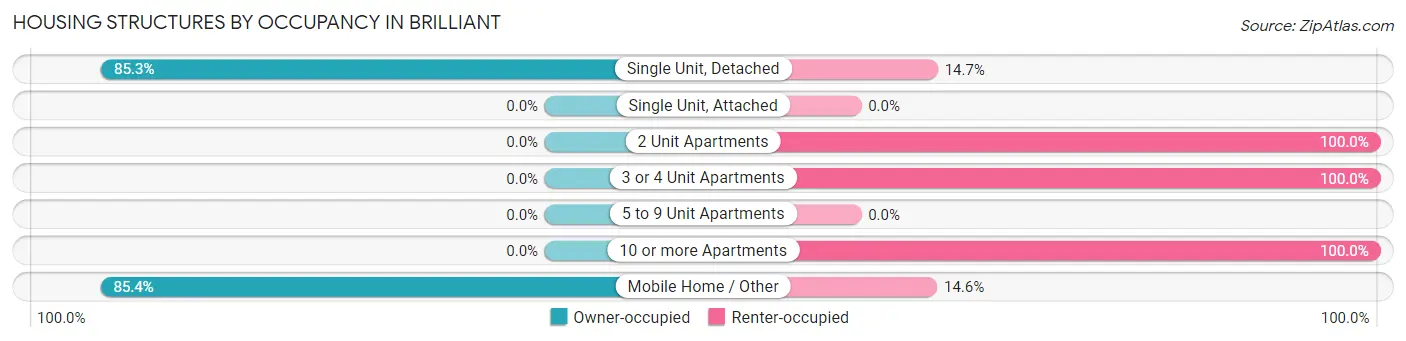
| Structure Type | Owner-occupied | Renter-occupied |
| Single Unit, Detached | 301 (85.3%) | 52 (14.7%) |
| Single Unit, Attached | 0 (0.0%) | 0 (0.0%) |
| 2 Unit Apartments | 0 (0.0%) | 72 (100.0%) |
| 3 or 4 Unit Apartments | 0 (0.0%) | 35 (100.0%) |
| 5 to 9 Unit Apartments | 0 (0.0%) | 0 (0.0%) |
| 10 or more Apartments | 0 (0.0%) | 3 (100.0%) |
| Mobile Home / Other | 76 (85.4%) | 13 (14.6%) |
| Total | 377 (68.3%) | 175 (31.7%) |
Housing Structures by Number of Rooms in Brilliant
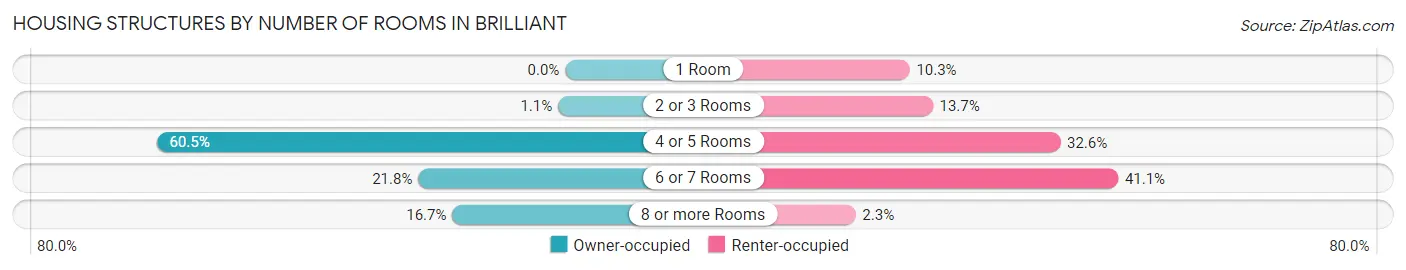
| Number of Rooms | Owner-occupied | Renter-occupied |
| 1 Room | 0 (0.0%) | 18 (10.3%) |
| 2 or 3 Rooms | 4 (1.1%) | 24 (13.7%) |
| 4 or 5 Rooms | 228 (60.5%) | 57 (32.6%) |
| 6 or 7 Rooms | 82 (21.7%) | 72 (41.1%) |
| 8 or more Rooms | 63 (16.7%) | 4 (2.3%) |
| Total | 377 (100.0%) | 175 (100.0%) |
Housing Structure by Heating Type in Brilliant
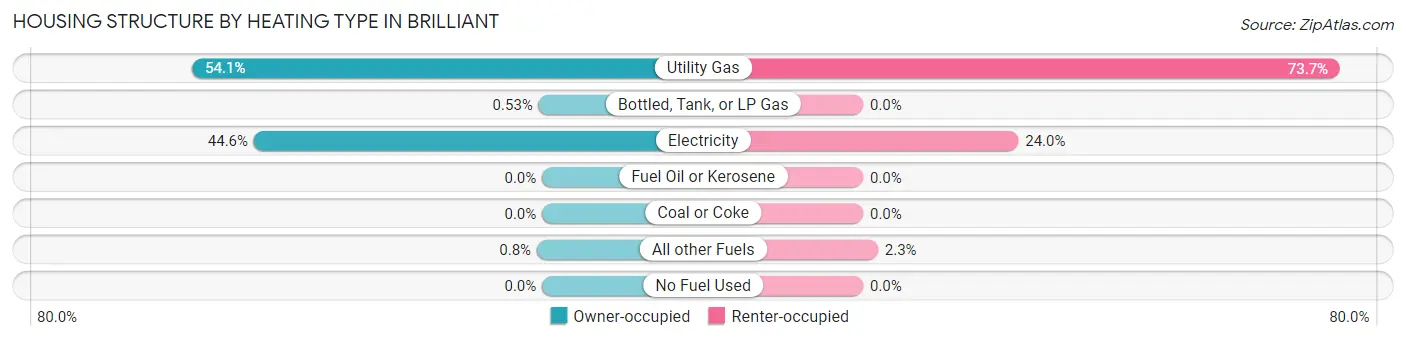
| Heating Type | Owner-occupied | Renter-occupied |
| Utility Gas | 204 (54.1%) | 129 (73.7%) |
| Bottled, Tank, or LP Gas | 2 (0.5%) | 0 (0.0%) |
| Electricity | 168 (44.6%) | 42 (24.0%) |
| Fuel Oil or Kerosene | 0 (0.0%) | 0 (0.0%) |
| Coal or Coke | 0 (0.0%) | 0 (0.0%) |
| All other Fuels | 3 (0.8%) | 4 (2.3%) |
| No Fuel Used | 0 (0.0%) | 0 (0.0%) |
| Total | 377 (100.0%) | 175 (100.0%) |
Household Vehicle Usage in Brilliant
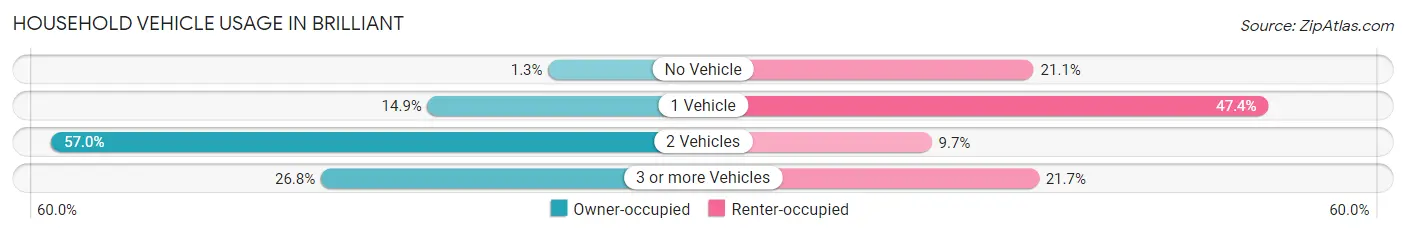
| Vehicles per Household | Owner-occupied | Renter-occupied |
| No Vehicle | 5 (1.3%) | 37 (21.1%) |
| 1 Vehicle | 56 (14.8%) | 83 (47.4%) |
| 2 Vehicles | 215 (57.0%) | 17 (9.7%) |
| 3 or more Vehicles | 101 (26.8%) | 38 (21.7%) |
| Total | 377 (100.0%) | 175 (100.0%) |
Real Estate & Mortgages in Brilliant
Real Estate and Mortgage Overview in Brilliant
| Characteristic | Without Mortgage | With Mortgage |
| Housing Units | 219 | 158 |
| Median Property Value | $56,100 | $0 |
| Median Household Income | $44,904 | $0 |
| Monthly Housing Costs | $312 | $0 |
| Real Estate Taxes | - | - |
Property Value by Mortgage Status in Brilliant
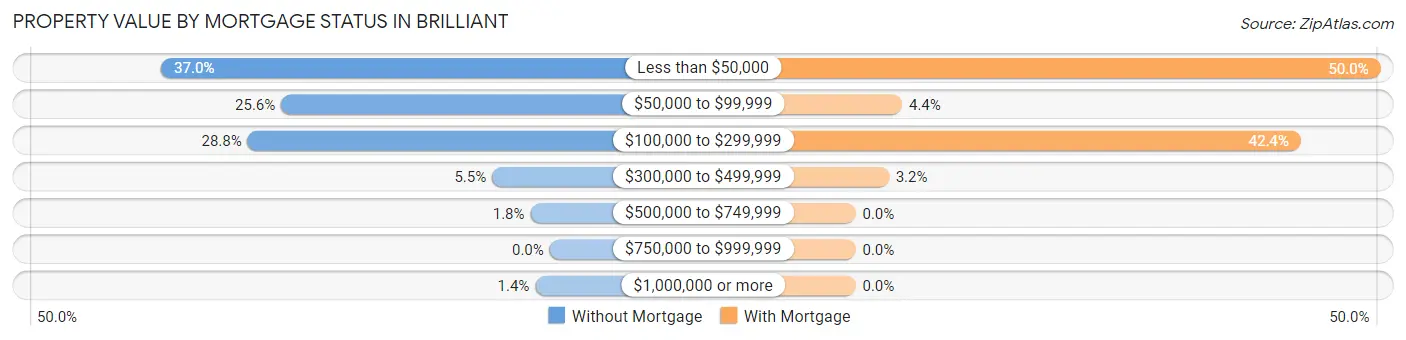
| Property Value | Without Mortgage | With Mortgage |
| Less than $50,000 | 81 (37.0%) | 79 (50.0%) |
| $50,000 to $99,999 | 56 (25.6%) | 7 (4.4%) |
| $100,000 to $299,999 | 63 (28.8%) | 67 (42.4%) |
| $300,000 to $499,999 | 12 (5.5%) | 5 (3.2%) |
| $500,000 to $749,999 | 4 (1.8%) | 0 (0.0%) |
| $750,000 to $999,999 | 0 (0.0%) | 0 (0.0%) |
| $1,000,000 or more | 3 (1.4%) | 0 (0.0%) |
| Total | 219 (100.0%) | 158 (100.0%) |
Household Income by Mortgage Status in Brilliant
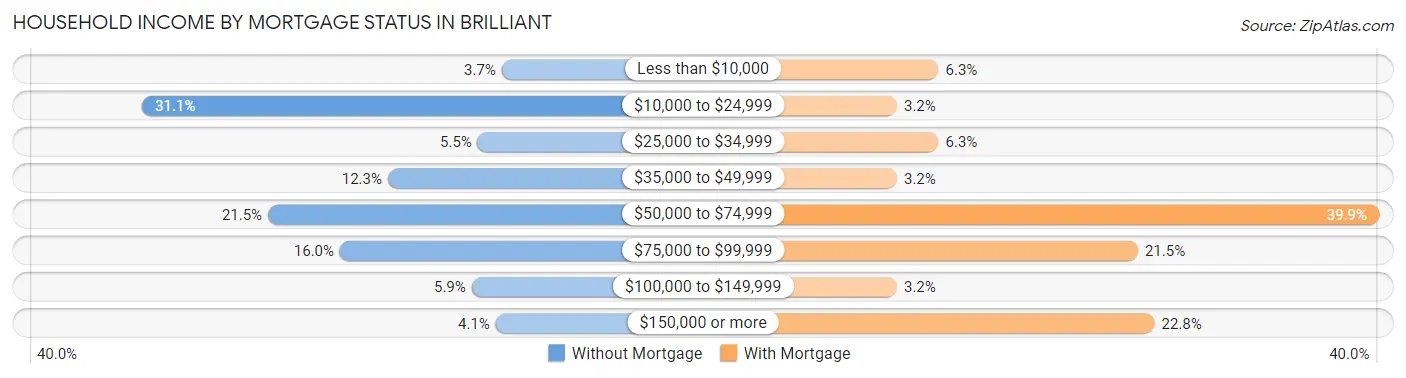
| Household Income | Without Mortgage | With Mortgage |
| Less than $10,000 | 8 (3.6%) | 10 (6.3%) |
| $10,000 to $24,999 | 68 (31.0%) | 5 (3.2%) |
| $25,000 to $34,999 | 12 (5.5%) | 10 (6.3%) |
| $35,000 to $49,999 | 27 (12.3%) | 5 (3.2%) |
| $50,000 to $74,999 | 47 (21.5%) | 63 (39.9%) |
| $75,000 to $99,999 | 35 (16.0%) | 34 (21.5%) |
| $100,000 to $149,999 | 13 (5.9%) | 5 (3.2%) |
| $150,000 or more | 9 (4.1%) | 36 (22.8%) |
| Total | 219 (100.0%) | 158 (100.0%) |
Property Value to Household Income Ratio in Brilliant
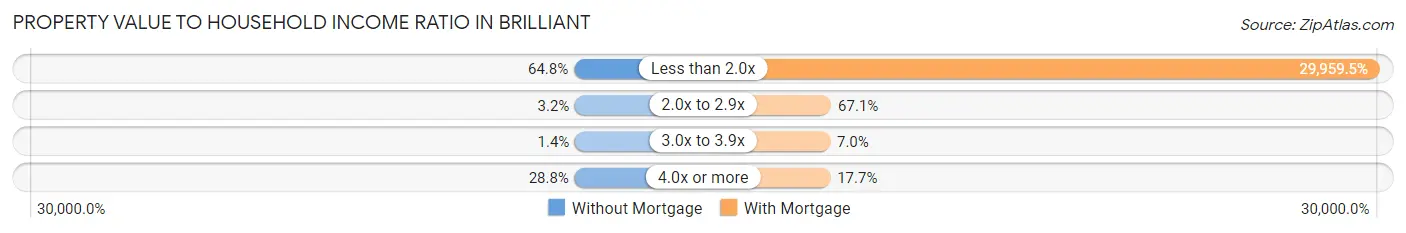
| Value-to-Income Ratio | Without Mortgage | With Mortgage |
| Less than 2.0x | 142 (64.8%) | 47,336 (29,959.5%) |
| 2.0x to 2.9x | 7 (3.2%) | 106 (67.1%) |
| 3.0x to 3.9x | 3 (1.4%) | 11 (7.0%) |
| 4.0x or more | 63 (28.8%) | 28 (17.7%) |
| Total | 219 (100.0%) | 158 (100.0%) |
Real Estate Taxes by Mortgage Status in Brilliant
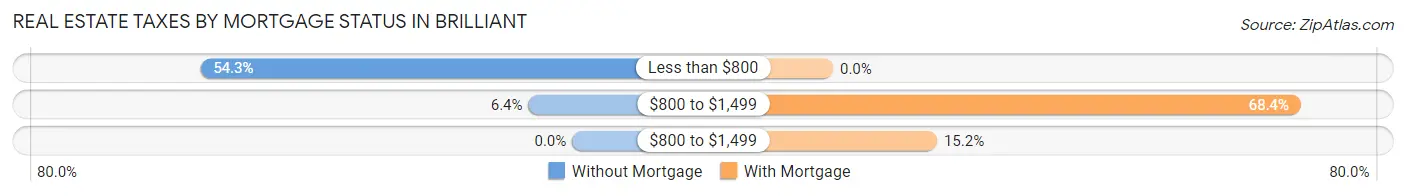
| Property Taxes | Without Mortgage | With Mortgage |
| Less than $800 | 119 (54.3%) | 0 (0.0%) |
| $800 to $1,499 | 14 (6.4%) | 108 (68.3%) |
| $800 to $1,499 | 0 (0.0%) | 24 (15.2%) |
| Total | 219 (100.0%) | 158 (100.0%) |
Health & Disability in Brilliant
Health Insurance Coverage by Age in Brilliant
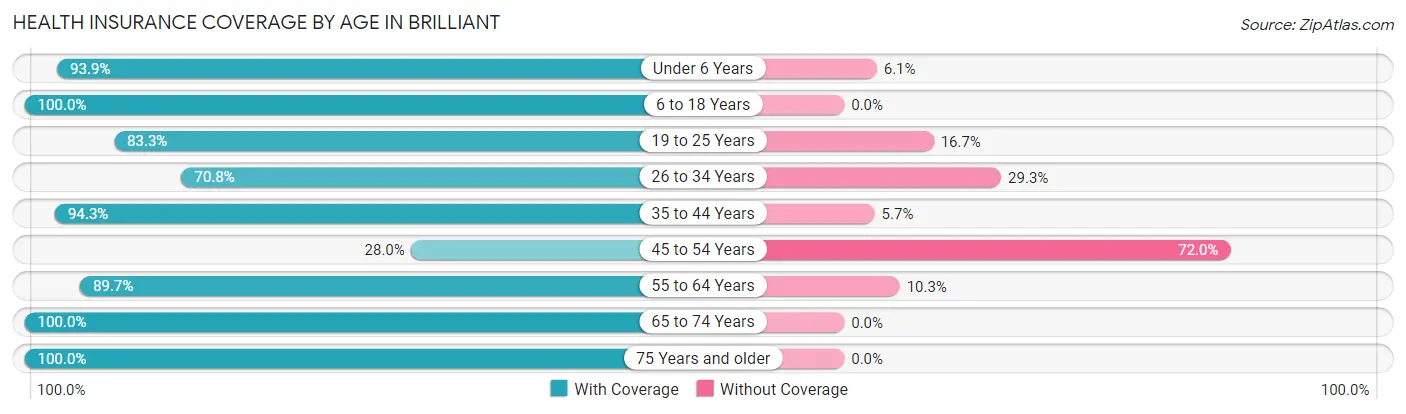
| Age Bracket | With Coverage | Without Coverage |
| Under 6 Years | 93 (93.9%) | 6 (6.1%) |
| 6 to 18 Years | 143 (100.0%) | 0 (0.0%) |
| 19 to 25 Years | 35 (83.3%) | 7 (16.7%) |
| 26 to 34 Years | 104 (70.8%) | 43 (29.2%) |
| 35 to 44 Years | 50 (94.3%) | 3 (5.7%) |
| 45 to 54 Years | 65 (28.0%) | 167 (72.0%) |
| 55 to 64 Years | 217 (89.7%) | 25 (10.3%) |
| 65 to 74 Years | 98 (100.0%) | 0 (0.0%) |
| 75 Years and older | 83 (100.0%) | 0 (0.0%) |
| Total | 888 (78.0%) | 251 (22.0%) |
Health Insurance Coverage by Citizenship Status in Brilliant
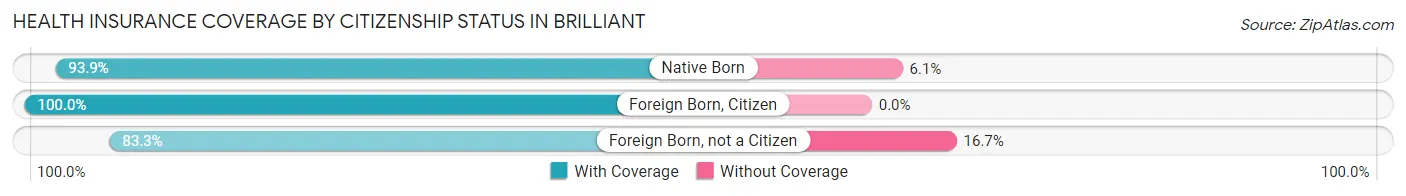
| Citizenship Status | With Coverage | Without Coverage |
| Native Born | 93 (93.9%) | 6 (6.1%) |
| Foreign Born, Citizen | 143 (100.0%) | 0 (0.0%) |
| Foreign Born, not a Citizen | 35 (83.3%) | 7 (16.7%) |
Health Insurance Coverage by Household Income in Brilliant
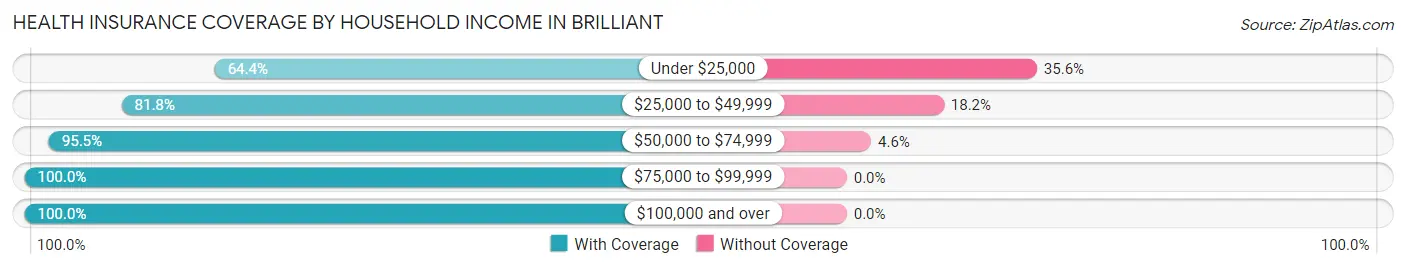
| Household Income | With Coverage | Without Coverage |
| Under $25,000 | 394 (64.4%) | 218 (35.6%) |
| $25,000 to $49,999 | 117 (81.8%) | 26 (18.2%) |
| $50,000 to $74,999 | 147 (95.5%) | 7 (4.5%) |
| $75,000 to $99,999 | 81 (100.0%) | 0 (0.0%) |
| $100,000 and over | 149 (100.0%) | 0 (0.0%) |
Public vs Private Health Insurance Coverage by Age in Brilliant
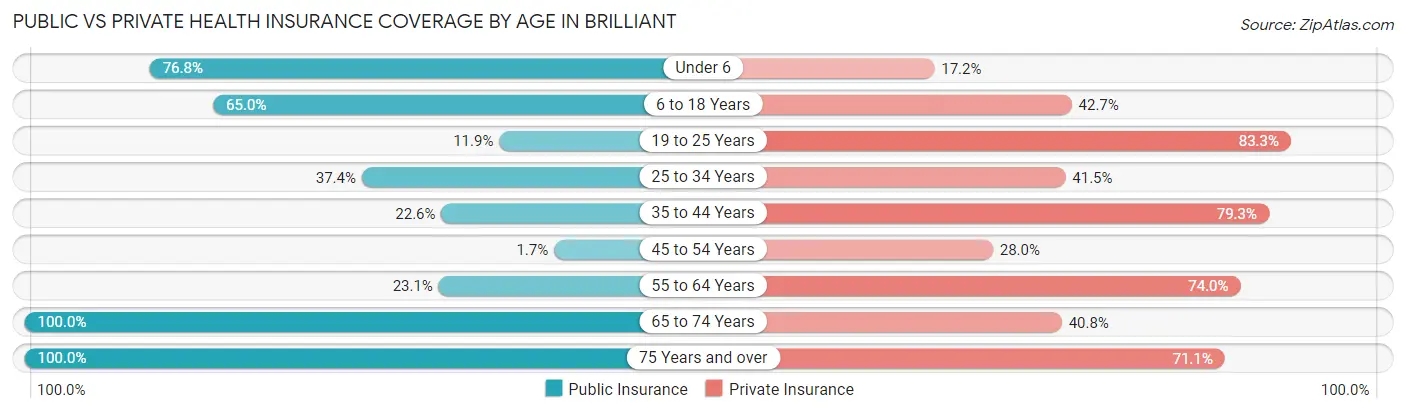
| Age Bracket | Public Insurance | Private Insurance |
| Under 6 | 76 (76.8%) | 17 (17.2%) |
| 6 to 18 Years | 93 (65.0%) | 61 (42.7%) |
| 19 to 25 Years | 5 (11.9%) | 35 (83.3%) |
| 25 to 34 Years | 55 (37.4%) | 61 (41.5%) |
| 35 to 44 Years | 12 (22.6%) | 42 (79.2%) |
| 45 to 54 Years | 4 (1.7%) | 65 (28.0%) |
| 55 to 64 Years | 56 (23.1%) | 179 (74.0%) |
| 65 to 74 Years | 98 (100.0%) | 40 (40.8%) |
| 75 Years and over | 83 (100.0%) | 59 (71.1%) |
| Total | 482 (42.3%) | 559 (49.1%) |
Disability Status by Sex by Age in Brilliant
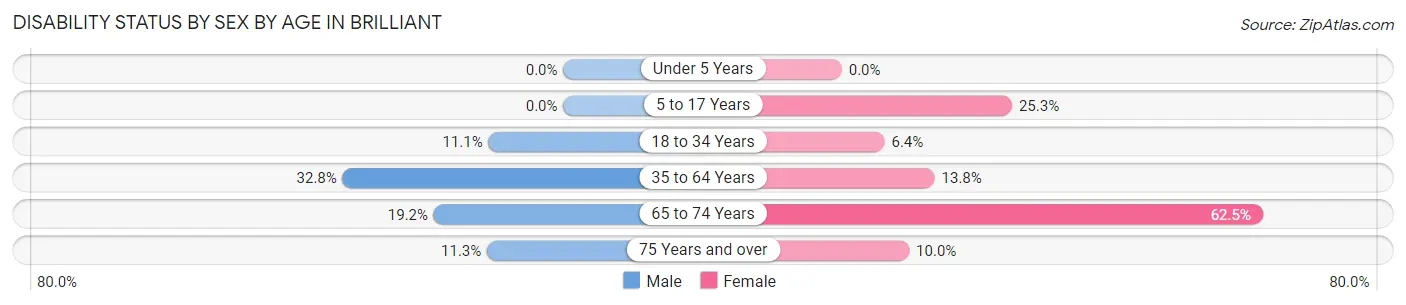
| Age Bracket | Male | Female |
| Under 5 Years | 0 (0.0%) | 0 (0.0%) |
| 5 to 17 Years | 0 (0.0%) | 23 (25.3%) |
| 18 to 34 Years | 7 (11.1%) | 8 (6.4%) |
| 35 to 64 Years | 99 (32.8%) | 31 (13.8%) |
| 65 to 74 Years | 5 (19.2%) | 45 (62.5%) |
| 75 Years and over | 6 (11.3%) | 3 (10.0%) |
Disability Class by Sex by Age in Brilliant
Disability Class: Hearing Difficulty
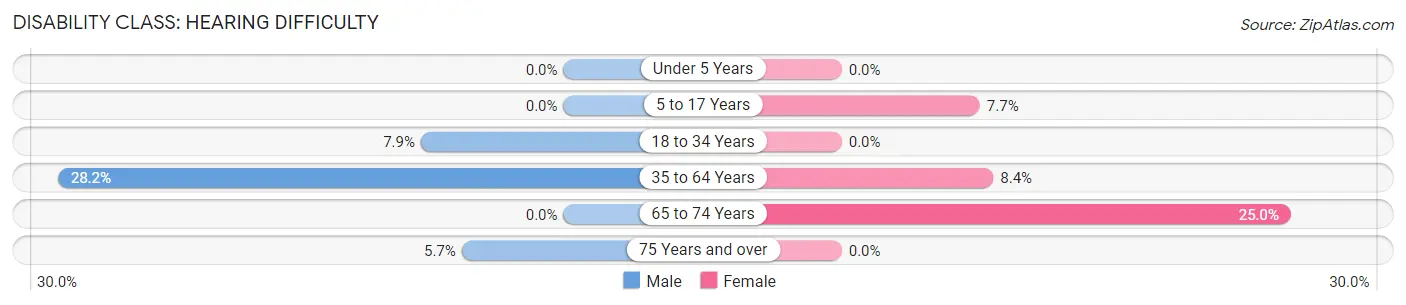
| Age Bracket | Male | Female |
| Under 5 Years | 0 (0.0%) | 0 (0.0%) |
| 5 to 17 Years | 0 (0.0%) | 7 (7.7%) |
| 18 to 34 Years | 5 (7.9%) | 0 (0.0%) |
| 35 to 64 Years | 85 (28.1%) | 19 (8.4%) |
| 65 to 74 Years | 0 (0.0%) | 18 (25.0%) |
| 75 Years and over | 3 (5.7%) | 0 (0.0%) |
Disability Class: Vision Difficulty
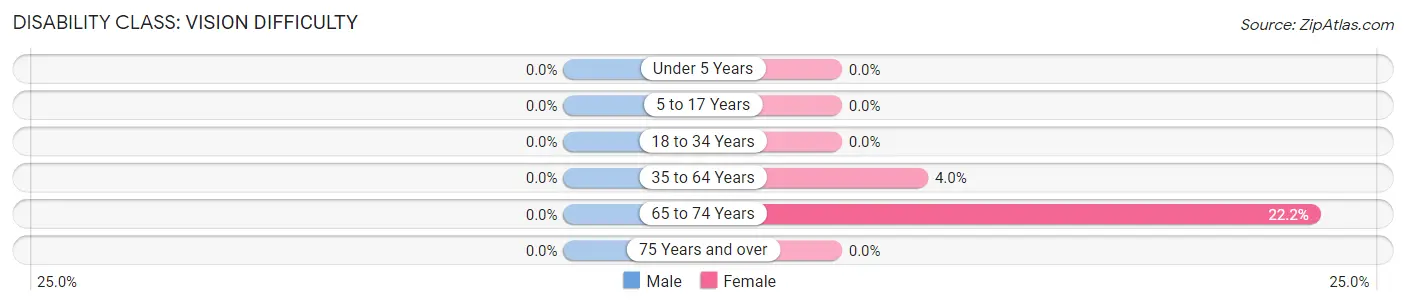
| Age Bracket | Male | Female |
| Under 5 Years | 0 (0.0%) | 0 (0.0%) |
| 5 to 17 Years | 0 (0.0%) | 0 (0.0%) |
| 18 to 34 Years | 0 (0.0%) | 0 (0.0%) |
| 35 to 64 Years | 0 (0.0%) | 9 (4.0%) |
| 65 to 74 Years | 0 (0.0%) | 16 (22.2%) |
| 75 Years and over | 0 (0.0%) | 0 (0.0%) |
Disability Class: Cognitive Difficulty
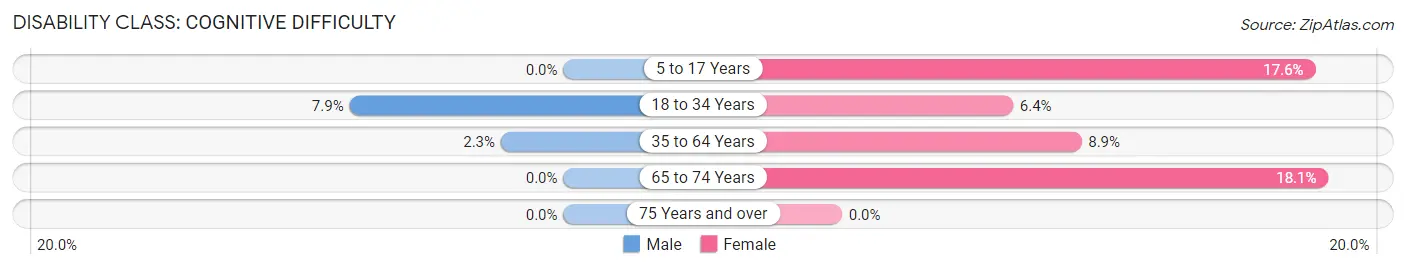
| Age Bracket | Male | Female |
| 5 to 17 Years | 0 (0.0%) | 16 (17.6%) |
| 18 to 34 Years | 5 (7.9%) | 8 (6.4%) |
| 35 to 64 Years | 7 (2.3%) | 20 (8.9%) |
| 65 to 74 Years | 0 (0.0%) | 13 (18.1%) |
| 75 Years and over | 0 (0.0%) | 0 (0.0%) |
Disability Class: Ambulatory Difficulty
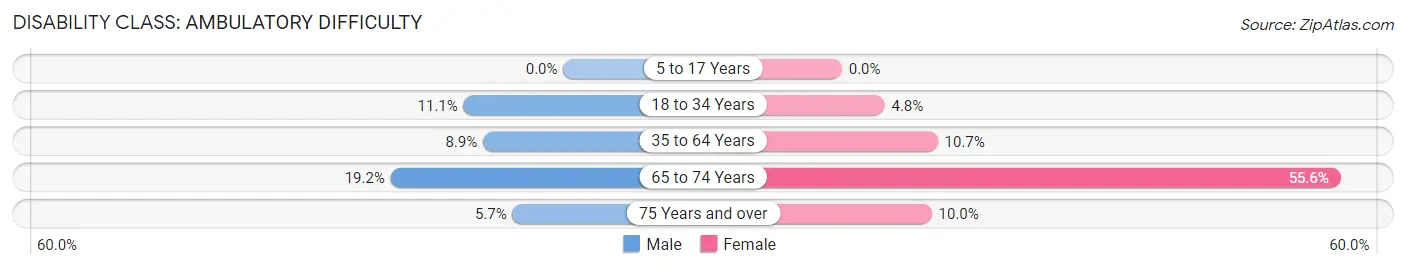
| Age Bracket | Male | Female |
| 5 to 17 Years | 0 (0.0%) | 0 (0.0%) |
| 18 to 34 Years | 7 (11.1%) | 6 (4.8%) |
| 35 to 64 Years | 27 (8.9%) | 24 (10.7%) |
| 65 to 74 Years | 5 (19.2%) | 40 (55.6%) |
| 75 Years and over | 3 (5.7%) | 3 (10.0%) |
Disability Class: Self-Care Difficulty
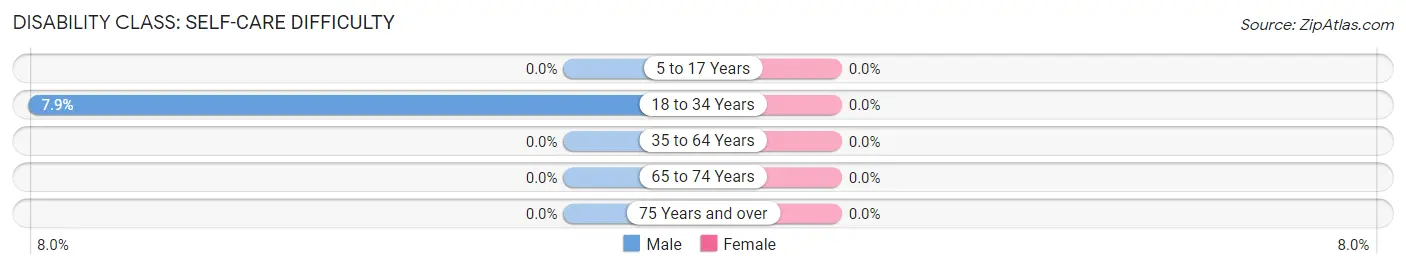
| Age Bracket | Male | Female |
| 5 to 17 Years | 0 (0.0%) | 0 (0.0%) |
| 18 to 34 Years | 5 (7.9%) | 0 (0.0%) |
| 35 to 64 Years | 0 (0.0%) | 0 (0.0%) |
| 65 to 74 Years | 0 (0.0%) | 0 (0.0%) |
| 75 Years and over | 0 (0.0%) | 0 (0.0%) |
Technology Access in Brilliant
Computing Device Access in Brilliant
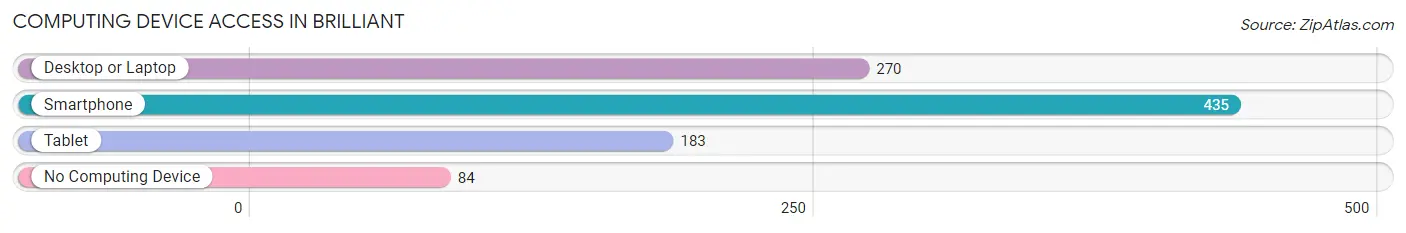
| Device Type | # Households | % Households |
| Desktop or Laptop | 270 | 48.9% |
| Smartphone | 435 | 78.8% |
| Tablet | 183 | 33.2% |
| No Computing Device | 84 | 15.2% |
| Total | 552 | 100.0% |
Internet Access in Brilliant
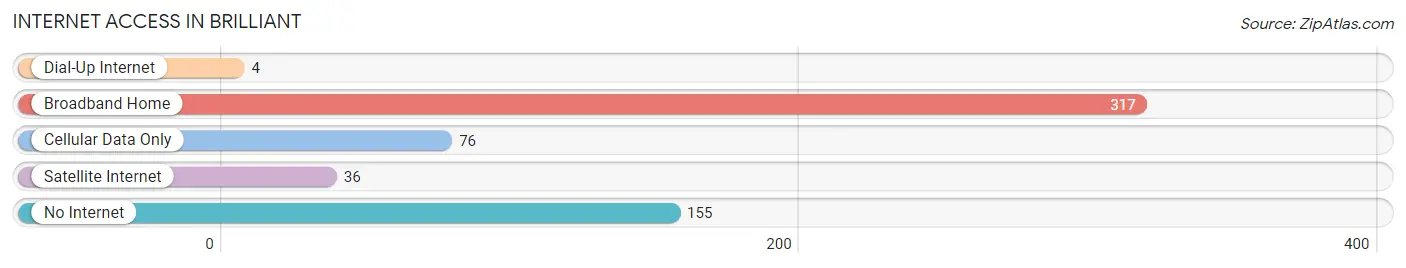
| Internet Type | # Households | % Households |
| Dial-Up Internet | 4 | 0.7% |
| Broadband Home | 317 | 57.4% |
| Cellular Data Only | 76 | 13.8% |
| Satellite Internet | 36 | 6.5% |
| No Internet | 155 | 28.1% |
| Total | 552 | 100.0% |
Brilliant Summary
History
Brilliant, Alabama is a small town located in Marion County, Alabama. It is situated on the banks of the Tombigbee River, and is part of the larger Mobile metropolitan area. The town was founded in 1819 by settlers from Georgia, and was originally known as “Brilliant Station”. The town was named after the brilliant colors of the river, and the name was later shortened to “Brilliant”.
The town was an important trading post during the early 19th century, and was a major stop on the stagecoach route between Mobile and Montgomery. The town was also a major port for steamboats traveling up and down the Tombigbee River. During the Civil War, Brilliant was a major supply depot for the Confederate Army.
In the late 19th century, Brilliant became an important center for the timber industry. The town was home to several sawmills and lumber companies, and the timber industry was the main source of employment for the town’s residents.
In the early 20th century, Brilliant was a major center for the cotton industry. The town was home to several cotton gins, and the cotton industry was the main source of employment for the town’s residents.
In the late 20th century, Brilliant began to experience a decline in population as many of its residents moved away in search of better economic opportunities. The town’s population has remained relatively stable since then, and currently stands at around 1,000 people.
Geography
Brilliant is located in Marion County, Alabama, on the banks of the Tombigbee River. The town is situated in the foothills of the Appalachian Mountains, and is surrounded by rolling hills and forests. The town is located approximately 30 miles south of Birmingham, and is part of the larger Mobile metropolitan area.
The climate in Brilliant is humid subtropical, with hot, humid summers and mild winters. The average annual temperature is around 68 degrees Fahrenheit, and the average annual precipitation is around 50 inches.
Economy
The economy of Brilliant is largely based on agriculture and timber. The town is home to several farms, and the timber industry is still an important source of employment for the town’s residents. The town is also home to several small businesses, including restaurants, convenience stores, and auto repair shops.
Demographics
As of the 2010 census, the population of Brilliant was 1,000 people. The racial makeup of the town was 97.2% White, 0.7% African American, 0.3% Native American, 0.2% Asian, and 1.6% from other races. The median household income was $30,000, and the median family income was $35,000. The per capita income was $14,000.
Common Questions
What is Per Capita Income in Brilliant?
Per Capita income in Brilliant is $21,458.
What is the Median Family Income in Brilliant?
Median Family Income in Brilliant is $45,250.
What is the Median Household income in Brilliant?
Median Household Income in Brilliant is $39,318.
What is Income or Wage Gap in Brilliant?
Income or Wage Gap in Brilliant is 28.1%.
Women in Brilliant earn 71.9 cents for every dollar earned by a man.
What is Inequality or Gini Index in Brilliant?
Inequality or Gini Index in Brilliant is 0.44.
What is the Total Population of Brilliant?
Total Population of Brilliant is 1,145.
What is the Total Male Population of Brilliant?
Total Male Population of Brilliant is 578.
What is the Total Female Population of Brilliant?
Total Female Population of Brilliant is 567.
What is the Ratio of Males per 100 Females in Brilliant?
There are 101.94 Males per 100 Females in Brilliant.
What is the Ratio of Females per 100 Males in Brilliant?
There are 98.10 Females per 100 Males in Brilliant.
What is the Median Population Age in Brilliant?
Median Population Age in Brilliant is 53.4 Years.
What is the Average Family Size in Brilliant
Average Family Size in Brilliant is 2.7 People.
What is the Average Household Size in Brilliant
Average Household Size in Brilliant is 2.1 People.
How Large is the Labor Force in Brilliant?
There are 433 People in the Labor Forcein in Brilliant.
What is the Percentage of People in the Labor Force in Brilliant?
46.7% of People are in the Labor Force in Brilliant.
What is the Unemployment Rate in Brilliant?
Unemployment Rate in Brilliant is 15.5%.