Silverhill, AL Map & Demographics
Silverhill Map
Silverhill Overview
$43,859
PER CAPITA INCOME
$93,482
AVG FAMILY INCOME
$58,510
AVG HOUSEHOLD INCOME
52.4%
WAGE / INCOME GAP [ % ]
47.6¢/ $1
WAGE / INCOME GAP [ $ ]
0.50
INEQUALITY / GINI INDEX
711
TOTAL POPULATION
337
MALE POPULATION
374
FEMALE POPULATION
90.11
MALES / 100 FEMALES
110.98
FEMALES / 100 MALES
43.0
MEDIAN AGE
2.5
AVG FAMILY SIZE
2.1
AVG HOUSEHOLD SIZE
443
LABOR FORCE [ PEOPLE ]
71.6%
PERCENT IN LABOR FORCE
0.5%
UNEMPLOYMENT RATE
Silverhill Zip Codes
Silverhill Area Codes
Income in Silverhill
Income Overview in Silverhill
Per Capita Income in Silverhill is $43,859, while median incomes of families and households are $93,482 and $58,510 respectively.
| Characteristic | Number | Measure |
| Per Capita Income | 711 | $43,859 |
| Median Family Income | 215 | $93,482 |
| Mean Family Income | 215 | $110,692 |
| Median Household Income | 329 | $58,510 |
| Mean Household Income | 329 | $94,658 |
| Income Deficit | 215 | $0 |
| Wage / Income Gap (%) | 711 | 52.43% |
| Wage / Income Gap ($) | 711 | 47.57¢ per $1 |
| Gini / Inequality Index | 711 | 0.50 |
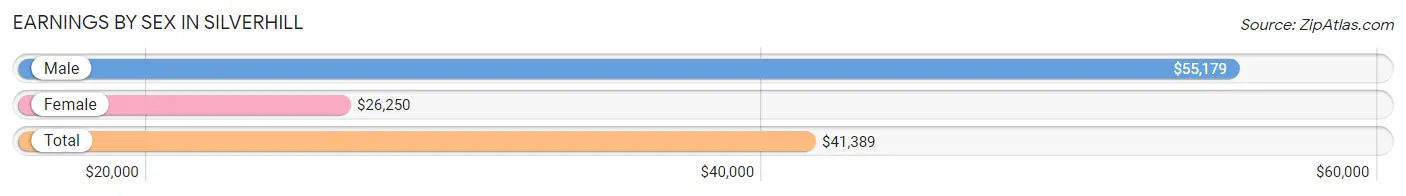
Earnings by Sex in Silverhill
Average Earnings in Silverhill are $41,389, $55,179 for men and $26,250 for women, a difference of 52.4%.
| Sex | Number | Average Earnings |
| Male | 222 (48.9%) | $55,179 |
| Female | 232 (51.1%) | $26,250 |
| Total | 454 (100.0%) | $41,389 |
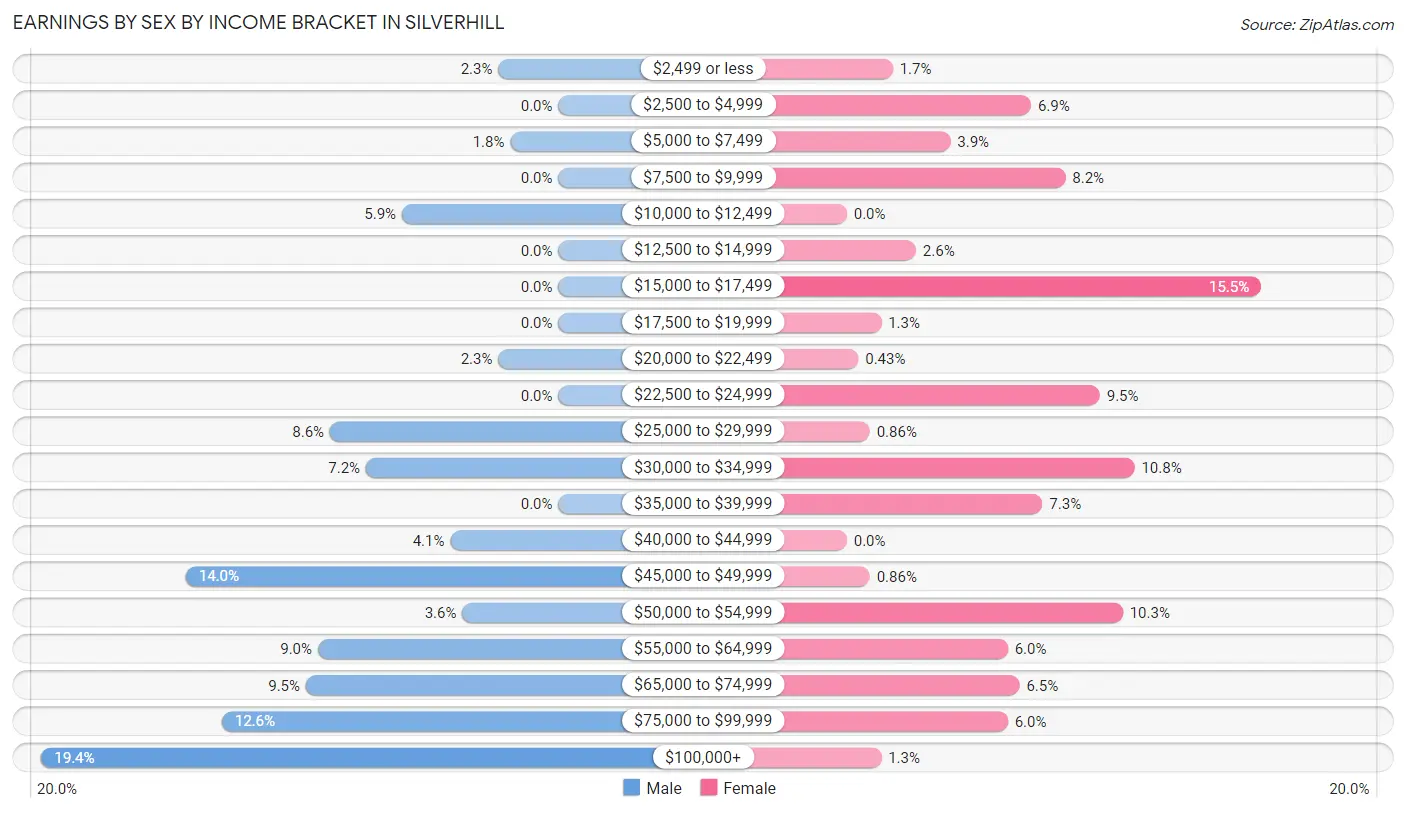
Earnings by Sex by Income Bracket in Silverhill
The most common earnings brackets in Silverhill are $100,000+ for men (43 | 19.4%) and $15,000 to $17,499 for women (36 | 15.5%).
| Income | Male | Female |
| $2,499 or less | 5 (2.2%) | 4 (1.7%) |
| $2,500 to $4,999 | 0 (0.0%) | 16 (6.9%) |
| $5,000 to $7,499 | 4 (1.8%) | 9 (3.9%) |
| $7,500 to $9,999 | 0 (0.0%) | 19 (8.2%) |
| $10,000 to $12,499 | 13 (5.9%) | 0 (0.0%) |
| $12,500 to $14,999 | 0 (0.0%) | 6 (2.6%) |
| $15,000 to $17,499 | 0 (0.0%) | 36 (15.5%) |
| $17,500 to $19,999 | 0 (0.0%) | 3 (1.3%) |
| $20,000 to $22,499 | 5 (2.2%) | 1 (0.4%) |
| $22,500 to $24,999 | 0 (0.0%) | 22 (9.5%) |
| $25,000 to $29,999 | 19 (8.6%) | 2 (0.9%) |
| $30,000 to $34,999 | 16 (7.2%) | 25 (10.8%) |
| $35,000 to $39,999 | 0 (0.0%) | 17 (7.3%) |
| $40,000 to $44,999 | 9 (4.1%) | 0 (0.0%) |
| $45,000 to $49,999 | 31 (14.0%) | 2 (0.9%) |
| $50,000 to $54,999 | 8 (3.6%) | 24 (10.3%) |
| $55,000 to $64,999 | 20 (9.0%) | 14 (6.0%) |
| $65,000 to $74,999 | 21 (9.5%) | 15 (6.5%) |
| $75,000 to $99,999 | 28 (12.6%) | 14 (6.0%) |
| $100,000+ | 43 (19.4%) | 3 (1.3%) |
| Total | 222 (100.0%) | 232 (100.0%) |
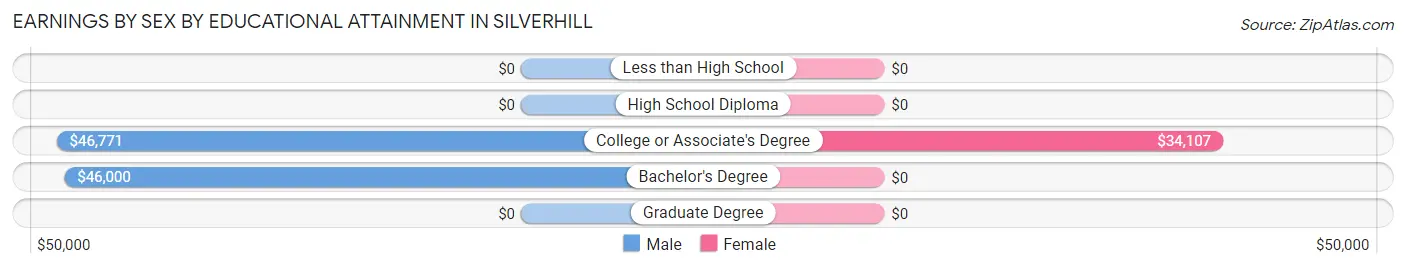
Earnings by Sex by Educational Attainment in Silverhill
Average earnings in Silverhill are $56,607 for men and $30,583 for women, a difference of 46.0%. Men with an educational attainment of college or associate's degree enjoy the highest average annual earnings of $46,771, while those with bachelor's degree education earn the least with $46,000. Women with an educational attainment of college or associate's degree earn the most with the average annual earnings of $34,107, while those with college or associate's degree education have the smallest earnings of $34,107.
| Educational Attainment | Male Income | Female Income |
| Less than High School | - | - |
| High School Diploma | - | - |
| College or Associate's Degree | $46,771 | $34,107 |
| Bachelor's Degree | $46,000 | $0 |
| Graduate Degree | - | - |
| Total | $56,607 | $30,583 |
Family Income in Silverhill
Family Income Brackets in Silverhill
According to the Silverhill family income data, there are 60 families falling into the $100,000 to $149,999 income range, which is the most common income bracket and makes up 27.9% of all families. Conversely, the less than $10,000 income bracket is the least frequent group with only 2 families (0.9%) belonging to this category.
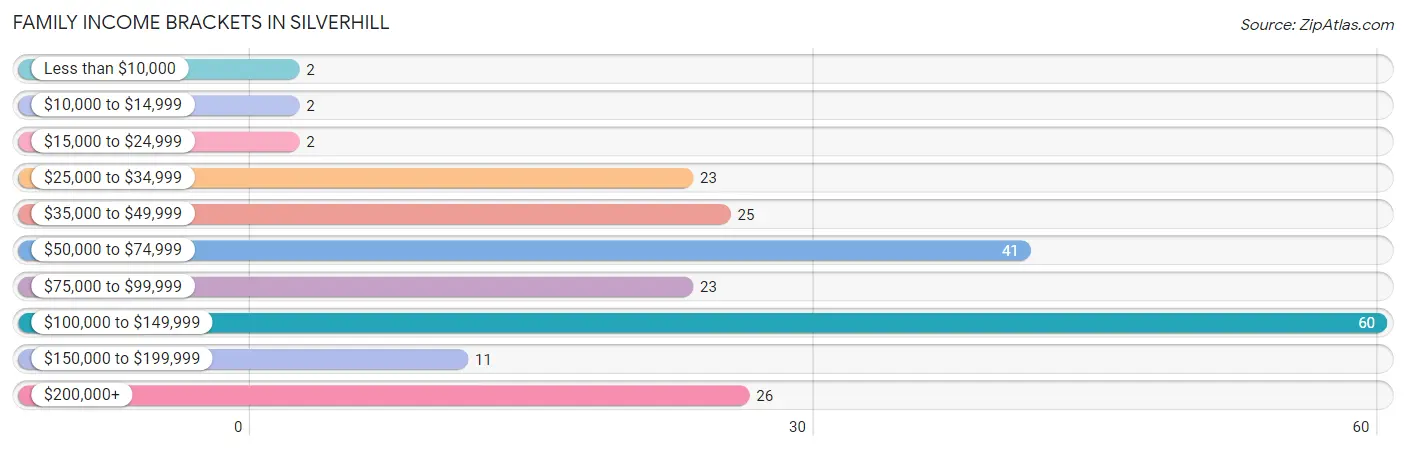
| Income Bracket | # Families | % Families |
| Less than $10,000 | 2 | 0.9% |
| $10,000 to $14,999 | 2 | 0.9% |
| $15,000 to $24,999 | 2 | 0.9% |
| $25,000 to $34,999 | 23 | 10.7% |
| $35,000 to $49,999 | 25 | 11.6% |
| $50,000 to $74,999 | 41 | 19.1% |
| $75,000 to $99,999 | 23 | 10.7% |
| $100,000 to $149,999 | 60 | 27.9% |
| $150,000 to $199,999 | 11 | 5.1% |
| $200,000+ | 26 | 12.1% |
Family Income by Famaliy Size in Silverhill
3-person families (24 | 11.2%) account for the highest median family income in Silverhill with $121,250 per family, while 2-person families (129 | 60.0%) have the highest median income of $47,098 per family member.
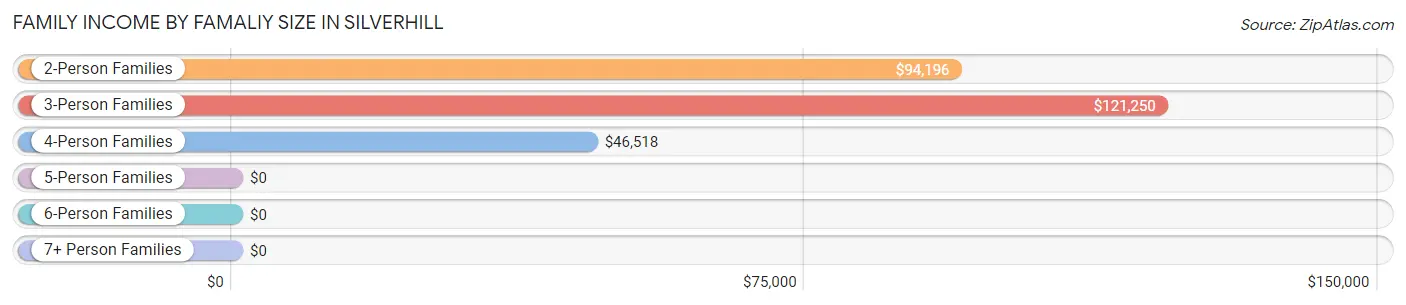
| Income Bracket | # Families | Median Income |
| 2-Person Families | 129 (60.0%) | $94,196 |
| 3-Person Families | 24 (11.2%) | $121,250 |
| 4-Person Families | 47 (21.9%) | $46,518 |
| 5-Person Families | 15 (7.0%) | $0 |
| 6-Person Families | 0 (0.0%) | $0 |
| 7+ Person Families | 0 (0.0%) | $0 |
| Total | 215 (100.0%) | $93,482 |
Family Income by Number of Earners in Silverhill
The median family income in Silverhill is $93,482, with families comprising 3+ earners (22) having the highest median family income of $250,001, while families with 1 earner (52) have the lowest median family income of $46,250, accounting for 10.2% and 24.2% of families, respectively.
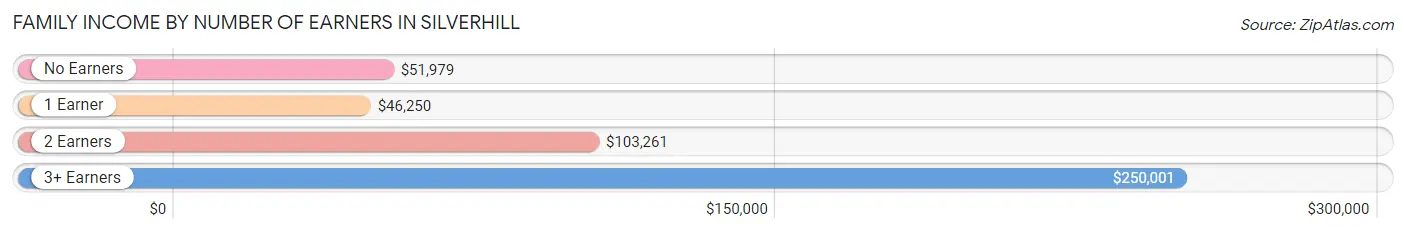
| Number of Earners | # Families | Median Income |
| No Earners | 25 (11.6%) | $51,979 |
| 1 Earner | 52 (24.2%) | $46,250 |
| 2 Earners | 116 (53.9%) | $103,261 |
| 3+ Earners | 22 (10.2%) | $250,001 |
| Total | 215 (100.0%) | $93,482 |
Household Income in Silverhill
Household Income Brackets in Silverhill
With 66 households falling in the category, the $100,000 to $149,999 income range is the most frequent in Silverhill, accounting for 20.1% of all households. In contrast, only 8 households (2.4%) fall into the less than $10,000 income bracket, making it the least populous group.
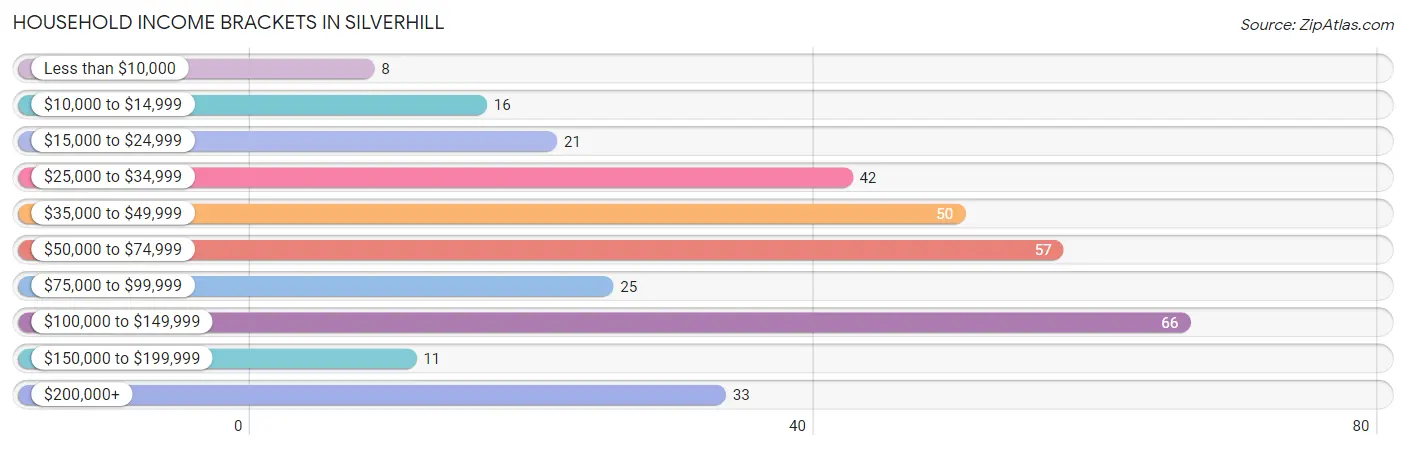
| Income Bracket | # Households | % Households |
| Less than $10,000 | 8 | 2.4% |
| $10,000 to $14,999 | 16 | 4.9% |
| $15,000 to $24,999 | 21 | 6.4% |
| $25,000 to $34,999 | 42 | 12.8% |
| $35,000 to $49,999 | 50 | 15.2% |
| $50,000 to $74,999 | 57 | 17.3% |
| $75,000 to $99,999 | 25 | 7.6% |
| $100,000 to $149,999 | 66 | 20.1% |
| $150,000 to $199,999 | 11 | 3.3% |
| $200,000+ | 33 | 10.0% |
Household Income by Householder Age in Silverhill
The median household income in Silverhill is $58,510, with the highest median household income of $102,554 found in the 45 to 64 years age bracket for the primary householder. A total of 133 households (40.4%) fall into this category. Meanwhile, the 15 to 24 years age bracket for the primary householder has the lowest median household income of $0, with 25 households (7.6%) in this group.
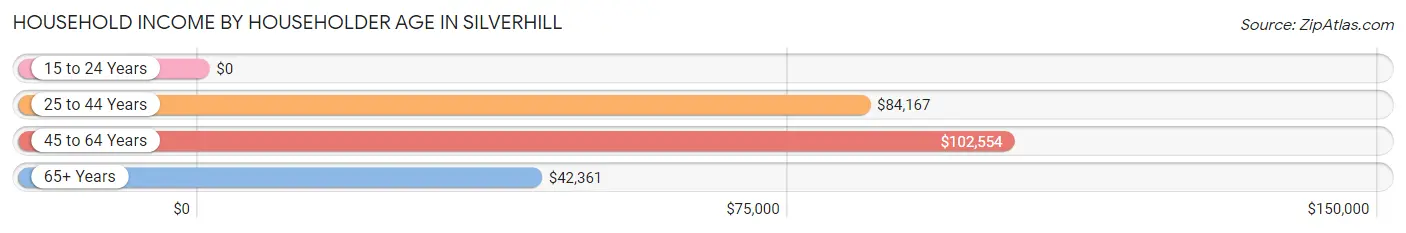
| Income Bracket | # Households | Median Income |
| 15 to 24 Years | 25 (7.6%) | $0 |
| 25 to 44 Years | 74 (22.5%) | $84,167 |
| 45 to 64 Years | 133 (40.4%) | $102,554 |
| 65+ Years | 97 (29.5%) | $42,361 |
| Total | 329 (100.0%) | $58,510 |
Poverty in Silverhill
Income Below Poverty by Sex and Age in Silverhill
With 7.1% poverty level for males and 6.8% for females among the residents of Silverhill, 18 to 24 year old males and 75 year old and over females are the most vulnerable to poverty, with 18 males (33.3%) and 6 females (20.7%) in their respective age groups living below the poverty level.
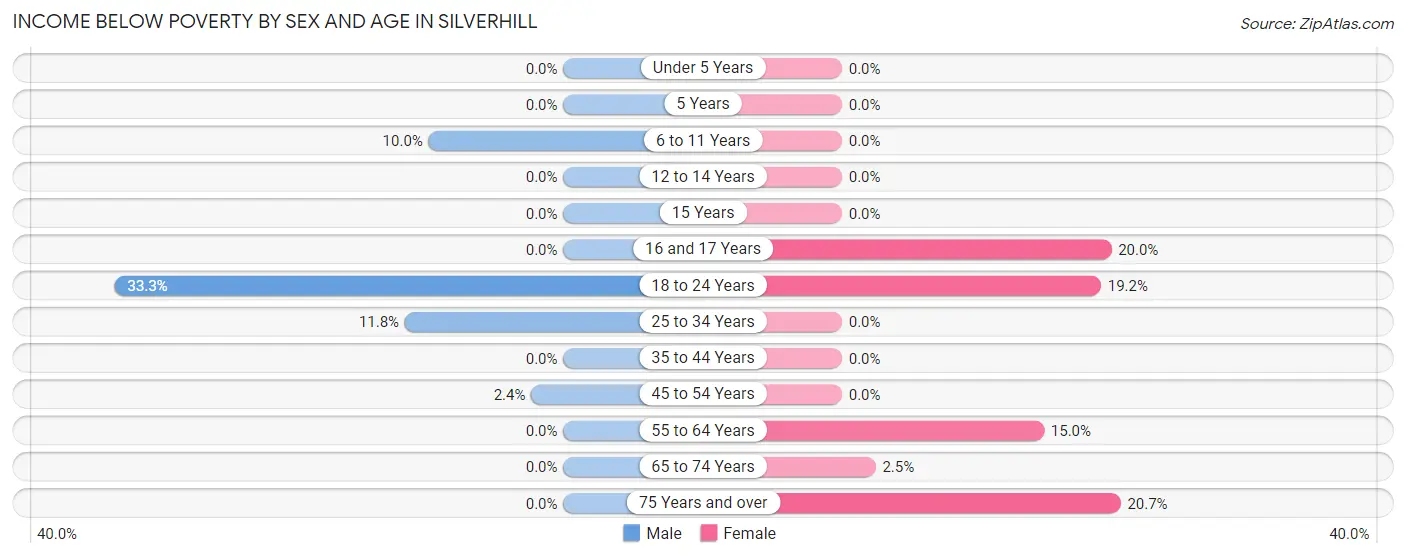
| Age Bracket | Male | Female |
| Under 5 Years | 0 (0.0%) | 0 (0.0%) |
| 5 Years | 0 (0.0%) | 0 (0.0%) |
| 6 to 11 Years | 1 (10.0%) | 0 (0.0%) |
| 12 to 14 Years | 0 (0.0%) | 0 (0.0%) |
| 15 Years | 0 (0.0%) | 0 (0.0%) |
| 16 and 17 Years | 0 (0.0%) | 2 (20.0%) |
| 18 to 24 Years | 18 (33.3%) | 10 (19.2%) |
| 25 to 34 Years | 4 (11.8%) | 0 (0.0%) |
| 35 to 44 Years | 0 (0.0%) | 0 (0.0%) |
| 45 to 54 Years | 1 (2.4%) | 0 (0.0%) |
| 55 to 64 Years | 0 (0.0%) | 6 (15.0%) |
| 65 to 74 Years | 0 (0.0%) | 1 (2.5%) |
| 75 Years and over | 0 (0.0%) | 6 (20.7%) |
| Total | 24 (7.1%) | 25 (6.8%) |
Income Above Poverty by Sex and Age in Silverhill
According to the poverty statistics in Silverhill, males aged under 5 years and females aged under 5 years are the age groups that are most secure financially, with 100.0% of males and 100.0% of females in these age groups living above the poverty line.
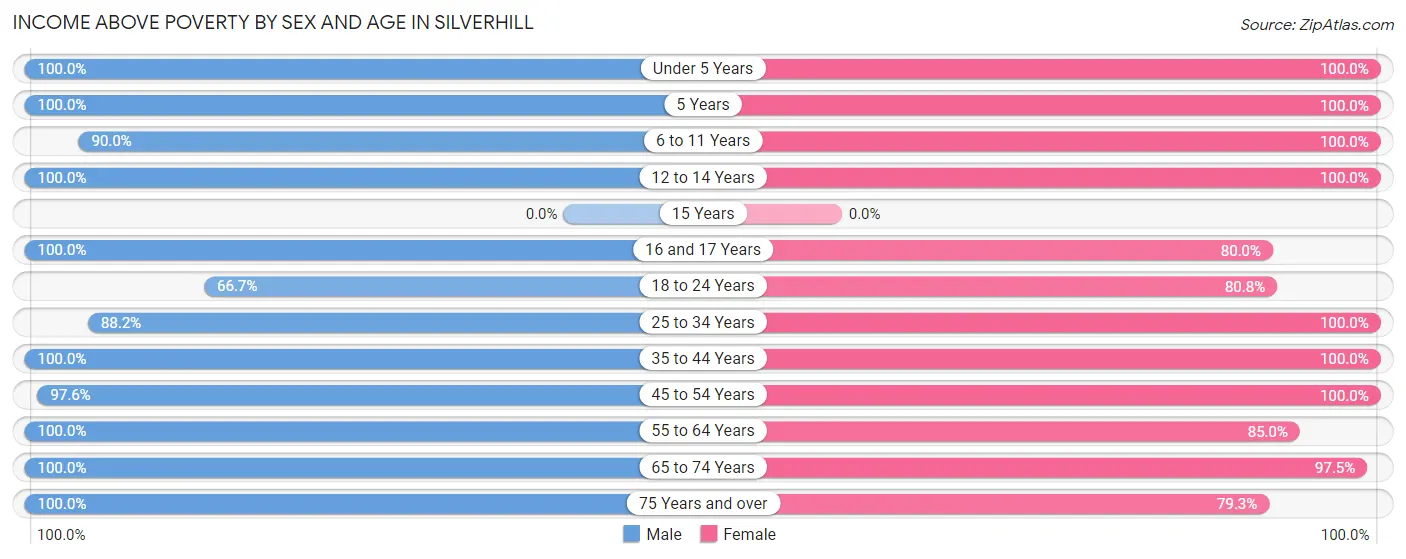
| Age Bracket | Male | Female |
| Under 5 Years | 22 (100.0%) | 3 (100.0%) |
| 5 Years | 5 (100.0%) | 14 (100.0%) |
| 6 to 11 Years | 9 (90.0%) | 13 (100.0%) |
| 12 to 14 Years | 17 (100.0%) | 4 (100.0%) |
| 15 Years | 0 (0.0%) | 0 (0.0%) |
| 16 and 17 Years | 9 (100.0%) | 8 (80.0%) |
| 18 to 24 Years | 36 (66.7%) | 42 (80.8%) |
| 25 to 34 Years | 30 (88.2%) | 60 (100.0%) |
| 35 to 44 Years | 40 (100.0%) | 19 (100.0%) |
| 45 to 54 Years | 41 (97.6%) | 86 (100.0%) |
| 55 to 64 Years | 53 (100.0%) | 34 (85.0%) |
| 65 to 74 Years | 26 (100.0%) | 39 (97.5%) |
| 75 Years and over | 25 (100.0%) | 23 (79.3%) |
| Total | 313 (92.9%) | 345 (93.2%) |
Income Below Poverty Among Married-Couple Families in Silverhill
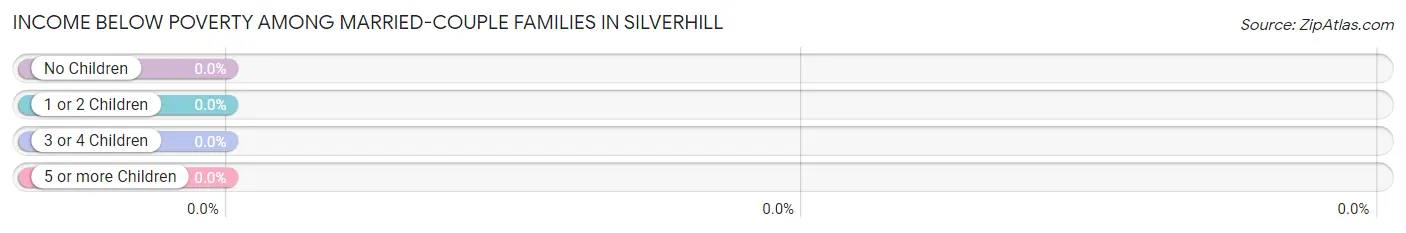
| Children | Above Poverty | Below Poverty |
| No Children | 111 (100.0%) | 0 (0.0%) |
| 1 or 2 Children | 67 (100.0%) | 0 (0.0%) |
| 3 or 4 Children | 0 (0.0%) | 0 (0.0%) |
| 5 or more Children | 0 (0.0%) | 0 (0.0%) |
| Total | 178 (100.0%) | 0 (0.0%) |
Income Below Poverty Among Single-Parent Households in Silverhill
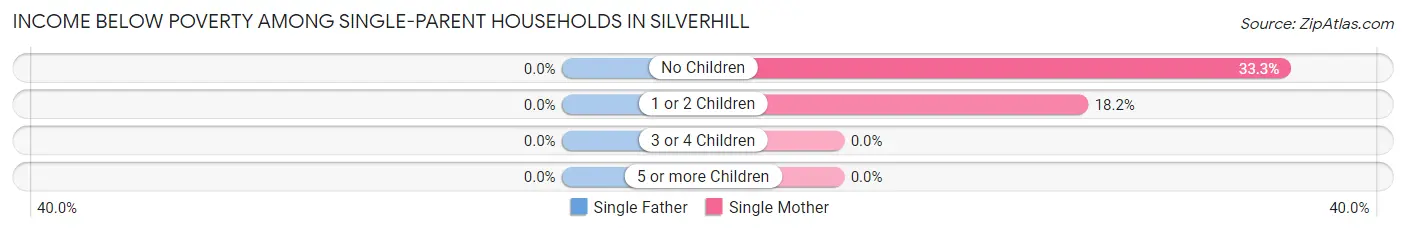
| Children | Single Father | Single Mother |
| No Children | 0 (0.0%) | 2 (33.3%) |
| 1 or 2 Children | 0 (0.0%) | 2 (18.2%) |
| 3 or 4 Children | 0 (0.0%) | 0 (0.0%) |
| 5 or more Children | 0 (0.0%) | 0 (0.0%) |
| Total | 0 (0.0%) | 4 (14.8%) |
Income Below Poverty Among Married-Couple vs Single-Parent Households in Silverhill
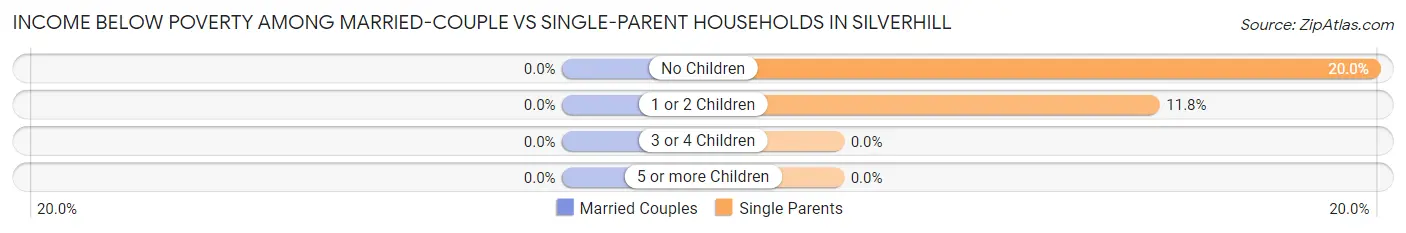
| Children | Married-Couple Families | Single-Parent Households |
| No Children | 0 (0.0%) | 2 (20.0%) |
| 1 or 2 Children | 0 (0.0%) | 2 (11.8%) |
| 3 or 4 Children | 0 (0.0%) | 0 (0.0%) |
| 5 or more Children | 0 (0.0%) | 0 (0.0%) |
| Total | 0 (0.0%) | 4 (10.8%) |
Race in Silverhill
The most populous races in Silverhill are White / Caucasian (587 | 82.6%), Hispanic or Latino (95 | 13.4%), and Some other Race (95 | 13.4%).
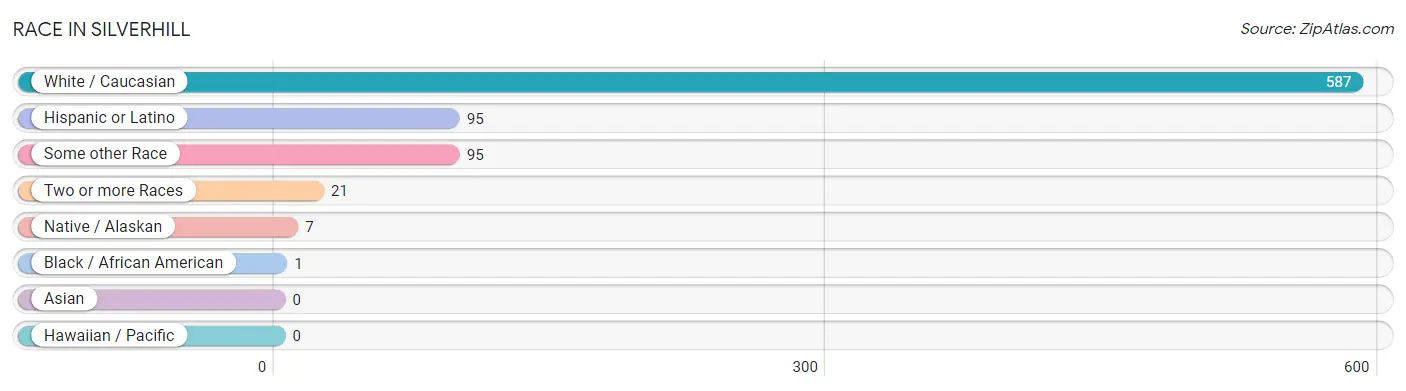
| Race | # Population | % Population |
| Asian | 0 | 0.0% |
| Black / African American | 1 | 0.1% |
| Hawaiian / Pacific | 0 | 0.0% |
| Hispanic or Latino | 95 | 13.4% |
| Native / Alaskan | 7 | 1.0% |
| White / Caucasian | 587 | 82.6% |
| Two or more Races | 21 | 2.9% |
| Some other Race | 95 | 13.4% |
| Total | 711 | 100.0% |
Ancestry in Silverhill
The most populous ancestries reported in Silverhill are American (261 | 36.7%), Mexican (82 | 11.5%), German (70 | 9.9%), English (62 | 8.7%), and Irish (37 | 5.2%), together accounting for 72.0% of all Silverhill residents.
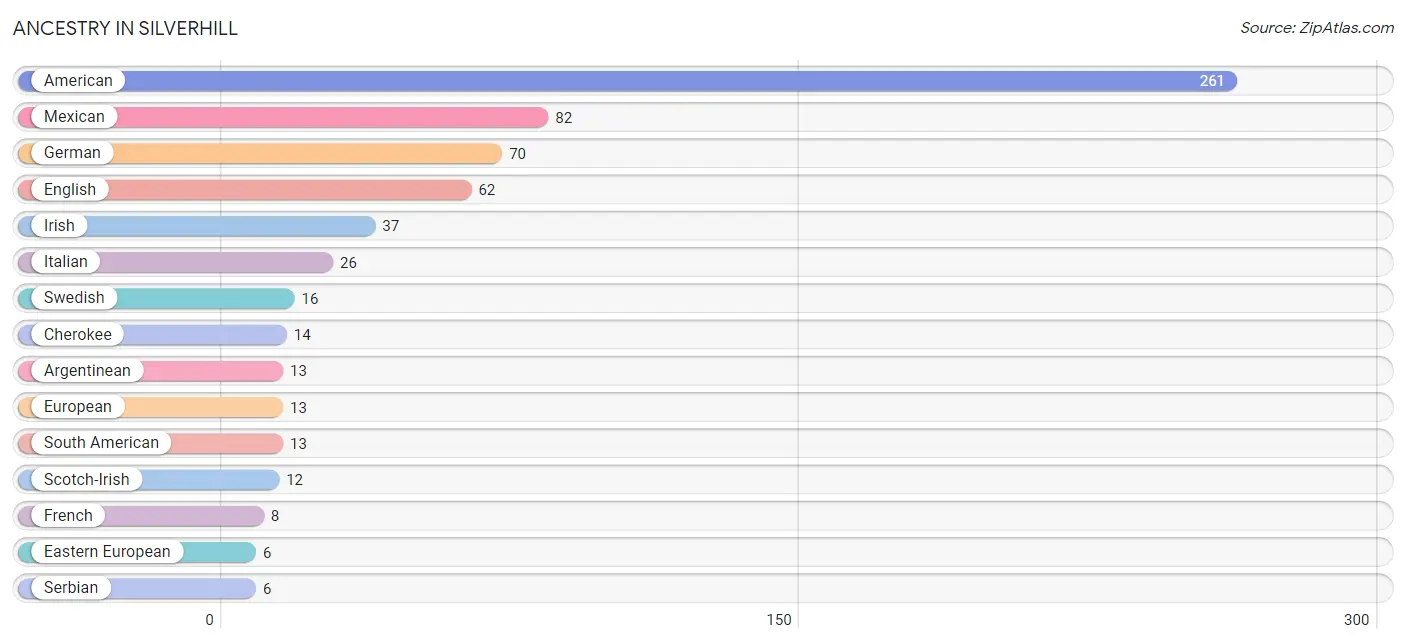
| Ancestry | # Population | % Population |
| American | 261 | 36.7% |
| Argentinean | 13 | 1.8% |
| British | 4 | 0.6% |
| Cherokee | 14 | 2.0% |
| Choctaw | 4 | 0.6% |
| Creek | 2 | 0.3% |
| Czech | 3 | 0.4% |
| Danish | 5 | 0.7% |
| Eastern European | 6 | 0.8% |
| English | 62 | 8.7% |
| European | 13 | 1.8% |
| French | 8 | 1.1% |
| French Canadian | 3 | 0.4% |
| German | 70 | 9.9% |
| Irish | 37 | 5.2% |
| Italian | 26 | 3.7% |
| Mexican | 82 | 11.5% |
| Norwegian | 4 | 0.6% |
| Polish | 2 | 0.3% |
| Russian | 1 | 0.1% |
| Scotch-Irish | 12 | 1.7% |
| Scottish | 5 | 0.7% |
| Serbian | 6 | 0.8% |
| South American | 13 | 1.8% |
| Swedish | 16 | 2.2% |
| Swiss | 2 | 0.3% |
| Welsh | 3 | 0.4% | View All 27 Rows |
Immigrants in Silverhill
The most numerous immigrant groups reported in Silverhill came from Latin America (27 | 3.8%), Central America (14 | 2.0%), Mexico (14 | 2.0%), Argentina (13 | 1.8%), and South America (13 | 1.8%), together accounting for 11.4% of all Silverhill residents.
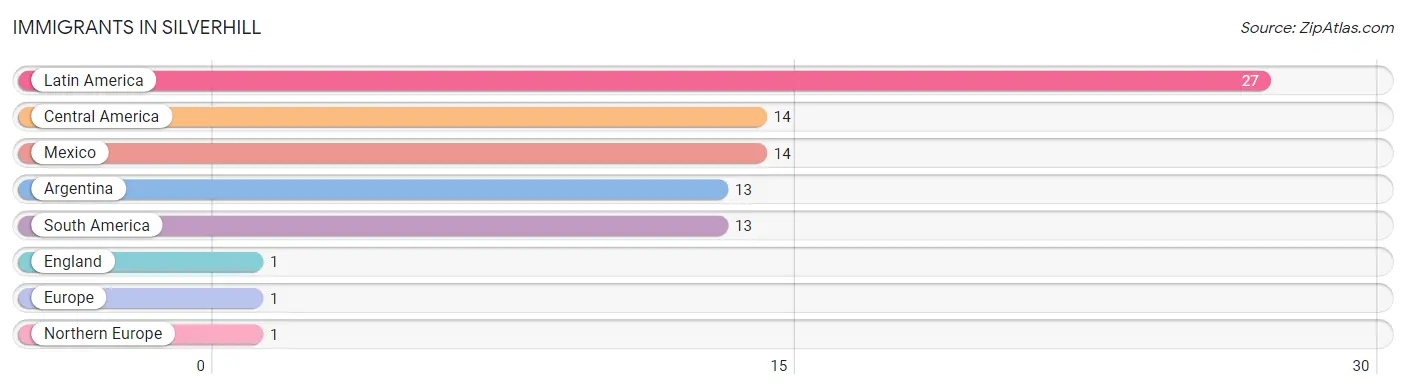
| Immigration Origin | # Population | % Population |
| Argentina | 13 | 1.8% |
| Central America | 14 | 2.0% |
| England | 1 | 0.1% |
| Europe | 1 | 0.1% |
| Latin America | 27 | 3.8% |
| Mexico | 14 | 2.0% |
| Northern Europe | 1 | 0.1% |
| South America | 13 | 1.8% | View All 8 Rows |
Sex and Age in Silverhill
Sex and Age in Silverhill
The most populous age groups in Silverhill are 20 to 24 Years (37 | 11.0%) for men and 25 to 29 Years (54 | 14.4%) for women.
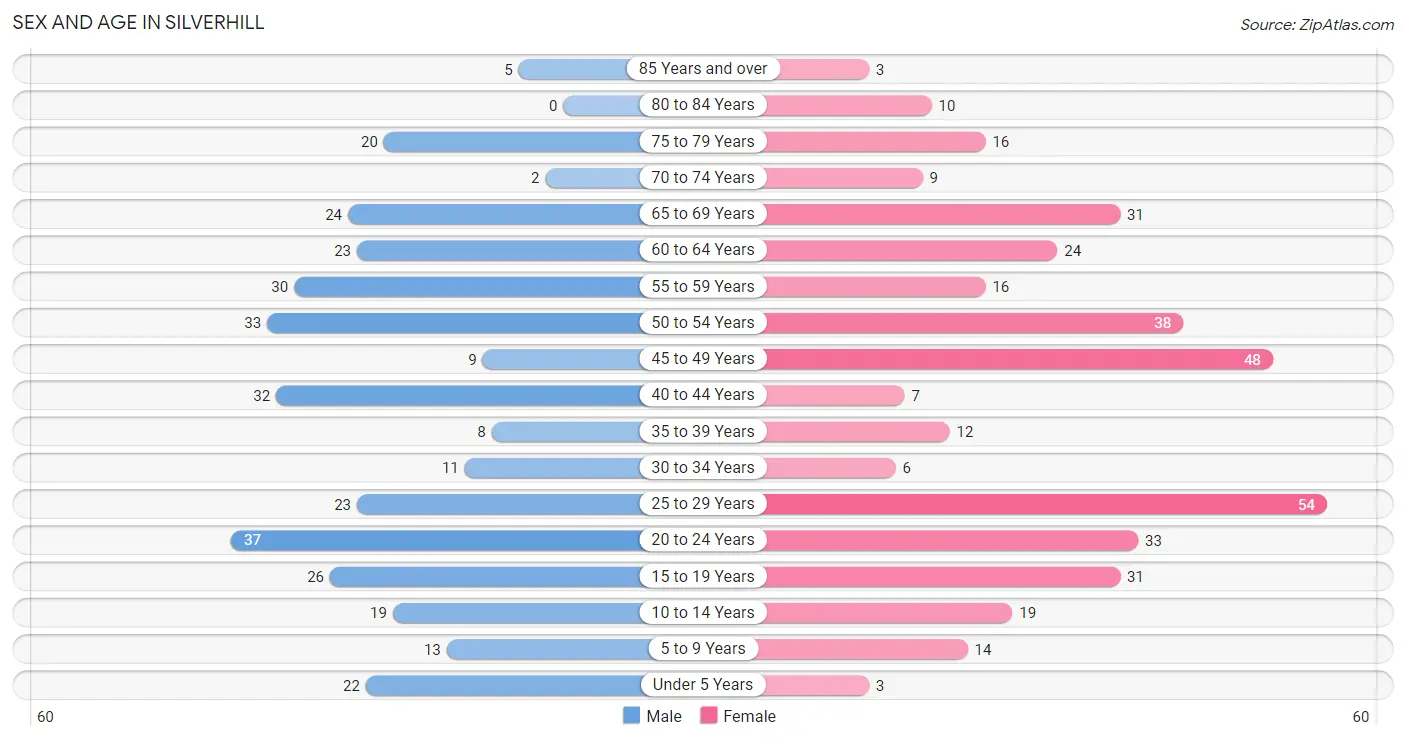
| Age Bracket | Male | Female |
| Under 5 Years | 22 (6.5%) | 3 (0.8%) |
| 5 to 9 Years | 13 (3.9%) | 14 (3.7%) |
| 10 to 14 Years | 19 (5.6%) | 19 (5.1%) |
| 15 to 19 Years | 26 (7.7%) | 31 (8.3%) |
| 20 to 24 Years | 37 (11.0%) | 33 (8.8%) |
| 25 to 29 Years | 23 (6.8%) | 54 (14.4%) |
| 30 to 34 Years | 11 (3.3%) | 6 (1.6%) |
| 35 to 39 Years | 8 (2.4%) | 12 (3.2%) |
| 40 to 44 Years | 32 (9.5%) | 7 (1.9%) |
| 45 to 49 Years | 9 (2.7%) | 48 (12.8%) |
| 50 to 54 Years | 33 (9.8%) | 38 (10.2%) |
| 55 to 59 Years | 30 (8.9%) | 16 (4.3%) |
| 60 to 64 Years | 23 (6.8%) | 24 (6.4%) |
| 65 to 69 Years | 24 (7.1%) | 31 (8.3%) |
| 70 to 74 Years | 2 (0.6%) | 9 (2.4%) |
| 75 to 79 Years | 20 (5.9%) | 16 (4.3%) |
| 80 to 84 Years | 0 (0.0%) | 10 (2.7%) |
| 85 Years and over | 5 (1.5%) | 3 (0.8%) |
| Total | 337 (100.0%) | 374 (100.0%) |
Families and Households in Silverhill
Median Family Size in Silverhill
The median family size in Silverhill is 2.55 persons per family, with married-couple families (178 | 82.8%) accounting for the largest median family size of 2.66 persons per family. On the other hand, single female/mother families (27 | 12.6%) represent the smallest median family size with 1.89 persons per family.
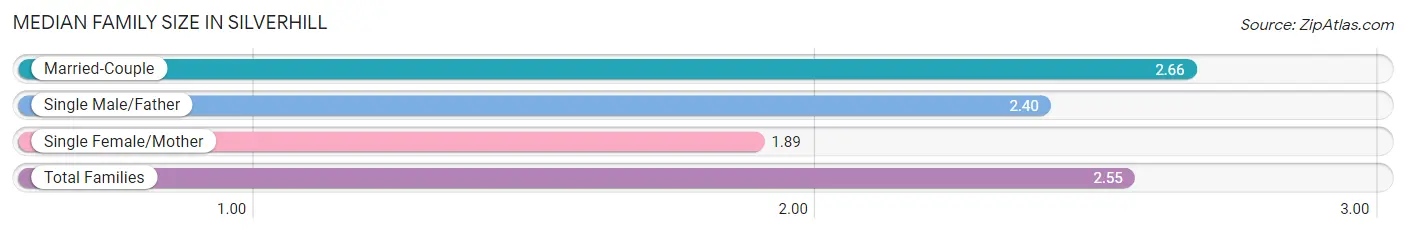
| Family Type | # Families | Family Size |
| Married-Couple | 178 (82.8%) | 2.66 |
| Single Male/Father | 10 (4.6%) | 2.40 |
| Single Female/Mother | 27 (12.6%) | 1.89 |
| Total Families | 215 (100.0%) | 2.55 |
Median Household Size in Silverhill
The median household size in Silverhill is 2.15 persons per household, with married-couple households (178 | 54.1%) accounting for the largest median household size of 2.66 persons per household. non-family households (114 | 34.6%) represent the smallest median household size with 1.39 persons per household.
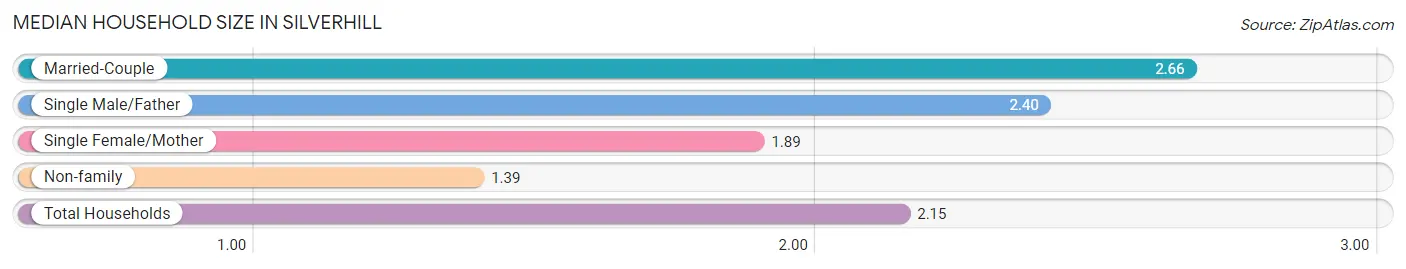
| Household Type | # Households | Household Size |
| Married-Couple | 178 (54.1%) | 2.66 |
| Single Male/Father | 10 (3.0%) | 2.40 |
| Single Female/Mother | 27 (8.2%) | 1.89 |
| Non-family | 114 (34.6%) | 1.39 |
| Total Households | 329 (100.0%) | 2.15 |
Household Size by Marriage Status in Silverhill
Out of a total of 329 households in Silverhill, 215 (65.3%) are family households, while 114 (34.6%) are nonfamily households. The most numerous type of family households are 2-person households, comprising 129, and the most common type of nonfamily households are 1-person households, comprising 97.
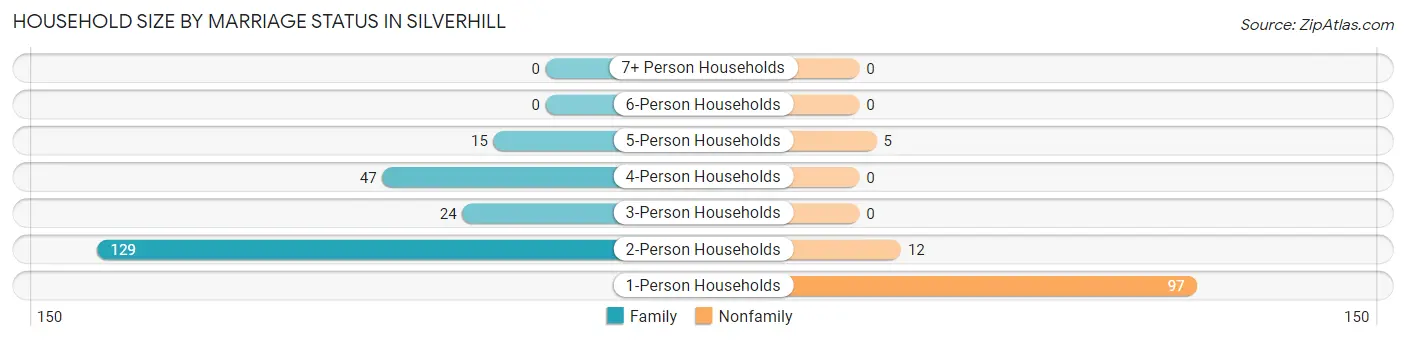
| Household Size | Family Households | Nonfamily Households |
| 1-Person Households | - | 97 (29.5%) |
| 2-Person Households | 129 (39.2%) | 12 (3.6%) |
| 3-Person Households | 24 (7.3%) | 0 (0.0%) |
| 4-Person Households | 47 (14.3%) | 0 (0.0%) |
| 5-Person Households | 15 (4.6%) | 5 (1.5%) |
| 6-Person Households | 0 (0.0%) | 0 (0.0%) |
| 7+ Person Households | 0 (0.0%) | 0 (0.0%) |
| Total | 215 (65.3%) | 114 (34.6%) |
Female Fertility in Silverhill
Fertility by Age in Silverhill
Average fertility rate in Silverhill is 52.0 births per 1,000 women. Women in the age bracket of 20 to 34 years have the highest fertility rate with 108.0 births per 1,000 women. Women in the age bracket of 20 to 34 years acount for 100.0% of all women with births.
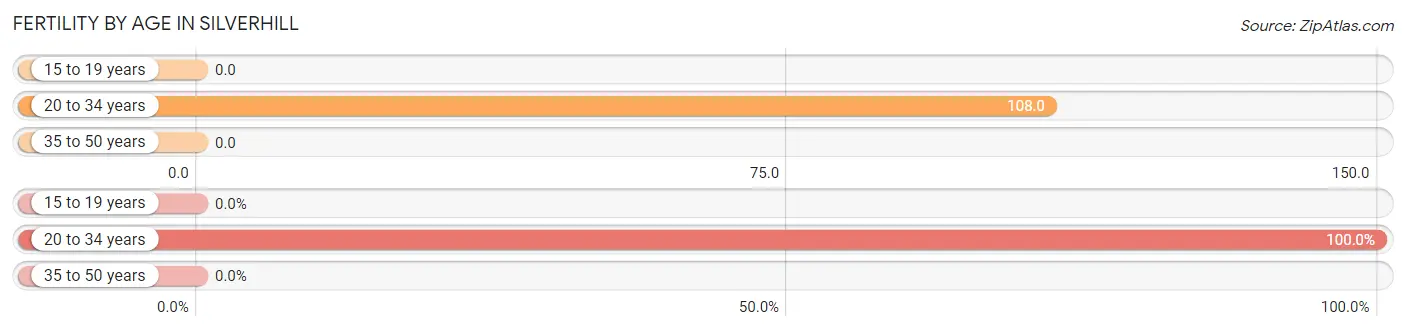
| Age Bracket | Women with Births | Births / 1,000 Women |
| 15 to 19 years | 0 (0.0%) | 0.0 |
| 20 to 34 years | 10 (100.0%) | 108.0 |
| 35 to 50 years | 0 (0.0%) | 0.0 |
| Total | 10 (100.0%) | 52.0 |
Fertility by Age by Marriage Status in Silverhill
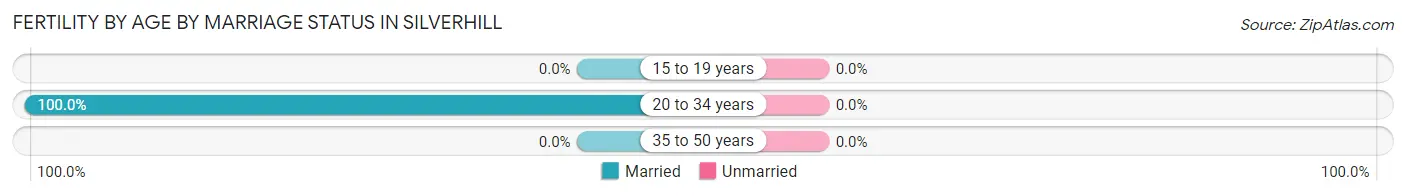
| Age Bracket | Married | Unmarried |
| 15 to 19 years | 0 (0.0%) | 0 (0.0%) |
| 20 to 34 years | 10 (100.0%) | 0 (0.0%) |
| 35 to 50 years | 0 (0.0%) | 0 (0.0%) |
| Total | 10 (100.0%) | 0 (0.0%) |
Fertility by Education in Silverhill
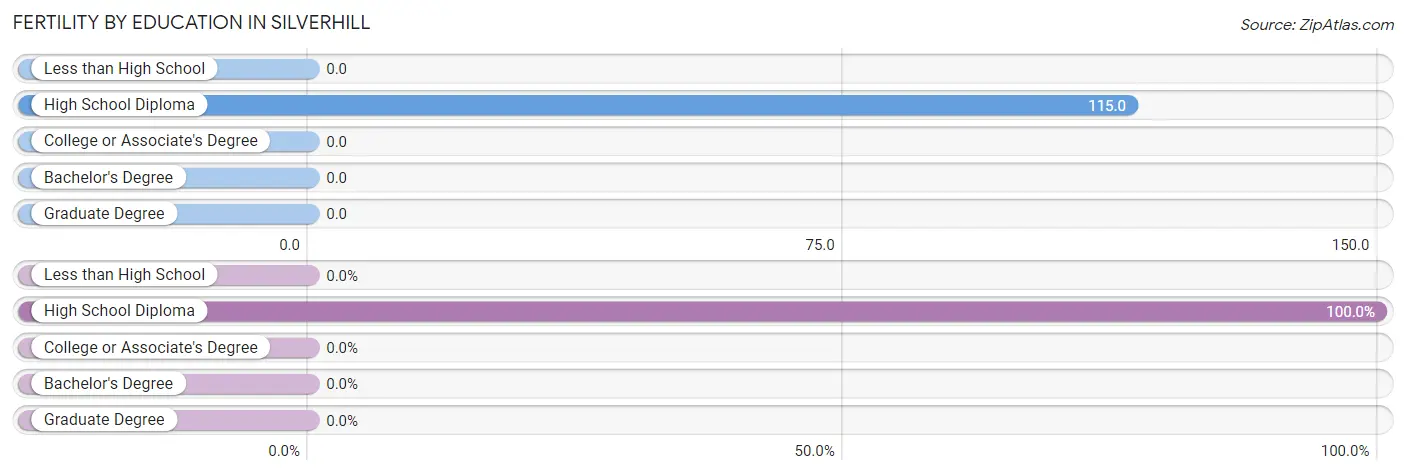
| Educational Attainment | Women with Births | Births / 1,000 Women |
| Less than High School | 0 (0.0%) | 0.0 |
| High School Diploma | 10 (100.0%) | 115.0 |
| College or Associate's Degree | 0 (0.0%) | 0.0 |
| Bachelor's Degree | 0 (0.0%) | 0.0 |
| Graduate Degree | 0 (0.0%) | 0.0 |
| Total | 10 (100.0%) | 52.0 |
Fertility by Education by Marriage Status in Silverhill
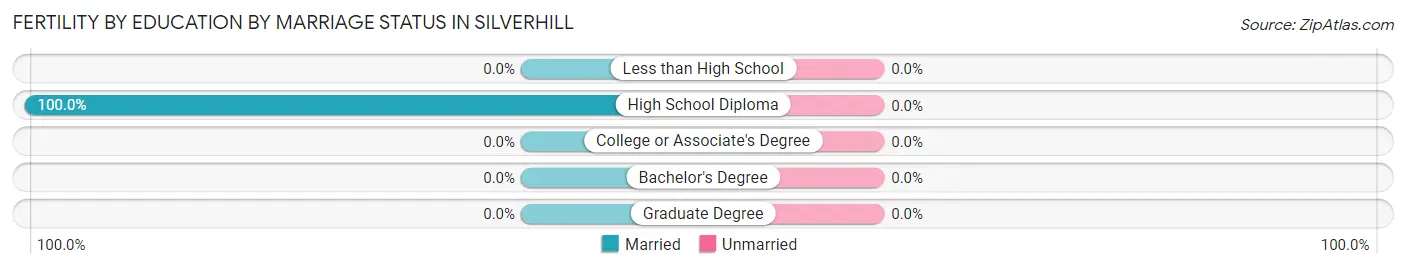
| Educational Attainment | Married | Unmarried |
| Less than High School | 0 (0.0%) | 0 (0.0%) |
| High School Diploma | 10 (100.0%) | 0 (0.0%) |
| College or Associate's Degree | 0 (0.0%) | 0 (0.0%) |
| Bachelor's Degree | 0 (0.0%) | 0 (0.0%) |
| Graduate Degree | 0 (0.0%) | 0 (0.0%) |
| Total | 10 (100.0%) | 0 (0.0%) |
Employment Characteristics in Silverhill
Employment by Class of Employer in Silverhill
Among the 435 employed individuals in Silverhill, private company employees (276 | 63.4%), local government employees (66 | 15.2%), and self-employed (not incorporated) (48 | 11.0%) make up the most common classes of employment.
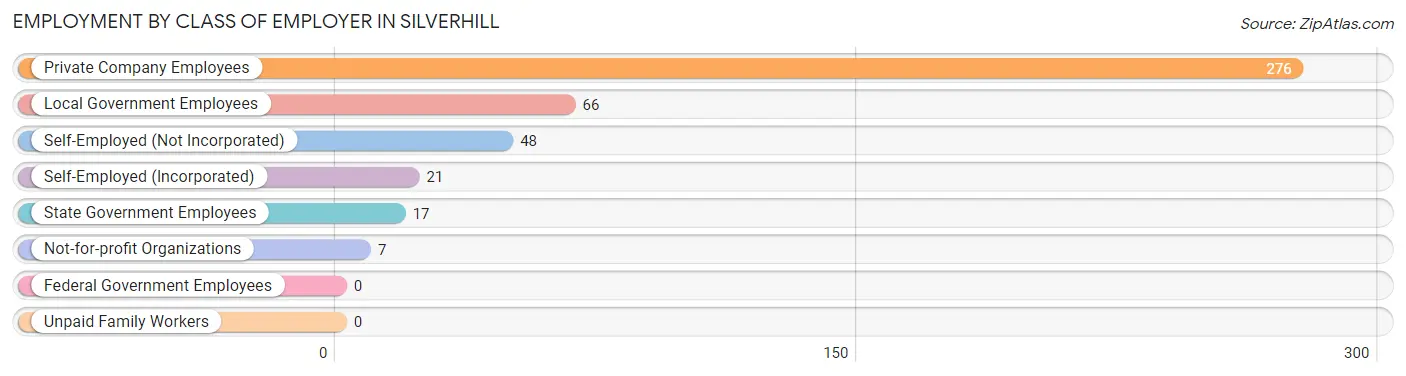
| Employer Class | # Employees | % Employees |
| Private Company Employees | 276 | 63.4% |
| Self-Employed (Incorporated) | 21 | 4.8% |
| Self-Employed (Not Incorporated) | 48 | 11.0% |
| Not-for-profit Organizations | 7 | 1.6% |
| Local Government Employees | 66 | 15.2% |
| State Government Employees | 17 | 3.9% |
| Federal Government Employees | 0 | 0.0% |
| Unpaid Family Workers | 0 | 0.0% |
| Total | 435 | 100.0% |
Employment Status by Age in Silverhill
According to the labor force statistics for Silverhill, out of the total population over 16 years of age (619), 71.6% or 443 individuals are in the labor force, with 0.5% or 2 of them unemployed. The age group with the highest labor force participation rate is 25 to 29 years, with 100.0% or 77 individuals in the labor force. Within the labor force, the 55 to 59 years age range has the highest percentage of unemployed individuals, with 4.3% or 2 of them being unemployed.
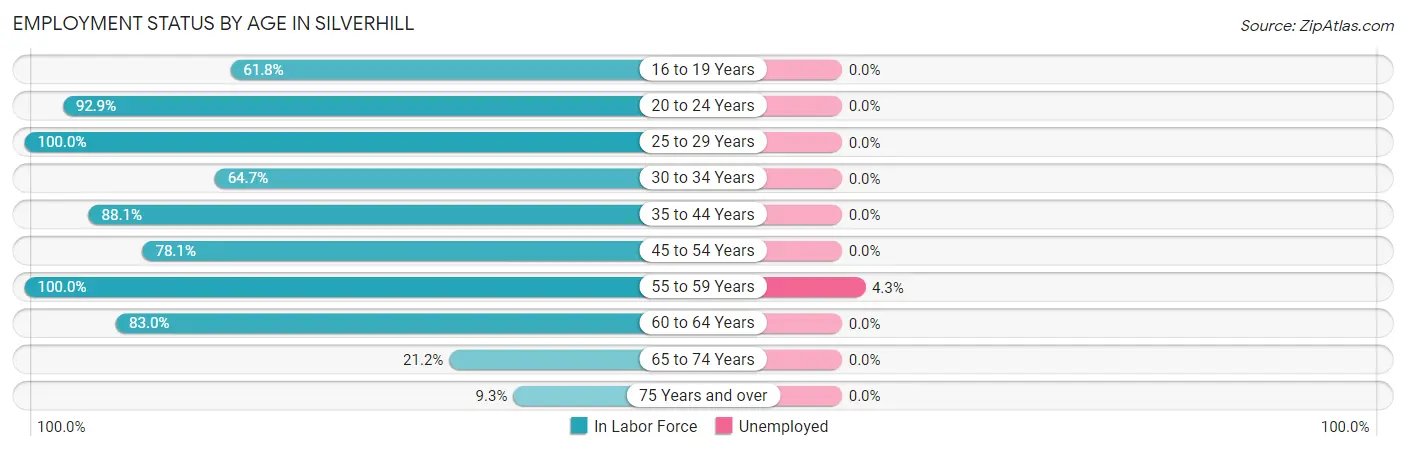
| Age Bracket | In Labor Force | Unemployed |
| 16 to 19 Years | 34 (61.8%) | 0 (0.0%) |
| 20 to 24 Years | 65 (92.9%) | 0 (0.0%) |
| 25 to 29 Years | 77 (100.0%) | 0 (0.0%) |
| 30 to 34 Years | 11 (64.7%) | 0 (0.0%) |
| 35 to 44 Years | 52 (88.1%) | 0 (0.0%) |
| 45 to 54 Years | 100 (78.1%) | 0 (0.0%) |
| 55 to 59 Years | 46 (100.0%) | 2 (4.3%) |
| 60 to 64 Years | 39 (83.0%) | 0 (0.0%) |
| 65 to 74 Years | 14 (21.2%) | 0 (0.0%) |
| 75 Years and over | 5 (9.3%) | 0 (0.0%) |
| Total | 443 (71.6%) | 2 (0.5%) |
Employment Status by Educational Attainment in Silverhill
According to labor force statistics for Silverhill, 86.9% of individuals (325) out of the total population between 25 and 64 years of age (374) are in the labor force, with 0.6% or 2 of them being unemployed. The group with the highest labor force participation rate are those with the educational attainment of less than high school, with 91.4% or 32 individuals in the labor force. Within the labor force, individuals with college / associate degree education have the highest percentage of unemployment, with 2.4% or 2 of them being unemployed.
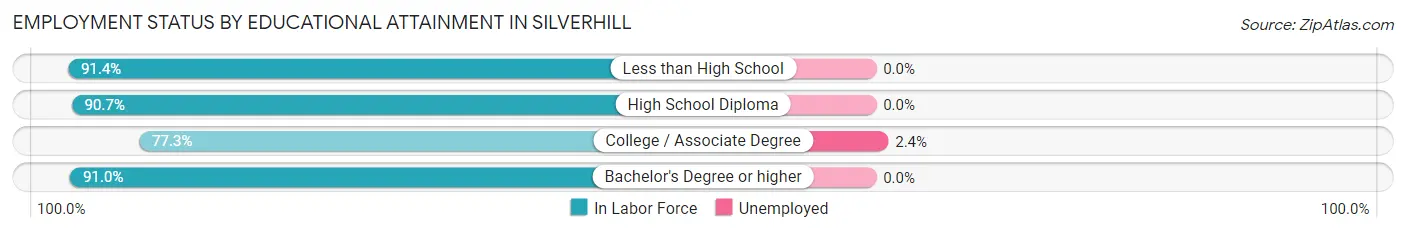
| Educational Attainment | In Labor Force | Unemployed |
| Less than High School | 32 (91.4%) | 0 (0.0%) |
| High School Diploma | 117 (90.7%) | 0 (0.0%) |
| College / Associate Degree | 85 (77.3%) | 3 (2.4%) |
| Bachelor's Degree or higher | 91 (91.0%) | 0 (0.0%) |
| Total | 325 (86.9%) | 2 (0.6%) |
Employment Occupations by Sex in Silverhill
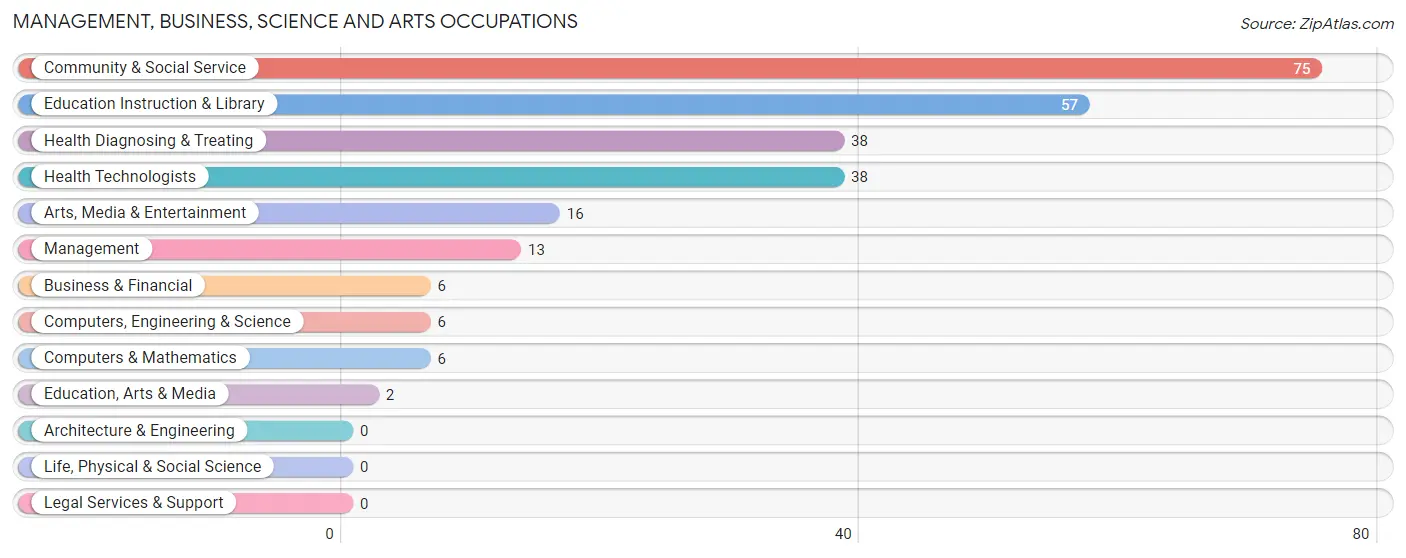
Management, Business, Science and Arts Occupations
The most common Management, Business, Science and Arts occupations in Silverhill are Community & Social Service (75 | 17.0%), Education Instruction & Library (57 | 12.9%), Health Diagnosing & Treating (38 | 8.6%), Health Technologists (38 | 8.6%), and Arts, Media & Entertainment (16 | 3.6%).
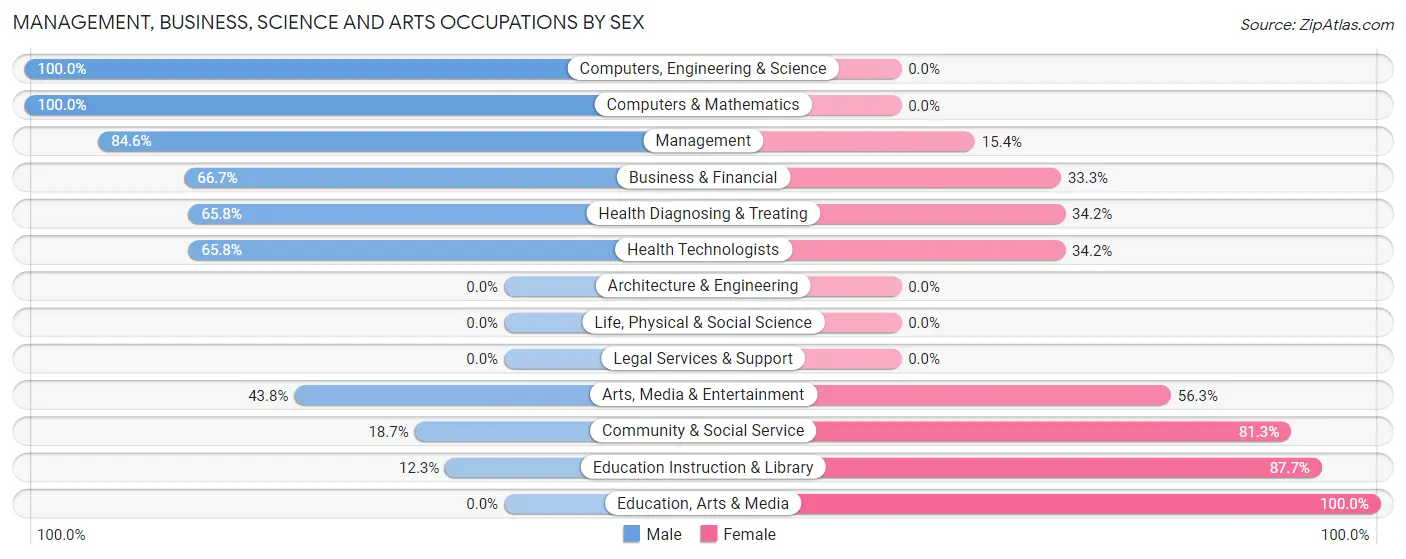
Management, Business, Science and Arts Occupations by Sex
Within the Management, Business, Science and Arts occupations in Silverhill, the most male-oriented occupations are Computers, Engineering & Science (100.0%), Computers & Mathematics (100.0%), and Management (84.6%), while the most female-oriented occupations are Education, Arts & Media (100.0%), Education Instruction & Library (87.7%), and Community & Social Service (81.3%).
| Occupation | Male | Female |
| Management | 11 (84.6%) | 2 (15.4%) |
| Business & Financial | 4 (66.7%) | 2 (33.3%) |
| Computers, Engineering & Science | 6 (100.0%) | 0 (0.0%) |
| Computers & Mathematics | 6 (100.0%) | 0 (0.0%) |
| Architecture & Engineering | 0 (0.0%) | 0 (0.0%) |
| Life, Physical & Social Science | 0 (0.0%) | 0 (0.0%) |
| Community & Social Service | 14 (18.7%) | 61 (81.3%) |
| Education, Arts & Media | 0 (0.0%) | 2 (100.0%) |
| Legal Services & Support | 0 (0.0%) | 0 (0.0%) |
| Education Instruction & Library | 7 (12.3%) | 50 (87.7%) |
| Arts, Media & Entertainment | 7 (43.8%) | 9 (56.2%) |
| Health Diagnosing & Treating | 25 (65.8%) | 13 (34.2%) |
| Health Technologists | 25 (65.8%) | 13 (34.2%) |
| Total (Category) | 60 (43.5%) | 78 (56.5%) |
| Total (Overall) | 222 (50.3%) | 219 (49.7%) |
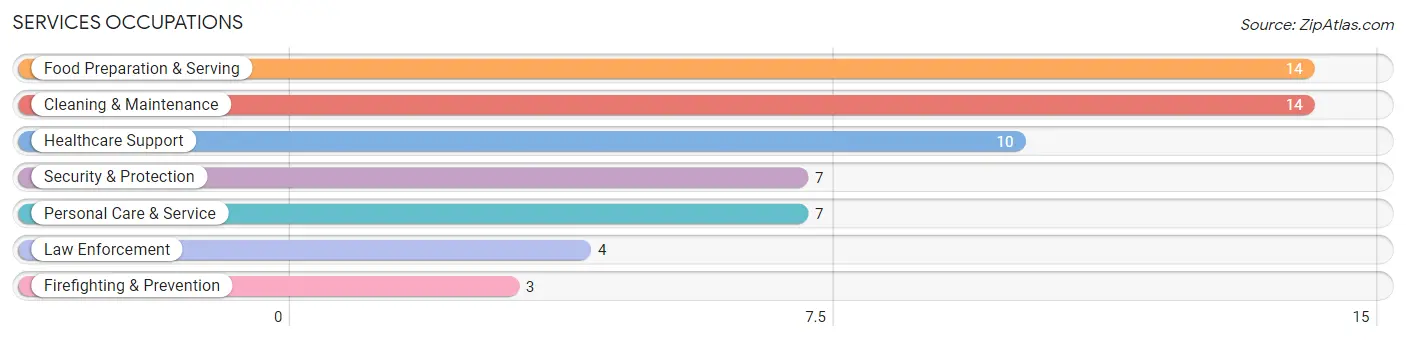
Services Occupations
The most common Services occupations in Silverhill are Food Preparation & Serving (14 | 3.2%), Cleaning & Maintenance (14 | 3.2%), Healthcare Support (10 | 2.3%), Security & Protection (7 | 1.6%), and Personal Care & Service (7 | 1.6%).
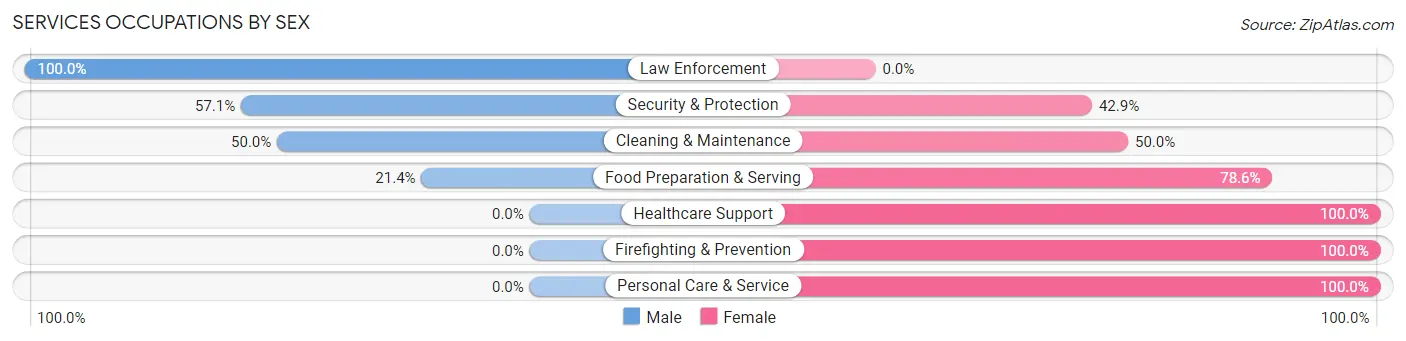
Services Occupations by Sex
Within the Services occupations in Silverhill, the most male-oriented occupations are Law Enforcement (100.0%), Security & Protection (57.1%), and Cleaning & Maintenance (50.0%), while the most female-oriented occupations are Healthcare Support (100.0%), Firefighting & Prevention (100.0%), and Personal Care & Service (100.0%).
| Occupation | Male | Female |
| Healthcare Support | 0 (0.0%) | 10 (100.0%) |
| Security & Protection | 4 (57.1%) | 3 (42.9%) |
| Firefighting & Prevention | 0 (0.0%) | 3 (100.0%) |
| Law Enforcement | 4 (100.0%) | 0 (0.0%) |
| Food Preparation & Serving | 3 (21.4%) | 11 (78.6%) |
| Cleaning & Maintenance | 7 (50.0%) | 7 (50.0%) |
| Personal Care & Service | 0 (0.0%) | 7 (100.0%) |
| Total (Category) | 14 (26.9%) | 38 (73.1%) |
| Total (Overall) | 222 (50.3%) | 219 (49.7%) |
Sales and Office Occupations
The most common Sales and Office occupations in Silverhill are Office & Administration (75 | 17.0%), and Sales & Related (69 | 15.7%).
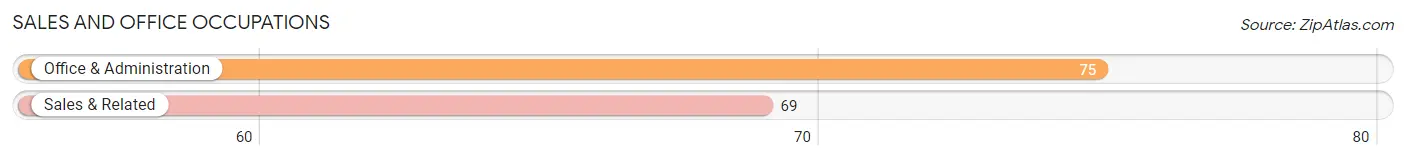
Sales and Office Occupations by Sex
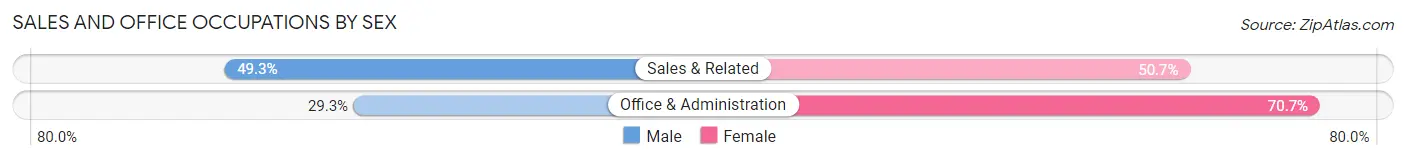
| Occupation | Male | Female |
| Sales & Related | 34 (49.3%) | 35 (50.7%) |
| Office & Administration | 22 (29.3%) | 53 (70.7%) |
| Total (Category) | 56 (38.9%) | 88 (61.1%) |
| Total (Overall) | 222 (50.3%) | 219 (49.7%) |
Natural Resources, Construction and Maintenance Occupations
The most common Natural Resources, Construction and Maintenance occupations in Silverhill are Construction & Extraction (44 | 10.0%), Installation, Maintenance & Repair (8 | 1.8%), and Farming, Fishing & Forestry (6 | 1.4%).
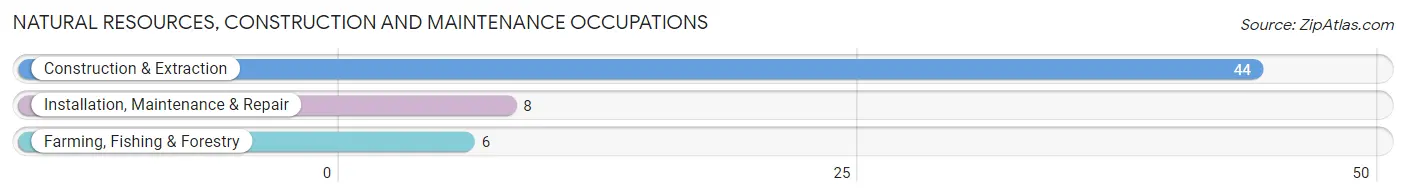
Natural Resources, Construction and Maintenance Occupations by Sex
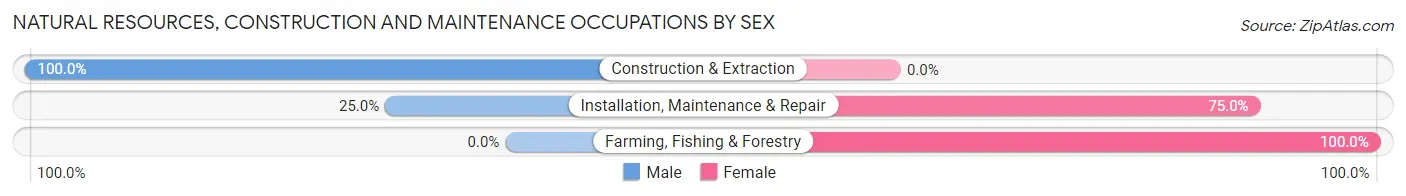
| Occupation | Male | Female |
| Farming, Fishing & Forestry | 0 (0.0%) | 6 (100.0%) |
| Construction & Extraction | 44 (100.0%) | 0 (0.0%) |
| Installation, Maintenance & Repair | 2 (25.0%) | 6 (75.0%) |
| Total (Category) | 46 (79.3%) | 12 (20.7%) |
| Total (Overall) | 222 (50.3%) | 219 (49.7%) |
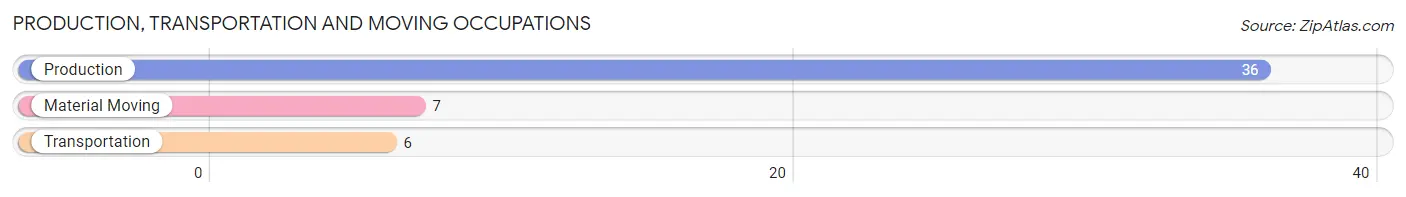
Production, Transportation and Moving Occupations
The most common Production, Transportation and Moving occupations in Silverhill are Production (36 | 8.2%), Material Moving (7 | 1.6%), and Transportation (6 | 1.4%).
Production, Transportation and Moving Occupations by Sex
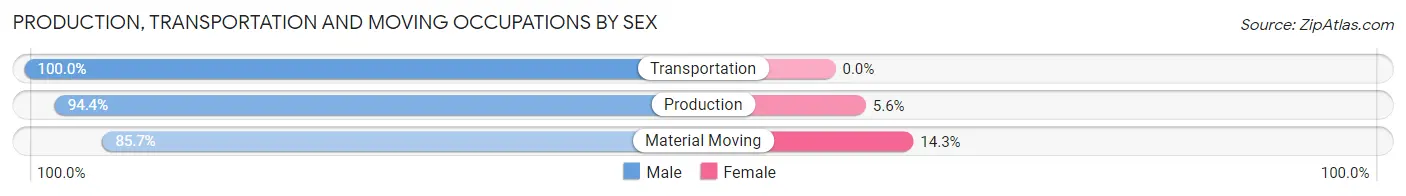
| Occupation | Male | Female |
| Production | 34 (94.4%) | 2 (5.6%) |
| Transportation | 6 (100.0%) | 0 (0.0%) |
| Material Moving | 6 (85.7%) | 1 (14.3%) |
| Total (Category) | 46 (93.9%) | 3 (6.1%) |
| Total (Overall) | 222 (50.3%) | 219 (49.7%) |
Employment Industries by Sex in Silverhill
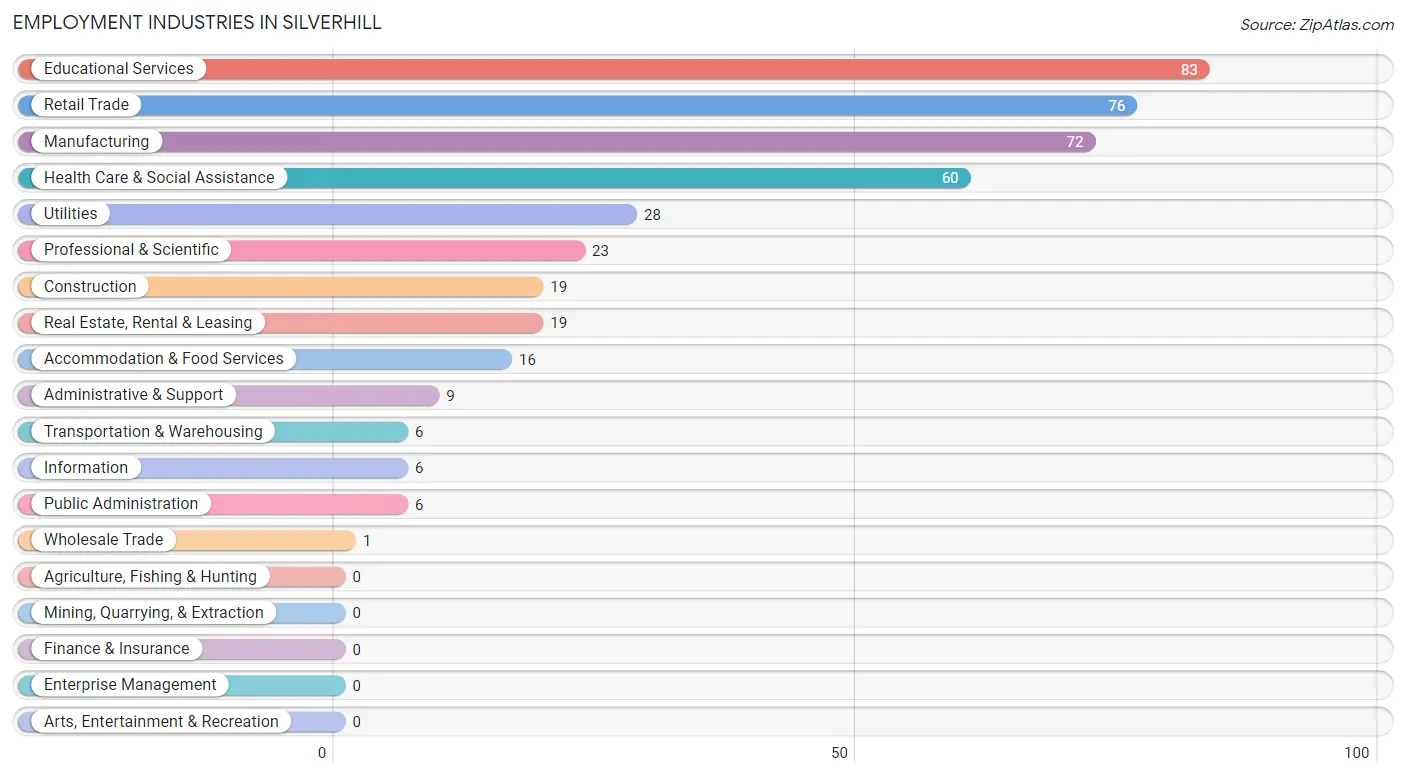
Employment Industries in Silverhill
The major employment industries in Silverhill include Educational Services (83 | 18.8%), Retail Trade (76 | 17.2%), Manufacturing (72 | 16.3%), Health Care & Social Assistance (60 | 13.6%), and Utilities (28 | 6.4%).
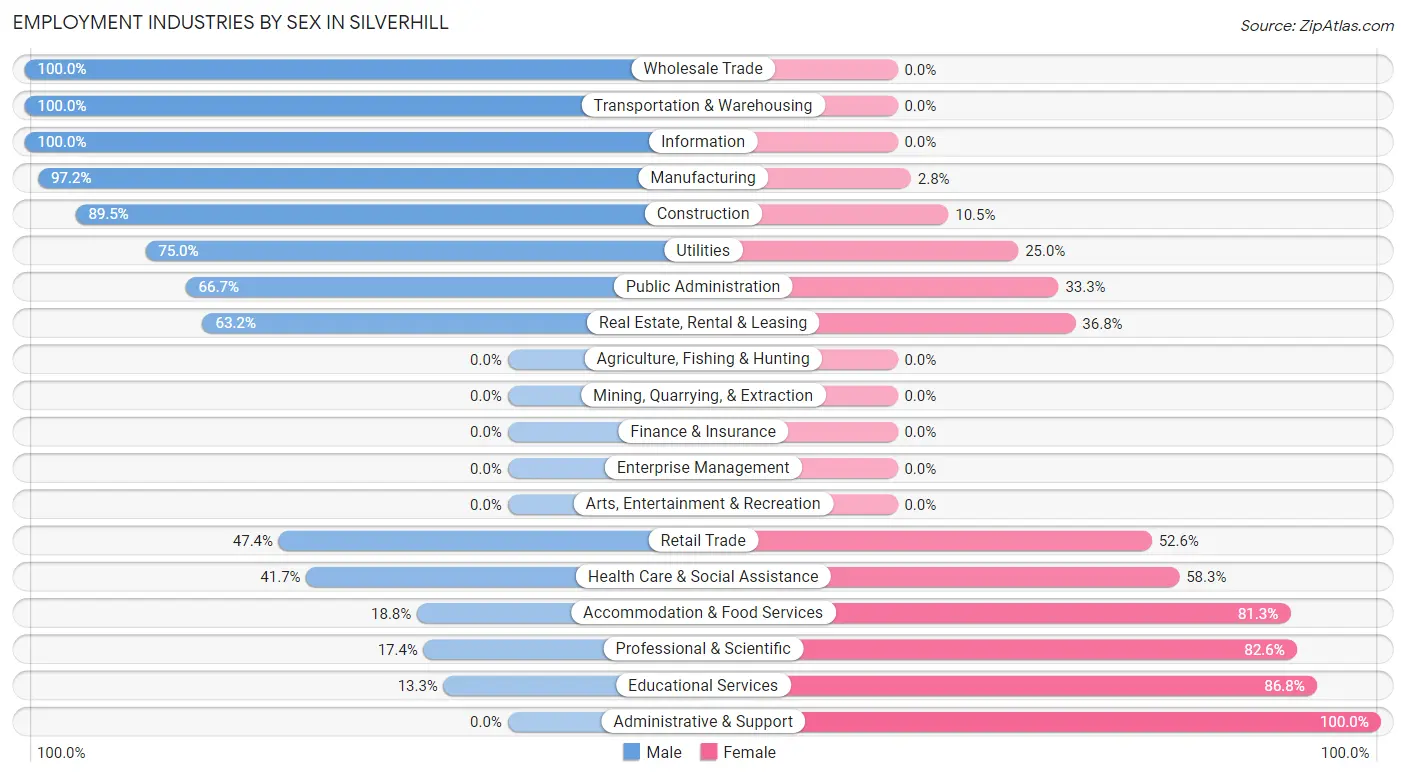
Employment Industries by Sex in Silverhill
The Silverhill industries that see more men than women are Wholesale Trade (100.0%), Transportation & Warehousing (100.0%), and Information (100.0%), whereas the industries that tend to have a higher number of women are Administrative & Support (100.0%), Educational Services (86.8%), and Professional & Scientific (82.6%).
| Industry | Male | Female |
| Agriculture, Fishing & Hunting | 0 (0.0%) | 0 (0.0%) |
| Mining, Quarrying, & Extraction | 0 (0.0%) | 0 (0.0%) |
| Construction | 17 (89.5%) | 2 (10.5%) |
| Manufacturing | 70 (97.2%) | 2 (2.8%) |
| Wholesale Trade | 1 (100.0%) | 0 (0.0%) |
| Retail Trade | 36 (47.4%) | 40 (52.6%) |
| Transportation & Warehousing | 6 (100.0%) | 0 (0.0%) |
| Utilities | 21 (75.0%) | 7 (25.0%) |
| Information | 6 (100.0%) | 0 (0.0%) |
| Finance & Insurance | 0 (0.0%) | 0 (0.0%) |
| Real Estate, Rental & Leasing | 12 (63.2%) | 7 (36.8%) |
| Professional & Scientific | 4 (17.4%) | 19 (82.6%) |
| Enterprise Management | 0 (0.0%) | 0 (0.0%) |
| Administrative & Support | 0 (0.0%) | 9 (100.0%) |
| Educational Services | 11 (13.3%) | 72 (86.8%) |
| Health Care & Social Assistance | 25 (41.7%) | 35 (58.3%) |
| Arts, Entertainment & Recreation | 0 (0.0%) | 0 (0.0%) |
| Accommodation & Food Services | 3 (18.8%) | 13 (81.2%) |
| Public Administration | 4 (66.7%) | 2 (33.3%) |
| Total | 222 (50.3%) | 219 (49.7%) |
Education in Silverhill
School Enrollment in Silverhill
The most common levels of schooling among the 124 students in Silverhill are college / undergraduate (43 | 34.7%), middle school (33 | 26.6%), and high school (19 | 15.3%).
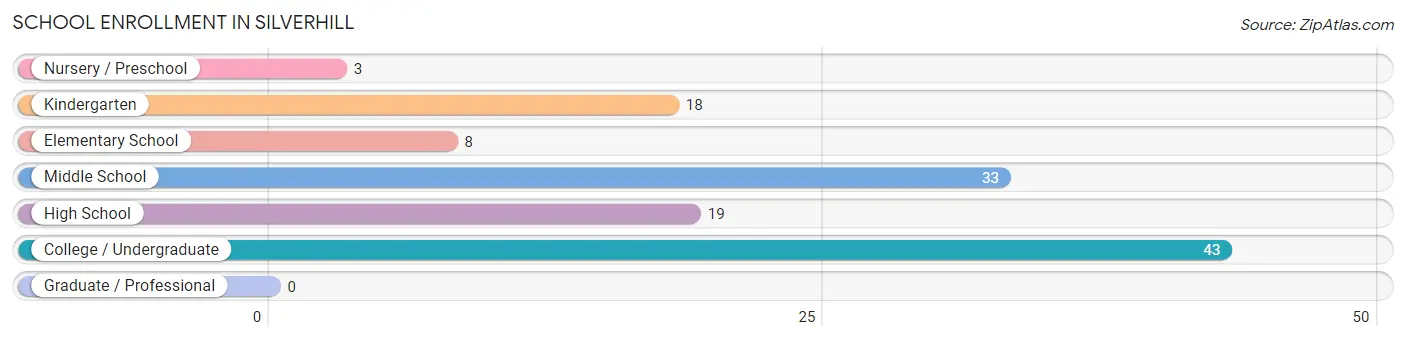
| School Level | # Students | % Students |
| Nursery / Preschool | 3 | 2.4% |
| Kindergarten | 18 | 14.5% |
| Elementary School | 8 | 6.5% |
| Middle School | 33 | 26.6% |
| High School | 19 | 15.3% |
| College / Undergraduate | 43 | 34.7% |
| Graduate / Professional | 0 | 0.0% |
| Total | 124 | 100.0% |
School Enrollment by Age by Funding Source in Silverhill
Out of a total of 124 students who are enrolled in schools in Silverhill, 32 (25.8%) attend a private institution, while the remaining 92 (74.2%) are enrolled in public schools. The age group of 3 to 4 year olds has the highest likelihood of being enrolled in private schools, with 3 (100.0% in the age bracket) enrolled. Conversely, the age group of 5 to 9 year old has the lowest likelihood of being enrolled in a private school, with 26 (100.0% in the age bracket) attending a public institution.
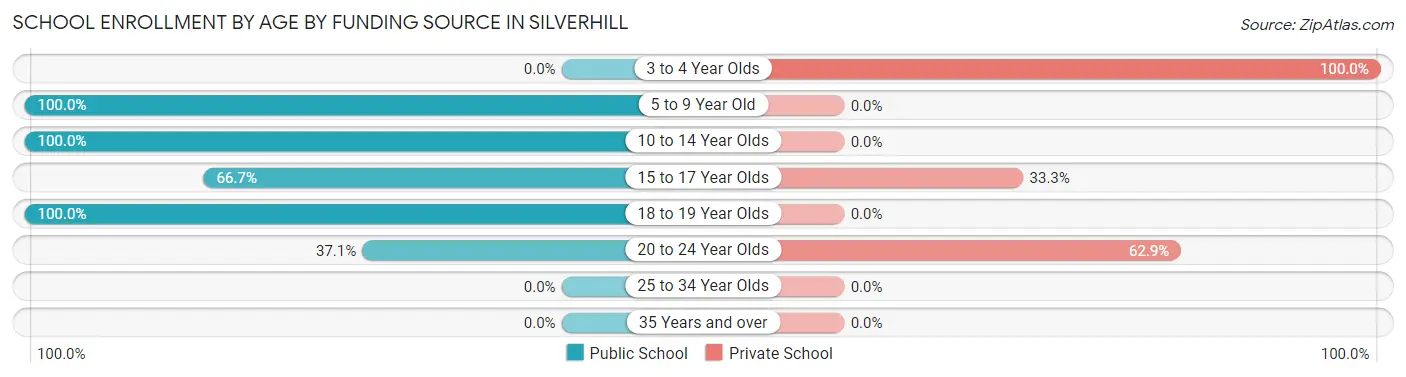
| Age Bracket | Public School | Private School |
| 3 to 4 Year Olds | 0 (0.0%) | 3 (100.0%) |
| 5 to 9 Year Old | 26 (100.0%) | 0 (0.0%) |
| 10 to 14 Year Olds | 34 (100.0%) | 0 (0.0%) |
| 15 to 17 Year Olds | 14 (66.7%) | 7 (33.3%) |
| 18 to 19 Year Olds | 5 (100.0%) | 0 (0.0%) |
| 20 to 24 Year Olds | 13 (37.1%) | 22 (62.9%) |
| 25 to 34 Year Olds | 0 (0.0%) | 0 (0.0%) |
| 35 Years and over | 0 (0.0%) | 0 (0.0%) |
| Total | 92 (74.2%) | 32 (25.8%) |
Educational Attainment by Field of Study in Silverhill
Business (42 | 23.2%), education (36 | 19.9%), physical & health sciences (24 | 13.3%), engineering (20 | 11.1%), and science & technology (17 | 9.4%) are the most common fields of study among 181 individuals in Silverhill who have obtained a bachelor's degree or higher.
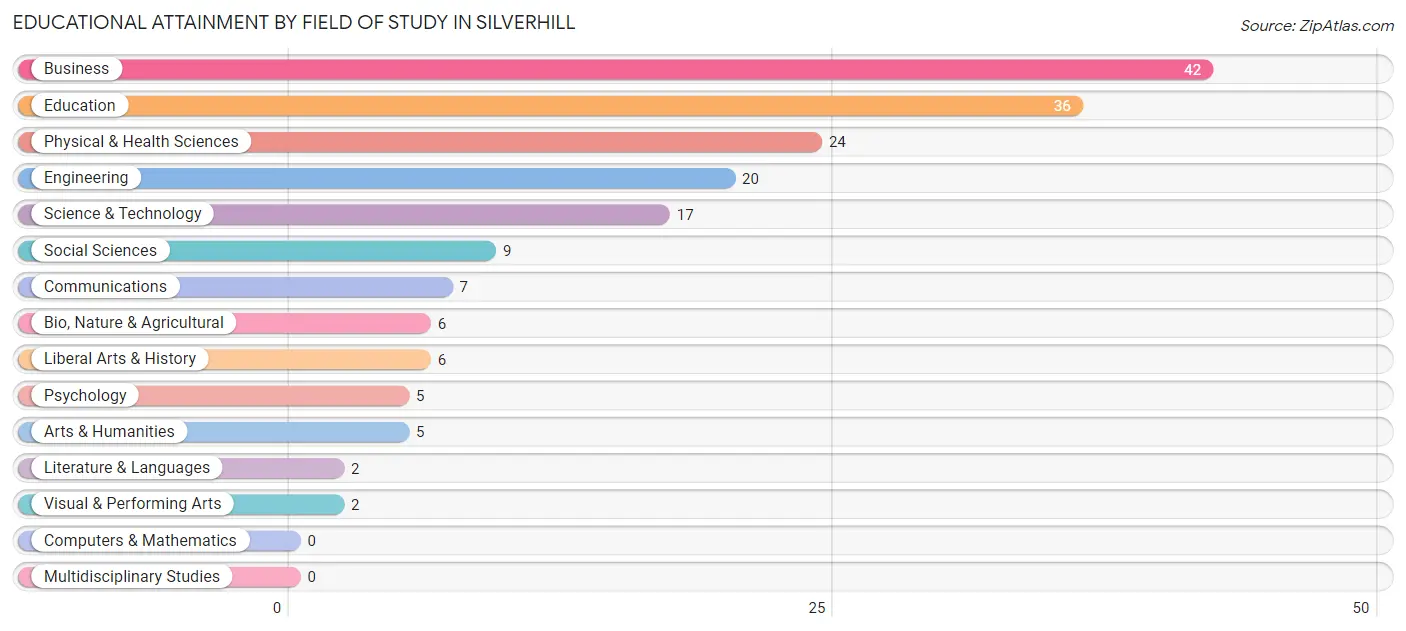
| Field of Study | # Graduates | % Graduates |
| Computers & Mathematics | 0 | 0.0% |
| Bio, Nature & Agricultural | 6 | 3.3% |
| Physical & Health Sciences | 24 | 13.3% |
| Psychology | 5 | 2.8% |
| Social Sciences | 9 | 5.0% |
| Engineering | 20 | 11.1% |
| Multidisciplinary Studies | 0 | 0.0% |
| Science & Technology | 17 | 9.4% |
| Business | 42 | 23.2% |
| Education | 36 | 19.9% |
| Literature & Languages | 2 | 1.1% |
| Liberal Arts & History | 6 | 3.3% |
| Visual & Performing Arts | 2 | 1.1% |
| Communications | 7 | 3.9% |
| Arts & Humanities | 5 | 2.8% |
| Total | 181 | 100.0% |
Transportation & Commute in Silverhill
Vehicle Availability by Sex in Silverhill
The most prevalent vehicle ownership categories in Silverhill are males with 2 vehicles (83, accounting for 38.4%) and females with 2 vehicles (79, making up 37.9%).
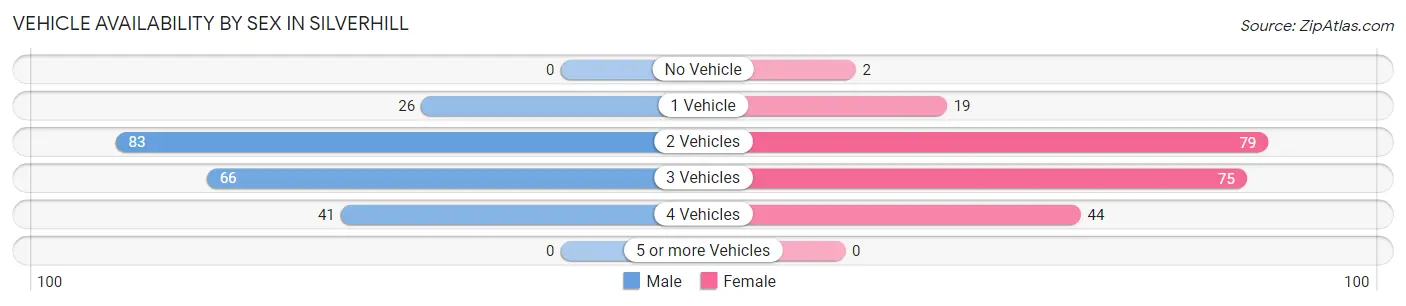
| Vehicles Available | Male | Female |
| No Vehicle | 0 (0.0%) | 2 (0.9%) |
| 1 Vehicle | 26 (12.0%) | 19 (8.7%) |
| 2 Vehicles | 83 (38.4%) | 79 (36.1%) |
| 3 Vehicles | 66 (30.6%) | 75 (34.3%) |
| 4 Vehicles | 41 (19.0%) | 44 (20.1%) |
| 5 or more Vehicles | 0 (0.0%) | 0 (0.0%) |
| Total | 216 (100.0%) | 219 (100.0%) |
Commute Time in Silverhill
The most frequently occuring commute durations in Silverhill are 15 to 19 minutes (95 commuters, 22.8%), 20 to 24 minutes (77 commuters, 18.5%), and 30 to 34 minutes (52 commuters, 12.5%).
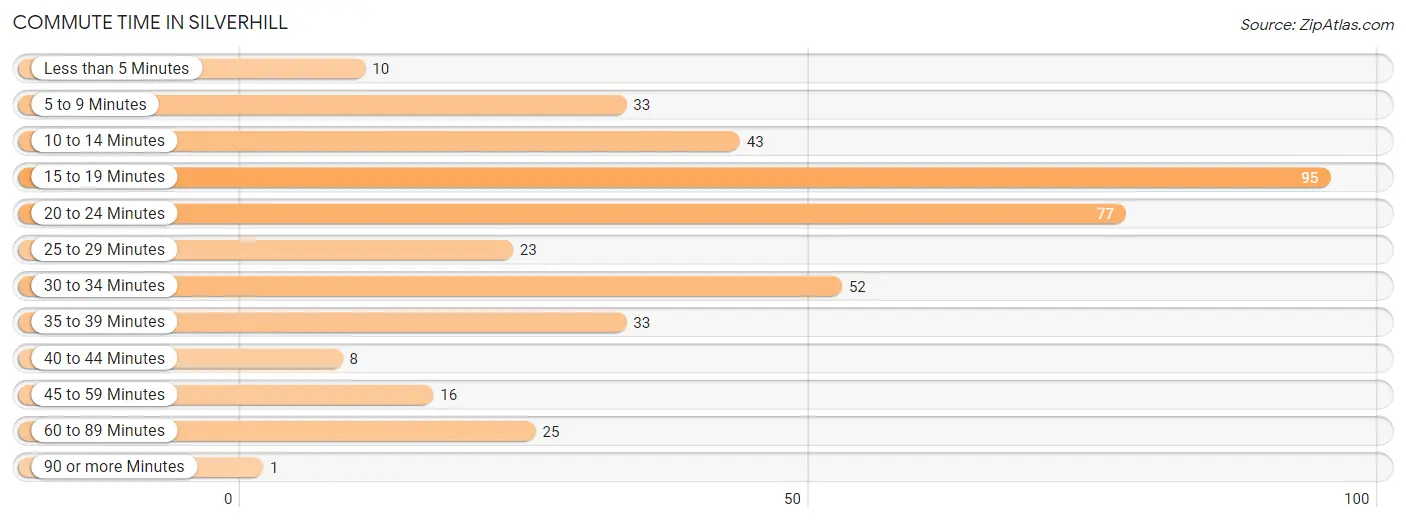
| Commute Time | # Commuters | % Commuters |
| Less than 5 Minutes | 10 | 2.4% |
| 5 to 9 Minutes | 33 | 7.9% |
| 10 to 14 Minutes | 43 | 10.3% |
| 15 to 19 Minutes | 95 | 22.8% |
| 20 to 24 Minutes | 77 | 18.5% |
| 25 to 29 Minutes | 23 | 5.5% |
| 30 to 34 Minutes | 52 | 12.5% |
| 35 to 39 Minutes | 33 | 7.9% |
| 40 to 44 Minutes | 8 | 1.9% |
| 45 to 59 Minutes | 16 | 3.8% |
| 60 to 89 Minutes | 25 | 6.0% |
| 90 or more Minutes | 1 | 0.2% |
Commute Time by Sex in Silverhill
The most common commute times in Silverhill are 30 to 34 minutes (52 commuters, 26.1%) for males and 15 to 19 minutes (78 commuters, 35.9%) for females.
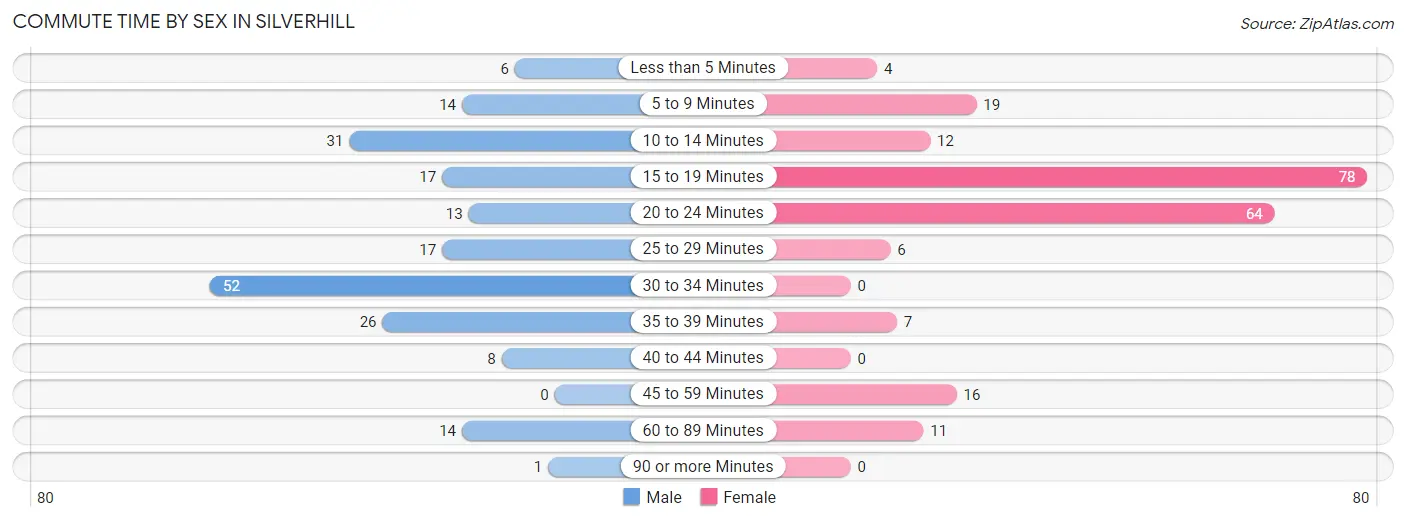
| Commute Time | Male | Female |
| Less than 5 Minutes | 6 (3.0%) | 4 (1.8%) |
| 5 to 9 Minutes | 14 (7.0%) | 19 (8.8%) |
| 10 to 14 Minutes | 31 (15.6%) | 12 (5.5%) |
| 15 to 19 Minutes | 17 (8.5%) | 78 (35.9%) |
| 20 to 24 Minutes | 13 (6.5%) | 64 (29.5%) |
| 25 to 29 Minutes | 17 (8.5%) | 6 (2.8%) |
| 30 to 34 Minutes | 52 (26.1%) | 0 (0.0%) |
| 35 to 39 Minutes | 26 (13.1%) | 7 (3.2%) |
| 40 to 44 Minutes | 8 (4.0%) | 0 (0.0%) |
| 45 to 59 Minutes | 0 (0.0%) | 16 (7.4%) |
| 60 to 89 Minutes | 14 (7.0%) | 11 (5.1%) |
| 90 or more Minutes | 1 (0.5%) | 0 (0.0%) |
Time of Departure to Work by Sex in Silverhill
The most frequent times of departure to work in Silverhill are 7:00 AM to 7:29 AM (58, 29.1%) for males and 7:00 AM to 7:29 AM (80, 36.9%) for females.
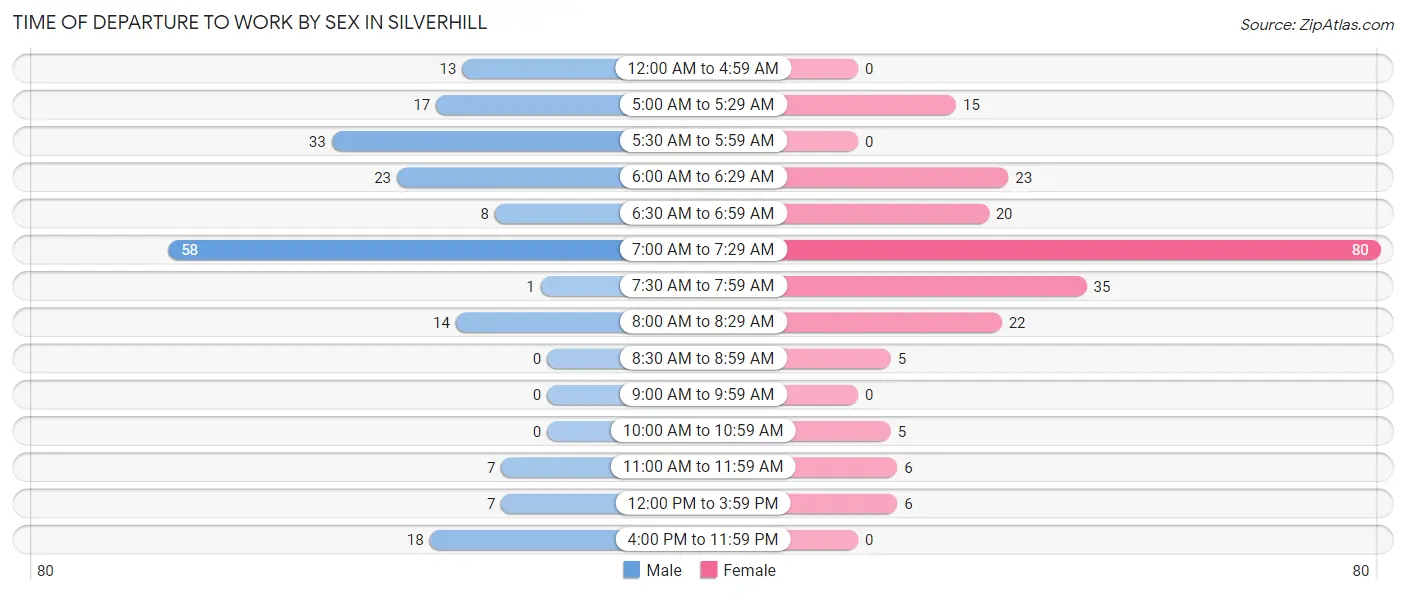
| Time of Departure | Male | Female |
| 12:00 AM to 4:59 AM | 13 (6.5%) | 0 (0.0%) |
| 5:00 AM to 5:29 AM | 17 (8.5%) | 15 (6.9%) |
| 5:30 AM to 5:59 AM | 33 (16.6%) | 0 (0.0%) |
| 6:00 AM to 6:29 AM | 23 (11.6%) | 23 (10.6%) |
| 6:30 AM to 6:59 AM | 8 (4.0%) | 20 (9.2%) |
| 7:00 AM to 7:29 AM | 58 (29.1%) | 80 (36.9%) |
| 7:30 AM to 7:59 AM | 1 (0.5%) | 35 (16.1%) |
| 8:00 AM to 8:29 AM | 14 (7.0%) | 22 (10.1%) |
| 8:30 AM to 8:59 AM | 0 (0.0%) | 5 (2.3%) |
| 9:00 AM to 9:59 AM | 0 (0.0%) | 0 (0.0%) |
| 10:00 AM to 10:59 AM | 0 (0.0%) | 5 (2.3%) |
| 11:00 AM to 11:59 AM | 7 (3.5%) | 6 (2.8%) |
| 12:00 PM to 3:59 PM | 7 (3.5%) | 6 (2.8%) |
| 4:00 PM to 11:59 PM | 18 (9.0%) | 0 (0.0%) |
| Total | 199 (100.0%) | 217 (100.0%) |
Housing Occupancy in Silverhill
Occupancy by Ownership in Silverhill
Of the total 329 dwellings in Silverhill, owner-occupied units account for 241 (73.3%), while renter-occupied units make up 88 (26.8%).
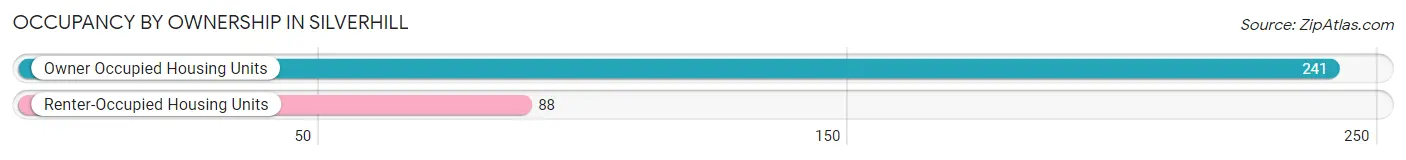
| Occupancy | # Housing Units | % Housing Units |
| Owner Occupied Housing Units | 241 | 73.3% |
| Renter-Occupied Housing Units | 88 | 26.8% |
| Total Occupied Housing Units | 329 | 100.0% |
Occupancy by Household Size in Silverhill
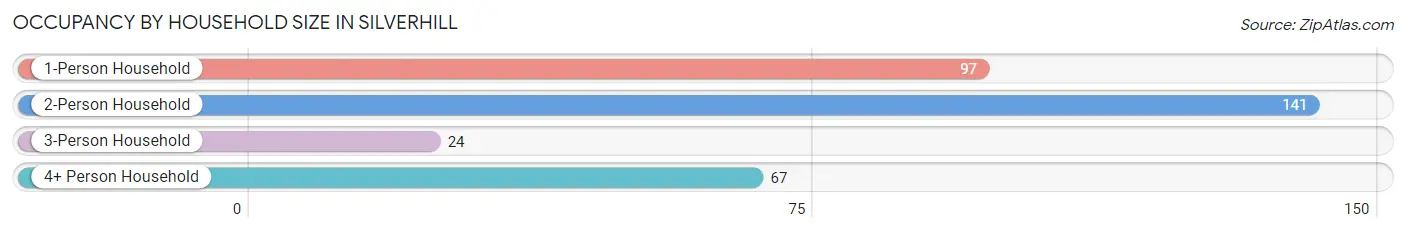
| Household Size | # Housing Units | % Housing Units |
| 1-Person Household | 97 | 29.5% |
| 2-Person Household | 141 | 42.9% |
| 3-Person Household | 24 | 7.3% |
| 4+ Person Household | 67 | 20.4% |
| Total Housing Units | 329 | 100.0% |
Occupancy by Ownership by Household Size in Silverhill
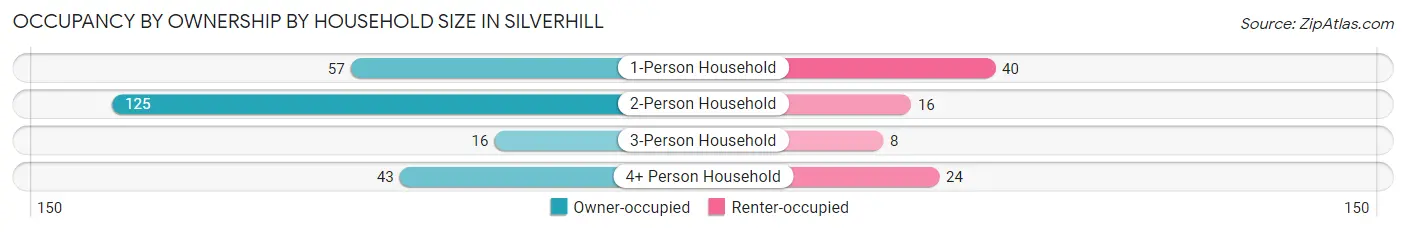
| Household Size | Owner-occupied | Renter-occupied |
| 1-Person Household | 57 (58.8%) | 40 (41.2%) |
| 2-Person Household | 125 (88.6%) | 16 (11.4%) |
| 3-Person Household | 16 (66.7%) | 8 (33.3%) |
| 4+ Person Household | 43 (64.2%) | 24 (35.8%) |
| Total Housing Units | 241 (73.3%) | 88 (26.8%) |
Occupancy by Educational Attainment in Silverhill
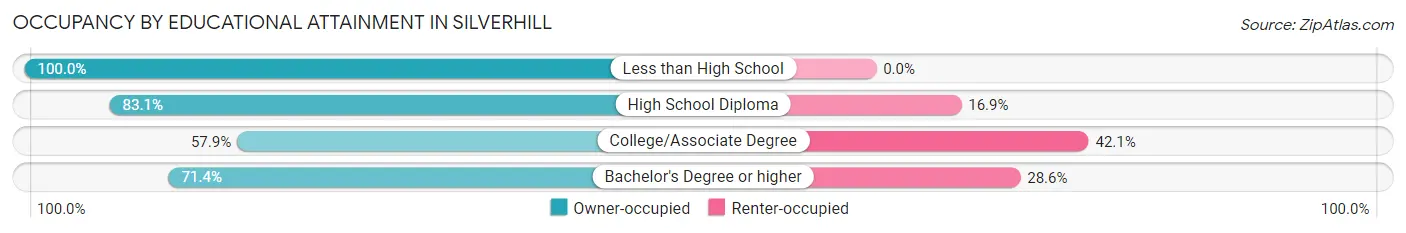
| Household Size | Owner-occupied | Renter-occupied |
| Less than High School | 32 (100.0%) | 0 (0.0%) |
| High School Diploma | 69 (83.1%) | 14 (16.9%) |
| College/Associate Degree | 55 (57.9%) | 40 (42.1%) |
| Bachelor's Degree or higher | 85 (71.4%) | 34 (28.6%) |
Occupancy by Age of Householder in Silverhill
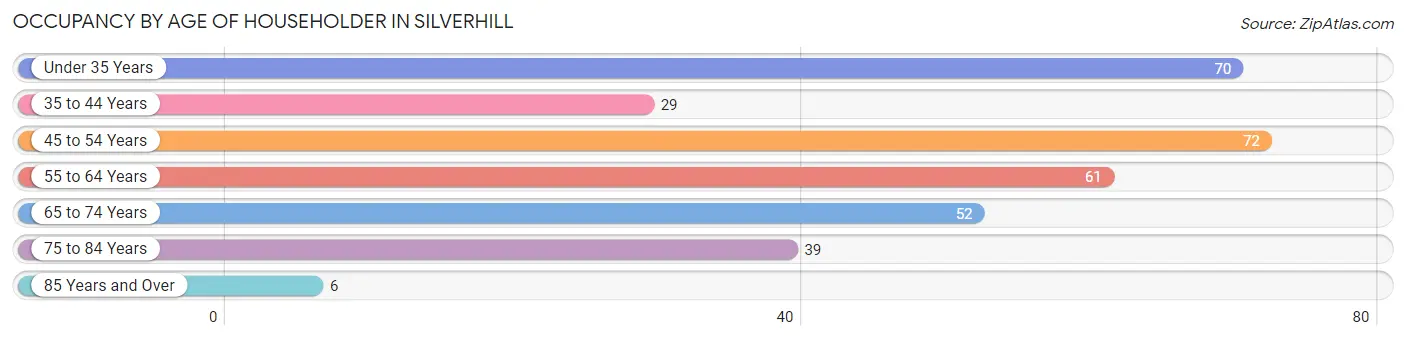
| Age Bracket | # Households | % Households |
| Under 35 Years | 70 | 21.3% |
| 35 to 44 Years | 29 | 8.8% |
| 45 to 54 Years | 72 | 21.9% |
| 55 to 64 Years | 61 | 18.5% |
| 65 to 74 Years | 52 | 15.8% |
| 75 to 84 Years | 39 | 11.8% |
| 85 Years and Over | 6 | 1.8% |
| Total | 329 | 100.0% |
Housing Finances in Silverhill
Median Income by Occupancy in Silverhill
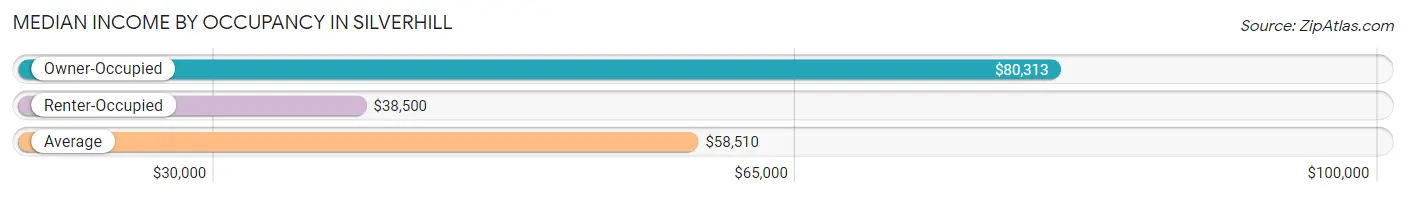
| Occupancy Type | # Households | Median Income |
| Owner-Occupied | 241 (73.3%) | $80,313 |
| Renter-Occupied | 88 (26.8%) | $38,500 |
| Average | 329 (100.0%) | $58,510 |
Occupancy by Householder Income Bracket in Silverhill
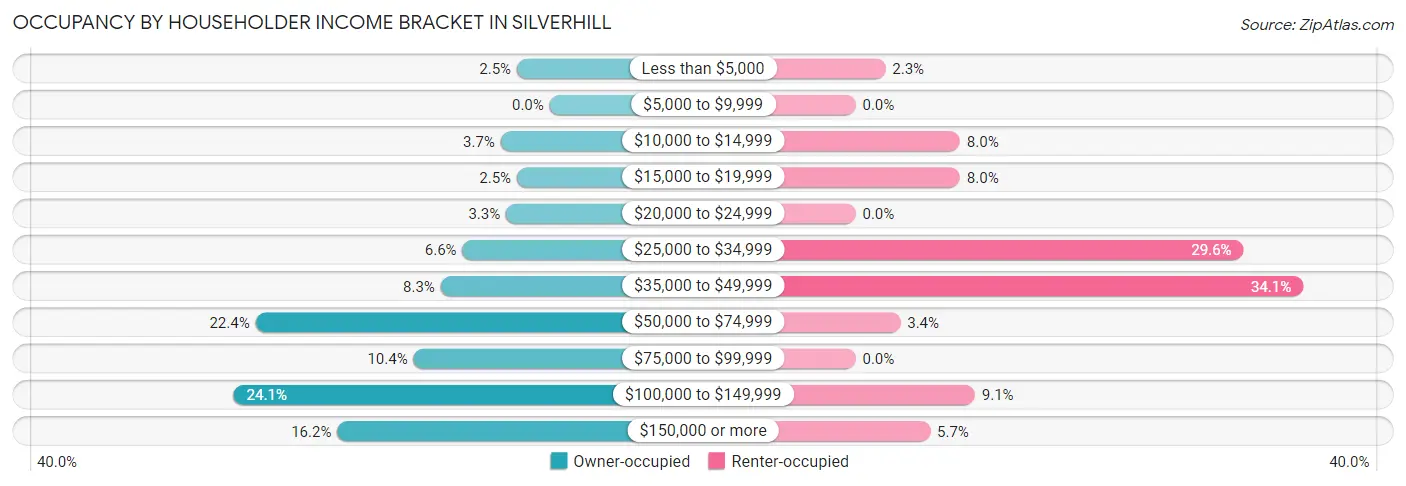
| Income Bracket | Owner-occupied | Renter-occupied |
| Less than $5,000 | 6 (2.5%) | 2 (2.3%) |
| $5,000 to $9,999 | 0 (0.0%) | 0 (0.0%) |
| $10,000 to $14,999 | 9 (3.7%) | 7 (8.0%) |
| $15,000 to $19,999 | 6 (2.5%) | 7 (8.0%) |
| $20,000 to $24,999 | 8 (3.3%) | 0 (0.0%) |
| $25,000 to $34,999 | 16 (6.6%) | 26 (29.5%) |
| $35,000 to $49,999 | 20 (8.3%) | 30 (34.1%) |
| $50,000 to $74,999 | 54 (22.4%) | 3 (3.4%) |
| $75,000 to $99,999 | 25 (10.4%) | 0 (0.0%) |
| $100,000 to $149,999 | 58 (24.1%) | 8 (9.1%) |
| $150,000 or more | 39 (16.2%) | 5 (5.7%) |
| Total | 241 (100.0%) | 88 (100.0%) |
Monthly Housing Cost Tiers in Silverhill
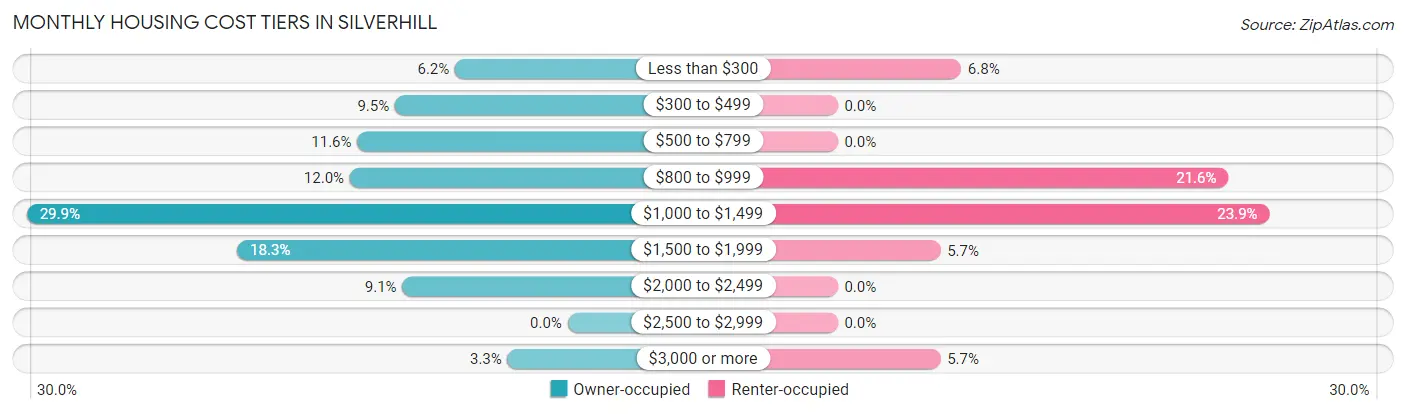
| Monthly Cost | Owner-occupied | Renter-occupied |
| Less than $300 | 15 (6.2%) | 6 (6.8%) |
| $300 to $499 | 23 (9.5%) | 0 (0.0%) |
| $500 to $799 | 28 (11.6%) | 0 (0.0%) |
| $800 to $999 | 29 (12.0%) | 19 (21.6%) |
| $1,000 to $1,499 | 72 (29.9%) | 21 (23.9%) |
| $1,500 to $1,999 | 44 (18.3%) | 5 (5.7%) |
| $2,000 to $2,499 | 22 (9.1%) | 0 (0.0%) |
| $2,500 to $2,999 | 0 (0.0%) | 0 (0.0%) |
| $3,000 or more | 8 (3.3%) | 5 (5.7%) |
| Total | 241 (100.0%) | 88 (100.0%) |
Physical Housing Characteristics in Silverhill
Housing Structures in Silverhill
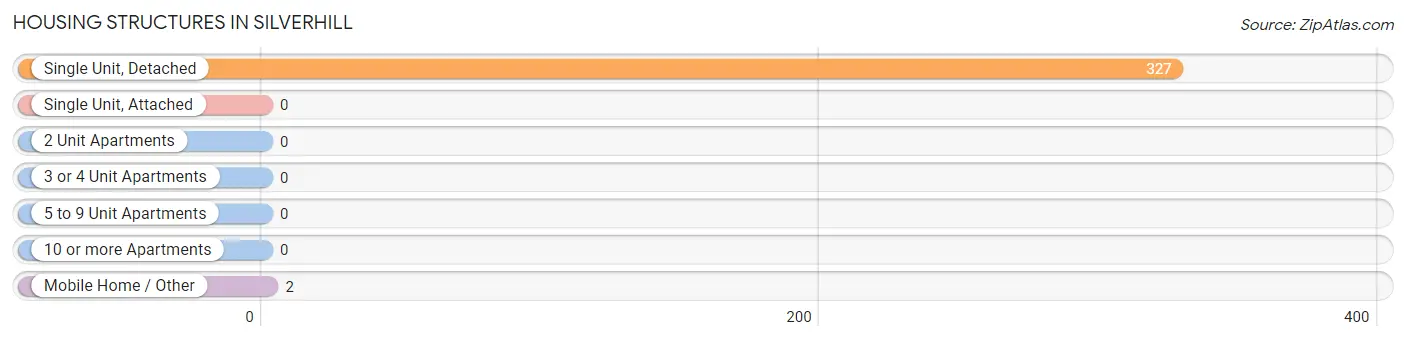
| Structure Type | # Housing Units | % Housing Units |
| Single Unit, Detached | 327 | 99.4% |
| Single Unit, Attached | 0 | 0.0% |
| 2 Unit Apartments | 0 | 0.0% |
| 3 or 4 Unit Apartments | 0 | 0.0% |
| 5 to 9 Unit Apartments | 0 | 0.0% |
| 10 or more Apartments | 0 | 0.0% |
| Mobile Home / Other | 2 | 0.6% |
| Total | 329 | 100.0% |
Housing Structures by Occupancy in Silverhill
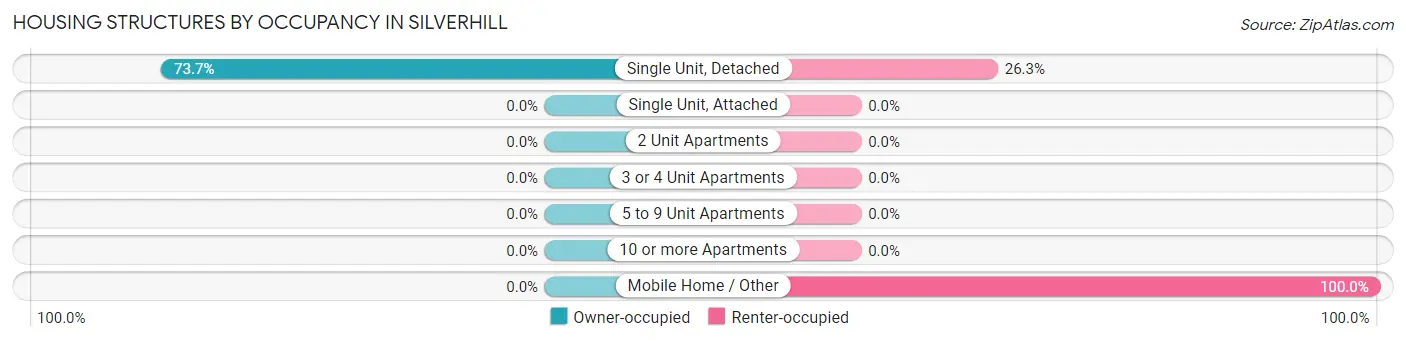
| Structure Type | Owner-occupied | Renter-occupied |
| Single Unit, Detached | 241 (73.7%) | 86 (26.3%) |
| Single Unit, Attached | 0 (0.0%) | 0 (0.0%) |
| 2 Unit Apartments | 0 (0.0%) | 0 (0.0%) |
| 3 or 4 Unit Apartments | 0 (0.0%) | 0 (0.0%) |
| 5 to 9 Unit Apartments | 0 (0.0%) | 0 (0.0%) |
| 10 or more Apartments | 0 (0.0%) | 0 (0.0%) |
| Mobile Home / Other | 0 (0.0%) | 2 (100.0%) |
| Total | 241 (73.3%) | 88 (26.8%) |
Housing Structures by Number of Rooms in Silverhill
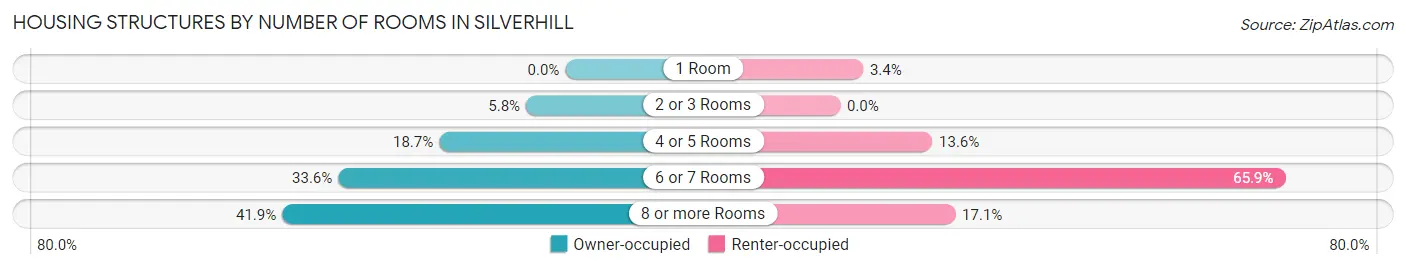
| Number of Rooms | Owner-occupied | Renter-occupied |
| 1 Room | 0 (0.0%) | 3 (3.4%) |
| 2 or 3 Rooms | 14 (5.8%) | 0 (0.0%) |
| 4 or 5 Rooms | 45 (18.7%) | 12 (13.6%) |
| 6 or 7 Rooms | 81 (33.6%) | 58 (65.9%) |
| 8 or more Rooms | 101 (41.9%) | 15 (17.1%) |
| Total | 241 (100.0%) | 88 (100.0%) |
Housing Structure by Heating Type in Silverhill
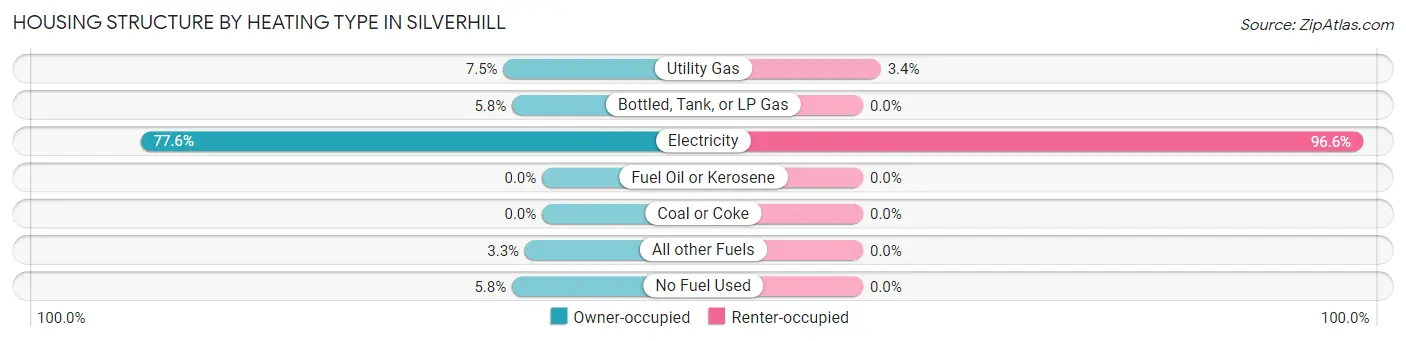
| Heating Type | Owner-occupied | Renter-occupied |
| Utility Gas | 18 (7.5%) | 3 (3.4%) |
| Bottled, Tank, or LP Gas | 14 (5.8%) | 0 (0.0%) |
| Electricity | 187 (77.6%) | 85 (96.6%) |
| Fuel Oil or Kerosene | 0 (0.0%) | 0 (0.0%) |
| Coal or Coke | 0 (0.0%) | 0 (0.0%) |
| All other Fuels | 8 (3.3%) | 0 (0.0%) |
| No Fuel Used | 14 (5.8%) | 0 (0.0%) |
| Total | 241 (100.0%) | 88 (100.0%) |
Household Vehicle Usage in Silverhill
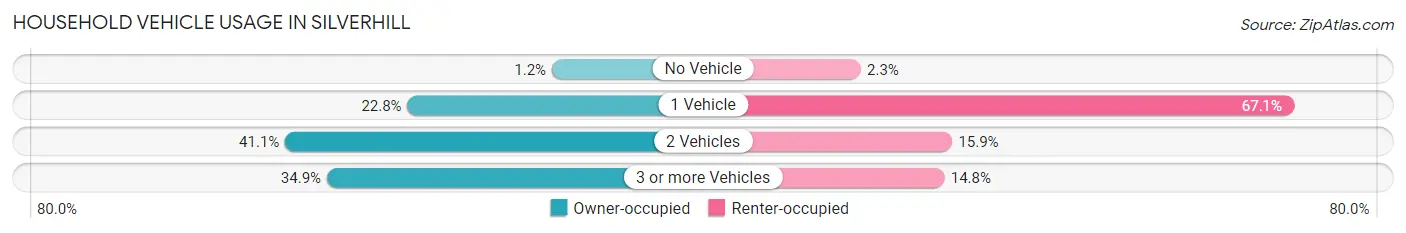
| Vehicles per Household | Owner-occupied | Renter-occupied |
| No Vehicle | 3 (1.2%) | 2 (2.3%) |
| 1 Vehicle | 55 (22.8%) | 59 (67.0%) |
| 2 Vehicles | 99 (41.1%) | 14 (15.9%) |
| 3 or more Vehicles | 84 (34.8%) | 13 (14.8%) |
| Total | 241 (100.0%) | 88 (100.0%) |
Real Estate & Mortgages in Silverhill
Real Estate and Mortgage Overview in Silverhill
| Characteristic | Without Mortgage | With Mortgage |
| Housing Units | 80 | 161 |
| Median Property Value | $319,400 | $233,600 |
| Median Household Income | - | - |
| Monthly Housing Costs | $567 | $8 |
| Real Estate Taxes | $745 | $13 |
Property Value by Mortgage Status in Silverhill
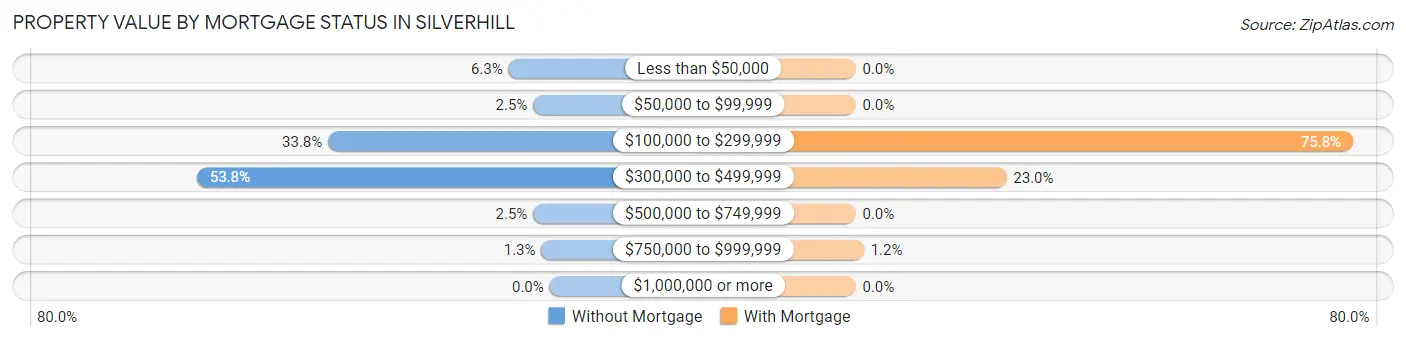
| Property Value | Without Mortgage | With Mortgage |
| Less than $50,000 | 5 (6.2%) | 0 (0.0%) |
| $50,000 to $99,999 | 2 (2.5%) | 0 (0.0%) |
| $100,000 to $299,999 | 27 (33.8%) | 122 (75.8%) |
| $300,000 to $499,999 | 43 (53.7%) | 37 (23.0%) |
| $500,000 to $749,999 | 2 (2.5%) | 0 (0.0%) |
| $750,000 to $999,999 | 1 (1.3%) | 2 (1.2%) |
| $1,000,000 or more | 0 (0.0%) | 0 (0.0%) |
| Total | 80 (100.0%) | 161 (100.0%) |
Household Income by Mortgage Status in Silverhill
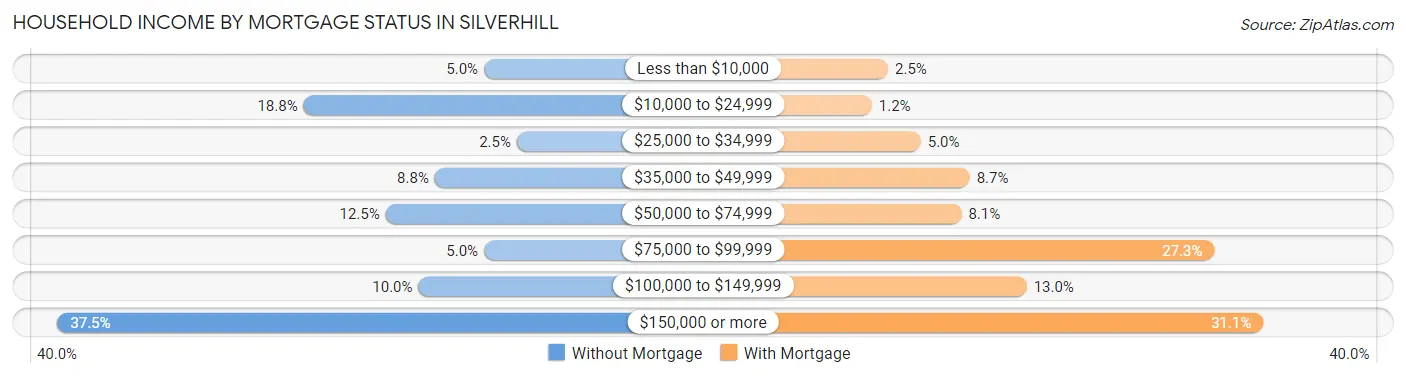
| Household Income | Without Mortgage | With Mortgage |
| Less than $10,000 | 4 (5.0%) | 4 (2.5%) |
| $10,000 to $24,999 | 15 (18.8%) | 2 (1.2%) |
| $25,000 to $34,999 | 2 (2.5%) | 8 (5.0%) |
| $35,000 to $49,999 | 7 (8.7%) | 14 (8.7%) |
| $50,000 to $74,999 | 10 (12.5%) | 13 (8.1%) |
| $75,000 to $99,999 | 4 (5.0%) | 44 (27.3%) |
| $100,000 to $149,999 | 8 (10.0%) | 21 (13.0%) |
| $150,000 or more | 30 (37.5%) | 50 (31.1%) |
| Total | 80 (100.0%) | 161 (100.0%) |
Property Value to Household Income Ratio in Silverhill
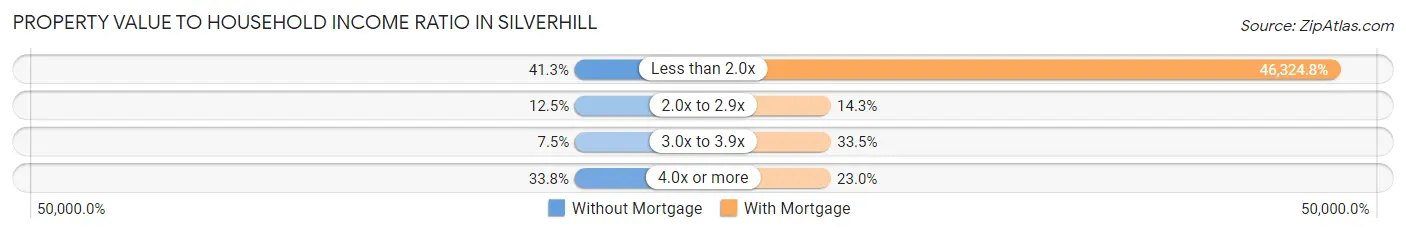
| Value-to-Income Ratio | Without Mortgage | With Mortgage |
| Less than 2.0x | 33 (41.2%) | 74,583 (46,324.8%) |
| 2.0x to 2.9x | 10 (12.5%) | 23 (14.3%) |
| 3.0x to 3.9x | 6 (7.5%) | 54 (33.5%) |
| 4.0x or more | 27 (33.8%) | 37 (23.0%) |
| Total | 80 (100.0%) | 161 (100.0%) |
Real Estate Taxes by Mortgage Status in Silverhill
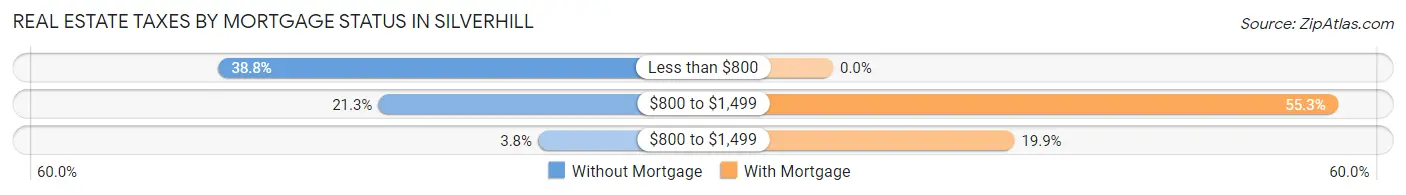
| Property Taxes | Without Mortgage | With Mortgage |
| Less than $800 | 31 (38.8%) | 0 (0.0%) |
| $800 to $1,499 | 17 (21.2%) | 89 (55.3%) |
| $800 to $1,499 | 3 (3.7%) | 32 (19.9%) |
| Total | 80 (100.0%) | 161 (100.0%) |
Health & Disability in Silverhill
Health Insurance Coverage by Age in Silverhill
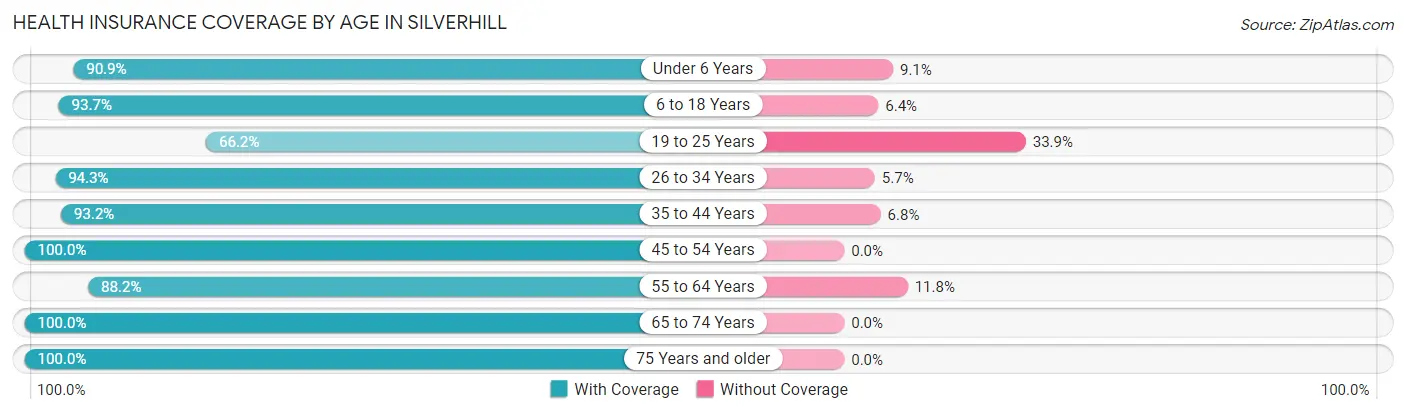
| Age Bracket | With Coverage | Without Coverage |
| Under 6 Years | 40 (90.9%) | 4 (9.1%) |
| 6 to 18 Years | 59 (93.6%) | 4 (6.4%) |
| 19 to 25 Years | 86 (66.1%) | 44 (33.9%) |
| 26 to 34 Years | 66 (94.3%) | 4 (5.7%) |
| 35 to 44 Years | 55 (93.2%) | 4 (6.8%) |
| 45 to 54 Years | 128 (100.0%) | 0 (0.0%) |
| 55 to 64 Years | 82 (88.2%) | 11 (11.8%) |
| 65 to 74 Years | 66 (100.0%) | 0 (0.0%) |
| 75 Years and older | 54 (100.0%) | 0 (0.0%) |
| Total | 636 (90.0%) | 71 (10.0%) |
Health Insurance Coverage by Citizenship Status in Silverhill
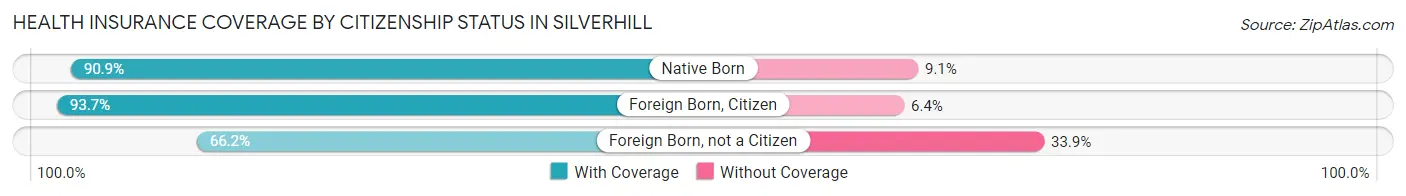
| Citizenship Status | With Coverage | Without Coverage |
| Native Born | 40 (90.9%) | 4 (9.1%) |
| Foreign Born, Citizen | 59 (93.6%) | 4 (6.4%) |
| Foreign Born, not a Citizen | 86 (66.1%) | 44 (33.9%) |
Health Insurance Coverage by Household Income in Silverhill
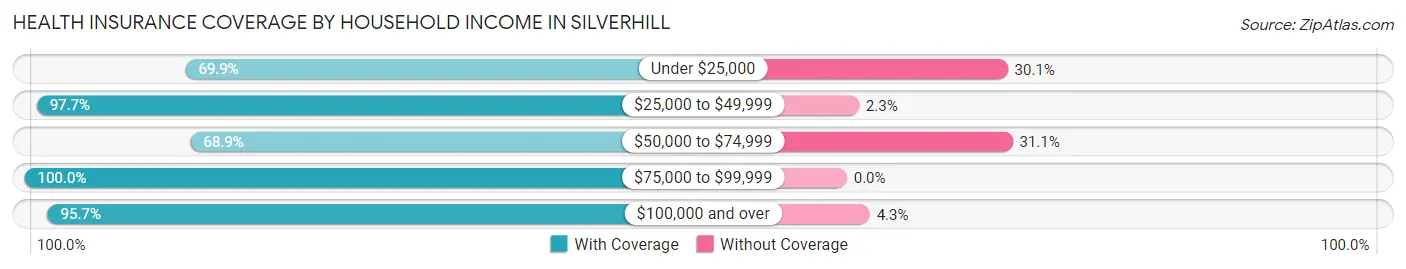
| Household Income | With Coverage | Without Coverage |
| Under $25,000 | 51 (69.9%) | 22 (30.1%) |
| $25,000 to $49,999 | 172 (97.7%) | 4 (2.3%) |
| $50,000 to $74,999 | 71 (68.9%) | 32 (31.1%) |
| $75,000 to $99,999 | 53 (100.0%) | 0 (0.0%) |
| $100,000 and over | 289 (95.7%) | 13 (4.3%) |
Public vs Private Health Insurance Coverage by Age in Silverhill
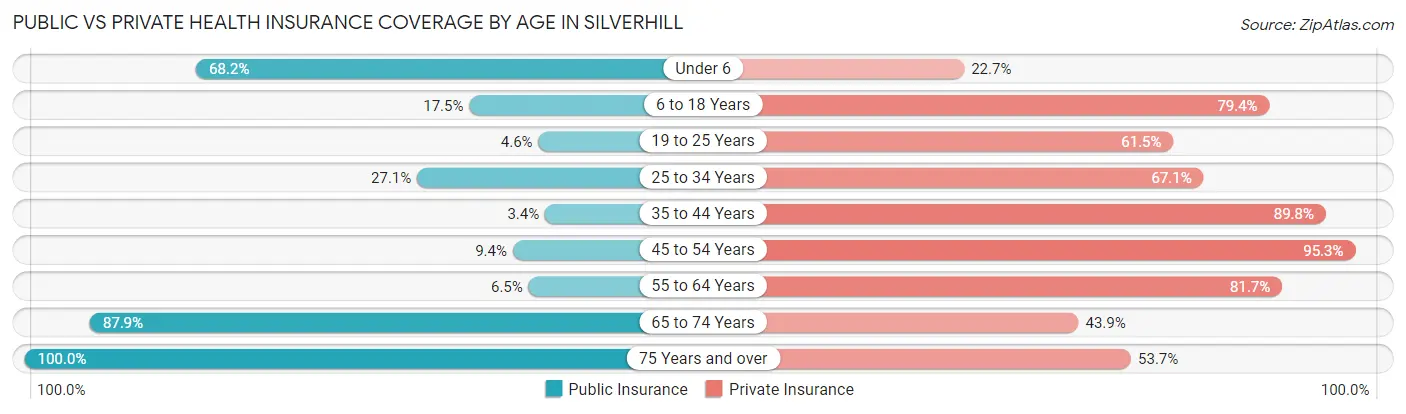
| Age Bracket | Public Insurance | Private Insurance |
| Under 6 | 30 (68.2%) | 10 (22.7%) |
| 6 to 18 Years | 11 (17.5%) | 50 (79.4%) |
| 19 to 25 Years | 6 (4.6%) | 80 (61.5%) |
| 25 to 34 Years | 19 (27.1%) | 47 (67.1%) |
| 35 to 44 Years | 2 (3.4%) | 53 (89.8%) |
| 45 to 54 Years | 12 (9.4%) | 122 (95.3%) |
| 55 to 64 Years | 6 (6.5%) | 76 (81.7%) |
| 65 to 74 Years | 58 (87.9%) | 29 (43.9%) |
| 75 Years and over | 54 (100.0%) | 29 (53.7%) |
| Total | 198 (28.0%) | 496 (70.2%) |
Disability Status by Sex by Age in Silverhill
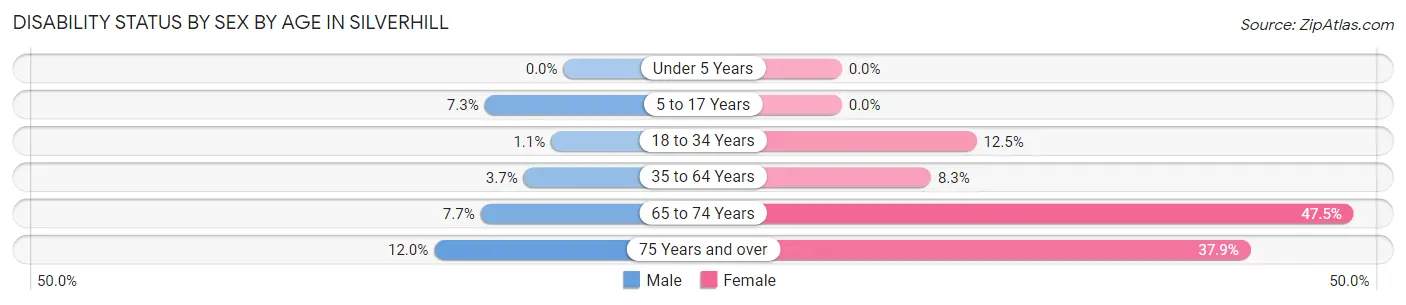
| Age Bracket | Male | Female |
| Under 5 Years | 0 (0.0%) | 0 (0.0%) |
| 5 to 17 Years | 3 (7.3%) | 0 (0.0%) |
| 18 to 34 Years | 1 (1.1%) | 14 (12.5%) |
| 35 to 64 Years | 5 (3.7%) | 12 (8.3%) |
| 65 to 74 Years | 2 (7.7%) | 19 (47.5%) |
| 75 Years and over | 3 (12.0%) | 11 (37.9%) |
Disability Class by Sex by Age in Silverhill
Disability Class: Hearing Difficulty
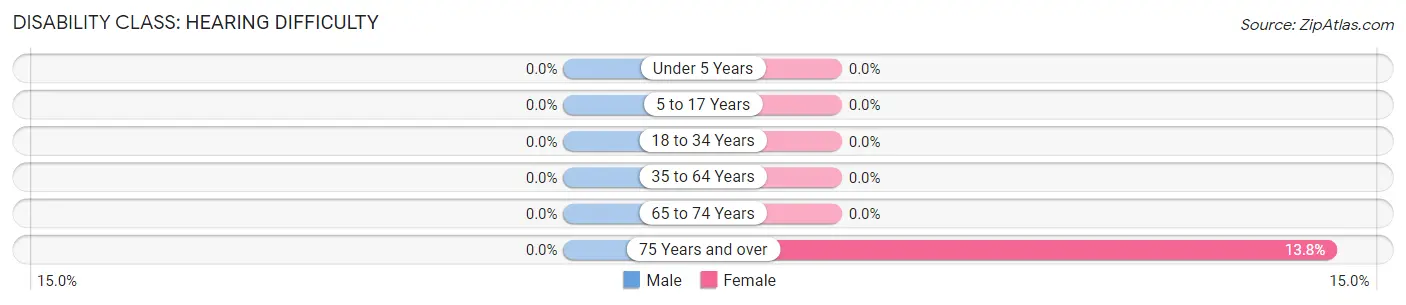
| Age Bracket | Male | Female |
| Under 5 Years | 0 (0.0%) | 0 (0.0%) |
| 5 to 17 Years | 0 (0.0%) | 0 (0.0%) |
| 18 to 34 Years | 0 (0.0%) | 0 (0.0%) |
| 35 to 64 Years | 0 (0.0%) | 0 (0.0%) |
| 65 to 74 Years | 0 (0.0%) | 0 (0.0%) |
| 75 Years and over | 0 (0.0%) | 4 (13.8%) |
Disability Class: Vision Difficulty
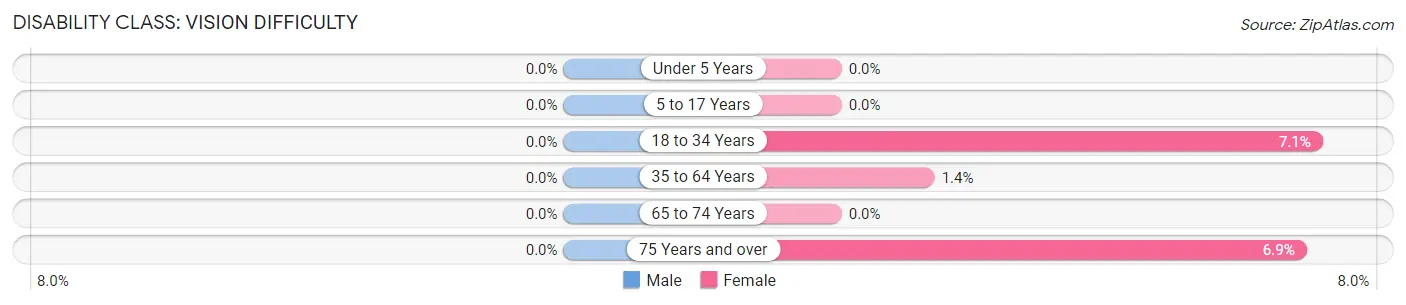
| Age Bracket | Male | Female |
| Under 5 Years | 0 (0.0%) | 0 (0.0%) |
| 5 to 17 Years | 0 (0.0%) | 0 (0.0%) |
| 18 to 34 Years | 0 (0.0%) | 8 (7.1%) |
| 35 to 64 Years | 0 (0.0%) | 2 (1.4%) |
| 65 to 74 Years | 0 (0.0%) | 0 (0.0%) |
| 75 Years and over | 0 (0.0%) | 2 (6.9%) |
Disability Class: Cognitive Difficulty
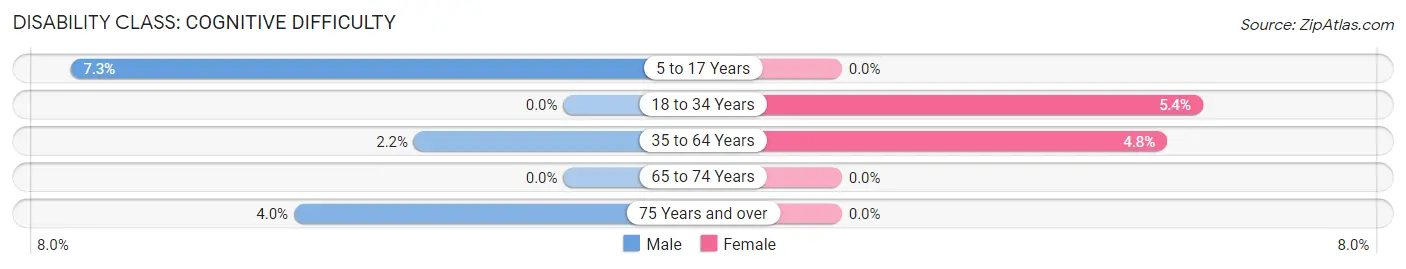
| Age Bracket | Male | Female |
| 5 to 17 Years | 3 (7.3%) | 0 (0.0%) |
| 18 to 34 Years | 0 (0.0%) | 6 (5.4%) |
| 35 to 64 Years | 3 (2.2%) | 7 (4.8%) |
| 65 to 74 Years | 0 (0.0%) | 0 (0.0%) |
| 75 Years and over | 1 (4.0%) | 0 (0.0%) |
Disability Class: Ambulatory Difficulty
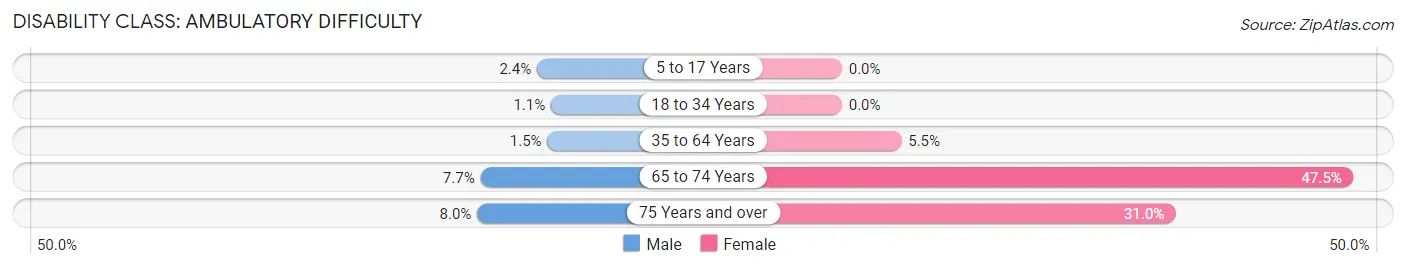
| Age Bracket | Male | Female |
| 5 to 17 Years | 1 (2.4%) | 0 (0.0%) |
| 18 to 34 Years | 1 (1.1%) | 0 (0.0%) |
| 35 to 64 Years | 2 (1.5%) | 8 (5.5%) |
| 65 to 74 Years | 2 (7.7%) | 19 (47.5%) |
| 75 Years and over | 2 (8.0%) | 9 (31.0%) |
Disability Class: Self-Care Difficulty
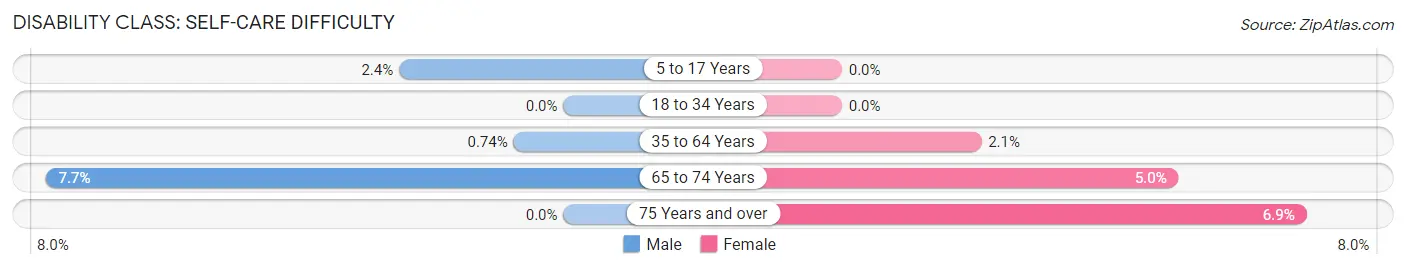
| Age Bracket | Male | Female |
| 5 to 17 Years | 1 (2.4%) | 0 (0.0%) |
| 18 to 34 Years | 0 (0.0%) | 0 (0.0%) |
| 35 to 64 Years | 1 (0.7%) | 3 (2.1%) |
| 65 to 74 Years | 2 (7.7%) | 2 (5.0%) |
| 75 Years and over | 0 (0.0%) | 2 (6.9%) |
Technology Access in Silverhill
Computing Device Access in Silverhill
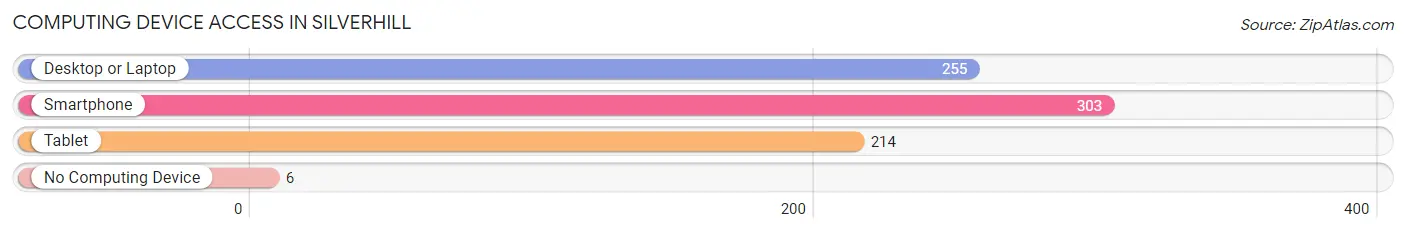
| Device Type | # Households | % Households |
| Desktop or Laptop | 255 | 77.5% |
| Smartphone | 303 | 92.1% |
| Tablet | 214 | 65.0% |
| No Computing Device | 6 | 1.8% |
| Total | 329 | 100.0% |
Internet Access in Silverhill
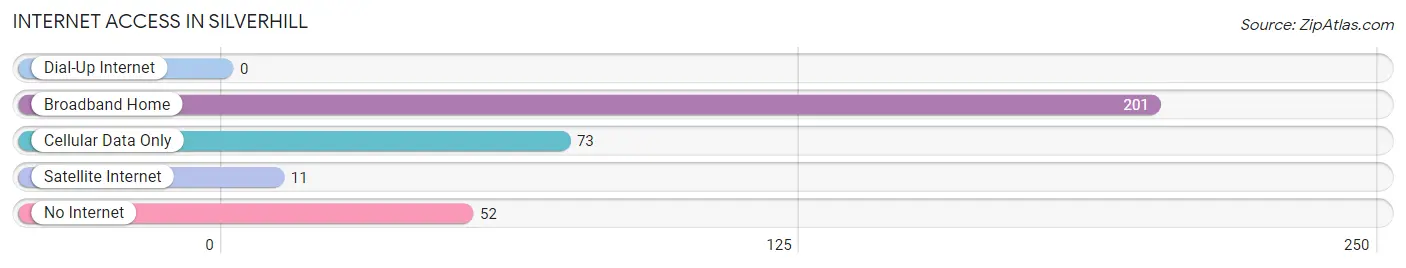
| Internet Type | # Households | % Households |
| Dial-Up Internet | 0 | 0.0% |
| Broadband Home | 201 | 61.1% |
| Cellular Data Only | 73 | 22.2% |
| Satellite Internet | 11 | 3.3% |
| No Internet | 52 | 15.8% |
| Total | 329 | 100.0% |
Silverhill Summary
History
Silverhill is a small town located in Baldwin County, Alabama. It is situated on the eastern shore of Mobile Bay, approximately 25 miles north of Mobile. The town was founded in 1887 by the Silverhill Land Company, which was formed by a group of investors from Mobile. The town was named after the silver mines that were discovered in the area.
The town was originally a farming community, but it soon became a popular tourist destination due to its proximity to the Gulf Coast. The town was also known for its mineral springs, which were believed to have healing properties.
In the early 1900s, Silverhill began to experience a period of growth and development. The town was incorporated in 1909 and the first mayor was elected in 1910. The town was home to several businesses, including a hotel, a bank, a sawmill, and a cotton gin.
The town continued to grow throughout the 20th century, and by the 1950s, it had become a popular destination for tourists. The town was home to several restaurants, hotels, and other businesses.
Geography
Silverhill is located in Baldwin County, Alabama, on the eastern shore of Mobile Bay. The town is situated on a small peninsula, surrounded by the bay on three sides. The town is located approximately 25 miles north of Mobile and is bordered by the towns of Bay Minette, Robertsdale, and Foley.
The town is located at an elevation of approximately 30 feet above sea level. The climate in Silverhill is humid subtropical, with hot, humid summers and mild winters. The average annual temperature is around 70 degrees Fahrenheit.
Economy
The economy of Silverhill is largely based on tourism. The town is home to several restaurants, hotels, and other businesses that cater to tourists. The town is also home to several marinas, which provide access to the bay for fishing and other recreational activities.
The town is also home to several manufacturing and industrial businesses, including a paper mill and a lumber mill. The town is also home to several retail stores, including a grocery store, a hardware store, and a pharmacy.
Demographics
As of the 2010 census, the population of Silverhill was 1,845. The racial makeup of the town was 94.3% White, 2.2% African American, 0.3% Native American, 0.7% Asian, 0.1% Pacific Islander, 0.7% from other races, and 1.7% from two or more races. Hispanic or Latino of any race were 2.2% of the population.
The median household income in Silverhill was $37,917, and the median family income was $45,625. The per capita income for the town was $19,945. About 11.2% of families and 14.2% of the population were below the poverty line, including 18.2% of those under age 18 and 8.3% of those age 65 or over.
Common Questions
What is Per Capita Income in Silverhill?
Per Capita income in Silverhill is $43,859.
What is the Median Family Income in Silverhill?
Median Family Income in Silverhill is $93,482.
What is the Median Household income in Silverhill?
Median Household Income in Silverhill is $58,510.
What is Income or Wage Gap in Silverhill?
Income or Wage Gap in Silverhill is 52.4%.
Women in Silverhill earn 47.6 cents for every dollar earned by a man.
What is Inequality or Gini Index in Silverhill?
Inequality or Gini Index in Silverhill is 0.50.
What is the Total Population of Silverhill?
Total Population of Silverhill is 711.
What is the Total Male Population of Silverhill?
Total Male Population of Silverhill is 337.
What is the Total Female Population of Silverhill?
Total Female Population of Silverhill is 374.
What is the Ratio of Males per 100 Females in Silverhill?
There are 90.11 Males per 100 Females in Silverhill.
What is the Ratio of Females per 100 Males in Silverhill?
There are 110.98 Females per 100 Males in Silverhill.
What is the Median Population Age in Silverhill?
Median Population Age in Silverhill is 43.0 Years.
What is the Average Family Size in Silverhill
Average Family Size in Silverhill is 2.5 People.
What is the Average Household Size in Silverhill
Average Household Size in Silverhill is 2.1 People.
How Large is the Labor Force in Silverhill?
There are 443 People in the Labor Forcein in Silverhill.
What is the Percentage of People in the Labor Force in Silverhill?
71.6% of People are in the Labor Force in Silverhill.
What is the Unemployment Rate in Silverhill?
Unemployment Rate in Silverhill is 0.5%.