Double Springs, AL Map & Demographics
Double Springs Map
Double Springs Overview
$21,489
PER CAPITA INCOME
$39,000
AVG FAMILY INCOME
$31,827
AVG HOUSEHOLD INCOME
17.9%
WAGE / INCOME GAP [ % ]
82.1¢/ $1
WAGE / INCOME GAP [ $ ]
$14,410
FAMILY INCOME DEFICIT
0.47
INEQUALITY / GINI INDEX
1,361
TOTAL POPULATION
657
MALE POPULATION
704
FEMALE POPULATION
93.32
MALES / 100 FEMALES
107.15
FEMALES / 100 MALES
36.8
MEDIAN AGE
2.5
AVG FAMILY SIZE
2.3
AVG HOUSEHOLD SIZE
535
LABOR FORCE [ PEOPLE ]
49.3%
PERCENT IN LABOR FORCE
11.6%
UNEMPLOYMENT RATE
Double Springs Zip Codes
Income in Double Springs
Income Overview in Double Springs
Per Capita Income in Double Springs is $21,489, while median incomes of families and households are $39,000 and $31,827 respectively.
| Characteristic | Number | Measure |
| Per Capita Income | 1,361 | $21,489 |
| Median Family Income | 368 | $39,000 |
| Mean Family Income | 368 | $57,099 |
| Median Household Income | 503 | $31,827 |
| Mean Household Income | 503 | $52,907 |
| Income Deficit | 368 | $14,410 |
| Wage / Income Gap (%) | 1,361 | 17.85% |
| Wage / Income Gap ($) | 1,361 | 82.15¢ per $1 |
| Gini / Inequality Index | 1,361 | 0.47 |
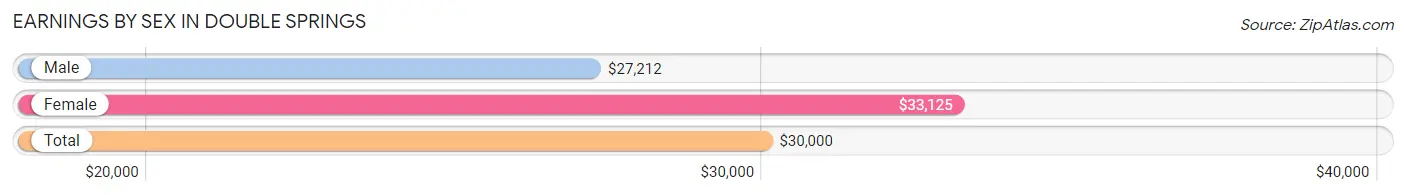
Earnings by Sex in Double Springs
Average Earnings in Double Springs are $30,000, $27,212 for men and $33,125 for women, a difference of 17.8%.
| Sex | Number | Average Earnings |
| Male | 324 (57.2%) | $27,212 |
| Female | 242 (42.8%) | $33,125 |
| Total | 566 (100.0%) | $30,000 |
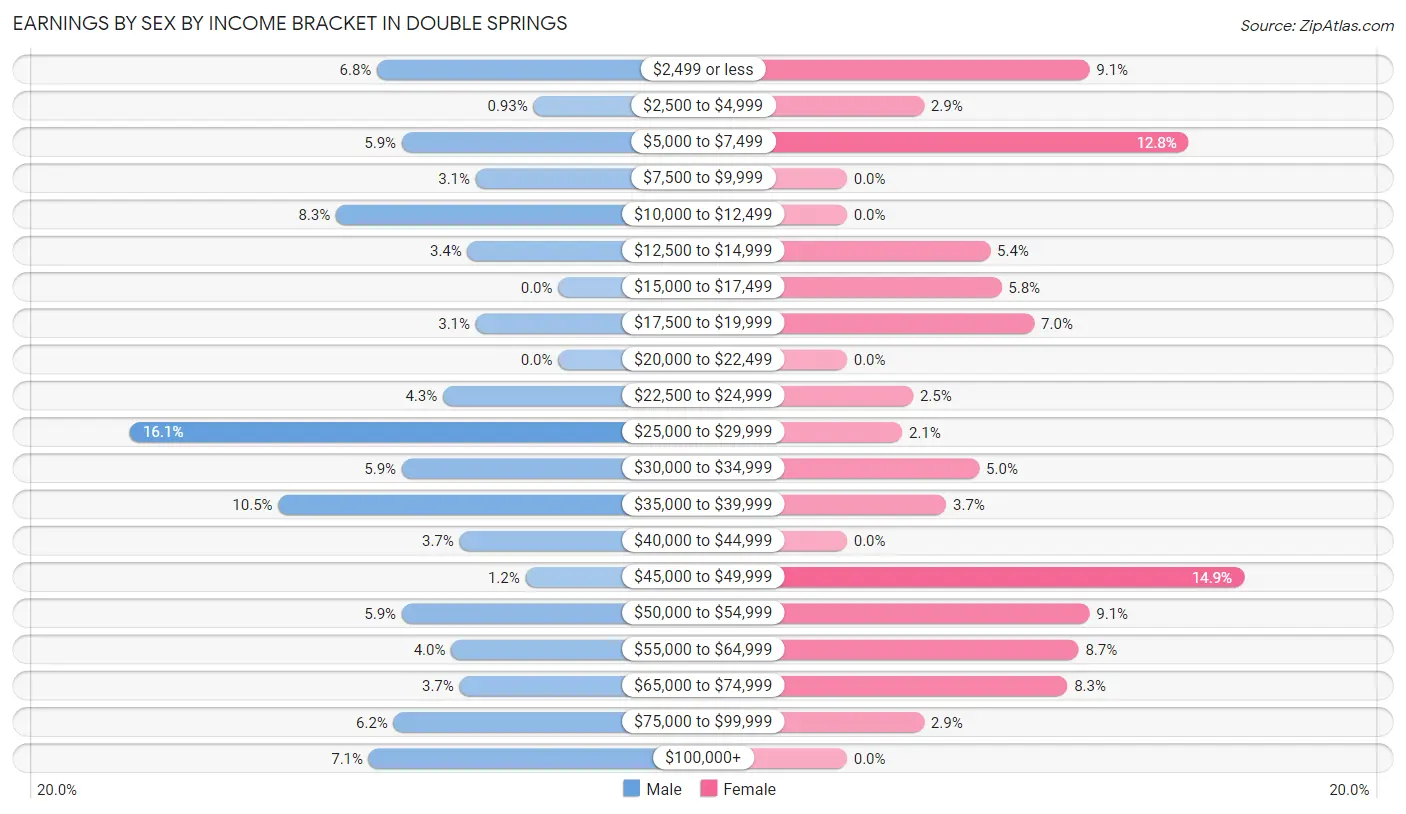
Earnings by Sex by Income Bracket in Double Springs
The most common earnings brackets in Double Springs are $25,000 to $29,999 for men (52 | 16.1%) and $45,000 to $49,999 for women (36 | 14.9%).
| Income | Male | Female |
| $2,499 or less | 22 (6.8%) | 22 (9.1%) |
| $2,500 to $4,999 | 3 (0.9%) | 7 (2.9%) |
| $5,000 to $7,499 | 19 (5.9%) | 31 (12.8%) |
| $7,500 to $9,999 | 10 (3.1%) | 0 (0.0%) |
| $10,000 to $12,499 | 27 (8.3%) | 0 (0.0%) |
| $12,500 to $14,999 | 11 (3.4%) | 13 (5.4%) |
| $15,000 to $17,499 | 0 (0.0%) | 14 (5.8%) |
| $17,500 to $19,999 | 10 (3.1%) | 17 (7.0%) |
| $20,000 to $22,499 | 0 (0.0%) | 0 (0.0%) |
| $22,500 to $24,999 | 14 (4.3%) | 6 (2.5%) |
| $25,000 to $29,999 | 52 (16.1%) | 5 (2.1%) |
| $30,000 to $34,999 | 19 (5.9%) | 12 (5.0%) |
| $35,000 to $39,999 | 34 (10.5%) | 9 (3.7%) |
| $40,000 to $44,999 | 12 (3.7%) | 0 (0.0%) |
| $45,000 to $49,999 | 4 (1.2%) | 36 (14.9%) |
| $50,000 to $54,999 | 19 (5.9%) | 22 (9.1%) |
| $55,000 to $64,999 | 13 (4.0%) | 21 (8.7%) |
| $65,000 to $74,999 | 12 (3.7%) | 20 (8.3%) |
| $75,000 to $99,999 | 20 (6.2%) | 7 (2.9%) |
| $100,000+ | 23 (7.1%) | 0 (0.0%) |
| Total | 324 (100.0%) | 242 (100.0%) |
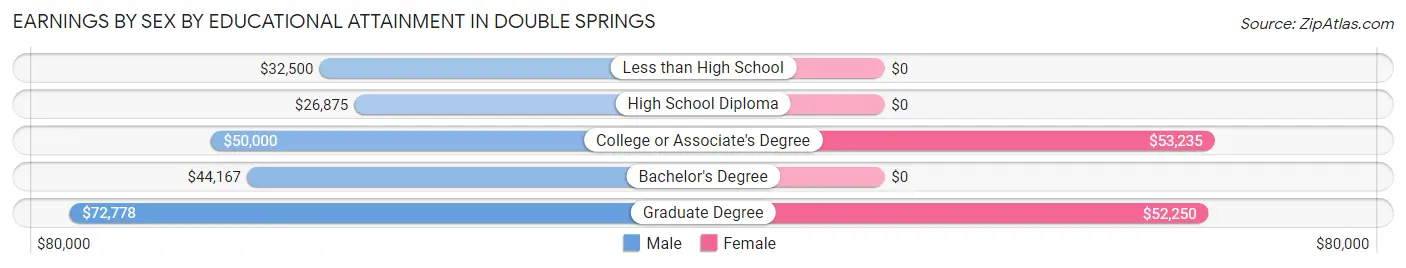
Earnings by Sex by Educational Attainment in Double Springs
Average earnings in Double Springs are $35,294 for men and $45,045 for women, a difference of 21.6%. Men with an educational attainment of graduate degree enjoy the highest average annual earnings of $72,778, while those with high school diploma education earn the least with $26,875. Women with an educational attainment of college or associate's degree earn the most with the average annual earnings of $53,235, while those with graduate degree education have the smallest earnings of $52,250.
| Educational Attainment | Male Income | Female Income |
| Less than High School | $32,500 | $0 |
| High School Diploma | $26,875 | $0 |
| College or Associate's Degree | $50,000 | $53,235 |
| Bachelor's Degree | $44,167 | $0 |
| Graduate Degree | $72,778 | $52,250 |
| Total | $35,294 | $45,045 |
Family Income in Double Springs
Family Income Brackets in Double Springs
According to the Double Springs family income data, there are 73 families falling into the $25,000 to $34,999 income range, which is the most common income bracket and makes up 19.8% of all families. Conversely, the $15,000 to $24,999 income bracket is the least frequent group with only 3 families (0.8%) belonging to this category.
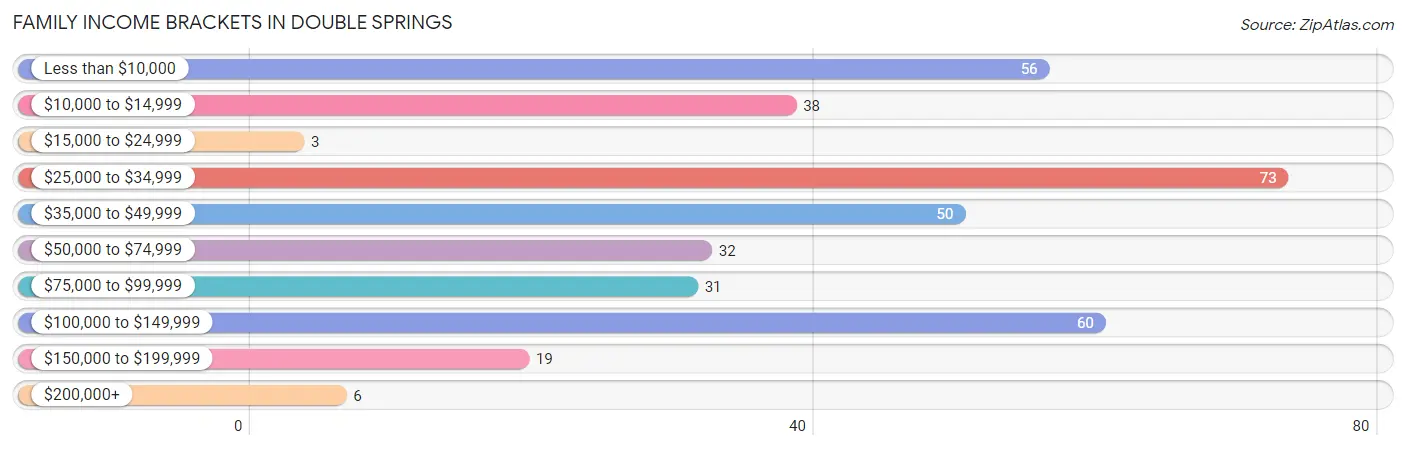
| Income Bracket | # Families | % Families |
| Less than $10,000 | 56 | 15.2% |
| $10,000 to $14,999 | 38 | 10.3% |
| $15,000 to $24,999 | 3 | 0.8% |
| $25,000 to $34,999 | 73 | 19.8% |
| $35,000 to $49,999 | 50 | 13.6% |
| $50,000 to $74,999 | 32 | 8.7% |
| $75,000 to $99,999 | 31 | 8.4% |
| $100,000 to $149,999 | 60 | 16.3% |
| $150,000 to $199,999 | 19 | 5.2% |
| $200,000+ | 6 | 1.6% |
Family Income by Famaliy Size in Double Springs
4-person families (40 | 10.9%) account for the highest median family income in Double Springs with $147,969 per family, while 4-person families (40 | 10.9%) have the highest median income of $36,992 per family member.
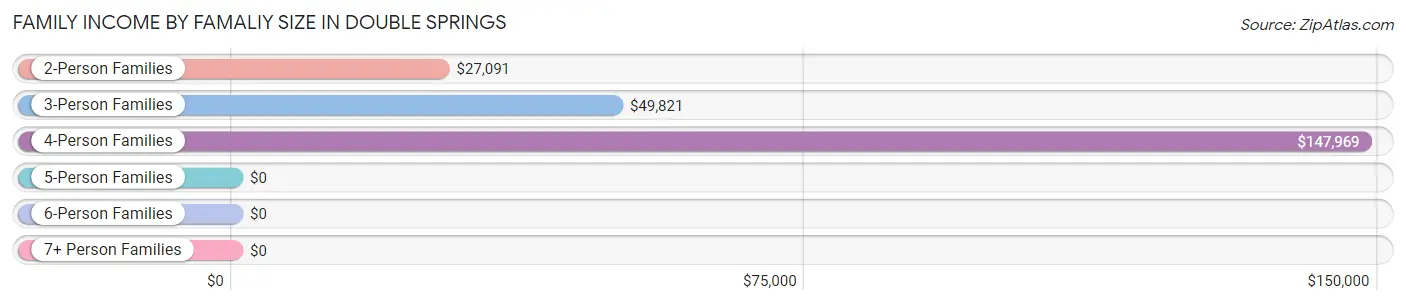
| Income Bracket | # Families | Median Income |
| 2-Person Families | 242 (65.8%) | $27,091 |
| 3-Person Families | 78 (21.2%) | $49,821 |
| 4-Person Families | 40 (10.9%) | $147,969 |
| 5-Person Families | 4 (1.1%) | $0 |
| 6-Person Families | 0 (0.0%) | $0 |
| 7+ Person Families | 4 (1.1%) | $0 |
| Total | 368 (100.0%) | $39,000 |
Family Income by Number of Earners in Double Springs
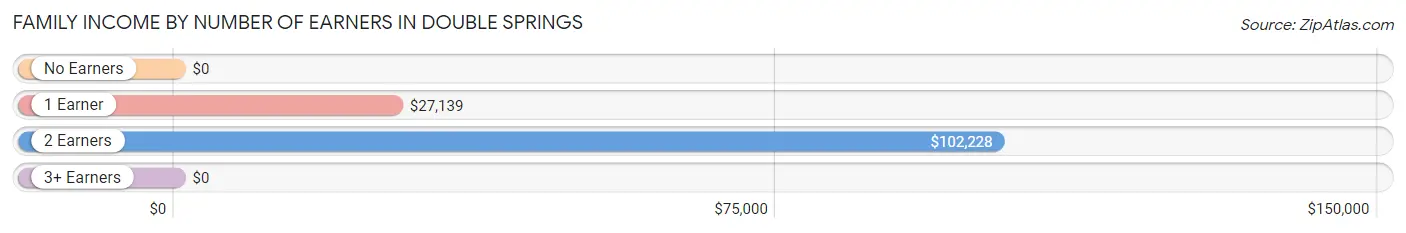
| Number of Earners | # Families | Median Income |
| No Earners | 118 (32.1%) | $0 |
| 1 Earner | 131 (35.6%) | $27,139 |
| 2 Earners | 93 (25.3%) | $102,228 |
| 3+ Earners | 26 (7.1%) | $0 |
| Total | 368 (100.0%) | $39,000 |
Household Income in Double Springs
Household Income Brackets in Double Springs
With 113 households falling in the category, the $10,000 to $14,999 income range is the most frequent in Double Springs, accounting for 22.5% of all households. In contrast, only 6 households (1.2%) fall into the $200,000+ income bracket, making it the least populous group.
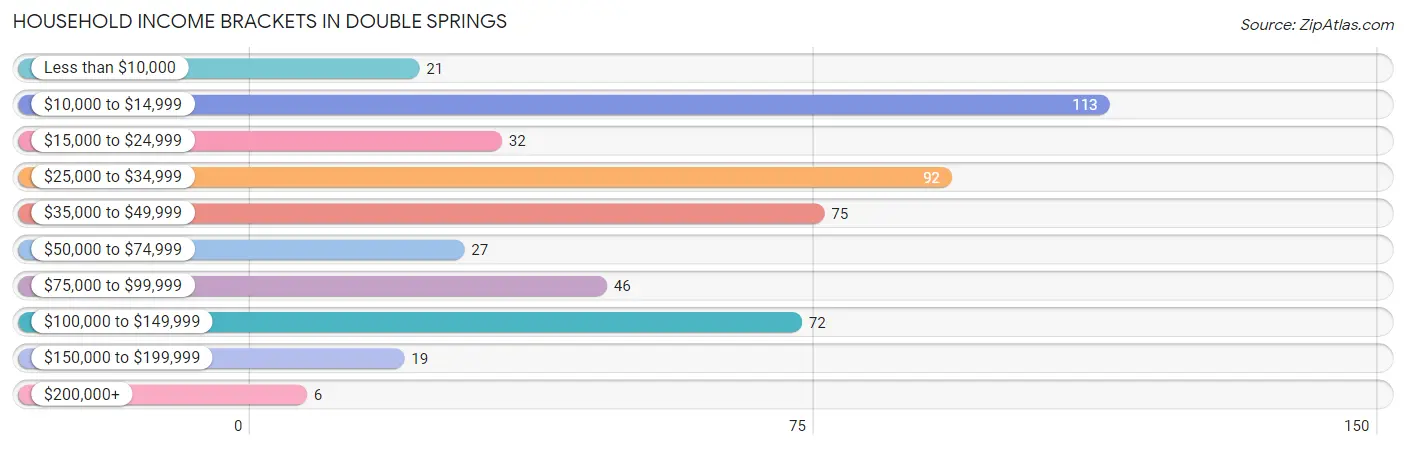
| Income Bracket | # Households | % Households |
| Less than $10,000 | 21 | 4.2% |
| $10,000 to $14,999 | 113 | 22.5% |
| $15,000 to $24,999 | 32 | 6.4% |
| $25,000 to $34,999 | 92 | 18.3% |
| $35,000 to $49,999 | 75 | 14.9% |
| $50,000 to $74,999 | 27 | 5.4% |
| $75,000 to $99,999 | 46 | 9.1% |
| $100,000 to $149,999 | 72 | 14.3% |
| $150,000 to $199,999 | 19 | 3.8% |
| $200,000+ | 6 | 1.2% |
Household Income by Householder Age in Double Springs
The median household income in Double Springs is $31,827, with the highest median household income of $45,903 found in the 45 to 64 years age bracket for the primary householder. A total of 151 households (30.0%) fall into this category. Meanwhile, the 15 to 24 years age bracket for the primary householder has the lowest median household income of $0, with 6 households (1.2%) in this group.
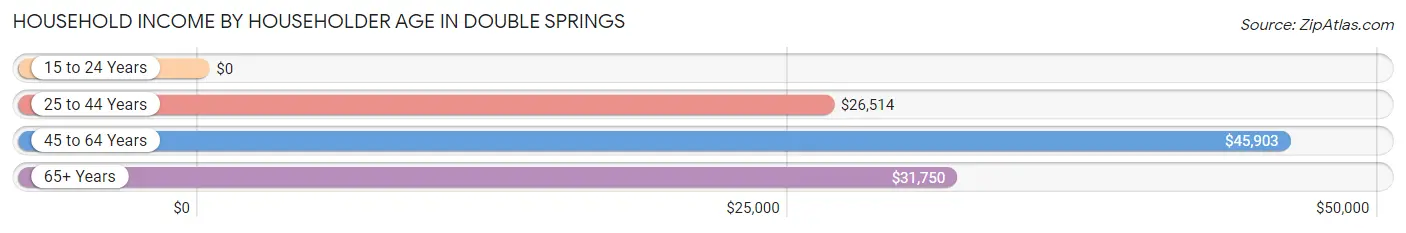
| Income Bracket | # Households | Median Income |
| 15 to 24 Years | 6 (1.2%) | $0 |
| 25 to 44 Years | 247 (49.1%) | $26,514 |
| 45 to 64 Years | 151 (30.0%) | $45,903 |
| 65+ Years | 99 (19.7%) | $31,750 |
| Total | 503 (100.0%) | $31,827 |
Poverty in Double Springs
Income Below Poverty by Sex and Age in Double Springs
With 25.8% poverty level for males and 36.9% for females among the residents of Double Springs, under 5 year old males and 5 year old females are the most vulnerable to poverty, with 54 males (56.2%) and 9 females (100.0%) in their respective age groups living below the poverty level.
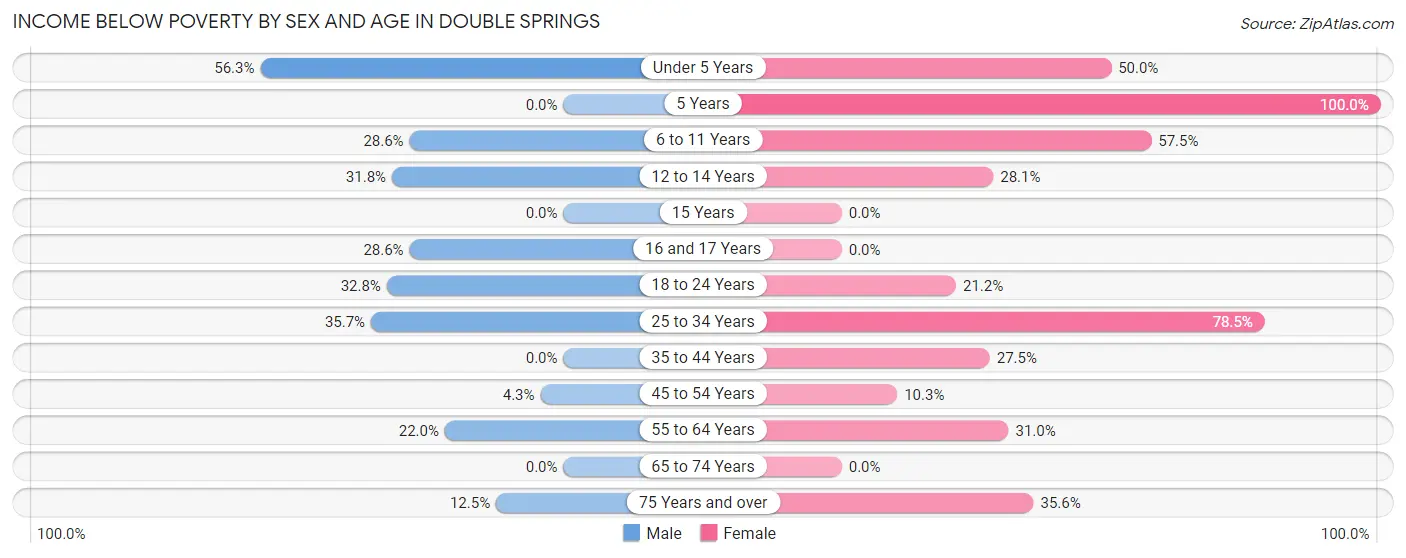
| Age Bracket | Male | Female |
| Under 5 Years | 54 (56.2%) | 9 (50.0%) |
| 5 Years | 0 (0.0%) | 9 (100.0%) |
| 6 to 11 Years | 4 (28.6%) | 27 (57.5%) |
| 12 to 14 Years | 7 (31.8%) | 18 (28.1%) |
| 15 Years | 0 (0.0%) | 0 (0.0%) |
| 16 and 17 Years | 10 (28.6%) | 0 (0.0%) |
| 18 to 24 Years | 20 (32.8%) | 7 (21.2%) |
| 25 to 34 Years | 35 (35.7%) | 73 (78.5%) |
| 35 to 44 Years | 0 (0.0%) | 25 (27.5%) |
| 45 to 54 Years | 2 (4.3%) | 7 (10.3%) |
| 55 to 64 Years | 11 (22.0%) | 26 (30.9%) |
| 65 to 74 Years | 0 (0.0%) | 0 (0.0%) |
| 75 Years and over | 3 (12.5%) | 21 (35.6%) |
| Total | 146 (25.8%) | 222 (36.9%) |
Income Above Poverty by Sex and Age in Double Springs
According to the poverty statistics in Double Springs, males aged 35 to 44 years and females aged 15 years are the age groups that are most secure financially, with 100.0% of males and 100.0% of females in these age groups living above the poverty line.
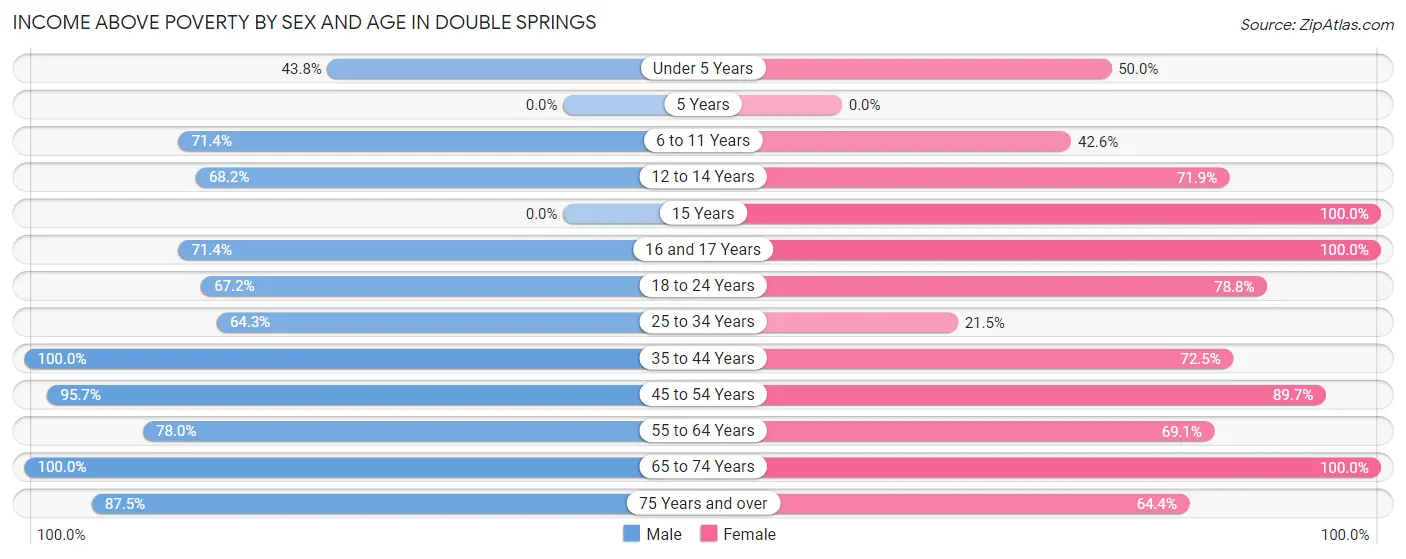
| Age Bracket | Male | Female |
| Under 5 Years | 42 (43.8%) | 9 (50.0%) |
| 5 Years | 0 (0.0%) | 0 (0.0%) |
| 6 to 11 Years | 10 (71.4%) | 20 (42.5%) |
| 12 to 14 Years | 15 (68.2%) | 46 (71.9%) |
| 15 Years | 0 (0.0%) | 6 (100.0%) |
| 16 and 17 Years | 25 (71.4%) | 8 (100.0%) |
| 18 to 24 Years | 41 (67.2%) | 26 (78.8%) |
| 25 to 34 Years | 63 (64.3%) | 20 (21.5%) |
| 35 to 44 Years | 87 (100.0%) | 66 (72.5%) |
| 45 to 54 Years | 45 (95.7%) | 61 (89.7%) |
| 55 to 64 Years | 39 (78.0%) | 58 (69.1%) |
| 65 to 74 Years | 31 (100.0%) | 22 (100.0%) |
| 75 Years and over | 21 (87.5%) | 38 (64.4%) |
| Total | 419 (74.2%) | 380 (63.1%) |
Income Below Poverty Among Married-Couple Families in Double Springs
The poverty statistics for married-couple families in Double Springs show that 5.4% or 9 of the total 167 families live below the poverty line. Families with 5 or more children have the highest poverty rate of 100.0%, comprising of 4 families. On the other hand, families with 1 or 2 children have the lowest poverty rate of 0.0%, which includes 0 families.
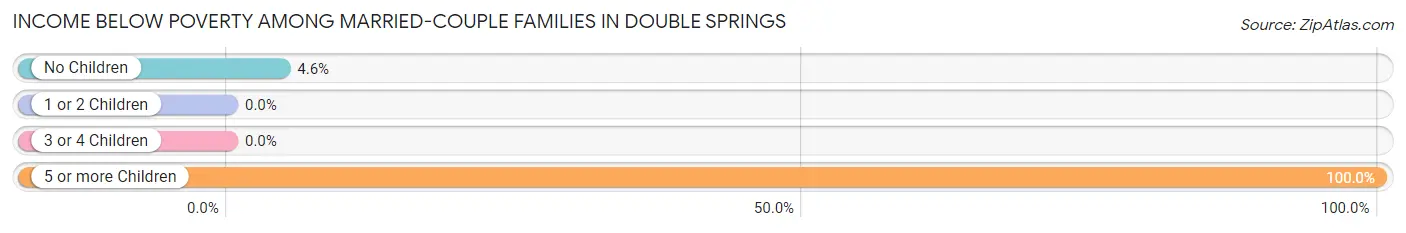
| Children | Above Poverty | Below Poverty |
| No Children | 105 (95.5%) | 5 (4.5%) |
| 1 or 2 Children | 53 (100.0%) | 0 (0.0%) |
| 3 or 4 Children | 0 (0.0%) | 0 (0.0%) |
| 5 or more Children | 0 (0.0%) | 4 (100.0%) |
| Total | 158 (94.6%) | 9 (5.4%) |
Income Below Poverty Among Single-Parent Households in Double Springs
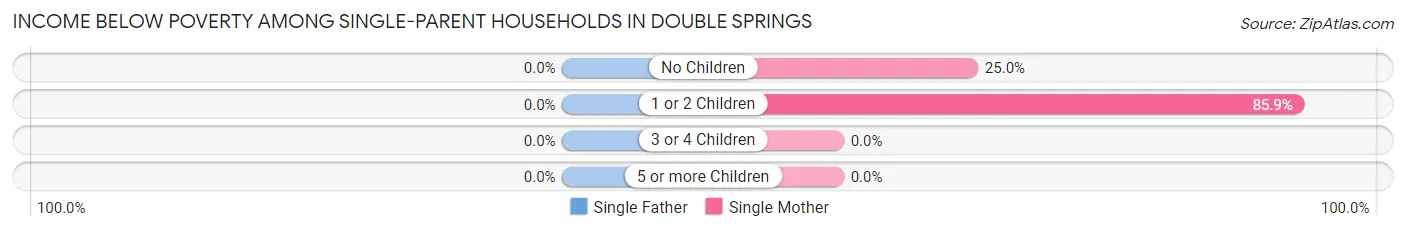
| Children | Single Father | Single Mother |
| No Children | 0 (0.0%) | 6 (25.0%) |
| 1 or 2 Children | 0 (0.0%) | 79 (85.9%) |
| 3 or 4 Children | 0 (0.0%) | 0 (0.0%) |
| 5 or more Children | 0 (0.0%) | 0 (0.0%) |
| Total | 0 (0.0%) | 85 (70.8%) |
Income Below Poverty Among Married-Couple vs Single-Parent Households in Double Springs
The poverty data for Double Springs shows that 9 of the married-couple family households (5.4%) and 85 of the single-parent households (42.3%) are living below the poverty level. Within the married-couple family households, those with 5 or more children have the highest poverty rate, with 4 households (100.0%) falling below the poverty line. Among the single-parent households, those with 1 or 2 children have the highest poverty rate, with 79 household (49.1%) living below poverty.
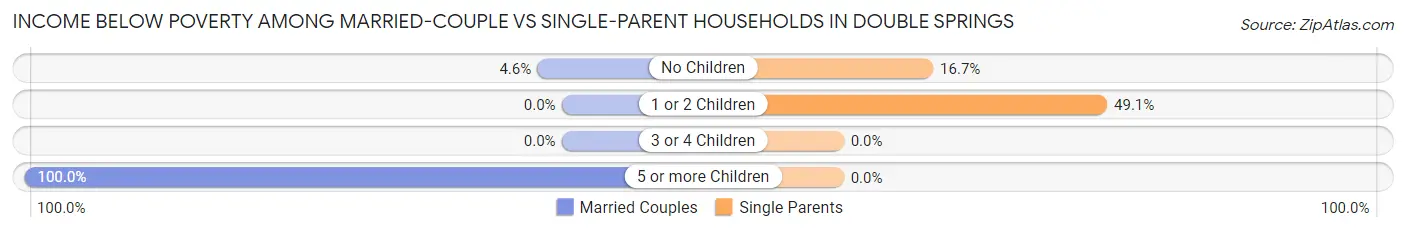
| Children | Married-Couple Families | Single-Parent Households |
| No Children | 5 (4.5%) | 6 (16.7%) |
| 1 or 2 Children | 0 (0.0%) | 79 (49.1%) |
| 3 or 4 Children | 0 (0.0%) | 0 (0.0%) |
| 5 or more Children | 4 (100.0%) | 0 (0.0%) |
| Total | 9 (5.4%) | 85 (42.3%) |
Race in Double Springs
The most populous races in Double Springs are White / Caucasian (1,254 | 92.1%), Hispanic or Latino (75 | 5.5%), and Two or more Races (72 | 5.3%).
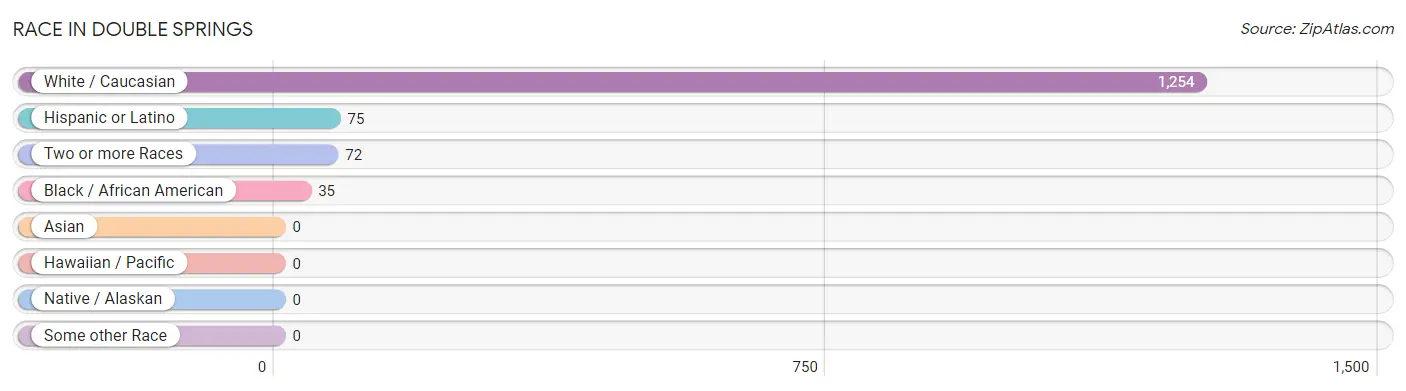
| Race | # Population | % Population |
| Asian | 0 | 0.0% |
| Black / African American | 35 | 2.6% |
| Hawaiian / Pacific | 0 | 0.0% |
| Hispanic or Latino | 75 | 5.5% |
| Native / Alaskan | 0 | 0.0% |
| White / Caucasian | 1,254 | 92.1% |
| Two or more Races | 72 | 5.3% |
| Some other Race | 0 | 0.0% |
| Total | 1,361 | 100.0% |
Ancestry in Double Springs
The most populous ancestries reported in Double Springs are American (320 | 23.5%), Irish (217 | 15.9%), English (109 | 8.0%), German (81 | 5.9%), and Mexican (75 | 5.5%), together accounting for 58.9% of all Double Springs residents.
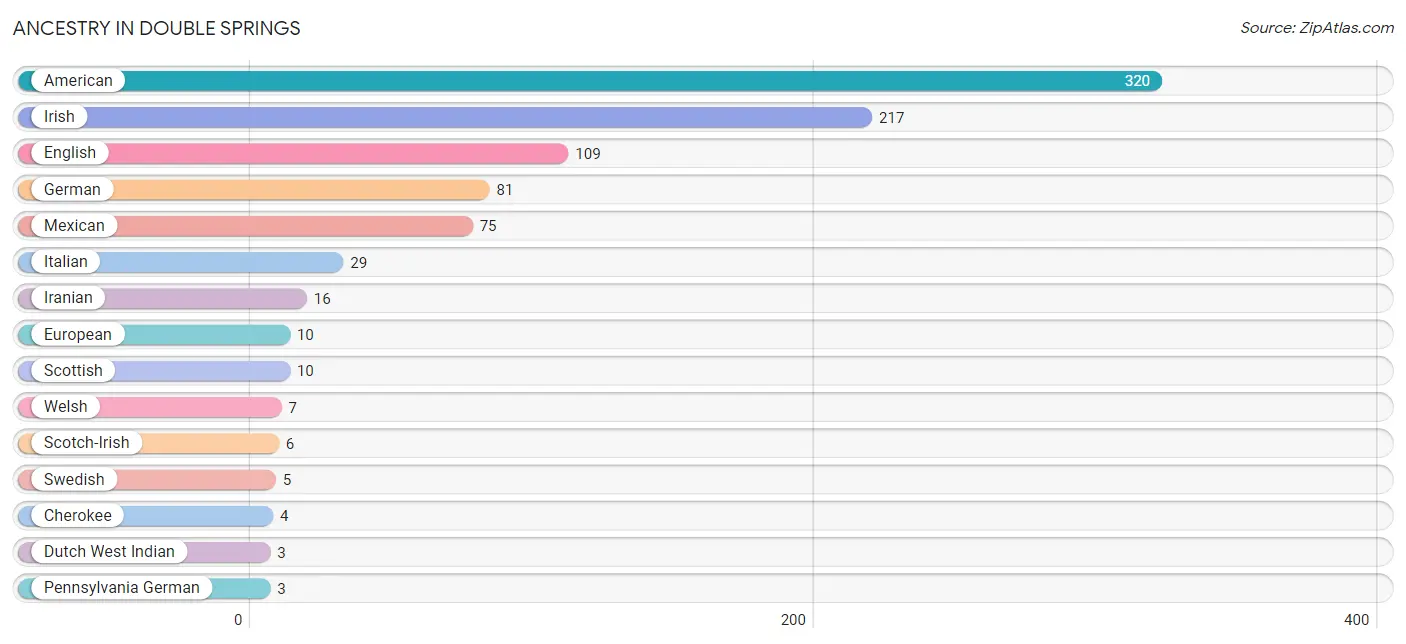
| Ancestry | # Population | % Population |
| American | 320 | 23.5% |
| British | 2 | 0.2% |
| Cherokee | 4 | 0.3% |
| Dutch West Indian | 3 | 0.2% |
| English | 109 | 8.0% |
| European | 10 | 0.7% |
| German | 81 | 5.9% |
| Iranian | 16 | 1.2% |
| Irish | 217 | 15.9% |
| Italian | 29 | 2.1% |
| Mexican | 75 | 5.5% |
| Pennsylvania German | 3 | 0.2% |
| Russian | 2 | 0.2% |
| Scotch-Irish | 6 | 0.4% |
| Scottish | 10 | 0.7% |
| Swedish | 5 | 0.4% |
| Welsh | 7 | 0.5% | View All 17 Rows |
Immigrants in Double Springs
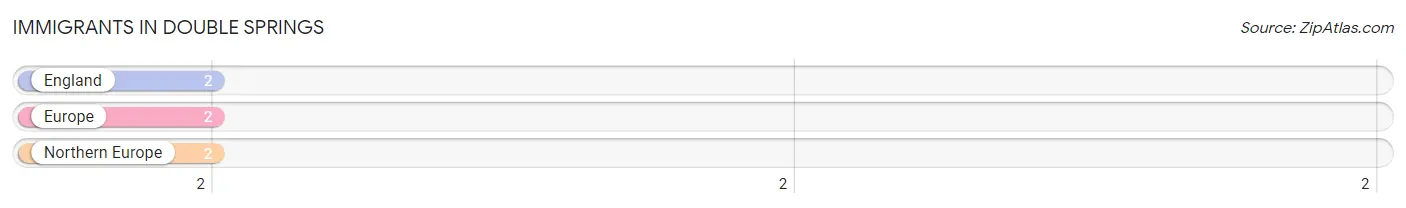
The most numerous immigrant groups reported in Double Springs came from England (2 | 0.2%), Europe (2 | 0.2%), and Northern Europe (2 | 0.2%), together accounting for 0.5% of all Double Springs residents.
| Immigration Origin | # Population | % Population |
| England | 2 | 0.2% |
| Europe | 2 | 0.2% |
| Northern Europe | 2 | 0.2% | View All 3 Rows |
Sex and Age in Double Springs
Sex and Age in Double Springs
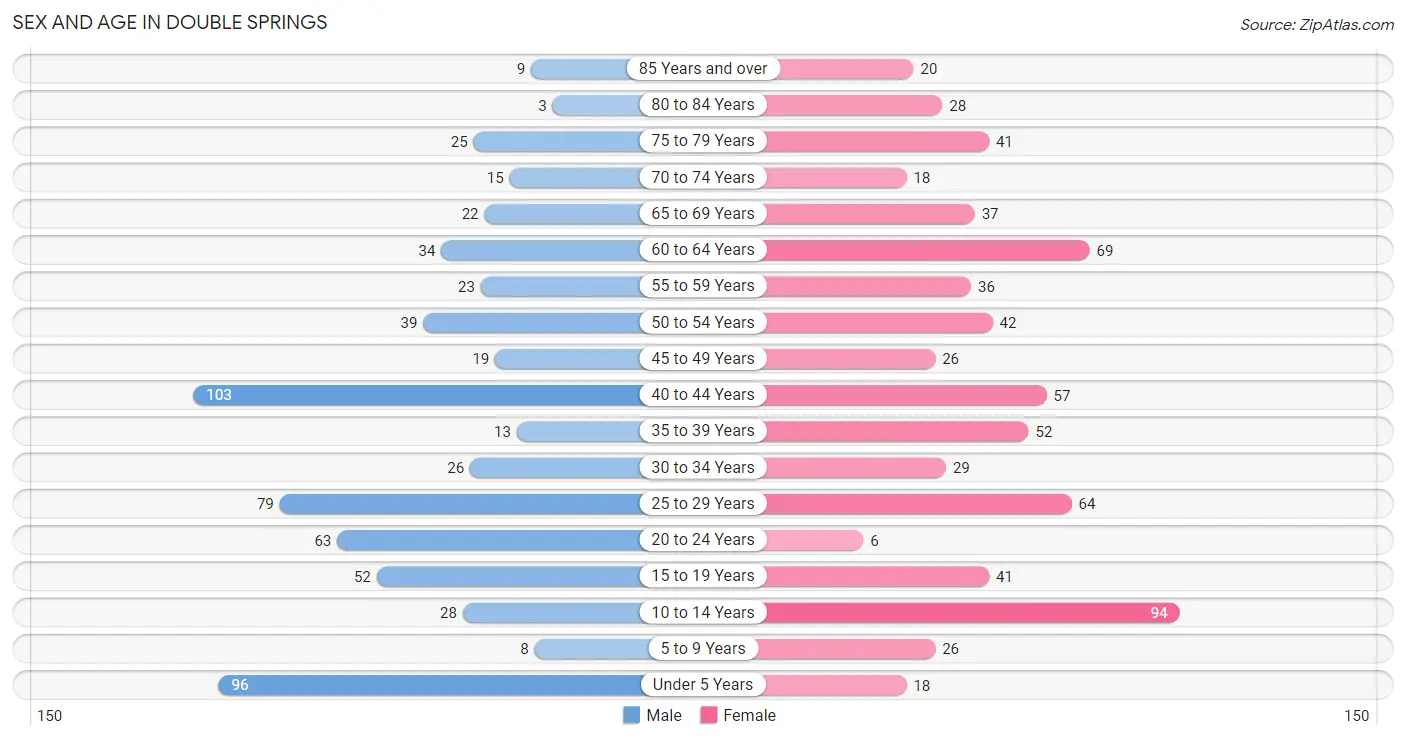
The most populous age groups in Double Springs are 40 to 44 Years (103 | 15.7%) for men and 10 to 14 Years (94 | 13.4%) for women.
| Age Bracket | Male | Female |
| Under 5 Years | 96 (14.6%) | 18 (2.6%) |
| 5 to 9 Years | 8 (1.2%) | 26 (3.7%) |
| 10 to 14 Years | 28 (4.3%) | 94 (13.4%) |
| 15 to 19 Years | 52 (7.9%) | 41 (5.8%) |
| 20 to 24 Years | 63 (9.6%) | 6 (0.9%) |
| 25 to 29 Years | 79 (12.0%) | 64 (9.1%) |
| 30 to 34 Years | 26 (4.0%) | 29 (4.1%) |
| 35 to 39 Years | 13 (2.0%) | 52 (7.4%) |
| 40 to 44 Years | 103 (15.7%) | 57 (8.1%) |
| 45 to 49 Years | 19 (2.9%) | 26 (3.7%) |
| 50 to 54 Years | 39 (5.9%) | 42 (6.0%) |
| 55 to 59 Years | 23 (3.5%) | 36 (5.1%) |
| 60 to 64 Years | 34 (5.2%) | 69 (9.8%) |
| 65 to 69 Years | 22 (3.4%) | 37 (5.3%) |
| 70 to 74 Years | 15 (2.3%) | 18 (2.6%) |
| 75 to 79 Years | 25 (3.8%) | 41 (5.8%) |
| 80 to 84 Years | 3 (0.5%) | 28 (4.0%) |
| 85 Years and over | 9 (1.4%) | 20 (2.8%) |
| Total | 657 (100.0%) | 704 (100.0%) |
Families and Households in Double Springs
Median Family Size in Double Springs
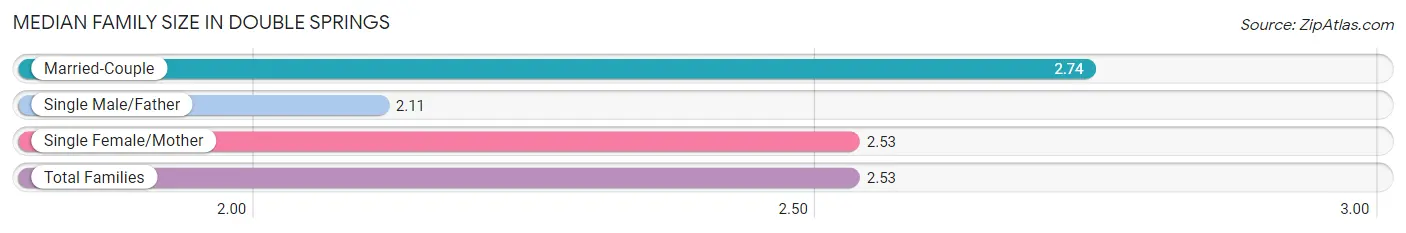
The median family size in Double Springs is 2.53 persons per family, with married-couple families (167 | 45.4%) accounting for the largest median family size of 2.74 persons per family. On the other hand, single male/father families (81 | 22.0%) represent the smallest median family size with 2.11 persons per family.
| Family Type | # Families | Family Size |
| Married-Couple | 167 (45.4%) | 2.74 |
| Single Male/Father | 81 (22.0%) | 2.11 |
| Single Female/Mother | 120 (32.6%) | 2.53 |
| Total Families | 368 (100.0%) | 2.53 |
Median Household Size in Double Springs
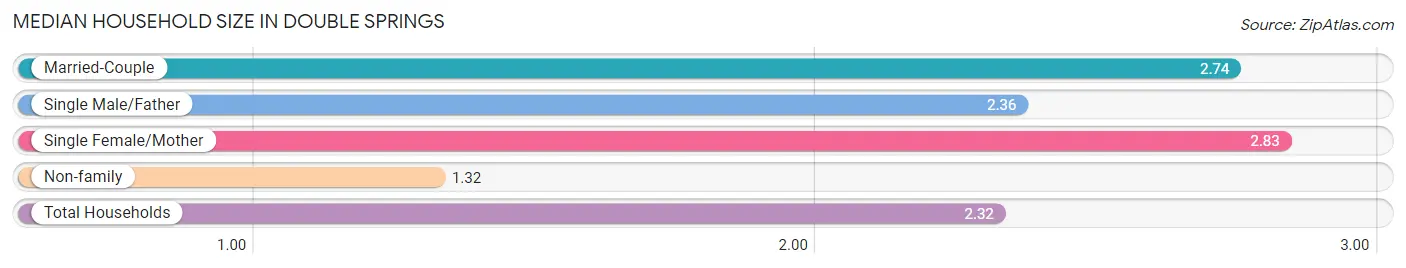
The median household size in Double Springs is 2.32 persons per household, with single female/mother households (120 | 23.9%) accounting for the largest median household size of 2.83 persons per household. non-family households (135 | 26.8%) represent the smallest median household size with 1.32 persons per household.
| Household Type | # Households | Household Size |
| Married-Couple | 167 (33.2%) | 2.74 |
| Single Male/Father | 81 (16.1%) | 2.36 |
| Single Female/Mother | 120 (23.9%) | 2.83 |
| Non-family | 135 (26.8%) | 1.32 |
| Total Households | 503 (100.0%) | 2.32 |
Household Size by Marriage Status in Double Springs
Out of a total of 503 households in Double Springs, 368 (73.2%) are family households, while 135 (26.8%) are nonfamily households. The most numerous type of family households are 2-person households, comprising 200, and the most common type of nonfamily households are 1-person households, comprising 101.
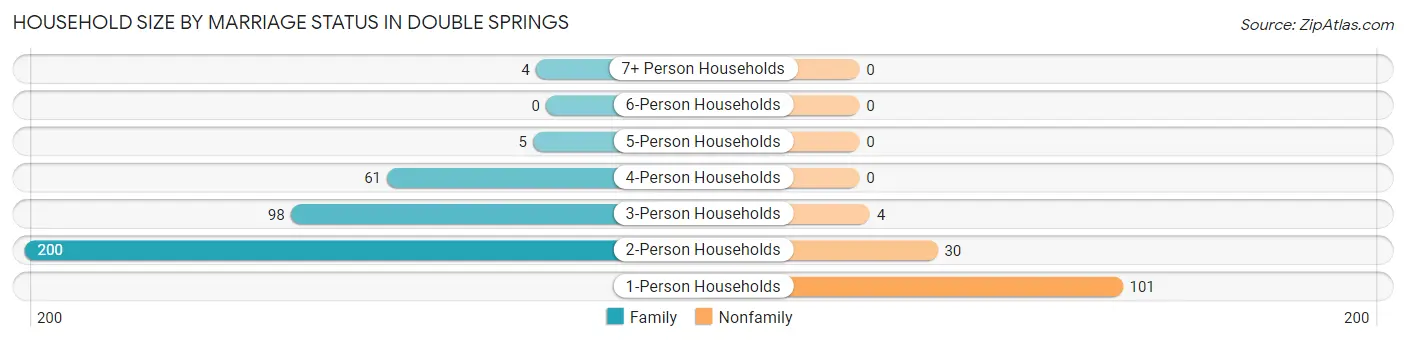
| Household Size | Family Households | Nonfamily Households |
| 1-Person Households | - | 101 (20.1%) |
| 2-Person Households | 200 (39.8%) | 30 (6.0%) |
| 3-Person Households | 98 (19.5%) | 4 (0.8%) |
| 4-Person Households | 61 (12.1%) | 0 (0.0%) |
| 5-Person Households | 5 (1.0%) | 0 (0.0%) |
| 6-Person Households | 0 (0.0%) | 0 (0.0%) |
| 7+ Person Households | 4 (0.8%) | 0 (0.0%) |
| Total | 368 (73.2%) | 135 (26.8%) |
Female Fertility in Double Springs
Fertility by Age in Double Springs
Average fertility rate in Double Springs is 66.0 births per 1,000 women. Women in the age bracket of 35 to 50 years have the highest fertility rate with 97.0 births per 1,000 women. Women in the age bracket of 35 to 50 years acount for 80.0% of all women with births.
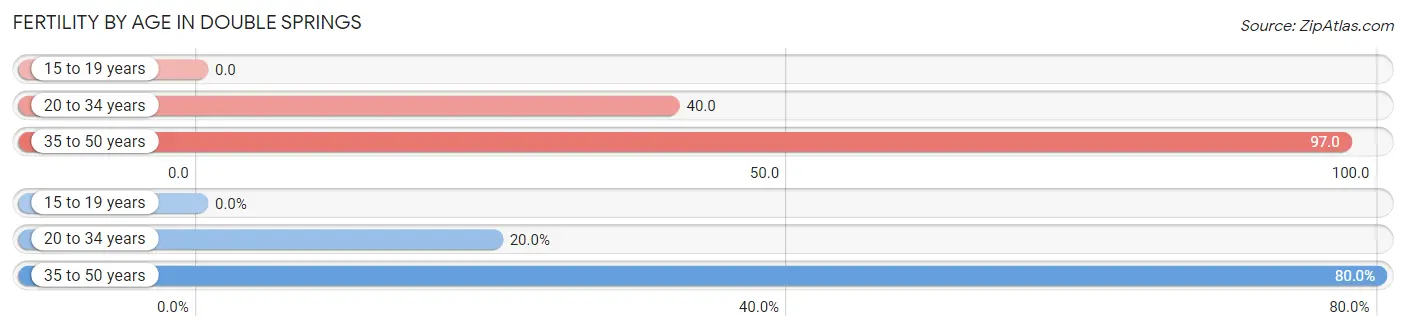
| Age Bracket | Women with Births | Births / 1,000 Women |
| 15 to 19 years | 0 (0.0%) | 0.0 |
| 20 to 34 years | 4 (20.0%) | 40.0 |
| 35 to 50 years | 16 (80.0%) | 97.0 |
| Total | 20 (100.0%) | 66.0 |
Fertility by Age by Marriage Status in Double Springs
20.0% of women with births (20) in Double Springs are married. The highest percentage of unmarried women with births falls into 35 to 50 years age bracket with 100.0% of them unmarried at the time of birth, while the lowest percentage of unmarried women with births belong to 20 to 34 years age bracket with 0.0% of them unmarried.
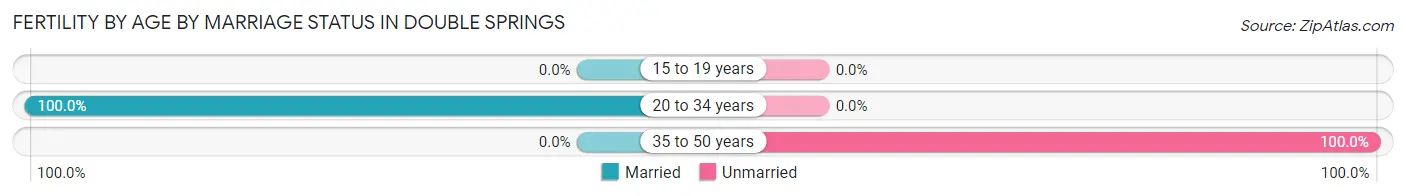
| Age Bracket | Married | Unmarried |
| 15 to 19 years | 0 (0.0%) | 0 (0.0%) |
| 20 to 34 years | 4 (100.0%) | 0 (0.0%) |
| 35 to 50 years | 0 (0.0%) | 16 (100.0%) |
| Total | 4 (20.0%) | 16 (80.0%) |
Fertility by Education in Double Springs
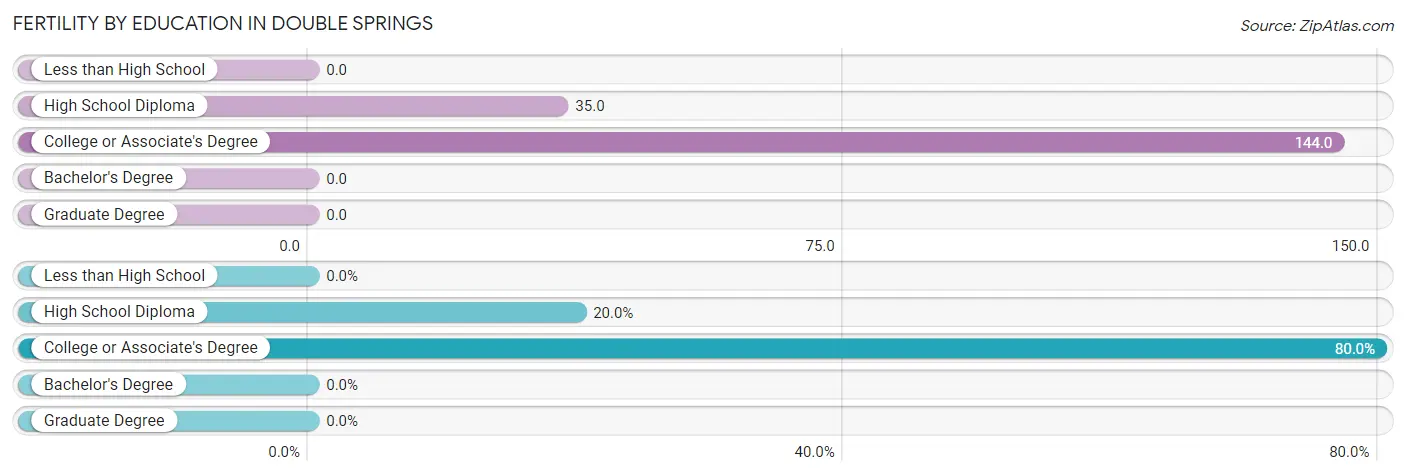
| Educational Attainment | Women with Births | Births / 1,000 Women |
| Less than High School | 0 (0.0%) | 0.0 |
| High School Diploma | 4 (20.0%) | 35.0 |
| College or Associate's Degree | 16 (80.0%) | 144.0 |
| Bachelor's Degree | 0 (0.0%) | 0.0 |
| Graduate Degree | 0 (0.0%) | 0.0 |
| Total | 20 (100.0%) | 66.0 |
Fertility by Education by Marriage Status in Double Springs
80.0% of women with births in Double Springs are unmarried. Women with the educational attainment of high school diploma are most likely to be married with 100.0% of them married at childbirth, while women with the educational attainment of college or associate's degree are least likely to be married with 100.0% of them unmarried at childbirth.
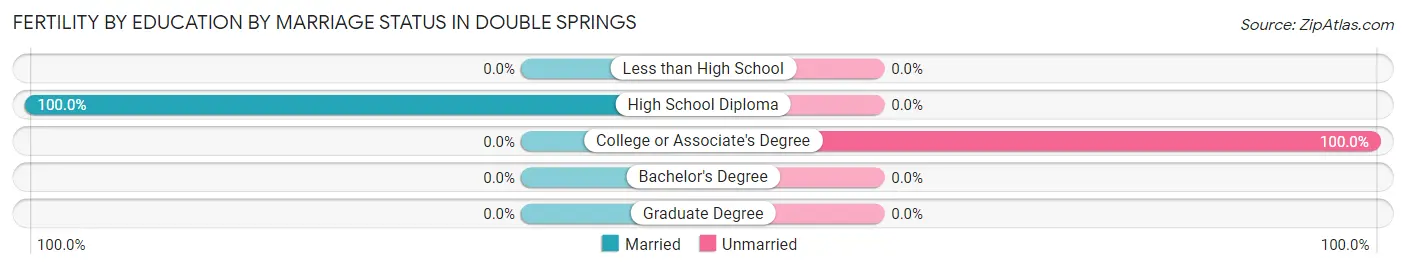
| Educational Attainment | Married | Unmarried |
| Less than High School | 0 (0.0%) | 0 (0.0%) |
| High School Diploma | 4 (100.0%) | 0 (0.0%) |
| College or Associate's Degree | 0 (0.0%) | 16 (100.0%) |
| Bachelor's Degree | 0 (0.0%) | 0 (0.0%) |
| Graduate Degree | 0 (0.0%) | 0 (0.0%) |
| Total | 4 (20.0%) | 16 (80.0%) |
Employment Characteristics in Double Springs
Employment by Class of Employer in Double Springs
Among the 473 employed individuals in Double Springs, private company employees (364 | 77.0%), state government employees (30 | 6.3%), and self-employed (incorporated) (21 | 4.4%) make up the most common classes of employment.
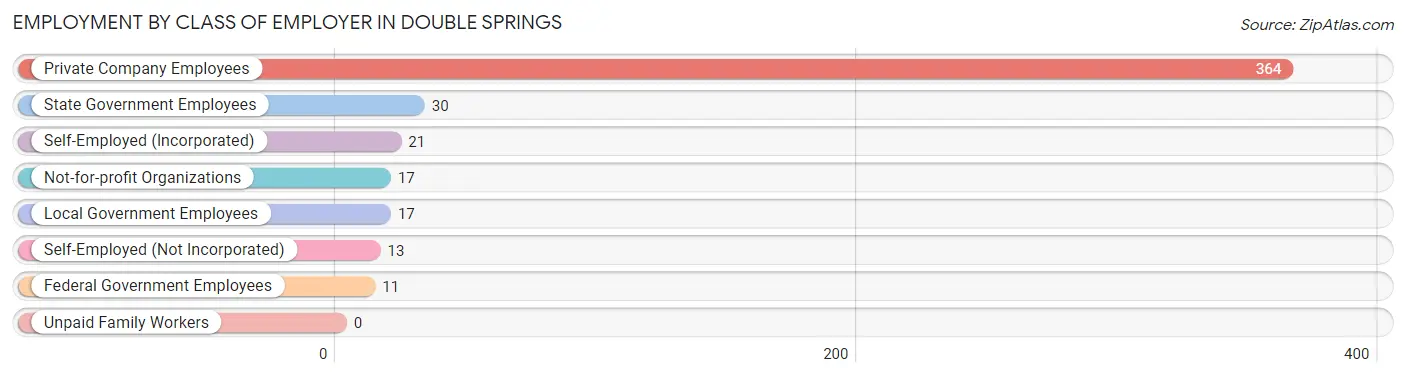
| Employer Class | # Employees | % Employees |
| Private Company Employees | 364 | 77.0% |
| Self-Employed (Incorporated) | 21 | 4.4% |
| Self-Employed (Not Incorporated) | 13 | 2.8% |
| Not-for-profit Organizations | 17 | 3.6% |
| Local Government Employees | 17 | 3.6% |
| State Government Employees | 30 | 6.3% |
| Federal Government Employees | 11 | 2.3% |
| Unpaid Family Workers | 0 | 0.0% |
| Total | 473 | 100.0% |
Employment Status by Age in Double Springs
According to the labor force statistics for Double Springs, out of the total population over 16 years of age (1,085), 49.3% or 535 individuals are in the labor force, with 11.6% or 62 of them unemployed. The age group with the highest labor force participation rate is 25 to 29 years, with 85.3% or 122 individuals in the labor force. Within the labor force, the 25 to 29 years age range has the highest percentage of unemployed individuals, with 41.8% or 51 of them being unemployed.
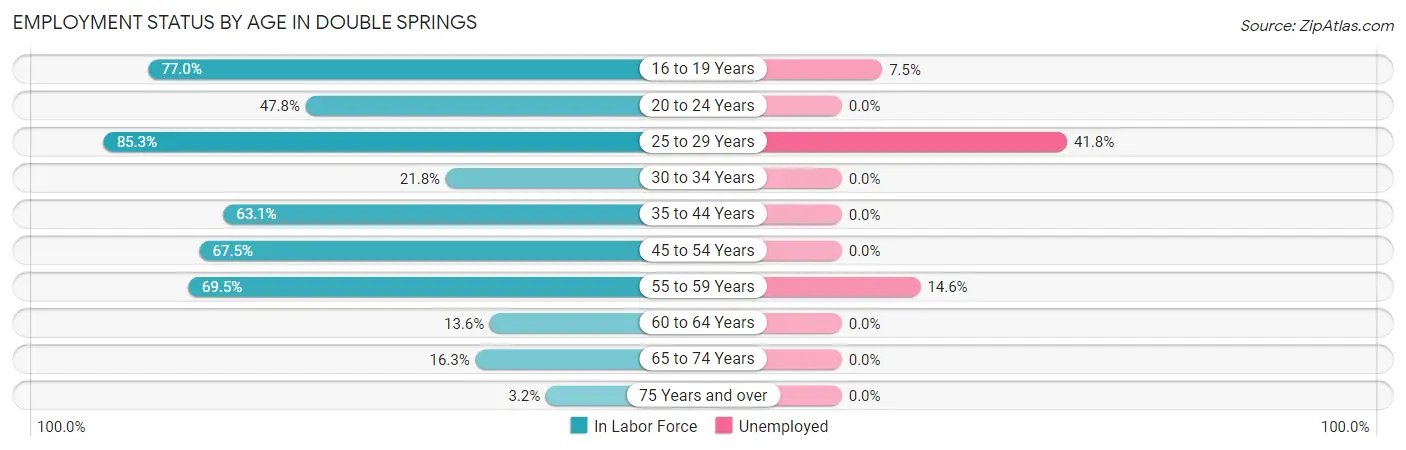
| Age Bracket | In Labor Force | Unemployed |
| 16 to 19 Years | 67 (77.0%) | 5 (7.5%) |
| 20 to 24 Years | 33 (47.8%) | 0 (0.0%) |
| 25 to 29 Years | 122 (85.3%) | 51 (41.8%) |
| 30 to 34 Years | 12 (21.8%) | 0 (0.0%) |
| 35 to 44 Years | 142 (63.1%) | 0 (0.0%) |
| 45 to 54 Years | 85 (67.5%) | 0 (0.0%) |
| 55 to 59 Years | 41 (69.5%) | 6 (14.6%) |
| 60 to 64 Years | 14 (13.6%) | 0 (0.0%) |
| 65 to 74 Years | 15 (16.3%) | 0 (0.0%) |
| 75 Years and over | 4 (3.2%) | 0 (0.0%) |
| Total | 535 (49.3%) | 62 (11.6%) |
Employment Status by Educational Attainment in Double Springs
According to labor force statistics for Double Springs, 58.5% of individuals (416) out of the total population between 25 and 64 years of age (711) are in the labor force, with 13.7% or 57 of them being unemployed. The group with the highest labor force participation rate are those with the educational attainment of bachelor's degree or higher, with 79.6% or 86 individuals in the labor force. Within the labor force, individuals with high school diploma education have the highest percentage of unemployment, with 23.3% or 45 of them being unemployed.
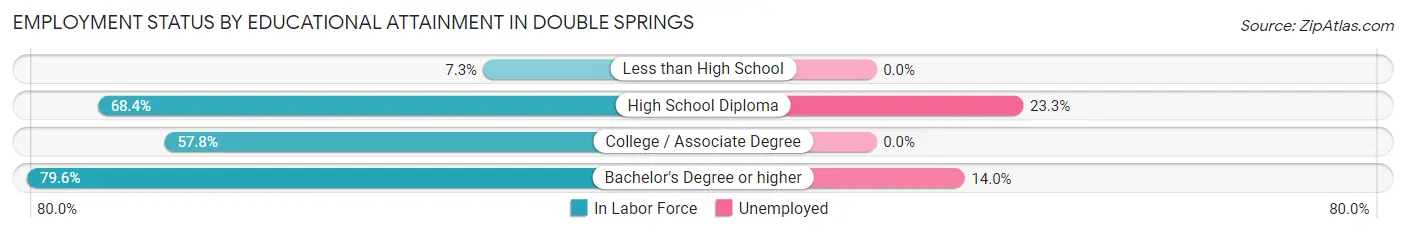
| Educational Attainment | In Labor Force | Unemployed |
| Less than High School | 7 (7.3%) | 0 (0.0%) |
| High School Diploma | 193 (68.4%) | 66 (23.3%) |
| College / Associate Degree | 130 (57.8%) | 0 (0.0%) |
| Bachelor's Degree or higher | 86 (79.6%) | 15 (14.0%) |
| Total | 416 (58.5%) | 97 (13.7%) |
Employment Occupations by Sex in Double Springs
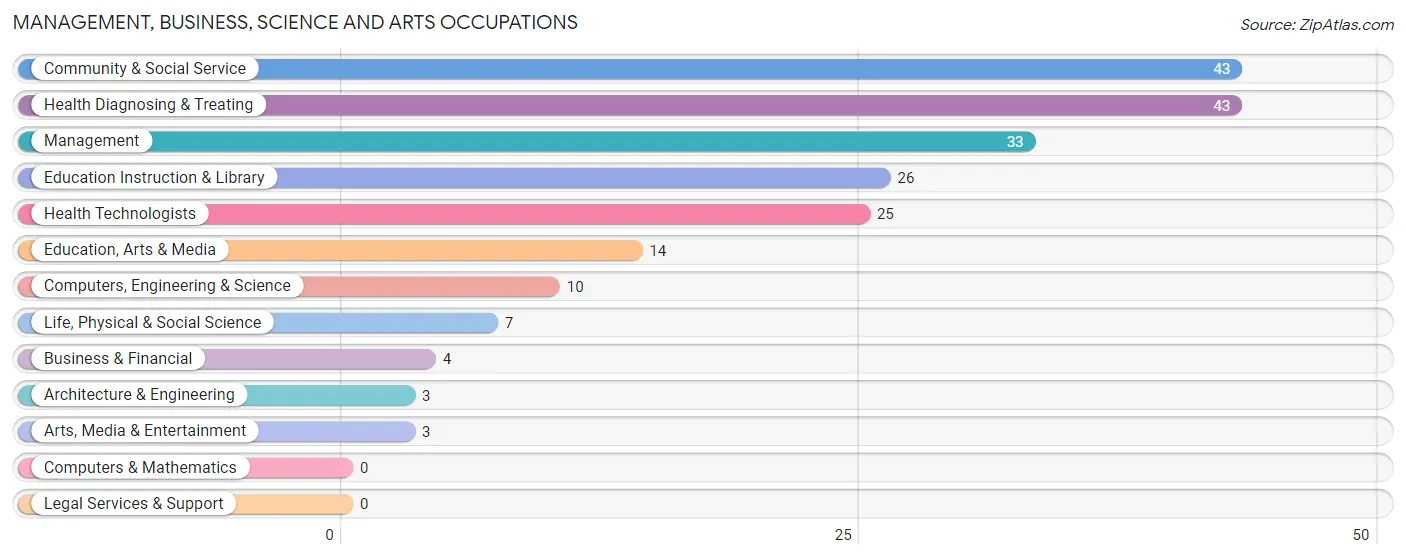
Management, Business, Science and Arts Occupations
The most common Management, Business, Science and Arts occupations in Double Springs are Community & Social Service (43 | 9.1%), Health Diagnosing & Treating (43 | 9.1%), Management (33 | 7.0%), Education Instruction & Library (26 | 5.5%), and Health Technologists (25 | 5.3%).
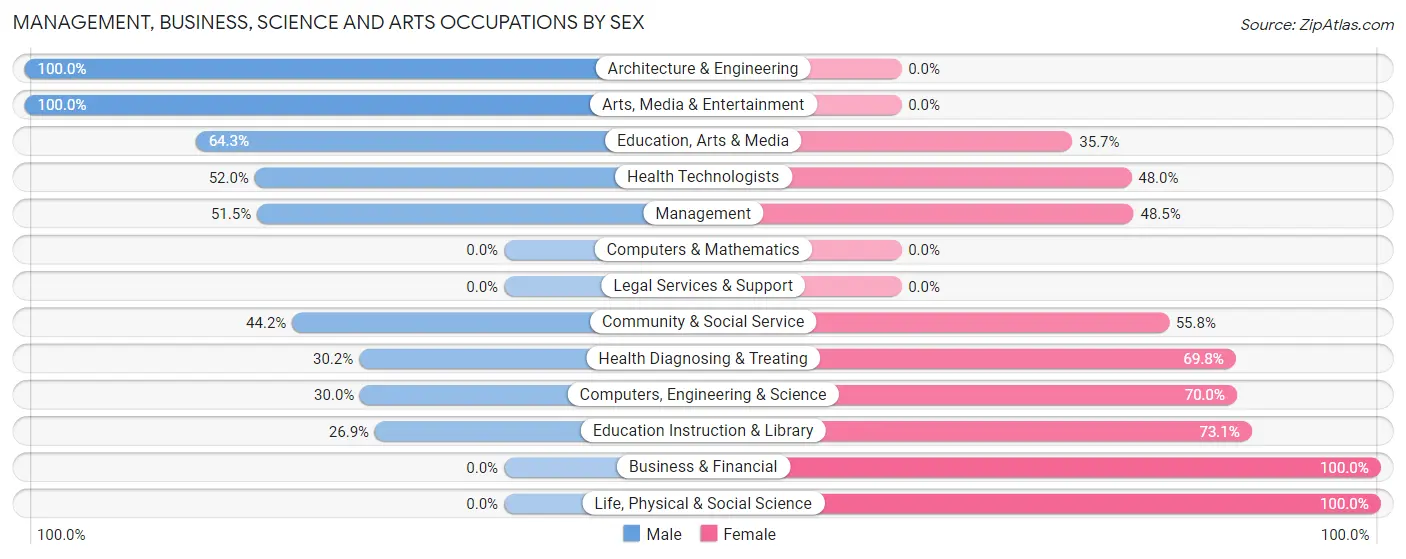
Management, Business, Science and Arts Occupations by Sex
Within the Management, Business, Science and Arts occupations in Double Springs, the most male-oriented occupations are Architecture & Engineering (100.0%), Arts, Media & Entertainment (100.0%), and Education, Arts & Media (64.3%), while the most female-oriented occupations are Business & Financial (100.0%), Life, Physical & Social Science (100.0%), and Education Instruction & Library (73.1%).
| Occupation | Male | Female |
| Management | 17 (51.5%) | 16 (48.5%) |
| Business & Financial | 0 (0.0%) | 4 (100.0%) |
| Computers, Engineering & Science | 3 (30.0%) | 7 (70.0%) |
| Computers & Mathematics | 0 (0.0%) | 0 (0.0%) |
| Architecture & Engineering | 3 (100.0%) | 0 (0.0%) |
| Life, Physical & Social Science | 0 (0.0%) | 7 (100.0%) |
| Community & Social Service | 19 (44.2%) | 24 (55.8%) |
| Education, Arts & Media | 9 (64.3%) | 5 (35.7%) |
| Legal Services & Support | 0 (0.0%) | 0 (0.0%) |
| Education Instruction & Library | 7 (26.9%) | 19 (73.1%) |
| Arts, Media & Entertainment | 3 (100.0%) | 0 (0.0%) |
| Health Diagnosing & Treating | 13 (30.2%) | 30 (69.8%) |
| Health Technologists | 13 (52.0%) | 12 (48.0%) |
| Total (Category) | 52 (39.1%) | 81 (60.9%) |
| Total (Overall) | 261 (55.2%) | 212 (44.8%) |
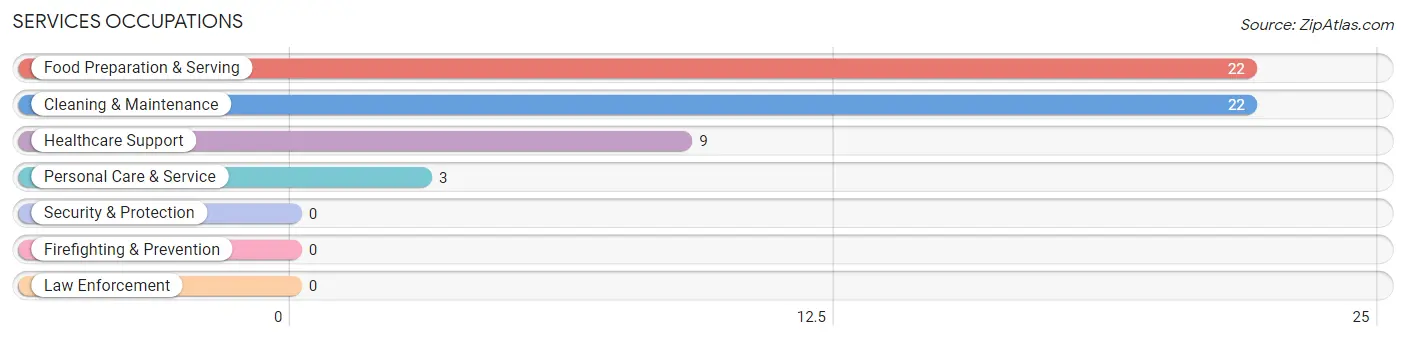
Services Occupations
The most common Services occupations in Double Springs are Food Preparation & Serving (22 | 4.6%), Cleaning & Maintenance (22 | 4.6%), Healthcare Support (9 | 1.9%), and Personal Care & Service (3 | 0.6%).
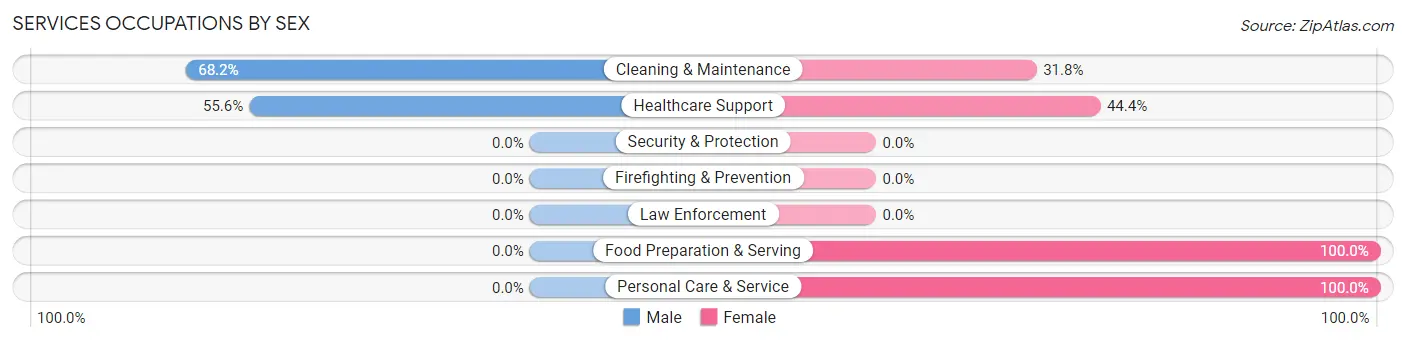
Services Occupations by Sex
Within the Services occupations in Double Springs, the most male-oriented occupations are Cleaning & Maintenance (68.2%), and Healthcare Support (55.6%), while the most female-oriented occupations are Food Preparation & Serving (100.0%), Personal Care & Service (100.0%), and Healthcare Support (44.4%).
| Occupation | Male | Female |
| Healthcare Support | 5 (55.6%) | 4 (44.4%) |
| Security & Protection | 0 (0.0%) | 0 (0.0%) |
| Firefighting & Prevention | 0 (0.0%) | 0 (0.0%) |
| Law Enforcement | 0 (0.0%) | 0 (0.0%) |
| Food Preparation & Serving | 0 (0.0%) | 22 (100.0%) |
| Cleaning & Maintenance | 15 (68.2%) | 7 (31.8%) |
| Personal Care & Service | 0 (0.0%) | 3 (100.0%) |
| Total (Category) | 20 (35.7%) | 36 (64.3%) |
| Total (Overall) | 261 (55.2%) | 212 (44.8%) |
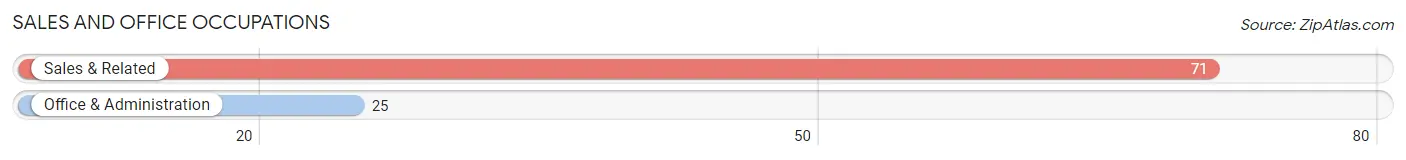
Sales and Office Occupations
The most common Sales and Office occupations in Double Springs are Sales & Related (71 | 15.0%), and Office & Administration (25 | 5.3%).
Sales and Office Occupations by Sex
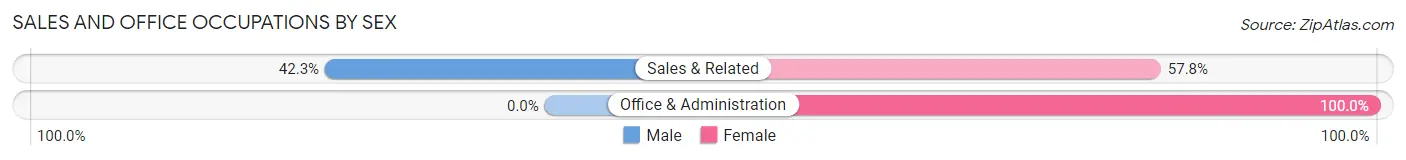
| Occupation | Male | Female |
| Sales & Related | 30 (42.2%) | 41 (57.8%) |
| Office & Administration | 0 (0.0%) | 25 (100.0%) |
| Total (Category) | 30 (31.2%) | 66 (68.8%) |
| Total (Overall) | 261 (55.2%) | 212 (44.8%) |
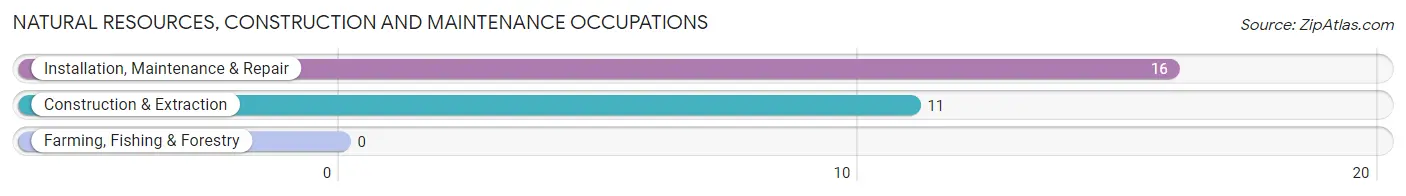
Natural Resources, Construction and Maintenance Occupations
The most common Natural Resources, Construction and Maintenance occupations in Double Springs are Installation, Maintenance & Repair (16 | 3.4%), and Construction & Extraction (11 | 2.3%).
Natural Resources, Construction and Maintenance Occupations by Sex
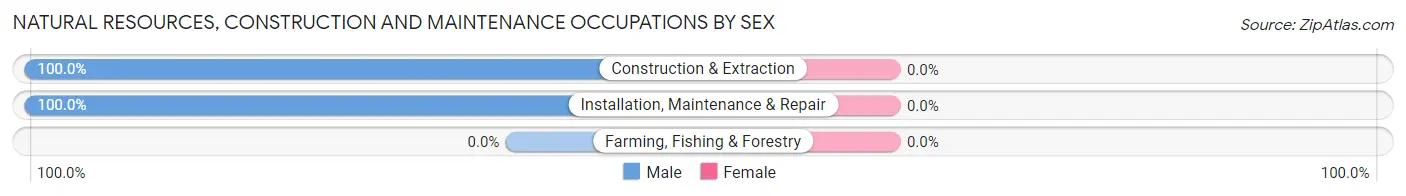
| Occupation | Male | Female |
| Farming, Fishing & Forestry | 0 (0.0%) | 0 (0.0%) |
| Construction & Extraction | 11 (100.0%) | 0 (0.0%) |
| Installation, Maintenance & Repair | 16 (100.0%) | 0 (0.0%) |
| Total (Category) | 27 (100.0%) | 0 (0.0%) |
| Total (Overall) | 261 (55.2%) | 212 (44.8%) |
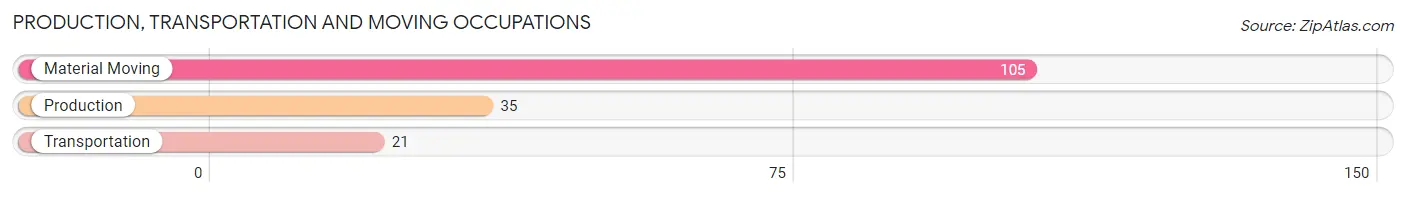
Production, Transportation and Moving Occupations
The most common Production, Transportation and Moving occupations in Double Springs are Material Moving (105 | 22.2%), Production (35 | 7.4%), and Transportation (21 | 4.4%).
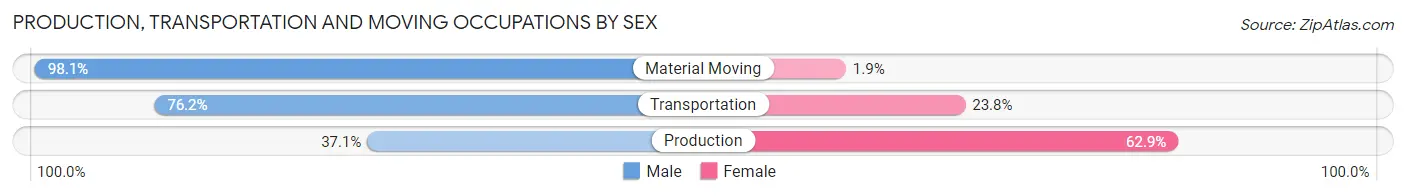
Production, Transportation and Moving Occupations by Sex
| Occupation | Male | Female |
| Production | 13 (37.1%) | 22 (62.9%) |
| Transportation | 16 (76.2%) | 5 (23.8%) |
| Material Moving | 103 (98.1%) | 2 (1.9%) |
| Total (Category) | 132 (82.0%) | 29 (18.0%) |
| Total (Overall) | 261 (55.2%) | 212 (44.8%) |
Employment Industries by Sex in Double Springs
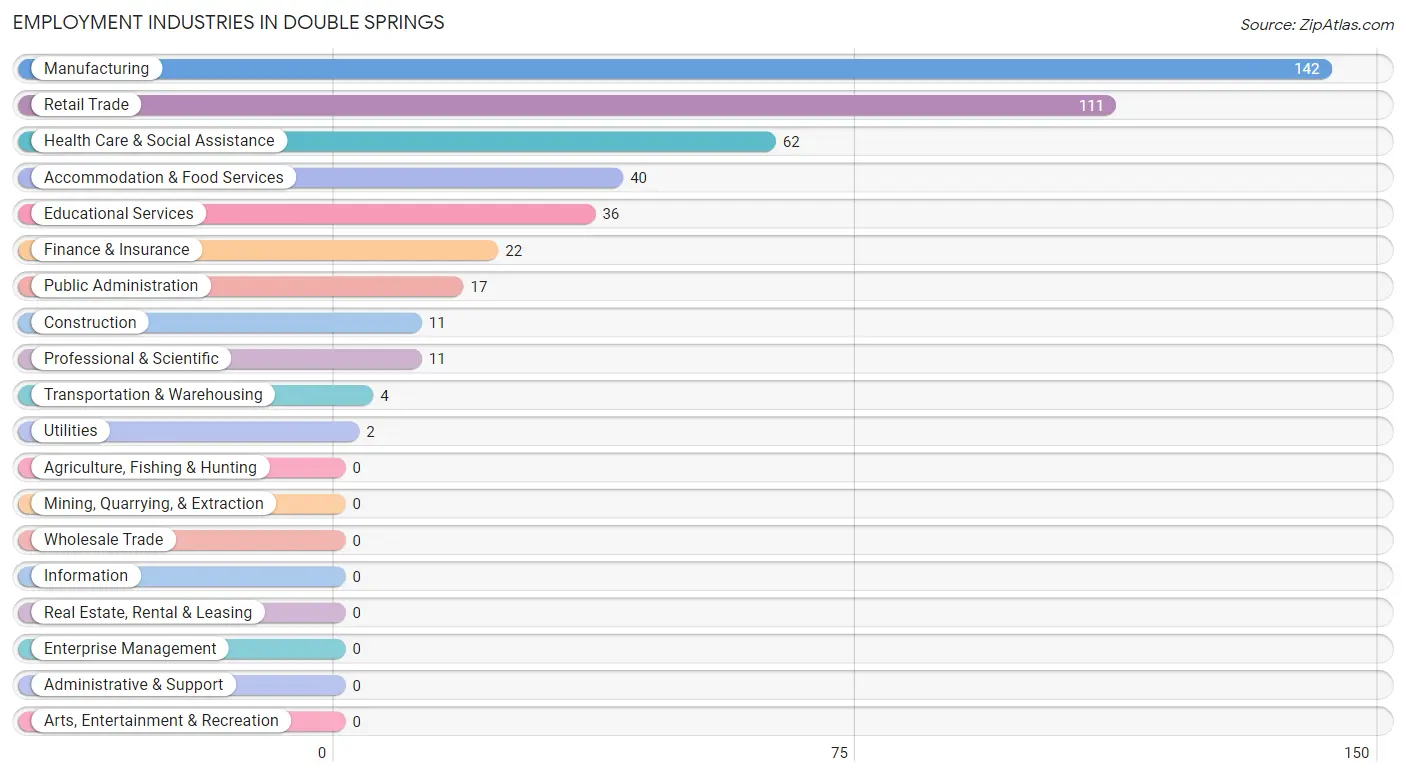
Employment Industries in Double Springs
The major employment industries in Double Springs include Manufacturing (142 | 30.0%), Retail Trade (111 | 23.5%), Health Care & Social Assistance (62 | 13.1%), Accommodation & Food Services (40 | 8.5%), and Educational Services (36 | 7.6%).
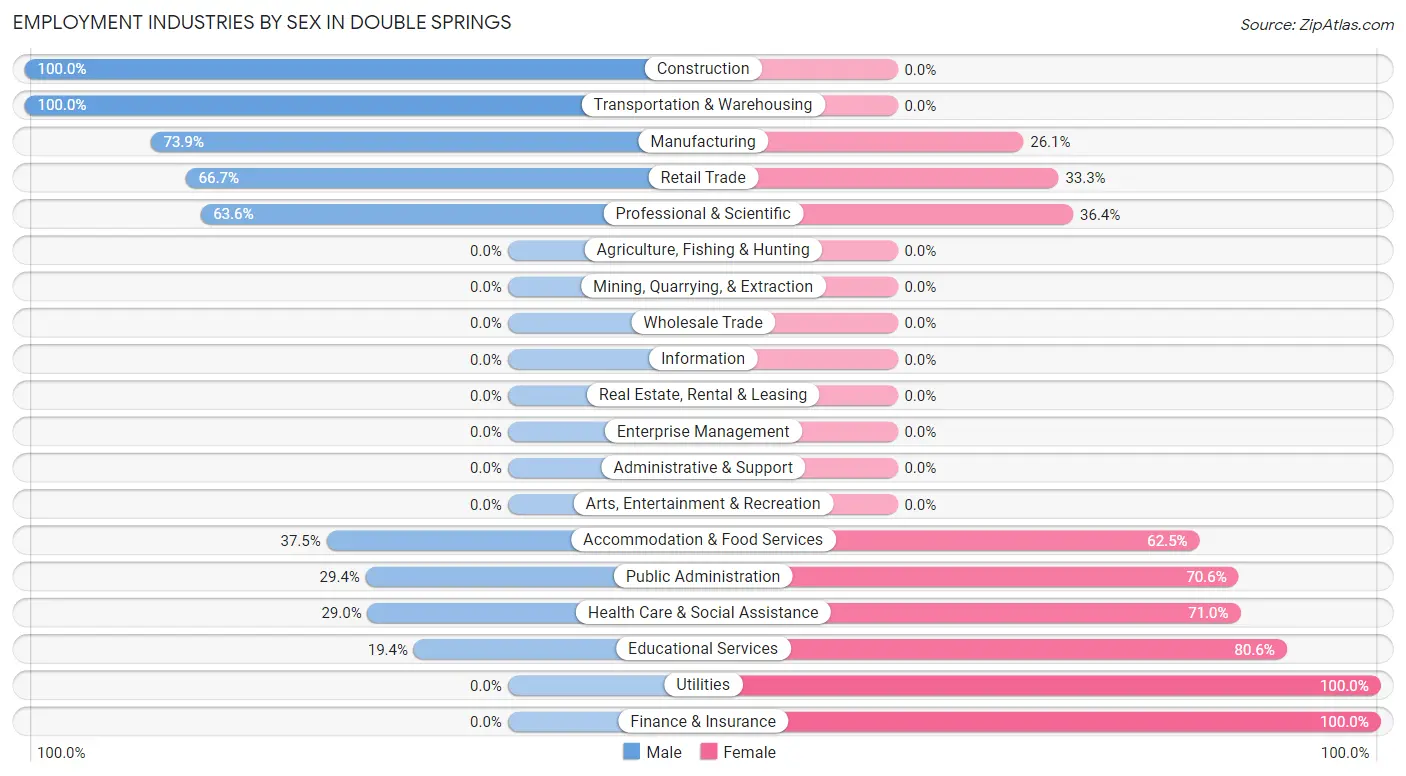
Employment Industries by Sex in Double Springs
The Double Springs industries that see more men than women are Construction (100.0%), Transportation & Warehousing (100.0%), and Manufacturing (73.9%), whereas the industries that tend to have a higher number of women are Utilities (100.0%), Finance & Insurance (100.0%), and Educational Services (80.6%).
| Industry | Male | Female |
| Agriculture, Fishing & Hunting | 0 (0.0%) | 0 (0.0%) |
| Mining, Quarrying, & Extraction | 0 (0.0%) | 0 (0.0%) |
| Construction | 11 (100.0%) | 0 (0.0%) |
| Manufacturing | 105 (73.9%) | 37 (26.1%) |
| Wholesale Trade | 0 (0.0%) | 0 (0.0%) |
| Retail Trade | 74 (66.7%) | 37 (33.3%) |
| Transportation & Warehousing | 4 (100.0%) | 0 (0.0%) |
| Utilities | 0 (0.0%) | 2 (100.0%) |
| Information | 0 (0.0%) | 0 (0.0%) |
| Finance & Insurance | 0 (0.0%) | 22 (100.0%) |
| Real Estate, Rental & Leasing | 0 (0.0%) | 0 (0.0%) |
| Professional & Scientific | 7 (63.6%) | 4 (36.4%) |
| Enterprise Management | 0 (0.0%) | 0 (0.0%) |
| Administrative & Support | 0 (0.0%) | 0 (0.0%) |
| Educational Services | 7 (19.4%) | 29 (80.6%) |
| Health Care & Social Assistance | 18 (29.0%) | 44 (71.0%) |
| Arts, Entertainment & Recreation | 0 (0.0%) | 0 (0.0%) |
| Accommodation & Food Services | 15 (37.5%) | 25 (62.5%) |
| Public Administration | 5 (29.4%) | 12 (70.6%) |
| Total | 261 (55.2%) | 212 (44.8%) |
Education in Double Springs
School Enrollment in Double Springs
The most common levels of schooling among the 344 students in Double Springs are middle school (88 | 25.6%), high school (66 | 19.2%), and nursery / preschool (54 | 15.7%).
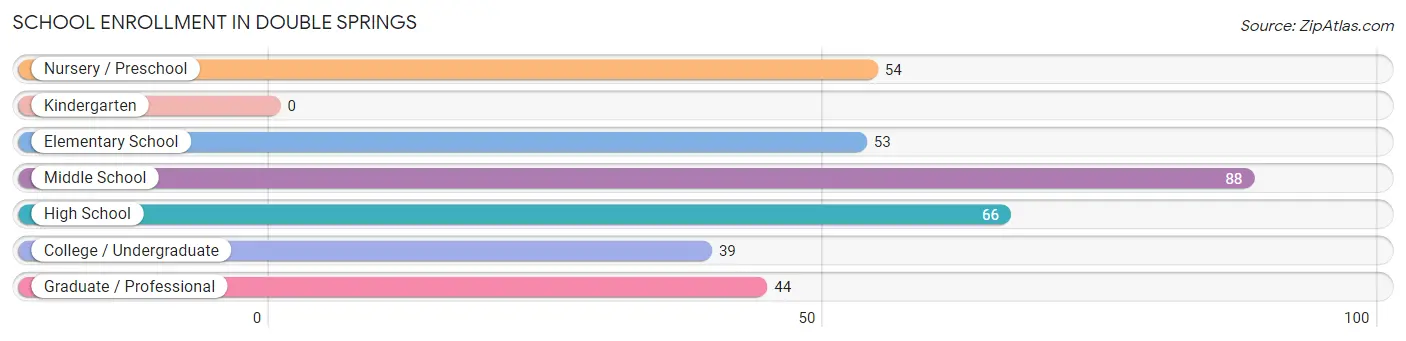
| School Level | # Students | % Students |
| Nursery / Preschool | 54 | 15.7% |
| Kindergarten | 0 | 0.0% |
| Elementary School | 53 | 15.4% |
| Middle School | 88 | 25.6% |
| High School | 66 | 19.2% |
| College / Undergraduate | 39 | 11.3% |
| Graduate / Professional | 44 | 12.8% |
| Total | 344 | 100.0% |
School Enrollment by Age by Funding Source in Double Springs
Out of a total of 344 students who are enrolled in schools in Double Springs, 46 (13.4%) attend a private institution, while the remaining 298 (86.6%) are enrolled in public schools. The age group of 25 to 34 year olds has the highest likelihood of being enrolled in private schools, with 12 (100.0% in the age bracket) enrolled. Conversely, the age group of 3 to 4 year olds has the lowest likelihood of being enrolled in a private school, with 54 (100.0% in the age bracket) attending a public institution.
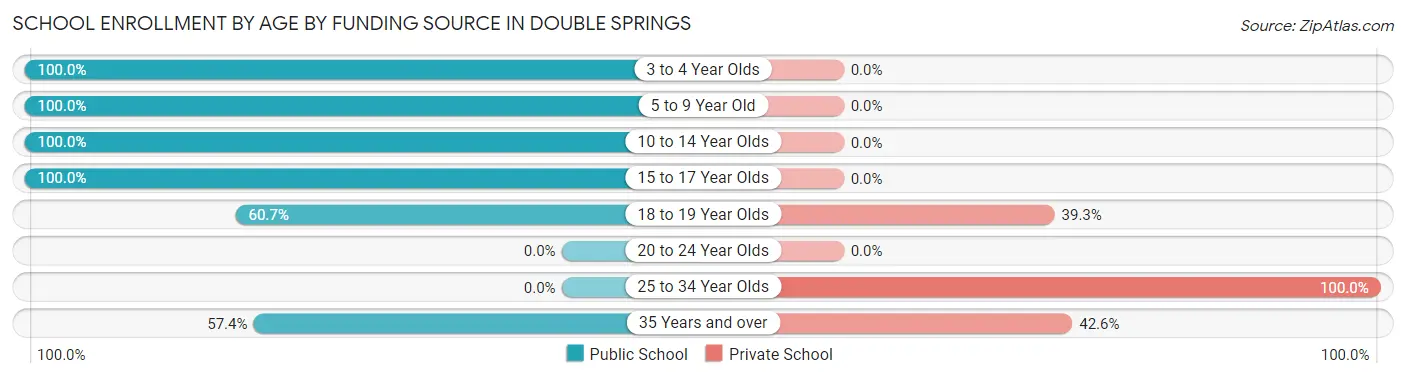
| Age Bracket | Public School | Private School |
| 3 to 4 Year Olds | 54 (100.0%) | 0 (0.0%) |
| 5 to 9 Year Old | 25 (100.0%) | 0 (0.0%) |
| 10 to 14 Year Olds | 122 (100.0%) | 0 (0.0%) |
| 15 to 17 Year Olds | 49 (100.0%) | 0 (0.0%) |
| 18 to 19 Year Olds | 17 (60.7%) | 11 (39.3%) |
| 20 to 24 Year Olds | 0 (0.0%) | 0 (0.0%) |
| 25 to 34 Year Olds | 0 (0.0%) | 12 (100.0%) |
| 35 Years and over | 31 (57.4%) | 23 (42.6%) |
| Total | 298 (86.6%) | 46 (13.4%) |
Educational Attainment by Field of Study in Double Springs
Education (52 | 30.9%), science & technology (45 | 26.8%), social sciences (19 | 11.3%), liberal arts & history (18 | 10.7%), and bio, nature & agricultural (11 | 6.6%) are the most common fields of study among 168 individuals in Double Springs who have obtained a bachelor's degree or higher.
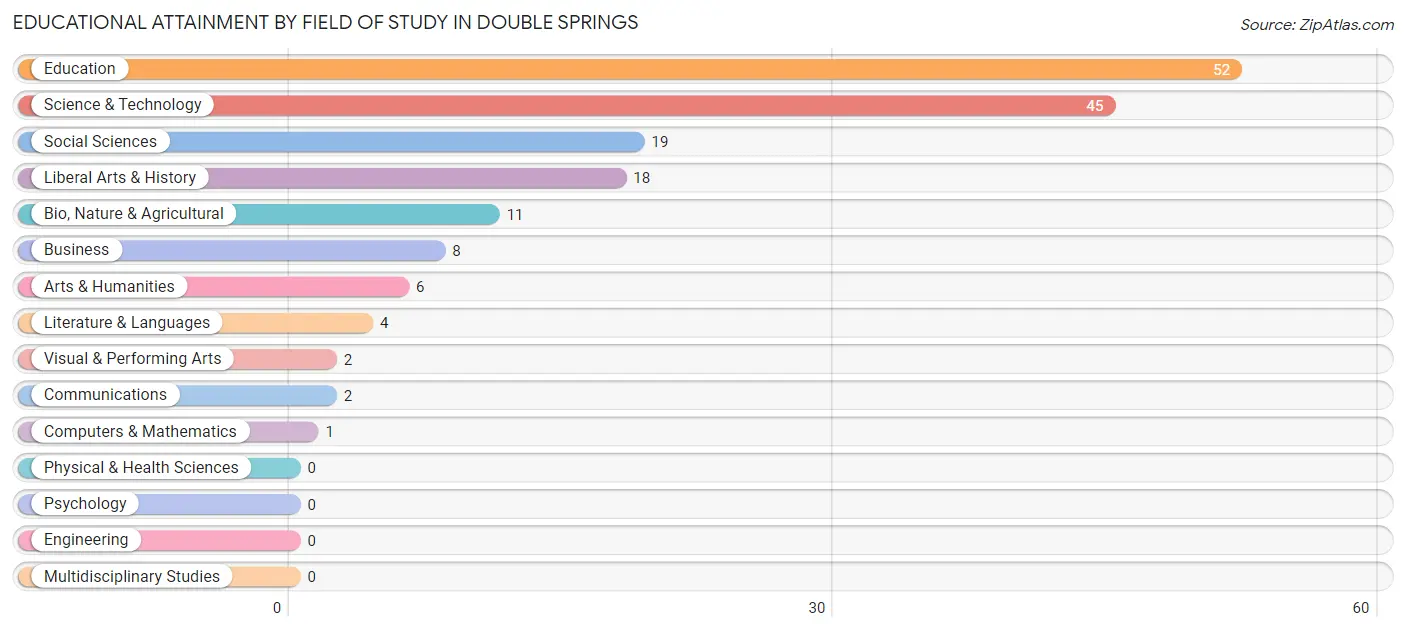
| Field of Study | # Graduates | % Graduates |
| Computers & Mathematics | 1 | 0.6% |
| Bio, Nature & Agricultural | 11 | 6.6% |
| Physical & Health Sciences | 0 | 0.0% |
| Psychology | 0 | 0.0% |
| Social Sciences | 19 | 11.3% |
| Engineering | 0 | 0.0% |
| Multidisciplinary Studies | 0 | 0.0% |
| Science & Technology | 45 | 26.8% |
| Business | 8 | 4.8% |
| Education | 52 | 30.9% |
| Literature & Languages | 4 | 2.4% |
| Liberal Arts & History | 18 | 10.7% |
| Visual & Performing Arts | 2 | 1.2% |
| Communications | 2 | 1.2% |
| Arts & Humanities | 6 | 3.6% |
| Total | 168 | 100.0% |
Transportation & Commute in Double Springs
Vehicle Availability by Sex in Double Springs
The most prevalent vehicle ownership categories in Double Springs are males with 2 vehicles (90, accounting for 34.5%) and females with 2 vehicles (95, making up 42.4%).
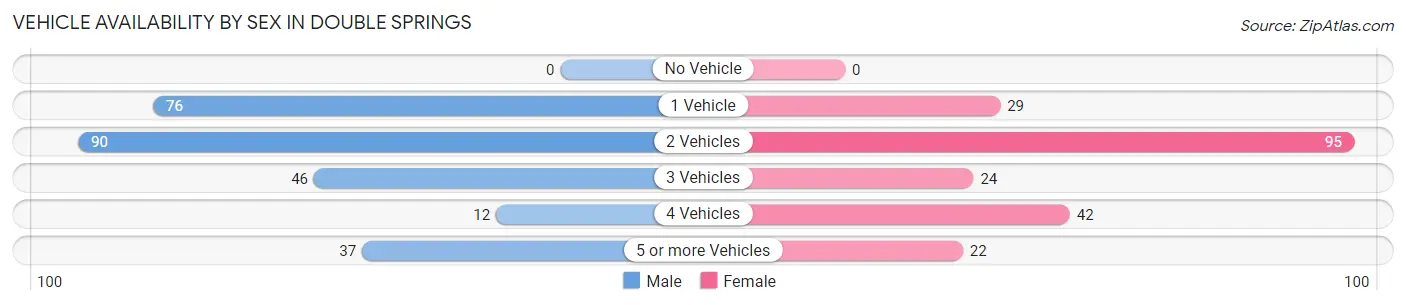
| Vehicles Available | Male | Female |
| No Vehicle | 0 (0.0%) | 0 (0.0%) |
| 1 Vehicle | 76 (29.1%) | 29 (13.7%) |
| 2 Vehicles | 90 (34.5%) | 95 (44.8%) |
| 3 Vehicles | 46 (17.6%) | 24 (11.3%) |
| 4 Vehicles | 12 (4.6%) | 42 (19.8%) |
| 5 or more Vehicles | 37 (14.2%) | 22 (10.4%) |
| Total | 261 (100.0%) | 212 (100.0%) |
Commute Time in Double Springs
The most frequently occuring commute durations in Double Springs are 5 to 9 minutes (91 commuters, 20.0%), 45 to 59 minutes (80 commuters, 17.5%), and less than 5 minutes (71 commuters, 15.6%).
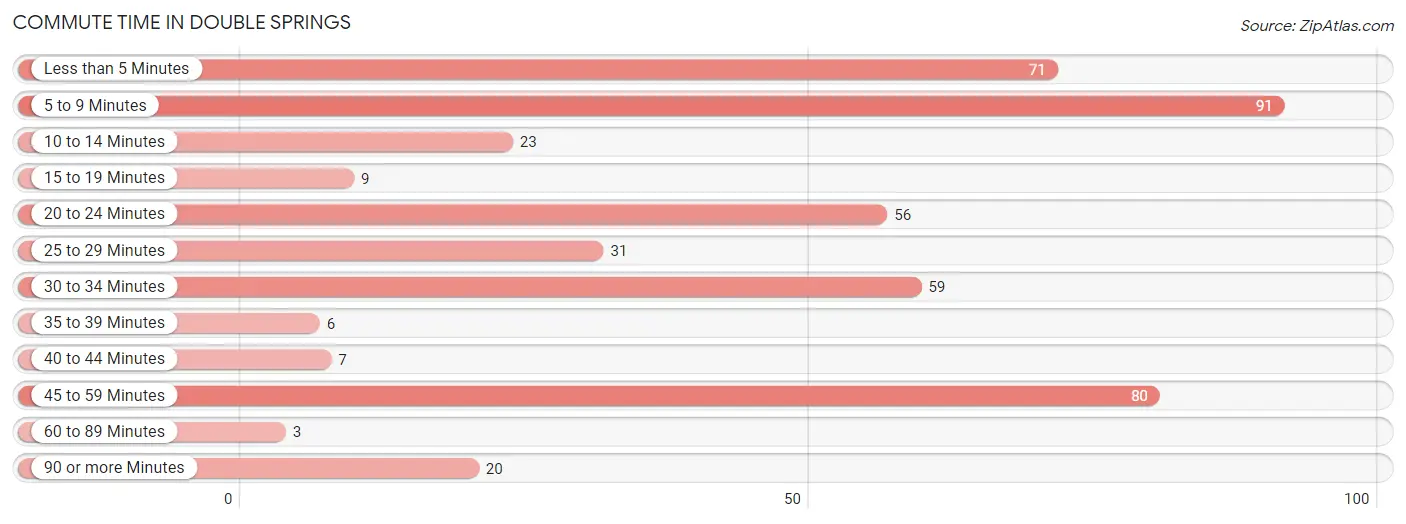
| Commute Time | # Commuters | % Commuters |
| Less than 5 Minutes | 71 | 15.6% |
| 5 to 9 Minutes | 91 | 20.0% |
| 10 to 14 Minutes | 23 | 5.0% |
| 15 to 19 Minutes | 9 | 2.0% |
| 20 to 24 Minutes | 56 | 12.3% |
| 25 to 29 Minutes | 31 | 6.8% |
| 30 to 34 Minutes | 59 | 12.9% |
| 35 to 39 Minutes | 6 | 1.3% |
| 40 to 44 Minutes | 7 | 1.5% |
| 45 to 59 Minutes | 80 | 17.5% |
| 60 to 89 Minutes | 3 | 0.7% |
| 90 or more Minutes | 20 | 4.4% |
Commute Time by Sex in Double Springs
The most common commute times in Double Springs are 45 to 59 minutes (68 commuters, 26.1%) for males and 5 to 9 minutes (53 commuters, 27.2%) for females.
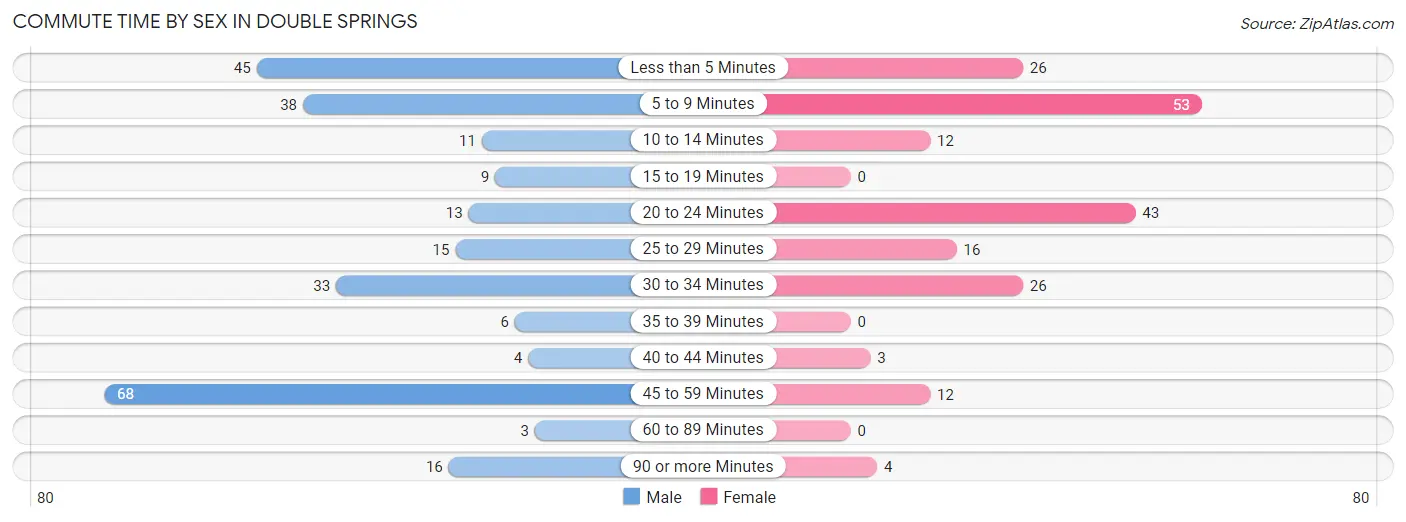
| Commute Time | Male | Female |
| Less than 5 Minutes | 45 (17.2%) | 26 (13.3%) |
| 5 to 9 Minutes | 38 (14.6%) | 53 (27.2%) |
| 10 to 14 Minutes | 11 (4.2%) | 12 (6.1%) |
| 15 to 19 Minutes | 9 (3.5%) | 0 (0.0%) |
| 20 to 24 Minutes | 13 (5.0%) | 43 (22.1%) |
| 25 to 29 Minutes | 15 (5.8%) | 16 (8.2%) |
| 30 to 34 Minutes | 33 (12.6%) | 26 (13.3%) |
| 35 to 39 Minutes | 6 (2.3%) | 0 (0.0%) |
| 40 to 44 Minutes | 4 (1.5%) | 3 (1.5%) |
| 45 to 59 Minutes | 68 (26.1%) | 12 (6.1%) |
| 60 to 89 Minutes | 3 (1.1%) | 0 (0.0%) |
| 90 or more Minutes | 16 (6.1%) | 4 (2.1%) |
Time of Departure to Work by Sex in Double Springs
The most frequent times of departure to work in Double Springs are 5:30 AM to 5:59 AM (60, 23.0%) for males and 7:00 AM to 7:29 AM (35, 17.9%) for females.
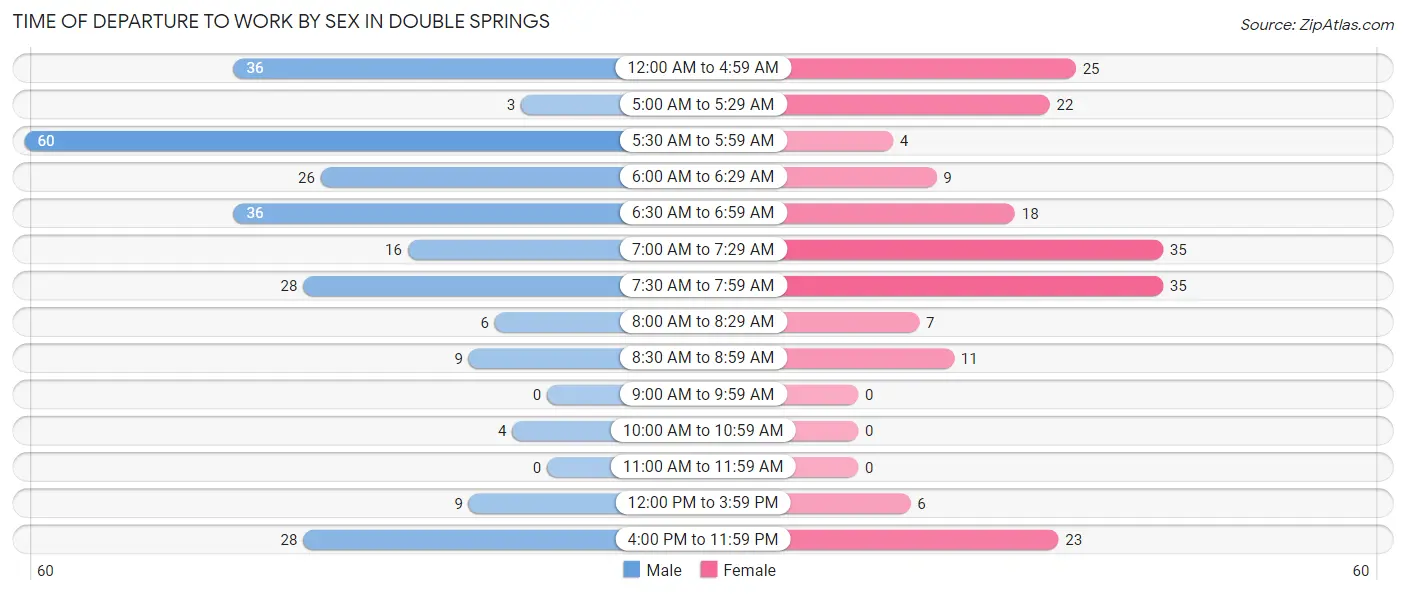
| Time of Departure | Male | Female |
| 12:00 AM to 4:59 AM | 36 (13.8%) | 25 (12.8%) |
| 5:00 AM to 5:29 AM | 3 (1.1%) | 22 (11.3%) |
| 5:30 AM to 5:59 AM | 60 (23.0%) | 4 (2.1%) |
| 6:00 AM to 6:29 AM | 26 (10.0%) | 9 (4.6%) |
| 6:30 AM to 6:59 AM | 36 (13.8%) | 18 (9.2%) |
| 7:00 AM to 7:29 AM | 16 (6.1%) | 35 (17.9%) |
| 7:30 AM to 7:59 AM | 28 (10.7%) | 35 (17.9%) |
| 8:00 AM to 8:29 AM | 6 (2.3%) | 7 (3.6%) |
| 8:30 AM to 8:59 AM | 9 (3.5%) | 11 (5.6%) |
| 9:00 AM to 9:59 AM | 0 (0.0%) | 0 (0.0%) |
| 10:00 AM to 10:59 AM | 4 (1.5%) | 0 (0.0%) |
| 11:00 AM to 11:59 AM | 0 (0.0%) | 0 (0.0%) |
| 12:00 PM to 3:59 PM | 9 (3.5%) | 6 (3.1%) |
| 4:00 PM to 11:59 PM | 28 (10.7%) | 23 (11.8%) |
| Total | 261 (100.0%) | 195 (100.0%) |
Housing Occupancy in Double Springs
Occupancy by Ownership in Double Springs
Of the total 503 dwellings in Double Springs, owner-occupied units account for 288 (57.3%), while renter-occupied units make up 215 (42.7%).
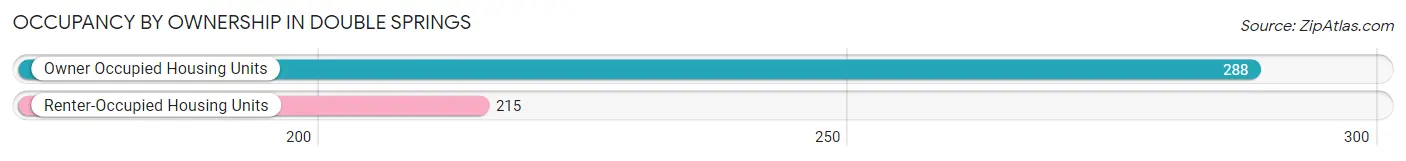
| Occupancy | # Housing Units | % Housing Units |
| Owner Occupied Housing Units | 288 | 57.3% |
| Renter-Occupied Housing Units | 215 | 42.7% |
| Total Occupied Housing Units | 503 | 100.0% |
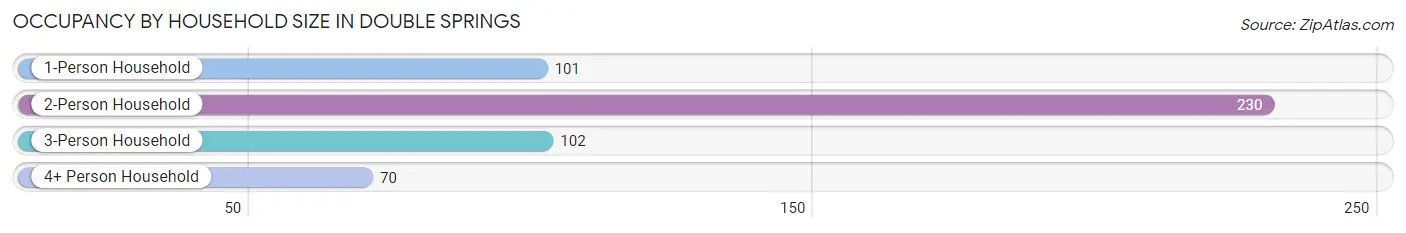
Occupancy by Household Size in Double Springs
| Household Size | # Housing Units | % Housing Units |
| 1-Person Household | 101 | 20.1% |
| 2-Person Household | 230 | 45.7% |
| 3-Person Household | 102 | 20.3% |
| 4+ Person Household | 70 | 13.9% |
| Total Housing Units | 503 | 100.0% |
Occupancy by Ownership by Household Size in Double Springs
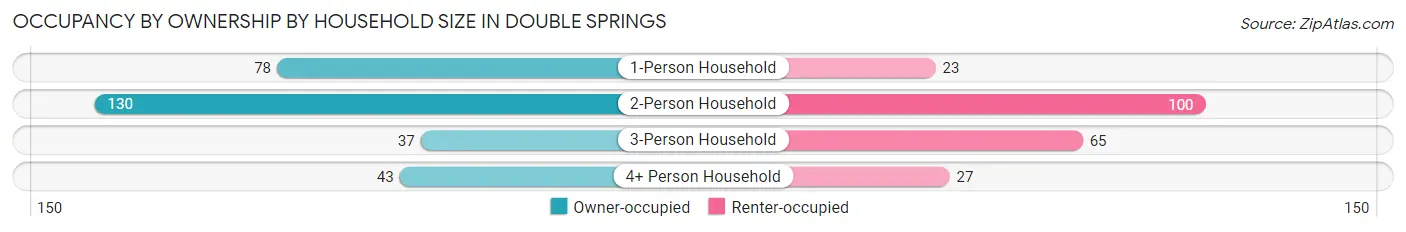
| Household Size | Owner-occupied | Renter-occupied |
| 1-Person Household | 78 (77.2%) | 23 (22.8%) |
| 2-Person Household | 130 (56.5%) | 100 (43.5%) |
| 3-Person Household | 37 (36.3%) | 65 (63.7%) |
| 4+ Person Household | 43 (61.4%) | 27 (38.6%) |
| Total Housing Units | 288 (57.3%) | 215 (42.7%) |
Occupancy by Educational Attainment in Double Springs
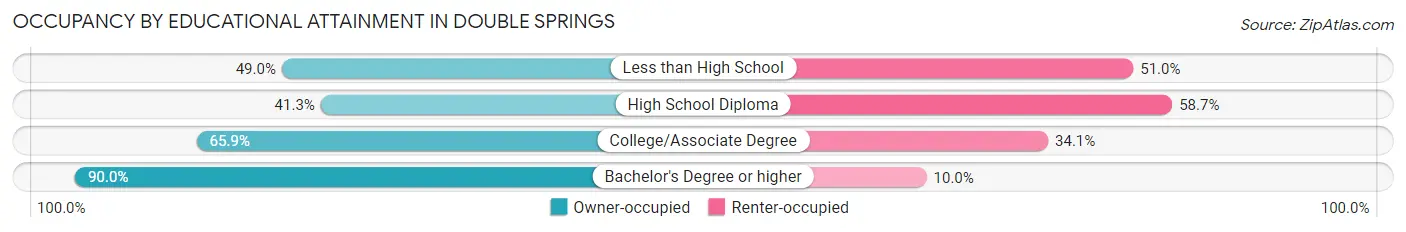
| Household Size | Owner-occupied | Renter-occupied |
| Less than High School | 25 (49.0%) | 26 (51.0%) |
| High School Diploma | 95 (41.3%) | 135 (58.7%) |
| College/Associate Degree | 87 (65.9%) | 45 (34.1%) |
| Bachelor's Degree or higher | 81 (90.0%) | 9 (10.0%) |
Occupancy by Age of Householder in Double Springs
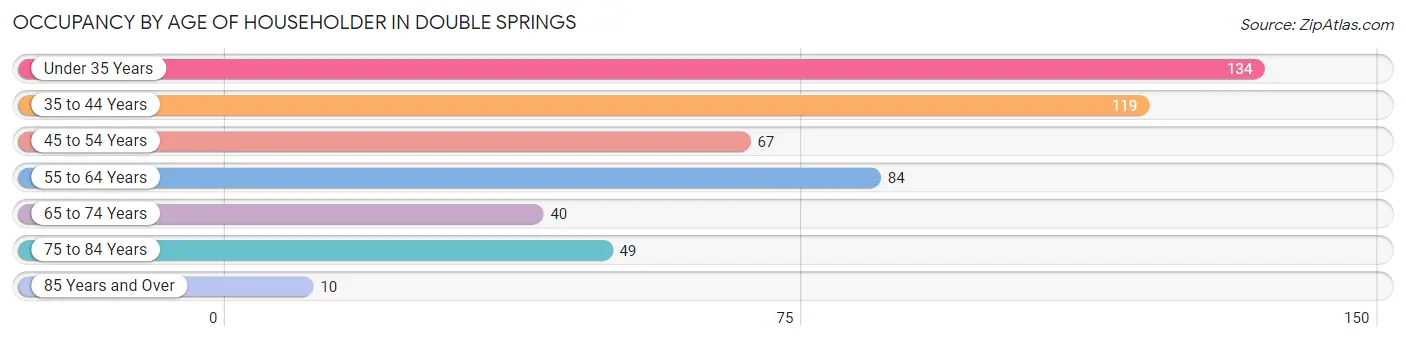
| Age Bracket | # Households | % Households |
| Under 35 Years | 134 | 26.6% |
| 35 to 44 Years | 119 | 23.7% |
| 45 to 54 Years | 67 | 13.3% |
| 55 to 64 Years | 84 | 16.7% |
| 65 to 74 Years | 40 | 8.0% |
| 75 to 84 Years | 49 | 9.7% |
| 85 Years and Over | 10 | 2.0% |
| Total | 503 | 100.0% |
Housing Finances in Double Springs
Median Income by Occupancy in Double Springs
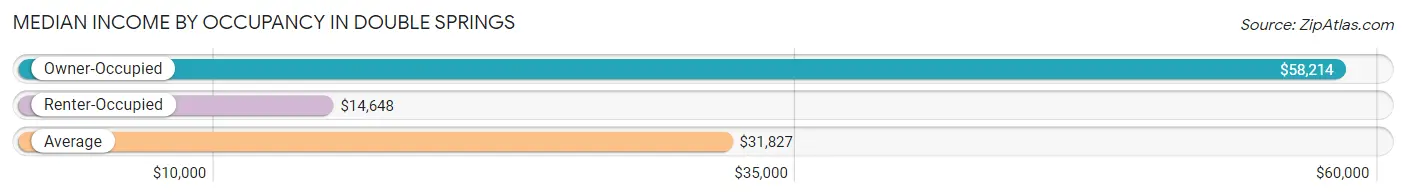
| Occupancy Type | # Households | Median Income |
| Owner-Occupied | 288 (57.3%) | $58,214 |
| Renter-Occupied | 215 (42.7%) | $14,648 |
| Average | 503 (100.0%) | $31,827 |
Occupancy by Householder Income Bracket in Double Springs
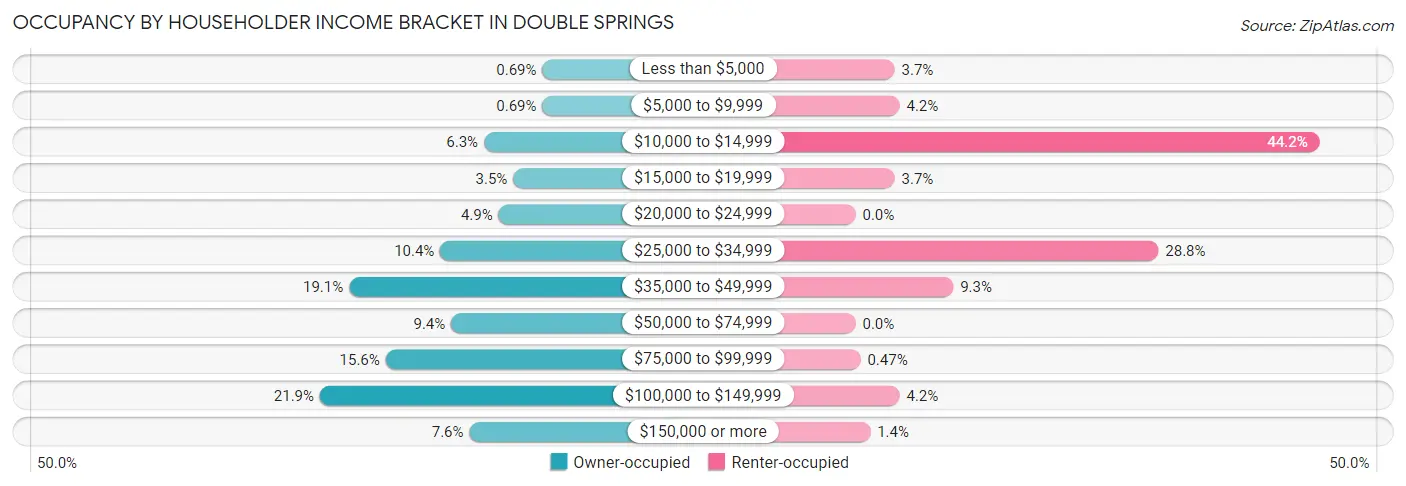
| Income Bracket | Owner-occupied | Renter-occupied |
| Less than $5,000 | 2 (0.7%) | 8 (3.7%) |
| $5,000 to $9,999 | 2 (0.7%) | 9 (4.2%) |
| $10,000 to $14,999 | 18 (6.2%) | 95 (44.2%) |
| $15,000 to $19,999 | 10 (3.5%) | 8 (3.7%) |
| $20,000 to $24,999 | 14 (4.9%) | 0 (0.0%) |
| $25,000 to $34,999 | 30 (10.4%) | 62 (28.8%) |
| $35,000 to $49,999 | 55 (19.1%) | 20 (9.3%) |
| $50,000 to $74,999 | 27 (9.4%) | 0 (0.0%) |
| $75,000 to $99,999 | 45 (15.6%) | 1 (0.5%) |
| $100,000 to $149,999 | 63 (21.9%) | 9 (4.2%) |
| $150,000 or more | 22 (7.6%) | 3 (1.4%) |
| Total | 288 (100.0%) | 215 (100.0%) |
Monthly Housing Cost Tiers in Double Springs
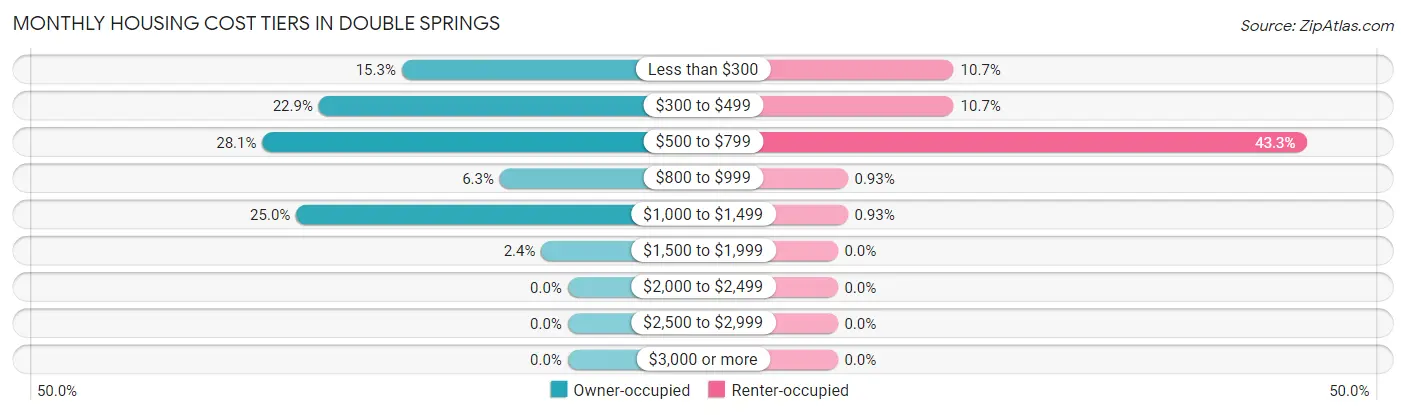
| Monthly Cost | Owner-occupied | Renter-occupied |
| Less than $300 | 44 (15.3%) | 23 (10.7%) |
| $300 to $499 | 66 (22.9%) | 23 (10.7%) |
| $500 to $799 | 81 (28.1%) | 93 (43.3%) |
| $800 to $999 | 18 (6.2%) | 2 (0.9%) |
| $1,000 to $1,499 | 72 (25.0%) | 2 (0.9%) |
| $1,500 to $1,999 | 7 (2.4%) | 0 (0.0%) |
| $2,000 to $2,499 | 0 (0.0%) | 0 (0.0%) |
| $2,500 to $2,999 | 0 (0.0%) | 0 (0.0%) |
| $3,000 or more | 0 (0.0%) | 0 (0.0%) |
| Total | 288 (100.0%) | 215 (100.0%) |
Physical Housing Characteristics in Double Springs
Housing Structures in Double Springs
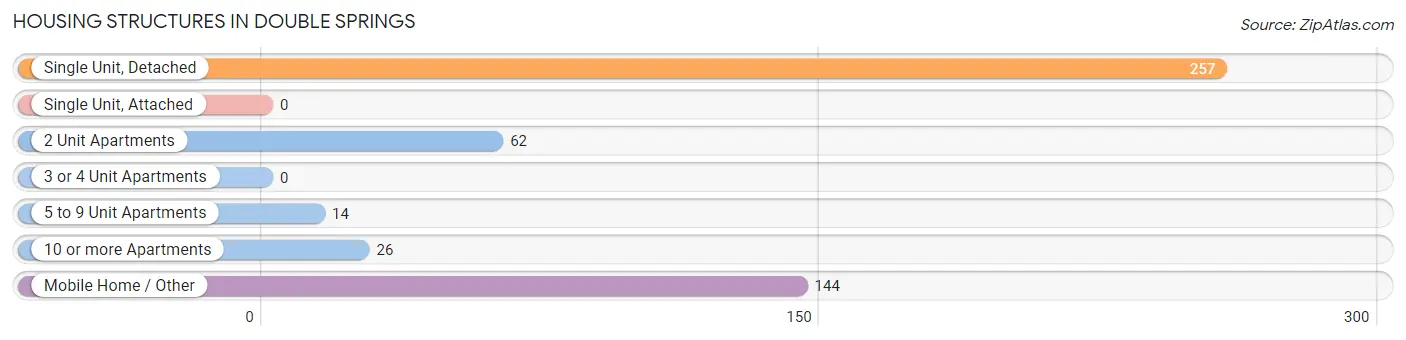
| Structure Type | # Housing Units | % Housing Units |
| Single Unit, Detached | 257 | 51.1% |
| Single Unit, Attached | 0 | 0.0% |
| 2 Unit Apartments | 62 | 12.3% |
| 3 or 4 Unit Apartments | 0 | 0.0% |
| 5 to 9 Unit Apartments | 14 | 2.8% |
| 10 or more Apartments | 26 | 5.2% |
| Mobile Home / Other | 144 | 28.6% |
| Total | 503 | 100.0% |
Housing Structures by Occupancy in Double Springs
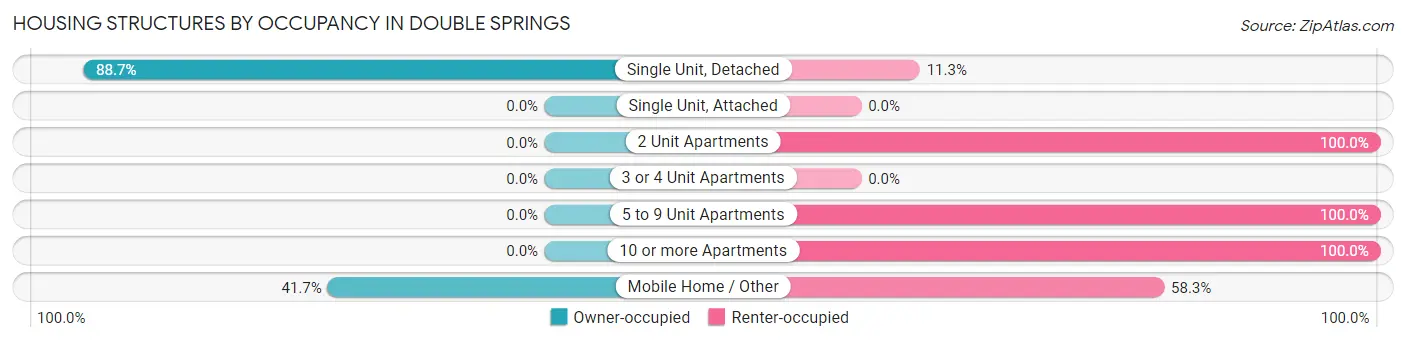
| Structure Type | Owner-occupied | Renter-occupied |
| Single Unit, Detached | 228 (88.7%) | 29 (11.3%) |
| Single Unit, Attached | 0 (0.0%) | 0 (0.0%) |
| 2 Unit Apartments | 0 (0.0%) | 62 (100.0%) |
| 3 or 4 Unit Apartments | 0 (0.0%) | 0 (0.0%) |
| 5 to 9 Unit Apartments | 0 (0.0%) | 14 (100.0%) |
| 10 or more Apartments | 0 (0.0%) | 26 (100.0%) |
| Mobile Home / Other | 60 (41.7%) | 84 (58.3%) |
| Total | 288 (57.3%) | 215 (42.7%) |
Housing Structures by Number of Rooms in Double Springs
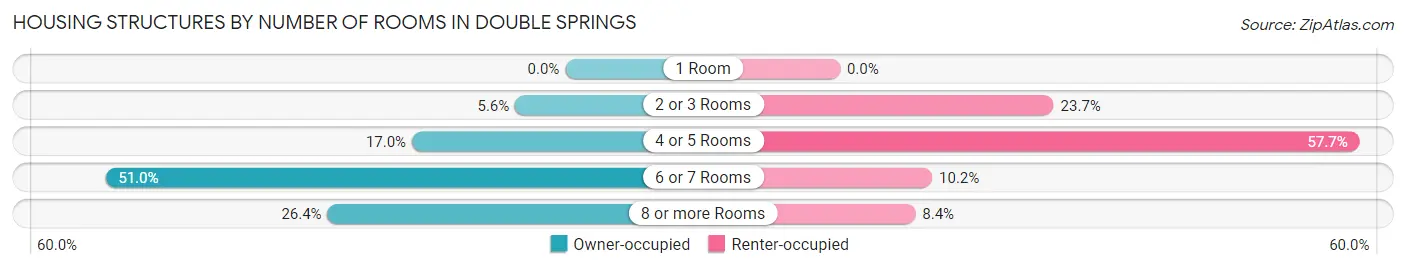
| Number of Rooms | Owner-occupied | Renter-occupied |
| 1 Room | 0 (0.0%) | 0 (0.0%) |
| 2 or 3 Rooms | 16 (5.6%) | 51 (23.7%) |
| 4 or 5 Rooms | 49 (17.0%) | 124 (57.7%) |
| 6 or 7 Rooms | 147 (51.0%) | 22 (10.2%) |
| 8 or more Rooms | 76 (26.4%) | 18 (8.4%) |
| Total | 288 (100.0%) | 215 (100.0%) |
Housing Structure by Heating Type in Double Springs
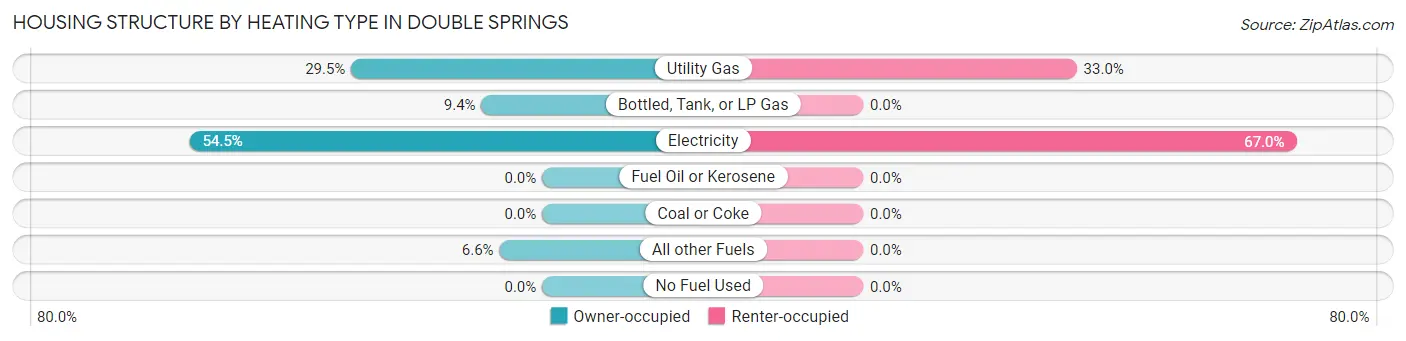
| Heating Type | Owner-occupied | Renter-occupied |
| Utility Gas | 85 (29.5%) | 71 (33.0%) |
| Bottled, Tank, or LP Gas | 27 (9.4%) | 0 (0.0%) |
| Electricity | 157 (54.5%) | 144 (67.0%) |
| Fuel Oil or Kerosene | 0 (0.0%) | 0 (0.0%) |
| Coal or Coke | 0 (0.0%) | 0 (0.0%) |
| All other Fuels | 19 (6.6%) | 0 (0.0%) |
| No Fuel Used | 0 (0.0%) | 0 (0.0%) |
| Total | 288 (100.0%) | 215 (100.0%) |
Household Vehicle Usage in Double Springs
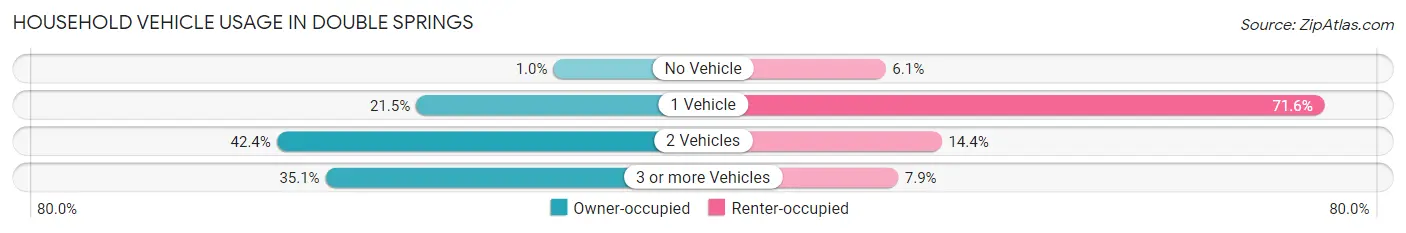
| Vehicles per Household | Owner-occupied | Renter-occupied |
| No Vehicle | 3 (1.0%) | 13 (6.0%) |
| 1 Vehicle | 62 (21.5%) | 154 (71.6%) |
| 2 Vehicles | 122 (42.4%) | 31 (14.4%) |
| 3 or more Vehicles | 101 (35.1%) | 17 (7.9%) |
| Total | 288 (100.0%) | 215 (100.0%) |
Real Estate & Mortgages in Double Springs
Real Estate and Mortgage Overview in Double Springs
| Characteristic | Without Mortgage | With Mortgage |
| Housing Units | 163 | 125 |
| Median Property Value | $122,800 | $116,300 |
| Median Household Income | $49,609 | $5 |
| Monthly Housing Costs | $408 | $0 |
| Real Estate Taxes | $420 | $15 |
Property Value by Mortgage Status in Double Springs
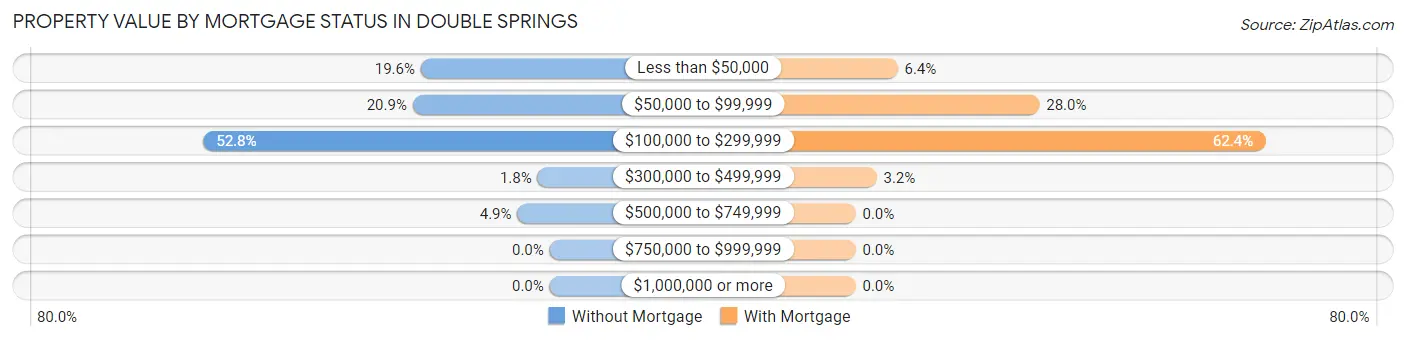
| Property Value | Without Mortgage | With Mortgage |
| Less than $50,000 | 32 (19.6%) | 8 (6.4%) |
| $50,000 to $99,999 | 34 (20.9%) | 35 (28.0%) |
| $100,000 to $299,999 | 86 (52.8%) | 78 (62.4%) |
| $300,000 to $499,999 | 3 (1.8%) | 4 (3.2%) |
| $500,000 to $749,999 | 8 (4.9%) | 0 (0.0%) |
| $750,000 to $999,999 | 0 (0.0%) | 0 (0.0%) |
| $1,000,000 or more | 0 (0.0%) | 0 (0.0%) |
| Total | 163 (100.0%) | 125 (100.0%) |
Household Income by Mortgage Status in Double Springs
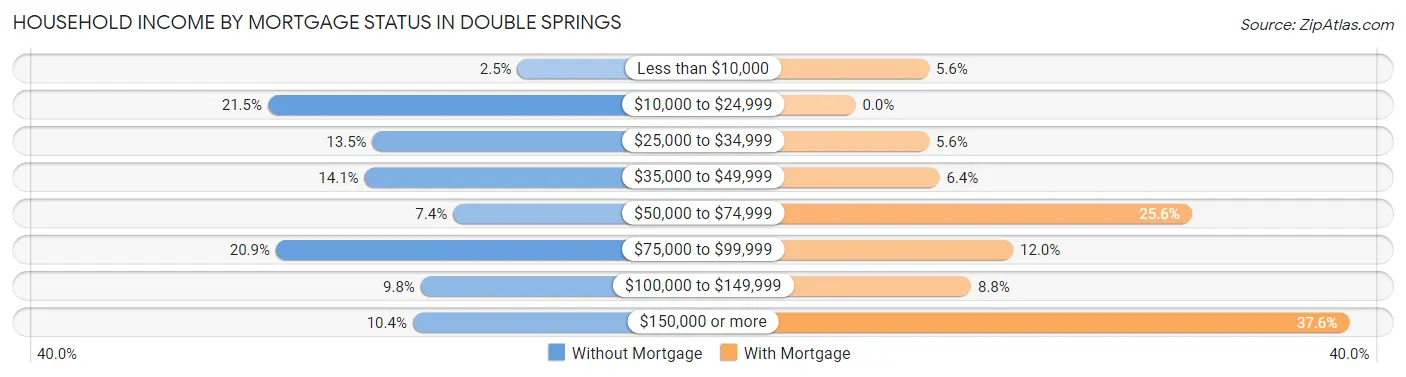
| Household Income | Without Mortgage | With Mortgage |
| Less than $10,000 | 4 (2.5%) | 7 (5.6%) |
| $10,000 to $24,999 | 35 (21.5%) | 0 (0.0%) |
| $25,000 to $34,999 | 22 (13.5%) | 7 (5.6%) |
| $35,000 to $49,999 | 23 (14.1%) | 8 (6.4%) |
| $50,000 to $74,999 | 12 (7.4%) | 32 (25.6%) |
| $75,000 to $99,999 | 34 (20.9%) | 15 (12.0%) |
| $100,000 to $149,999 | 16 (9.8%) | 11 (8.8%) |
| $150,000 or more | 17 (10.4%) | 47 (37.6%) |
| Total | 163 (100.0%) | 125 (100.0%) |
Property Value to Household Income Ratio in Double Springs
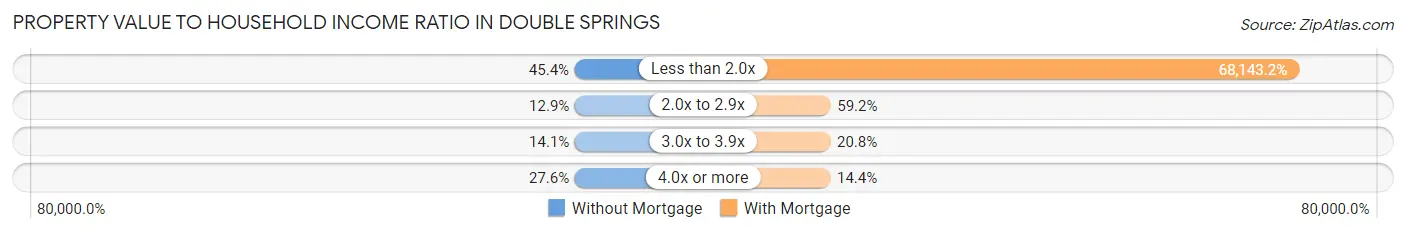
| Value-to-Income Ratio | Without Mortgage | With Mortgage |
| Less than 2.0x | 74 (45.4%) | 85,179 (68,143.2%) |
| 2.0x to 2.9x | 21 (12.9%) | 74 (59.2%) |
| 3.0x to 3.9x | 23 (14.1%) | 26 (20.8%) |
| 4.0x or more | 45 (27.6%) | 18 (14.4%) |
| Total | 163 (100.0%) | 125 (100.0%) |
Real Estate Taxes by Mortgage Status in Double Springs
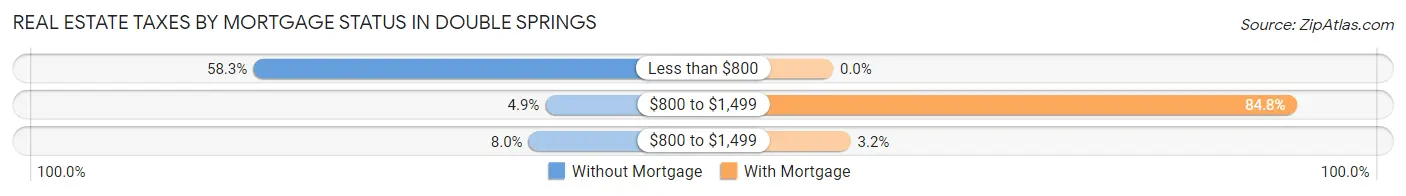
| Property Taxes | Without Mortgage | With Mortgage |
| Less than $800 | 95 (58.3%) | 0 (0.0%) |
| $800 to $1,499 | 8 (4.9%) | 106 (84.8%) |
| $800 to $1,499 | 13 (8.0%) | 4 (3.2%) |
| Total | 163 (100.0%) | 125 (100.0%) |
Health & Disability in Double Springs
Health Insurance Coverage by Age in Double Springs
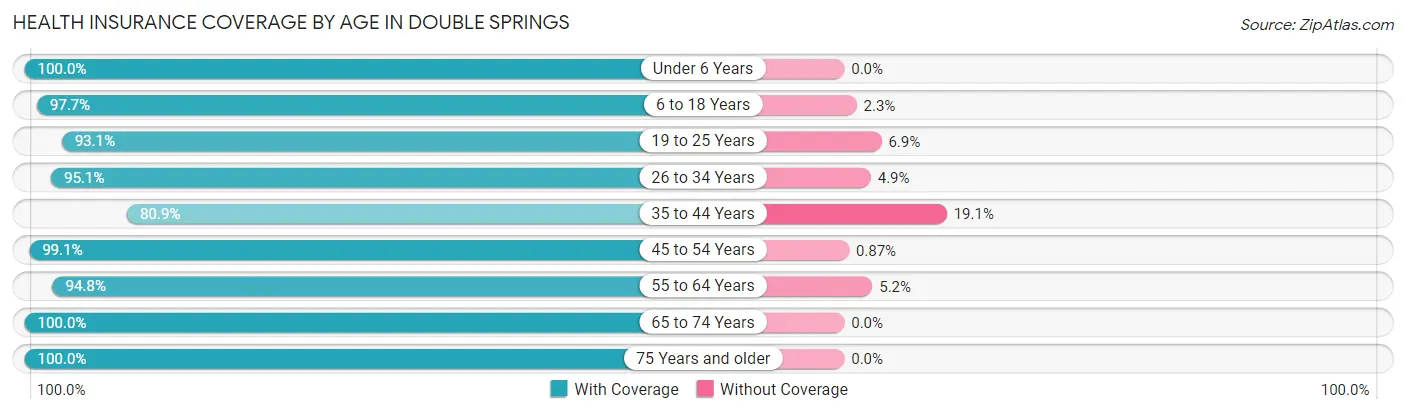
| Age Bracket | With Coverage | Without Coverage |
| Under 6 Years | 123 (100.0%) | 0 (0.0%) |
| 6 to 18 Years | 213 (97.7%) | 5 (2.3%) |
| 19 to 25 Years | 94 (93.1%) | 7 (6.9%) |
| 26 to 34 Years | 154 (95.1%) | 8 (4.9%) |
| 35 to 44 Years | 144 (80.9%) | 34 (19.1%) |
| 45 to 54 Years | 114 (99.1%) | 1 (0.9%) |
| 55 to 64 Years | 127 (94.8%) | 7 (5.2%) |
| 65 to 74 Years | 53 (100.0%) | 0 (0.0%) |
| 75 Years and older | 83 (100.0%) | 0 (0.0%) |
| Total | 1,105 (94.7%) | 62 (5.3%) |
Health Insurance Coverage by Citizenship Status in Double Springs
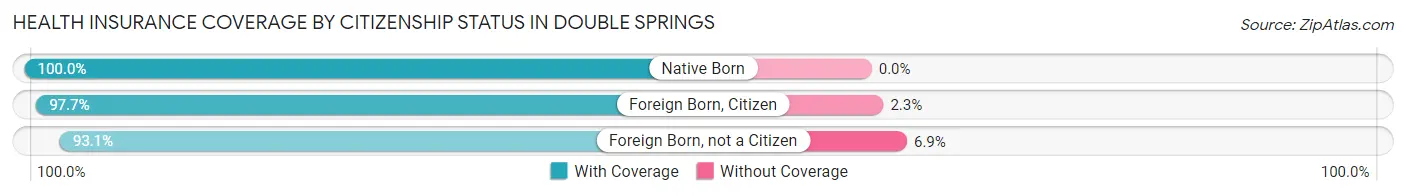
| Citizenship Status | With Coverage | Without Coverage |
| Native Born | 123 (100.0%) | 0 (0.0%) |
| Foreign Born, Citizen | 213 (97.7%) | 5 (2.3%) |
| Foreign Born, not a Citizen | 94 (93.1%) | 7 (6.9%) |
Health Insurance Coverage by Household Income in Double Springs
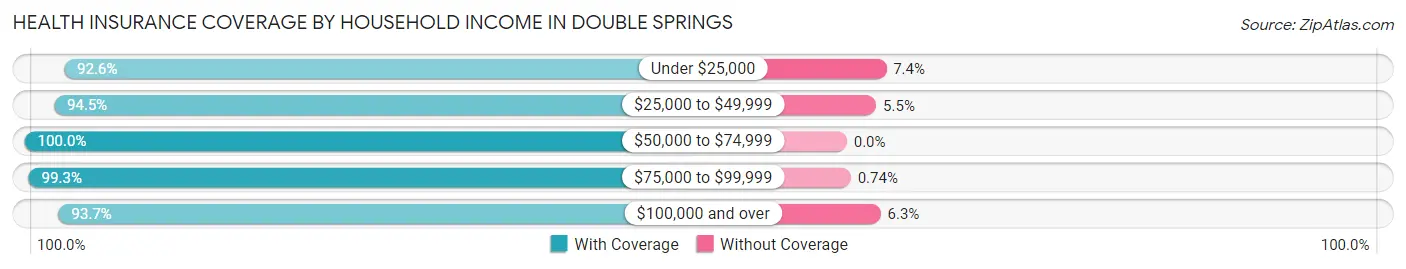
| Household Income | With Coverage | Without Coverage |
| Under $25,000 | 326 (92.6%) | 26 (7.4%) |
| $25,000 to $49,999 | 309 (94.5%) | 18 (5.5%) |
| $50,000 to $74,999 | 85 (100.0%) | 0 (0.0%) |
| $75,000 to $99,999 | 134 (99.3%) | 1 (0.7%) |
| $100,000 and over | 251 (93.7%) | 17 (6.3%) |
Public vs Private Health Insurance Coverage by Age in Double Springs
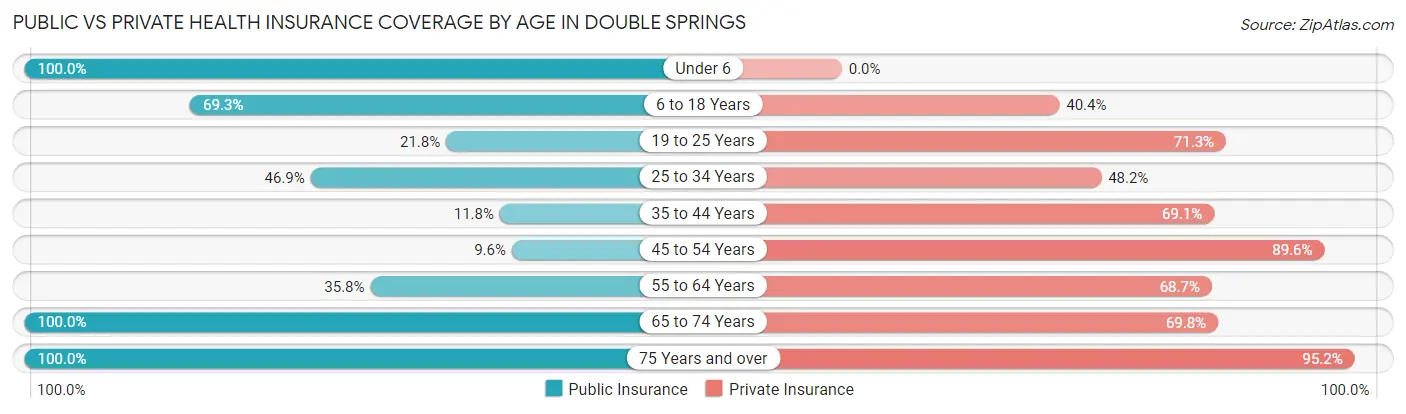
| Age Bracket | Public Insurance | Private Insurance |
| Under 6 | 123 (100.0%) | 0 (0.0%) |
| 6 to 18 Years | 151 (69.3%) | 88 (40.4%) |
| 19 to 25 Years | 22 (21.8%) | 72 (71.3%) |
| 25 to 34 Years | 76 (46.9%) | 78 (48.1%) |
| 35 to 44 Years | 21 (11.8%) | 123 (69.1%) |
| 45 to 54 Years | 11 (9.6%) | 103 (89.6%) |
| 55 to 64 Years | 48 (35.8%) | 92 (68.7%) |
| 65 to 74 Years | 53 (100.0%) | 37 (69.8%) |
| 75 Years and over | 83 (100.0%) | 79 (95.2%) |
| Total | 588 (50.4%) | 672 (57.6%) |
Disability Status by Sex by Age in Double Springs
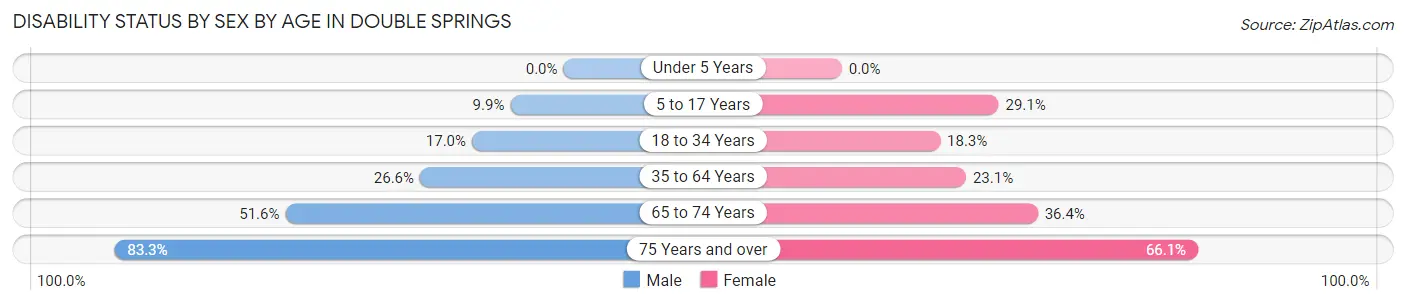
| Age Bracket | Male | Female |
| Under 5 Years | 0 (0.0%) | 0 (0.0%) |
| 5 to 17 Years | 7 (9.9%) | 39 (29.1%) |
| 18 to 34 Years | 27 (17.0%) | 23 (18.2%) |
| 35 to 64 Years | 49 (26.6%) | 56 (23.1%) |
| 65 to 74 Years | 16 (51.6%) | 8 (36.4%) |
| 75 Years and over | 20 (83.3%) | 39 (66.1%) |
Disability Class by Sex by Age in Double Springs
Disability Class: Hearing Difficulty
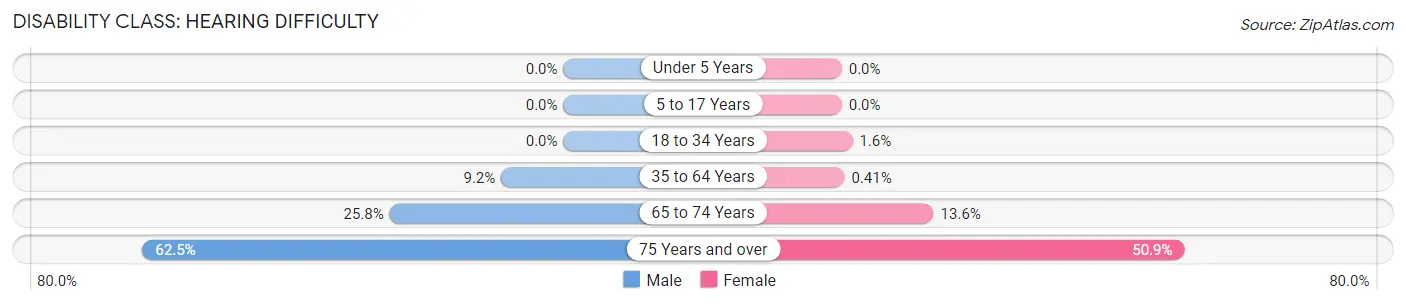
| Age Bracket | Male | Female |
| Under 5 Years | 0 (0.0%) | 0 (0.0%) |
| 5 to 17 Years | 0 (0.0%) | 0 (0.0%) |
| 18 to 34 Years | 0 (0.0%) | 2 (1.6%) |
| 35 to 64 Years | 17 (9.2%) | 1 (0.4%) |
| 65 to 74 Years | 8 (25.8%) | 3 (13.6%) |
| 75 Years and over | 15 (62.5%) | 30 (50.8%) |
Disability Class: Vision Difficulty
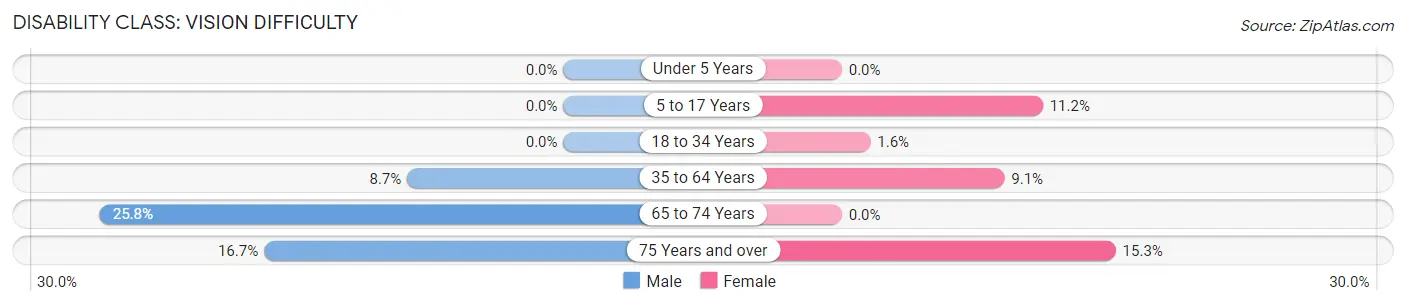
| Age Bracket | Male | Female |
| Under 5 Years | 0 (0.0%) | 0 (0.0%) |
| 5 to 17 Years | 0 (0.0%) | 15 (11.2%) |
| 18 to 34 Years | 0 (0.0%) | 2 (1.6%) |
| 35 to 64 Years | 16 (8.7%) | 22 (9.0%) |
| 65 to 74 Years | 8 (25.8%) | 0 (0.0%) |
| 75 Years and over | 4 (16.7%) | 9 (15.2%) |
Disability Class: Cognitive Difficulty
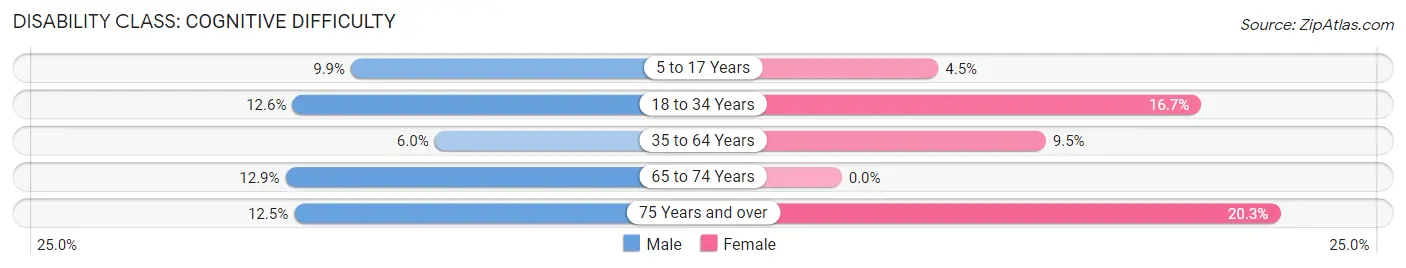
| Age Bracket | Male | Female |
| 5 to 17 Years | 7 (9.9%) | 6 (4.5%) |
| 18 to 34 Years | 20 (12.6%) | 21 (16.7%) |
| 35 to 64 Years | 11 (6.0%) | 23 (9.5%) |
| 65 to 74 Years | 4 (12.9%) | 0 (0.0%) |
| 75 Years and over | 3 (12.5%) | 12 (20.3%) |
Disability Class: Ambulatory Difficulty
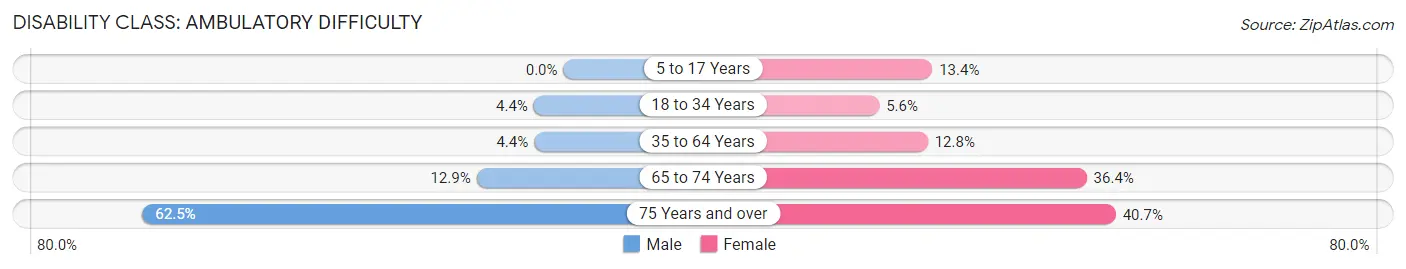
| Age Bracket | Male | Female |
| 5 to 17 Years | 0 (0.0%) | 18 (13.4%) |
| 18 to 34 Years | 7 (4.4%) | 7 (5.6%) |
| 35 to 64 Years | 8 (4.3%) | 31 (12.8%) |
| 65 to 74 Years | 4 (12.9%) | 8 (36.4%) |
| 75 Years and over | 15 (62.5%) | 24 (40.7%) |
Disability Class: Self-Care Difficulty
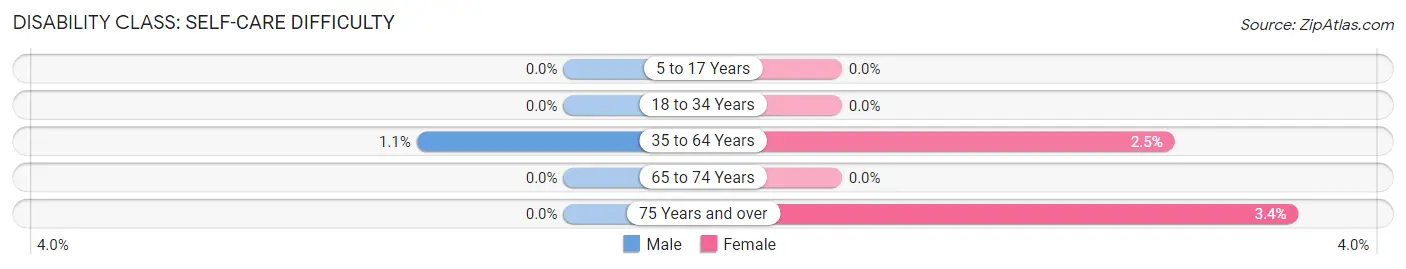
| Age Bracket | Male | Female |
| 5 to 17 Years | 0 (0.0%) | 0 (0.0%) |
| 18 to 34 Years | 0 (0.0%) | 0 (0.0%) |
| 35 to 64 Years | 2 (1.1%) | 6 (2.5%) |
| 65 to 74 Years | 0 (0.0%) | 0 (0.0%) |
| 75 Years and over | 0 (0.0%) | 2 (3.4%) |
Technology Access in Double Springs
Computing Device Access in Double Springs
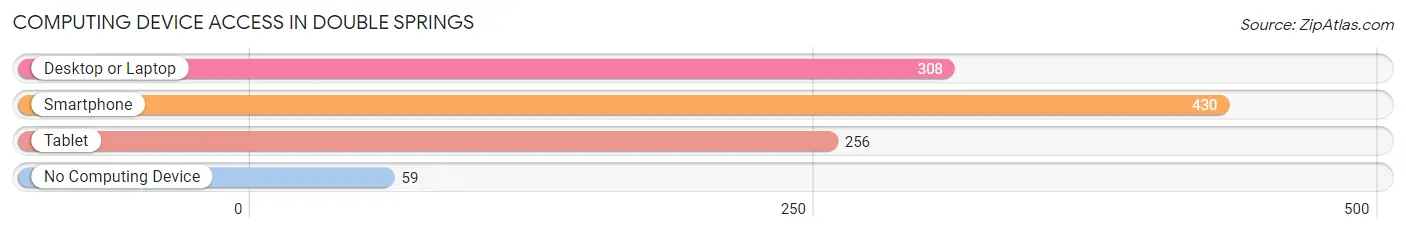
| Device Type | # Households | % Households |
| Desktop or Laptop | 308 | 61.2% |
| Smartphone | 430 | 85.5% |
| Tablet | 256 | 50.9% |
| No Computing Device | 59 | 11.7% |
| Total | 503 | 100.0% |
Internet Access in Double Springs
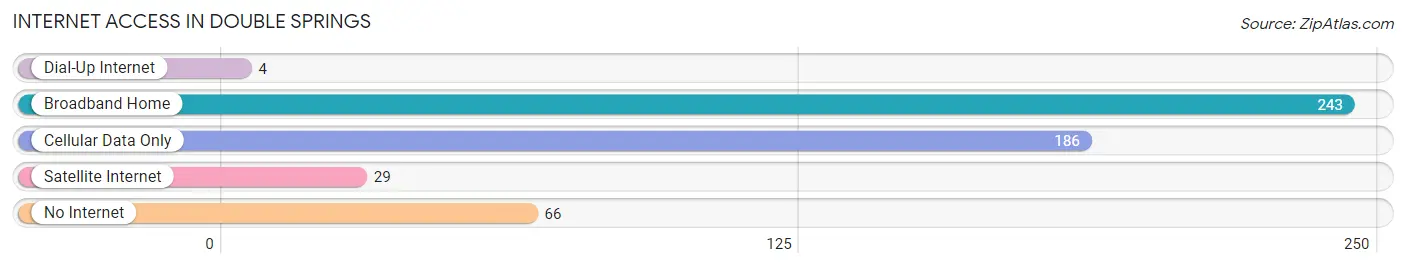
| Internet Type | # Households | % Households |
| Dial-Up Internet | 4 | 0.8% |
| Broadband Home | 243 | 48.3% |
| Cellular Data Only | 186 | 37.0% |
| Satellite Internet | 29 | 5.8% |
| No Internet | 66 | 13.1% |
| Total | 503 | 100.0% |
Double Springs Summary
History
Double Springs is a small town located in Winston County, Alabama. It is situated in the foothills of the Appalachian Mountains and is part of the Bankhead National Forest. The town was founded in 1820 and was originally known as “Double Springs Settlement”. The town was named after two natural springs that were located nearby. The springs were used by the local Native American tribes for centuries before the town was founded.
The town was originally settled by a group of settlers from North Carolina. The settlers were primarily farmers and the town quickly grew to become a thriving agricultural community. The town was also known for its timber industry, which was a major source of income for the town.
In the late 1800s, the town began to experience a period of growth and development. The town was incorporated in 1891 and the first mayor was elected in 1892. The town was also home to a number of businesses, including a cotton gin, a sawmill, and a gristmill.
The town experienced a period of decline in the early 1900s due to the Great Depression and the Dust Bowl. However, the town was able to recover and experienced a period of growth in the 1950s and 1960s. During this time, the town was home to a number of businesses, including a furniture factory, a canning factory, and a clothing factory.
Geography
Double Springs is located in the foothills of the Appalachian Mountains in Winston County, Alabama. The town is situated at the intersection of State Highway 195 and County Road 8. The town is located approximately 30 miles north of Birmingham and approximately 60 miles south of Huntsville.
The town is located in a hilly region and is surrounded by forests and rolling hills. The town is located near the Bankhead National Forest, which is a popular destination for outdoor activities such as camping, hiking, and fishing.
The town is located in a humid subtropical climate zone and experiences hot, humid summers and mild winters. The average annual temperature is around 70 degrees Fahrenheit and the average annual precipitation is around 50 inches.
Economy
The economy of Double Springs is primarily based on agriculture and forestry. The town is home to a number of farms that produce a variety of crops, including corn, soybeans, cotton, and hay. The town is also home to a number of timber companies that harvest timber from the surrounding forests.
The town is also home to a number of small businesses, including restaurants, retail stores, and service providers. The town is also home to a number of manufacturing companies, including a furniture factory, a canning factory, and a clothing factory.
Demographics
As of the 2010 census, the population of Double Springs was 1,845. The population is primarily white (94.3%) and African American (4.7%). The median household income is $31,250 and the median home value is $87,500. The town has a poverty rate of 22.3%.
Conclusion
Double Springs is a small town located in Winston County, Alabama. The town was founded in 1820 and was originally known as “Double Springs Settlement”. The town is situated in the foothills of the Appalachian Mountains and is part of the Bankhead National Forest. The town’s economy is primarily based on agriculture and forestry and the town is home to a number of small businesses. The population of Double Springs is primarily white (94.3%) and African American (4.7%). The median household income is $31,250 and the median home value is $87,500.
Common Questions
What is Per Capita Income in Double Springs?
Per Capita income in Double Springs is $21,489.
What is the Median Family Income in Double Springs?
Median Family Income in Double Springs is $39,000.
What is the Median Household income in Double Springs?
Median Household Income in Double Springs is $31,827.
What is Income or Wage Gap in Double Springs?
Income or Wage Gap in Double Springs is 17.9%.
Women in Double Springs earn 82.1 cents for every dollar earned by a man.
What is Family Income Deficit in Double Springs?
Family Income Deficit in Double Springs is $14,410.
Families that are below poverty line in Double Springs earn $14,410 less on average than the poverty threshold level.
What is Inequality or Gini Index in Double Springs?
Inequality or Gini Index in Double Springs is 0.47.
What is the Total Population of Double Springs?
Total Population of Double Springs is 1,361.
What is the Total Male Population of Double Springs?
Total Male Population of Double Springs is 657.
What is the Total Female Population of Double Springs?
Total Female Population of Double Springs is 704.
What is the Ratio of Males per 100 Females in Double Springs?
There are 93.32 Males per 100 Females in Double Springs.
What is the Ratio of Females per 100 Males in Double Springs?
There are 107.15 Females per 100 Males in Double Springs.
What is the Median Population Age in Double Springs?
Median Population Age in Double Springs is 36.8 Years.
What is the Average Family Size in Double Springs
Average Family Size in Double Springs is 2.5 People.
What is the Average Household Size in Double Springs
Average Household Size in Double Springs is 2.3 People.
How Large is the Labor Force in Double Springs?
There are 535 People in the Labor Forcein in Double Springs.
What is the Percentage of People in the Labor Force in Double Springs?
49.3% of People are in the Labor Force in Double Springs.
What is the Unemployment Rate in Double Springs?
Unemployment Rate in Double Springs is 11.6%.