Cedar Bluff, AL Map & Demographics
Cedar Bluff Map
Cedar Bluff Overview
$24,334
PER CAPITA INCOME
$61,957
AVG FAMILY INCOME
$45,861
AVG HOUSEHOLD INCOME
47.8%
WAGE / INCOME GAP [ % ]
52.2¢/ $1
WAGE / INCOME GAP [ $ ]
0.43
INEQUALITY / GINI INDEX
1,672
TOTAL POPULATION
805
MALE POPULATION
867
FEMALE POPULATION
92.85
MALES / 100 FEMALES
107.70
FEMALES / 100 MALES
45.3
MEDIAN AGE
3.2
AVG FAMILY SIZE
2.5
AVG HOUSEHOLD SIZE
583
LABOR FORCE [ PEOPLE ]
43.3%
PERCENT IN LABOR FORCE
10.1%
UNEMPLOYMENT RATE
Cedar Bluff Zip Codes
Cedar Bluff Area Codes
Income in Cedar Bluff
Income Overview in Cedar Bluff
Per Capita Income in Cedar Bluff is $24,334, while median incomes of families and households are $61,957 and $45,861 respectively.
| Characteristic | Number | Measure |
| Per Capita Income | 1,672 | $24,334 |
| Median Family Income | 430 | $61,957 |
| Mean Family Income | 430 | $70,762 |
| Median Household Income | 675 | $45,861 |
| Mean Household Income | 675 | $57,298 |
| Income Deficit | 430 | $0 |
| Wage / Income Gap (%) | 1,672 | 47.78% |
| Wage / Income Gap ($) | 1,672 | 52.22¢ per $1 |
| Gini / Inequality Index | 1,672 | 0.43 |
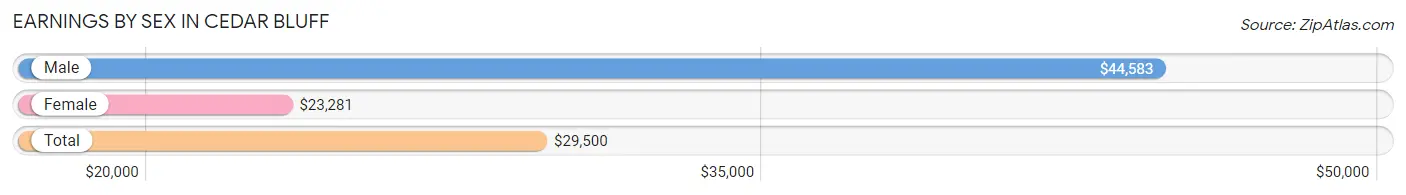
Earnings by Sex in Cedar Bluff
Average Earnings in Cedar Bluff are $29,500, $44,583 for men and $23,281 for women, a difference of 47.8%.
| Sex | Number | Average Earnings |
| Male | 295 (51.9%) | $44,583 |
| Female | 273 (48.1%) | $23,281 |
| Total | 568 (100.0%) | $29,500 |
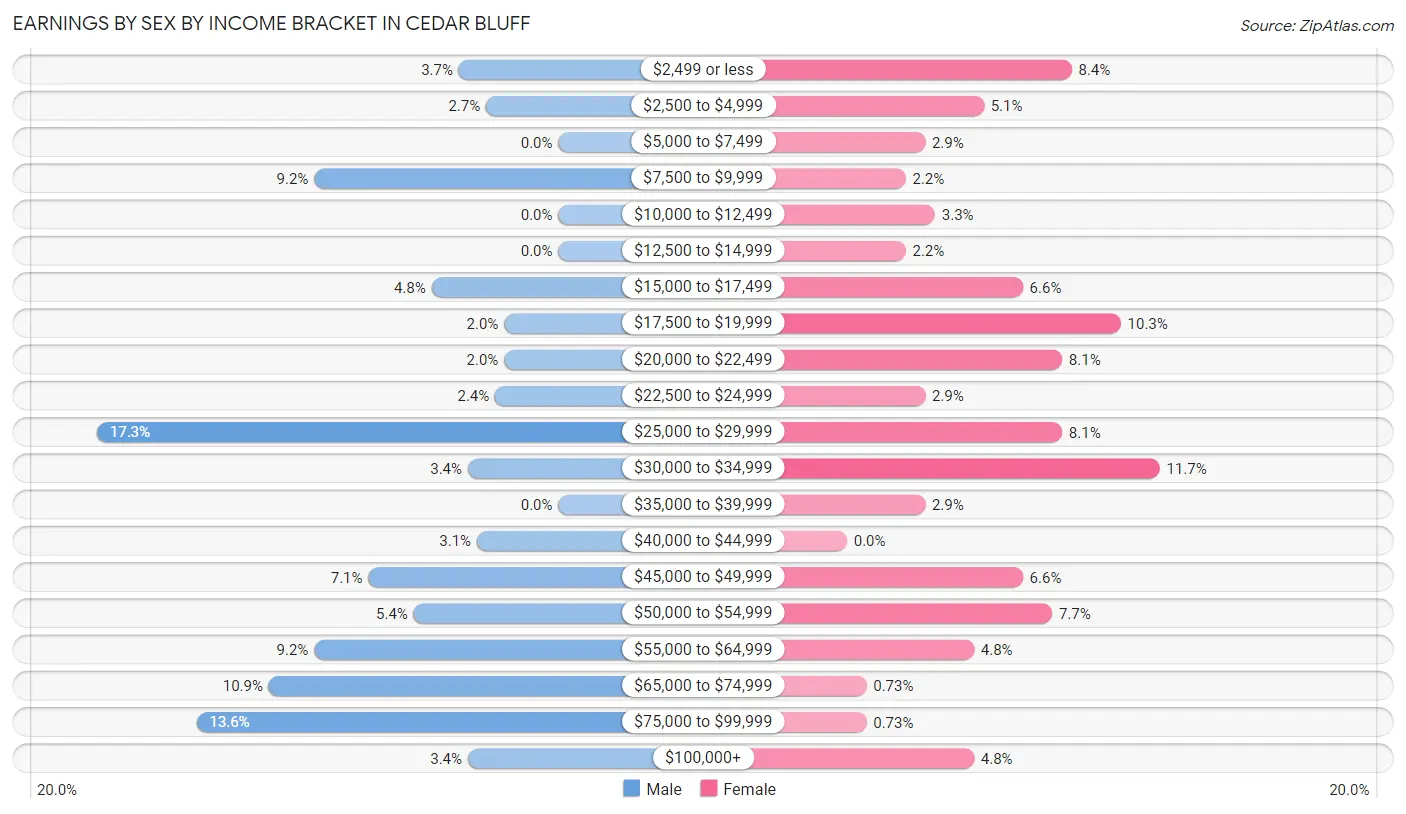
Earnings by Sex by Income Bracket in Cedar Bluff
The most common earnings brackets in Cedar Bluff are $25,000 to $29,999 for men (51 | 17.3%) and $30,000 to $34,999 for women (32 | 11.7%).
| Income | Male | Female |
| $2,499 or less | 11 (3.7%) | 23 (8.4%) |
| $2,500 to $4,999 | 8 (2.7%) | 14 (5.1%) |
| $5,000 to $7,499 | 0 (0.0%) | 8 (2.9%) |
| $7,500 to $9,999 | 27 (9.1%) | 6 (2.2%) |
| $10,000 to $12,499 | 0 (0.0%) | 9 (3.3%) |
| $12,500 to $14,999 | 0 (0.0%) | 6 (2.2%) |
| $15,000 to $17,499 | 14 (4.8%) | 18 (6.6%) |
| $17,500 to $19,999 | 6 (2.0%) | 28 (10.3%) |
| $20,000 to $22,499 | 6 (2.0%) | 22 (8.1%) |
| $22,500 to $24,999 | 7 (2.4%) | 8 (2.9%) |
| $25,000 to $29,999 | 51 (17.3%) | 22 (8.1%) |
| $30,000 to $34,999 | 10 (3.4%) | 32 (11.7%) |
| $35,000 to $39,999 | 0 (0.0%) | 8 (2.9%) |
| $40,000 to $44,999 | 9 (3.0%) | 0 (0.0%) |
| $45,000 to $49,999 | 21 (7.1%) | 18 (6.6%) |
| $50,000 to $54,999 | 16 (5.4%) | 21 (7.7%) |
| $55,000 to $64,999 | 27 (9.1%) | 13 (4.8%) |
| $65,000 to $74,999 | 32 (10.8%) | 2 (0.7%) |
| $75,000 to $99,999 | 40 (13.6%) | 2 (0.7%) |
| $100,000+ | 10 (3.4%) | 13 (4.8%) |
| Total | 295 (100.0%) | 273 (100.0%) |
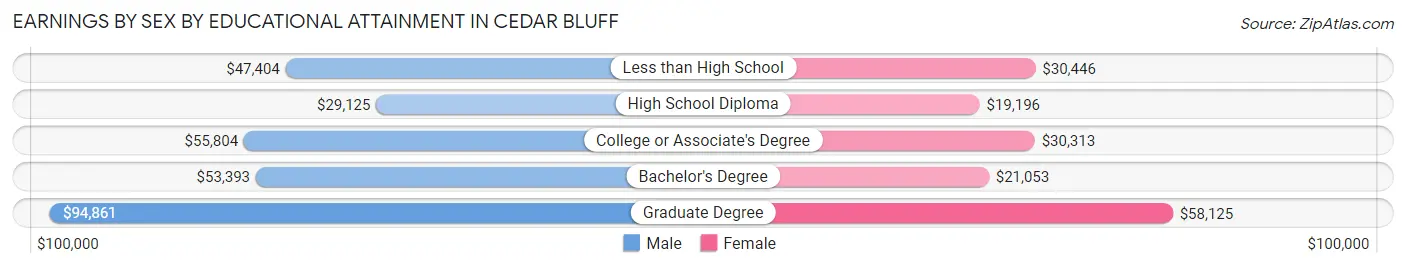
Earnings by Sex by Educational Attainment in Cedar Bluff
Average earnings in Cedar Bluff are $53,068 for men and $27,344 for women, a difference of 48.5%. Men with an educational attainment of graduate degree enjoy the highest average annual earnings of $94,861, while those with high school diploma education earn the least with $29,125. Women with an educational attainment of graduate degree earn the most with the average annual earnings of $58,125, while those with high school diploma education have the smallest earnings of $19,196.
| Educational Attainment | Male Income | Female Income |
| Less than High School | $47,404 | $30,446 |
| High School Diploma | $29,125 | $19,196 |
| College or Associate's Degree | $55,804 | $30,313 |
| Bachelor's Degree | $53,393 | $21,053 |
| Graduate Degree | $94,861 | $58,125 |
| Total | $53,068 | $27,344 |
Family Income in Cedar Bluff
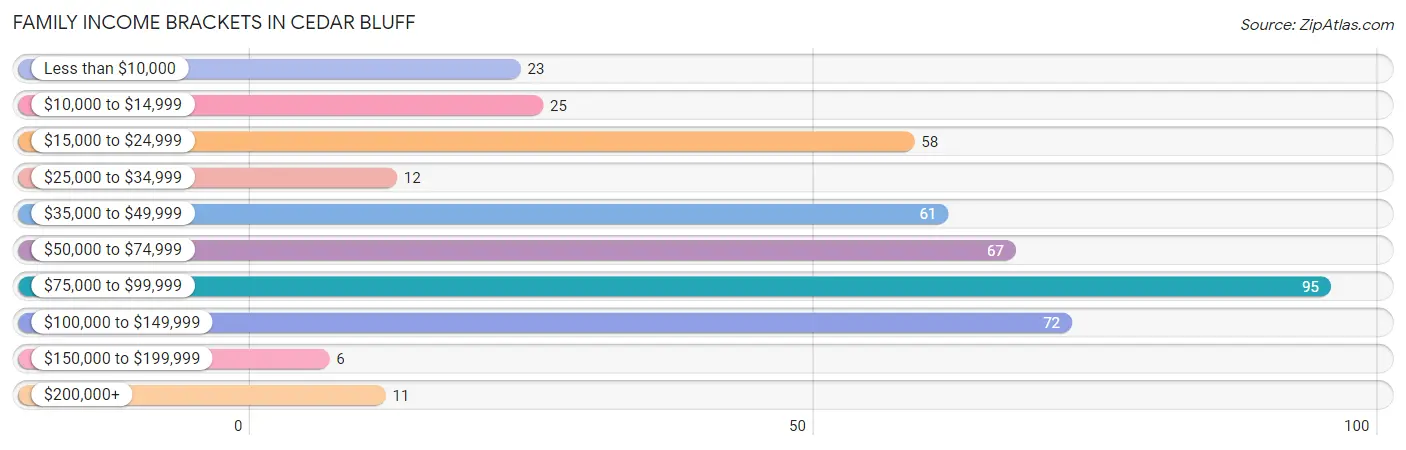
Family Income Brackets in Cedar Bluff
According to the Cedar Bluff family income data, there are 95 families falling into the $75,000 to $99,999 income range, which is the most common income bracket and makes up 22.1% of all families. Conversely, the $150,000 to $199,999 income bracket is the least frequent group with only 6 families (1.4%) belonging to this category.
| Income Bracket | # Families | % Families |
| Less than $10,000 | 23 | 5.3% |
| $10,000 to $14,999 | 25 | 5.8% |
| $15,000 to $24,999 | 58 | 13.5% |
| $25,000 to $34,999 | 12 | 2.8% |
| $35,000 to $49,999 | 61 | 14.2% |
| $50,000 to $74,999 | 67 | 15.6% |
| $75,000 to $99,999 | 95 | 22.1% |
| $100,000 to $149,999 | 72 | 16.7% |
| $150,000 to $199,999 | 6 | 1.4% |
| $200,000+ | 11 | 2.6% |
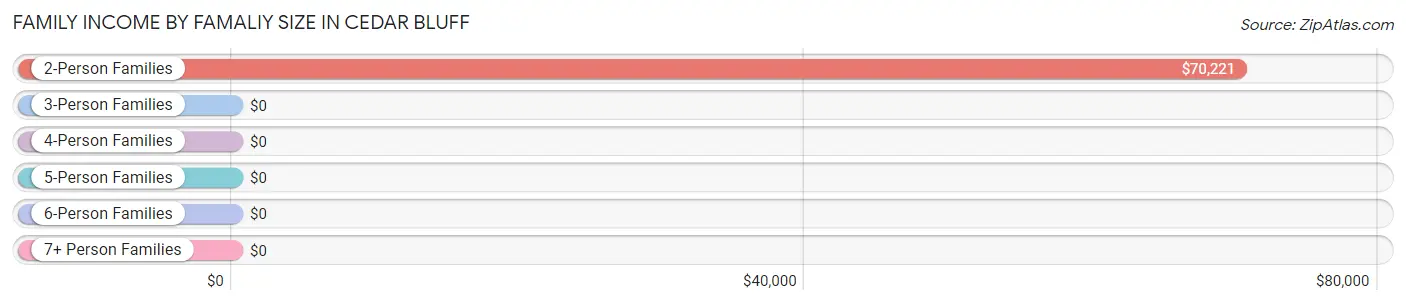
Family Income by Famaliy Size in Cedar Bluff
2-person families (261 | 60.7%) account for the highest median family income in Cedar Bluff with $70,221 per family, while 2-person families (261 | 60.7%) have the highest median income of $35,110 per family member.
| Income Bracket | # Families | Median Income |
| 2-Person Families | 261 (60.7%) | $70,221 |
| 3-Person Families | 102 (23.7%) | $0 |
| 4-Person Families | 34 (7.9%) | $0 |
| 5-Person Families | 25 (5.8%) | $0 |
| 6-Person Families | 8 (1.9%) | $0 |
| 7+ Person Families | 0 (0.0%) | $0 |
| Total | 430 (100.0%) | $61,957 |
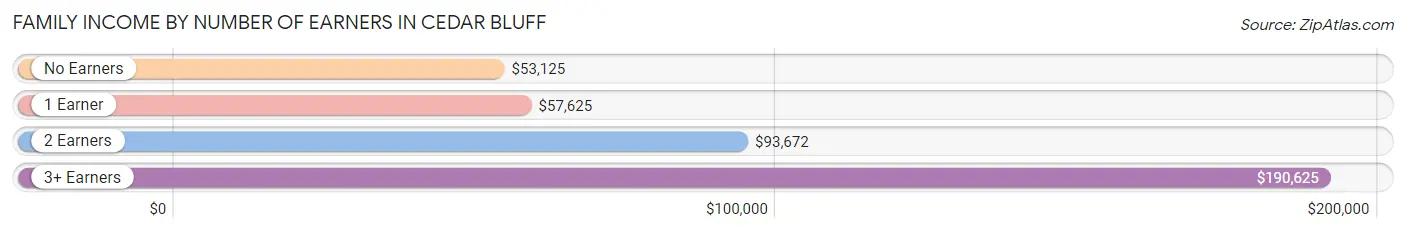
Family Income by Number of Earners in Cedar Bluff
The median family income in Cedar Bluff is $61,957, with families comprising 3+ earners (15) having the highest median family income of $190,625, while families with no earners (163) have the lowest median family income of $53,125, accounting for 3.5% and 37.9% of families, respectively.
| Number of Earners | # Families | Median Income |
| No Earners | 163 (37.9%) | $53,125 |
| 1 Earner | 167 (38.8%) | $57,625 |
| 2 Earners | 85 (19.8%) | $93,672 |
| 3+ Earners | 15 (3.5%) | $190,625 |
| Total | 430 (100.0%) | $61,957 |
Household Income in Cedar Bluff
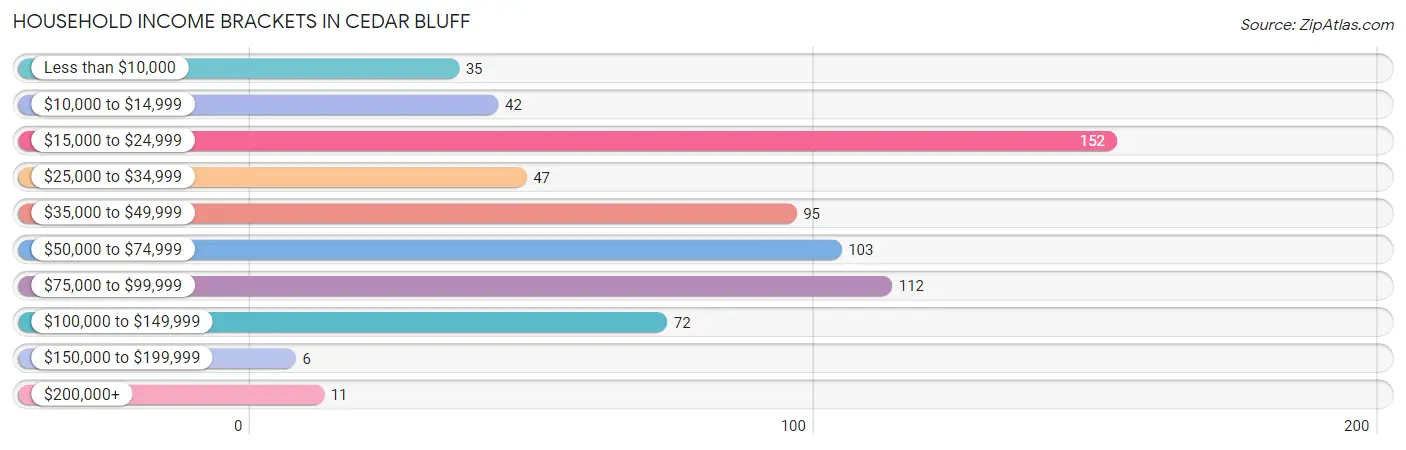
Household Income Brackets in Cedar Bluff
With 152 households falling in the category, the $15,000 to $24,999 income range is the most frequent in Cedar Bluff, accounting for 22.5% of all households. In contrast, only 6 households (0.9%) fall into the $150,000 to $199,999 income bracket, making it the least populous group.
| Income Bracket | # Households | % Households |
| Less than $10,000 | 35 | 5.2% |
| $10,000 to $14,999 | 42 | 6.2% |
| $15,000 to $24,999 | 152 | 22.5% |
| $25,000 to $34,999 | 47 | 7.0% |
| $35,000 to $49,999 | 95 | 14.1% |
| $50,000 to $74,999 | 103 | 15.3% |
| $75,000 to $99,999 | 112 | 16.6% |
| $100,000 to $149,999 | 72 | 10.7% |
| $150,000 to $199,999 | 6 | 0.9% |
| $200,000+ | 11 | 1.6% |
Household Income by Householder Age in Cedar Bluff
The median household income in Cedar Bluff is $45,861, with the highest median household income of $59,375 found in the 45 to 64 years age bracket for the primary householder. A total of 328 households (48.6%) fall into this category. Meanwhile, the 15 to 24 years age bracket for the primary householder has the lowest median household income of $0, with 5 households (0.7%) in this group.
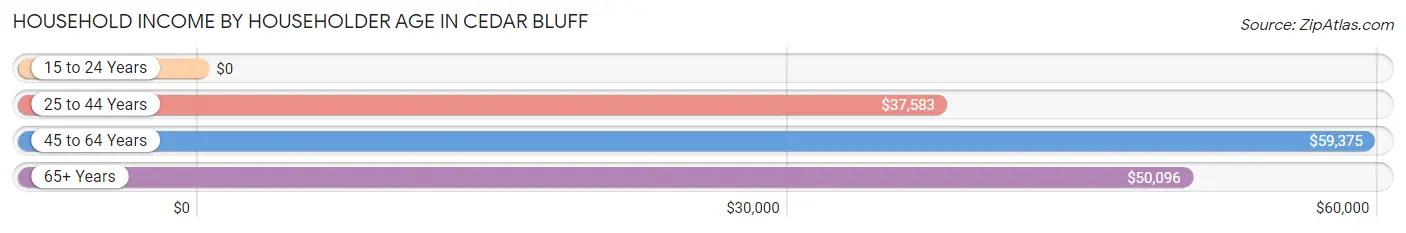
| Income Bracket | # Households | Median Income |
| 15 to 24 Years | 5 (0.7%) | $0 |
| 25 to 44 Years | 161 (23.8%) | $37,583 |
| 45 to 64 Years | 328 (48.6%) | $59,375 |
| 65+ Years | 181 (26.8%) | $50,096 |
| Total | 675 (100.0%) | $45,861 |
Poverty in Cedar Bluff
Income Below Poverty by Sex and Age in Cedar Bluff
With 31.2% poverty level for males and 27.5% for females among the residents of Cedar Bluff, 5 year old males and under 5 year old females are the most vulnerable to poverty, with 16 males (100.0%) and 35 females (100.0%) in their respective age groups living below the poverty level.
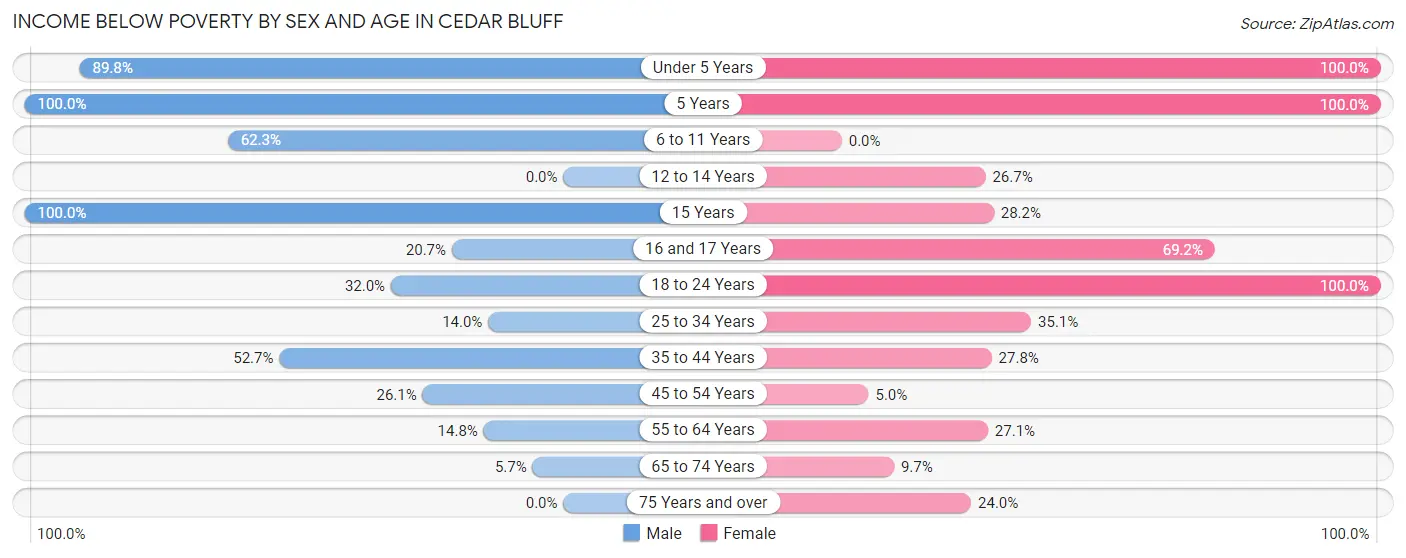
| Age Bracket | Male | Female |
| Under 5 Years | 44 (89.8%) | 35 (100.0%) |
| 5 Years | 16 (100.0%) | 6 (100.0%) |
| 6 to 11 Years | 38 (62.3%) | 0 (0.0%) |
| 12 to 14 Years | 0 (0.0%) | 12 (26.7%) |
| 15 Years | 11 (100.0%) | 11 (28.2%) |
| 16 and 17 Years | 12 (20.7%) | 18 (69.2%) |
| 18 to 24 Years | 16 (32.0%) | 14 (100.0%) |
| 25 to 34 Years | 6 (14.0%) | 26 (35.1%) |
| 35 to 44 Years | 58 (52.7%) | 37 (27.8%) |
| 45 to 54 Years | 23 (26.1%) | 6 (5.0%) |
| 55 to 64 Years | 21 (14.8%) | 48 (27.1%) |
| 65 to 74 Years | 6 (5.7%) | 12 (9.7%) |
| 75 Years and over | 0 (0.0%) | 12 (24.0%) |
| Total | 251 (31.2%) | 237 (27.5%) |
Income Above Poverty by Sex and Age in Cedar Bluff
According to the poverty statistics in Cedar Bluff, males aged 12 to 14 years and females aged 6 to 11 years are the age groups that are most secure financially, with 100.0% of males and 100.0% of females in these age groups living above the poverty line.
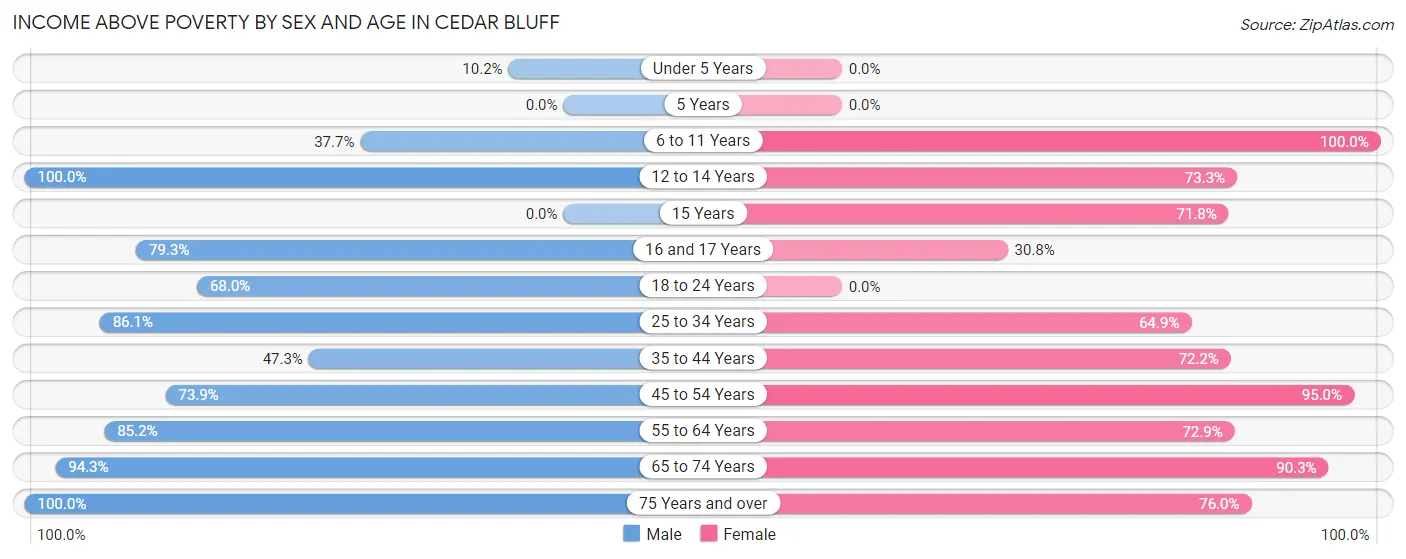
| Age Bracket | Male | Female |
| Under 5 Years | 5 (10.2%) | 0 (0.0%) |
| 5 Years | 0 (0.0%) | 0 (0.0%) |
| 6 to 11 Years | 23 (37.7%) | 17 (100.0%) |
| 12 to 14 Years | 40 (100.0%) | 33 (73.3%) |
| 15 Years | 0 (0.0%) | 28 (71.8%) |
| 16 and 17 Years | 46 (79.3%) | 8 (30.8%) |
| 18 to 24 Years | 34 (68.0%) | 0 (0.0%) |
| 25 to 34 Years | 37 (86.1%) | 48 (64.9%) |
| 35 to 44 Years | 52 (47.3%) | 96 (72.2%) |
| 45 to 54 Years | 65 (73.9%) | 115 (95.0%) |
| 55 to 64 Years | 121 (85.2%) | 129 (72.9%) |
| 65 to 74 Years | 99 (94.3%) | 112 (90.3%) |
| 75 Years and over | 32 (100.0%) | 38 (76.0%) |
| Total | 554 (68.8%) | 624 (72.5%) |
Income Below Poverty Among Married-Couple Families in Cedar Bluff
The poverty statistics for married-couple families in Cedar Bluff show that 13.4% or 42 of the total 313 families live below the poverty line. Families with 3 or 4 children have the highest poverty rate of 57.1%, comprising of 16 families. On the other hand, families with no children have the lowest poverty rate of 7.8%, which includes 18 families.
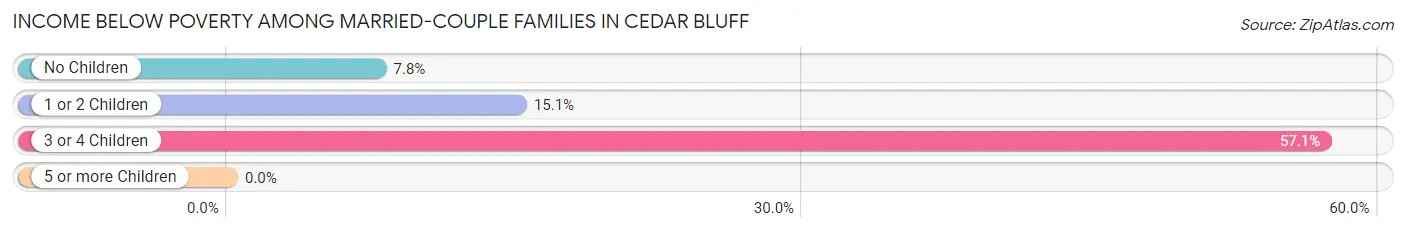
| Children | Above Poverty | Below Poverty |
| No Children | 214 (92.2%) | 18 (7.8%) |
| 1 or 2 Children | 45 (84.9%) | 8 (15.1%) |
| 3 or 4 Children | 12 (42.9%) | 16 (57.1%) |
| 5 or more Children | 0 (0.0%) | 0 (0.0%) |
| Total | 271 (86.6%) | 42 (13.4%) |
Income Below Poverty Among Single-Parent Households in Cedar Bluff
According to the poverty data in Cedar Bluff, 36.7% or 11 single-father households and 47.1% or 41 single-mother households are living below the poverty line. Among single-father households, those with 1 or 2 children have the highest poverty rate, with 11 households (44.0%) experiencing poverty. Likewise, among single-mother households, those with 3 or 4 children have the highest poverty rate, with 3 households (100.0%) falling below the poverty line.
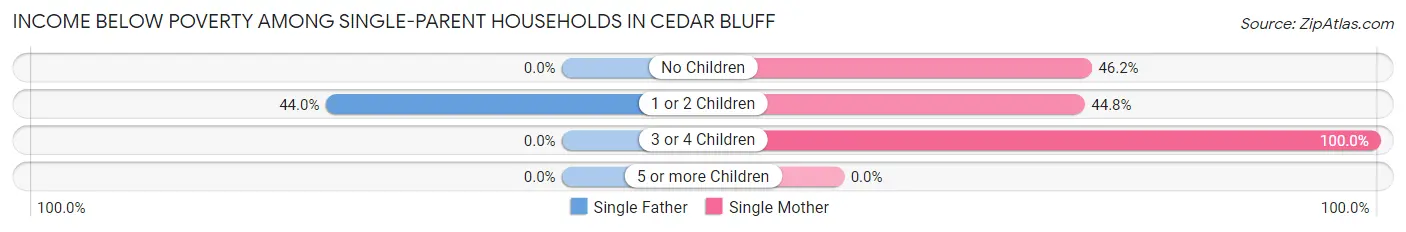
| Children | Single Father | Single Mother |
| No Children | 0 (0.0%) | 12 (46.2%) |
| 1 or 2 Children | 11 (44.0%) | 26 (44.8%) |
| 3 or 4 Children | 0 (0.0%) | 3 (100.0%) |
| 5 or more Children | 0 (0.0%) | 0 (0.0%) |
| Total | 11 (36.7%) | 41 (47.1%) |
Income Below Poverty Among Married-Couple vs Single-Parent Households in Cedar Bluff
The poverty data for Cedar Bluff shows that 42 of the married-couple family households (13.4%) and 52 of the single-parent households (44.4%) are living below the poverty level. Within the married-couple family households, those with 3 or 4 children have the highest poverty rate, with 16 households (57.1%) falling below the poverty line. Among the single-parent households, those with 3 or 4 children have the highest poverty rate, with 3 household (100.0%) living below poverty.
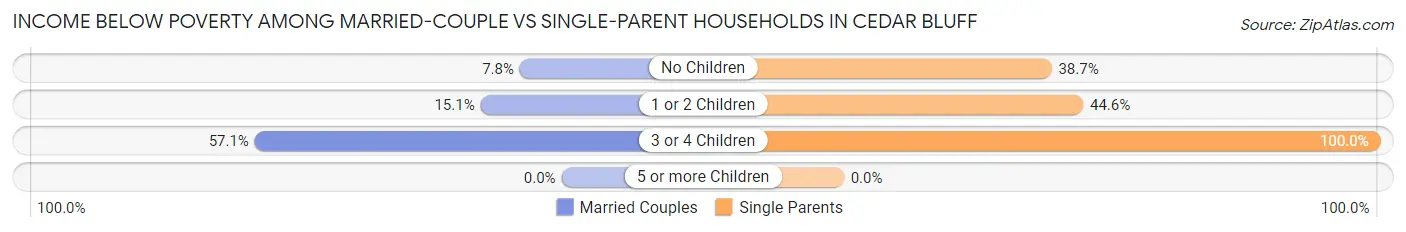
| Children | Married-Couple Families | Single-Parent Households |
| No Children | 18 (7.8%) | 12 (38.7%) |
| 1 or 2 Children | 8 (15.1%) | 37 (44.6%) |
| 3 or 4 Children | 16 (57.1%) | 3 (100.0%) |
| 5 or more Children | 0 (0.0%) | 0 (0.0%) |
| Total | 42 (13.4%) | 52 (44.4%) |
Race in Cedar Bluff
The most populous races in Cedar Bluff are White / Caucasian (1,501 | 89.8%), Black / African American (101 | 6.0%), and Two or more Races (62 | 3.7%).
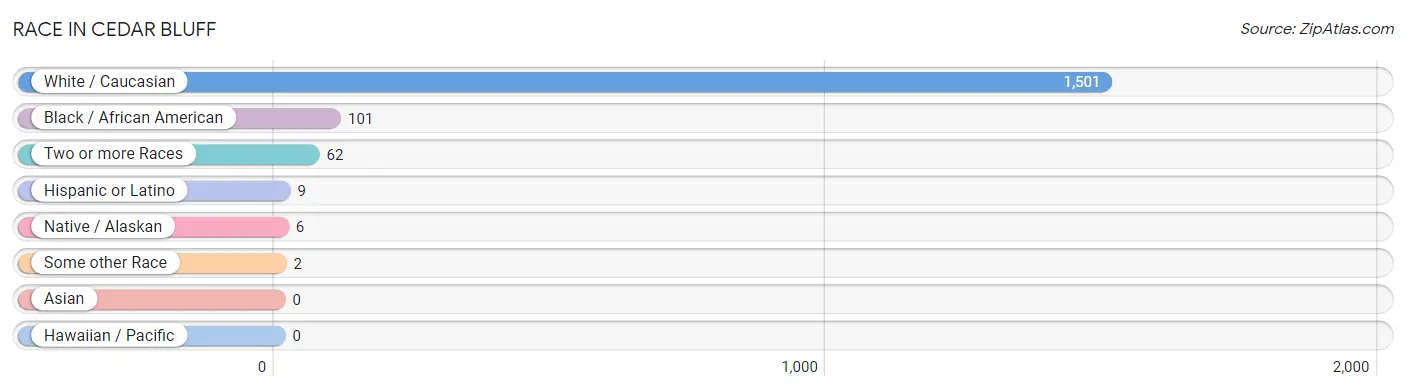
| Race | # Population | % Population |
| Asian | 0 | 0.0% |
| Black / African American | 101 | 6.0% |
| Hawaiian / Pacific | 0 | 0.0% |
| Hispanic or Latino | 9 | 0.5% |
| Native / Alaskan | 6 | 0.4% |
| White / Caucasian | 1,501 | 89.8% |
| Two or more Races | 62 | 3.7% |
| Some other Race | 2 | 0.1% |
| Total | 1,672 | 100.0% |
Ancestry in Cedar Bluff
The most populous ancestries reported in Cedar Bluff are Irish (328 | 19.6%), English (213 | 12.7%), American (158 | 9.5%), German (78 | 4.7%), and Dutch (28 | 1.7%), together accounting for 48.2% of all Cedar Bluff residents.
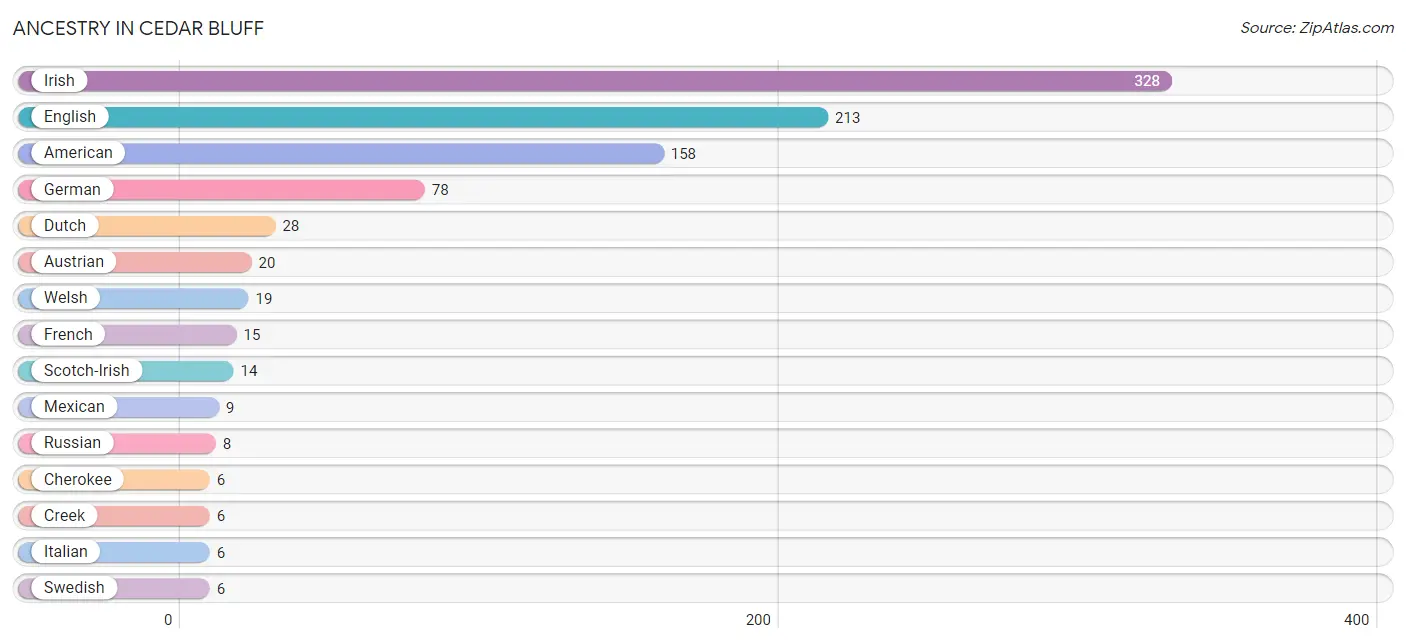
| Ancestry | # Population | % Population |
| American | 158 | 9.5% |
| Austrian | 20 | 1.2% |
| Cherokee | 6 | 0.4% |
| Creek | 6 | 0.4% |
| Dutch | 28 | 1.7% |
| English | 213 | 12.7% |
| French | 15 | 0.9% |
| French Canadian | 5 | 0.3% |
| German | 78 | 4.7% |
| Irish | 328 | 19.6% |
| Italian | 6 | 0.4% |
| Lithuanian | 3 | 0.2% |
| Mexican | 9 | 0.5% |
| Russian | 8 | 0.5% |
| Scotch-Irish | 14 | 0.8% |
| South African | 4 | 0.2% |
| Subsaharan African | 4 | 0.2% |
| Swedish | 6 | 0.4% |
| Welsh | 19 | 1.1% | View All 19 Rows |
Immigrants in Cedar Bluff
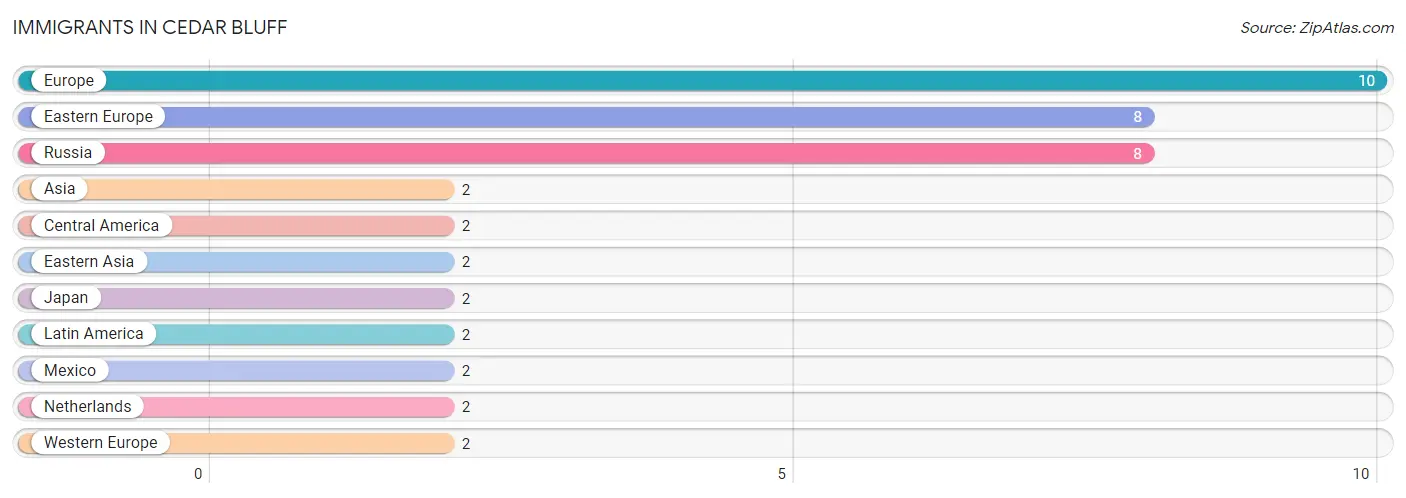
The most numerous immigrant groups reported in Cedar Bluff came from Europe (10 | 0.6%), Eastern Europe (8 | 0.5%), Russia (8 | 0.5%), Asia (2 | 0.1%), and Central America (2 | 0.1%), together accounting for 1.8% of all Cedar Bluff residents.
| Immigration Origin | # Population | % Population |
| Asia | 2 | 0.1% |
| Central America | 2 | 0.1% |
| Eastern Asia | 2 | 0.1% |
| Eastern Europe | 8 | 0.5% |
| Europe | 10 | 0.6% |
| Japan | 2 | 0.1% |
| Latin America | 2 | 0.1% |
| Mexico | 2 | 0.1% |
| Netherlands | 2 | 0.1% |
| Russia | 8 | 0.5% |
| Western Europe | 2 | 0.1% | View All 11 Rows |
Sex and Age in Cedar Bluff
Sex and Age in Cedar Bluff
The most populous age groups in Cedar Bluff are 15 to 19 Years (96 | 11.9%) for men and 60 to 64 Years (125 | 14.4%) for women.
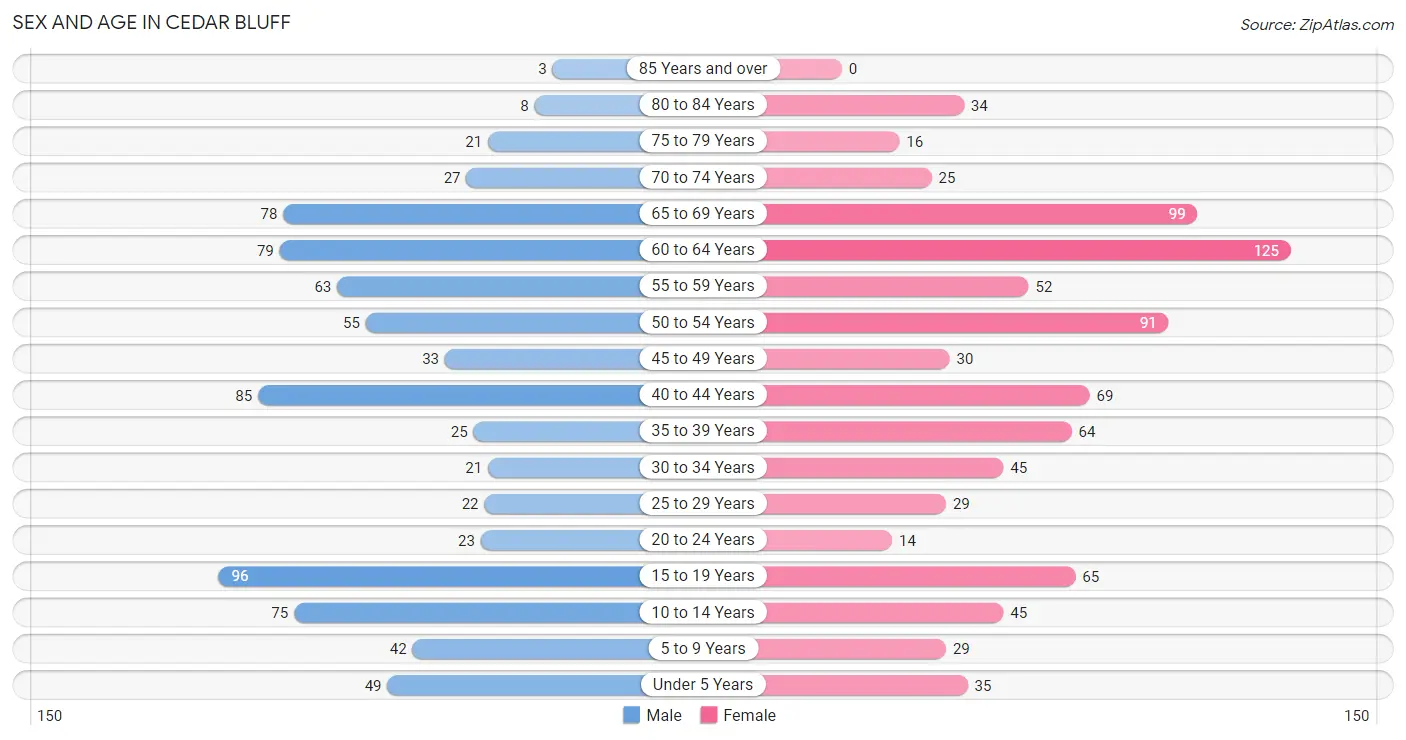
| Age Bracket | Male | Female |
| Under 5 Years | 49 (6.1%) | 35 (4.0%) |
| 5 to 9 Years | 42 (5.2%) | 29 (3.3%) |
| 10 to 14 Years | 75 (9.3%) | 45 (5.2%) |
| 15 to 19 Years | 96 (11.9%) | 65 (7.5%) |
| 20 to 24 Years | 23 (2.9%) | 14 (1.6%) |
| 25 to 29 Years | 22 (2.7%) | 29 (3.3%) |
| 30 to 34 Years | 21 (2.6%) | 45 (5.2%) |
| 35 to 39 Years | 25 (3.1%) | 64 (7.4%) |
| 40 to 44 Years | 85 (10.6%) | 69 (8.0%) |
| 45 to 49 Years | 33 (4.1%) | 30 (3.5%) |
| 50 to 54 Years | 55 (6.8%) | 91 (10.5%) |
| 55 to 59 Years | 63 (7.8%) | 52 (6.0%) |
| 60 to 64 Years | 79 (9.8%) | 125 (14.4%) |
| 65 to 69 Years | 78 (9.7%) | 99 (11.4%) |
| 70 to 74 Years | 27 (3.4%) | 25 (2.9%) |
| 75 to 79 Years | 21 (2.6%) | 16 (1.8%) |
| 80 to 84 Years | 8 (1.0%) | 34 (3.9%) |
| 85 Years and over | 3 (0.4%) | 0 (0.0%) |
| Total | 805 (100.0%) | 867 (100.0%) |
Families and Households in Cedar Bluff
Median Family Size in Cedar Bluff
The median family size in Cedar Bluff is 3.21 persons per family, with single female/mother families (87 | 20.2%) accounting for the largest median family size of 4.57 persons per family. On the other hand, single male/father families (30 | 7.0%) represent the smallest median family size with 2.83 persons per family.
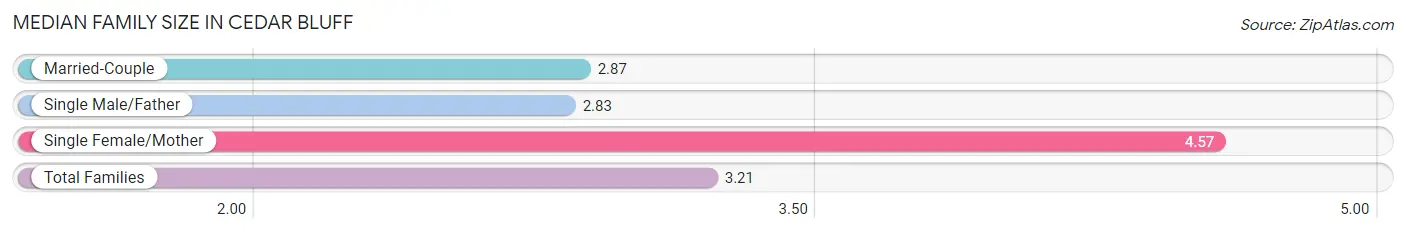
| Family Type | # Families | Family Size |
| Married-Couple | 313 (72.8%) | 2.87 |
| Single Male/Father | 30 (7.0%) | 2.83 |
| Single Female/Mother | 87 (20.2%) | 4.57 |
| Total Families | 430 (100.0%) | 3.21 |
Median Household Size in Cedar Bluff
The median household size in Cedar Bluff is 2.48 persons per household, with single female/mother households (87 | 12.9%) accounting for the largest median household size of 4.57 persons per household. non-family households (245 | 36.3%) represent the smallest median household size with 1.09 persons per household.
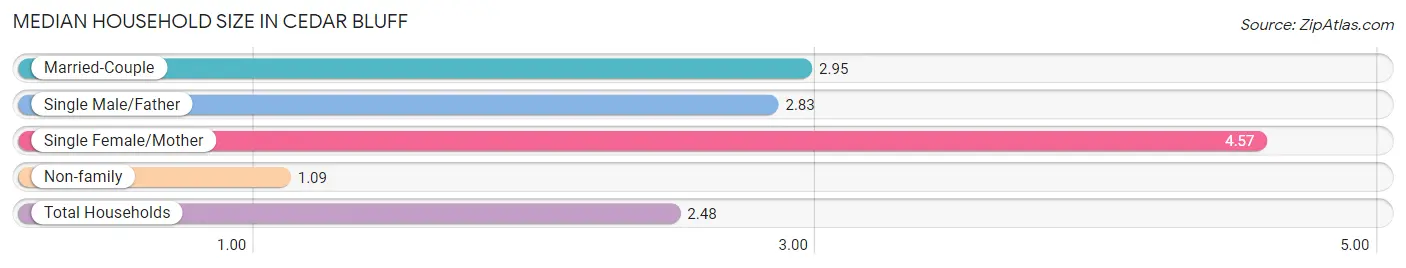
| Household Type | # Households | Household Size |
| Married-Couple | 313 (46.4%) | 2.95 |
| Single Male/Father | 30 (4.4%) | 2.83 |
| Single Female/Mother | 87 (12.9%) | 4.57 |
| Non-family | 245 (36.3%) | 1.09 |
| Total Households | 675 (100.0%) | 2.48 |
Household Size by Marriage Status in Cedar Bluff
Out of a total of 675 households in Cedar Bluff, 430 (63.7%) are family households, while 245 (36.3%) are nonfamily households. The most numerous type of family households are 2-person households, comprising 248, and the most common type of nonfamily households are 1-person households, comprising 222.
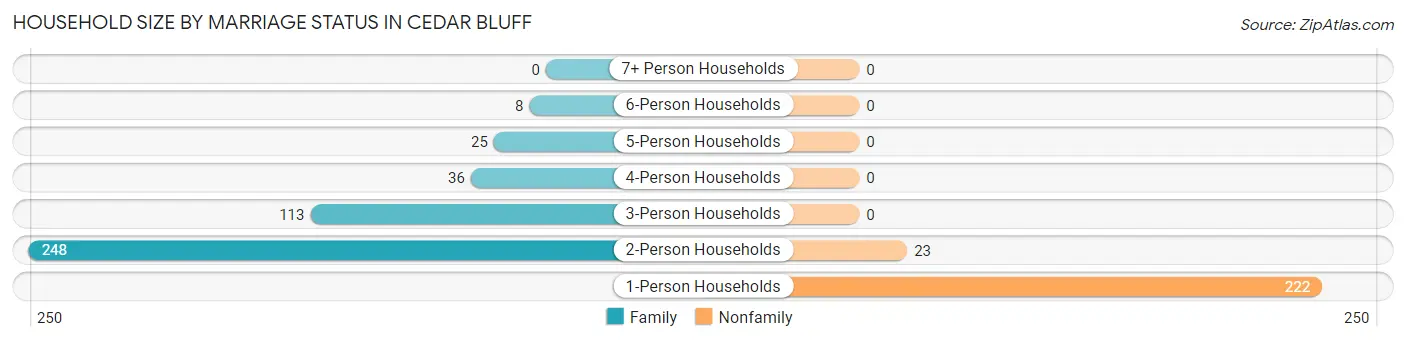
| Household Size | Family Households | Nonfamily Households |
| 1-Person Households | - | 222 (32.9%) |
| 2-Person Households | 248 (36.7%) | 23 (3.4%) |
| 3-Person Households | 113 (16.7%) | 0 (0.0%) |
| 4-Person Households | 36 (5.3%) | 0 (0.0%) |
| 5-Person Households | 25 (3.7%) | 0 (0.0%) |
| 6-Person Households | 8 (1.2%) | 0 (0.0%) |
| 7+ Person Households | 0 (0.0%) | 0 (0.0%) |
| Total | 430 (63.7%) | 245 (36.3%) |
Female Fertility in Cedar Bluff
Fertility by Age in Cedar Bluff
Average fertility rate in Cedar Bluff is 106.0 births per 1,000 women. Women in the age bracket of 15 to 19 years have the highest fertility rate with 169.0 births per 1,000 women. Women in the age bracket of 35 to 50 years acount for 52.9% of all women with births.
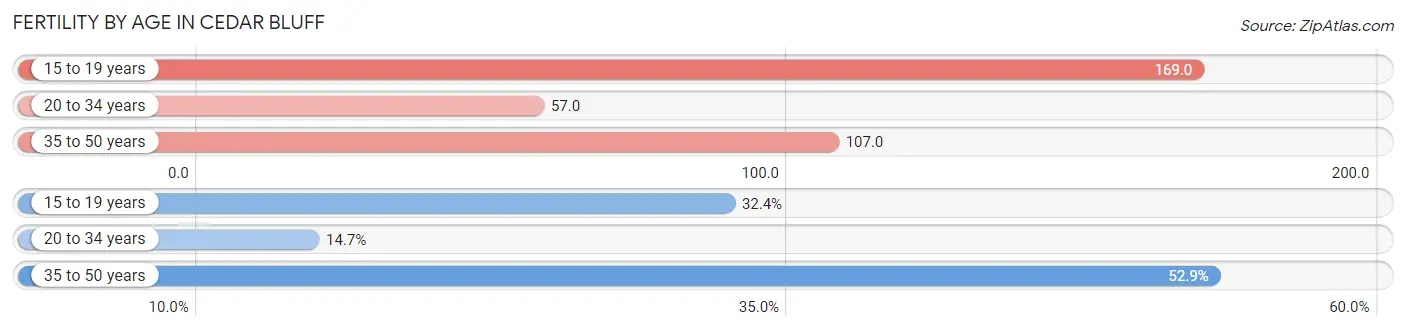
| Age Bracket | Women with Births | Births / 1,000 Women |
| 15 to 19 years | 11 (32.4%) | 169.0 |
| 20 to 34 years | 5 (14.7%) | 57.0 |
| 35 to 50 years | 18 (52.9%) | 107.0 |
| Total | 34 (100.0%) | 106.0 |
Fertility by Age by Marriage Status in Cedar Bluff
29.4% of women with births (34) in Cedar Bluff are married. The highest percentage of unmarried women with births falls into 15 to 19 years age bracket with 100.0% of them unmarried at the time of birth, while the lowest percentage of unmarried women with births belong to 20 to 34 years age bracket with 0.0% of them unmarried.
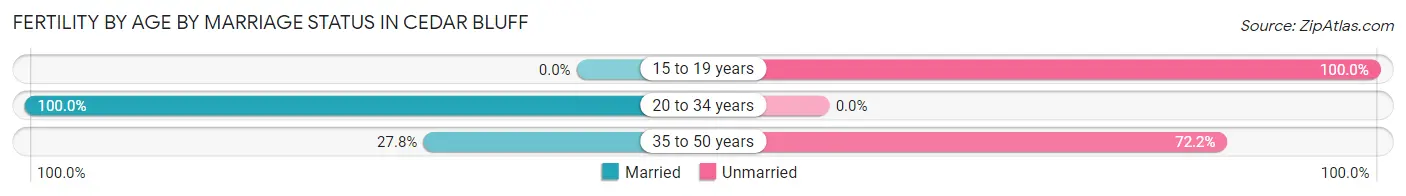
| Age Bracket | Married | Unmarried |
| 15 to 19 years | 0 (0.0%) | 11 (100.0%) |
| 20 to 34 years | 5 (100.0%) | 0 (0.0%) |
| 35 to 50 years | 5 (27.8%) | 13 (72.2%) |
| Total | 10 (29.4%) | 24 (70.6%) |
Fertility by Education in Cedar Bluff
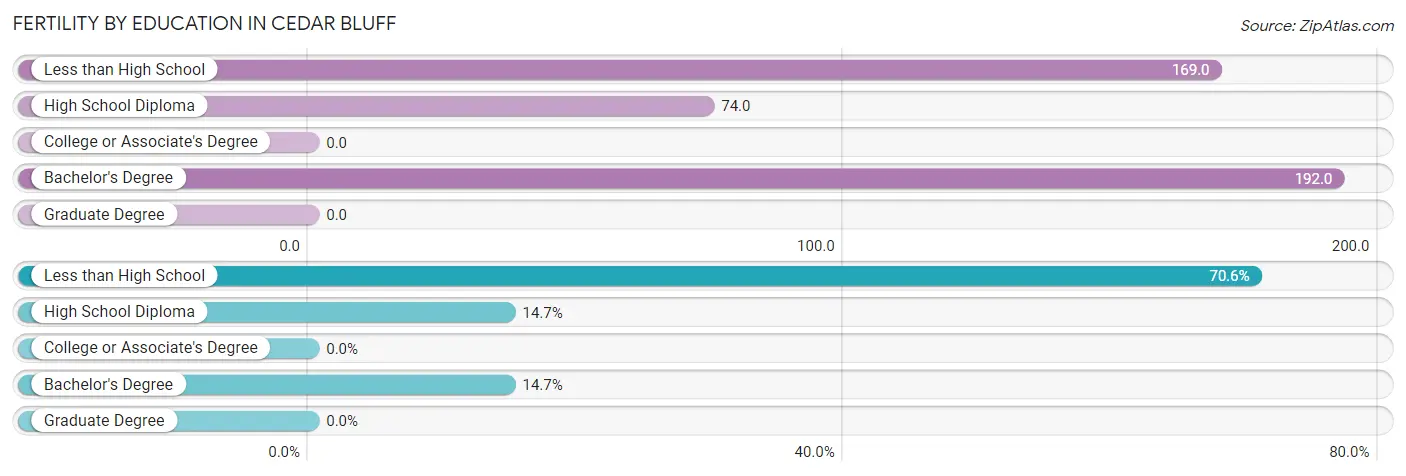
| Educational Attainment | Women with Births | Births / 1,000 Women |
| Less than High School | 24 (70.6%) | 169.0 |
| High School Diploma | 5 (14.7%) | 74.0 |
| College or Associate's Degree | 0 (0.0%) | 0.0 |
| Bachelor's Degree | 5 (14.7%) | 192.0 |
| Graduate Degree | 0 (0.0%) | 0.0 |
| Total | 34 (100.0%) | 106.0 |
Fertility by Education by Marriage Status in Cedar Bluff
70.6% of women with births in Cedar Bluff are unmarried. Women with the educational attainment of high school diploma are most likely to be married with 100.0% of them married at childbirth, while women with the educational attainment of less than high school are least likely to be married with 100.0% of them unmarried at childbirth.
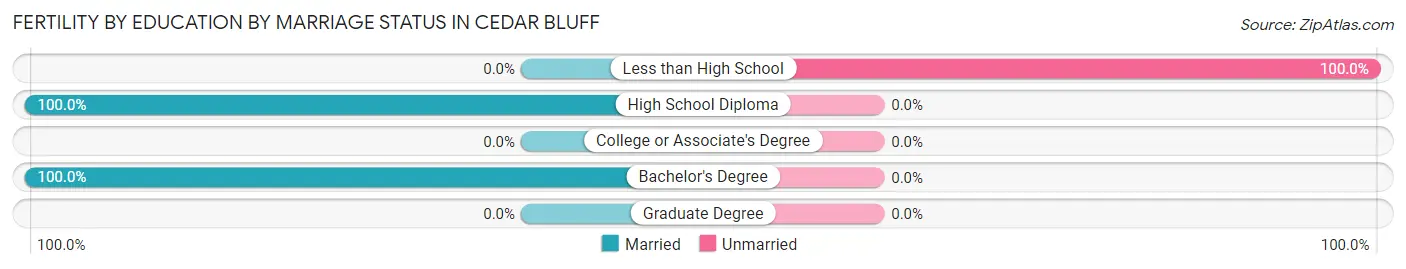
| Educational Attainment | Married | Unmarried |
| Less than High School | 0 (0.0%) | 24 (100.0%) |
| High School Diploma | 5 (100.0%) | 0 (0.0%) |
| College or Associate's Degree | 0 (0.0%) | 0 (0.0%) |
| Bachelor's Degree | 5 (100.0%) | 0 (0.0%) |
| Graduate Degree | 0 (0.0%) | 0 (0.0%) |
| Total | 10 (29.4%) | 24 (70.6%) |
Employment Characteristics in Cedar Bluff
Employment by Class of Employer in Cedar Bluff
Among the 511 employed individuals in Cedar Bluff, private company employees (389 | 76.1%), local government employees (59 | 11.6%), and state government employees (22 | 4.3%) make up the most common classes of employment.
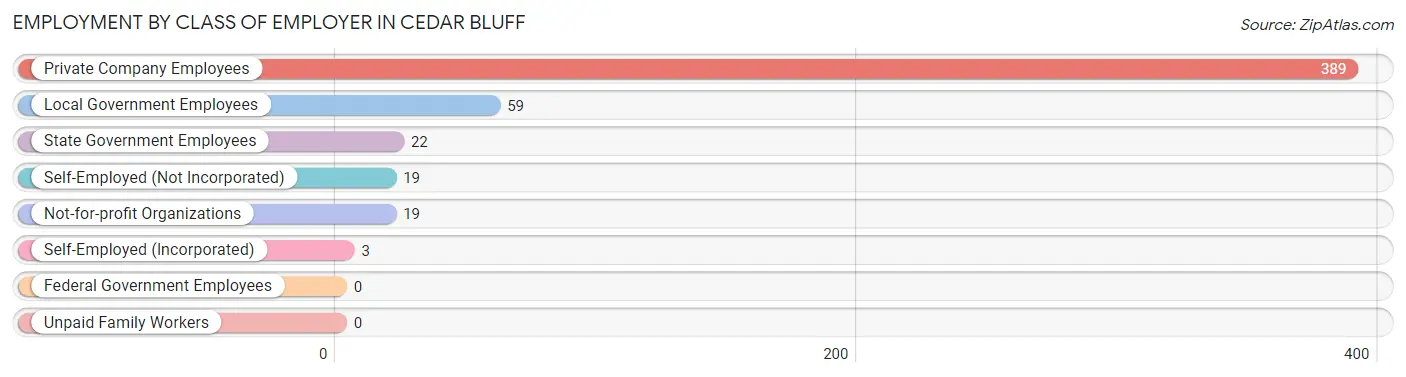
| Employer Class | # Employees | % Employees |
| Private Company Employees | 389 | 76.1% |
| Self-Employed (Incorporated) | 3 | 0.6% |
| Self-Employed (Not Incorporated) | 19 | 3.7% |
| Not-for-profit Organizations | 19 | 3.7% |
| Local Government Employees | 59 | 11.6% |
| State Government Employees | 22 | 4.3% |
| Federal Government Employees | 0 | 0.0% |
| Unpaid Family Workers | 0 | 0.0% |
| Total | 511 | 100.0% |
Employment Status by Age in Cedar Bluff
According to the labor force statistics for Cedar Bluff, out of the total population over 16 years of age (1,347), 43.3% or 583 individuals are in the labor force, with 10.1% or 59 of them unemployed. The age group with the highest labor force participation rate is 30 to 34 years, with 77.3% or 51 individuals in the labor force. Within the labor force, the 30 to 34 years age range has the highest percentage of unemployed individuals, with 39.2% or 20 of them being unemployed.
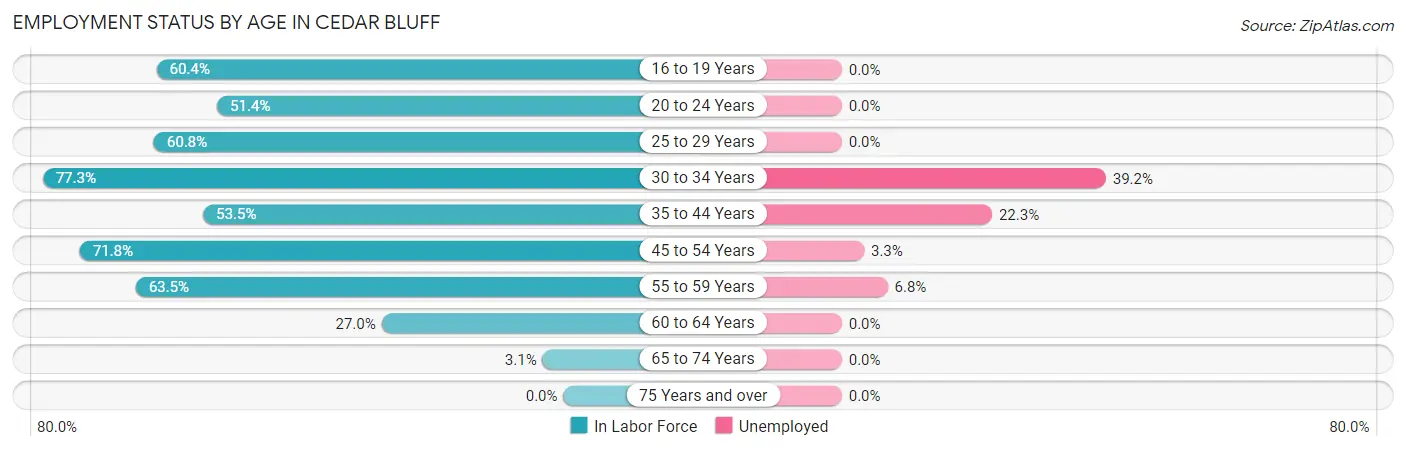
| Age Bracket | In Labor Force | Unemployed |
| 16 to 19 Years | 67 (60.4%) | 0 (0.0%) |
| 20 to 24 Years | 19 (51.4%) | 0 (0.0%) |
| 25 to 29 Years | 31 (60.8%) | 0 (0.0%) |
| 30 to 34 Years | 51 (77.3%) | 20 (39.2%) |
| 35 to 44 Years | 130 (53.5%) | 29 (22.3%) |
| 45 to 54 Years | 150 (71.8%) | 5 (3.3%) |
| 55 to 59 Years | 73 (63.5%) | 5 (6.8%) |
| 60 to 64 Years | 55 (27.0%) | 0 (0.0%) |
| 65 to 74 Years | 7 (3.1%) | 0 (0.0%) |
| 75 Years and over | 0 (0.0%) | 0 (0.0%) |
| Total | 583 (43.3%) | 59 (10.1%) |
Employment Status by Educational Attainment in Cedar Bluff
According to labor force statistics for Cedar Bluff, 55.2% of individuals (490) out of the total population between 25 and 64 years of age (888) are in the labor force, with 12.0% or 59 of them being unemployed. The group with the highest labor force participation rate are those with the educational attainment of bachelor's degree or higher, with 75.0% or 99 individuals in the labor force. Within the labor force, individuals with high school diploma education have the highest percentage of unemployment, with 18.7% or 26 of them being unemployed.
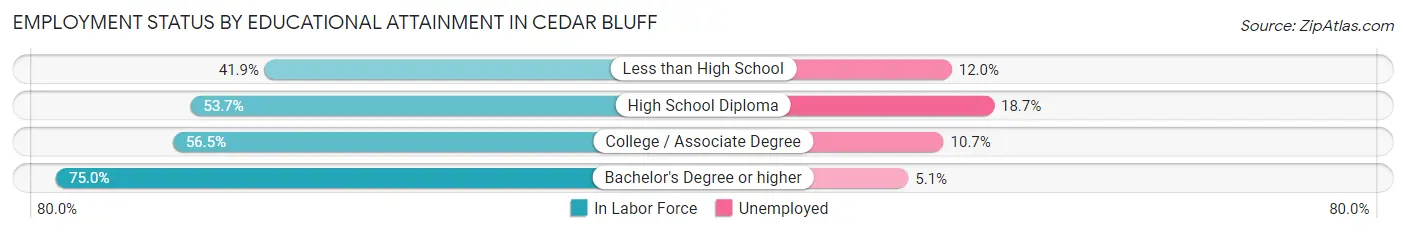
| Educational Attainment | In Labor Force | Unemployed |
| Less than High School | 83 (41.9%) | 24 (12.0%) |
| High School Diploma | 139 (53.7%) | 48 (18.7%) |
| College / Associate Degree | 169 (56.5%) | 32 (10.7%) |
| Bachelor's Degree or higher | 99 (75.0%) | 7 (5.1%) |
| Total | 490 (55.2%) | 107 (12.0%) |
Employment Occupations by Sex in Cedar Bluff
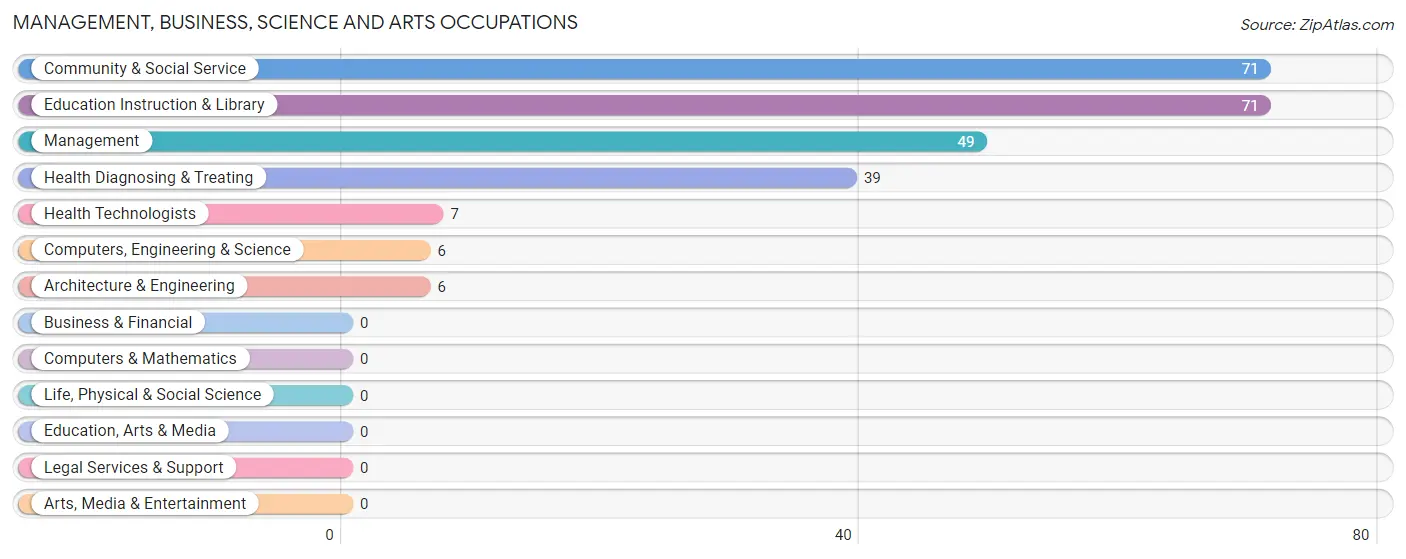
Management, Business, Science and Arts Occupations
The most common Management, Business, Science and Arts occupations in Cedar Bluff are Community & Social Service (71 | 13.6%), Education Instruction & Library (71 | 13.6%), Management (49 | 9.3%), Health Diagnosing & Treating (39 | 7.4%), and Health Technologists (7 | 1.3%).
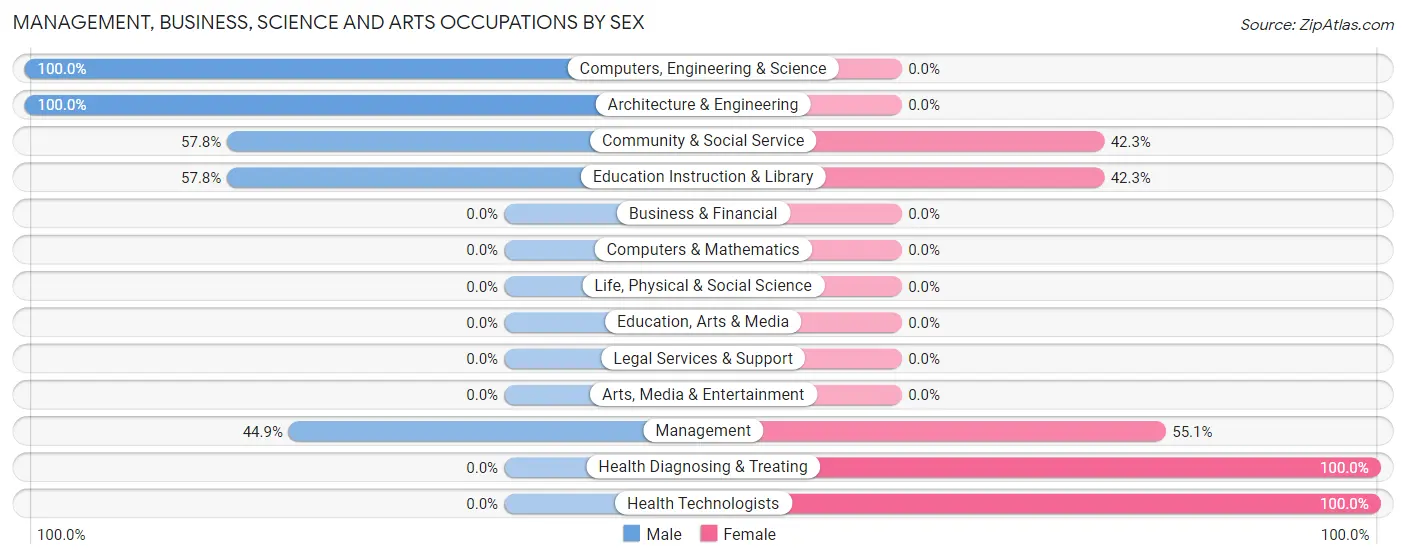
Management, Business, Science and Arts Occupations by Sex
Within the Management, Business, Science and Arts occupations in Cedar Bluff, the most male-oriented occupations are Computers, Engineering & Science (100.0%), Architecture & Engineering (100.0%), and Community & Social Service (57.8%), while the most female-oriented occupations are Health Diagnosing & Treating (100.0%), Health Technologists (100.0%), and Management (55.1%).
| Occupation | Male | Female |
| Management | 22 (44.9%) | 27 (55.1%) |
| Business & Financial | 0 (0.0%) | 0 (0.0%) |
| Computers, Engineering & Science | 6 (100.0%) | 0 (0.0%) |
| Computers & Mathematics | 0 (0.0%) | 0 (0.0%) |
| Architecture & Engineering | 6 (100.0%) | 0 (0.0%) |
| Life, Physical & Social Science | 0 (0.0%) | 0 (0.0%) |
| Community & Social Service | 41 (57.8%) | 30 (42.2%) |
| Education, Arts & Media | 0 (0.0%) | 0 (0.0%) |
| Legal Services & Support | 0 (0.0%) | 0 (0.0%) |
| Education Instruction & Library | 41 (57.8%) | 30 (42.2%) |
| Arts, Media & Entertainment | 0 (0.0%) | 0 (0.0%) |
| Health Diagnosing & Treating | 0 (0.0%) | 39 (100.0%) |
| Health Technologists | 0 (0.0%) | 7 (100.0%) |
| Total (Category) | 69 (41.8%) | 96 (58.2%) |
| Total (Overall) | 275 (52.5%) | 249 (47.5%) |
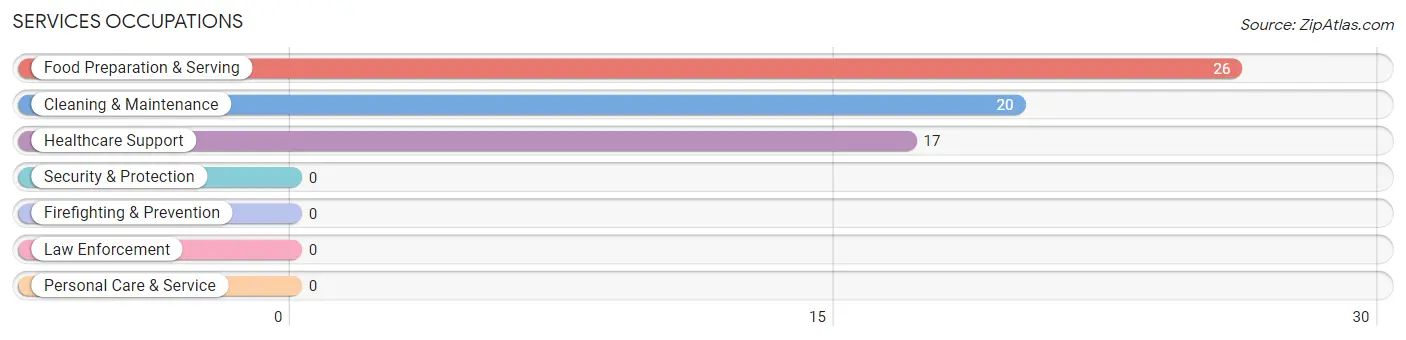
Services Occupations
The most common Services occupations in Cedar Bluff are Food Preparation & Serving (26 | 5.0%), Cleaning & Maintenance (20 | 3.8%), and Healthcare Support (17 | 3.2%).
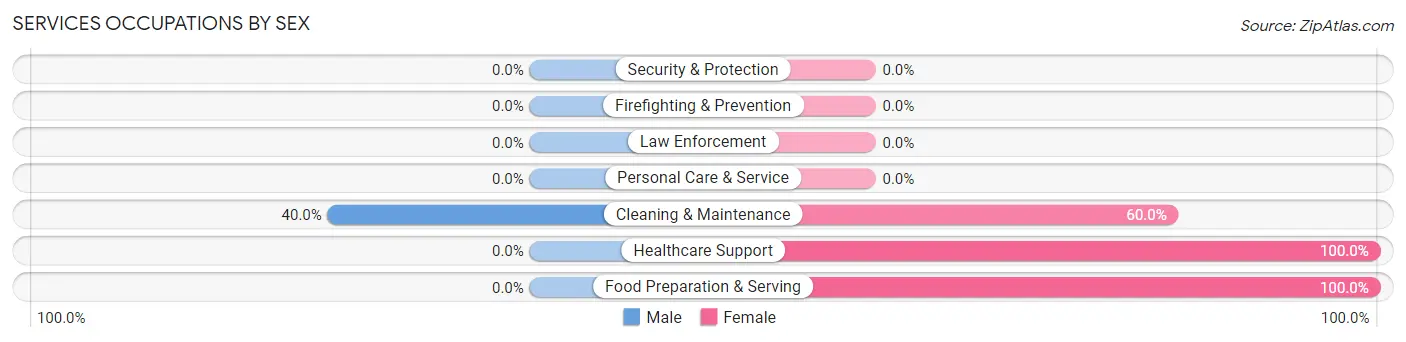
Services Occupations by Sex
| Occupation | Male | Female |
| Healthcare Support | 0 (0.0%) | 17 (100.0%) |
| Security & Protection | 0 (0.0%) | 0 (0.0%) |
| Firefighting & Prevention | 0 (0.0%) | 0 (0.0%) |
| Law Enforcement | 0 (0.0%) | 0 (0.0%) |
| Food Preparation & Serving | 0 (0.0%) | 26 (100.0%) |
| Cleaning & Maintenance | 8 (40.0%) | 12 (60.0%) |
| Personal Care & Service | 0 (0.0%) | 0 (0.0%) |
| Total (Category) | 8 (12.7%) | 55 (87.3%) |
| Total (Overall) | 275 (52.5%) | 249 (47.5%) |
Sales and Office Occupations
The most common Sales and Office occupations in Cedar Bluff are Sales & Related (74 | 14.1%), and Office & Administration (46 | 8.8%).

Sales and Office Occupations by Sex
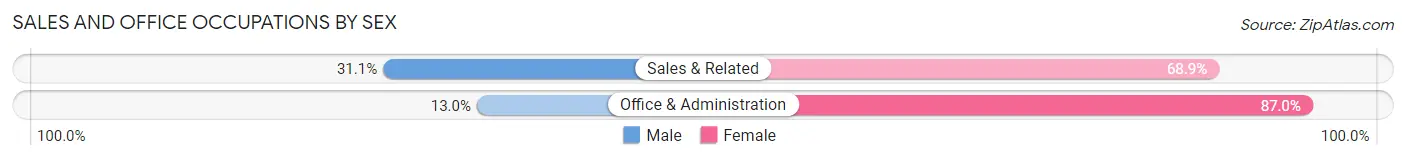
| Occupation | Male | Female |
| Sales & Related | 23 (31.1%) | 51 (68.9%) |
| Office & Administration | 6 (13.0%) | 40 (87.0%) |
| Total (Category) | 29 (24.2%) | 91 (75.8%) |
| Total (Overall) | 275 (52.5%) | 249 (47.5%) |
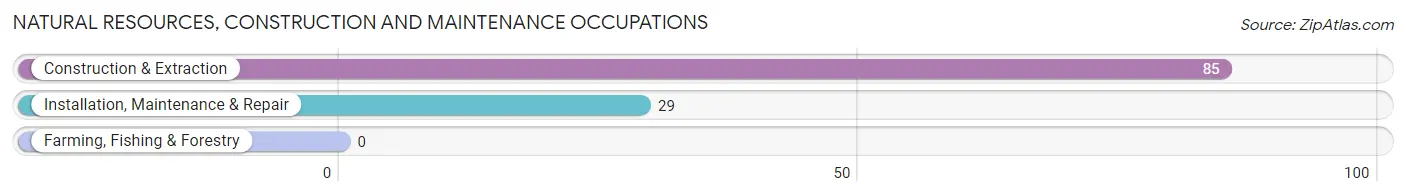
Natural Resources, Construction and Maintenance Occupations
The most common Natural Resources, Construction and Maintenance occupations in Cedar Bluff are Construction & Extraction (85 | 16.2%), and Installation, Maintenance & Repair (29 | 5.5%).
Natural Resources, Construction and Maintenance Occupations by Sex
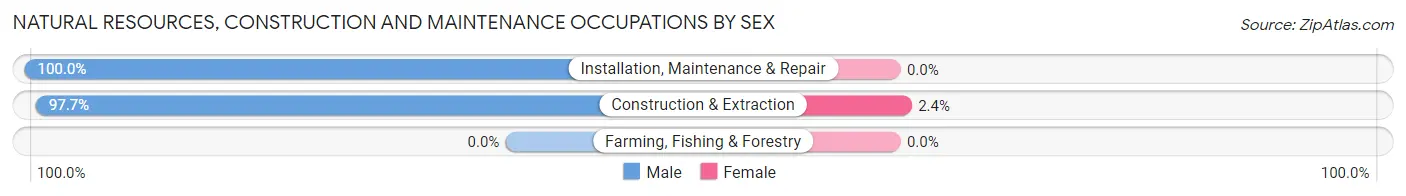
| Occupation | Male | Female |
| Farming, Fishing & Forestry | 0 (0.0%) | 0 (0.0%) |
| Construction & Extraction | 83 (97.7%) | 2 (2.4%) |
| Installation, Maintenance & Repair | 29 (100.0%) | 0 (0.0%) |
| Total (Category) | 112 (98.3%) | 2 (1.8%) |
| Total (Overall) | 275 (52.5%) | 249 (47.5%) |
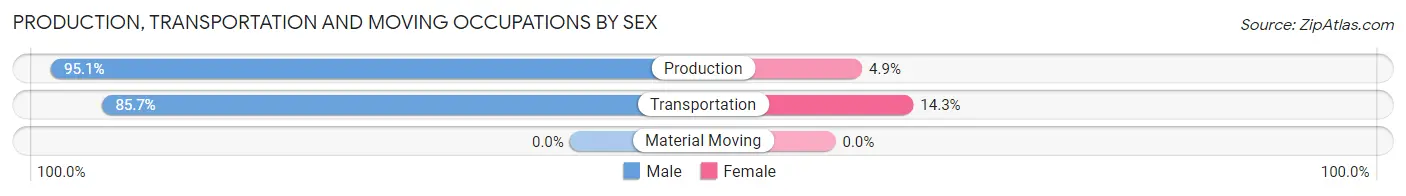
Production, Transportation and Moving Occupations
The most common Production, Transportation and Moving occupations in Cedar Bluff are Production (41 | 7.8%), and Transportation (21 | 4.0%).
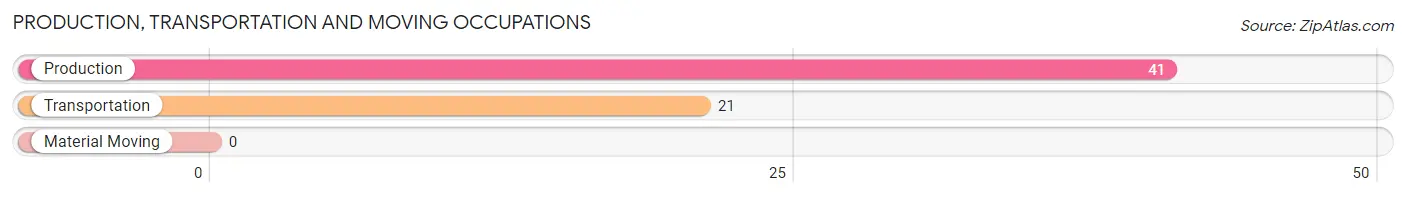
Production, Transportation and Moving Occupations by Sex
| Occupation | Male | Female |
| Production | 39 (95.1%) | 2 (4.9%) |
| Transportation | 18 (85.7%) | 3 (14.3%) |
| Material Moving | 0 (0.0%) | 0 (0.0%) |
| Total (Category) | 57 (91.9%) | 5 (8.1%) |
| Total (Overall) | 275 (52.5%) | 249 (47.5%) |
Employment Industries by Sex in Cedar Bluff
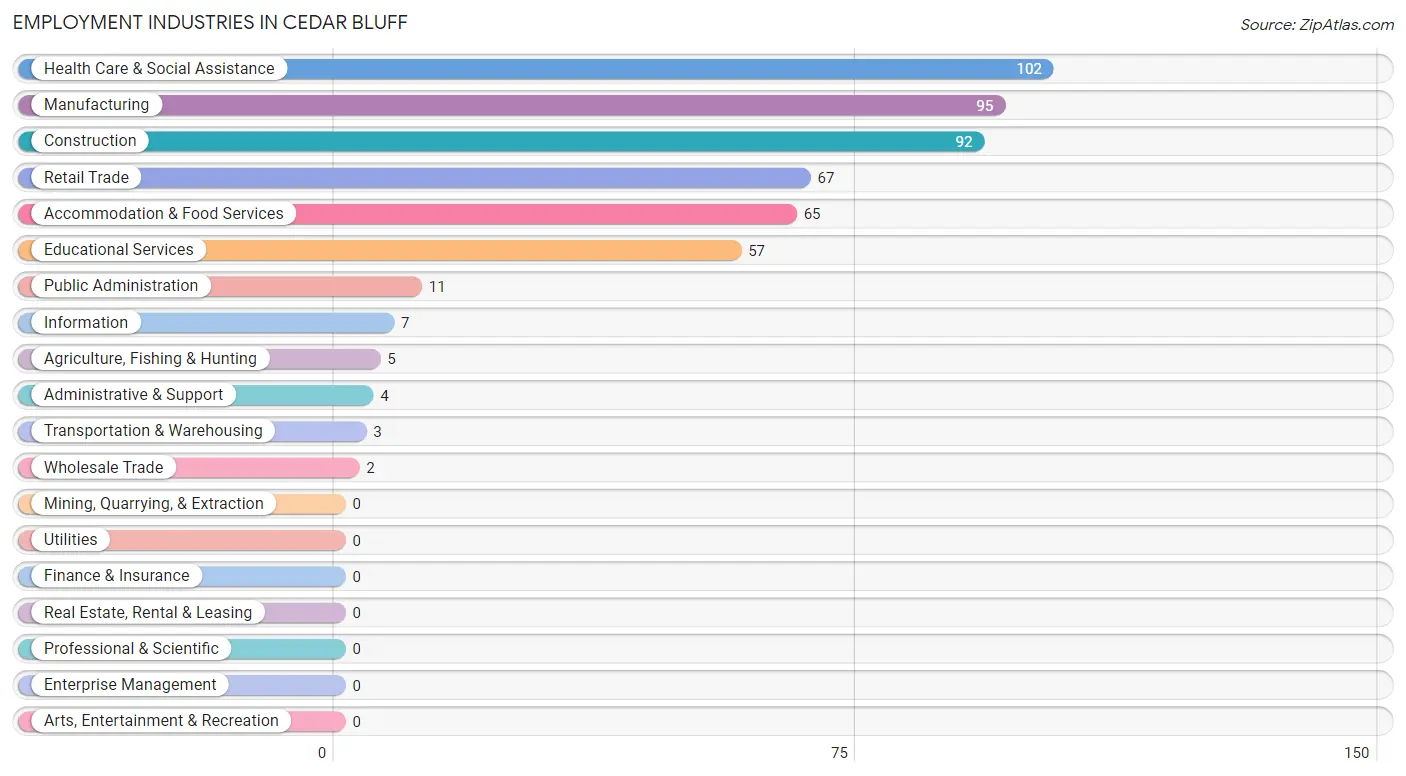
Employment Industries in Cedar Bluff
The major employment industries in Cedar Bluff include Health Care & Social Assistance (102 | 19.5%), Manufacturing (95 | 18.1%), Construction (92 | 17.6%), Retail Trade (67 | 12.8%), and Accommodation & Food Services (65 | 12.4%).
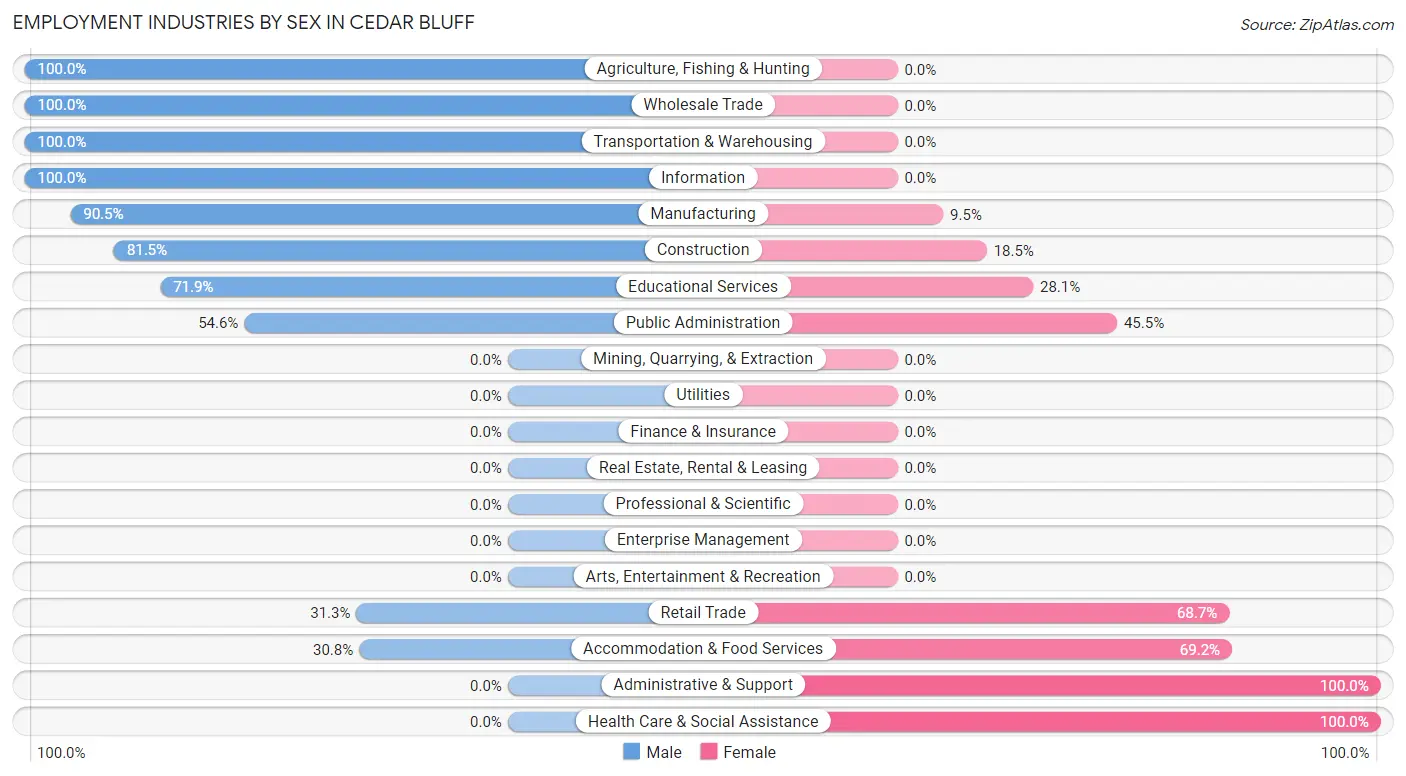
Employment Industries by Sex in Cedar Bluff
The Cedar Bluff industries that see more men than women are Agriculture, Fishing & Hunting (100.0%), Wholesale Trade (100.0%), and Transportation & Warehousing (100.0%), whereas the industries that tend to have a higher number of women are Administrative & Support (100.0%), Health Care & Social Assistance (100.0%), and Accommodation & Food Services (69.2%).
| Industry | Male | Female |
| Agriculture, Fishing & Hunting | 5 (100.0%) | 0 (0.0%) |
| Mining, Quarrying, & Extraction | 0 (0.0%) | 0 (0.0%) |
| Construction | 75 (81.5%) | 17 (18.5%) |
| Manufacturing | 86 (90.5%) | 9 (9.5%) |
| Wholesale Trade | 2 (100.0%) | 0 (0.0%) |
| Retail Trade | 21 (31.3%) | 46 (68.7%) |
| Transportation & Warehousing | 3 (100.0%) | 0 (0.0%) |
| Utilities | 0 (0.0%) | 0 (0.0%) |
| Information | 7 (100.0%) | 0 (0.0%) |
| Finance & Insurance | 0 (0.0%) | 0 (0.0%) |
| Real Estate, Rental & Leasing | 0 (0.0%) | 0 (0.0%) |
| Professional & Scientific | 0 (0.0%) | 0 (0.0%) |
| Enterprise Management | 0 (0.0%) | 0 (0.0%) |
| Administrative & Support | 0 (0.0%) | 4 (100.0%) |
| Educational Services | 41 (71.9%) | 16 (28.1%) |
| Health Care & Social Assistance | 0 (0.0%) | 102 (100.0%) |
| Arts, Entertainment & Recreation | 0 (0.0%) | 0 (0.0%) |
| Accommodation & Food Services | 20 (30.8%) | 45 (69.2%) |
| Public Administration | 6 (54.5%) | 5 (45.5%) |
| Total | 275 (52.5%) | 249 (47.5%) |
Education in Cedar Bluff
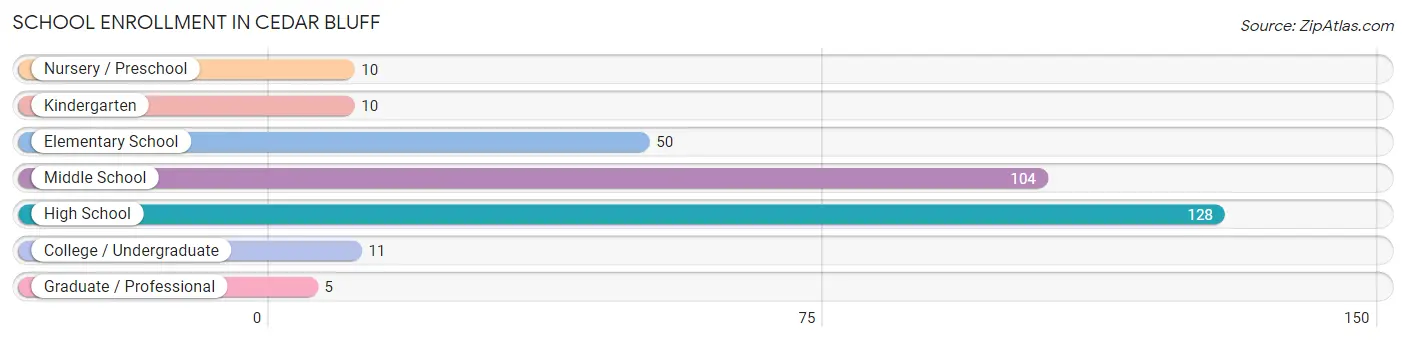
School Enrollment in Cedar Bluff
The most common levels of schooling among the 318 students in Cedar Bluff are high school (128 | 40.3%), middle school (104 | 32.7%), and elementary school (50 | 15.7%).
| School Level | # Students | % Students |
| Nursery / Preschool | 10 | 3.1% |
| Kindergarten | 10 | 3.1% |
| Elementary School | 50 | 15.7% |
| Middle School | 104 | 32.7% |
| High School | 128 | 40.3% |
| College / Undergraduate | 11 | 3.5% |
| Graduate / Professional | 5 | 1.6% |
| Total | 318 | 100.0% |
School Enrollment by Age by Funding Source in Cedar Bluff
Out of a total of 318 students who are enrolled in schools in Cedar Bluff, 10 (3.1%) attend a private institution, while the remaining 308 (96.9%) are enrolled in public schools. The age group of 5 to 9 year old has the highest likelihood of being enrolled in private schools, with 10 (20.4% in the age bracket) enrolled. Conversely, the age group of 3 to 4 year olds has the lowest likelihood of being enrolled in a private school, with 10 (100.0% in the age bracket) attending a public institution.
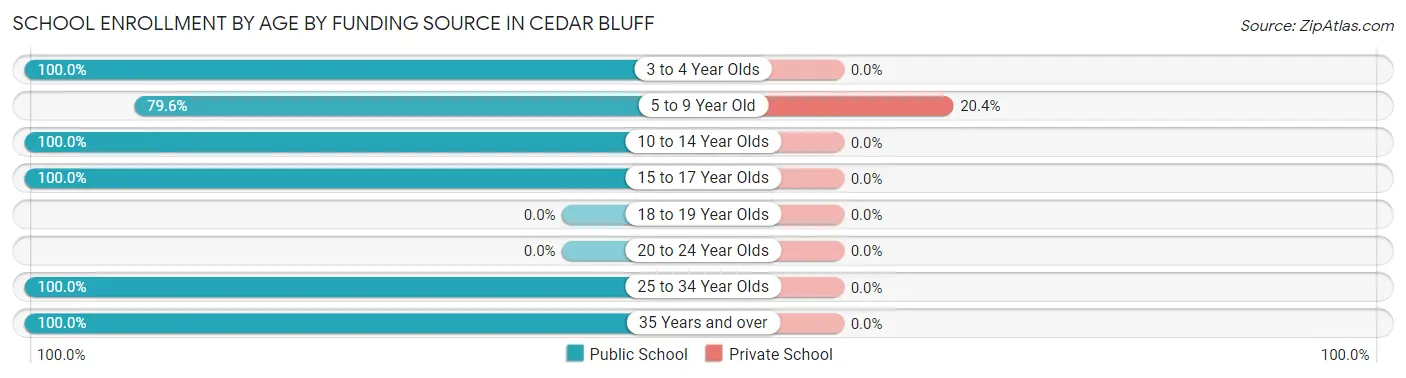
| Age Bracket | Public School | Private School |
| 3 to 4 Year Olds | 10 (100.0%) | 0 (0.0%) |
| 5 to 9 Year Old | 39 (79.6%) | 10 (20.4%) |
| 10 to 14 Year Olds | 120 (100.0%) | 0 (0.0%) |
| 15 to 17 Year Olds | 123 (100.0%) | 0 (0.0%) |
| 18 to 19 Year Olds | 0 (0.0%) | 0 (0.0%) |
| 20 to 24 Year Olds | 0 (0.0%) | 0 (0.0%) |
| 25 to 34 Year Olds | 4 (100.0%) | 0 (0.0%) |
| 35 Years and over | 12 (100.0%) | 0 (0.0%) |
| Total | 308 (96.9%) | 10 (3.1%) |
Educational Attainment by Field of Study in Cedar Bluff
Business (63 | 24.1%), education (56 | 21.5%), science & technology (27 | 10.3%), arts & humanities (25 | 9.6%), and psychology (24 | 9.2%) are the most common fields of study among 261 individuals in Cedar Bluff who have obtained a bachelor's degree or higher.
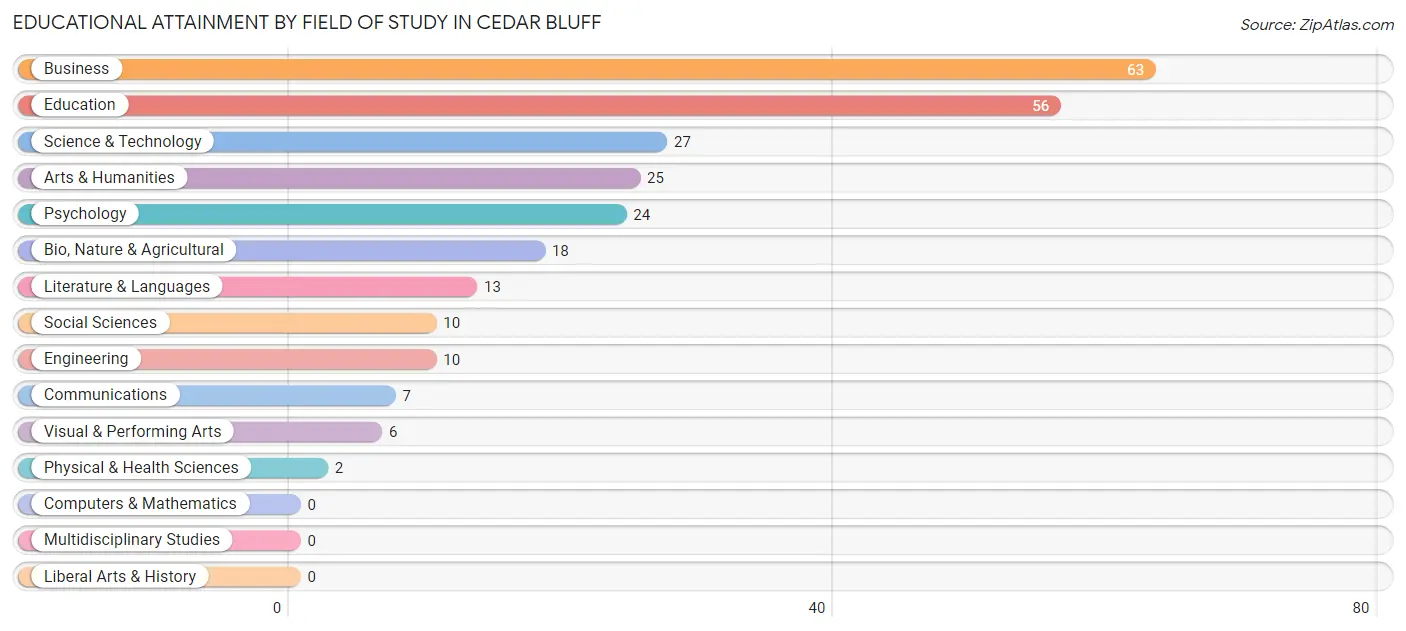
| Field of Study | # Graduates | % Graduates |
| Computers & Mathematics | 0 | 0.0% |
| Bio, Nature & Agricultural | 18 | 6.9% |
| Physical & Health Sciences | 2 | 0.8% |
| Psychology | 24 | 9.2% |
| Social Sciences | 10 | 3.8% |
| Engineering | 10 | 3.8% |
| Multidisciplinary Studies | 0 | 0.0% |
| Science & Technology | 27 | 10.3% |
| Business | 63 | 24.1% |
| Education | 56 | 21.5% |
| Literature & Languages | 13 | 5.0% |
| Liberal Arts & History | 0 | 0.0% |
| Visual & Performing Arts | 6 | 2.3% |
| Communications | 7 | 2.7% |
| Arts & Humanities | 25 | 9.6% |
| Total | 261 | 100.0% |
Transportation & Commute in Cedar Bluff
Vehicle Availability by Sex in Cedar Bluff
The most prevalent vehicle ownership categories in Cedar Bluff are males with 2 vehicles (121, accounting for 45.0%) and females with 2 vehicles (107, making up 50.0%).

| Vehicles Available | Male | Female |
| No Vehicle | 0 (0.0%) | 0 (0.0%) |
| 1 Vehicle | 31 (11.5%) | 53 (21.9%) |
| 2 Vehicles | 121 (45.0%) | 107 (44.2%) |
| 3 Vehicles | 60 (22.3%) | 43 (17.8%) |
| 4 Vehicles | 52 (19.3%) | 39 (16.1%) |
| 5 or more Vehicles | 5 (1.9%) | 0 (0.0%) |
| Total | 269 (100.0%) | 242 (100.0%) |
Commute Time in Cedar Bluff
The most frequently occuring commute durations in Cedar Bluff are less than 5 minutes (78 commuters, 16.1%), 5 to 9 minutes (75 commuters, 15.5%), and 15 to 19 minutes (59 commuters, 12.2%).
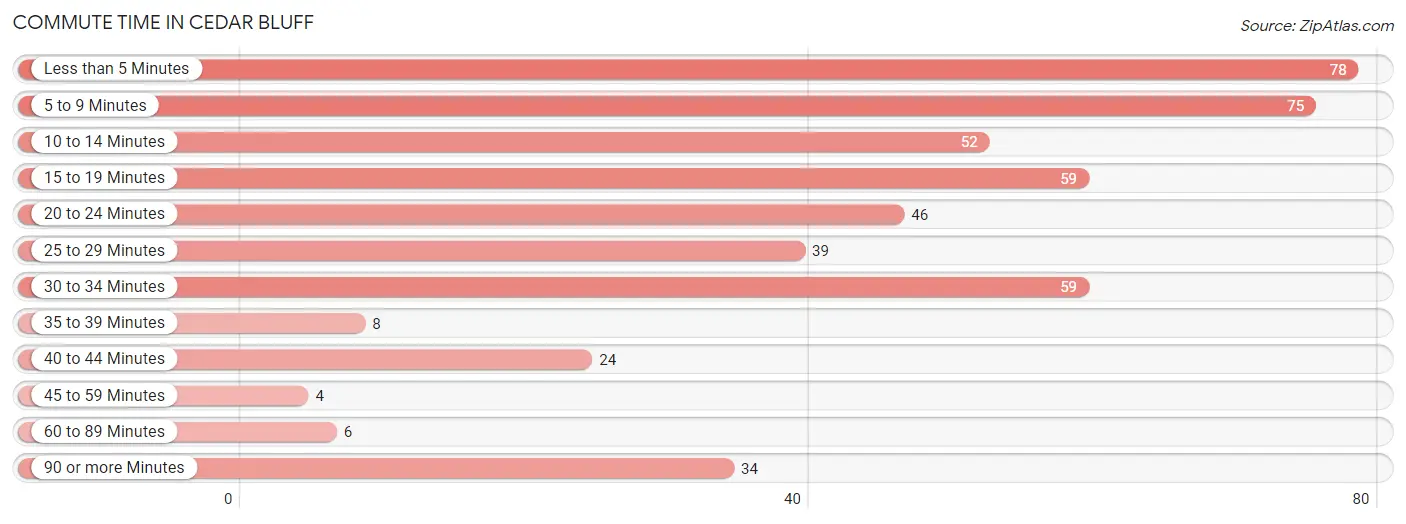
| Commute Time | # Commuters | % Commuters |
| Less than 5 Minutes | 78 | 16.1% |
| 5 to 9 Minutes | 75 | 15.5% |
| 10 to 14 Minutes | 52 | 10.7% |
| 15 to 19 Minutes | 59 | 12.2% |
| 20 to 24 Minutes | 46 | 9.5% |
| 25 to 29 Minutes | 39 | 8.1% |
| 30 to 34 Minutes | 59 | 12.2% |
| 35 to 39 Minutes | 8 | 1.7% |
| 40 to 44 Minutes | 24 | 5.0% |
| 45 to 59 Minutes | 4 | 0.8% |
| 60 to 89 Minutes | 6 | 1.2% |
| 90 or more Minutes | 34 | 7.0% |
Commute Time by Sex in Cedar Bluff
The most common commute times in Cedar Bluff are 20 to 24 minutes (43 commuters, 17.5%) for males and less than 5 minutes (62 commuters, 26.1%) for females.
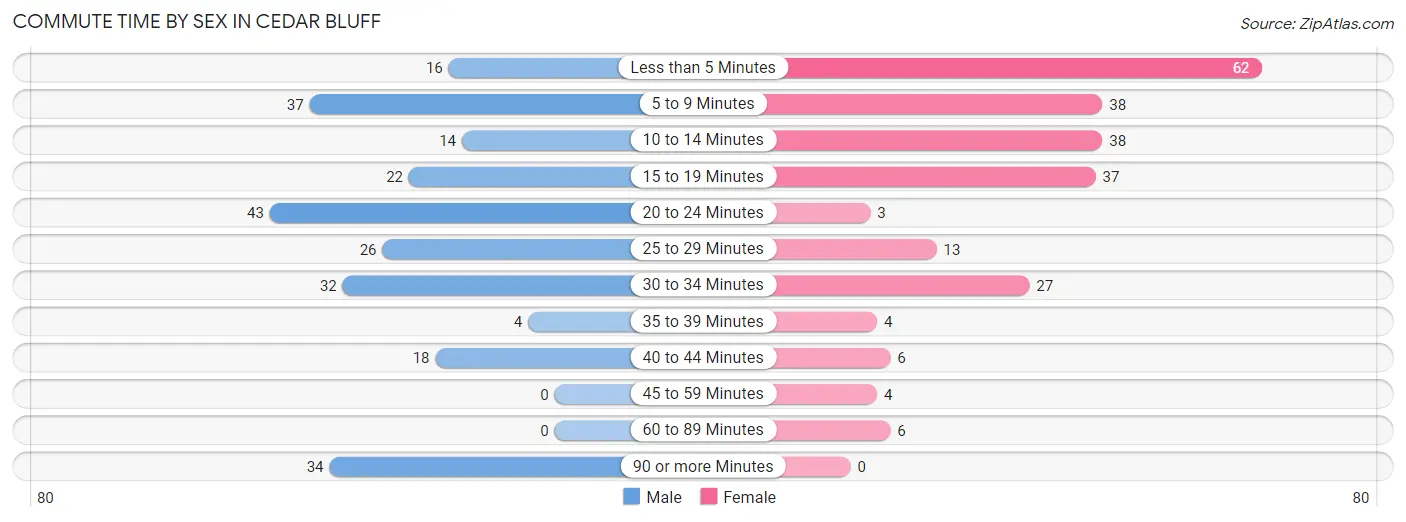
| Commute Time | Male | Female |
| Less than 5 Minutes | 16 (6.5%) | 62 (26.1%) |
| 5 to 9 Minutes | 37 (15.0%) | 38 (16.0%) |
| 10 to 14 Minutes | 14 (5.7%) | 38 (16.0%) |
| 15 to 19 Minutes | 22 (8.9%) | 37 (15.5%) |
| 20 to 24 Minutes | 43 (17.5%) | 3 (1.3%) |
| 25 to 29 Minutes | 26 (10.6%) | 13 (5.5%) |
| 30 to 34 Minutes | 32 (13.0%) | 27 (11.3%) |
| 35 to 39 Minutes | 4 (1.6%) | 4 (1.7%) |
| 40 to 44 Minutes | 18 (7.3%) | 6 (2.5%) |
| 45 to 59 Minutes | 0 (0.0%) | 4 (1.7%) |
| 60 to 89 Minutes | 0 (0.0%) | 6 (2.5%) |
| 90 or more Minutes | 34 (13.8%) | 0 (0.0%) |
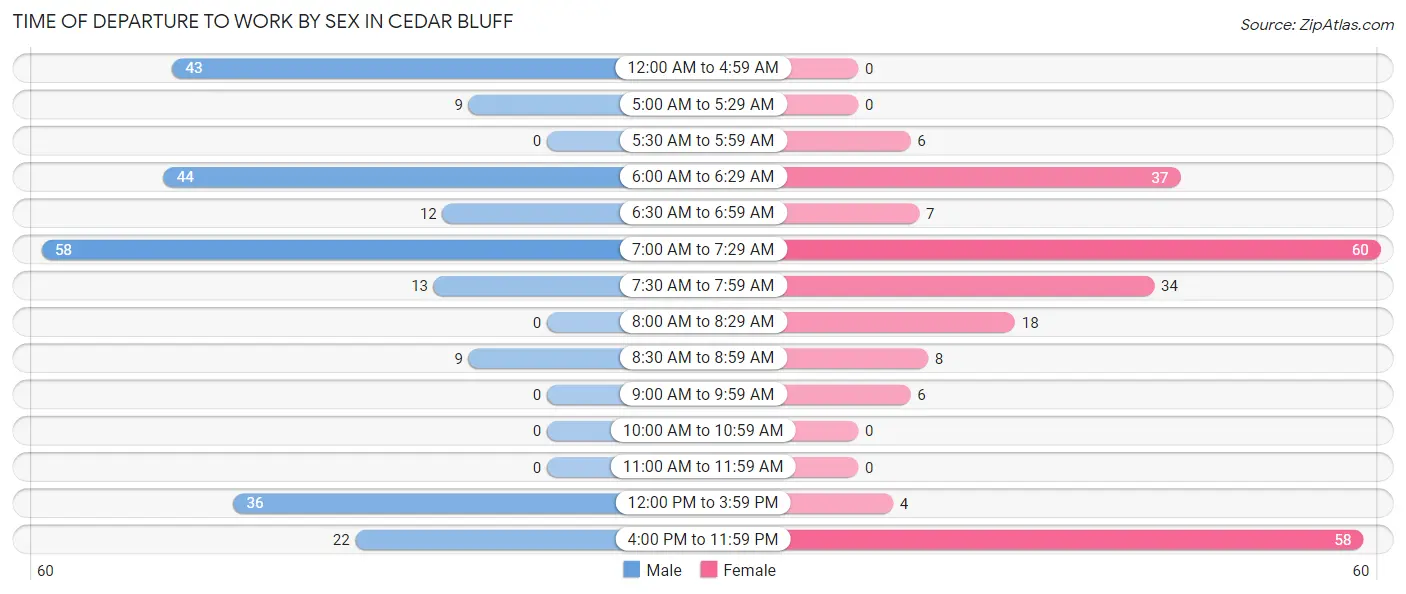
Time of Departure to Work by Sex in Cedar Bluff
The most frequent times of departure to work in Cedar Bluff are 7:00 AM to 7:29 AM (58, 23.6%) for males and 7:00 AM to 7:29 AM (60, 25.2%) for females.
| Time of Departure | Male | Female |
| 12:00 AM to 4:59 AM | 43 (17.5%) | 0 (0.0%) |
| 5:00 AM to 5:29 AM | 9 (3.7%) | 0 (0.0%) |
| 5:30 AM to 5:59 AM | 0 (0.0%) | 6 (2.5%) |
| 6:00 AM to 6:29 AM | 44 (17.9%) | 37 (15.5%) |
| 6:30 AM to 6:59 AM | 12 (4.9%) | 7 (2.9%) |
| 7:00 AM to 7:29 AM | 58 (23.6%) | 60 (25.2%) |
| 7:30 AM to 7:59 AM | 13 (5.3%) | 34 (14.3%) |
| 8:00 AM to 8:29 AM | 0 (0.0%) | 18 (7.6%) |
| 8:30 AM to 8:59 AM | 9 (3.7%) | 8 (3.4%) |
| 9:00 AM to 9:59 AM | 0 (0.0%) | 6 (2.5%) |
| 10:00 AM to 10:59 AM | 0 (0.0%) | 0 (0.0%) |
| 11:00 AM to 11:59 AM | 0 (0.0%) | 0 (0.0%) |
| 12:00 PM to 3:59 PM | 36 (14.6%) | 4 (1.7%) |
| 4:00 PM to 11:59 PM | 22 (8.9%) | 58 (24.4%) |
| Total | 246 (100.0%) | 238 (100.0%) |
Housing Occupancy in Cedar Bluff
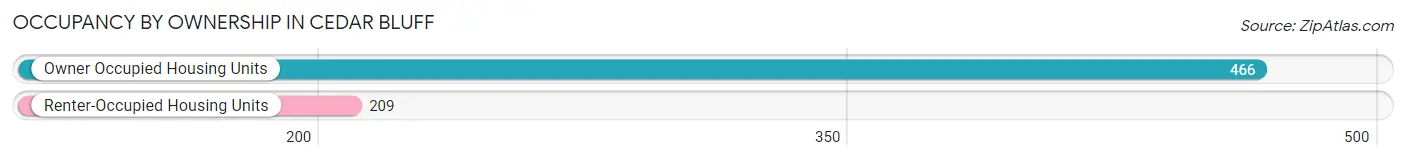
Occupancy by Ownership in Cedar Bluff
Of the total 675 dwellings in Cedar Bluff, owner-occupied units account for 466 (69.0%), while renter-occupied units make up 209 (31.0%).
| Occupancy | # Housing Units | % Housing Units |
| Owner Occupied Housing Units | 466 | 69.0% |
| Renter-Occupied Housing Units | 209 | 31.0% |
| Total Occupied Housing Units | 675 | 100.0% |
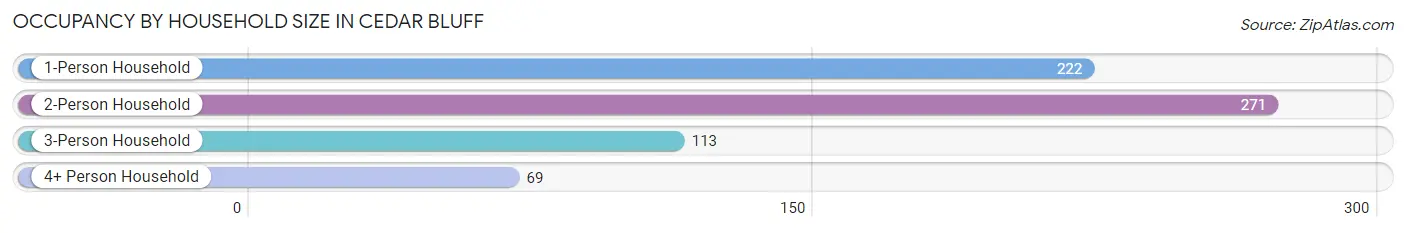
Occupancy by Household Size in Cedar Bluff
| Household Size | # Housing Units | % Housing Units |
| 1-Person Household | 222 | 32.9% |
| 2-Person Household | 271 | 40.2% |
| 3-Person Household | 113 | 16.7% |
| 4+ Person Household | 69 | 10.2% |
| Total Housing Units | 675 | 100.0% |
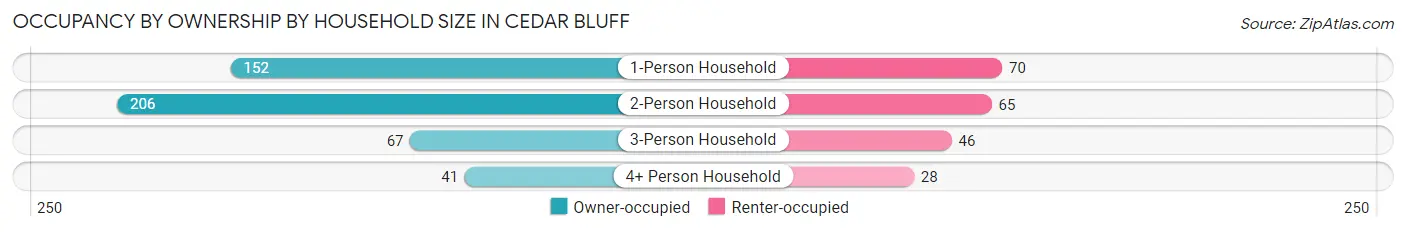
Occupancy by Ownership by Household Size in Cedar Bluff
| Household Size | Owner-occupied | Renter-occupied |
| 1-Person Household | 152 (68.5%) | 70 (31.5%) |
| 2-Person Household | 206 (76.0%) | 65 (24.0%) |
| 3-Person Household | 67 (59.3%) | 46 (40.7%) |
| 4+ Person Household | 41 (59.4%) | 28 (40.6%) |
| Total Housing Units | 466 (69.0%) | 209 (31.0%) |
Occupancy by Educational Attainment in Cedar Bluff
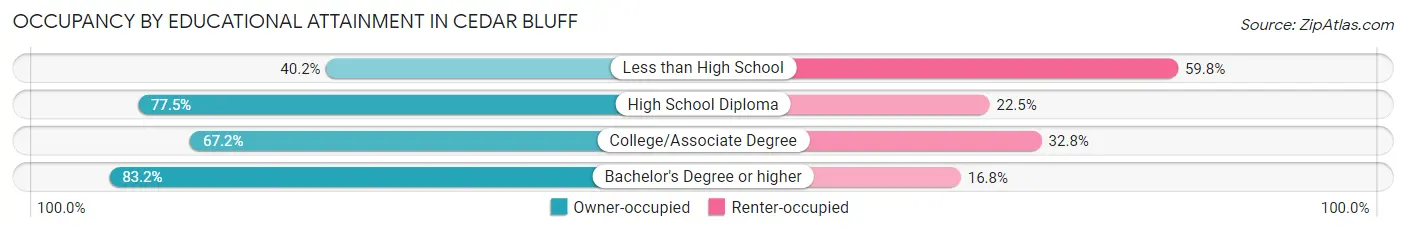
| Household Size | Owner-occupied | Renter-occupied |
| Less than High School | 49 (40.2%) | 73 (59.8%) |
| High School Diploma | 169 (77.5%) | 49 (22.5%) |
| College/Associate Degree | 129 (67.2%) | 63 (32.8%) |
| Bachelor's Degree or higher | 119 (83.2%) | 24 (16.8%) |
Occupancy by Age of Householder in Cedar Bluff
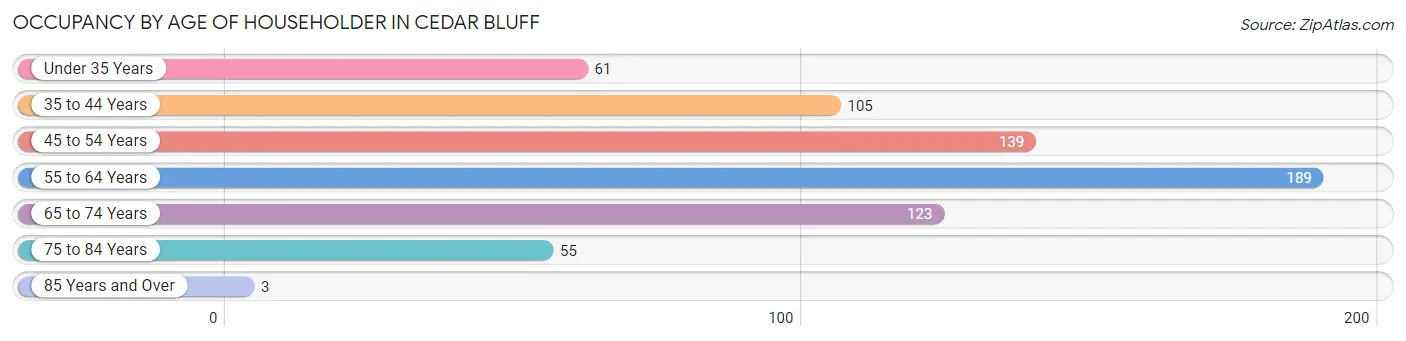
| Age Bracket | # Households | % Households |
| Under 35 Years | 61 | 9.0% |
| 35 to 44 Years | 105 | 15.6% |
| 45 to 54 Years | 139 | 20.6% |
| 55 to 64 Years | 189 | 28.0% |
| 65 to 74 Years | 123 | 18.2% |
| 75 to 84 Years | 55 | 8.2% |
| 85 Years and Over | 3 | 0.4% |
| Total | 675 | 100.0% |
Housing Finances in Cedar Bluff
Median Income by Occupancy in Cedar Bluff
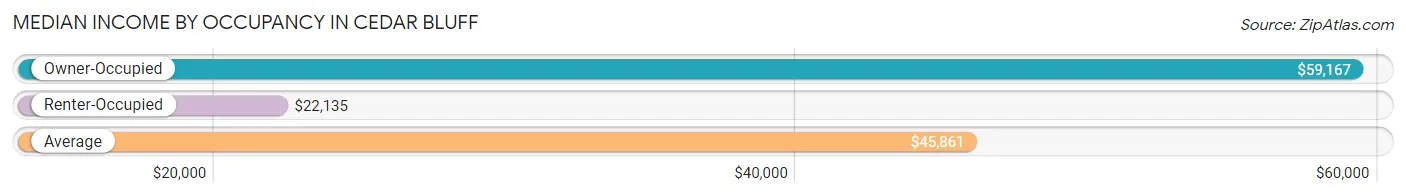
| Occupancy Type | # Households | Median Income |
| Owner-Occupied | 466 (69.0%) | $59,167 |
| Renter-Occupied | 209 (31.0%) | $22,135 |
| Average | 675 (100.0%) | $45,861 |
Occupancy by Householder Income Bracket in Cedar Bluff
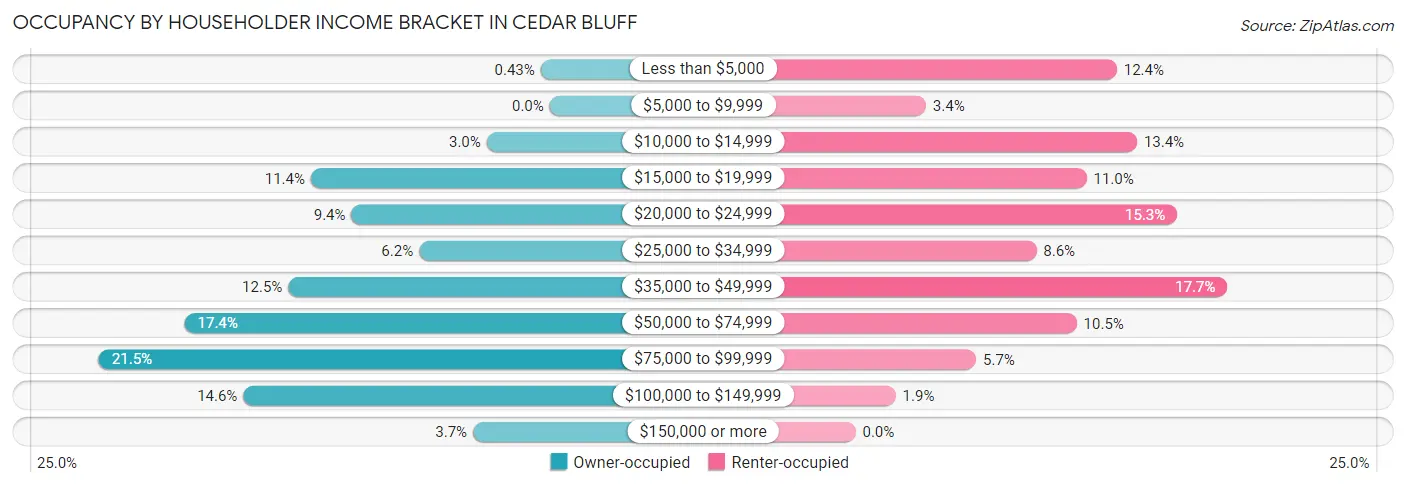
| Income Bracket | Owner-occupied | Renter-occupied |
| Less than $5,000 | 2 (0.4%) | 26 (12.4%) |
| $5,000 to $9,999 | 0 (0.0%) | 7 (3.4%) |
| $10,000 to $14,999 | 14 (3.0%) | 28 (13.4%) |
| $15,000 to $19,999 | 53 (11.4%) | 23 (11.0%) |
| $20,000 to $24,999 | 44 (9.4%) | 32 (15.3%) |
| $25,000 to $34,999 | 29 (6.2%) | 18 (8.6%) |
| $35,000 to $49,999 | 58 (12.4%) | 37 (17.7%) |
| $50,000 to $74,999 | 81 (17.4%) | 22 (10.5%) |
| $75,000 to $99,999 | 100 (21.5%) | 12 (5.7%) |
| $100,000 to $149,999 | 68 (14.6%) | 4 (1.9%) |
| $150,000 or more | 17 (3.6%) | 0 (0.0%) |
| Total | 466 (100.0%) | 209 (100.0%) |
Monthly Housing Cost Tiers in Cedar Bluff
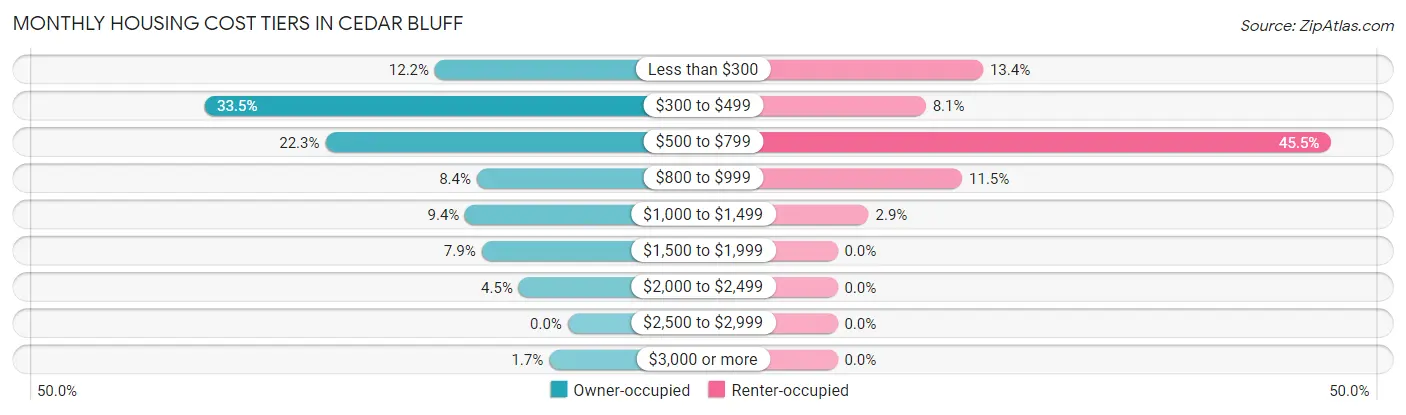
| Monthly Cost | Owner-occupied | Renter-occupied |
| Less than $300 | 57 (12.2%) | 28 (13.4%) |
| $300 to $499 | 156 (33.5%) | 17 (8.1%) |
| $500 to $799 | 104 (22.3%) | 95 (45.5%) |
| $800 to $999 | 39 (8.4%) | 24 (11.5%) |
| $1,000 to $1,499 | 44 (9.4%) | 6 (2.9%) |
| $1,500 to $1,999 | 37 (7.9%) | 0 (0.0%) |
| $2,000 to $2,499 | 21 (4.5%) | 0 (0.0%) |
| $2,500 to $2,999 | 0 (0.0%) | 0 (0.0%) |
| $3,000 or more | 8 (1.7%) | 0 (0.0%) |
| Total | 466 (100.0%) | 209 (100.0%) |
Physical Housing Characteristics in Cedar Bluff
Housing Structures in Cedar Bluff
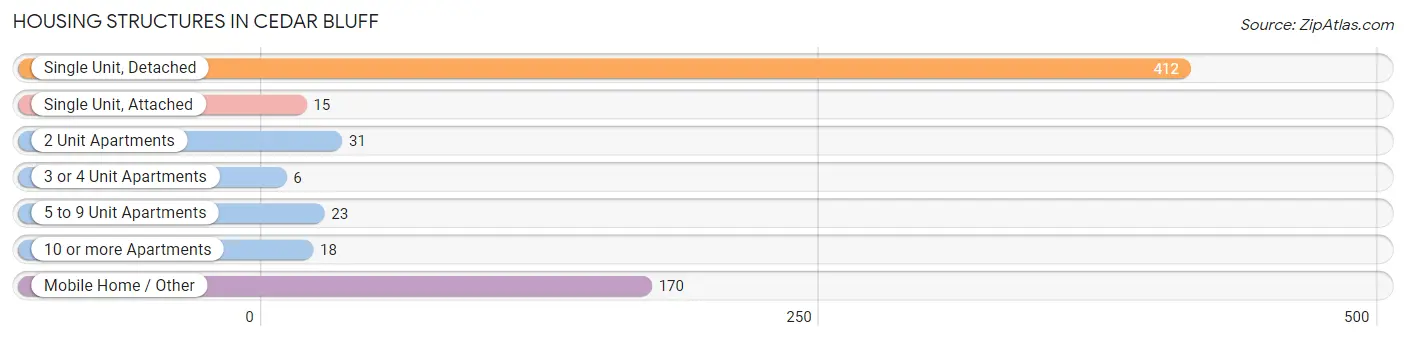
| Structure Type | # Housing Units | % Housing Units |
| Single Unit, Detached | 412 | 61.0% |
| Single Unit, Attached | 15 | 2.2% |
| 2 Unit Apartments | 31 | 4.6% |
| 3 or 4 Unit Apartments | 6 | 0.9% |
| 5 to 9 Unit Apartments | 23 | 3.4% |
| 10 or more Apartments | 18 | 2.7% |
| Mobile Home / Other | 170 | 25.2% |
| Total | 675 | 100.0% |
Housing Structures by Occupancy in Cedar Bluff
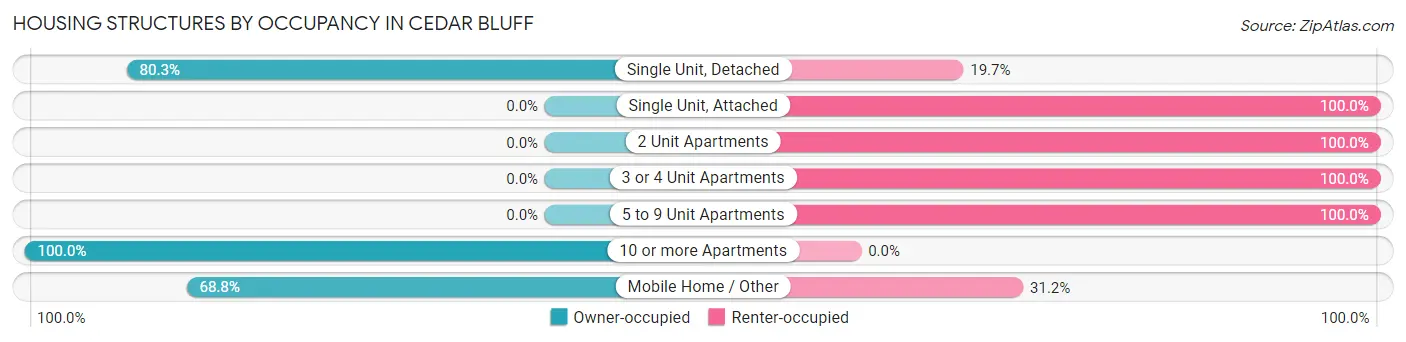
| Structure Type | Owner-occupied | Renter-occupied |
| Single Unit, Detached | 331 (80.3%) | 81 (19.7%) |
| Single Unit, Attached | 0 (0.0%) | 15 (100.0%) |
| 2 Unit Apartments | 0 (0.0%) | 31 (100.0%) |
| 3 or 4 Unit Apartments | 0 (0.0%) | 6 (100.0%) |
| 5 to 9 Unit Apartments | 0 (0.0%) | 23 (100.0%) |
| 10 or more Apartments | 18 (100.0%) | 0 (0.0%) |
| Mobile Home / Other | 117 (68.8%) | 53 (31.2%) |
| Total | 466 (69.0%) | 209 (31.0%) |
Housing Structures by Number of Rooms in Cedar Bluff
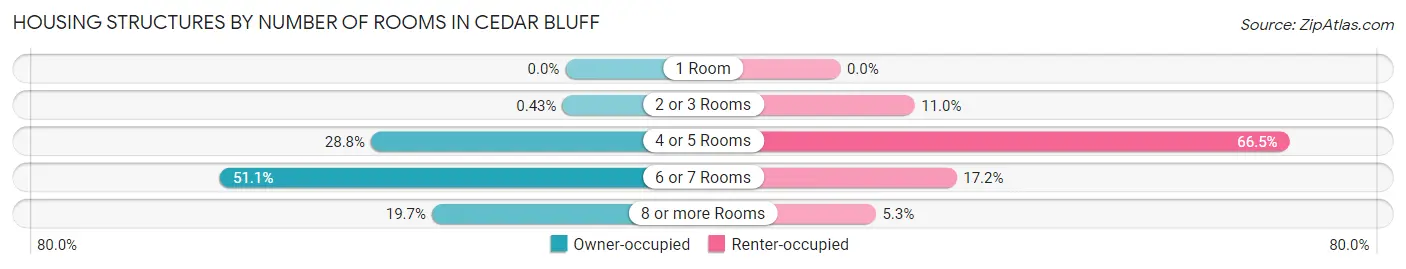
| Number of Rooms | Owner-occupied | Renter-occupied |
| 1 Room | 0 (0.0%) | 0 (0.0%) |
| 2 or 3 Rooms | 2 (0.4%) | 23 (11.0%) |
| 4 or 5 Rooms | 134 (28.8%) | 139 (66.5%) |
| 6 or 7 Rooms | 238 (51.1%) | 36 (17.2%) |
| 8 or more Rooms | 92 (19.7%) | 11 (5.3%) |
| Total | 466 (100.0%) | 209 (100.0%) |
Housing Structure by Heating Type in Cedar Bluff
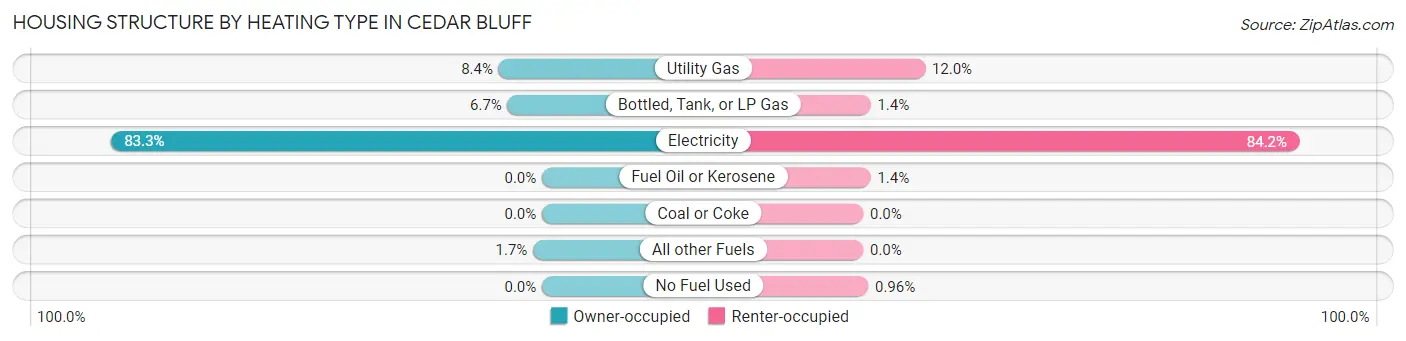
| Heating Type | Owner-occupied | Renter-occupied |
| Utility Gas | 39 (8.4%) | 25 (12.0%) |
| Bottled, Tank, or LP Gas | 31 (6.7%) | 3 (1.4%) |
| Electricity | 388 (83.3%) | 176 (84.2%) |
| Fuel Oil or Kerosene | 0 (0.0%) | 3 (1.4%) |
| Coal or Coke | 0 (0.0%) | 0 (0.0%) |
| All other Fuels | 8 (1.7%) | 0 (0.0%) |
| No Fuel Used | 0 (0.0%) | 2 (1.0%) |
| Total | 466 (100.0%) | 209 (100.0%) |
Household Vehicle Usage in Cedar Bluff
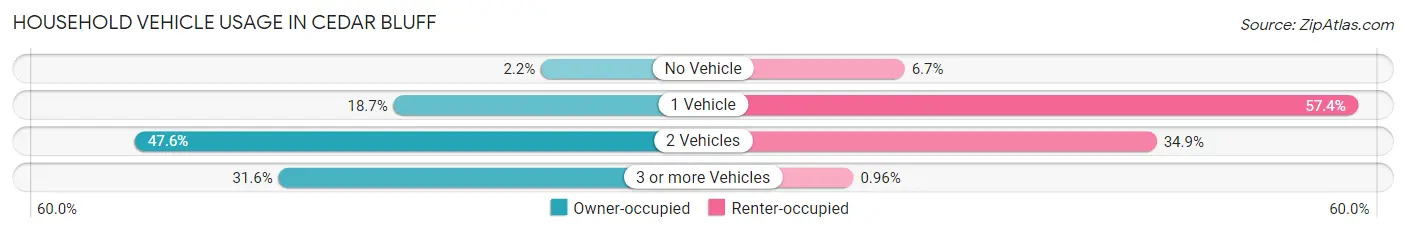
| Vehicles per Household | Owner-occupied | Renter-occupied |
| No Vehicle | 10 (2.1%) | 14 (6.7%) |
| 1 Vehicle | 87 (18.7%) | 120 (57.4%) |
| 2 Vehicles | 222 (47.6%) | 73 (34.9%) |
| 3 or more Vehicles | 147 (31.6%) | 2 (1.0%) |
| Total | 466 (100.0%) | 209 (100.0%) |
Real Estate & Mortgages in Cedar Bluff
Real Estate and Mortgage Overview in Cedar Bluff
| Characteristic | Without Mortgage | With Mortgage |
| Housing Units | 309 | 157 |
| Median Property Value | $132,000 | $211,500 |
| Median Household Income | $53,125 | $8 |
| Monthly Housing Costs | $416 | $8 |
| Real Estate Taxes | $489 | $18 |
Property Value by Mortgage Status in Cedar Bluff
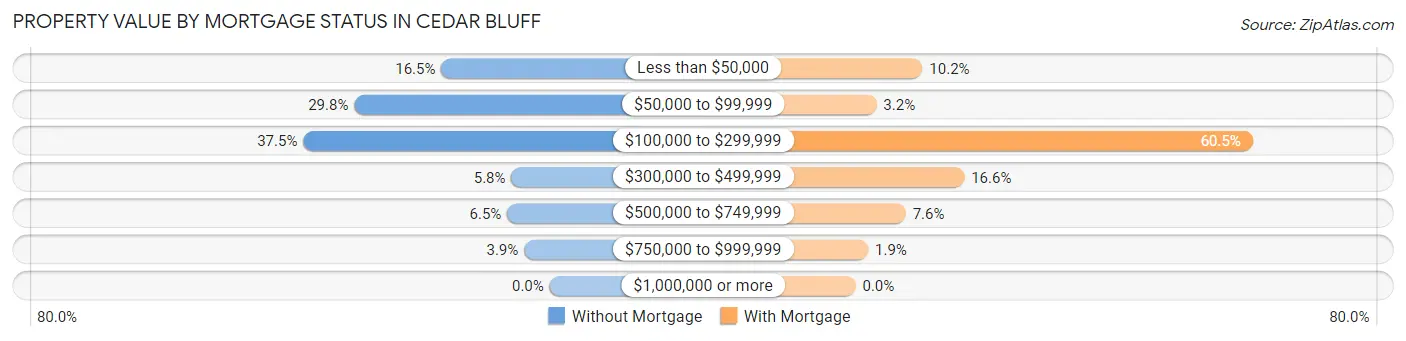
| Property Value | Without Mortgage | With Mortgage |
| Less than $50,000 | 51 (16.5%) | 16 (10.2%) |
| $50,000 to $99,999 | 92 (29.8%) | 5 (3.2%) |
| $100,000 to $299,999 | 116 (37.5%) | 95 (60.5%) |
| $300,000 to $499,999 | 18 (5.8%) | 26 (16.6%) |
| $500,000 to $749,999 | 20 (6.5%) | 12 (7.6%) |
| $750,000 to $999,999 | 12 (3.9%) | 3 (1.9%) |
| $1,000,000 or more | 0 (0.0%) | 0 (0.0%) |
| Total | 309 (100.0%) | 157 (100.0%) |
Household Income by Mortgage Status in Cedar Bluff
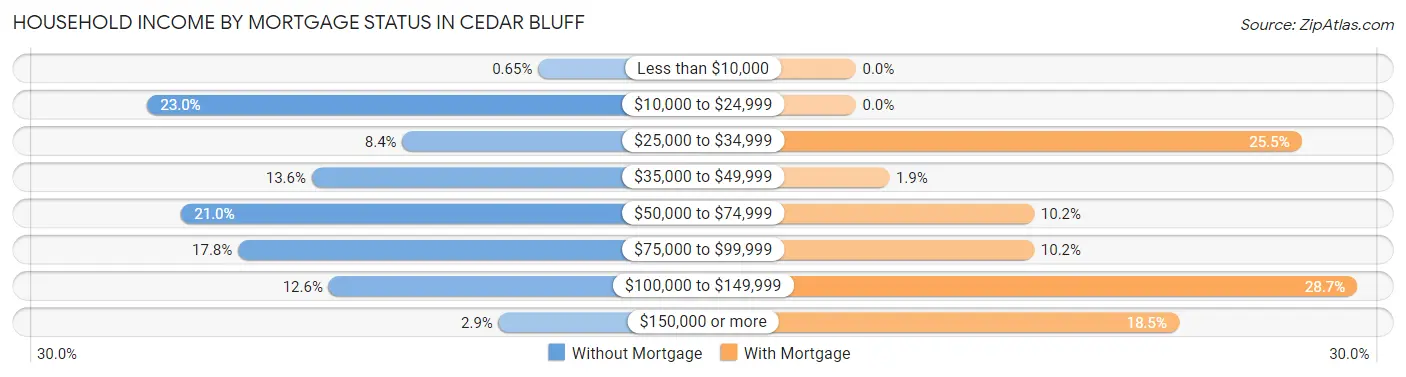
| Household Income | Without Mortgage | With Mortgage |
| Less than $10,000 | 2 (0.6%) | 0 (0.0%) |
| $10,000 to $24,999 | 71 (23.0%) | 0 (0.0%) |
| $25,000 to $34,999 | 26 (8.4%) | 40 (25.5%) |
| $35,000 to $49,999 | 42 (13.6%) | 3 (1.9%) |
| $50,000 to $74,999 | 65 (21.0%) | 16 (10.2%) |
| $75,000 to $99,999 | 55 (17.8%) | 16 (10.2%) |
| $100,000 to $149,999 | 39 (12.6%) | 45 (28.7%) |
| $150,000 or more | 9 (2.9%) | 29 (18.5%) |
| Total | 309 (100.0%) | 157 (100.0%) |
Property Value to Household Income Ratio in Cedar Bluff
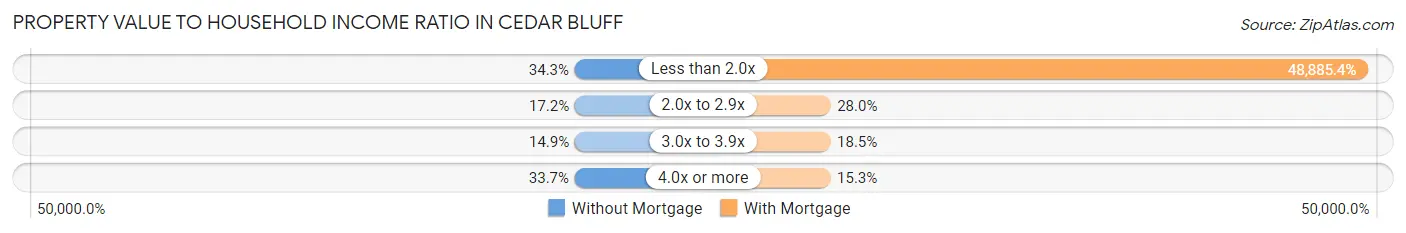
| Value-to-Income Ratio | Without Mortgage | With Mortgage |
| Less than 2.0x | 106 (34.3%) | 76,750 (48,885.3%) |
| 2.0x to 2.9x | 53 (17.2%) | 44 (28.0%) |
| 3.0x to 3.9x | 46 (14.9%) | 29 (18.5%) |
| 4.0x or more | 104 (33.7%) | 24 (15.3%) |
| Total | 309 (100.0%) | 157 (100.0%) |
Real Estate Taxes by Mortgage Status in Cedar Bluff
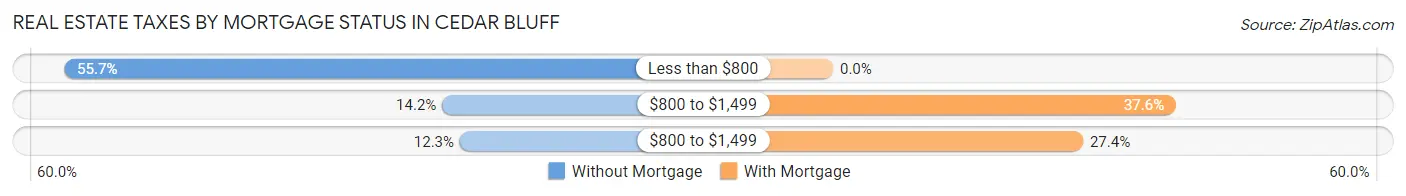
| Property Taxes | Without Mortgage | With Mortgage |
| Less than $800 | 172 (55.7%) | 0 (0.0%) |
| $800 to $1,499 | 44 (14.2%) | 59 (37.6%) |
| $800 to $1,499 | 38 (12.3%) | 43 (27.4%) |
| Total | 309 (100.0%) | 157 (100.0%) |
Health & Disability in Cedar Bluff
Health Insurance Coverage by Age in Cedar Bluff
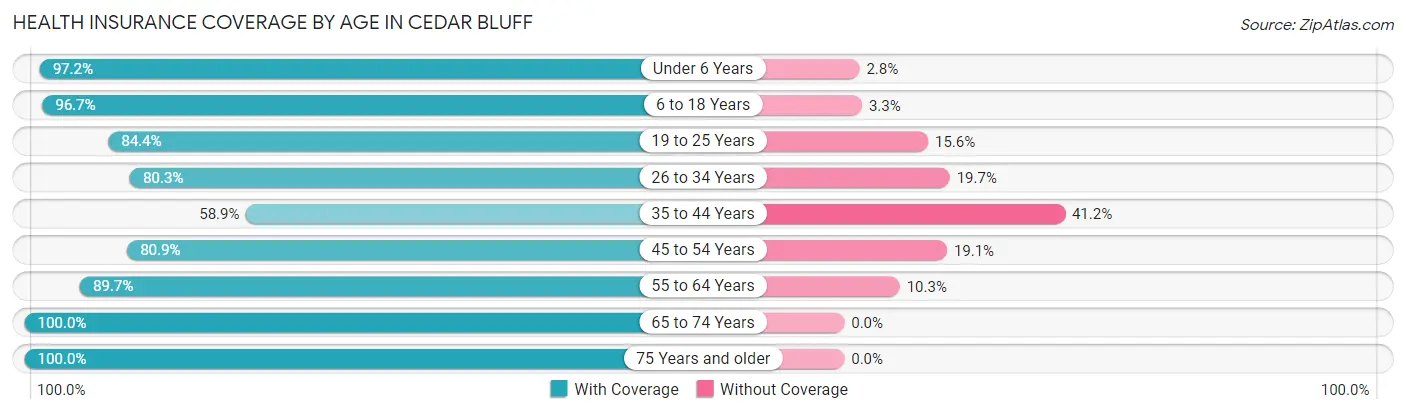
| Age Bracket | With Coverage | Without Coverage |
| Under 6 Years | 103 (97.2%) | 3 (2.8%) |
| 6 to 18 Years | 293 (96.7%) | 10 (3.3%) |
| 19 to 25 Years | 54 (84.4%) | 10 (15.6%) |
| 26 to 34 Years | 94 (80.3%) | 23 (19.7%) |
| 35 to 44 Years | 143 (58.9%) | 100 (41.1%) |
| 45 to 54 Years | 169 (80.9%) | 40 (19.1%) |
| 55 to 64 Years | 286 (89.7%) | 33 (10.3%) |
| 65 to 74 Years | 229 (100.0%) | 0 (0.0%) |
| 75 Years and older | 82 (100.0%) | 0 (0.0%) |
| Total | 1,453 (86.9%) | 219 (13.1%) |
Health Insurance Coverage by Citizenship Status in Cedar Bluff
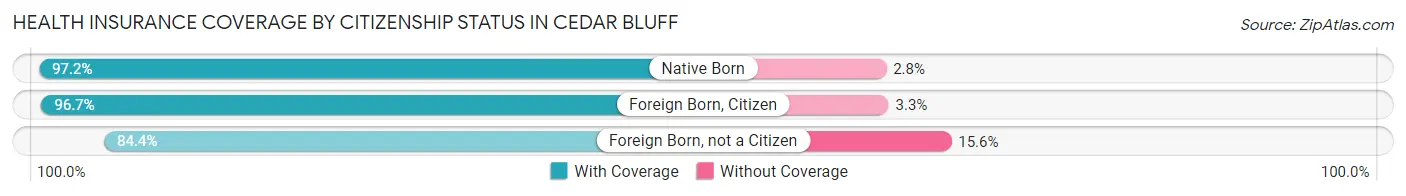
| Citizenship Status | With Coverage | Without Coverage |
| Native Born | 103 (97.2%) | 3 (2.8%) |
| Foreign Born, Citizen | 293 (96.7%) | 10 (3.3%) |
| Foreign Born, not a Citizen | 54 (84.4%) | 10 (15.6%) |
Health Insurance Coverage by Household Income in Cedar Bluff
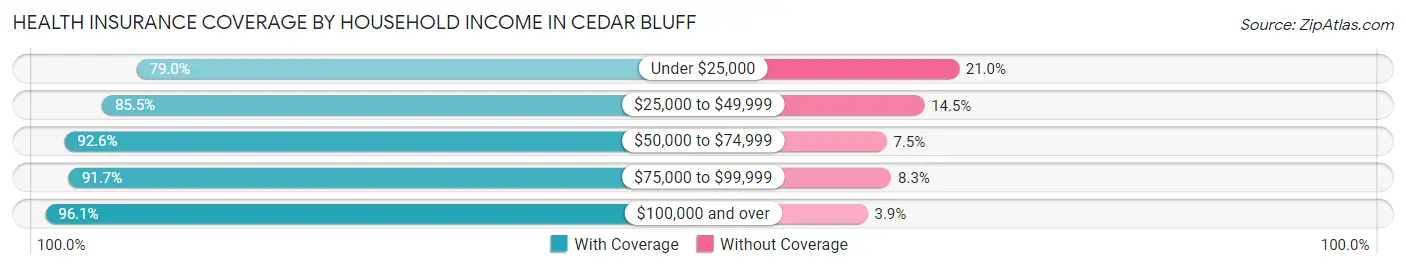
| Household Income | With Coverage | Without Coverage |
| Under $25,000 | 467 (79.0%) | 124 (21.0%) |
| $25,000 to $49,999 | 283 (85.5%) | 48 (14.5%) |
| $50,000 to $74,999 | 174 (92.5%) | 14 (7.4%) |
| $75,000 to $99,999 | 232 (91.7%) | 21 (8.3%) |
| $100,000 and over | 297 (96.1%) | 12 (3.9%) |
Public vs Private Health Insurance Coverage by Age in Cedar Bluff
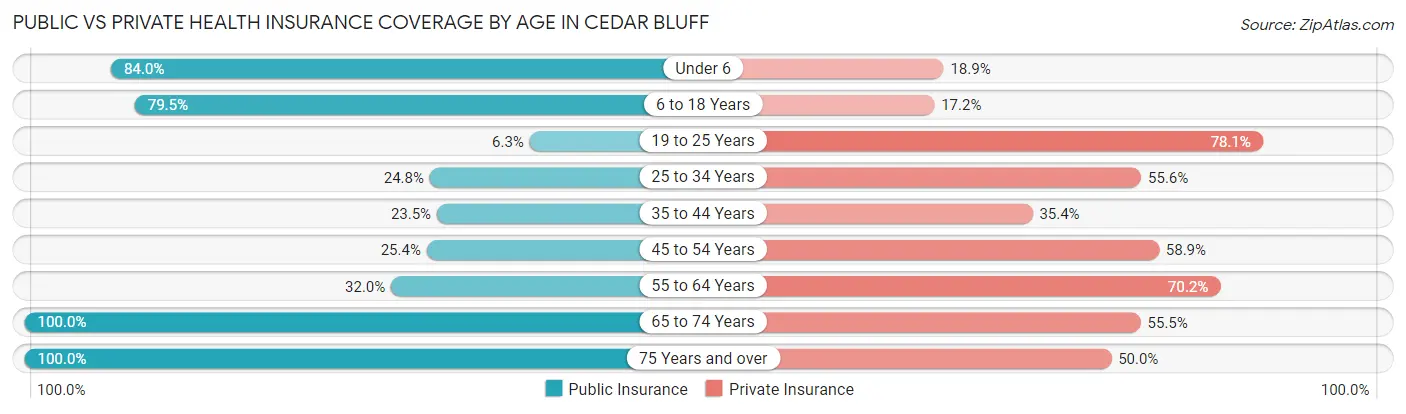
| Age Bracket | Public Insurance | Private Insurance |
| Under 6 | 89 (84.0%) | 20 (18.9%) |
| 6 to 18 Years | 241 (79.5%) | 52 (17.2%) |
| 19 to 25 Years | 4 (6.2%) | 50 (78.1%) |
| 25 to 34 Years | 29 (24.8%) | 65 (55.6%) |
| 35 to 44 Years | 57 (23.5%) | 86 (35.4%) |
| 45 to 54 Years | 53 (25.4%) | 123 (58.9%) |
| 55 to 64 Years | 102 (32.0%) | 224 (70.2%) |
| 65 to 74 Years | 229 (100.0%) | 127 (55.5%) |
| 75 Years and over | 82 (100.0%) | 41 (50.0%) |
| Total | 886 (53.0%) | 788 (47.1%) |
Disability Status by Sex by Age in Cedar Bluff
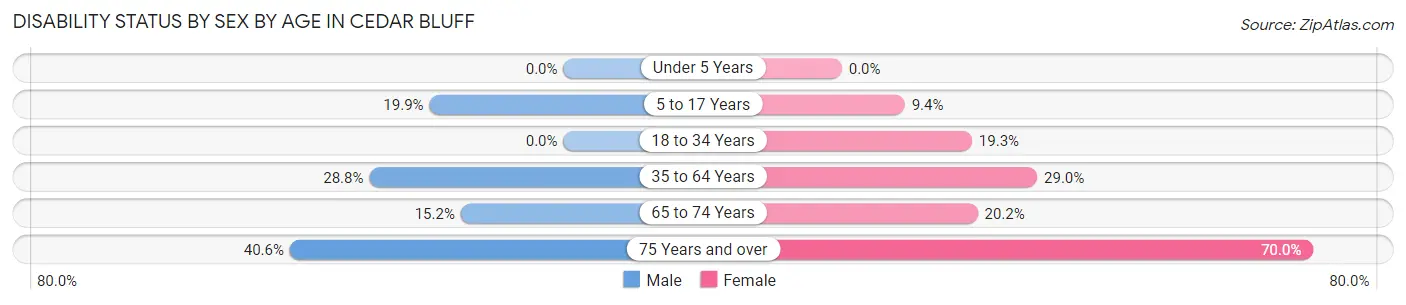
| Age Bracket | Male | Female |
| Under 5 Years | 0 (0.0%) | 0 (0.0%) |
| 5 to 17 Years | 37 (19.9%) | 13 (9.3%) |
| 18 to 34 Years | 0 (0.0%) | 17 (19.3%) |
| 35 to 64 Years | 98 (28.8%) | 125 (29.0%) |
| 65 to 74 Years | 16 (15.2%) | 25 (20.2%) |
| 75 Years and over | 13 (40.6%) | 35 (70.0%) |
Disability Class by Sex by Age in Cedar Bluff
Disability Class: Hearing Difficulty
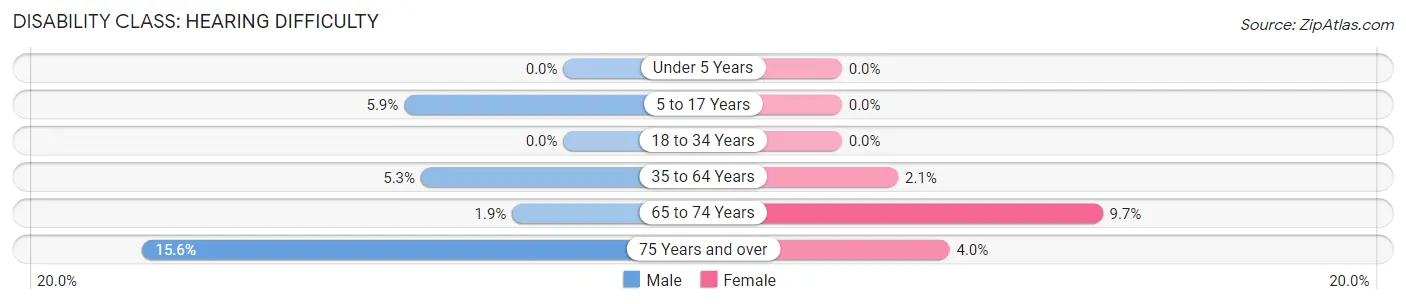
| Age Bracket | Male | Female |
| Under 5 Years | 0 (0.0%) | 0 (0.0%) |
| 5 to 17 Years | 11 (5.9%) | 0 (0.0%) |
| 18 to 34 Years | 0 (0.0%) | 0 (0.0%) |
| 35 to 64 Years | 18 (5.3%) | 9 (2.1%) |
| 65 to 74 Years | 2 (1.9%) | 12 (9.7%) |
| 75 Years and over | 5 (15.6%) | 2 (4.0%) |
Disability Class: Vision Difficulty
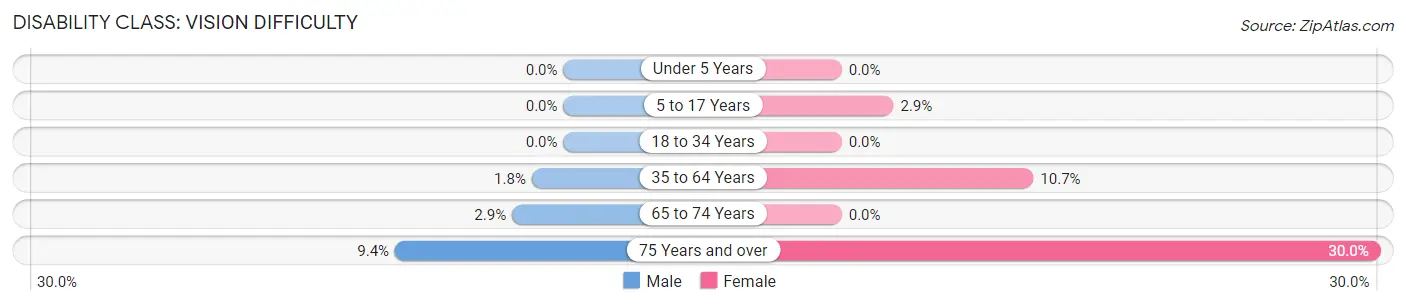
| Age Bracket | Male | Female |
| Under 5 Years | 0 (0.0%) | 0 (0.0%) |
| 5 to 17 Years | 0 (0.0%) | 4 (2.9%) |
| 18 to 34 Years | 0 (0.0%) | 0 (0.0%) |
| 35 to 64 Years | 6 (1.8%) | 46 (10.7%) |
| 65 to 74 Years | 3 (2.9%) | 0 (0.0%) |
| 75 Years and over | 3 (9.4%) | 15 (30.0%) |
Disability Class: Cognitive Difficulty
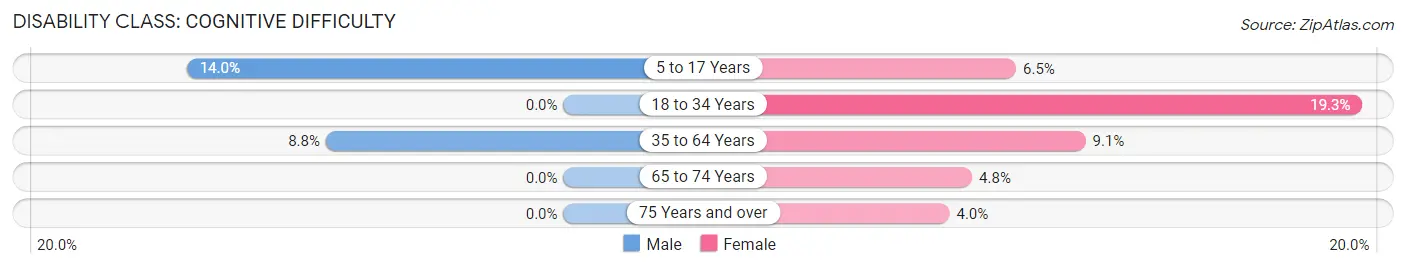
| Age Bracket | Male | Female |
| 5 to 17 Years | 26 (14.0%) | 9 (6.5%) |
| 18 to 34 Years | 0 (0.0%) | 17 (19.3%) |
| 35 to 64 Years | 30 (8.8%) | 39 (9.0%) |
| 65 to 74 Years | 0 (0.0%) | 6 (4.8%) |
| 75 Years and over | 0 (0.0%) | 2 (4.0%) |
Disability Class: Ambulatory Difficulty
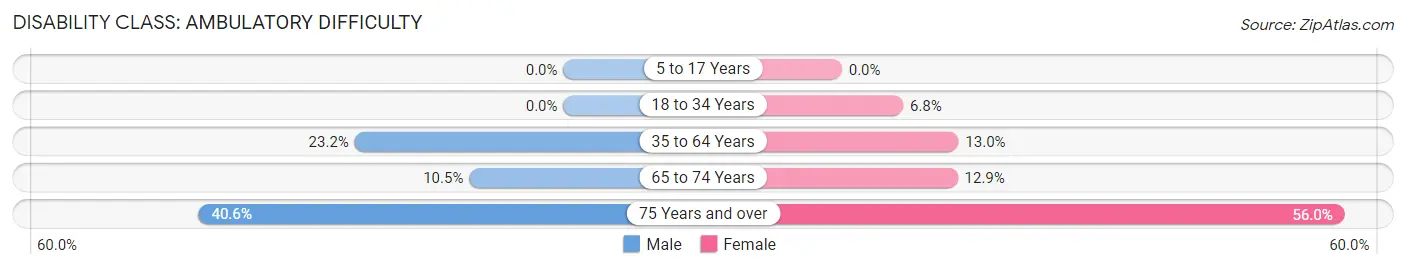
| Age Bracket | Male | Female |
| 5 to 17 Years | 0 (0.0%) | 0 (0.0%) |
| 18 to 34 Years | 0 (0.0%) | 6 (6.8%) |
| 35 to 64 Years | 79 (23.2%) | 56 (13.0%) |
| 65 to 74 Years | 11 (10.5%) | 16 (12.9%) |
| 75 Years and over | 13 (40.6%) | 28 (56.0%) |
Disability Class: Self-Care Difficulty
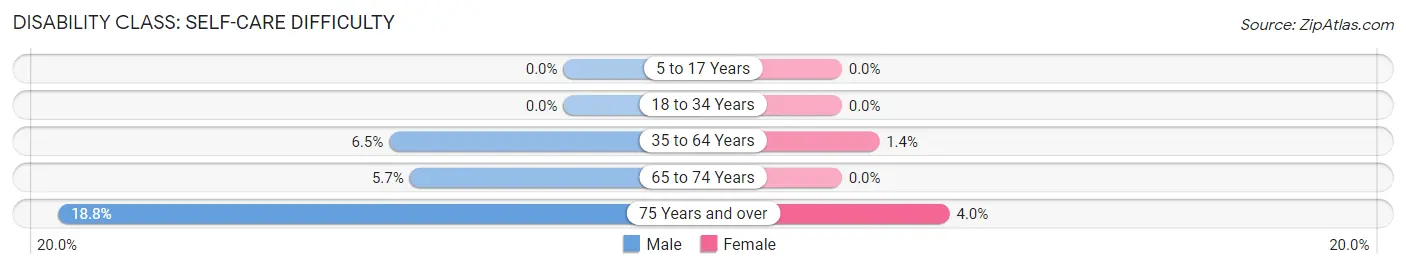
| Age Bracket | Male | Female |
| 5 to 17 Years | 0 (0.0%) | 0 (0.0%) |
| 18 to 34 Years | 0 (0.0%) | 0 (0.0%) |
| 35 to 64 Years | 22 (6.5%) | 6 (1.4%) |
| 65 to 74 Years | 6 (5.7%) | 0 (0.0%) |
| 75 Years and over | 6 (18.8%) | 2 (4.0%) |
Technology Access in Cedar Bluff
Computing Device Access in Cedar Bluff
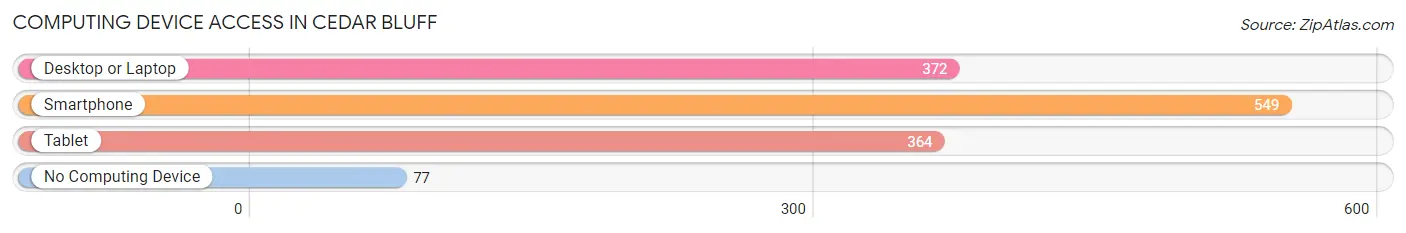
| Device Type | # Households | % Households |
| Desktop or Laptop | 372 | 55.1% |
| Smartphone | 549 | 81.3% |
| Tablet | 364 | 53.9% |
| No Computing Device | 77 | 11.4% |
| Total | 675 | 100.0% |
Internet Access in Cedar Bluff
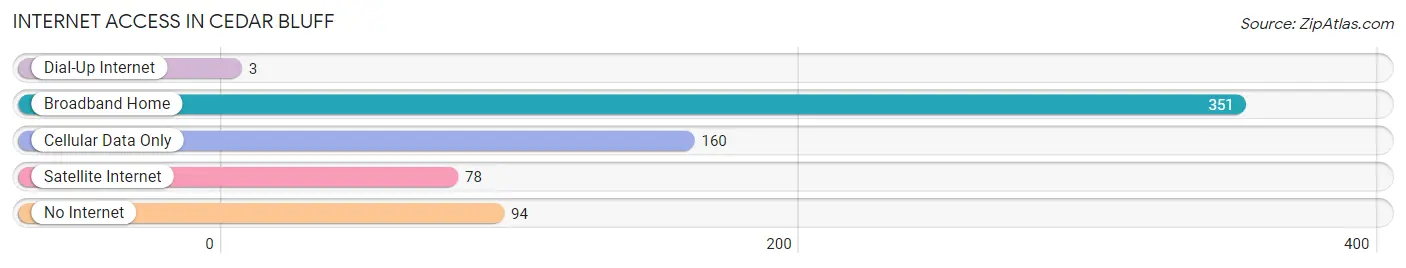
| Internet Type | # Households | % Households |
| Dial-Up Internet | 3 | 0.4% |
| Broadband Home | 351 | 52.0% |
| Cellular Data Only | 160 | 23.7% |
| Satellite Internet | 78 | 11.6% |
| No Internet | 94 | 13.9% |
| Total | 675 | 100.0% |
Cedar Bluff Summary
Cedar Bluff is a town located in Cherokee County, Alabama, United States. It is situated along the banks of the Coosa River, and is part of the Gadsden Metropolitan Statistical Area. The population of Cedar Bluff was 1,845 at the 2010 census.
History
Cedar Bluff was founded in 1836 by settlers from Georgia and Tennessee. The town was named for the abundance of cedar trees in the area. The town was incorporated in 1887.
During the Civil War, Cedar Bluff was a major supply depot for the Confederate Army. The town was also the site of a major battle in 1863, when Union forces attempted to capture the town. The Union forces were unsuccessful, and the town remained in Confederate hands.
In the late 19th century, Cedar Bluff became a popular tourist destination, due to its proximity to the Coosa River. The town was home to several resorts, including the Cedar Bluff Hotel, which was built in 1891.
Geography
Cedar Bluff is located at 34°45'25" North, 85°45'25" West (34.756944, -85.756944). The town is situated along the banks of the Coosa River, and is part of the Gadsden Metropolitan Statistical Area.
According to the United States Census Bureau, the town has a total area of 2.2 square miles (5.7 km2), all land.
Demographics
As of the census of 2010, there were 1,845 people, 745 households, and 486 families residing in the town. The population density was 837.5 people per square mile (323.7/km2). There were 845 housing units at an average density of 382.7 per square mile (147.7/km2). The racial makeup of the town was 92.2% White, 4.2% African American, 0.2% Native American, 0.7% Asian, 0.1% Pacific Islander, 0.9% from other races, and 1.7% from two or more races. Hispanic or Latino of any race were 2.2% of the population.
Economy
Cedar Bluff is home to several businesses, including a lumber mill, a furniture factory, and a number of retail stores. The town is also home to a number of restaurants, including the popular Cedar Bluff Cafe.
The town is served by the Cherokee County School District, which operates several schools in the area, including Cedar Bluff Elementary School, Cedar Bluff Middle School, and Cedar Bluff High School.
The town is also home to a number of churches, including the First Baptist Church of Cedar Bluff, the Cedar Bluff United Methodist Church, and the Cedar Bluff Church of Christ.
Cedar Bluff is also home to a number of recreational facilities, including the Cedar Bluff Recreation Center, which offers a variety of activities for residents of all ages. The town is also home to several parks, including the Cedar Bluff Park, which features a playground, picnic areas, and a walking trail.
Common Questions
What is Per Capita Income in Cedar Bluff?
Per Capita income in Cedar Bluff is $24,334.
What is the Median Family Income in Cedar Bluff?
Median Family Income in Cedar Bluff is $61,957.
What is the Median Household income in Cedar Bluff?
Median Household Income in Cedar Bluff is $45,861.
What is Income or Wage Gap in Cedar Bluff?
Income or Wage Gap in Cedar Bluff is 47.8%.
Women in Cedar Bluff earn 52.2 cents for every dollar earned by a man.
What is Inequality or Gini Index in Cedar Bluff?
Inequality or Gini Index in Cedar Bluff is 0.43.
What is the Total Population of Cedar Bluff?
Total Population of Cedar Bluff is 1,672.
What is the Total Male Population of Cedar Bluff?
Total Male Population of Cedar Bluff is 805.
What is the Total Female Population of Cedar Bluff?
Total Female Population of Cedar Bluff is 867.
What is the Ratio of Males per 100 Females in Cedar Bluff?
There are 92.85 Males per 100 Females in Cedar Bluff.
What is the Ratio of Females per 100 Males in Cedar Bluff?
There are 107.70 Females per 100 Males in Cedar Bluff.
What is the Median Population Age in Cedar Bluff?
Median Population Age in Cedar Bluff is 45.3 Years.
What is the Average Family Size in Cedar Bluff
Average Family Size in Cedar Bluff is 3.2 People.
What is the Average Household Size in Cedar Bluff
Average Household Size in Cedar Bluff is 2.5 People.
How Large is the Labor Force in Cedar Bluff?
There are 583 People in the Labor Forcein in Cedar Bluff.
What is the Percentage of People in the Labor Force in Cedar Bluff?
43.3% of People are in the Labor Force in Cedar Bluff.
What is the Unemployment Rate in Cedar Bluff?
Unemployment Rate in Cedar Bluff is 10.1%.