Wadley, AL
Wadley Map
Wadley Overview
950
TOTAL POPULATION
419
MALE POPULATION
531
FEMALE POPULATION
78.91
MALES / 100 FEMALES
126.73
FEMALES / 100 MALES
20.7
MEDIAN AGE
3.4
AVG FAMILY SIZE
2.5
AVG HOUSEHOLD SIZE
$14,061
PER CAPITA INCOME
$53,750
AVG FAMILY INCOME
$25,000
AVG HOUSEHOLD INCOME
0.56
INEQUALITY / GINI INDEX
291
LABOR FORCE [ PEOPLE ]
36.8%
PERCENT IN LABOR FORCE
9.3%
UNEMPLOYMENT RATE
Wadley Zip Codes
Wadley Area Codes
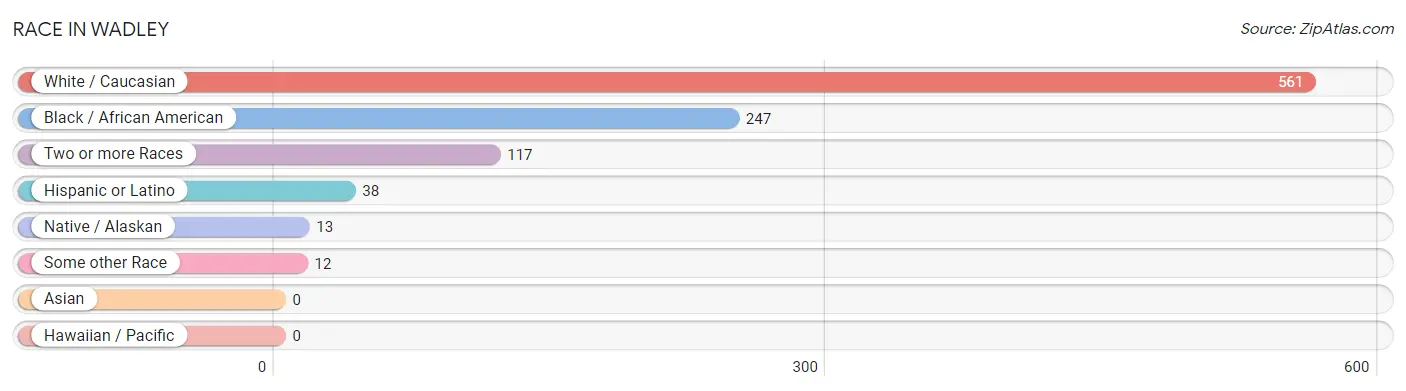
Race in Wadley
The most populous races in Wadley are White / Caucasian (561 | 59.1%), Black / African American (247 | 26.0%), and Two or more Races (117 | 12.3%).
| Race | # Population | % Population |
| Asian | 0 | 0.0% |
| Black / African American | 247 | 26.0% |
| Hawaiian / Pacific | 0 | 0.0% |
| Hispanic or Latino | 38 | 4.0% |
| Native / Alaskan | 13 | 1.4% |
| White / Caucasian | 561 | 59.1% |
| Two or more Races | 117 | 12.3% |
| Some other Race | 12 | 1.3% |
| Total | 950 | 100.0% |
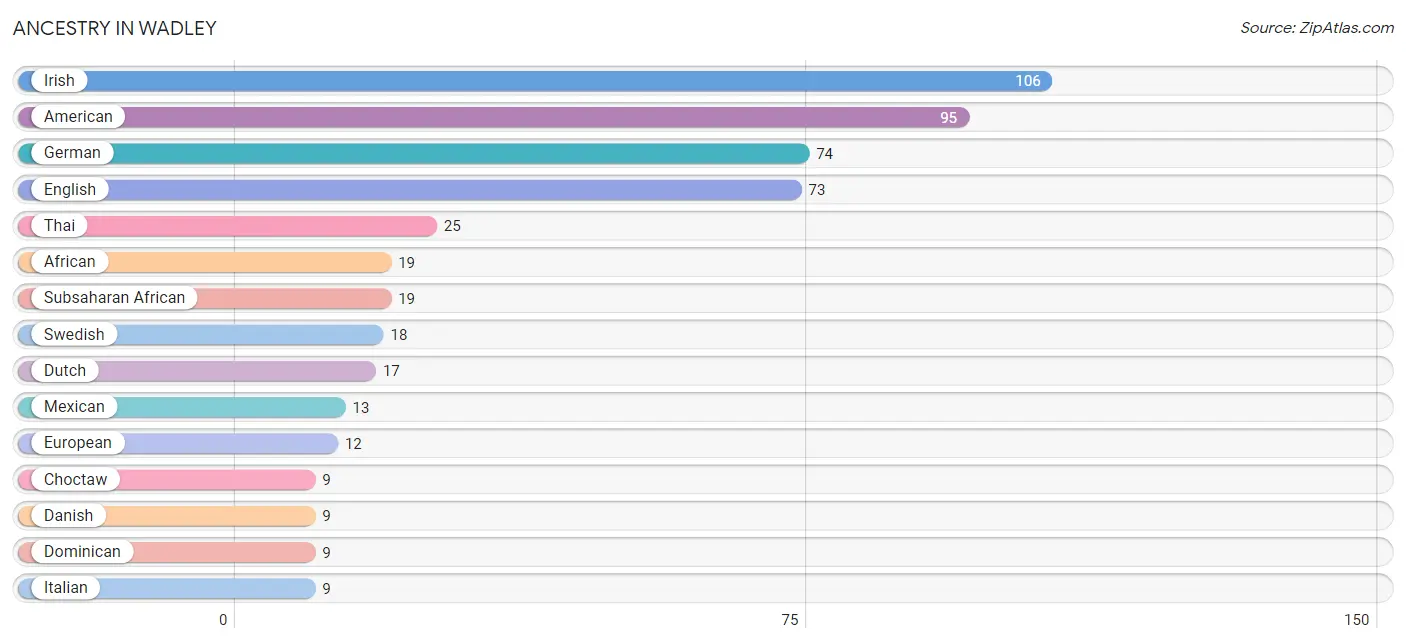
Ancestry in Wadley
The most populous ancestries reported in Wadley are Irish (106 | 11.2%), American (95 | 10.0%), German (74 | 7.8%), English (73 | 7.7%), and Thai (25 | 2.6%), together accounting for 39.3% of all Wadley residents.
| Ancestry | # Population | % Population |
| African | 19 | 2.0% |
| American | 95 | 10.0% |
| Cherokee | 1 | 0.1% |
| Choctaw | 9 | 0.9% |
| Cuban | 1 | 0.1% |
| Danish | 9 | 0.9% |
| Dominican | 9 | 0.9% |
| Dutch | 17 | 1.8% |
| English | 73 | 7.7% |
| European | 12 | 1.3% |
| German | 74 | 7.8% |
| Irish | 106 | 11.2% |
| Italian | 9 | 0.9% |
| Jamaican | 9 | 0.9% |
| Korean | 9 | 0.9% |
| Mexican | 13 | 1.4% |
| Mexican American Indian | 4 | 0.4% |
| Scotch-Irish | 1 | 0.1% |
| South American | 9 | 0.9% |
| Subsaharan African | 19 | 2.0% |
| Swedish | 18 | 1.9% |
| Thai | 25 | 2.6% |
| Venezuelan | 9 | 0.9% |
| West Indian | 9 | 0.9% | View All 24 Rows |
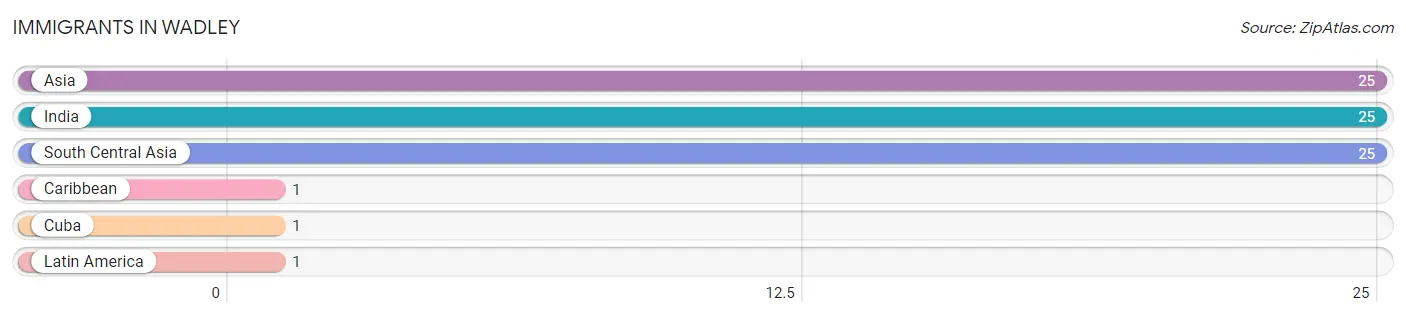
Immigrants in Wadley
The most numerous immigrant groups reported in Wadley came from Asia (25 | 2.6%), India (25 | 2.6%), South Central Asia (25 | 2.6%), Caribbean (1 | 0.1%), and Cuba (1 | 0.1%), together accounting for 8.1% of all Wadley residents.
| Immigration Origin | # Population | % Population |
| Asia | 25 | 2.6% |
| Caribbean | 1 | 0.1% |
| Cuba | 1 | 0.1% |
| India | 25 | 2.6% |
| Latin America | 1 | 0.1% |
| South Central Asia | 25 | 2.6% | View All 6 Rows |
Sex and Age in Wadley
Sex and Age in Wadley
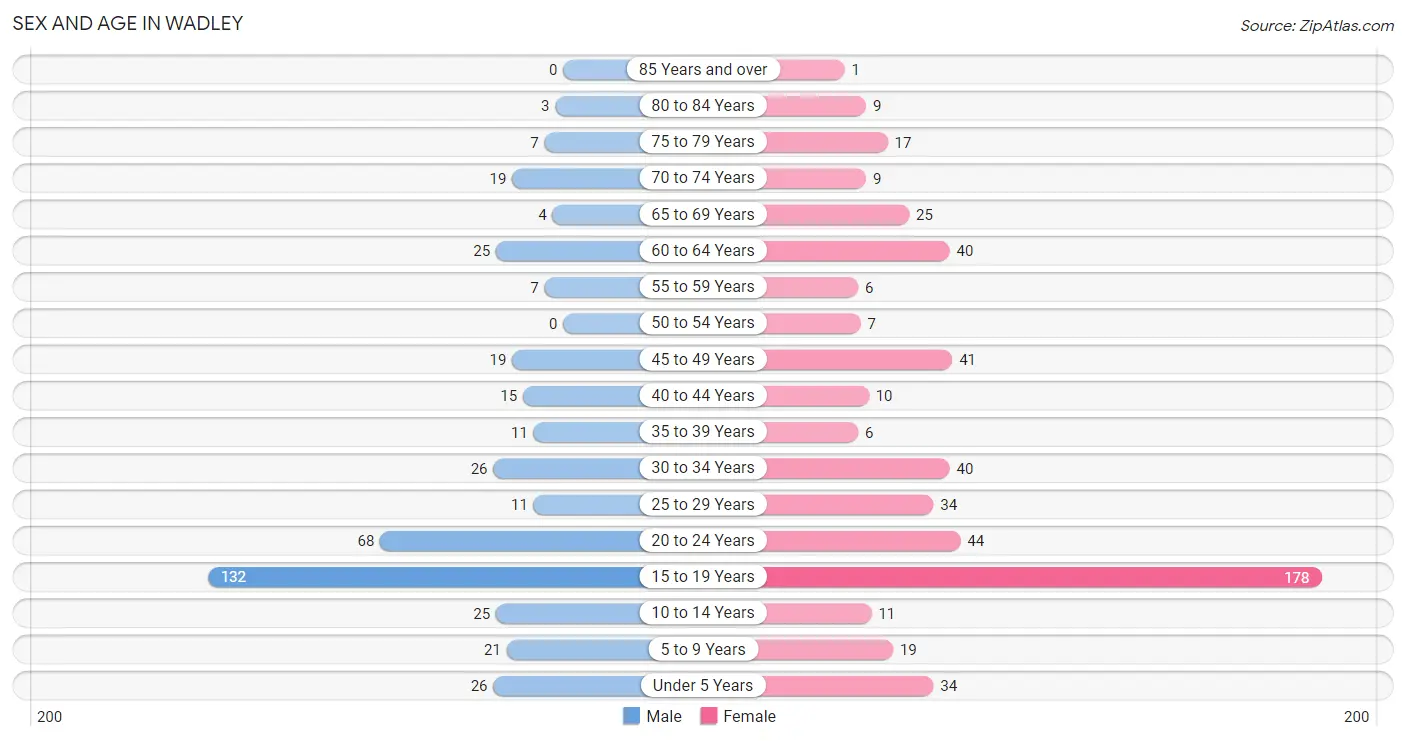
The most populous age groups in Wadley are 15 to 19 Years (132 | 31.5%) for men and 15 to 19 Years (178 | 33.5%) for women.
| Age Bracket | Male | Female |
| Under 5 Years | 26 (6.2%) | 34 (6.4%) |
| 5 to 9 Years | 21 (5.0%) | 19 (3.6%) |
| 10 to 14 Years | 25 (6.0%) | 11 (2.1%) |
| 15 to 19 Years | 132 (31.5%) | 178 (33.5%) |
| 20 to 24 Years | 68 (16.2%) | 44 (8.3%) |
| 25 to 29 Years | 11 (2.6%) | 34 (6.4%) |
| 30 to 34 Years | 26 (6.2%) | 40 (7.5%) |
| 35 to 39 Years | 11 (2.6%) | 6 (1.1%) |
| 40 to 44 Years | 15 (3.6%) | 10 (1.9%) |
| 45 to 49 Years | 19 (4.5%) | 41 (7.7%) |
| 50 to 54 Years | 0 (0.0%) | 7 (1.3%) |
| 55 to 59 Years | 7 (1.7%) | 6 (1.1%) |
| 60 to 64 Years | 25 (6.0%) | 40 (7.5%) |
| 65 to 69 Years | 4 (0.9%) | 25 (4.7%) |
| 70 to 74 Years | 19 (4.5%) | 9 (1.7%) |
| 75 to 79 Years | 7 (1.7%) | 17 (3.2%) |
| 80 to 84 Years | 3 (0.7%) | 9 (1.7%) |
| 85 Years and over | 0 (0.0%) | 1 (0.2%) |
| Total | 419 (100.0%) | 531 (100.0%) |
Families and Households in Wadley
Median Family Size in Wadley
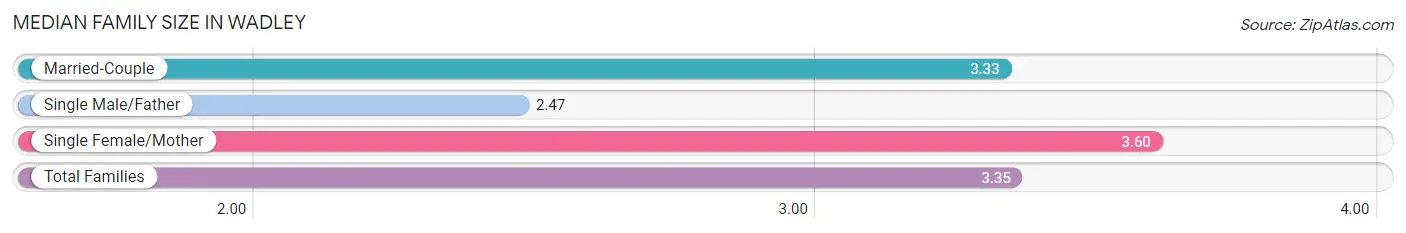
The median family size in Wadley is 3.35 persons per family, with single female/mother families (57 | 38.0%) accounting for the largest median family size of 3.6 persons per family. On the other hand, single male/father families (15 | 10.0%) represent the smallest median family size with 2.47 persons per family.
| Family Type | # Families | Family Size |
| Married-Couple | 78 (52.0%) | 3.33 |
| Single Male/Father | 15 (10.0%) | 2.47 |
| Single Female/Mother | 57 (38.0%) | 3.60 |
| Total Families | 150 (100.0%) | 3.35 |
Median Household Size in Wadley
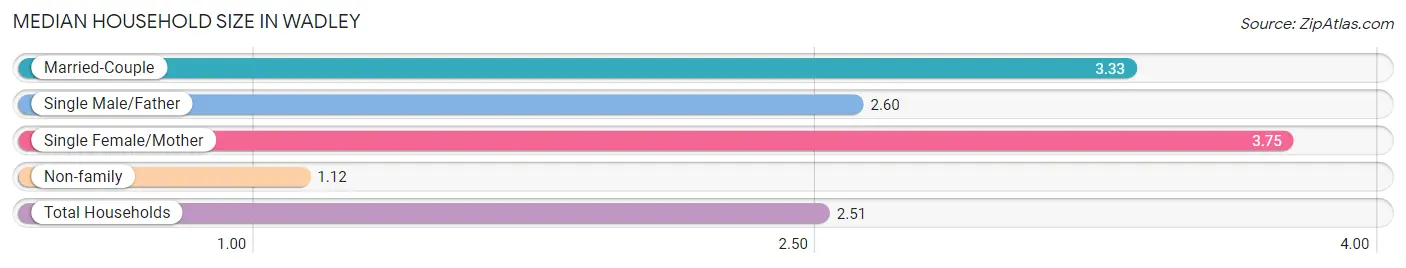
The median household size in Wadley is 2.51 persons per household, with single female/mother households (57 | 23.0%) accounting for the largest median household size of 3.75 persons per household. non-family households (98 | 39.5%) represent the smallest median household size with 1.12 persons per household.
| Household Type | # Households | Household Size |
| Married-Couple | 78 (31.5%) | 3.33 |
| Single Male/Father | 15 (6.0%) | 2.60 |
| Single Female/Mother | 57 (23.0%) | 3.75 |
| Non-family | 98 (39.5%) | 1.12 |
| Total Households | 248 (100.0%) | 2.51 |
Household Size by Marriage Status in Wadley
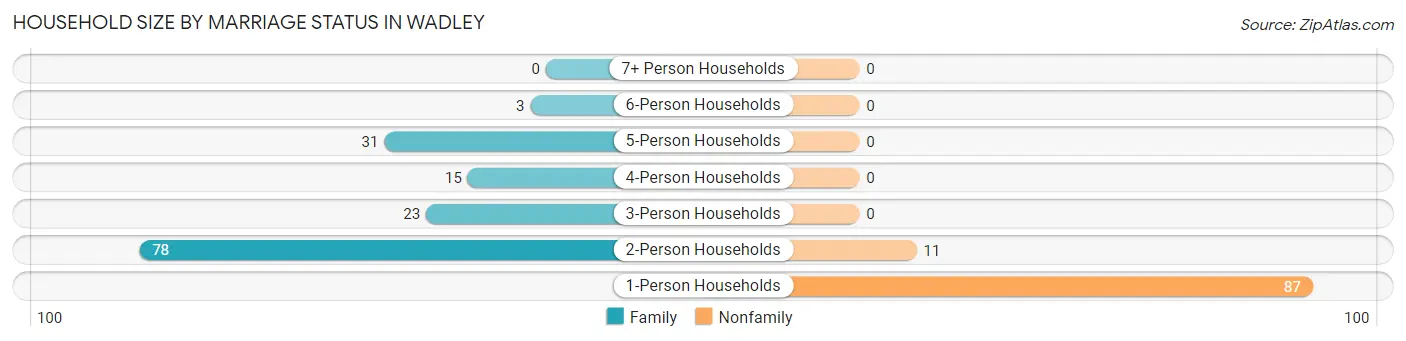
Out of a total of 248 households in Wadley, 150 (60.5%) are family households, while 98 (39.5%) are nonfamily households. The most numerous type of family households are 2-person households, comprising 78, and the most common type of nonfamily households are 1-person households, comprising 87.
| Household Size | Family Households | Nonfamily Households |
| 1-Person Households | - | 87 (35.1%) |
| 2-Person Households | 78 (31.5%) | 11 (4.4%) |
| 3-Person Households | 23 (9.3%) | 0 (0.0%) |
| 4-Person Households | 15 (6.0%) | 0 (0.0%) |
| 5-Person Households | 31 (12.5%) | 0 (0.0%) |
| 6-Person Households | 3 (1.2%) | 0 (0.0%) |
| 7+ Person Households | 0 (0.0%) | 0 (0.0%) |
| Total | 150 (60.5%) | 98 (39.5%) |
Female Fertility in Wadley
Fertility by Age in Wadley
Average fertility rate in Wadley is 14.0 births per 1,000 women. Women in the age bracket of 20 to 34 years have the highest fertility rate with 42.0 births per 1,000 women. Women in the age bracket of 20 to 34 years acount for 100.0% of all women with births.
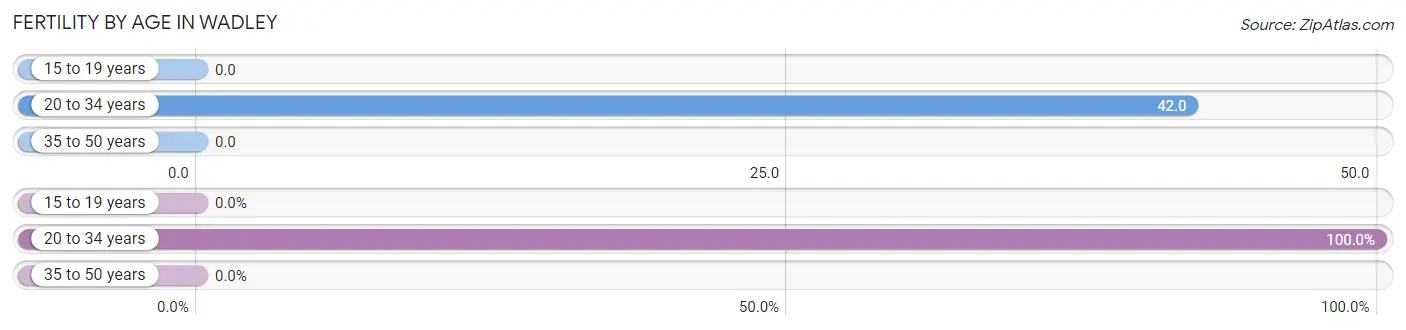
| Age Bracket | Women with Births | Births / 1,000 Women |
| 15 to 19 years | 0 (0.0%) | 0.0 |
| 20 to 34 years | 5 (100.0%) | 42.0 |
| 35 to 50 years | 0 (0.0%) | 0.0 |
| Total | 5 (100.0%) | 14.0 |
Fertility by Age by Marriage Status in Wadley
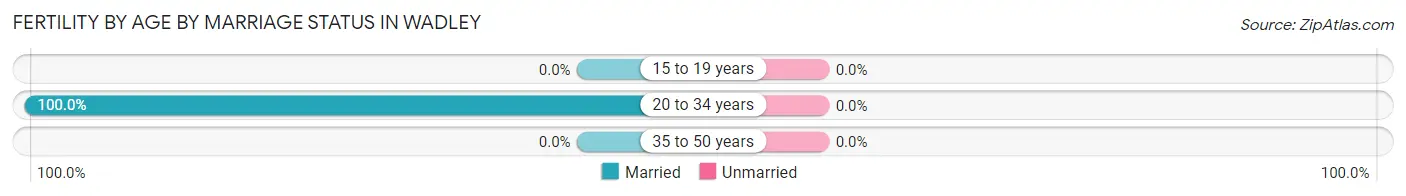
| Age Bracket | Married | Unmarried |
| 15 to 19 years | 0 (0.0%) | 0 (0.0%) |
| 20 to 34 years | 5 (100.0%) | 0 (0.0%) |
| 35 to 50 years | 0 (0.0%) | 0 (0.0%) |
| Total | 5 (100.0%) | 0 (0.0%) |
Fertility by Education in Wadley
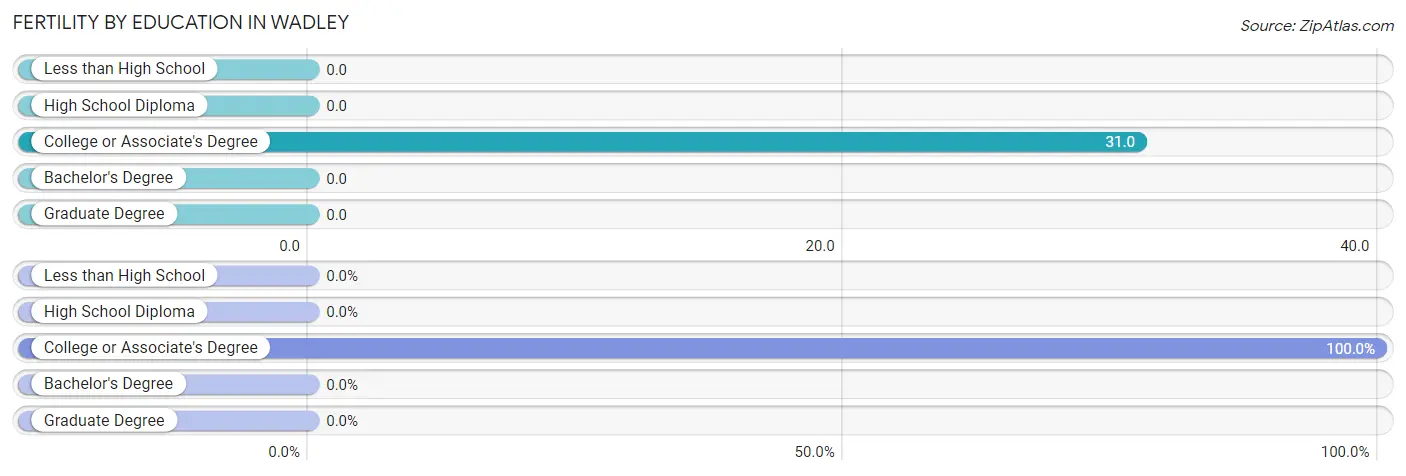
| Educational Attainment | Women with Births | Births / 1,000 Women |
| Less than High School | 0 (0.0%) | 0.0 |
| High School Diploma | 0 (0.0%) | 0.0 |
| College or Associate's Degree | 5 (100.0%) | 31.0 |
| Bachelor's Degree | 0 (0.0%) | 0.0 |
| Graduate Degree | 0 (0.0%) | 0.0 |
| Total | 5 (100.0%) | 14.0 |
Fertility by Education by Marriage Status in Wadley
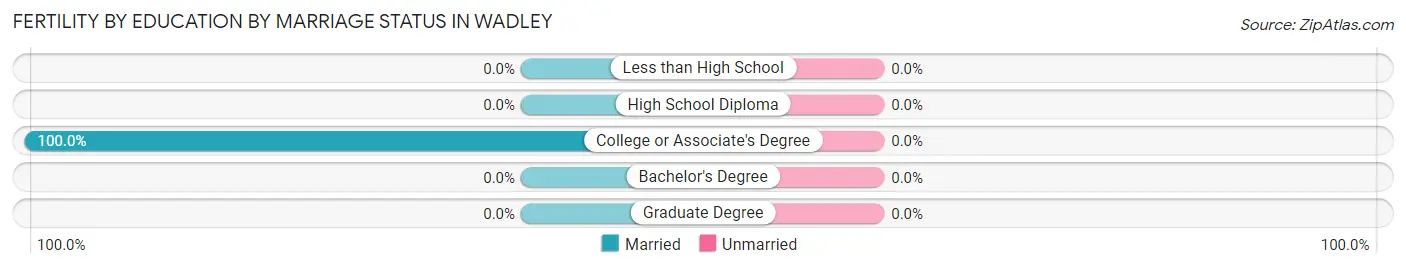
| Educational Attainment | Married | Unmarried |
| Less than High School | 0 (0.0%) | 0 (0.0%) |
| High School Diploma | 0 (0.0%) | 0 (0.0%) |
| College or Associate's Degree | 5 (100.0%) | 0 (0.0%) |
| Bachelor's Degree | 0 (0.0%) | 0 (0.0%) |
| Graduate Degree | 0 (0.0%) | 0 (0.0%) |
| Total | 5 (100.0%) | 0 (0.0%) |
Income in Wadley
Income Overview in Wadley
Per Capita Income in Wadley is $14,061, while median incomes of families and households are $53,750 and $25,000 respectively.
| Characteristic | Number | Measure |
| Per Capita Income | 950 | $14,061 |
| Median Family Income | 150 | $53,750 |
| Mean Family Income | 150 | $69,583 |
| Median Household Income | 248 | $25,000 |
| Mean Household Income | 248 | $49,578 |
| Income Deficit | 150 | $0 |
| Wage / Income Gap (%) | 950 | 0.00% |
| Wage / Income Gap ($) | 950 | 100.00¢ per $1 |
| Gini / Inequality Index | 950 | 0.56 |
Earnings by Sex in Wadley
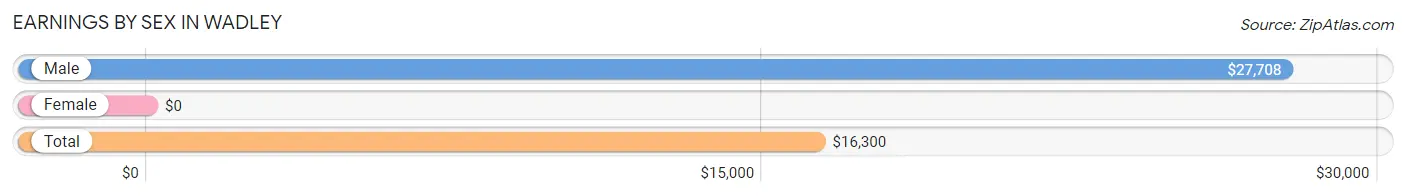
| Sex | Number | Average Earnings |
| Male | 164 (47.1%) | $27,708 |
| Female | 184 (52.9%) | $0 |
| Total | 348 (100.0%) | $16,300 |
Earnings by Sex by Income Bracket in Wadley
The most common earnings brackets in Wadley are $2,500 to $4,999 for men (28 | 17.1%) and $2,500 to $4,999 for women (34 | 18.5%).
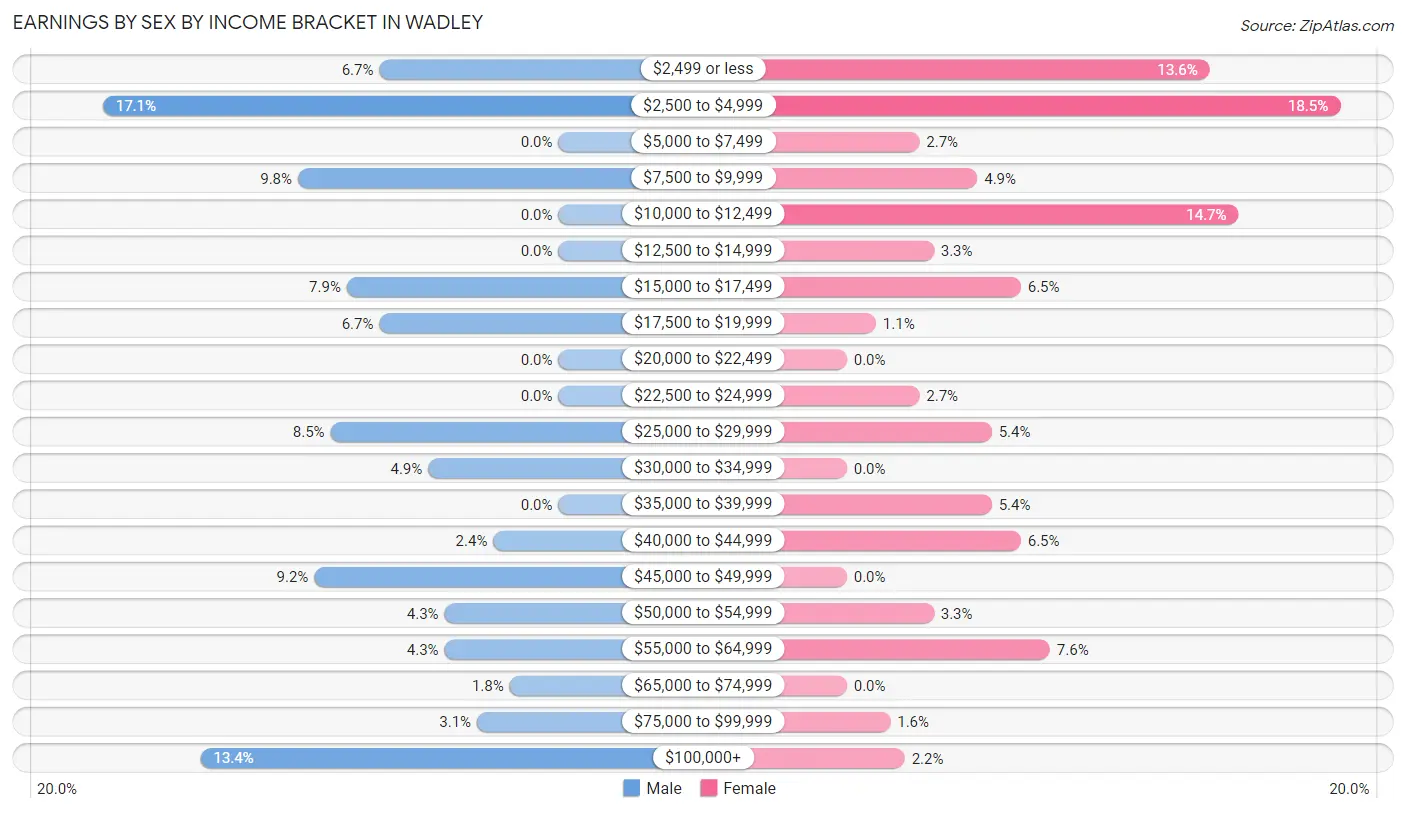
| Income | Male | Female |
| $2,499 or less | 11 (6.7%) | 25 (13.6%) |
| $2,500 to $4,999 | 28 (17.1%) | 34 (18.5%) |
| $5,000 to $7,499 | 0 (0.0%) | 5 (2.7%) |
| $7,500 to $9,999 | 16 (9.8%) | 9 (4.9%) |
| $10,000 to $12,499 | 0 (0.0%) | 27 (14.7%) |
| $12,500 to $14,999 | 0 (0.0%) | 6 (3.3%) |
| $15,000 to $17,499 | 13 (7.9%) | 12 (6.5%) |
| $17,500 to $19,999 | 11 (6.7%) | 2 (1.1%) |
| $20,000 to $22,499 | 0 (0.0%) | 0 (0.0%) |
| $22,500 to $24,999 | 0 (0.0%) | 5 (2.7%) |
| $25,000 to $29,999 | 14 (8.5%) | 10 (5.4%) |
| $30,000 to $34,999 | 8 (4.9%) | 0 (0.0%) |
| $35,000 to $39,999 | 0 (0.0%) | 10 (5.4%) |
| $40,000 to $44,999 | 4 (2.4%) | 12 (6.5%) |
| $45,000 to $49,999 | 15 (9.1%) | 0 (0.0%) |
| $50,000 to $54,999 | 7 (4.3%) | 6 (3.3%) |
| $55,000 to $64,999 | 7 (4.3%) | 14 (7.6%) |
| $65,000 to $74,999 | 3 (1.8%) | 0 (0.0%) |
| $75,000 to $99,999 | 5 (3.0%) | 3 (1.6%) |
| $100,000+ | 22 (13.4%) | 4 (2.2%) |
| Total | 164 (100.0%) | 184 (100.0%) |
Earnings by Sex by Educational Attainment in Wadley
Average earnings in Wadley are $46,250 for men and $28,250 for women, a difference of 38.9%. Men with an educational attainment of bachelor's degree enjoy the highest average annual earnings of $117,656, while those with high school diploma education earn the least with $45,481. Women with an educational attainment of bachelor's degree earn the most with the average annual earnings of $58,194, while those with high school diploma education have the smallest earnings of $29,375.
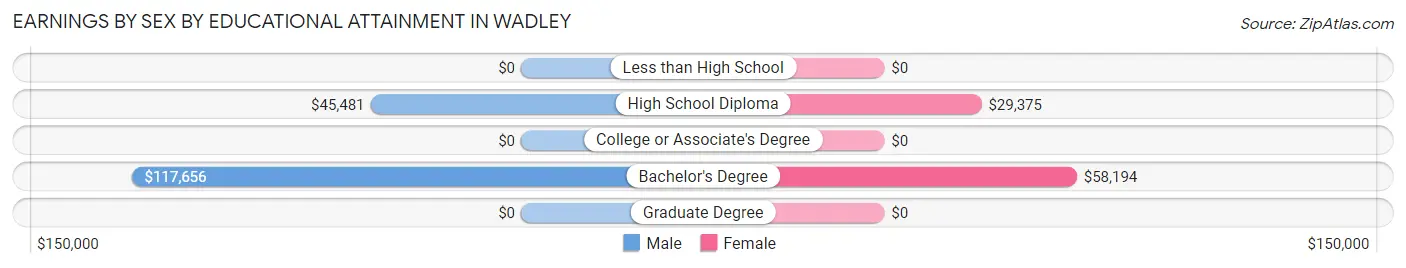
| Educational Attainment | Male Income | Female Income |
| Less than High School | - | - |
| High School Diploma | $45,481 | $29,375 |
| College or Associate's Degree | - | - |
| Bachelor's Degree | $117,656 | $58,194 |
| Graduate Degree | - | - |
| Total | $46,250 | $28,250 |
Family Income in Wadley
Family Income Brackets in Wadley
According to the Wadley family income data, there are 24 families falling into the $50,000 to $74,999 income range, which is the most common income bracket and makes up 16.0% of all families. Conversely, the $200,000+ income bracket is the least frequent group with only 2 families (1.3%) belonging to this category.
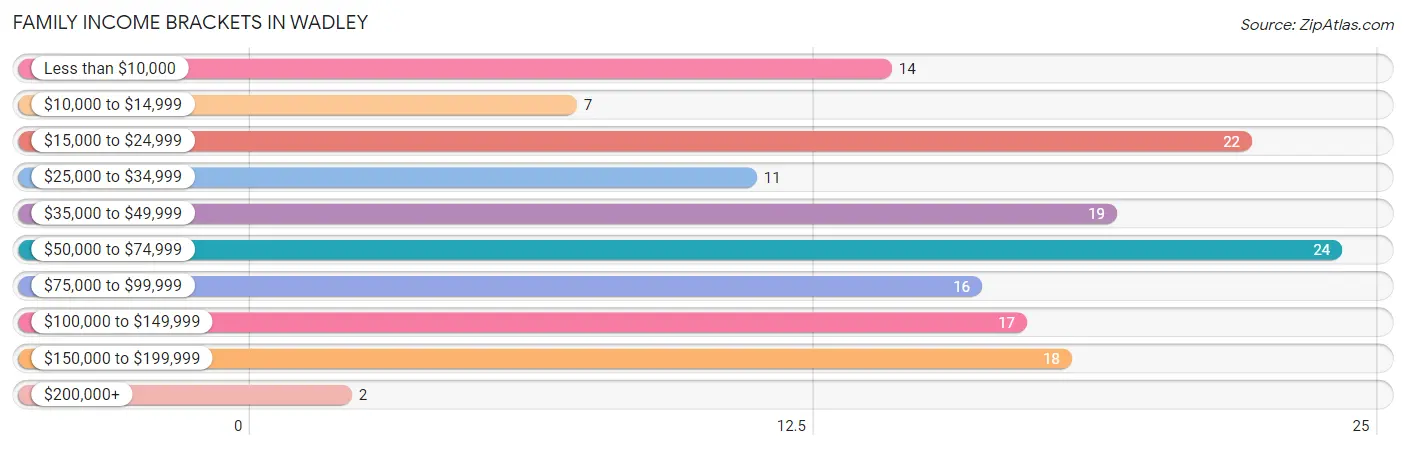
| Income Bracket | # Families | % Families |
| Less than $10,000 | 14 | 9.3% |
| $10,000 to $14,999 | 7 | 4.7% |
| $15,000 to $24,999 | 22 | 14.7% |
| $25,000 to $34,999 | 11 | 7.3% |
| $35,000 to $49,999 | 19 | 12.7% |
| $50,000 to $74,999 | 24 | 16.0% |
| $75,000 to $99,999 | 16 | 10.7% |
| $100,000 to $149,999 | 17 | 11.3% |
| $150,000 to $199,999 | 18 | 12.0% |
| $200,000+ | 2 | 1.3% |
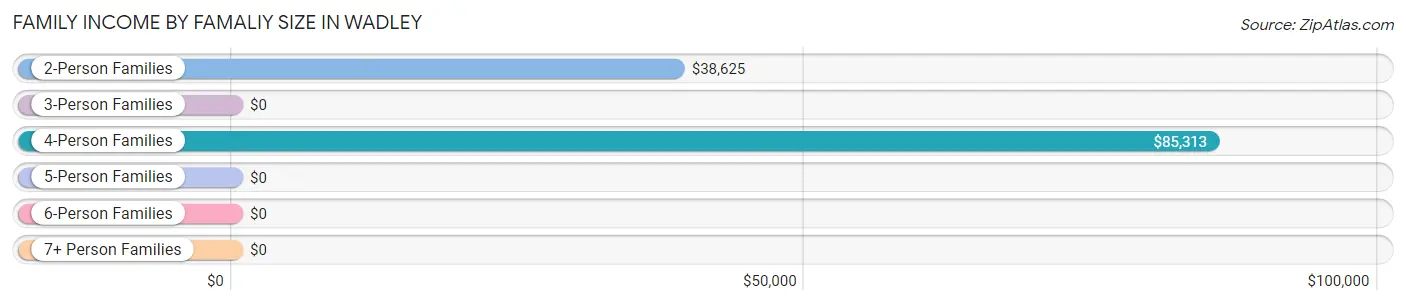
Family Income by Famaliy Size in Wadley
4-person families (15 | 10.0%) account for the highest median family income in Wadley with $85,313 per family, while 4-person families (15 | 10.0%) have the highest median income of $21,328 per family member.
| Income Bracket | # Families | Median Income |
| 2-Person Families | 83 (55.3%) | $38,625 |
| 3-Person Families | 22 (14.7%) | $0 |
| 4-Person Families | 15 (10.0%) | $85,313 |
| 5-Person Families | 27 (18.0%) | $0 |
| 6-Person Families | 3 (2.0%) | $0 |
| 7+ Person Families | 0 (0.0%) | $0 |
| Total | 150 (100.0%) | $53,750 |
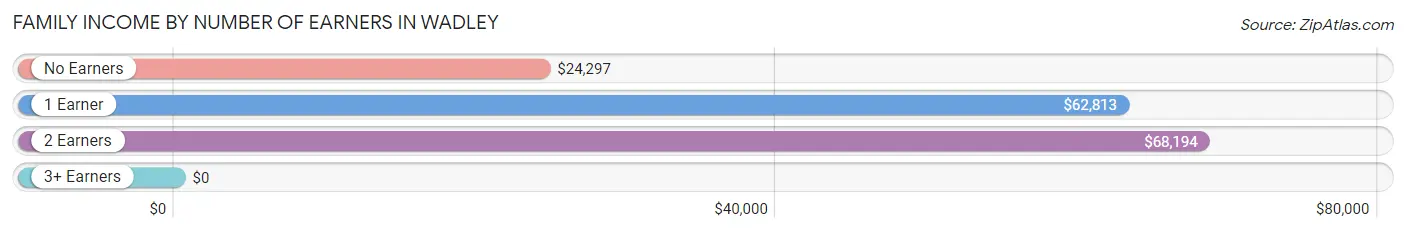
Family Income by Number of Earners in Wadley
| Number of Earners | # Families | Median Income |
| No Earners | 31 (20.7%) | $24,297 |
| 1 Earner | 51 (34.0%) | $62,813 |
| 2 Earners | 63 (42.0%) | $68,194 |
| 3+ Earners | 5 (3.3%) | $0 |
| Total | 150 (100.0%) | $53,750 |
Household Income in Wadley
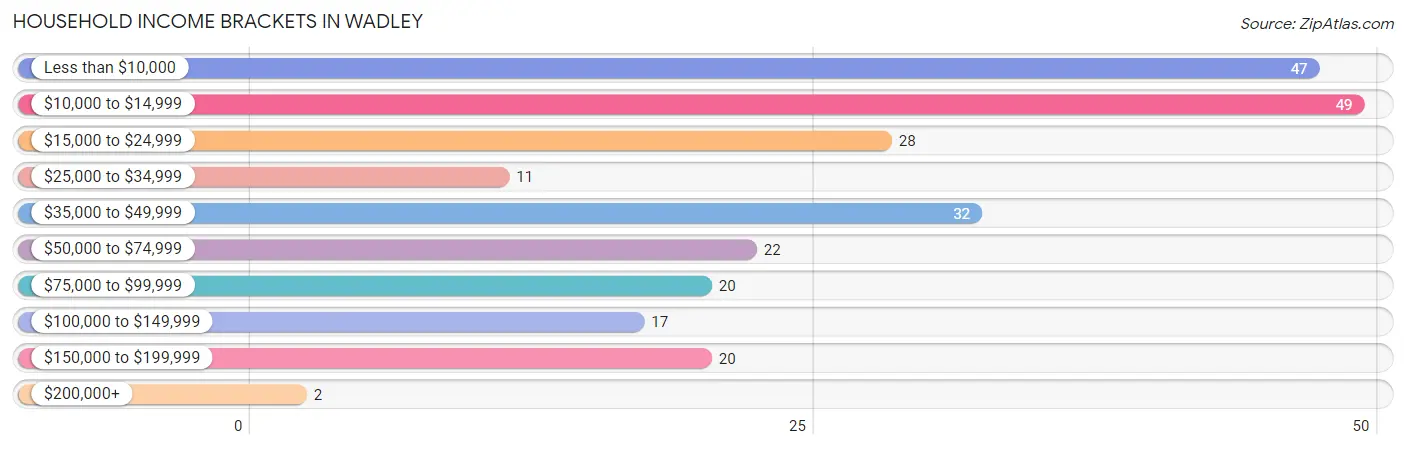
Household Income Brackets in Wadley
With 49 households falling in the category, the $10,000 to $14,999 income range is the most frequent in Wadley, accounting for 19.8% of all households. In contrast, only 2 households (0.8%) fall into the $200,000+ income bracket, making it the least populous group.
| Income Bracket | # Households | % Households |
| Less than $10,000 | 47 | 19.0% |
| $10,000 to $14,999 | 49 | 19.8% |
| $15,000 to $24,999 | 28 | 11.3% |
| $25,000 to $34,999 | 11 | 4.4% |
| $35,000 to $49,999 | 32 | 12.9% |
| $50,000 to $74,999 | 22 | 8.9% |
| $75,000 to $99,999 | 20 | 8.1% |
| $100,000 to $149,999 | 17 | 6.9% |
| $150,000 to $199,999 | 20 | 8.1% |
| $200,000+ | 2 | 0.8% |
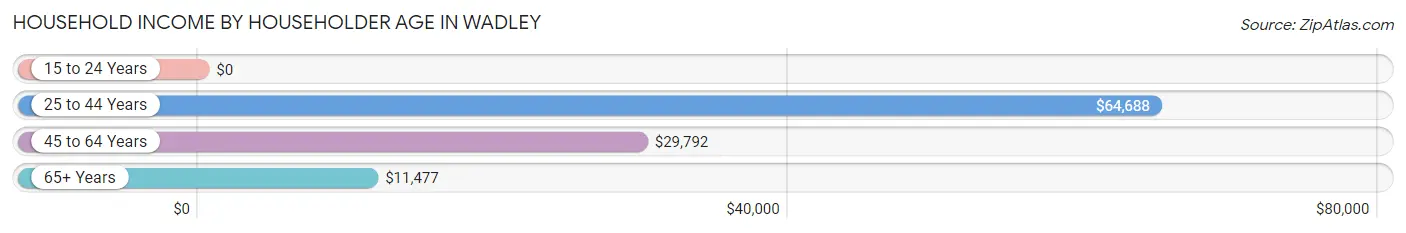
Household Income by Householder Age in Wadley
The median household income in Wadley is $25,000, with the highest median household income of $64,688 found in the 25 to 44 years age bracket for the primary householder. A total of 87 households (35.1%) fall into this category.
| Income Bracket | # Households | Median Income |
| 15 to 24 Years | 0 (0.0%) | $0 |
| 25 to 44 Years | 87 (35.1%) | $64,688 |
| 45 to 64 Years | 81 (32.7%) | $29,792 |
| 65+ Years | 80 (32.3%) | $11,477 |
| Total | 248 (100.0%) | $25,000 |
Poverty in Wadley
Income Below Poverty by Sex and Age in Wadley
With 24.7% poverty level for males and 30.9% for females among the residents of Wadley, 5 year old males and 75 year old and over females are the most vulnerable to poverty, with 2 males (100.0%) and 23 females (85.2%) in their respective age groups living below the poverty level.
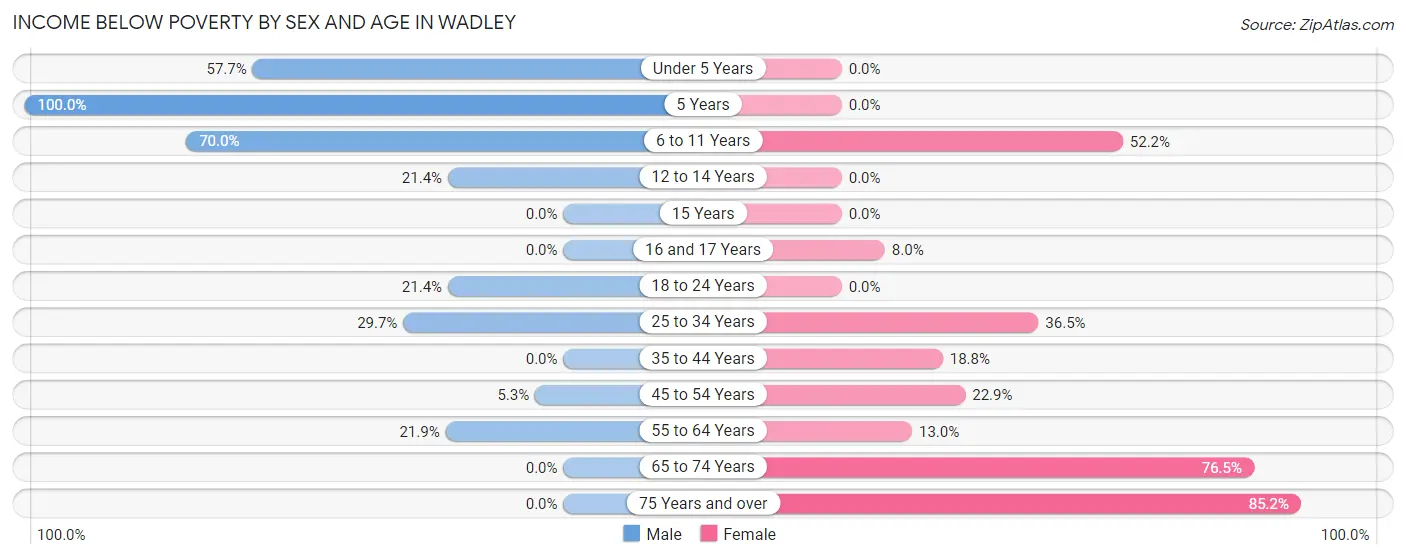
| Age Bracket | Male | Female |
| Under 5 Years | 15 (57.7%) | 0 (0.0%) |
| 5 Years | 2 (100.0%) | 0 (0.0%) |
| 6 to 11 Years | 21 (70.0%) | 12 (52.2%) |
| 12 to 14 Years | 3 (21.4%) | 0 (0.0%) |
| 15 Years | 0 (0.0%) | 0 (0.0%) |
| 16 and 17 Years | 0 (0.0%) | 2 (8.0%) |
| 18 to 24 Years | 6 (21.4%) | 0 (0.0%) |
| 25 to 34 Years | 11 (29.7%) | 27 (36.5%) |
| 35 to 44 Years | 0 (0.0%) | 3 (18.8%) |
| 45 to 54 Years | 1 (5.3%) | 11 (22.9%) |
| 55 to 64 Years | 7 (21.9%) | 6 (13.0%) |
| 65 to 74 Years | 0 (0.0%) | 26 (76.5%) |
| 75 Years and over | 0 (0.0%) | 23 (85.2%) |
| Total | 66 (24.7%) | 110 (30.9%) |
Income Above Poverty by Sex and Age in Wadley
According to the poverty statistics in Wadley, males aged 15 years and females aged under 5 years are the age groups that are most secure financially, with 100.0% of males and 100.0% of females in these age groups living above the poverty line.
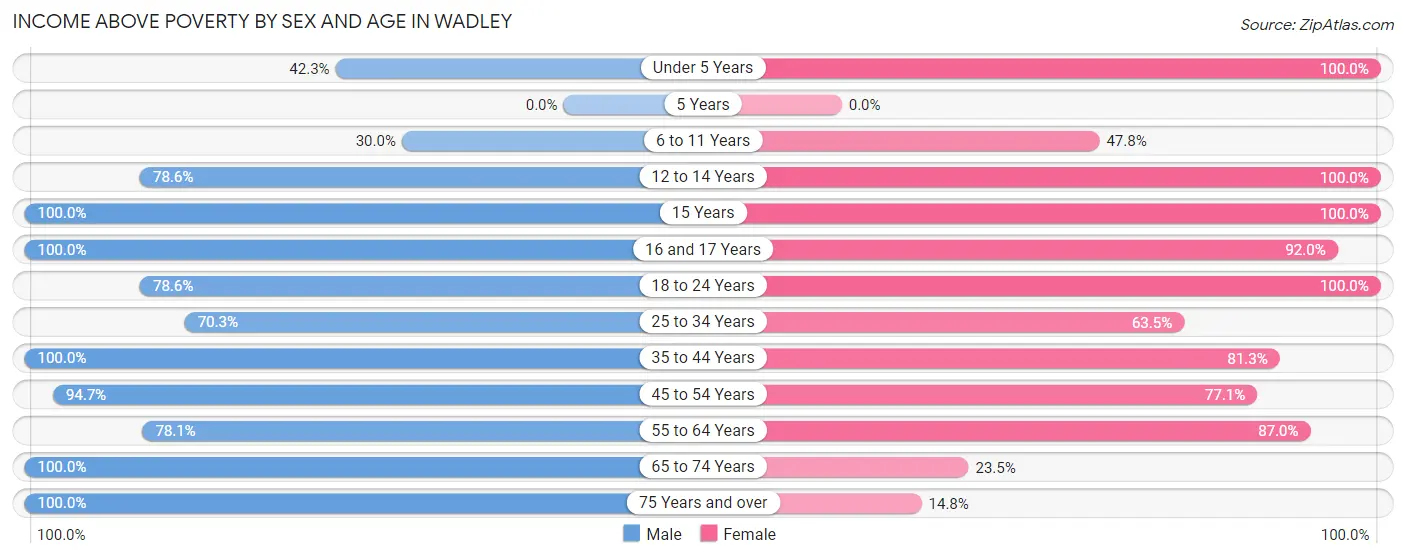
| Age Bracket | Male | Female |
| Under 5 Years | 11 (42.3%) | 34 (100.0%) |
| 5 Years | 0 (0.0%) | 0 (0.0%) |
| 6 to 11 Years | 9 (30.0%) | 11 (47.8%) |
| 12 to 14 Years | 11 (78.6%) | 7 (100.0%) |
| 15 Years | 4 (100.0%) | 19 (100.0%) |
| 16 and 17 Years | 16 (100.0%) | 23 (92.0%) |
| 18 to 24 Years | 22 (78.6%) | 3 (100.0%) |
| 25 to 34 Years | 26 (70.3%) | 47 (63.5%) |
| 35 to 44 Years | 26 (100.0%) | 13 (81.2%) |
| 45 to 54 Years | 18 (94.7%) | 37 (77.1%) |
| 55 to 64 Years | 25 (78.1%) | 40 (87.0%) |
| 65 to 74 Years | 23 (100.0%) | 8 (23.5%) |
| 75 Years and over | 10 (100.0%) | 4 (14.8%) |
| Total | 201 (75.3%) | 246 (69.1%) |
Income Below Poverty Among Married-Couple Families in Wadley
| Children | Above Poverty | Below Poverty |
| No Children | 49 (100.0%) | 0 (0.0%) |
| 1 or 2 Children | 7 (100.0%) | 0 (0.0%) |
| 3 or 4 Children | 22 (100.0%) | 0 (0.0%) |
| 5 or more Children | 0 (0.0%) | 0 (0.0%) |
| Total | 78 (100.0%) | 0 (0.0%) |
Income Below Poverty Among Single-Parent Households in Wadley
According to the poverty data in Wadley, 53.3% or 8 single-father households and 33.3% or 19 single-mother households are living below the poverty line. Among single-father households, those with no children have the highest poverty rate, with 7 households (63.6%) experiencing poverty. Likewise, among single-mother households, those with 1 or 2 children have the highest poverty rate, with 14 households (51.8%) falling below the poverty line.
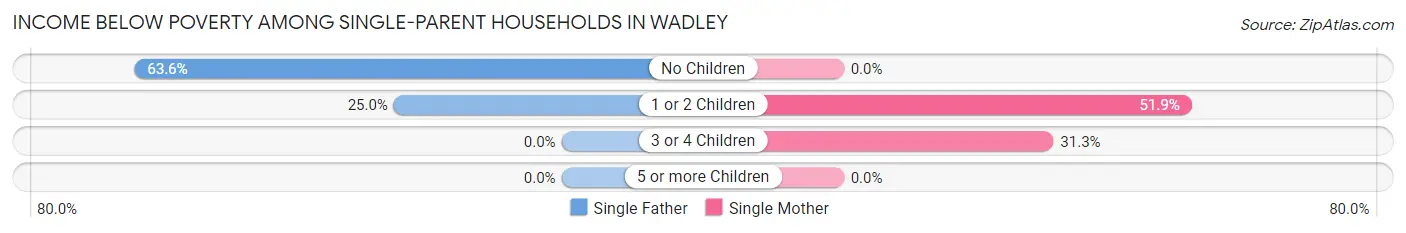
| Children | Single Father | Single Mother |
| No Children | 7 (63.6%) | 0 (0.0%) |
| 1 or 2 Children | 1 (25.0%) | 14 (51.8%) |
| 3 or 4 Children | 0 (0.0%) | 5 (31.2%) |
| 5 or more Children | 0 (0.0%) | 0 (0.0%) |
| Total | 8 (53.3%) | 19 (33.3%) |
Income Below Poverty Among Married-Couple vs Single-Parent Households in Wadley
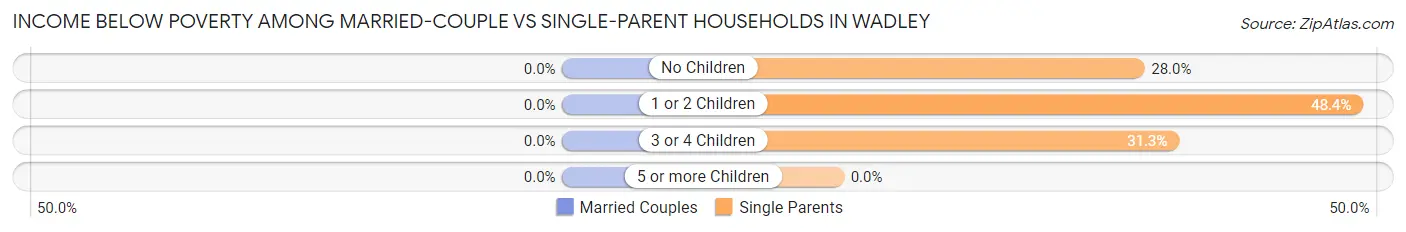
| Children | Married-Couple Families | Single-Parent Households |
| No Children | 0 (0.0%) | 7 (28.0%) |
| 1 or 2 Children | 0 (0.0%) | 15 (48.4%) |
| 3 or 4 Children | 0 (0.0%) | 5 (31.2%) |
| 5 or more Children | 0 (0.0%) | 0 (0.0%) |
| Total | 0 (0.0%) | 27 (37.5%) |
Employment Characteristics in Wadley
Employment by Class of Employer in Wadley
Among the 245 employed individuals in Wadley, private company employees (191 | 78.0%), state government employees (26 | 10.6%), and self-employed (incorporated) (9 | 3.7%) make up the most common classes of employment.
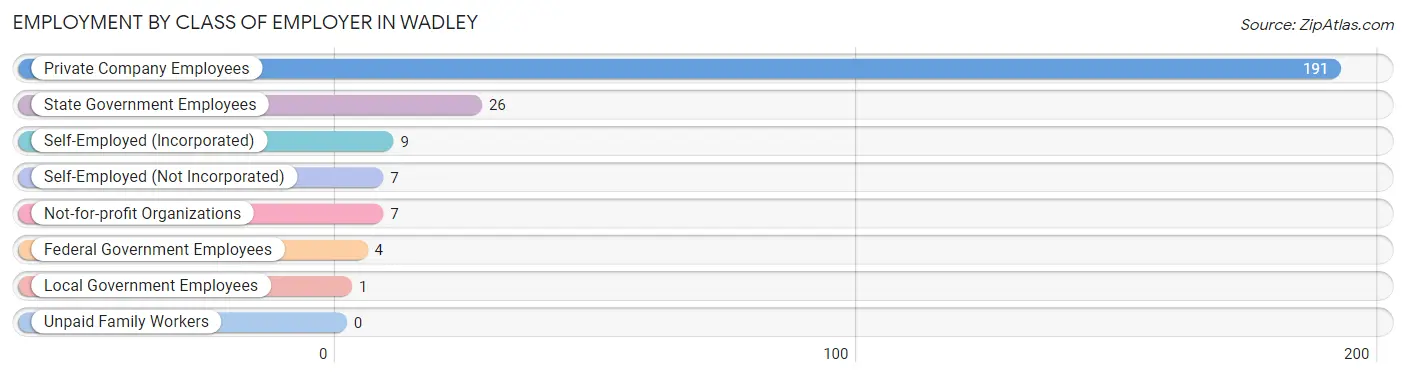
| Employer Class | # Employees | % Employees |
| Private Company Employees | 191 | 78.0% |
| Self-Employed (Incorporated) | 9 | 3.7% |
| Self-Employed (Not Incorporated) | 7 | 2.9% |
| Not-for-profit Organizations | 7 | 2.9% |
| Local Government Employees | 1 | 0.4% |
| State Government Employees | 26 | 10.6% |
| Federal Government Employees | 4 | 1.6% |
| Unpaid Family Workers | 0 | 0.0% |
| Total | 245 | 100.0% |
Employment Status by Age in Wadley
According to the labor force statistics for Wadley, out of the total population over 16 years of age (791), 36.8% or 291 individuals are in the labor force, with 9.3% or 27 of them unemployed. The age group with the highest labor force participation rate is 35 to 44 years, with 92.9% or 39 individuals in the labor force. Within the labor force, the 20 to 24 years age range has the highest percentage of unemployed individuals, with 27.3% or 9 of them being unemployed.
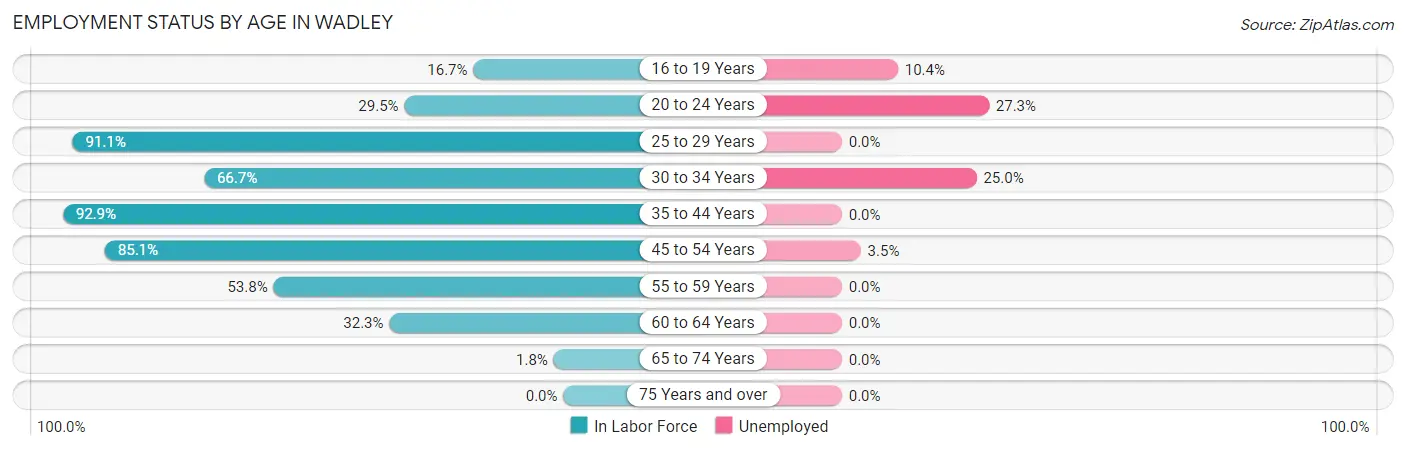
| Age Bracket | In Labor Force | Unemployed |
| 16 to 19 Years | 48 (16.7%) | 5 (10.4%) |
| 20 to 24 Years | 33 (29.5%) | 9 (27.3%) |
| 25 to 29 Years | 41 (91.1%) | 0 (0.0%) |
| 30 to 34 Years | 44 (66.7%) | 11 (25.0%) |
| 35 to 44 Years | 39 (92.9%) | 0 (0.0%) |
| 45 to 54 Years | 57 (85.1%) | 2 (3.5%) |
| 55 to 59 Years | 7 (53.8%) | 0 (0.0%) |
| 60 to 64 Years | 21 (32.3%) | 0 (0.0%) |
| 65 to 74 Years | 1 (1.8%) | 0 (0.0%) |
| 75 Years and over | 0 (0.0%) | 0 (0.0%) |
| Total | 291 (36.8%) | 27 (9.3%) |
Employment Status by Educational Attainment in Wadley
According to labor force statistics for Wadley, 70.1% of individuals (209) out of the total population between 25 and 64 years of age (298) are in the labor force, with 6.2% or 13 of them being unemployed. The group with the highest labor force participation rate are those with the educational attainment of college / associate degree, with 88.7% or 63 individuals in the labor force. Within the labor force, individuals with less than high school education have the highest percentage of unemployment, with 39.3% or 11 of them being unemployed.
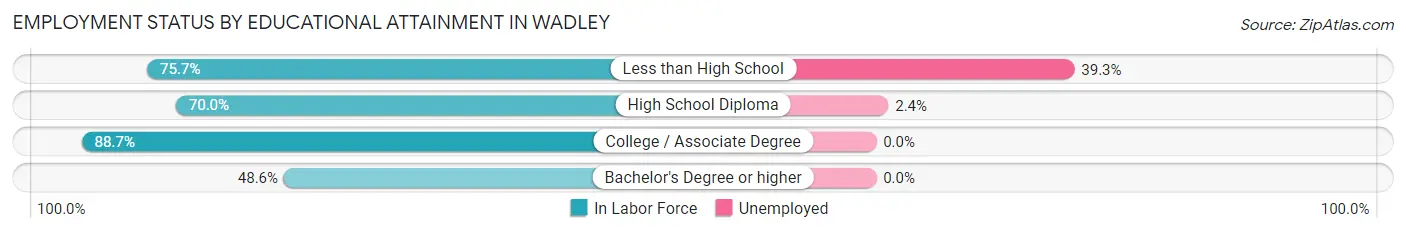
| Educational Attainment | In Labor Force | Unemployed |
| Less than High School | 28 (75.7%) | 15 (39.3%) |
| High School Diploma | 84 (70.0%) | 3 (2.4%) |
| College / Associate Degree | 63 (88.7%) | 0 (0.0%) |
| Bachelor's Degree or higher | 34 (48.6%) | 0 (0.0%) |
| Total | 209 (70.1%) | 18 (6.2%) |
Employment Occupations by Sex in Wadley
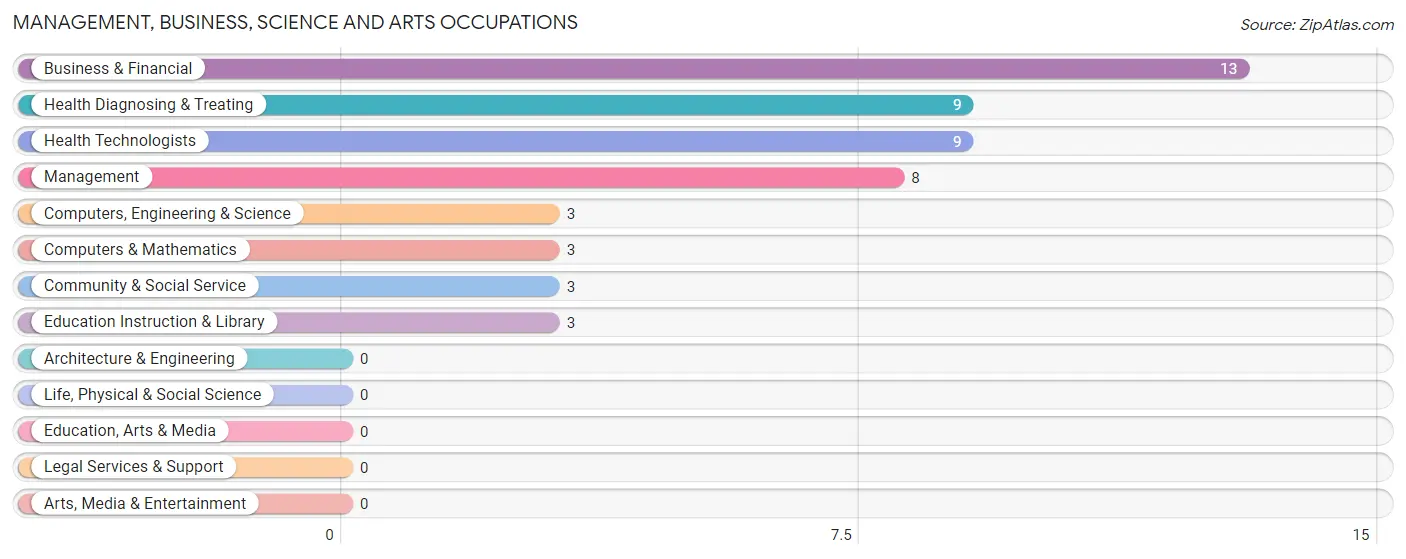
Management, Business, Science and Arts Occupations
The most common Management, Business, Science and Arts occupations in Wadley are Business & Financial (13 | 4.9%), Health Diagnosing & Treating (9 | 3.4%), Health Technologists (9 | 3.4%), Management (8 | 3.0%), and Computers, Engineering & Science (3 | 1.1%).
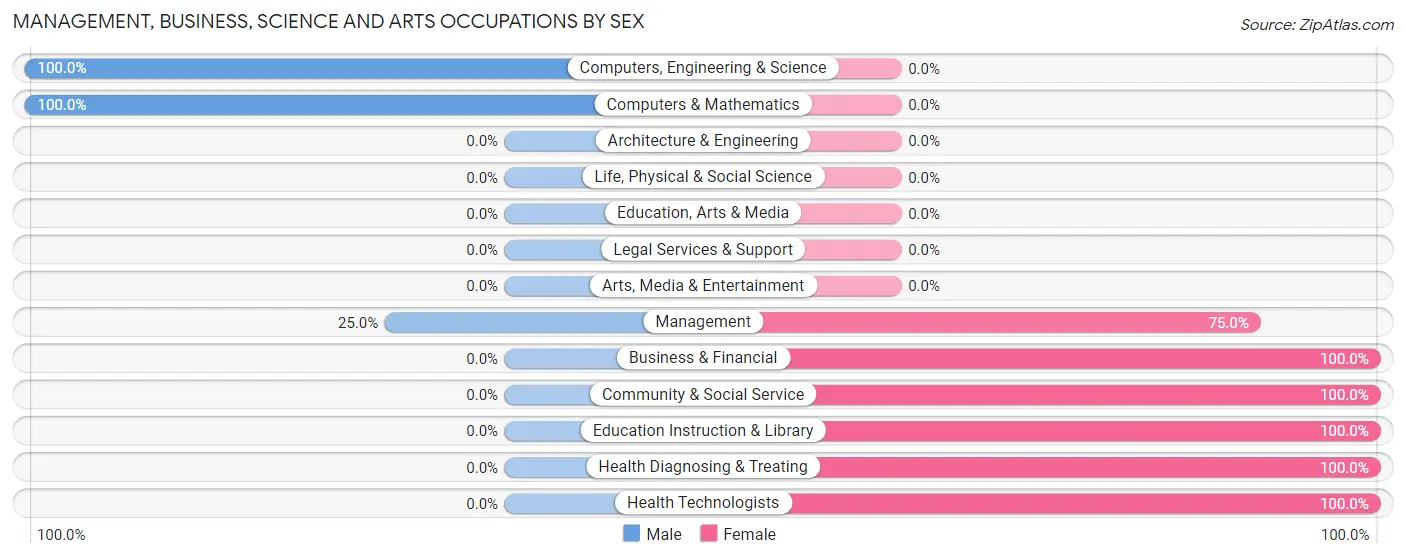
Management, Business, Science and Arts Occupations by Sex
Within the Management, Business, Science and Arts occupations in Wadley, the most male-oriented occupations are Computers, Engineering & Science (100.0%), Computers & Mathematics (100.0%), and Management (25.0%), while the most female-oriented occupations are Business & Financial (100.0%), Community & Social Service (100.0%), and Education Instruction & Library (100.0%).
| Occupation | Male | Female |
| Management | 2 (25.0%) | 6 (75.0%) |
| Business & Financial | 0 (0.0%) | 13 (100.0%) |
| Computers, Engineering & Science | 3 (100.0%) | 0 (0.0%) |
| Computers & Mathematics | 3 (100.0%) | 0 (0.0%) |
| Architecture & Engineering | 0 (0.0%) | 0 (0.0%) |
| Life, Physical & Social Science | 0 (0.0%) | 0 (0.0%) |
| Community & Social Service | 0 (0.0%) | 3 (100.0%) |
| Education, Arts & Media | 0 (0.0%) | 0 (0.0%) |
| Legal Services & Support | 0 (0.0%) | 0 (0.0%) |
| Education Instruction & Library | 0 (0.0%) | 3 (100.0%) |
| Arts, Media & Entertainment | 0 (0.0%) | 0 (0.0%) |
| Health Diagnosing & Treating | 0 (0.0%) | 9 (100.0%) |
| Health Technologists | 0 (0.0%) | 9 (100.0%) |
| Total (Category) | 5 (13.9%) | 31 (86.1%) |
| Total (Overall) | 105 (39.8%) | 159 (60.2%) |
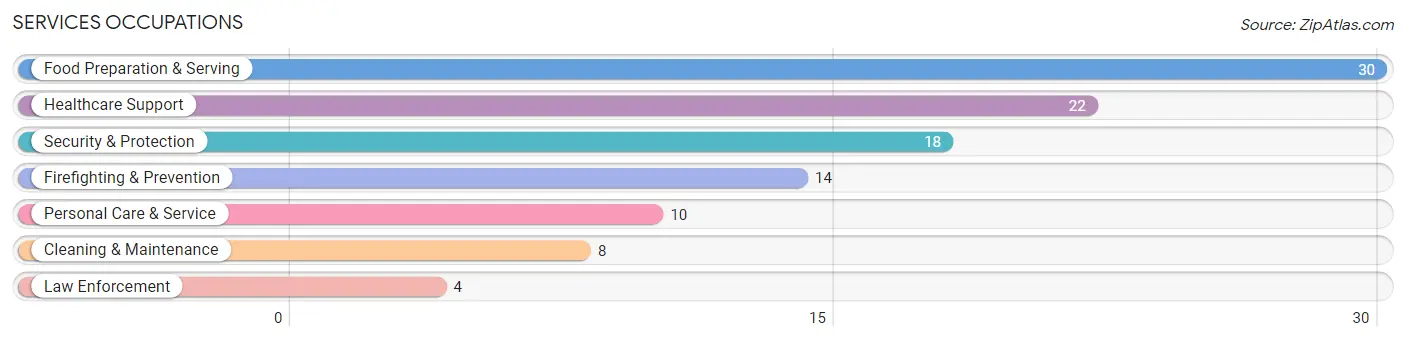
Services Occupations
The most common Services occupations in Wadley are Food Preparation & Serving (30 | 11.4%), Healthcare Support (22 | 8.3%), Security & Protection (18 | 6.8%), Firefighting & Prevention (14 | 5.3%), and Personal Care & Service (10 | 3.8%).
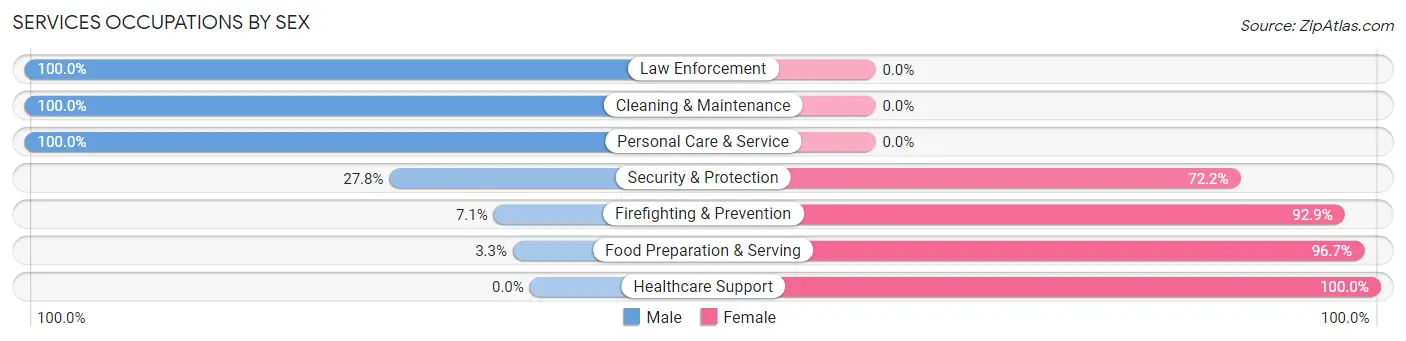
Services Occupations by Sex
Within the Services occupations in Wadley, the most male-oriented occupations are Law Enforcement (100.0%), Cleaning & Maintenance (100.0%), and Personal Care & Service (100.0%), while the most female-oriented occupations are Healthcare Support (100.0%), Food Preparation & Serving (96.7%), and Firefighting & Prevention (92.9%).
| Occupation | Male | Female |
| Healthcare Support | 0 (0.0%) | 22 (100.0%) |
| Security & Protection | 5 (27.8%) | 13 (72.2%) |
| Firefighting & Prevention | 1 (7.1%) | 13 (92.9%) |
| Law Enforcement | 4 (100.0%) | 0 (0.0%) |
| Food Preparation & Serving | 1 (3.3%) | 29 (96.7%) |
| Cleaning & Maintenance | 8 (100.0%) | 0 (0.0%) |
| Personal Care & Service | 10 (100.0%) | 0 (0.0%) |
| Total (Category) | 24 (27.3%) | 64 (72.7%) |
| Total (Overall) | 105 (39.8%) | 159 (60.2%) |
Sales and Office Occupations
The most common Sales and Office occupations in Wadley are Office & Administration (40 | 15.1%), and Sales & Related (10 | 3.8%).
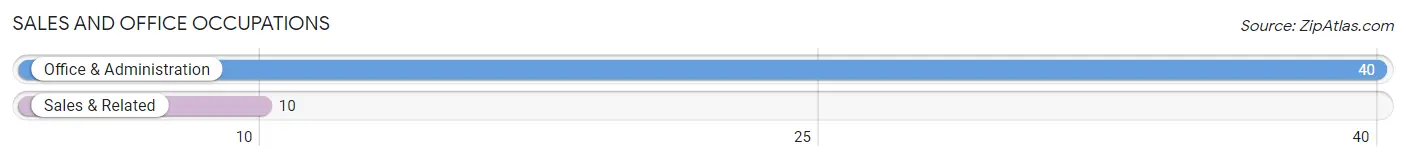
Sales and Office Occupations by Sex
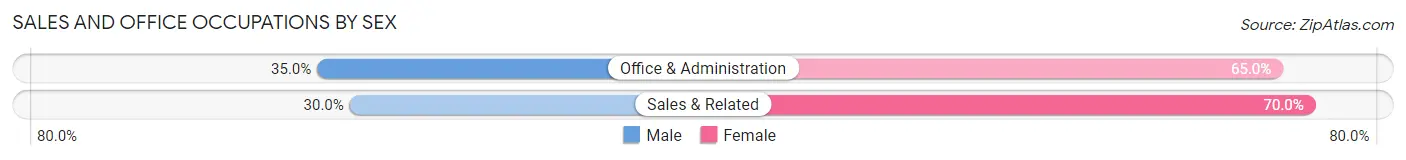
| Occupation | Male | Female |
| Sales & Related | 3 (30.0%) | 7 (70.0%) |
| Office & Administration | 14 (35.0%) | 26 (65.0%) |
| Total (Category) | 17 (34.0%) | 33 (66.0%) |
| Total (Overall) | 105 (39.8%) | 159 (60.2%) |
Natural Resources, Construction and Maintenance Occupations
The most common Natural Resources, Construction and Maintenance occupations in Wadley are Installation, Maintenance & Repair (23 | 8.7%), Construction & Extraction (17 | 6.4%), and Farming, Fishing & Forestry (2 | 0.8%).
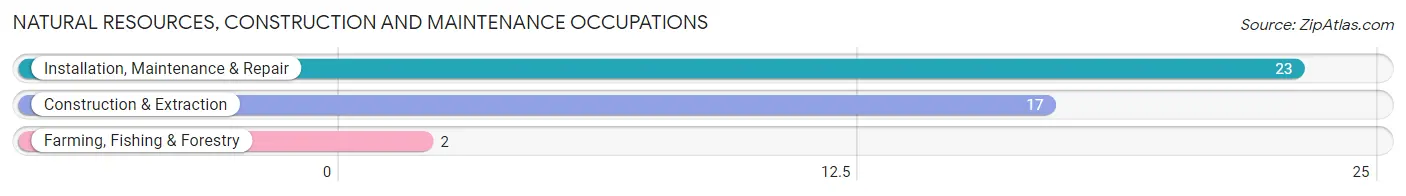
Natural Resources, Construction and Maintenance Occupations by Sex
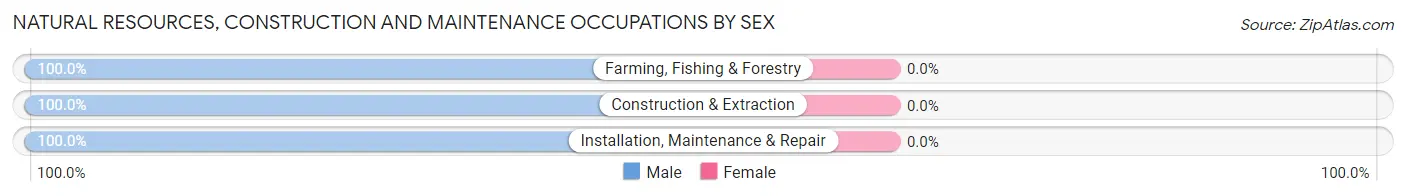
| Occupation | Male | Female |
| Farming, Fishing & Forestry | 2 (100.0%) | 0 (0.0%) |
| Construction & Extraction | 17 (100.0%) | 0 (0.0%) |
| Installation, Maintenance & Repair | 23 (100.0%) | 0 (0.0%) |
| Total (Category) | 42 (100.0%) | 0 (0.0%) |
| Total (Overall) | 105 (39.8%) | 159 (60.2%) |
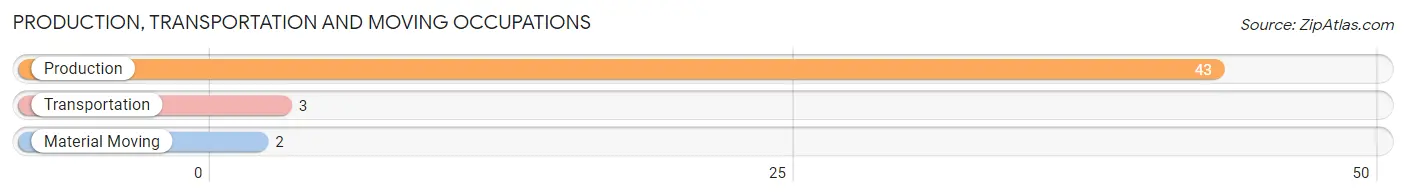
Production, Transportation and Moving Occupations
The most common Production, Transportation and Moving occupations in Wadley are Production (43 | 16.3%), Transportation (3 | 1.1%), and Material Moving (2 | 0.8%).
Production, Transportation and Moving Occupations by Sex
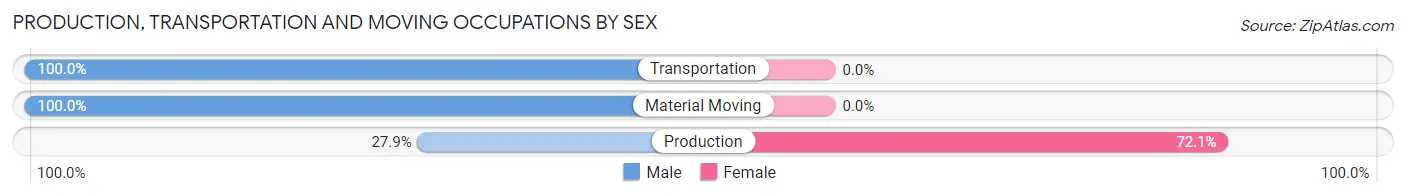
| Occupation | Male | Female |
| Production | 12 (27.9%) | 31 (72.1%) |
| Transportation | 3 (100.0%) | 0 (0.0%) |
| Material Moving | 2 (100.0%) | 0 (0.0%) |
| Total (Category) | 17 (35.4%) | 31 (64.6%) |
| Total (Overall) | 105 (39.8%) | 159 (60.2%) |
Employment Industries by Sex in Wadley
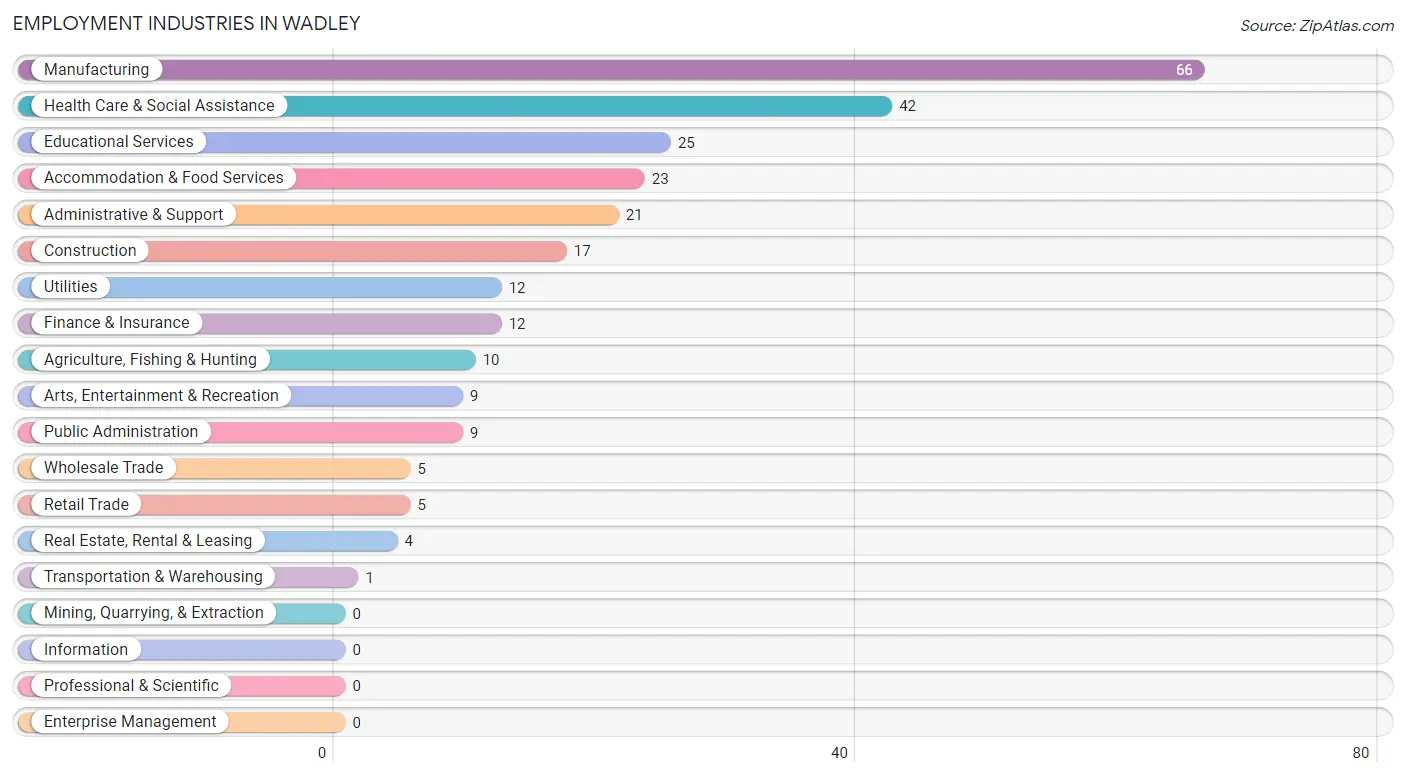
Employment Industries in Wadley
The major employment industries in Wadley include Manufacturing (66 | 25.0%), Health Care & Social Assistance (42 | 15.9%), Educational Services (25 | 9.5%), Accommodation & Food Services (23 | 8.7%), and Administrative & Support (21 | 8.0%).
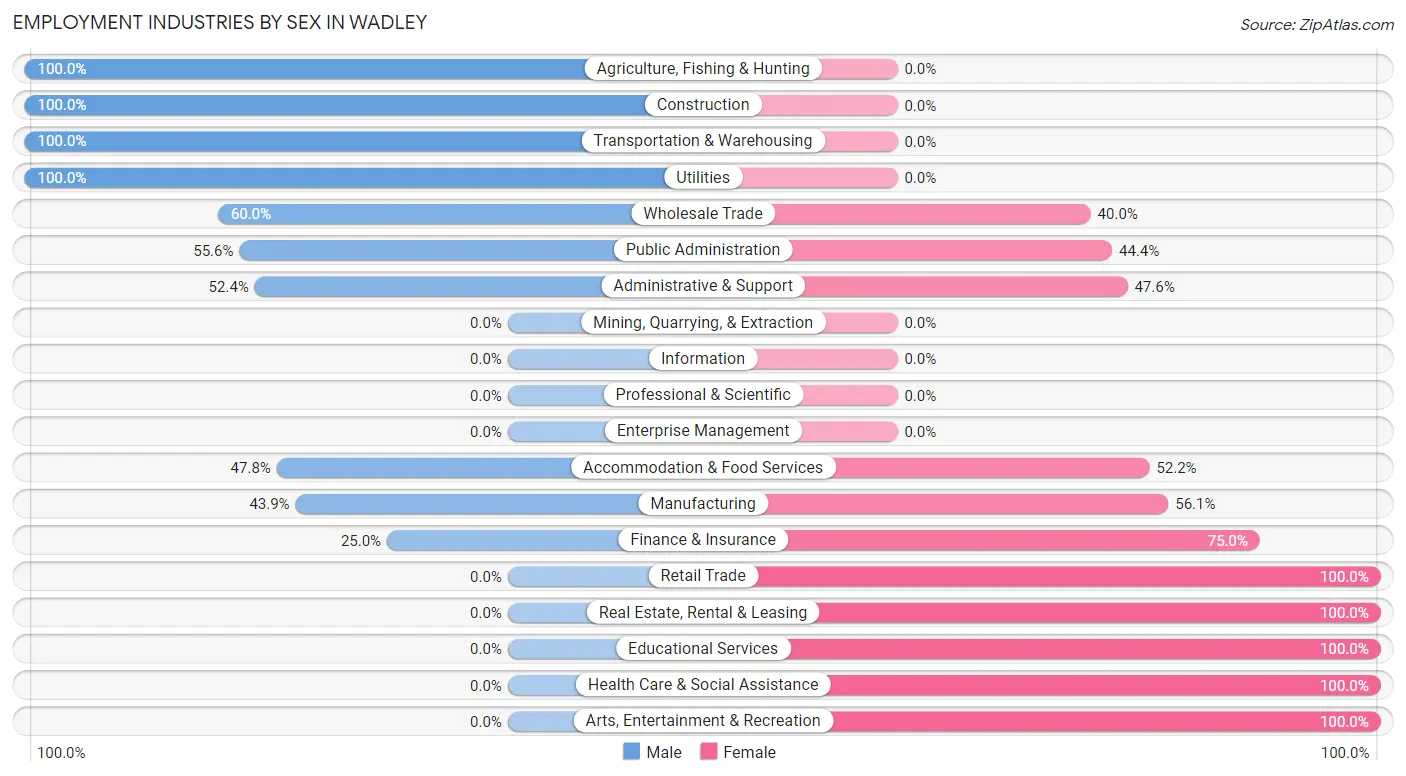
Employment Industries by Sex in Wadley
The Wadley industries that see more men than women are Agriculture, Fishing & Hunting (100.0%), Construction (100.0%), and Transportation & Warehousing (100.0%), whereas the industries that tend to have a higher number of women are Retail Trade (100.0%), Real Estate, Rental & Leasing (100.0%), and Educational Services (100.0%).
| Industry | Male | Female |
| Agriculture, Fishing & Hunting | 10 (100.0%) | 0 (0.0%) |
| Mining, Quarrying, & Extraction | 0 (0.0%) | 0 (0.0%) |
| Construction | 17 (100.0%) | 0 (0.0%) |
| Manufacturing | 29 (43.9%) | 37 (56.1%) |
| Wholesale Trade | 3 (60.0%) | 2 (40.0%) |
| Retail Trade | 0 (0.0%) | 5 (100.0%) |
| Transportation & Warehousing | 1 (100.0%) | 0 (0.0%) |
| Utilities | 12 (100.0%) | 0 (0.0%) |
| Information | 0 (0.0%) | 0 (0.0%) |
| Finance & Insurance | 3 (25.0%) | 9 (75.0%) |
| Real Estate, Rental & Leasing | 0 (0.0%) | 4 (100.0%) |
| Professional & Scientific | 0 (0.0%) | 0 (0.0%) |
| Enterprise Management | 0 (0.0%) | 0 (0.0%) |
| Administrative & Support | 11 (52.4%) | 10 (47.6%) |
| Educational Services | 0 (0.0%) | 25 (100.0%) |
| Health Care & Social Assistance | 0 (0.0%) | 42 (100.0%) |
| Arts, Entertainment & Recreation | 0 (0.0%) | 9 (100.0%) |
| Accommodation & Food Services | 11 (47.8%) | 12 (52.2%) |
| Public Administration | 5 (55.6%) | 4 (44.4%) |
| Total | 105 (39.8%) | 159 (60.2%) |
Education in Wadley
School Enrollment in Wadley
The most common levels of schooling among the 515 students in Wadley are college / undergraduate (363 | 70.5%), high school (64 | 12.4%), and elementary school (38 | 7.4%).
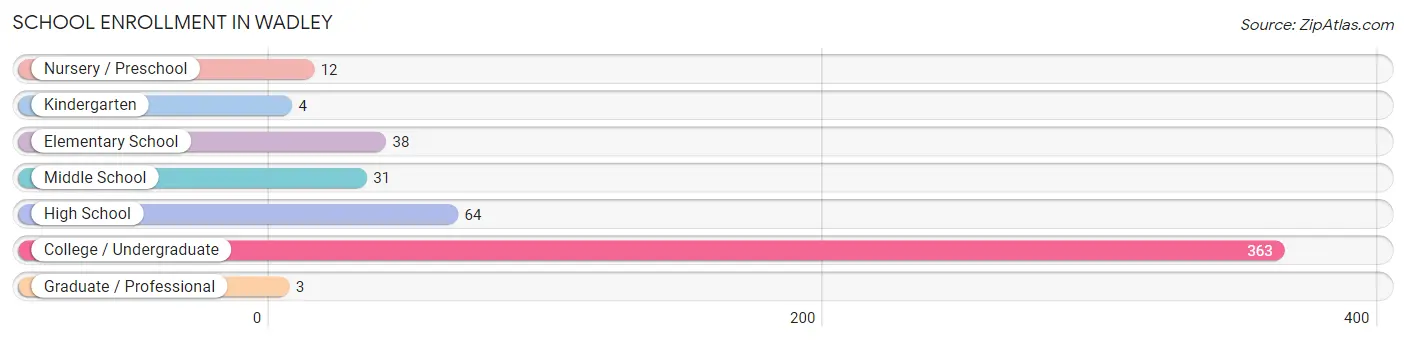
| School Level | # Students | % Students |
| Nursery / Preschool | 12 | 2.3% |
| Kindergarten | 4 | 0.8% |
| Elementary School | 38 | 7.4% |
| Middle School | 31 | 6.0% |
| High School | 64 | 12.4% |
| College / Undergraduate | 363 | 70.5% |
| Graduate / Professional | 3 | 0.6% |
| Total | 515 | 100.0% |
School Enrollment by Age by Funding Source in Wadley
Out of a total of 515 students who are enrolled in schools in Wadley, 54 (10.5%) attend a private institution, while the remaining 461 (89.5%) are enrolled in public schools. The age group of 35 years and over has the highest likelihood of being enrolled in private schools, with 4 (100.0% in the age bracket) enrolled. Conversely, the age group of 5 to 9 year old has the lowest likelihood of being enrolled in a private school, with 40 (100.0% in the age bracket) attending a public institution.
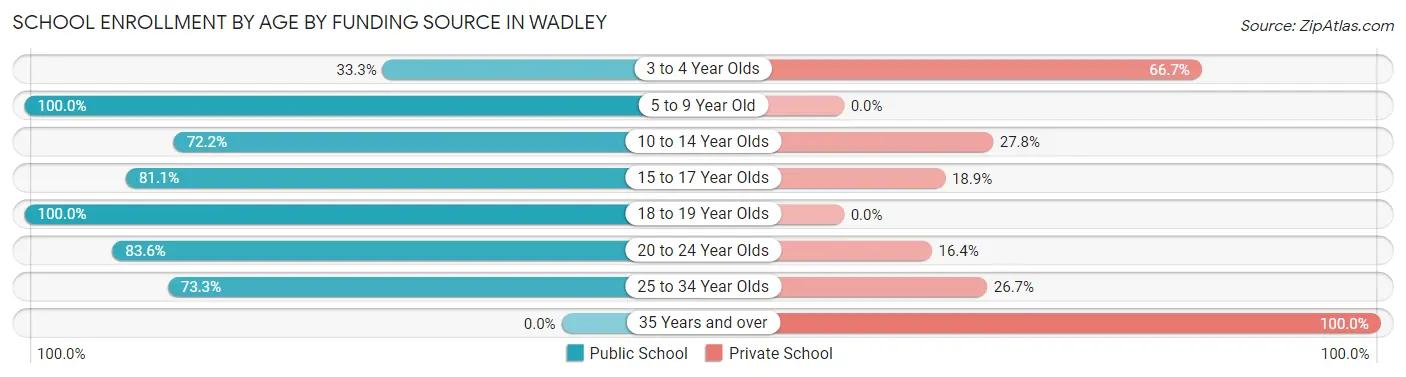
| Age Bracket | Public School | Private School |
| 3 to 4 Year Olds | 4 (33.3%) | 8 (66.7%) |
| 5 to 9 Year Old | 40 (100.0%) | 0 (0.0%) |
| 10 to 14 Year Olds | 26 (72.2%) | 10 (27.8%) |
| 15 to 17 Year Olds | 43 (81.1%) | 10 (18.9%) |
| 18 to 19 Year Olds | 245 (100.0%) | 0 (0.0%) |
| 20 to 24 Year Olds | 92 (83.6%) | 18 (16.4%) |
| 25 to 34 Year Olds | 11 (73.3%) | 4 (26.7%) |
| 35 Years and over | 0 (0.0%) | 4 (100.0%) |
| Total | 461 (89.5%) | 54 (10.5%) |
Educational Attainment by Field of Study in Wadley
Business (35 | 38.5%), education (29 | 31.9%), engineering (9 | 9.9%), bio, nature & agricultural (8 | 8.8%), and liberal arts & history (3 | 3.3%) are the most common fields of study among 91 individuals in Wadley who have obtained a bachelor's degree or higher.
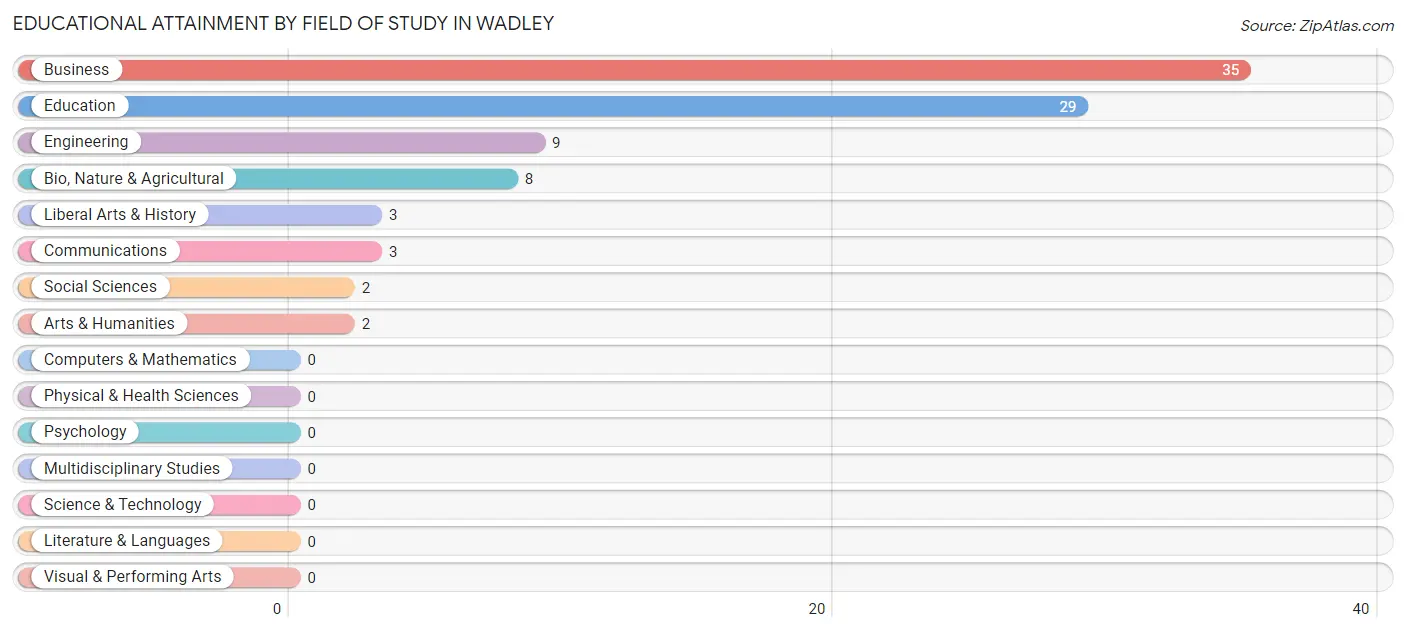
| Field of Study | # Graduates | % Graduates |
| Computers & Mathematics | 0 | 0.0% |
| Bio, Nature & Agricultural | 8 | 8.8% |
| Physical & Health Sciences | 0 | 0.0% |
| Psychology | 0 | 0.0% |
| Social Sciences | 2 | 2.2% |
| Engineering | 9 | 9.9% |
| Multidisciplinary Studies | 0 | 0.0% |
| Science & Technology | 0 | 0.0% |
| Business | 35 | 38.5% |
| Education | 29 | 31.9% |
| Literature & Languages | 0 | 0.0% |
| Liberal Arts & History | 3 | 3.3% |
| Visual & Performing Arts | 0 | 0.0% |
| Communications | 3 | 3.3% |
| Arts & Humanities | 2 | 2.2% |
| Total | 91 | 100.0% |
Transportation & Commute in Wadley
Vehicle Availability by Sex in Wadley
The most prevalent vehicle ownership categories in Wadley are males with 2 vehicles (44, accounting for 41.9%) and females with 2 vehicles (14, making up 43.6%).
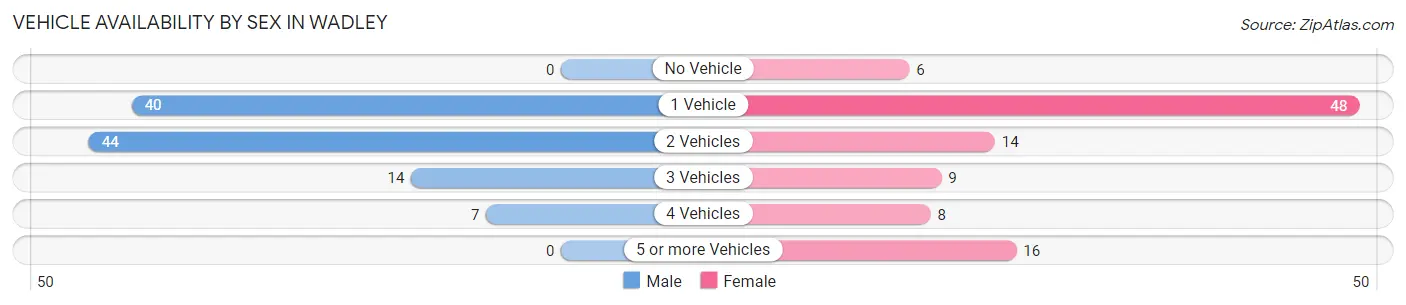
| Vehicles Available | Male | Female |
| No Vehicle | 0 (0.0%) | 6 (5.9%) |
| 1 Vehicle | 40 (38.1%) | 48 (47.5%) |
| 2 Vehicles | 44 (41.9%) | 14 (13.9%) |
| 3 Vehicles | 14 (13.3%) | 9 (8.9%) |
| 4 Vehicles | 7 (6.7%) | 8 (7.9%) |
| 5 or more Vehicles | 0 (0.0%) | 16 (15.8%) |
| Total | 105 (100.0%) | 101 (100.0%) |
Commute Time in Wadley
The most frequently occuring commute durations in Wadley are 20 to 24 minutes (53 commuters, 21.6%), 30 to 34 minutes (51 commuters, 20.8%), and 25 to 29 minutes (26 commuters, 10.6%).
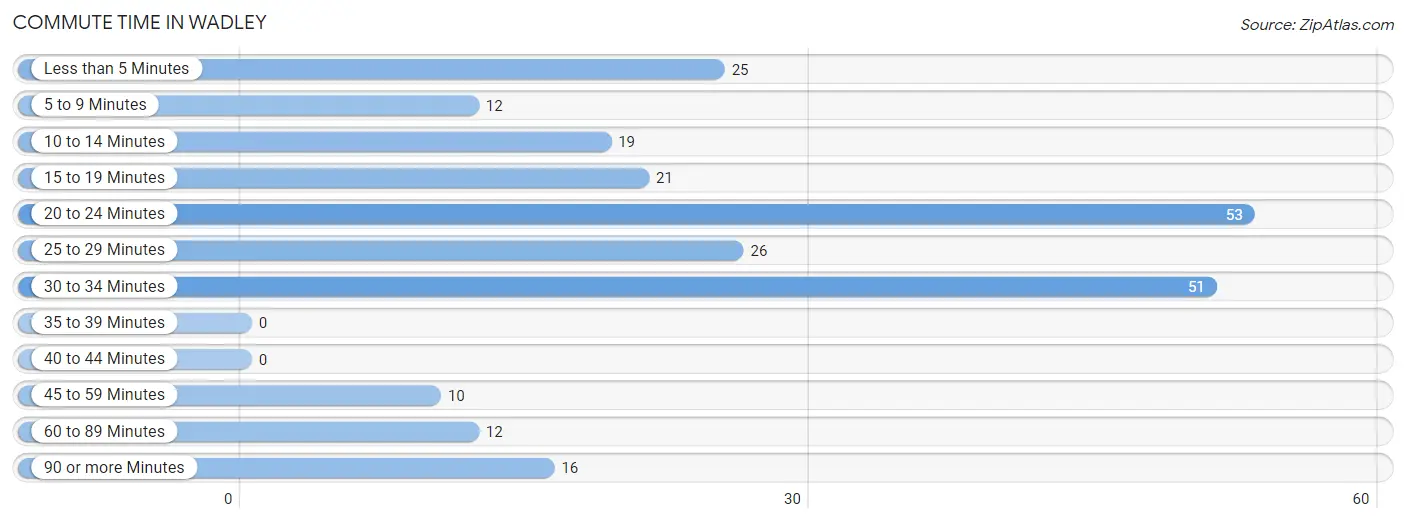
| Commute Time | # Commuters | % Commuters |
| Less than 5 Minutes | 25 | 10.2% |
| 5 to 9 Minutes | 12 | 4.9% |
| 10 to 14 Minutes | 19 | 7.8% |
| 15 to 19 Minutes | 21 | 8.6% |
| 20 to 24 Minutes | 53 | 21.6% |
| 25 to 29 Minutes | 26 | 10.6% |
| 30 to 34 Minutes | 51 | 20.8% |
| 35 to 39 Minutes | 0 | 0.0% |
| 40 to 44 Minutes | 0 | 0.0% |
| 45 to 59 Minutes | 10 | 4.1% |
| 60 to 89 Minutes | 12 | 4.9% |
| 90 or more Minutes | 16 | 6.5% |
Commute Time by Sex in Wadley
The most common commute times in Wadley are 25 to 29 minutes (23 commuters, 21.9%) for males and 20 to 24 minutes (46 commuters, 32.9%) for females.
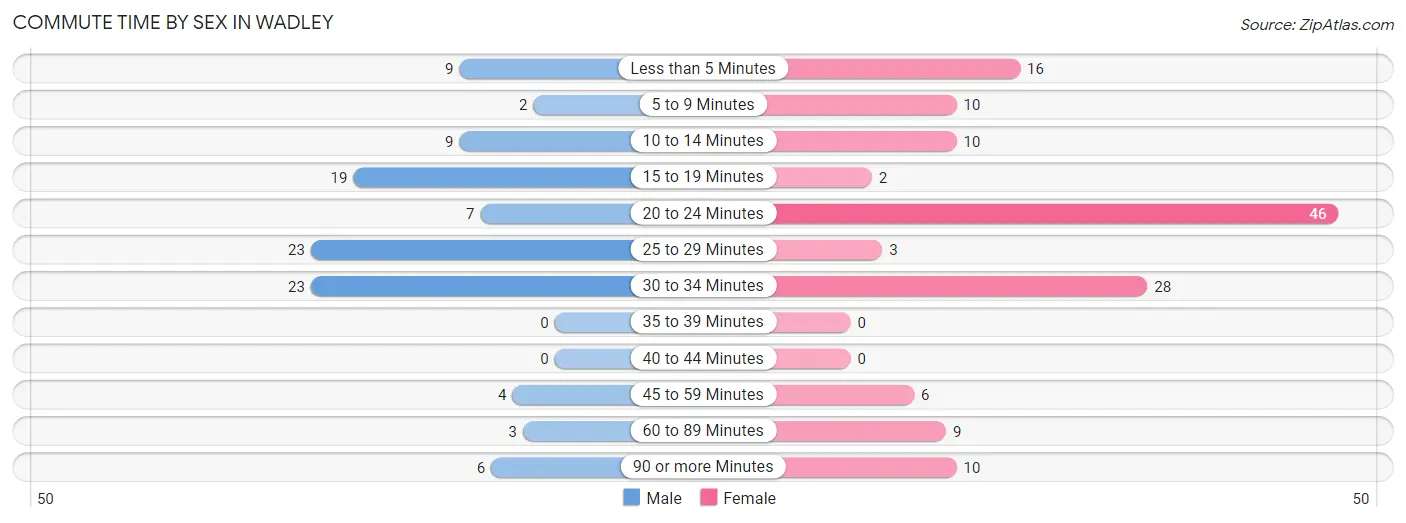
| Commute Time | Male | Female |
| Less than 5 Minutes | 9 (8.6%) | 16 (11.4%) |
| 5 to 9 Minutes | 2 (1.9%) | 10 (7.1%) |
| 10 to 14 Minutes | 9 (8.6%) | 10 (7.1%) |
| 15 to 19 Minutes | 19 (18.1%) | 2 (1.4%) |
| 20 to 24 Minutes | 7 (6.7%) | 46 (32.9%) |
| 25 to 29 Minutes | 23 (21.9%) | 3 (2.1%) |
| 30 to 34 Minutes | 23 (21.9%) | 28 (20.0%) |
| 35 to 39 Minutes | 0 (0.0%) | 0 (0.0%) |
| 40 to 44 Minutes | 0 (0.0%) | 0 (0.0%) |
| 45 to 59 Minutes | 4 (3.8%) | 6 (4.3%) |
| 60 to 89 Minutes | 3 (2.9%) | 9 (6.4%) |
| 90 or more Minutes | 6 (5.7%) | 10 (7.1%) |
Time of Departure to Work by Sex in Wadley
The most frequent times of departure to work in Wadley are 6:30 AM to 6:59 AM (25, 23.8%) for males and 4:00 PM to 11:59 PM (28, 20.0%) for females.
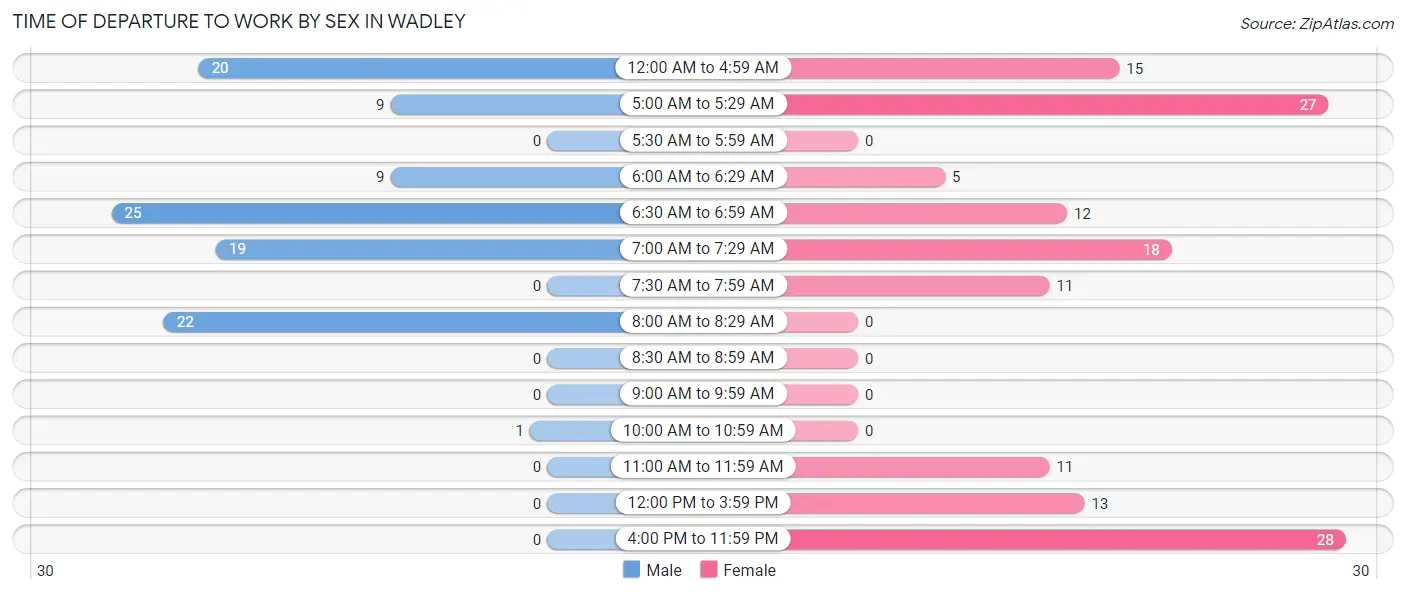
| Time of Departure | Male | Female |
| 12:00 AM to 4:59 AM | 20 (19.1%) | 15 (10.7%) |
| 5:00 AM to 5:29 AM | 9 (8.6%) | 27 (19.3%) |
| 5:30 AM to 5:59 AM | 0 (0.0%) | 0 (0.0%) |
| 6:00 AM to 6:29 AM | 9 (8.6%) | 5 (3.6%) |
| 6:30 AM to 6:59 AM | 25 (23.8%) | 12 (8.6%) |
| 7:00 AM to 7:29 AM | 19 (18.1%) | 18 (12.9%) |
| 7:30 AM to 7:59 AM | 0 (0.0%) | 11 (7.9%) |
| 8:00 AM to 8:29 AM | 22 (20.9%) | 0 (0.0%) |
| 8:30 AM to 8:59 AM | 0 (0.0%) | 0 (0.0%) |
| 9:00 AM to 9:59 AM | 0 (0.0%) | 0 (0.0%) |
| 10:00 AM to 10:59 AM | 1 (0.9%) | 0 (0.0%) |
| 11:00 AM to 11:59 AM | 0 (0.0%) | 11 (7.9%) |
| 12:00 PM to 3:59 PM | 0 (0.0%) | 13 (9.3%) |
| 4:00 PM to 11:59 PM | 0 (0.0%) | 28 (20.0%) |
| Total | 105 (100.0%) | 140 (100.0%) |
Housing Occupancy in Wadley
Occupancy by Ownership in Wadley
Of the total 248 dwellings in Wadley, owner-occupied units account for 133 (53.6%), while renter-occupied units make up 115 (46.4%).
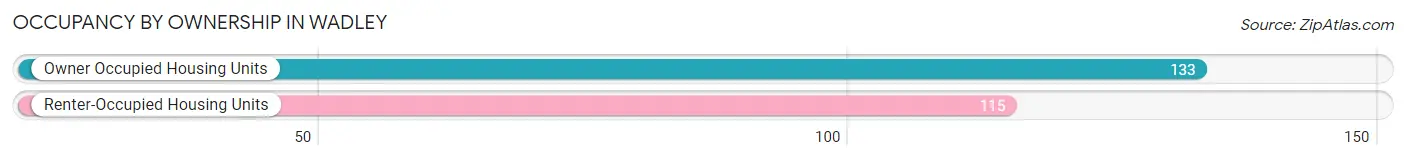
| Occupancy | # Housing Units | % Housing Units |
| Owner Occupied Housing Units | 133 | 53.6% |
| Renter-Occupied Housing Units | 115 | 46.4% |
| Total Occupied Housing Units | 248 | 100.0% |
Occupancy by Household Size in Wadley
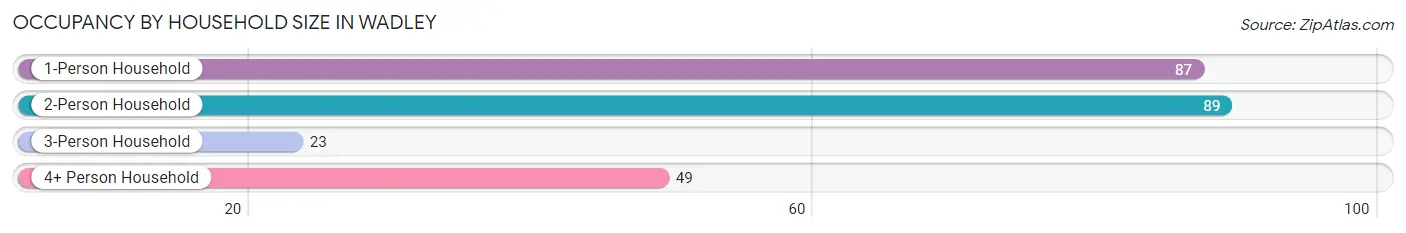
| Household Size | # Housing Units | % Housing Units |
| 1-Person Household | 87 | 35.1% |
| 2-Person Household | 89 | 35.9% |
| 3-Person Household | 23 | 9.3% |
| 4+ Person Household | 49 | 19.8% |
| Total Housing Units | 248 | 100.0% |
Occupancy by Ownership by Household Size in Wadley
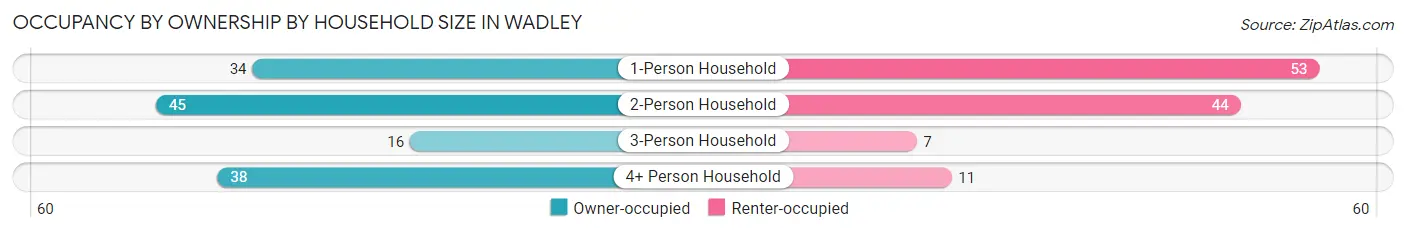
| Household Size | Owner-occupied | Renter-occupied |
| 1-Person Household | 34 (39.1%) | 53 (60.9%) |
| 2-Person Household | 45 (50.6%) | 44 (49.4%) |
| 3-Person Household | 16 (69.6%) | 7 (30.4%) |
| 4+ Person Household | 38 (77.5%) | 11 (22.5%) |
| Total Housing Units | 133 (53.6%) | 115 (46.4%) |
Occupancy by Educational Attainment in Wadley
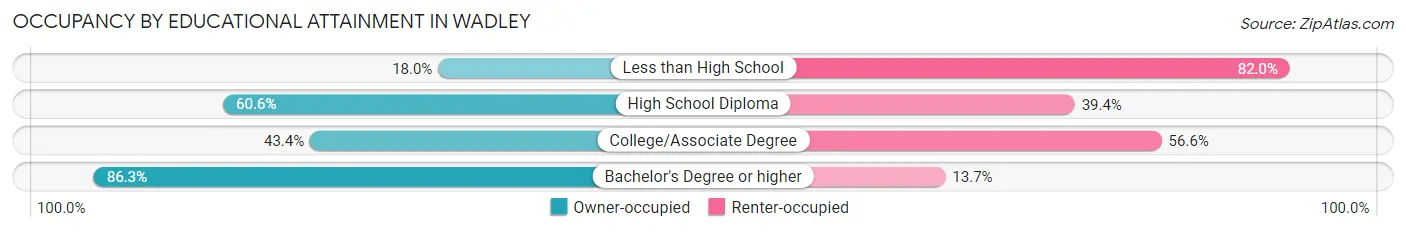
| Household Size | Owner-occupied | Renter-occupied |
| Less than High School | 9 (18.0%) | 41 (82.0%) |
| High School Diploma | 57 (60.6%) | 37 (39.4%) |
| College/Associate Degree | 23 (43.4%) | 30 (56.6%) |
| Bachelor's Degree or higher | 44 (86.3%) | 7 (13.7%) |
Occupancy by Age of Householder in Wadley
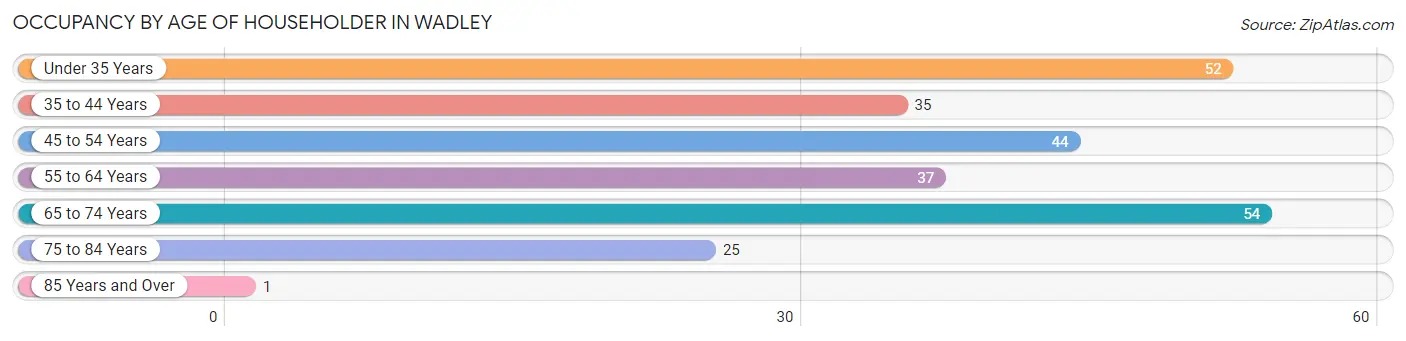
| Age Bracket | # Households | % Households |
| Under 35 Years | 52 | 21.0% |
| 35 to 44 Years | 35 | 14.1% |
| 45 to 54 Years | 44 | 17.7% |
| 55 to 64 Years | 37 | 14.9% |
| 65 to 74 Years | 54 | 21.8% |
| 75 to 84 Years | 25 | 10.1% |
| 85 Years and Over | 1 | 0.4% |
| Total | 248 | 100.0% |
Housing Finances in Wadley
Median Income by Occupancy in Wadley
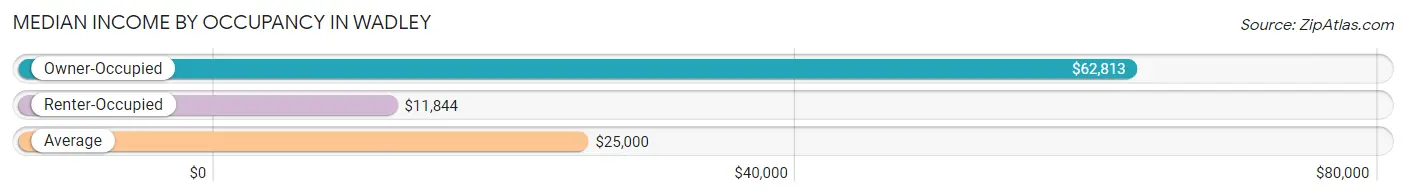
| Occupancy Type | # Households | Median Income |
| Owner-Occupied | 133 (53.6%) | $62,813 |
| Renter-Occupied | 115 (46.4%) | $11,844 |
| Average | 248 (100.0%) | $25,000 |
Occupancy by Householder Income Bracket in Wadley
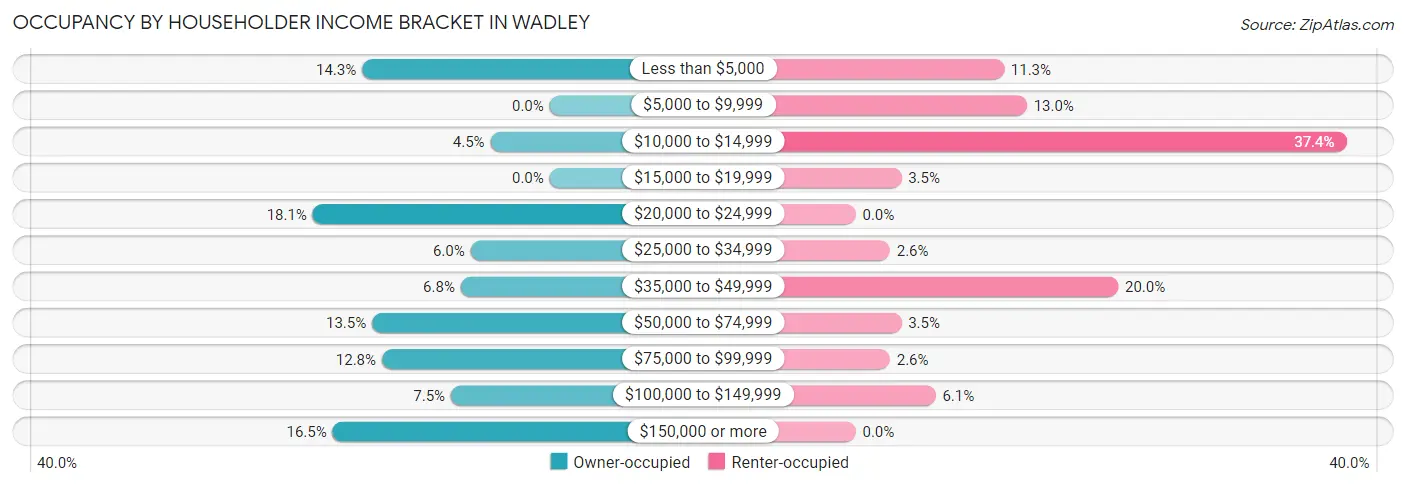
| Income Bracket | Owner-occupied | Renter-occupied |
| Less than $5,000 | 19 (14.3%) | 13 (11.3%) |
| $5,000 to $9,999 | 0 (0.0%) | 15 (13.0%) |
| $10,000 to $14,999 | 6 (4.5%) | 43 (37.4%) |
| $15,000 to $19,999 | 0 (0.0%) | 4 (3.5%) |
| $20,000 to $24,999 | 24 (18.0%) | 0 (0.0%) |
| $25,000 to $34,999 | 8 (6.0%) | 3 (2.6%) |
| $35,000 to $49,999 | 9 (6.8%) | 23 (20.0%) |
| $50,000 to $74,999 | 18 (13.5%) | 4 (3.5%) |
| $75,000 to $99,999 | 17 (12.8%) | 3 (2.6%) |
| $100,000 to $149,999 | 10 (7.5%) | 7 (6.1%) |
| $150,000 or more | 22 (16.5%) | 0 (0.0%) |
| Total | 133 (100.0%) | 115 (100.0%) |
Monthly Housing Cost Tiers in Wadley
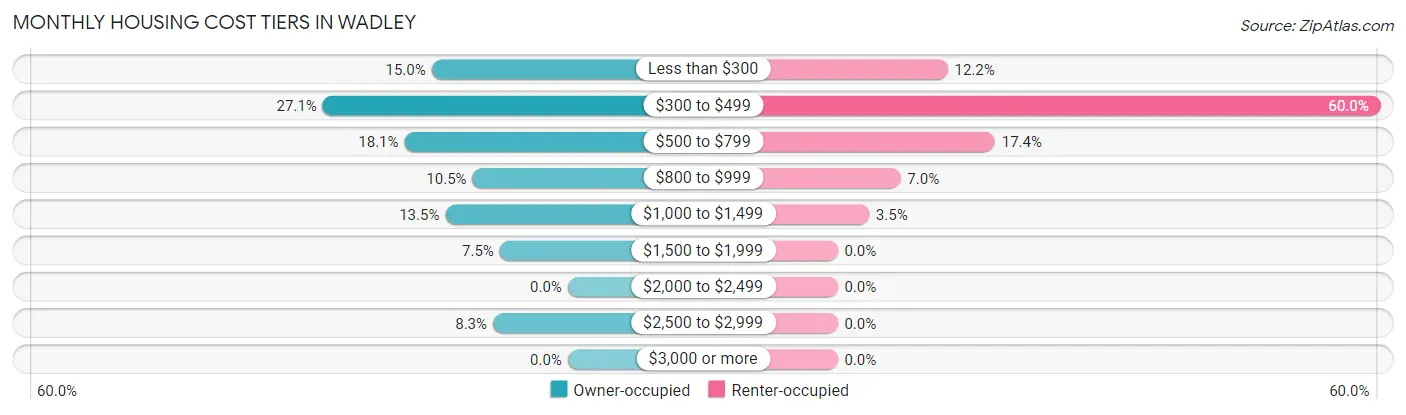
| Monthly Cost | Owner-occupied | Renter-occupied |
| Less than $300 | 20 (15.0%) | 14 (12.2%) |
| $300 to $499 | 36 (27.1%) | 69 (60.0%) |
| $500 to $799 | 24 (18.0%) | 20 (17.4%) |
| $800 to $999 | 14 (10.5%) | 8 (7.0%) |
| $1,000 to $1,499 | 18 (13.5%) | 4 (3.5%) |
| $1,500 to $1,999 | 10 (7.5%) | 0 (0.0%) |
| $2,000 to $2,499 | 0 (0.0%) | 0 (0.0%) |
| $2,500 to $2,999 | 11 (8.3%) | 0 (0.0%) |
| $3,000 or more | 0 (0.0%) | 0 (0.0%) |
| Total | 133 (100.0%) | 115 (100.0%) |
Physical Housing Characteristics in Wadley
Housing Structures in Wadley
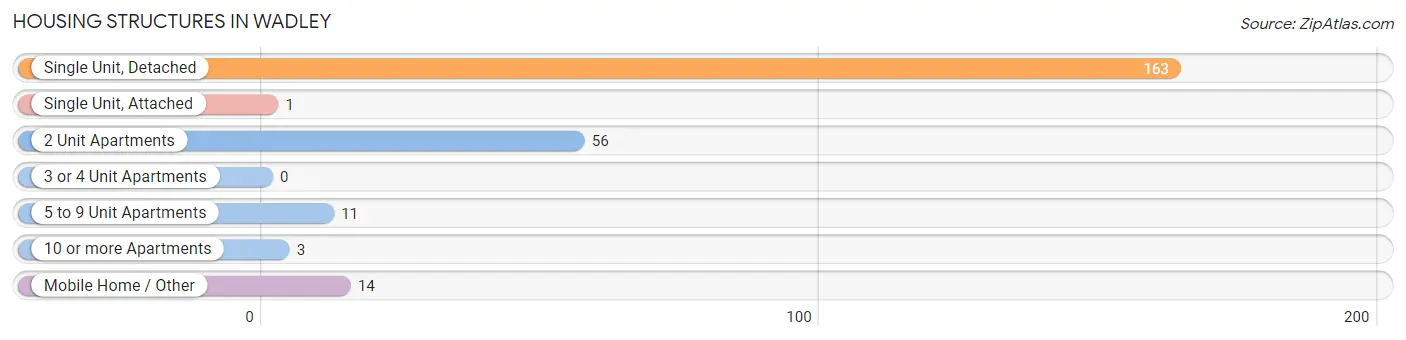
| Structure Type | # Housing Units | % Housing Units |
| Single Unit, Detached | 163 | 65.7% |
| Single Unit, Attached | 1 | 0.4% |
| 2 Unit Apartments | 56 | 22.6% |
| 3 or 4 Unit Apartments | 0 | 0.0% |
| 5 to 9 Unit Apartments | 11 | 4.4% |
| 10 or more Apartments | 3 | 1.2% |
| Mobile Home / Other | 14 | 5.7% |
| Total | 248 | 100.0% |
Housing Structures by Occupancy in Wadley
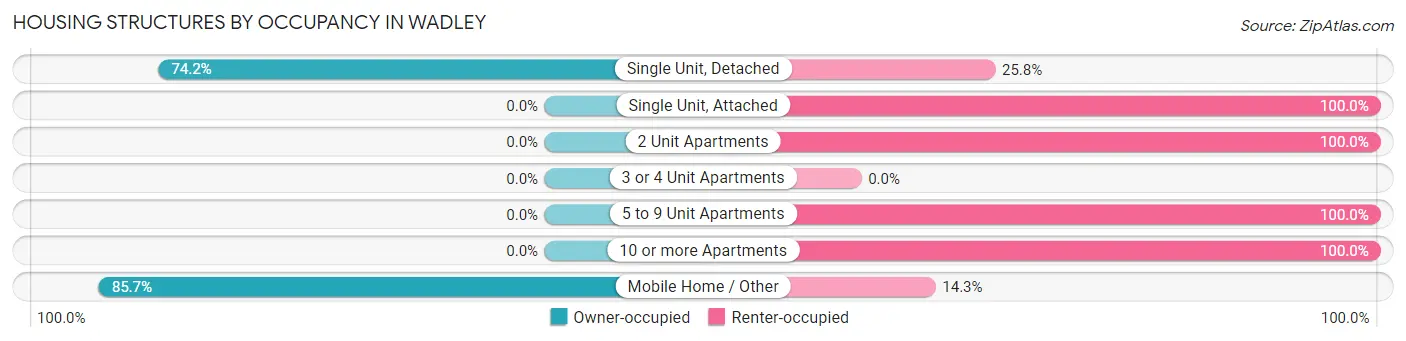
| Structure Type | Owner-occupied | Renter-occupied |
| Single Unit, Detached | 121 (74.2%) | 42 (25.8%) |
| Single Unit, Attached | 0 (0.0%) | 1 (100.0%) |
| 2 Unit Apartments | 0 (0.0%) | 56 (100.0%) |
| 3 or 4 Unit Apartments | 0 (0.0%) | 0 (0.0%) |
| 5 to 9 Unit Apartments | 0 (0.0%) | 11 (100.0%) |
| 10 or more Apartments | 0 (0.0%) | 3 (100.0%) |
| Mobile Home / Other | 12 (85.7%) | 2 (14.3%) |
| Total | 133 (53.6%) | 115 (46.4%) |
Housing Structures by Number of Rooms in Wadley
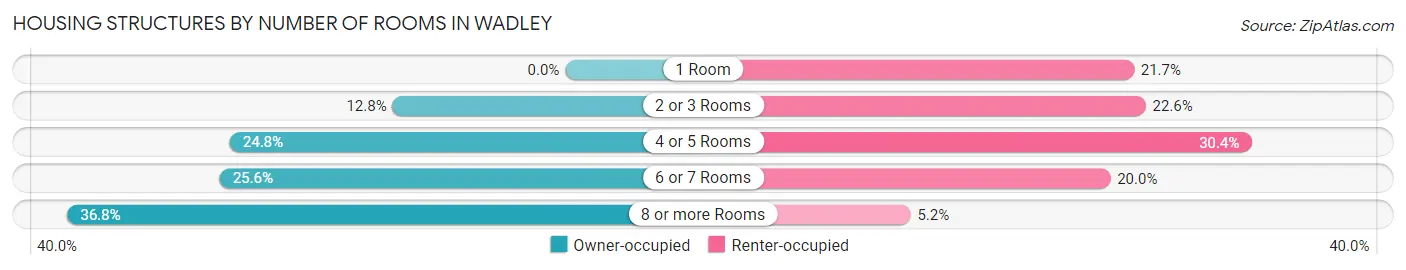
| Number of Rooms | Owner-occupied | Renter-occupied |
| 1 Room | 0 (0.0%) | 25 (21.7%) |
| 2 or 3 Rooms | 17 (12.8%) | 26 (22.6%) |
| 4 or 5 Rooms | 33 (24.8%) | 35 (30.4%) |
| 6 or 7 Rooms | 34 (25.6%) | 23 (20.0%) |
| 8 or more Rooms | 49 (36.8%) | 6 (5.2%) |
| Total | 133 (100.0%) | 115 (100.0%) |
Housing Structure by Heating Type in Wadley
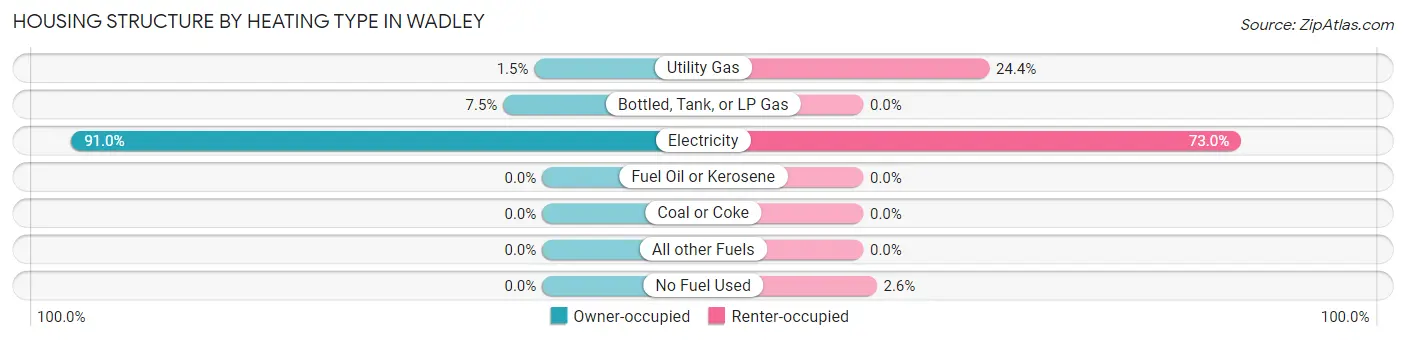
| Heating Type | Owner-occupied | Renter-occupied |
| Utility Gas | 2 (1.5%) | 28 (24.3%) |
| Bottled, Tank, or LP Gas | 10 (7.5%) | 0 (0.0%) |
| Electricity | 121 (91.0%) | 84 (73.0%) |
| Fuel Oil or Kerosene | 0 (0.0%) | 0 (0.0%) |
| Coal or Coke | 0 (0.0%) | 0 (0.0%) |
| All other Fuels | 0 (0.0%) | 0 (0.0%) |
| No Fuel Used | 0 (0.0%) | 3 (2.6%) |
| Total | 133 (100.0%) | 115 (100.0%) |
Household Vehicle Usage in Wadley
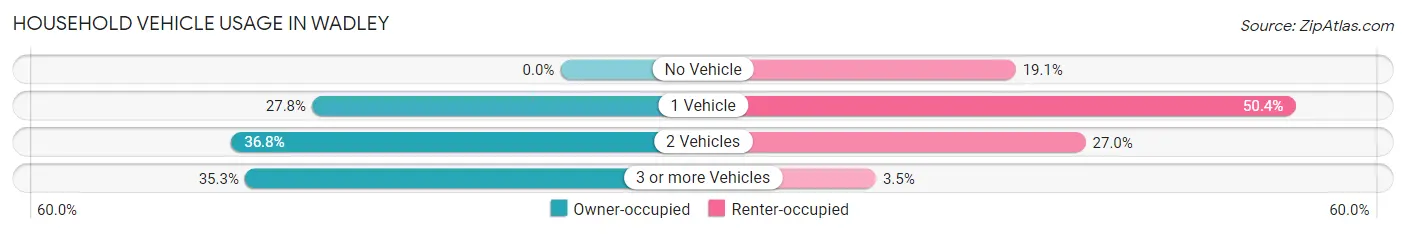
| Vehicles per Household | Owner-occupied | Renter-occupied |
| No Vehicle | 0 (0.0%) | 22 (19.1%) |
| 1 Vehicle | 37 (27.8%) | 58 (50.4%) |
| 2 Vehicles | 49 (36.8%) | 31 (27.0%) |
| 3 or more Vehicles | 47 (35.3%) | 4 (3.5%) |
| Total | 133 (100.0%) | 115 (100.0%) |
Real Estate & Mortgages in Wadley
Real Estate and Mortgage Overview in Wadley
| Characteristic | Without Mortgage | With Mortgage |
| Housing Units | 60 | 73 |
| Median Property Value | $75,500 | $201,400 |
| Median Household Income | - | - |
| Monthly Housing Costs | $365 | $0 |
| Real Estate Taxes | $273 | $12 |
Property Value by Mortgage Status in Wadley
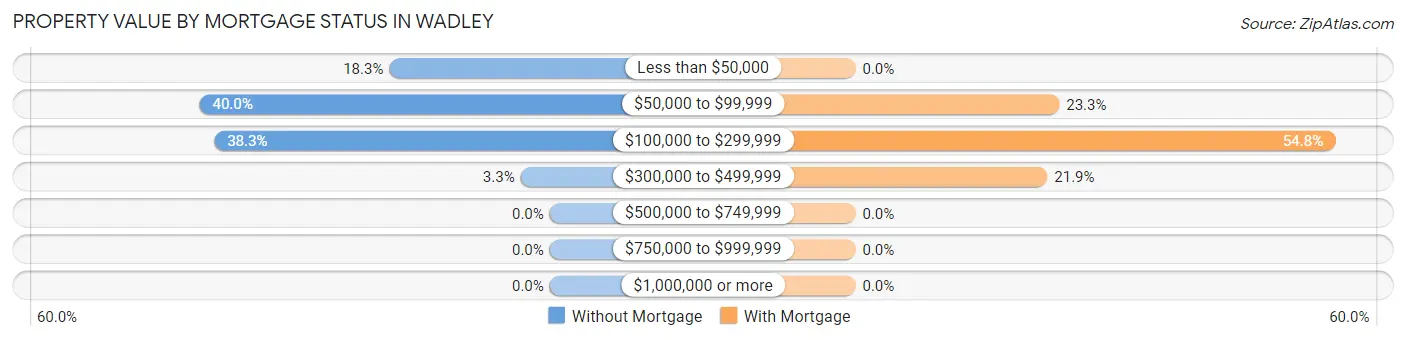
| Property Value | Without Mortgage | With Mortgage |
| Less than $50,000 | 11 (18.3%) | 0 (0.0%) |
| $50,000 to $99,999 | 24 (40.0%) | 17 (23.3%) |
| $100,000 to $299,999 | 23 (38.3%) | 40 (54.8%) |
| $300,000 to $499,999 | 2 (3.3%) | 16 (21.9%) |
| $500,000 to $749,999 | 0 (0.0%) | 0 (0.0%) |
| $750,000 to $999,999 | 0 (0.0%) | 0 (0.0%) |
| $1,000,000 or more | 0 (0.0%) | 0 (0.0%) |
| Total | 60 (100.0%) | 73 (100.0%) |
Household Income by Mortgage Status in Wadley
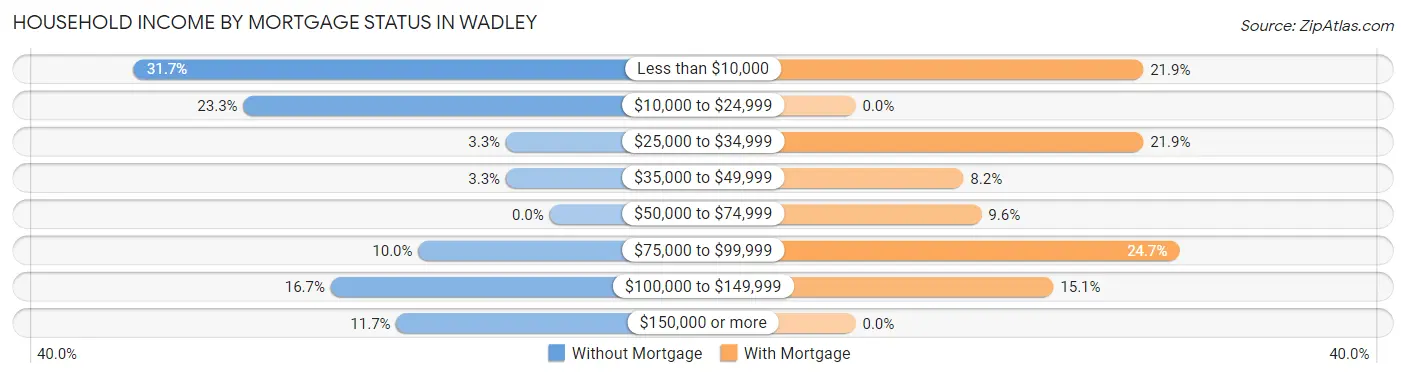
| Household Income | Without Mortgage | With Mortgage |
| Less than $10,000 | 19 (31.7%) | 16 (21.9%) |
| $10,000 to $24,999 | 14 (23.3%) | 0 (0.0%) |
| $25,000 to $34,999 | 2 (3.3%) | 16 (21.9%) |
| $35,000 to $49,999 | 2 (3.3%) | 6 (8.2%) |
| $50,000 to $74,999 | 0 (0.0%) | 7 (9.6%) |
| $75,000 to $99,999 | 6 (10.0%) | 18 (24.7%) |
| $100,000 to $149,999 | 10 (16.7%) | 11 (15.1%) |
| $150,000 or more | 7 (11.7%) | 0 (0.0%) |
| Total | 60 (100.0%) | 73 (100.0%) |
Property Value to Household Income Ratio in Wadley
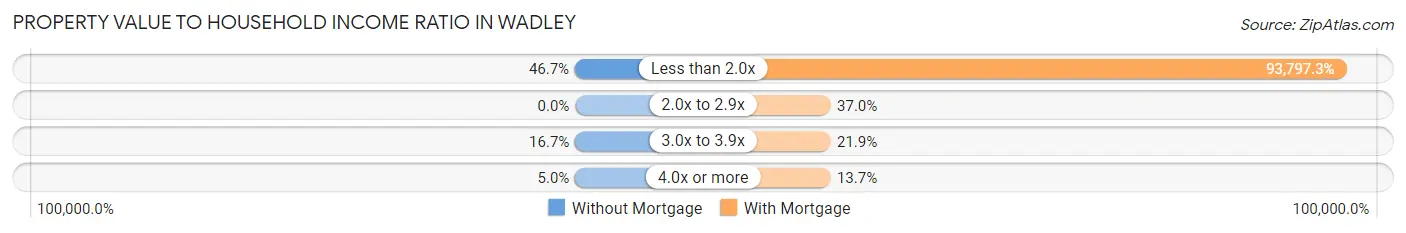
| Value-to-Income Ratio | Without Mortgage | With Mortgage |
| Less than 2.0x | 28 (46.7%) | 68,472 (93,797.3%) |
| 2.0x to 2.9x | 0 (0.0%) | 27 (37.0%) |
| 3.0x to 3.9x | 10 (16.7%) | 16 (21.9%) |
| 4.0x or more | 3 (5.0%) | 10 (13.7%) |
| Total | 60 (100.0%) | 73 (100.0%) |
Real Estate Taxes by Mortgage Status in Wadley
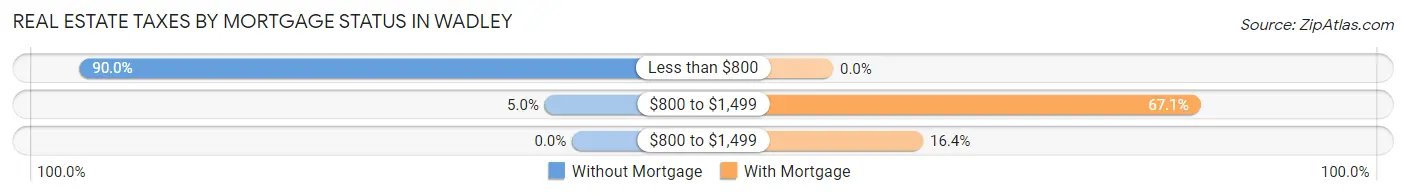
| Property Taxes | Without Mortgage | With Mortgage |
| Less than $800 | 54 (90.0%) | 0 (0.0%) |
| $800 to $1,499 | 3 (5.0%) | 49 (67.1%) |
| $800 to $1,499 | 0 (0.0%) | 12 (16.4%) |
| Total | 60 (100.0%) | 73 (100.0%) |
Health & Disability in Wadley
Health Insurance Coverage by Age in Wadley
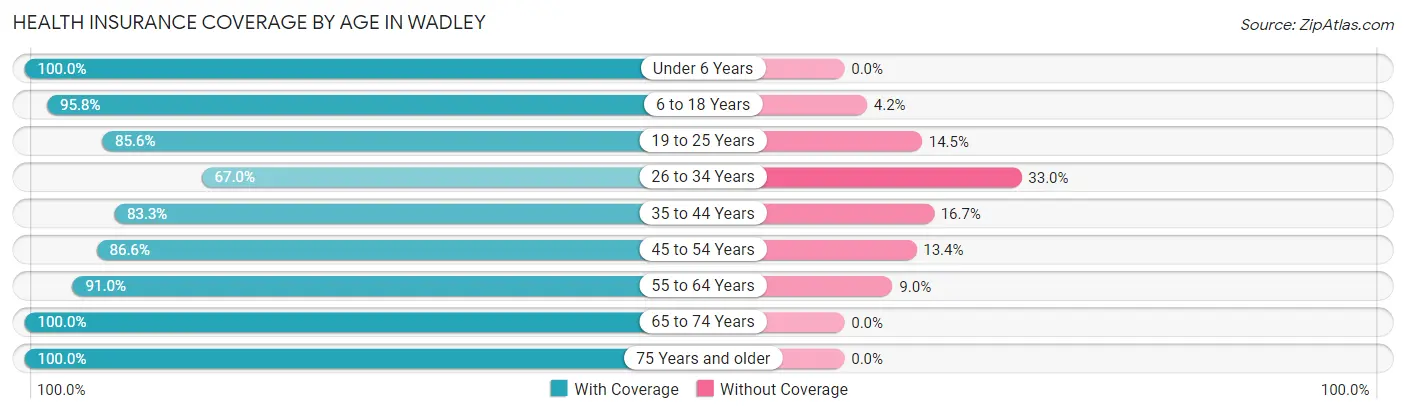
| Age Bracket | With Coverage | Without Coverage |
| Under 6 Years | 62 (100.0%) | 0 (0.0%) |
| 6 to 18 Years | 228 (95.8%) | 10 (4.2%) |
| 19 to 25 Years | 225 (85.6%) | 38 (14.4%) |
| 26 to 34 Years | 71 (67.0%) | 35 (33.0%) |
| 35 to 44 Years | 35 (83.3%) | 7 (16.7%) |
| 45 to 54 Years | 58 (86.6%) | 9 (13.4%) |
| 55 to 64 Years | 71 (91.0%) | 7 (9.0%) |
| 65 to 74 Years | 57 (100.0%) | 0 (0.0%) |
| 75 Years and older | 37 (100.0%) | 0 (0.0%) |
| Total | 844 (88.8%) | 106 (11.2%) |
Health Insurance Coverage by Citizenship Status in Wadley
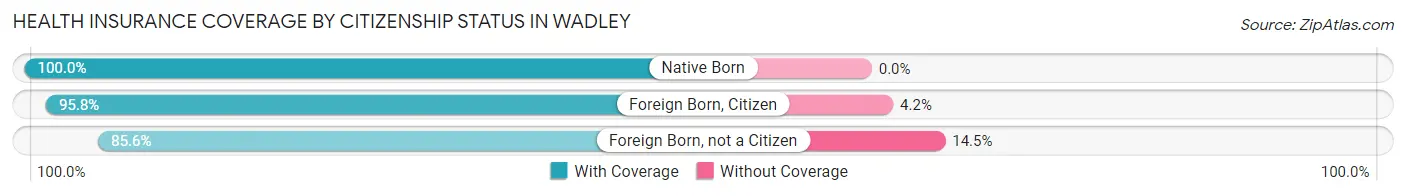
| Citizenship Status | With Coverage | Without Coverage |
| Native Born | 62 (100.0%) | 0 (0.0%) |
| Foreign Born, Citizen | 228 (95.8%) | 10 (4.2%) |
| Foreign Born, not a Citizen | 225 (85.6%) | 38 (14.4%) |
Health Insurance Coverage by Household Income in Wadley
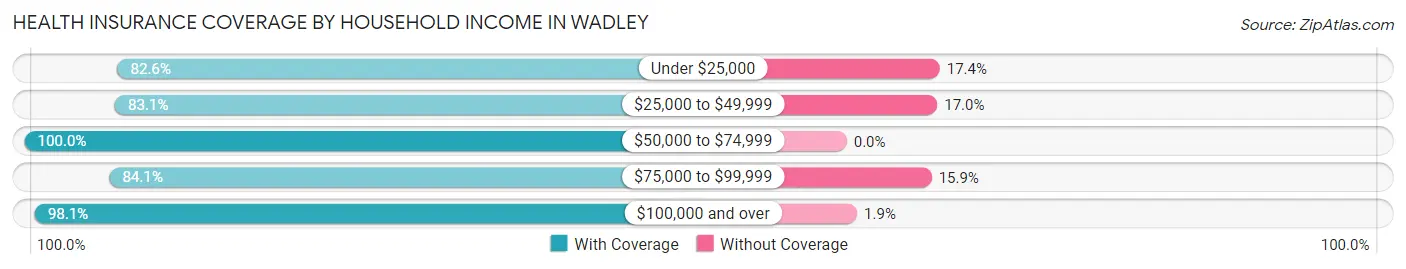
| Household Income | With Coverage | Without Coverage |
| Under $25,000 | 180 (82.6%) | 38 (17.4%) |
| $25,000 to $49,999 | 98 (83.1%) | 20 (17.0%) |
| $50,000 to $74,999 | 88 (100.0%) | 0 (0.0%) |
| $75,000 to $99,999 | 37 (84.1%) | 7 (15.9%) |
| $100,000 and over | 152 (98.1%) | 3 (1.9%) |
Public vs Private Health Insurance Coverage by Age in Wadley
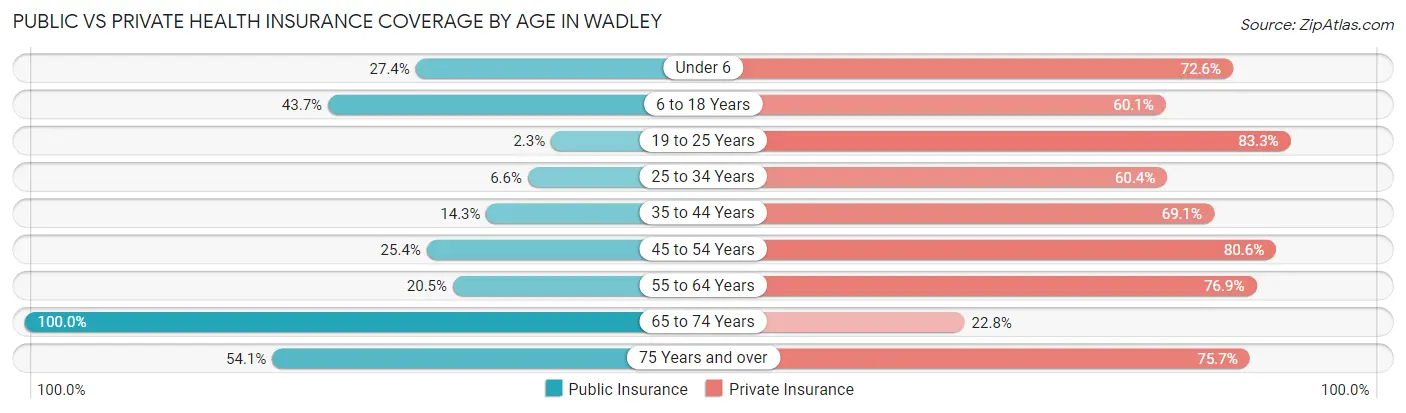
| Age Bracket | Public Insurance | Private Insurance |
| Under 6 | 17 (27.4%) | 45 (72.6%) |
| 6 to 18 Years | 104 (43.7%) | 143 (60.1%) |
| 19 to 25 Years | 6 (2.3%) | 219 (83.3%) |
| 25 to 34 Years | 7 (6.6%) | 64 (60.4%) |
| 35 to 44 Years | 6 (14.3%) | 29 (69.1%) |
| 45 to 54 Years | 17 (25.4%) | 54 (80.6%) |
| 55 to 64 Years | 16 (20.5%) | 60 (76.9%) |
| 65 to 74 Years | 57 (100.0%) | 13 (22.8%) |
| 75 Years and over | 20 (54.0%) | 28 (75.7%) |
| Total | 250 (26.3%) | 655 (69.0%) |
Disability Status by Sex by Age in Wadley
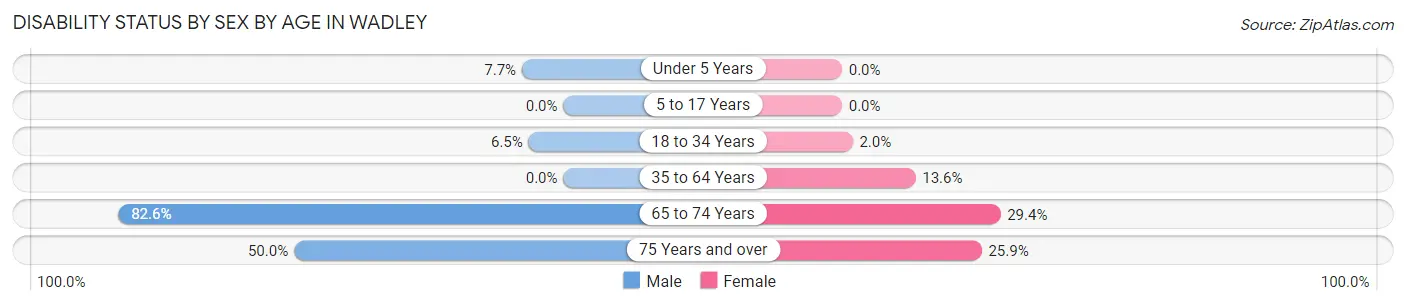
| Age Bracket | Male | Female |
| Under 5 Years | 2 (7.7%) | 0 (0.0%) |
| 5 to 17 Years | 0 (0.0%) | 0 (0.0%) |
| 18 to 34 Years | 14 (6.5%) | 5 (2.0%) |
| 35 to 64 Years | 0 (0.0%) | 15 (13.6%) |
| 65 to 74 Years | 19 (82.6%) | 10 (29.4%) |
| 75 Years and over | 5 (50.0%) | 7 (25.9%) |
Disability Class by Sex by Age in Wadley
Disability Class: Hearing Difficulty
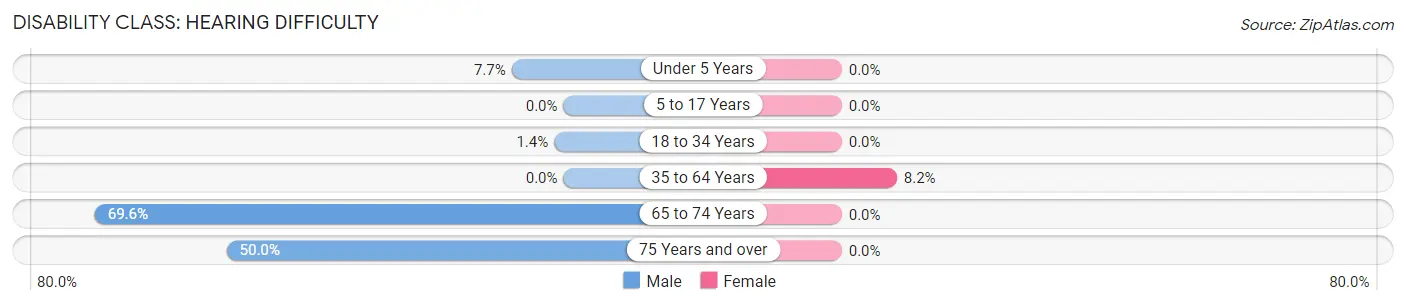
| Age Bracket | Male | Female |
| Under 5 Years | 2 (7.7%) | 0 (0.0%) |
| 5 to 17 Years | 0 (0.0%) | 0 (0.0%) |
| 18 to 34 Years | 3 (1.4%) | 0 (0.0%) |
| 35 to 64 Years | 0 (0.0%) | 9 (8.2%) |
| 65 to 74 Years | 16 (69.6%) | 0 (0.0%) |
| 75 Years and over | 5 (50.0%) | 0 (0.0%) |
Disability Class: Vision Difficulty
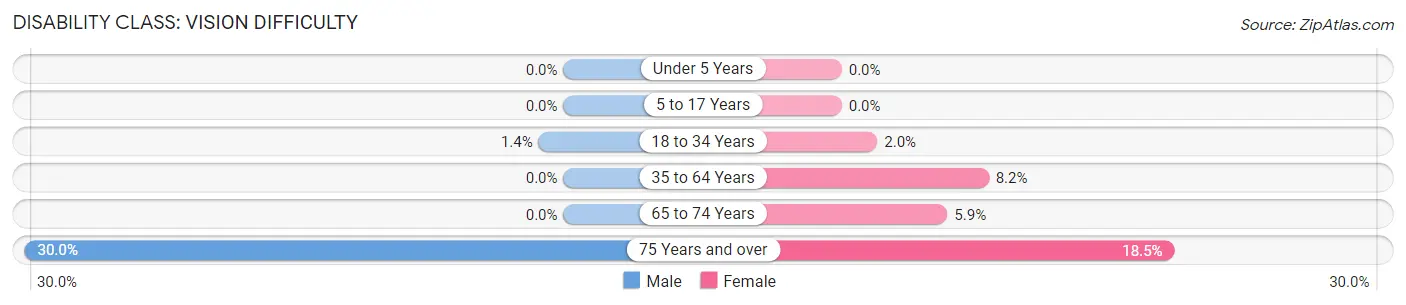
| Age Bracket | Male | Female |
| Under 5 Years | 0 (0.0%) | 0 (0.0%) |
| 5 to 17 Years | 0 (0.0%) | 0 (0.0%) |
| 18 to 34 Years | 3 (1.4%) | 5 (2.0%) |
| 35 to 64 Years | 0 (0.0%) | 9 (8.2%) |
| 65 to 74 Years | 0 (0.0%) | 2 (5.9%) |
| 75 Years and over | 3 (30.0%) | 5 (18.5%) |
Disability Class: Cognitive Difficulty
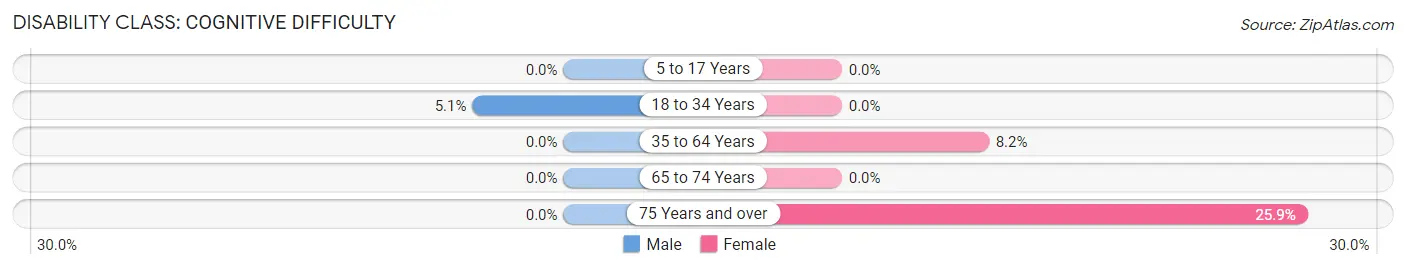
| Age Bracket | Male | Female |
| 5 to 17 Years | 0 (0.0%) | 0 (0.0%) |
| 18 to 34 Years | 11 (5.1%) | 0 (0.0%) |
| 35 to 64 Years | 0 (0.0%) | 9 (8.2%) |
| 65 to 74 Years | 0 (0.0%) | 0 (0.0%) |
| 75 Years and over | 0 (0.0%) | 7 (25.9%) |
Disability Class: Ambulatory Difficulty
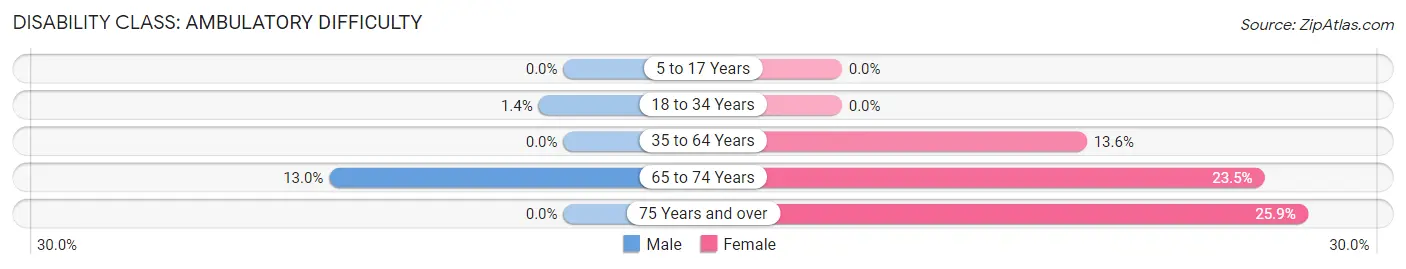
| Age Bracket | Male | Female |
| 5 to 17 Years | 0 (0.0%) | 0 (0.0%) |
| 18 to 34 Years | 3 (1.4%) | 0 (0.0%) |
| 35 to 64 Years | 0 (0.0%) | 15 (13.6%) |
| 65 to 74 Years | 3 (13.0%) | 8 (23.5%) |
| 75 Years and over | 0 (0.0%) | 7 (25.9%) |
Disability Class: Self-Care Difficulty
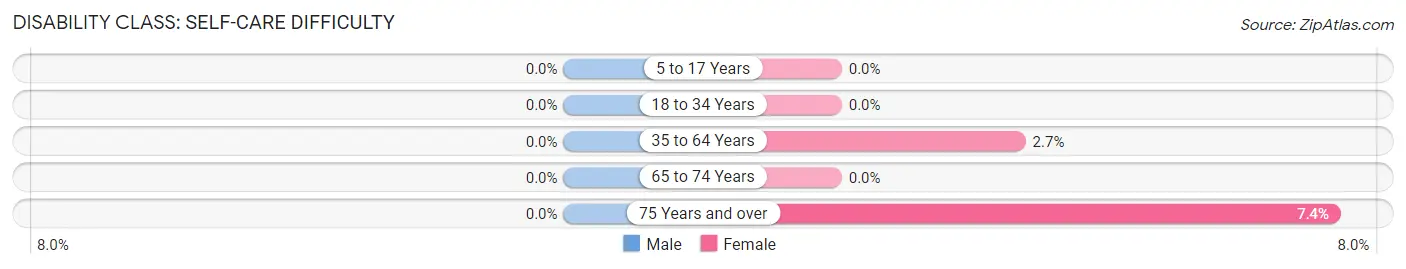
| Age Bracket | Male | Female |
| 5 to 17 Years | 0 (0.0%) | 0 (0.0%) |
| 18 to 34 Years | 0 (0.0%) | 0 (0.0%) |
| 35 to 64 Years | 0 (0.0%) | 3 (2.7%) |
| 65 to 74 Years | 0 (0.0%) | 0 (0.0%) |
| 75 Years and over | 0 (0.0%) | 2 (7.4%) |
Technology Access in Wadley
Computing Device Access in Wadley
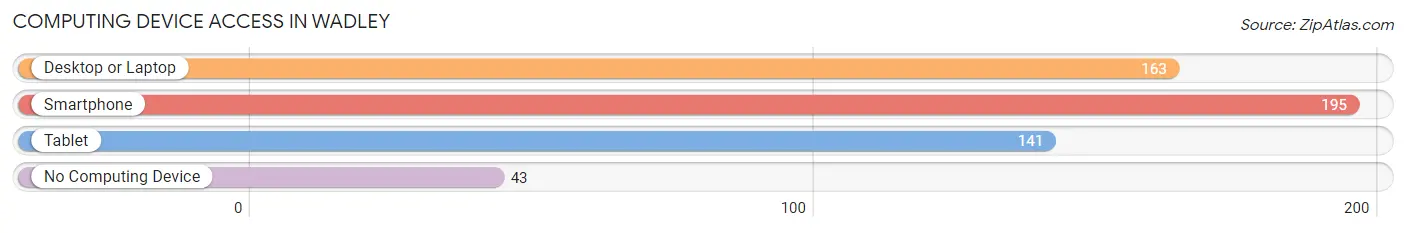
| Device Type | # Households | % Households |
| Desktop or Laptop | 163 | 65.7% |
| Smartphone | 195 | 78.6% |
| Tablet | 141 | 56.9% |
| No Computing Device | 43 | 17.3% |
| Total | 248 | 100.0% |
Internet Access in Wadley
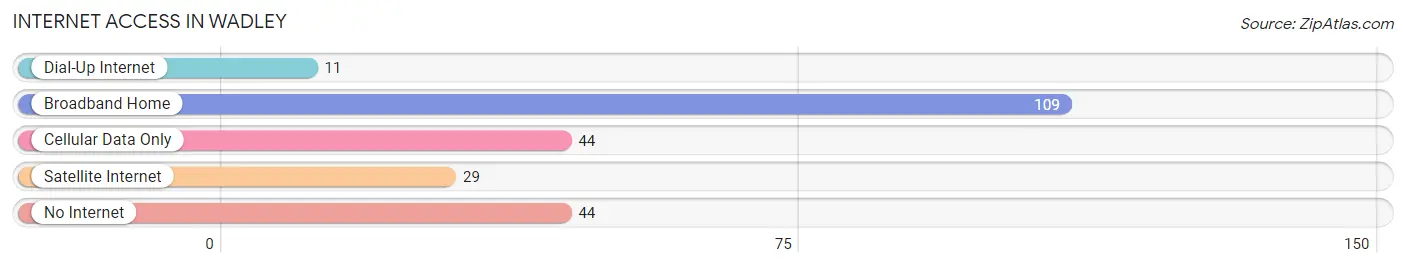
| Internet Type | # Households | % Households |
| Dial-Up Internet | 11 | 4.4% |
| Broadband Home | 109 | 44.0% |
| Cellular Data Only | 44 | 17.7% |
| Satellite Internet | 29 | 11.7% |
| No Internet | 44 | 17.7% |
| Total | 248 | 100.0% |
Wadley Summary
Wadley is a small town located in Randolph County, Alabama. It is situated in the foothills of the Appalachian Mountains and is part of the Talladega National Forest. The town was founded in 1883 and has a population of approximately 1,000 people.
Geography
Wadley is located in the foothills of the Appalachian Mountains in Randolph County, Alabama. The town is situated on the banks of the Tallapoosa River and is surrounded by the Talladega National Forest. The town is located at an elevation of 830 feet above sea level and has a total area of 1.2 square miles. The climate in Wadley is humid subtropical with hot summers and mild winters.
Economy
The economy of Wadley is largely based on agriculture and forestry. The town is home to several farms and timber companies that produce a variety of crops and timber products. The town also has a few small businesses, including a grocery store, a hardware store, and a few restaurants.
Demographics
As of the 2010 census, the population of Wadley was 1,000 people. The racial makeup of the town was 95.2% White, 2.2% African American, 0.2% Native American, 0.2% Asian, 0.2% from other races, and 1.2% from two or more races. The median household income in Wadley was $25,000 and the median family income was $30,000.
History
Wadley was founded in 1883 by a group of settlers from Georgia. The town was named after a local creek and was originally known as Wadley Creek. The town grew slowly over the years and by the early 1900s had a population of around 500 people. The town was incorporated in 1909 and by the 1920s had a population of around 1,000 people.
The town experienced a period of growth in the 1950s and 1960s as the timber industry in the area expanded. The town also benefited from the construction of the nearby Talladega National Forest. The town has remained relatively unchanged since then and continues to be a small, rural community.
Conclusion
Wadley is a small town located in Randolph County, Alabama. It is situated in the foothills of the Appalachian Mountains and is part of the Talladega National Forest. The town was founded in 1883 and has a population of approximately 1,000 people. The economy of Wadley is largely based on agriculture and forestry and the town has a few small businesses. The racial makeup of the town is 95.2% White, 2.2% African American, 0.2% Native American, 0.2% Asian, 0.2% from other races, and 1.2% from two or more races. The median household income in Wadley was $25,000 and the median family income was $30,000. Wadley has remained relatively unchanged since its founding and continues to be a small, rural community.
Common Questions
What is the Total Population of Wadley?
Total Population of Wadley is 950.
What is the Total Male Population of Wadley?
Total Male Population of Wadley is 419.
What is the Total Female Population of Wadley?
Total Female Population of Wadley is 531.
What is the Ratio of Males per 100 Females in Wadley?
There are 78.91 Males per 100 Females in Wadley.
What is the Ratio of Females per 100 Males in Wadley?
There are 126.73 Females per 100 Males in Wadley.
What is the Median Population Age in Wadley?
Median Population Age in Wadley is 20.7 Years.
What is the Average Family Size in Wadley
Average Family Size in Wadley is 3.4 People.
What is the Average Household Size in Wadley
Average Household Size in Wadley is 2.5 People.
What is Per Capita Income in Wadley?
Per Capita income in Wadley is $14,061.
What is the Median Family Income in Wadley?
Median Family Income in Wadley is $53,750.
What is the Median Household income in Wadley?
Median Household Income in Wadley is $25,000.
What is Inequality or Gini Index in Wadley?
Inequality or Gini Index in Wadley is 0.56.
How Large is the Labor Force in Wadley?
There are 291 People in the Labor Forcein in Wadley.
What is the Percentage of People in the Labor Force in Wadley?
36.8% of People are in the Labor Force in Wadley.
What is the Unemployment Rate in Wadley?
Unemployment Rate in Wadley is 9.3%.