Hartford, AL Map & Demographics
Hartford Map
Hartford Overview
$22,852
PER CAPITA INCOME
$60,080
AVG FAMILY INCOME
$44,977
AVG HOUSEHOLD INCOME
8.9%
WAGE / INCOME GAP [ % ]
91.1¢/ $1
WAGE / INCOME GAP [ $ ]
0.40
INEQUALITY / GINI INDEX
2,660
TOTAL POPULATION
1,272
MALE POPULATION
1,388
FEMALE POPULATION
91.64
MALES / 100 FEMALES
109.12
FEMALES / 100 MALES
39.1
MEDIAN AGE
3.1
AVG FAMILY SIZE
2.6
AVG HOUSEHOLD SIZE
1,043
LABOR FORCE [ PEOPLE ]
51.3%
PERCENT IN LABOR FORCE
0.6%
UNEMPLOYMENT RATE
Hartford Zip Codes
Hartford Area Codes
Income in Hartford
Income Overview in Hartford
Per Capita Income in Hartford is $22,852, while median incomes of families and households are $60,080 and $44,977 respectively.
| Characteristic | Number | Measure |
| Per Capita Income | 2,660 | $22,852 |
| Median Family Income | 681 | $60,080 |
| Mean Family Income | 681 | $67,642 |
| Median Household Income | 975 | $44,977 |
| Mean Household Income | 975 | $57,969 |
| Income Deficit | 681 | $0 |
| Wage / Income Gap (%) | 2,660 | 8.91% |
| Wage / Income Gap ($) | 2,660 | 91.09¢ per $1 |
| Gini / Inequality Index | 2,660 | 0.40 |
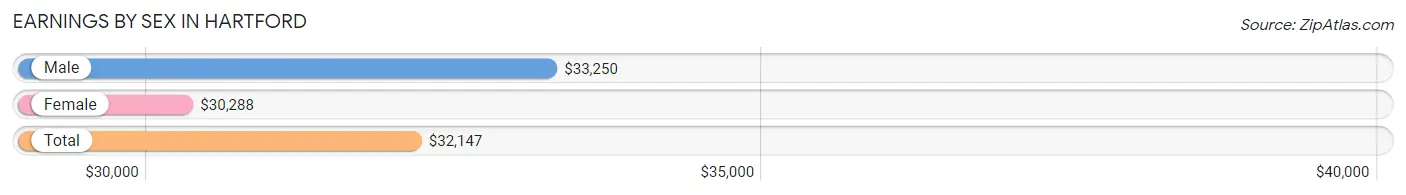
Earnings by Sex in Hartford
Average Earnings in Hartford are $32,147, $33,250 for men and $30,288 for women, a difference of 8.9%.
| Sex | Number | Average Earnings |
| Male | 520 (48.0%) | $33,250 |
| Female | 563 (52.0%) | $30,288 |
| Total | 1,083 (100.0%) | $32,147 |
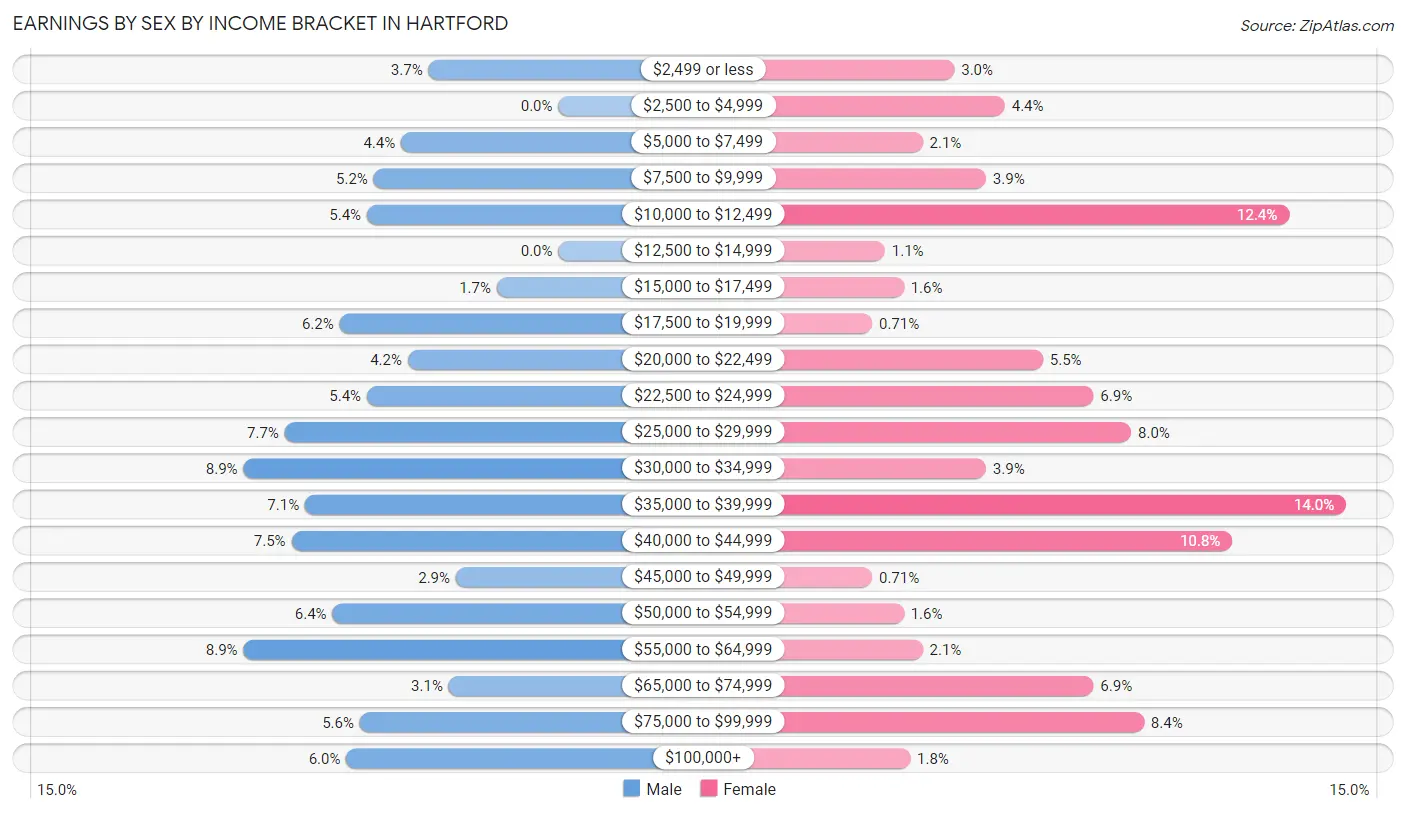
Earnings by Sex by Income Bracket in Hartford
The most common earnings brackets in Hartford are $30,000 to $34,999 for men (46 | 8.8%) and $35,000 to $39,999 for women (79 | 14.0%).
| Income | Male | Female |
| $2,499 or less | 19 (3.6%) | 17 (3.0%) |
| $2,500 to $4,999 | 0 (0.0%) | 25 (4.4%) |
| $5,000 to $7,499 | 23 (4.4%) | 12 (2.1%) |
| $7,500 to $9,999 | 27 (5.2%) | 22 (3.9%) |
| $10,000 to $12,499 | 28 (5.4%) | 70 (12.4%) |
| $12,500 to $14,999 | 0 (0.0%) | 6 (1.1%) |
| $15,000 to $17,499 | 9 (1.7%) | 9 (1.6%) |
| $17,500 to $19,999 | 32 (6.1%) | 4 (0.7%) |
| $20,000 to $22,499 | 22 (4.2%) | 31 (5.5%) |
| $22,500 to $24,999 | 28 (5.4%) | 39 (6.9%) |
| $25,000 to $29,999 | 40 (7.7%) | 45 (8.0%) |
| $30,000 to $34,999 | 46 (8.8%) | 22 (3.9%) |
| $35,000 to $39,999 | 37 (7.1%) | 79 (14.0%) |
| $40,000 to $44,999 | 39 (7.5%) | 61 (10.8%) |
| $45,000 to $49,999 | 15 (2.9%) | 4 (0.7%) |
| $50,000 to $54,999 | 33 (6.4%) | 9 (1.6%) |
| $55,000 to $64,999 | 46 (8.8%) | 12 (2.1%) |
| $65,000 to $74,999 | 16 (3.1%) | 39 (6.9%) |
| $75,000 to $99,999 | 29 (5.6%) | 47 (8.4%) |
| $100,000+ | 31 (6.0%) | 10 (1.8%) |
| Total | 520 (100.0%) | 563 (100.0%) |
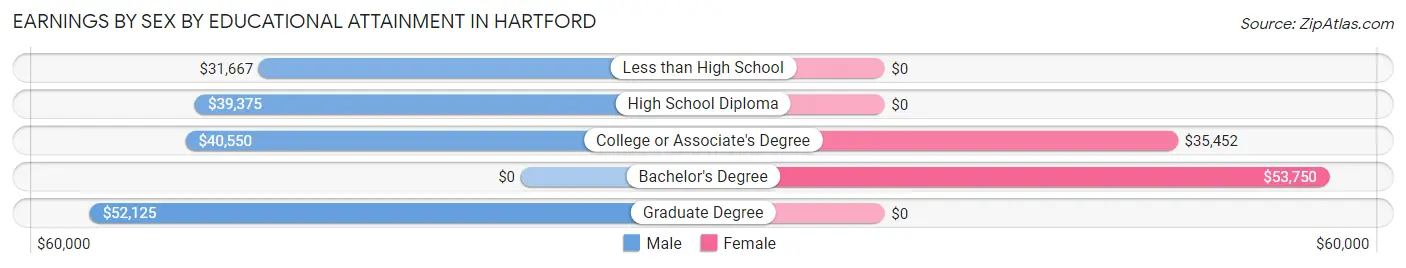
Earnings by Sex by Educational Attainment in Hartford
Average earnings in Hartford are $35,385 for men and $34,306 for women, a difference of 3.0%. Men with an educational attainment of graduate degree enjoy the highest average annual earnings of $52,125, while those with less than high school education earn the least with $31,667. Women with an educational attainment of bachelor's degree earn the most with the average annual earnings of $53,750, while those with college or associate's degree education have the smallest earnings of $35,452.
| Educational Attainment | Male Income | Female Income |
| Less than High School | $31,667 | $0 |
| High School Diploma | $39,375 | $0 |
| College or Associate's Degree | $40,550 | $35,452 |
| Bachelor's Degree | - | - |
| Graduate Degree | $52,125 | $0 |
| Total | $35,385 | $34,306 |
Family Income in Hartford
Family Income Brackets in Hartford
According to the Hartford family income data, there are 192 families falling into the $50,000 to $74,999 income range, which is the most common income bracket and makes up 28.2% of all families.
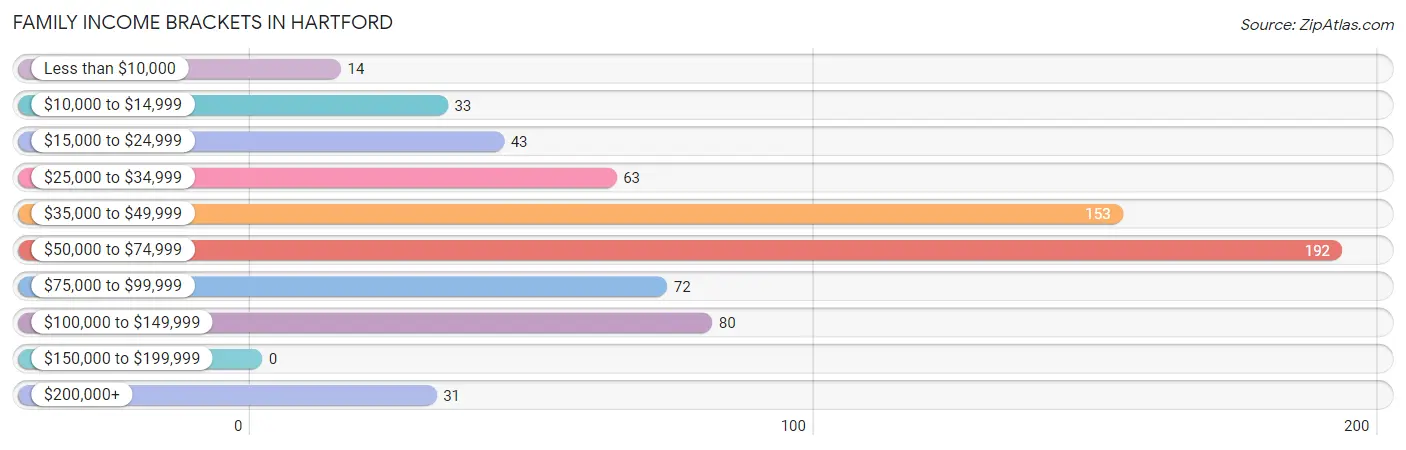
| Income Bracket | # Families | % Families |
| Less than $10,000 | 14 | 2.1% |
| $10,000 to $14,999 | 33 | 4.8% |
| $15,000 to $24,999 | 43 | 6.3% |
| $25,000 to $34,999 | 63 | 9.3% |
| $35,000 to $49,999 | 153 | 22.5% |
| $50,000 to $74,999 | 192 | 28.2% |
| $75,000 to $99,999 | 72 | 10.6% |
| $100,000 to $149,999 | 80 | 11.7% |
| $150,000 to $199,999 | 0 | 0.0% |
| $200,000+ | 31 | 4.6% |
Family Income by Famaliy Size in Hartford
5-person families (60 | 8.8%) account for the highest median family income in Hartford with $71,500 per family, while 2-person families (368 | 54.0%) have the highest median income of $30,478 per family member.
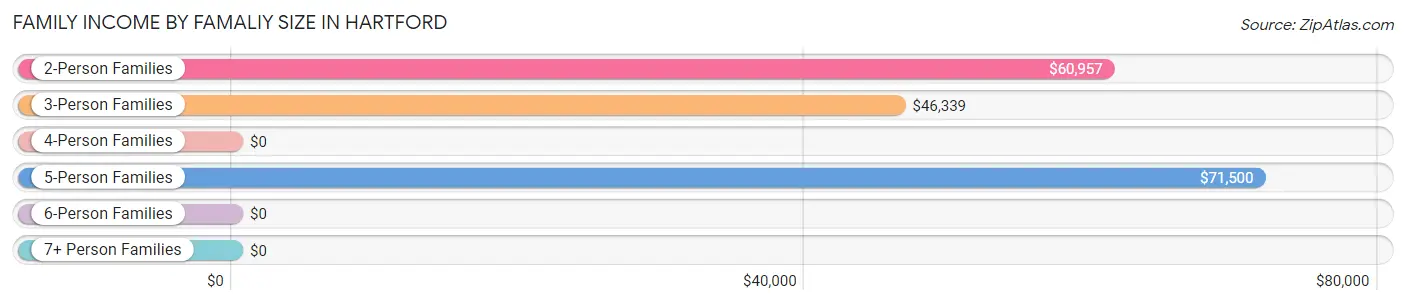
| Income Bracket | # Families | Median Income |
| 2-Person Families | 368 (54.0%) | $60,957 |
| 3-Person Families | 119 (17.5%) | $46,339 |
| 4-Person Families | 131 (19.2%) | $0 |
| 5-Person Families | 60 (8.8%) | $71,500 |
| 6-Person Families | 3 (0.4%) | $0 |
| 7+ Person Families | 0 (0.0%) | $0 |
| Total | 681 (100.0%) | $60,080 |
Family Income by Number of Earners in Hartford
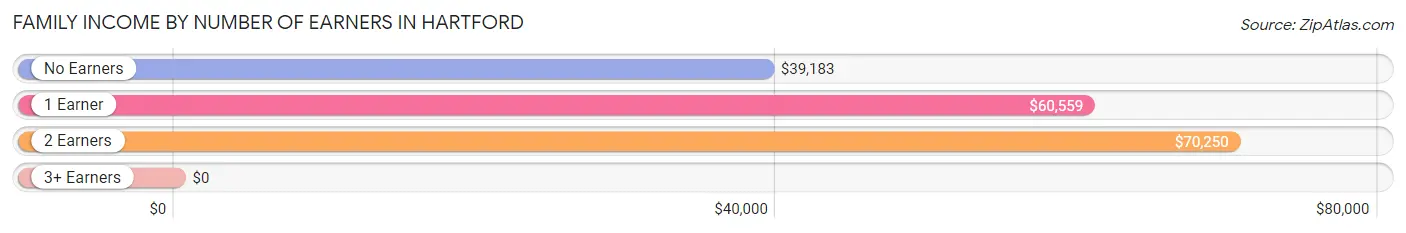
| Number of Earners | # Families | Median Income |
| No Earners | 143 (21.0%) | $39,183 |
| 1 Earner | 285 (41.8%) | $60,559 |
| 2 Earners | 197 (28.9%) | $70,250 |
| 3+ Earners | 56 (8.2%) | $0 |
| Total | 681 (100.0%) | $60,080 |
Household Income in Hartford
Household Income Brackets in Hartford
With 260 households falling in the category, the $50,000 to $74,999 income range is the most frequent in Hartford, accounting for 26.7% of all households. In contrast, only 6 households (0.6%) fall into the $150,000 to $199,999 income bracket, making it the least populous group.
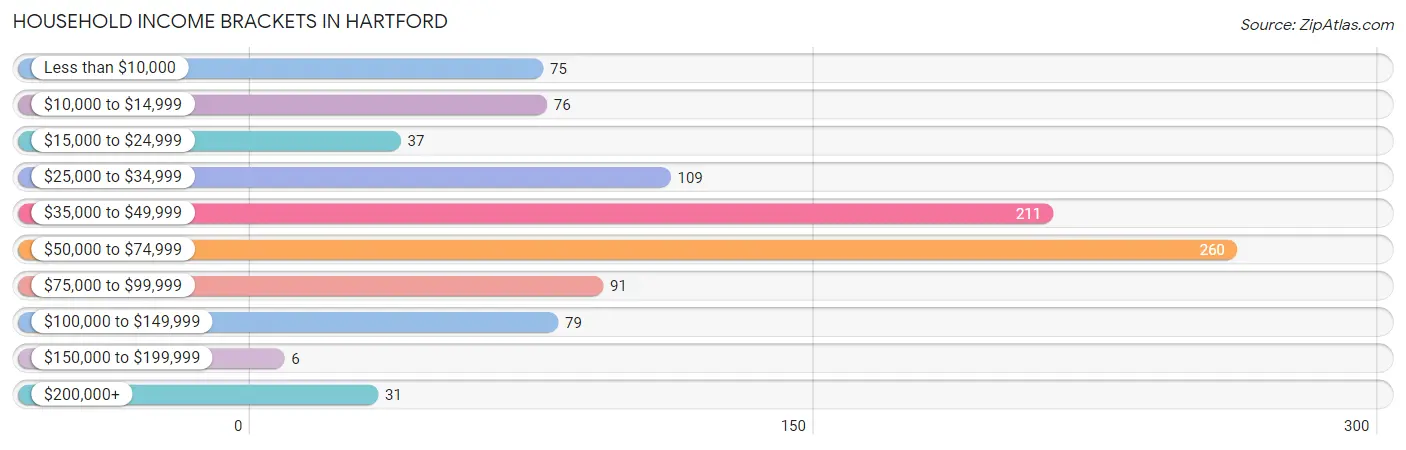
| Income Bracket | # Households | % Households |
| Less than $10,000 | 75 | 7.7% |
| $10,000 to $14,999 | 76 | 7.8% |
| $15,000 to $24,999 | 37 | 3.8% |
| $25,000 to $34,999 | 109 | 11.2% |
| $35,000 to $49,999 | 211 | 21.6% |
| $50,000 to $74,999 | 260 | 26.7% |
| $75,000 to $99,999 | 91 | 9.3% |
| $100,000 to $149,999 | 79 | 8.1% |
| $150,000 to $199,999 | 6 | 0.6% |
| $200,000+ | 31 | 3.2% |
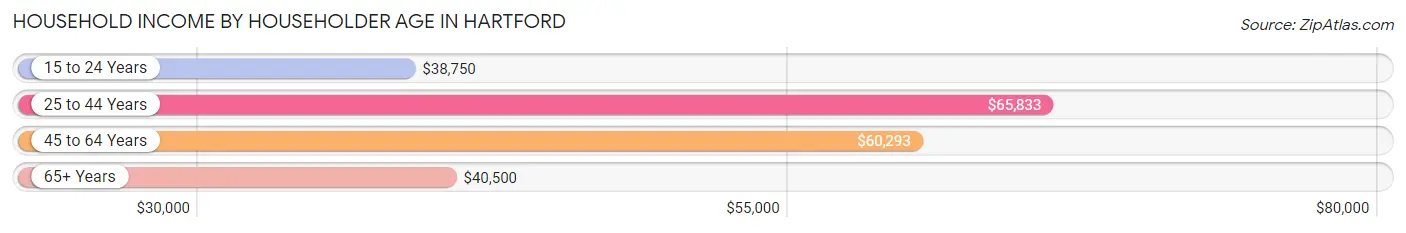
Household Income by Householder Age in Hartford
The median household income in Hartford is $44,977, with the highest median household income of $65,833 found in the 25 to 44 years age bracket for the primary householder. A total of 326 households (33.4%) fall into this category. Meanwhile, the 15 to 24 years age bracket for the primary householder has the lowest median household income of $38,750, with 28 households (2.9%) in this group.
| Income Bracket | # Households | Median Income |
| 15 to 24 Years | 28 (2.9%) | $38,750 |
| 25 to 44 Years | 326 (33.4%) | $65,833 |
| 45 to 64 Years | 309 (31.7%) | $60,293 |
| 65+ Years | 312 (32.0%) | $40,500 |
| Total | 975 (100.0%) | $44,977 |
Poverty in Hartford
Income Below Poverty by Sex and Age in Hartford
With 16.8% poverty level for males and 24.9% for females among the residents of Hartford, 5 year old males and 5 year old females are the most vulnerable to poverty, with 14 males (100.0%) and 110 females (88.0%) in their respective age groups living below the poverty level.
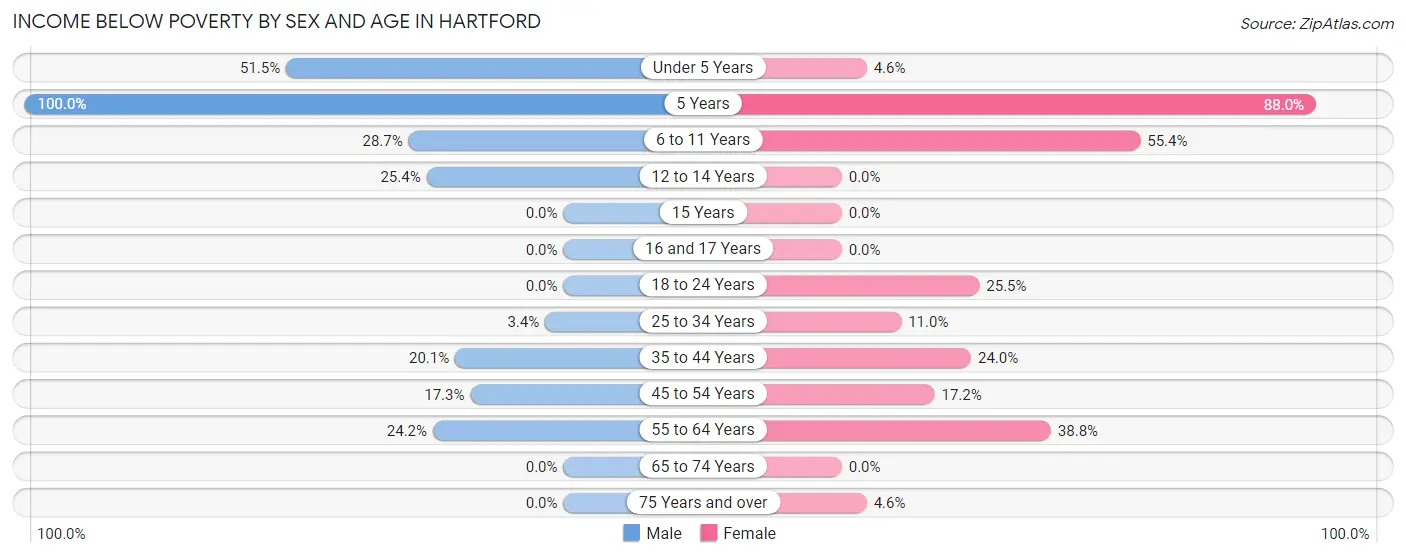
| Age Bracket | Male | Female |
| Under 5 Years | 35 (51.5%) | 3 (4.6%) |
| 5 Years | 14 (100.0%) | 110 (88.0%) |
| 6 to 11 Years | 25 (28.7%) | 41 (55.4%) |
| 12 to 14 Years | 32 (25.4%) | 0 (0.0%) |
| 15 Years | 0 (0.0%) | 0 (0.0%) |
| 16 and 17 Years | 0 (0.0%) | 0 (0.0%) |
| 18 to 24 Years | 0 (0.0%) | 12 (25.5%) |
| 25 to 34 Years | 6 (3.4%) | 15 (11.0%) |
| 35 to 44 Years | 40 (20.1%) | 65 (24.0%) |
| 45 to 54 Years | 24 (17.3%) | 26 (17.2%) |
| 55 to 64 Years | 31 (24.2%) | 52 (38.8%) |
| 65 to 74 Years | 0 (0.0%) | 0 (0.0%) |
| 75 Years and over | 0 (0.0%) | 6 (4.6%) |
| Total | 207 (16.8%) | 330 (24.9%) |
Income Above Poverty by Sex and Age in Hartford
According to the poverty statistics in Hartford, males aged 15 years and females aged 12 to 14 years are the age groups that are most secure financially, with 100.0% of males and 100.0% of females in these age groups living above the poverty line.
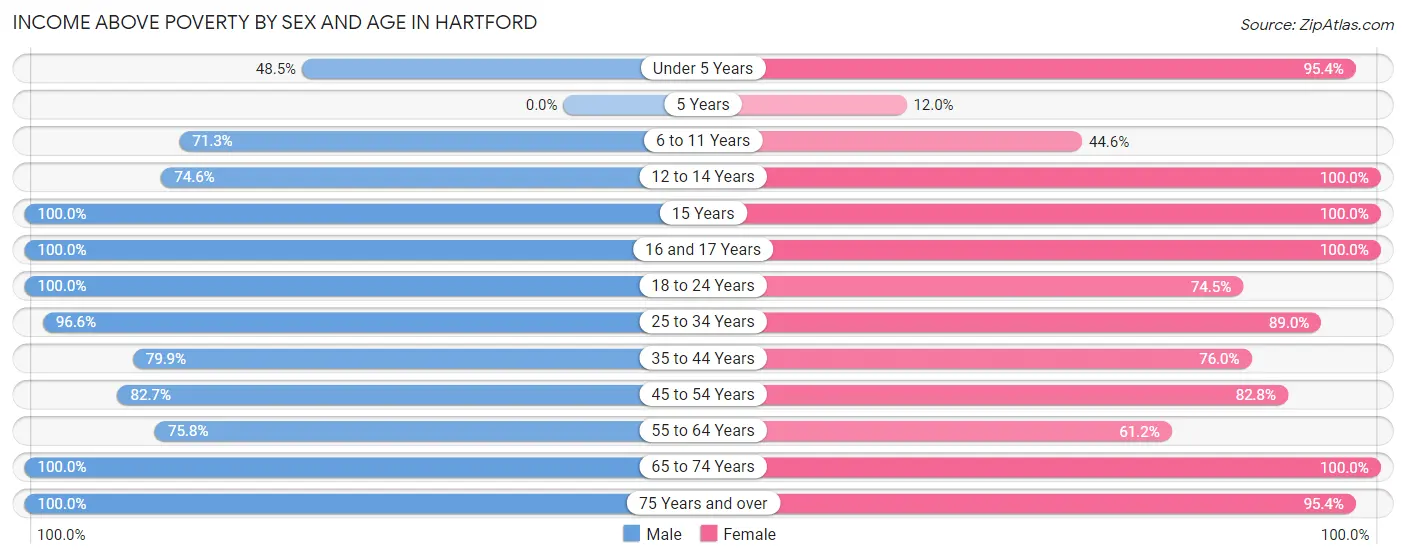
| Age Bracket | Male | Female |
| Under 5 Years | 33 (48.5%) | 62 (95.4%) |
| 5 Years | 0 (0.0%) | 15 (12.0%) |
| 6 to 11 Years | 62 (71.3%) | 33 (44.6%) |
| 12 to 14 Years | 94 (74.6%) | 25 (100.0%) |
| 15 Years | 7 (100.0%) | 36 (100.0%) |
| 16 and 17 Years | 15 (100.0%) | 4 (100.0%) |
| 18 to 24 Years | 110 (100.0%) | 35 (74.5%) |
| 25 to 34 Years | 171 (96.6%) | 121 (89.0%) |
| 35 to 44 Years | 159 (79.9%) | 206 (76.0%) |
| 45 to 54 Years | 115 (82.7%) | 125 (82.8%) |
| 55 to 64 Years | 97 (75.8%) | 82 (61.2%) |
| 65 to 74 Years | 41 (100.0%) | 125 (100.0%) |
| 75 Years and over | 124 (100.0%) | 124 (95.4%) |
| Total | 1,028 (83.2%) | 993 (75.1%) |
Income Below Poverty Among Married-Couple Families in Hartford
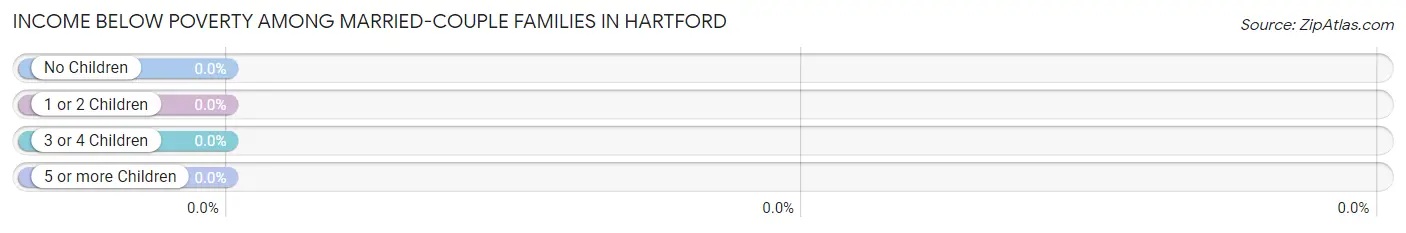
| Children | Above Poverty | Below Poverty |
| No Children | 294 (100.0%) | 0 (0.0%) |
| 1 or 2 Children | 74 (100.0%) | 0 (0.0%) |
| 3 or 4 Children | 41 (100.0%) | 0 (0.0%) |
| 5 or more Children | 0 (0.0%) | 0 (0.0%) |
| Total | 409 (100.0%) | 0 (0.0%) |
Income Below Poverty Among Single-Parent Households in Hartford
According to the poverty data in Hartford, 14.6% or 6 single-father households and 36.4% or 84 single-mother households are living below the poverty line. Among single-father households, those with 3 or 4 children have the highest poverty rate, with 6 households (100.0%) experiencing poverty. Likewise, among single-mother households, those with 3 or 4 children have the highest poverty rate, with 55 households (100.0%) falling below the poverty line.
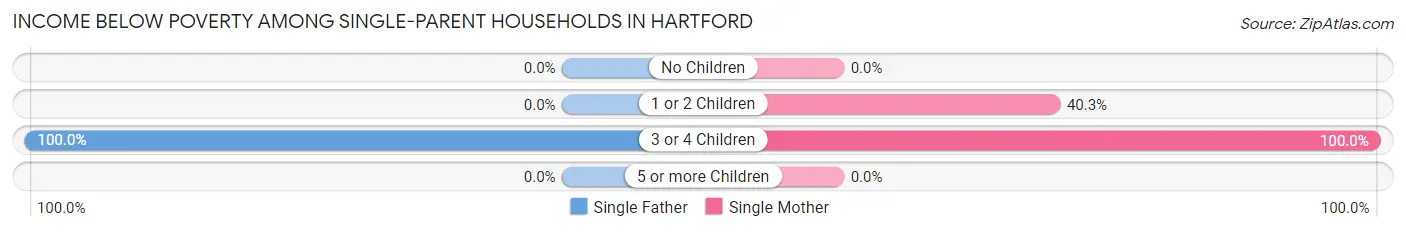
| Children | Single Father | Single Mother |
| No Children | 0 (0.0%) | 0 (0.0%) |
| 1 or 2 Children | 0 (0.0%) | 29 (40.3%) |
| 3 or 4 Children | 6 (100.0%) | 55 (100.0%) |
| 5 or more Children | 0 (0.0%) | 0 (0.0%) |
| Total | 6 (14.6%) | 84 (36.4%) |
Income Below Poverty Among Married-Couple vs Single-Parent Households in Hartford
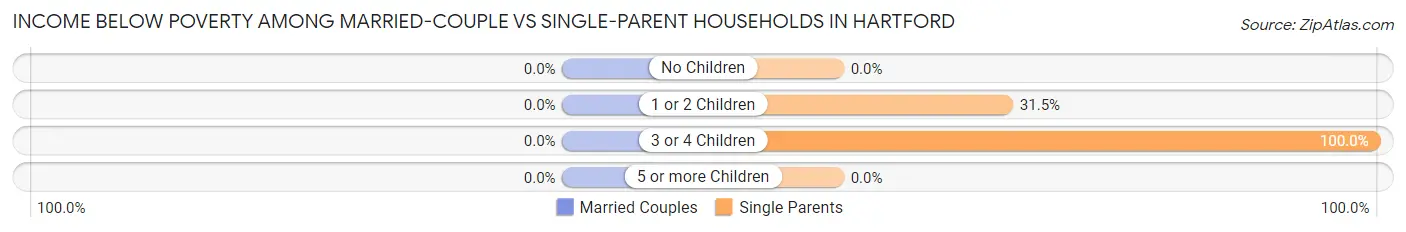
| Children | Married-Couple Families | Single-Parent Households |
| No Children | 0 (0.0%) | 0 (0.0%) |
| 1 or 2 Children | 0 (0.0%) | 29 (31.5%) |
| 3 or 4 Children | 0 (0.0%) | 61 (100.0%) |
| 5 or more Children | 0 (0.0%) | 0 (0.0%) |
| Total | 0 (0.0%) | 90 (33.1%) |
Race in Hartford
The most populous races in Hartford are White / Caucasian (1,807 | 67.9%), Black / African American (726 | 27.3%), and Hispanic or Latino (174 | 6.5%).
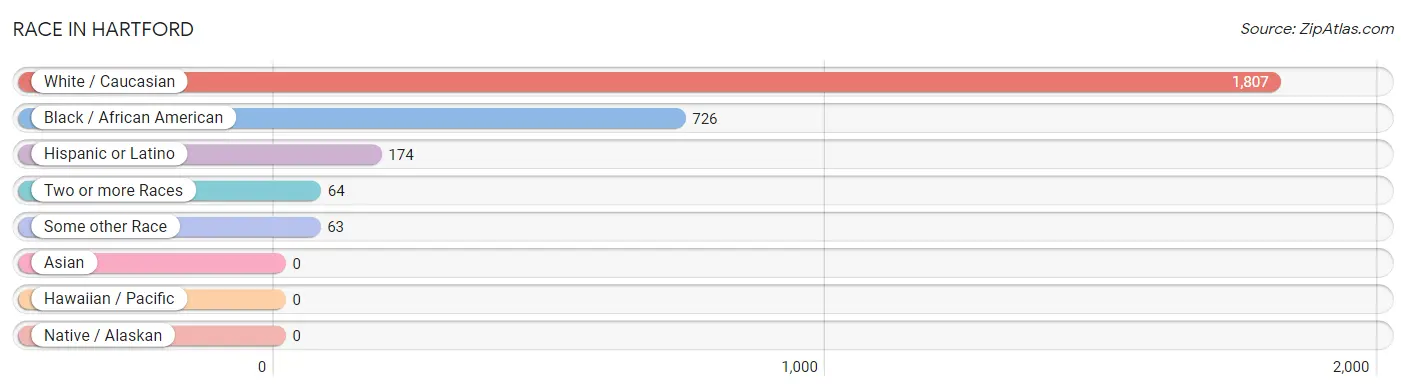
| Race | # Population | % Population |
| Asian | 0 | 0.0% |
| Black / African American | 726 | 27.3% |
| Hawaiian / Pacific | 0 | 0.0% |
| Hispanic or Latino | 174 | 6.5% |
| Native / Alaskan | 0 | 0.0% |
| White / Caucasian | 1,807 | 67.9% |
| Two or more Races | 64 | 2.4% |
| Some other Race | 63 | 2.4% |
| Total | 2,660 | 100.0% |
Ancestry in Hartford
The most populous ancestries reported in Hartford are Irish (290 | 10.9%), German (244 | 9.2%), American (214 | 8.1%), English (213 | 8.0%), and Italian (121 | 4.5%), together accounting for 40.7% of all Hartford residents.
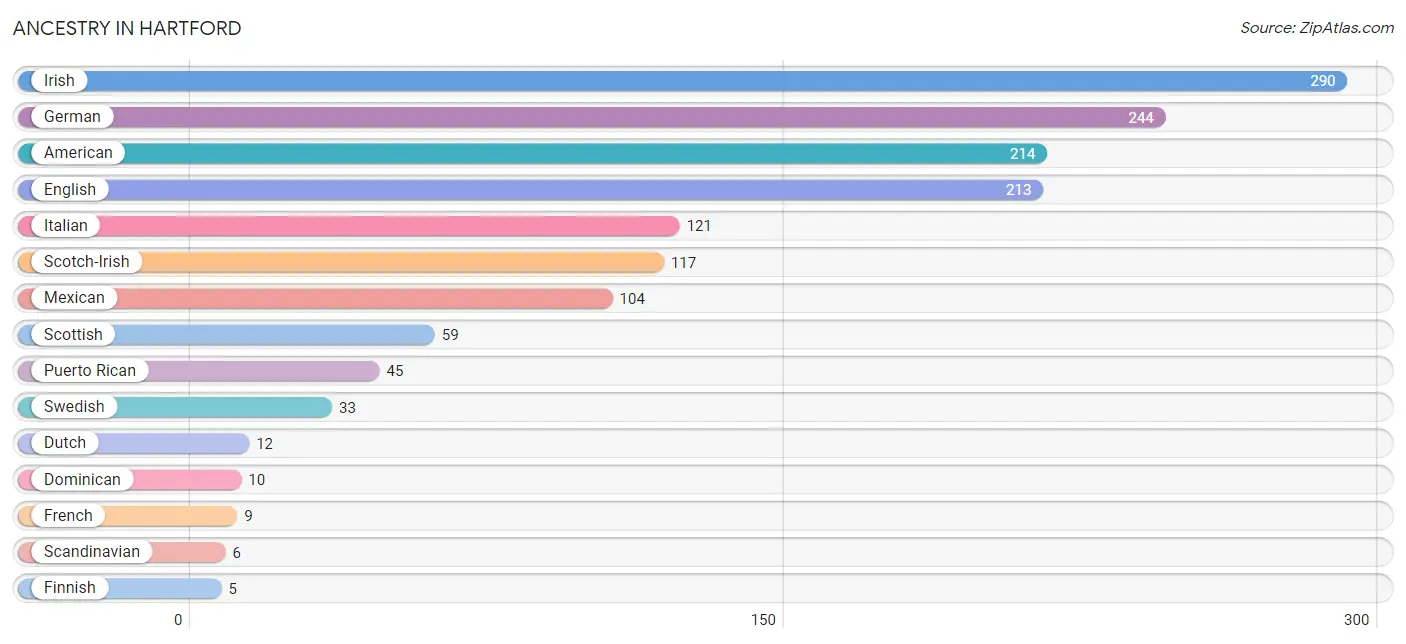
| Ancestry | # Population | % Population |
| American | 214 | 8.1% |
| Dominican | 10 | 0.4% |
| Dutch | 12 | 0.4% |
| English | 213 | 8.0% |
| Finnish | 5 | 0.2% |
| French | 9 | 0.3% |
| German | 244 | 9.2% |
| Greek | 5 | 0.2% |
| Irish | 290 | 10.9% |
| Italian | 121 | 4.5% |
| Mexican | 104 | 3.9% |
| Puerto Rican | 45 | 1.7% |
| Scandinavian | 6 | 0.2% |
| Scotch-Irish | 117 | 4.4% |
| Scottish | 59 | 2.2% |
| Serbian | 5 | 0.2% |
| Swedish | 33 | 1.2% | View All 17 Rows |
Immigrants in Hartford
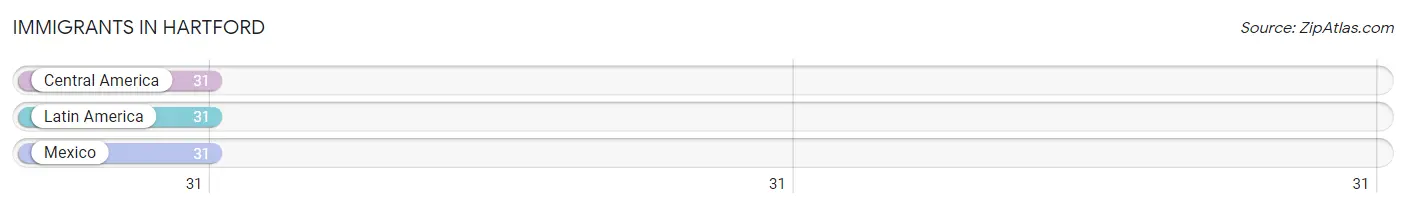
The most numerous immigrant groups reported in Hartford came from Central America (31 | 1.2%), Latin America (31 | 1.2%), and Mexico (31 | 1.2%), together accounting for 3.5% of all Hartford residents.
| Immigration Origin | # Population | % Population |
| Central America | 31 | 1.2% |
| Latin America | 31 | 1.2% |
| Mexico | 31 | 1.2% | View All 3 Rows |
Sex and Age in Hartford
Sex and Age in Hartford
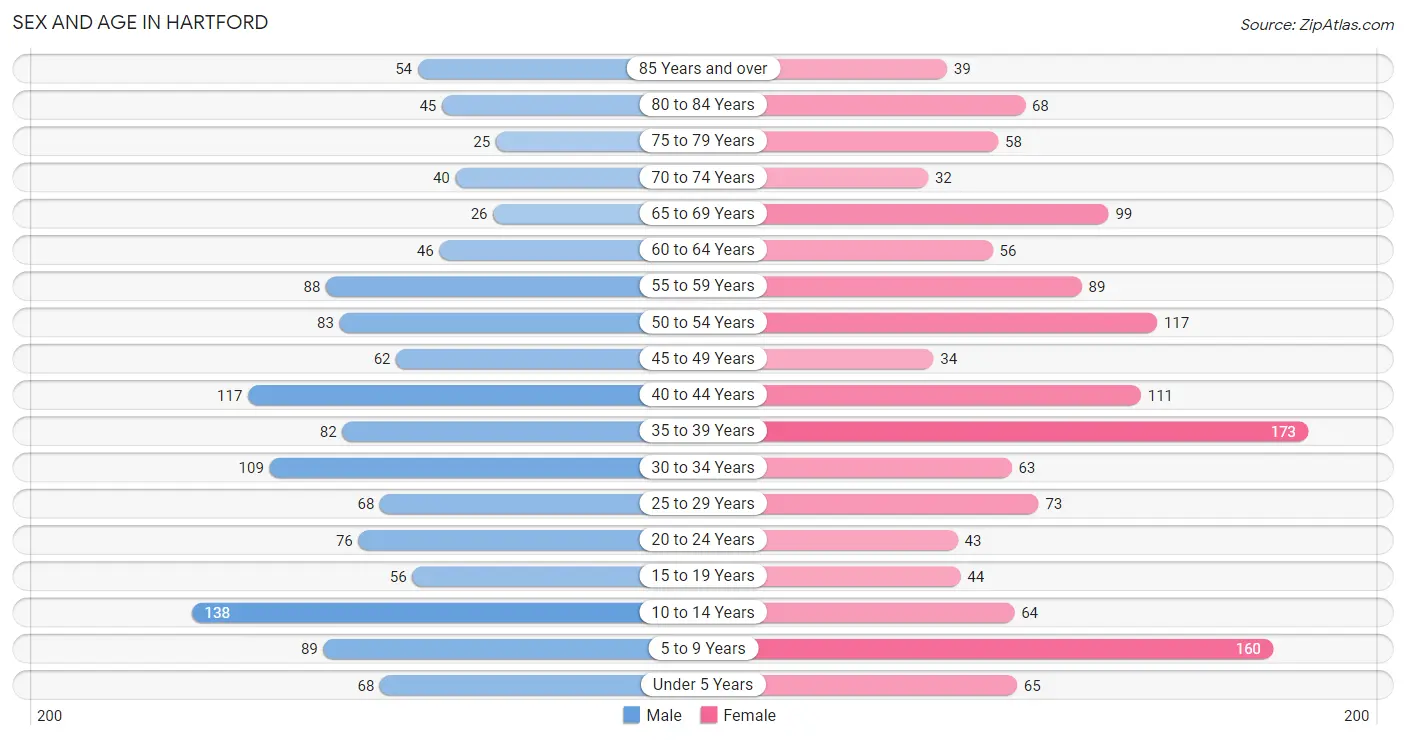
The most populous age groups in Hartford are 10 to 14 Years (138 | 10.8%) for men and 35 to 39 Years (173 | 12.5%) for women.
| Age Bracket | Male | Female |
| Under 5 Years | 68 (5.3%) | 65 (4.7%) |
| 5 to 9 Years | 89 (7.0%) | 160 (11.5%) |
| 10 to 14 Years | 138 (10.8%) | 64 (4.6%) |
| 15 to 19 Years | 56 (4.4%) | 44 (3.2%) |
| 20 to 24 Years | 76 (6.0%) | 43 (3.1%) |
| 25 to 29 Years | 68 (5.3%) | 73 (5.3%) |
| 30 to 34 Years | 109 (8.6%) | 63 (4.5%) |
| 35 to 39 Years | 82 (6.5%) | 173 (12.5%) |
| 40 to 44 Years | 117 (9.2%) | 111 (8.0%) |
| 45 to 49 Years | 62 (4.9%) | 34 (2.5%) |
| 50 to 54 Years | 83 (6.5%) | 117 (8.4%) |
| 55 to 59 Years | 88 (6.9%) | 89 (6.4%) |
| 60 to 64 Years | 46 (3.6%) | 56 (4.0%) |
| 65 to 69 Years | 26 (2.0%) | 99 (7.1%) |
| 70 to 74 Years | 40 (3.1%) | 32 (2.3%) |
| 75 to 79 Years | 25 (2.0%) | 58 (4.2%) |
| 80 to 84 Years | 45 (3.5%) | 68 (4.9%) |
| 85 Years and over | 54 (4.3%) | 39 (2.8%) |
| Total | 1,272 (100.0%) | 1,388 (100.0%) |
Families and Households in Hartford
Median Family Size in Hartford
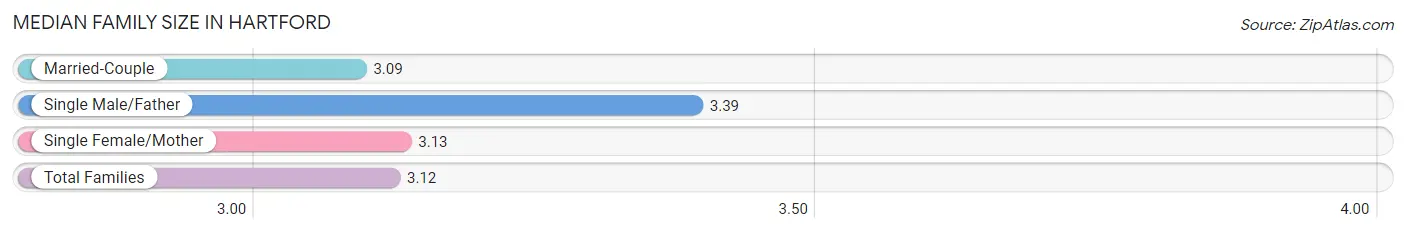
The median family size in Hartford is 3.12 persons per family, with single male/father families (41 | 6.0%) accounting for the largest median family size of 3.39 persons per family. On the other hand, married-couple families (409 | 60.1%) represent the smallest median family size with 3.09 persons per family.
| Family Type | # Families | Family Size |
| Married-Couple | 409 (60.1%) | 3.09 |
| Single Male/Father | 41 (6.0%) | 3.39 |
| Single Female/Mother | 231 (33.9%) | 3.13 |
| Total Families | 681 (100.0%) | 3.12 |
Median Household Size in Hartford
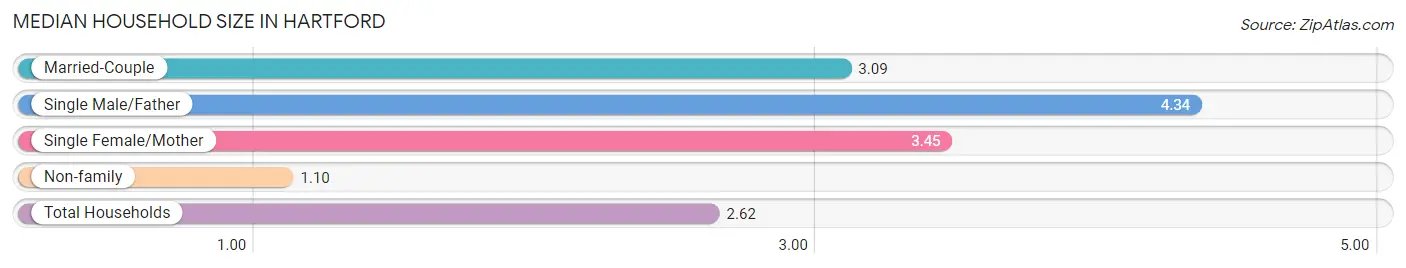
The median household size in Hartford is 2.62 persons per household, with single male/father households (41 | 4.2%) accounting for the largest median household size of 4.34 persons per household. non-family households (294 | 30.1%) represent the smallest median household size with 1.10 persons per household.
| Household Type | # Households | Household Size |
| Married-Couple | 409 (41.9%) | 3.09 |
| Single Male/Father | 41 (4.2%) | 4.34 |
| Single Female/Mother | 231 (23.7%) | 3.45 |
| Non-family | 294 (30.1%) | 1.10 |
| Total Households | 975 (100.0%) | 2.62 |
Household Size by Marriage Status in Hartford
Out of a total of 975 households in Hartford, 681 (69.9%) are family households, while 294 (30.1%) are nonfamily households. The most numerous type of family households are 2-person households, comprising 351, and the most common type of nonfamily households are 1-person households, comprising 271.
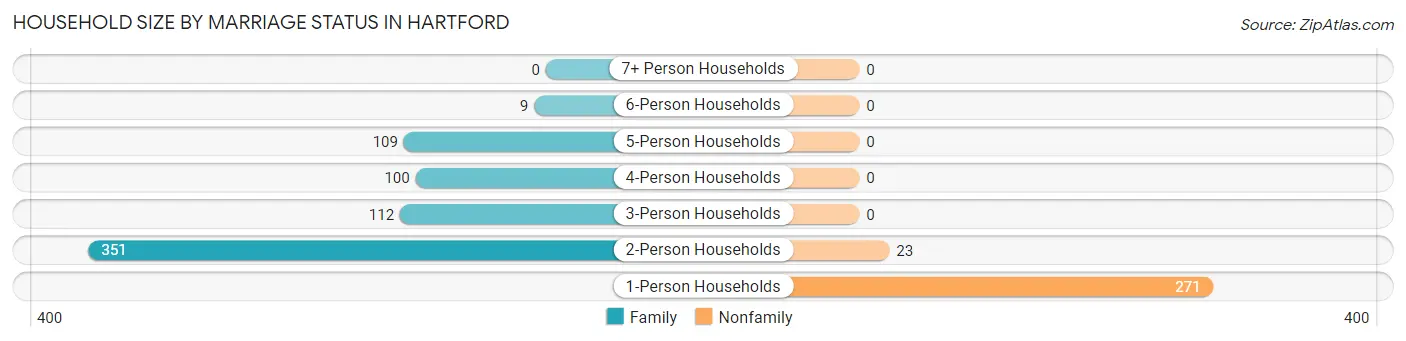
| Household Size | Family Households | Nonfamily Households |
| 1-Person Households | - | 271 (27.8%) |
| 2-Person Households | 351 (36.0%) | 23 (2.4%) |
| 3-Person Households | 112 (11.5%) | 0 (0.0%) |
| 4-Person Households | 100 (10.3%) | 0 (0.0%) |
| 5-Person Households | 109 (11.2%) | 0 (0.0%) |
| 6-Person Households | 9 (0.9%) | 0 (0.0%) |
| 7+ Person Households | 0 (0.0%) | 0 (0.0%) |
| Total | 681 (69.9%) | 294 (30.1%) |
Female Fertility in Hartford
Fertility by Age in Hartford
Average fertility rate in Hartford is 64.0 births per 1,000 women. Women in the age bracket of 20 to 34 years have the highest fertility rate with 196.0 births per 1,000 women. Women in the age bracket of 20 to 34 years acount for 100.0% of all women with births.
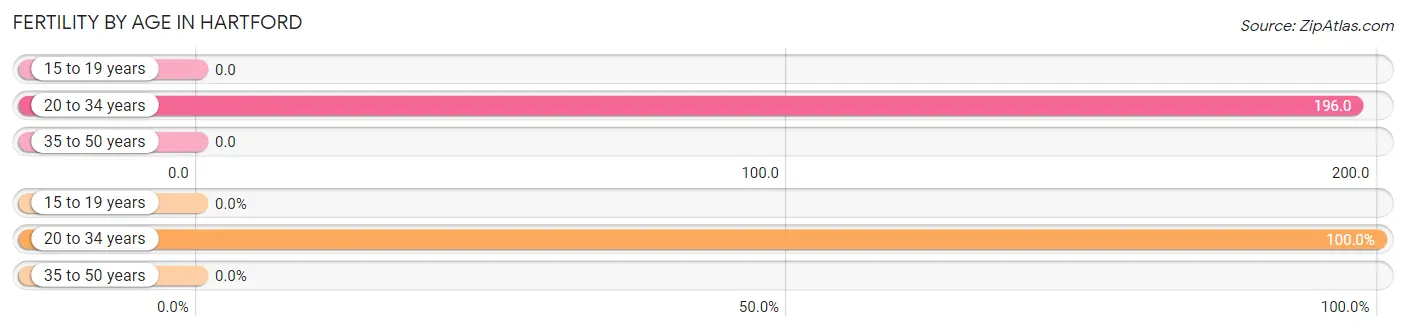
| Age Bracket | Women with Births | Births / 1,000 Women |
| 15 to 19 years | 0 (0.0%) | 0.0 |
| 20 to 34 years | 35 (100.0%) | 196.0 |
| 35 to 50 years | 0 (0.0%) | 0.0 |
| Total | 35 (100.0%) | 64.0 |
Fertility by Age by Marriage Status in Hartford
77.1% of women with births (35) in Hartford are married. The highest percentage of unmarried women with births falls into 20 to 34 years age bracket with 22.9% of them unmarried at the time of birth, while the lowest percentage of unmarried women with births belong to 20 to 34 years age bracket with 22.9% of them unmarried.
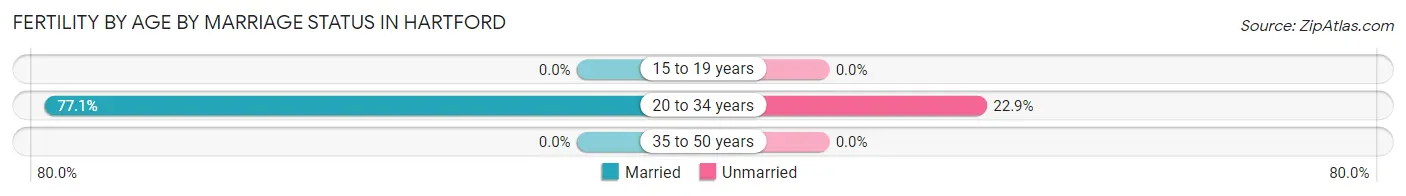
| Age Bracket | Married | Unmarried |
| 15 to 19 years | 0 (0.0%) | 0 (0.0%) |
| 20 to 34 years | 27 (77.1%) | 8 (22.9%) |
| 35 to 50 years | 0 (0.0%) | 0 (0.0%) |
| Total | 27 (77.1%) | 8 (22.9%) |
Fertility by Education in Hartford
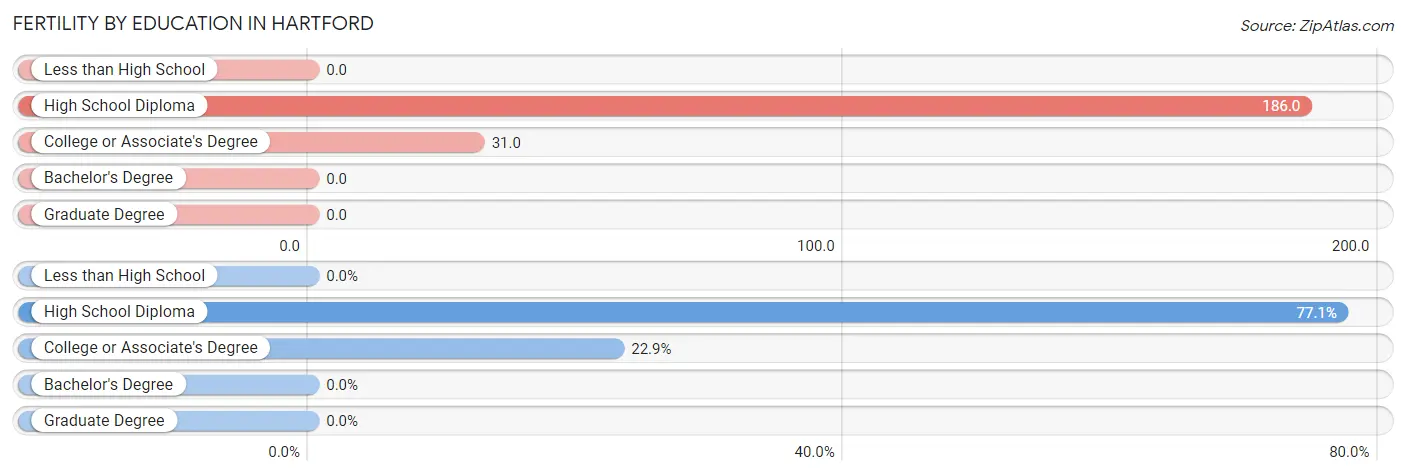
| Educational Attainment | Women with Births | Births / 1,000 Women |
| Less than High School | 0 (0.0%) | 0.0 |
| High School Diploma | 27 (77.1%) | 186.0 |
| College or Associate's Degree | 8 (22.9%) | 31.0 |
| Bachelor's Degree | 0 (0.0%) | 0.0 |
| Graduate Degree | 0 (0.0%) | 0.0 |
| Total | 35 (100.0%) | 64.0 |
Fertility by Education by Marriage Status in Hartford
22.9% of women with births in Hartford are unmarried. Women with the educational attainment of high school diploma are most likely to be married with 100.0% of them married at childbirth, while women with the educational attainment of college or associate's degree are least likely to be married with 100.0% of them unmarried at childbirth.
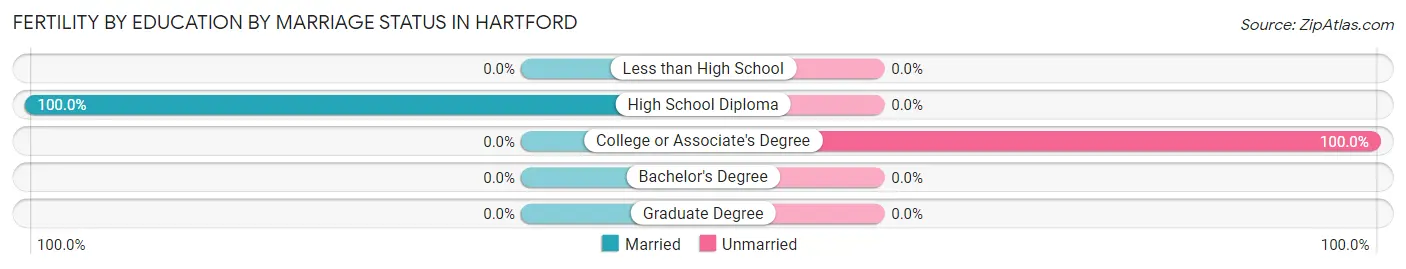
| Educational Attainment | Married | Unmarried |
| Less than High School | 0 (0.0%) | 0 (0.0%) |
| High School Diploma | 27 (100.0%) | 0 (0.0%) |
| College or Associate's Degree | 0 (0.0%) | 8 (100.0%) |
| Bachelor's Degree | 0 (0.0%) | 0 (0.0%) |
| Graduate Degree | 0 (0.0%) | 0 (0.0%) |
| Total | 27 (77.1%) | 8 (22.9%) |
Employment Characteristics in Hartford
Employment by Class of Employer in Hartford
Among the 1,023 employed individuals in Hartford, private company employees (715 | 69.9%), local government employees (83 | 8.1%), and self-employed (not incorporated) (70 | 6.8%) make up the most common classes of employment.
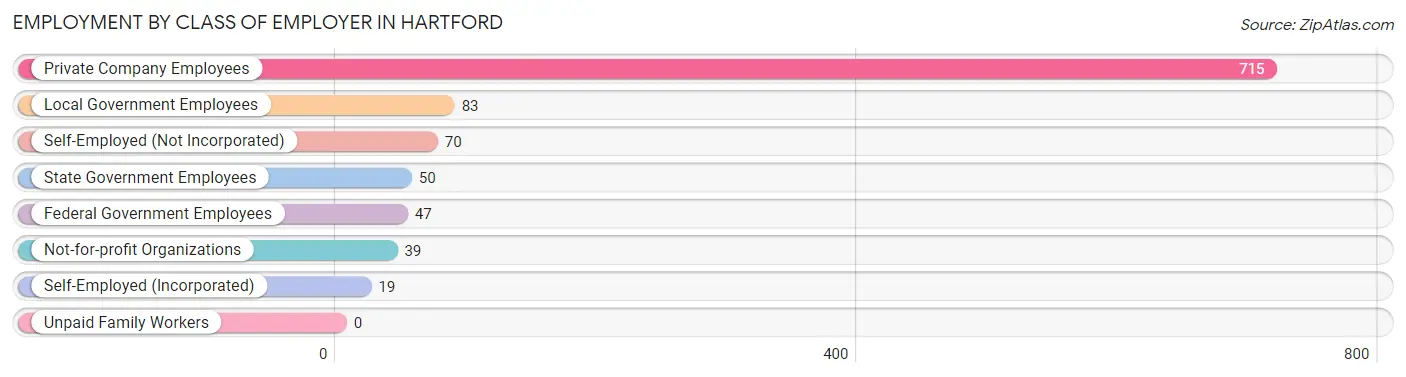
| Employer Class | # Employees | % Employees |
| Private Company Employees | 715 | 69.9% |
| Self-Employed (Incorporated) | 19 | 1.9% |
| Self-Employed (Not Incorporated) | 70 | 6.8% |
| Not-for-profit Organizations | 39 | 3.8% |
| Local Government Employees | 83 | 8.1% |
| State Government Employees | 50 | 4.9% |
| Federal Government Employees | 47 | 4.6% |
| Unpaid Family Workers | 0 | 0.0% |
| Total | 1,023 | 100.0% |
Employment Status by Age in Hartford
According to the labor force statistics for Hartford, out of the total population over 16 years of age (2,033), 51.3% or 1,043 individuals are in the labor force, with 0.6% or 6 of them unemployed. The age group with the highest labor force participation rate is 35 to 44 years, with 80.1% or 387 individuals in the labor force. Within the labor force, the 30 to 34 years age range has the highest percentage of unemployed individuals, with 5.4% or 6 of them being unemployed.
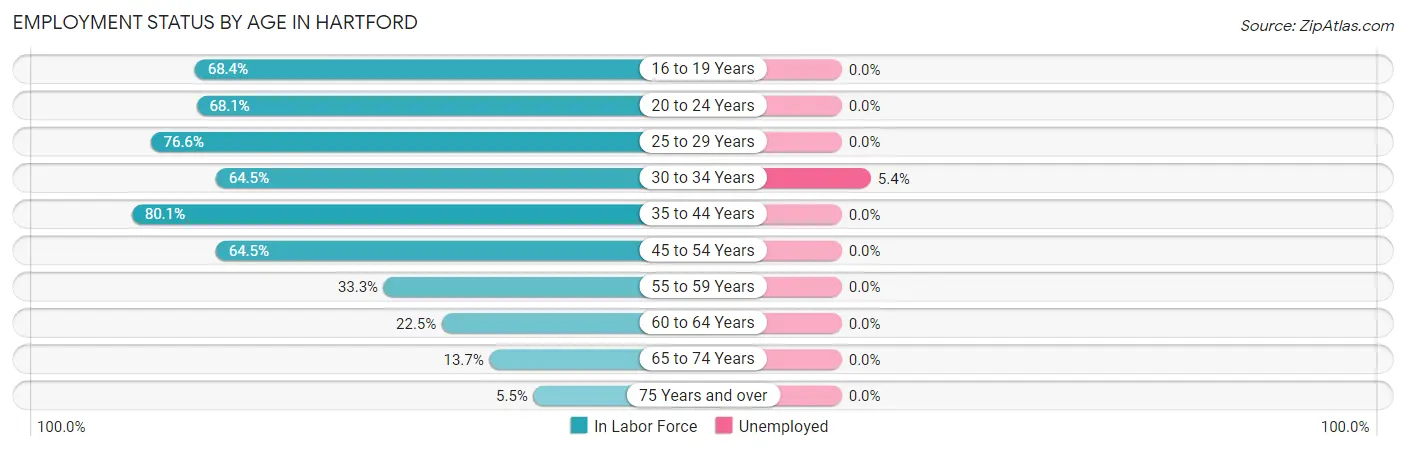
| Age Bracket | In Labor Force | Unemployed |
| 16 to 19 Years | 39 (68.4%) | 0 (0.0%) |
| 20 to 24 Years | 81 (68.1%) | 0 (0.0%) |
| 25 to 29 Years | 108 (76.6%) | 0 (0.0%) |
| 30 to 34 Years | 111 (64.5%) | 6 (5.4%) |
| 35 to 44 Years | 387 (80.1%) | 0 (0.0%) |
| 45 to 54 Years | 191 (64.5%) | 0 (0.0%) |
| 55 to 59 Years | 59 (33.3%) | 0 (0.0%) |
| 60 to 64 Years | 23 (22.5%) | 0 (0.0%) |
| 65 to 74 Years | 27 (13.7%) | 0 (0.0%) |
| 75 Years and over | 16 (5.5%) | 0 (0.0%) |
| Total | 1,043 (51.3%) | 6 (0.6%) |
Employment Status by Educational Attainment in Hartford
According to labor force statistics for Hartford, 64.1% of individuals (879) out of the total population between 25 and 64 years of age (1,371) are in the labor force, with 0.7% or 6 of them being unemployed. The group with the highest labor force participation rate are those with the educational attainment of bachelor's degree or higher, with 84.0% or 84 individuals in the labor force. Within the labor force, individuals with high school diploma education have the highest percentage of unemployment, with 2.6% or 6 of them being unemployed.
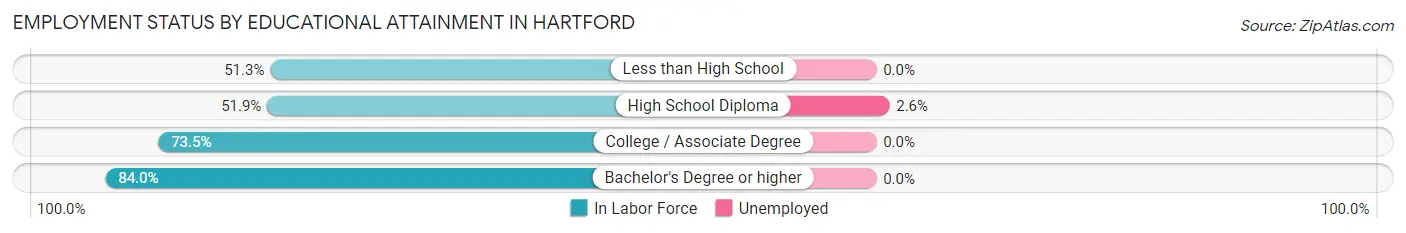
| Educational Attainment | In Labor Force | Unemployed |
| Less than High School | 98 (51.3%) | 0 (0.0%) |
| High School Diploma | 232 (51.9%) | 12 (2.6%) |
| College / Associate Degree | 465 (73.5%) | 0 (0.0%) |
| Bachelor's Degree or higher | 84 (84.0%) | 0 (0.0%) |
| Total | 879 (64.1%) | 10 (0.7%) |
Employment Occupations by Sex in Hartford
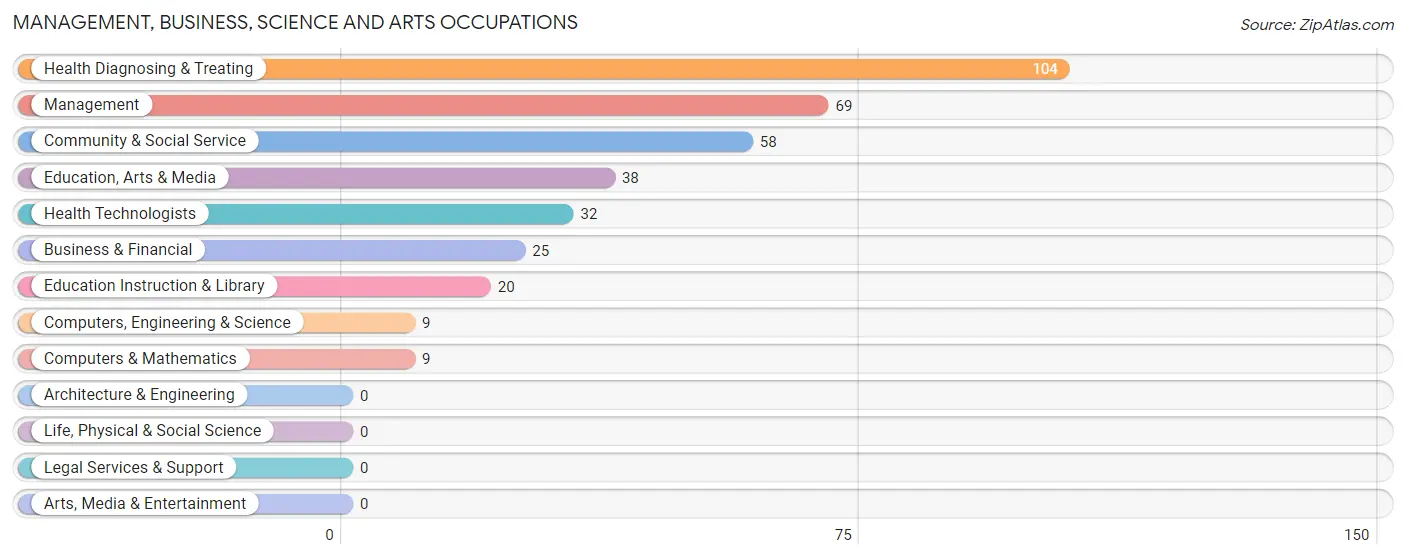
Management, Business, Science and Arts Occupations
The most common Management, Business, Science and Arts occupations in Hartford are Health Diagnosing & Treating (104 | 10.0%), Management (69 | 6.7%), Community & Social Service (58 | 5.6%), Education, Arts & Media (38 | 3.7%), and Health Technologists (32 | 3.1%).
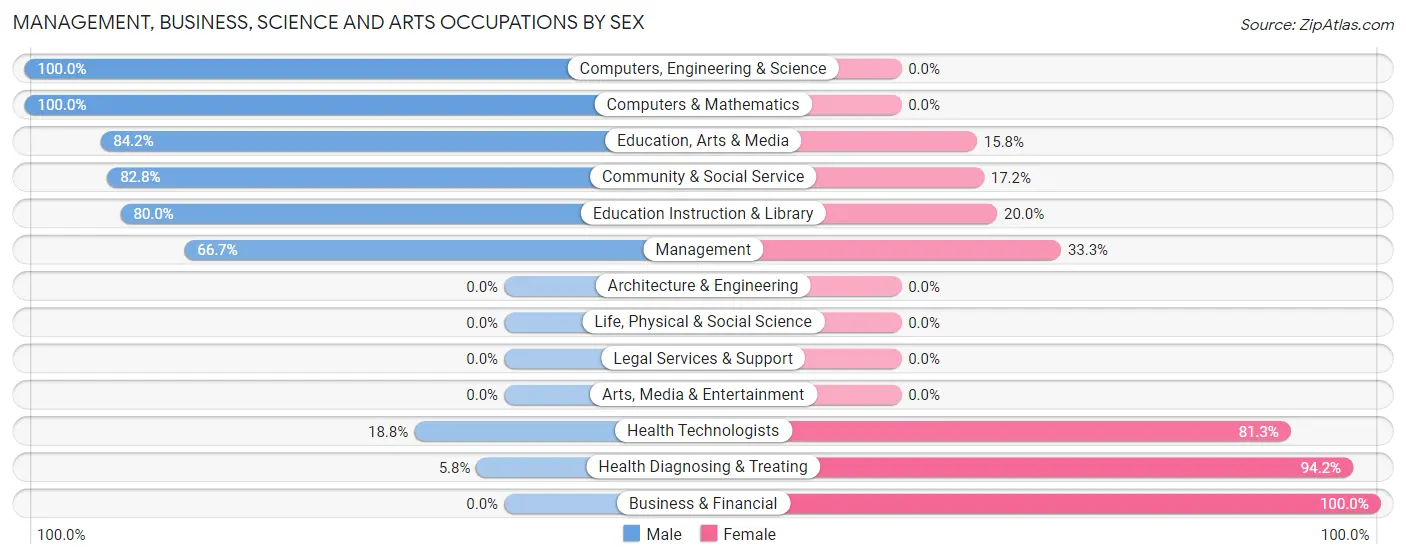
Management, Business, Science and Arts Occupations by Sex
Within the Management, Business, Science and Arts occupations in Hartford, the most male-oriented occupations are Computers, Engineering & Science (100.0%), Computers & Mathematics (100.0%), and Education, Arts & Media (84.2%), while the most female-oriented occupations are Business & Financial (100.0%), Health Diagnosing & Treating (94.2%), and Health Technologists (81.2%).
| Occupation | Male | Female |
| Management | 46 (66.7%) | 23 (33.3%) |
| Business & Financial | 0 (0.0%) | 25 (100.0%) |
| Computers, Engineering & Science | 9 (100.0%) | 0 (0.0%) |
| Computers & Mathematics | 9 (100.0%) | 0 (0.0%) |
| Architecture & Engineering | 0 (0.0%) | 0 (0.0%) |
| Life, Physical & Social Science | 0 (0.0%) | 0 (0.0%) |
| Community & Social Service | 48 (82.8%) | 10 (17.2%) |
| Education, Arts & Media | 32 (84.2%) | 6 (15.8%) |
| Legal Services & Support | 0 (0.0%) | 0 (0.0%) |
| Education Instruction & Library | 16 (80.0%) | 4 (20.0%) |
| Arts, Media & Entertainment | 0 (0.0%) | 0 (0.0%) |
| Health Diagnosing & Treating | 6 (5.8%) | 98 (94.2%) |
| Health Technologists | 6 (18.8%) | 26 (81.2%) |
| Total (Category) | 109 (41.1%) | 156 (58.9%) |
| Total (Overall) | 514 (49.6%) | 522 (50.4%) |
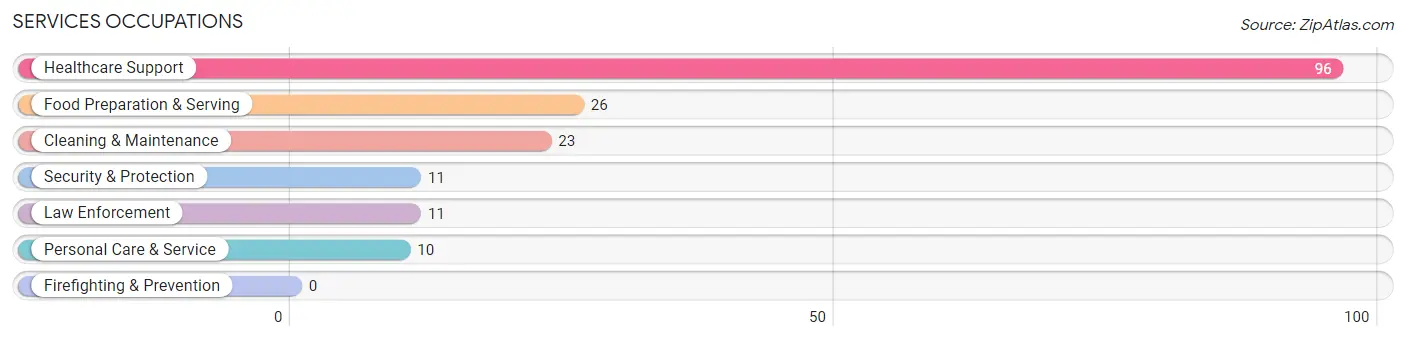
Services Occupations
The most common Services occupations in Hartford are Healthcare Support (96 | 9.3%), Food Preparation & Serving (26 | 2.5%), Cleaning & Maintenance (23 | 2.2%), Security & Protection (11 | 1.1%), and Law Enforcement (11 | 1.1%).
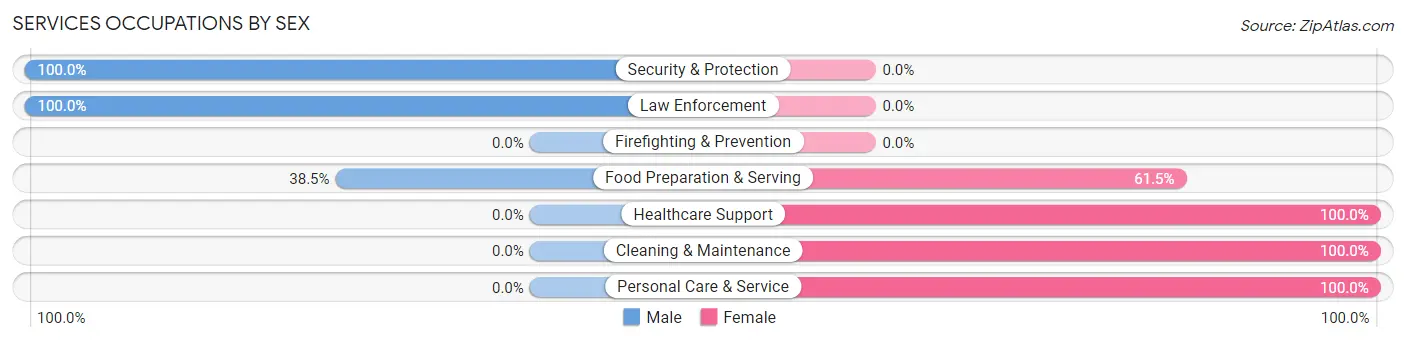
Services Occupations by Sex
Within the Services occupations in Hartford, the most male-oriented occupations are Security & Protection (100.0%), Law Enforcement (100.0%), and Food Preparation & Serving (38.5%), while the most female-oriented occupations are Healthcare Support (100.0%), Cleaning & Maintenance (100.0%), and Personal Care & Service (100.0%).
| Occupation | Male | Female |
| Healthcare Support | 0 (0.0%) | 96 (100.0%) |
| Security & Protection | 11 (100.0%) | 0 (0.0%) |
| Firefighting & Prevention | 0 (0.0%) | 0 (0.0%) |
| Law Enforcement | 11 (100.0%) | 0 (0.0%) |
| Food Preparation & Serving | 10 (38.5%) | 16 (61.5%) |
| Cleaning & Maintenance | 0 (0.0%) | 23 (100.0%) |
| Personal Care & Service | 0 (0.0%) | 10 (100.0%) |
| Total (Category) | 21 (12.7%) | 145 (87.4%) |
| Total (Overall) | 514 (49.6%) | 522 (50.4%) |
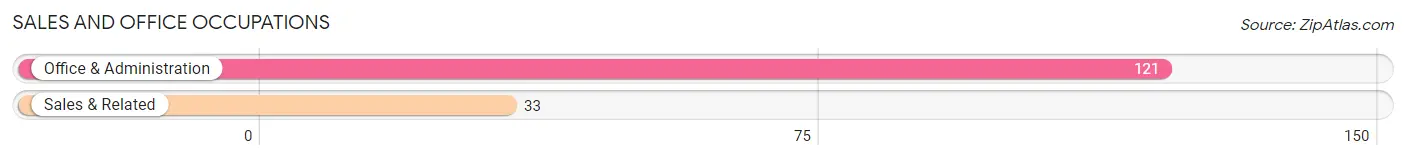
Sales and Office Occupations
The most common Sales and Office occupations in Hartford are Office & Administration (121 | 11.7%), and Sales & Related (33 | 3.2%).
Sales and Office Occupations by Sex
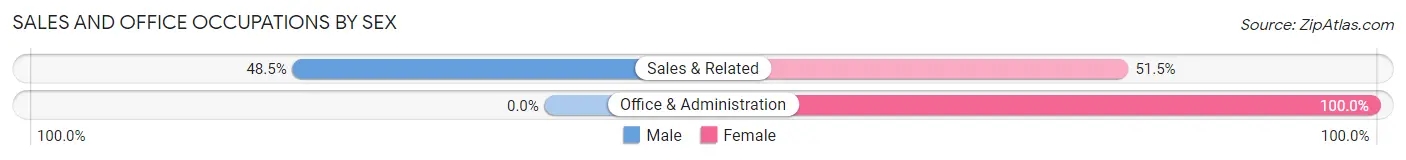
| Occupation | Male | Female |
| Sales & Related | 16 (48.5%) | 17 (51.5%) |
| Office & Administration | 0 (0.0%) | 121 (100.0%) |
| Total (Category) | 16 (10.4%) | 138 (89.6%) |
| Total (Overall) | 514 (49.6%) | 522 (50.4%) |
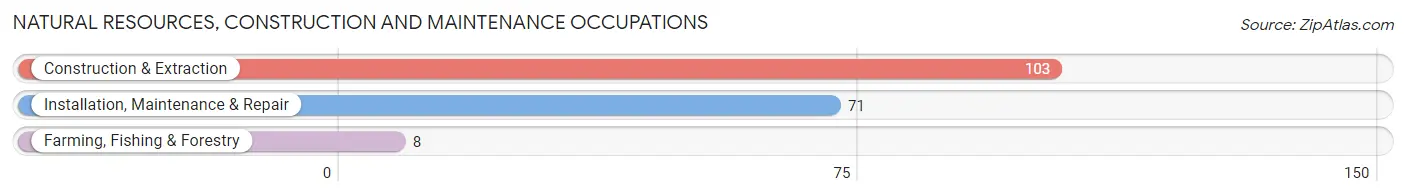
Natural Resources, Construction and Maintenance Occupations
The most common Natural Resources, Construction and Maintenance occupations in Hartford are Construction & Extraction (103 | 9.9%), Installation, Maintenance & Repair (71 | 6.9%), and Farming, Fishing & Forestry (8 | 0.8%).
Natural Resources, Construction and Maintenance Occupations by Sex
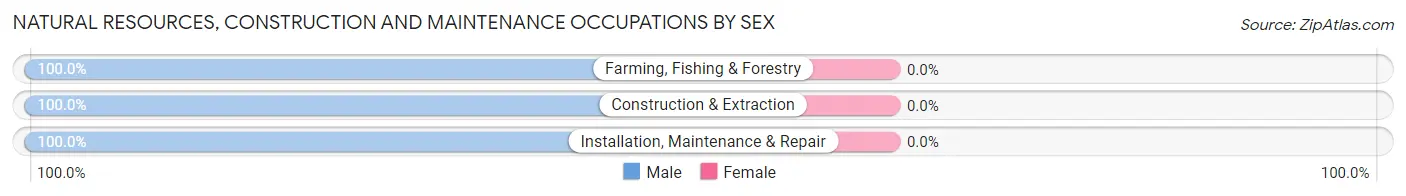
| Occupation | Male | Female |
| Farming, Fishing & Forestry | 8 (100.0%) | 0 (0.0%) |
| Construction & Extraction | 103 (100.0%) | 0 (0.0%) |
| Installation, Maintenance & Repair | 71 (100.0%) | 0 (0.0%) |
| Total (Category) | 182 (100.0%) | 0 (0.0%) |
| Total (Overall) | 514 (49.6%) | 522 (50.4%) |
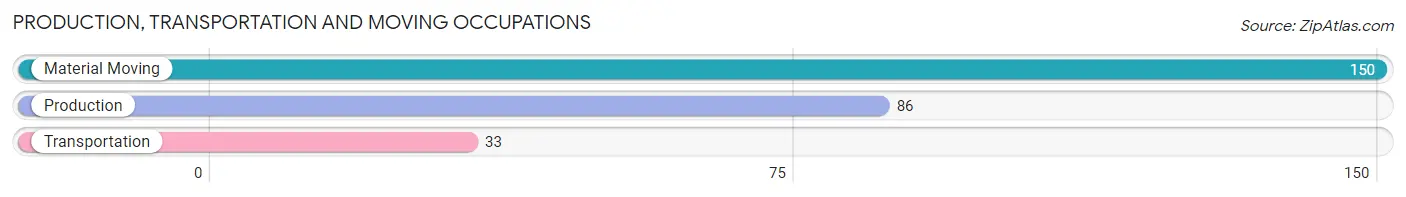
Production, Transportation and Moving Occupations
The most common Production, Transportation and Moving occupations in Hartford are Material Moving (150 | 14.5%), Production (86 | 8.3%), and Transportation (33 | 3.2%).
Production, Transportation and Moving Occupations by Sex
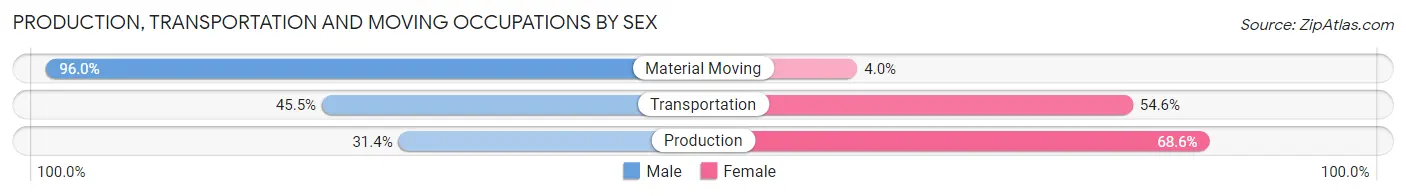
| Occupation | Male | Female |
| Production | 27 (31.4%) | 59 (68.6%) |
| Transportation | 15 (45.5%) | 18 (54.5%) |
| Material Moving | 144 (96.0%) | 6 (4.0%) |
| Total (Category) | 186 (69.1%) | 83 (30.9%) |
| Total (Overall) | 514 (49.6%) | 522 (50.4%) |
Employment Industries by Sex in Hartford
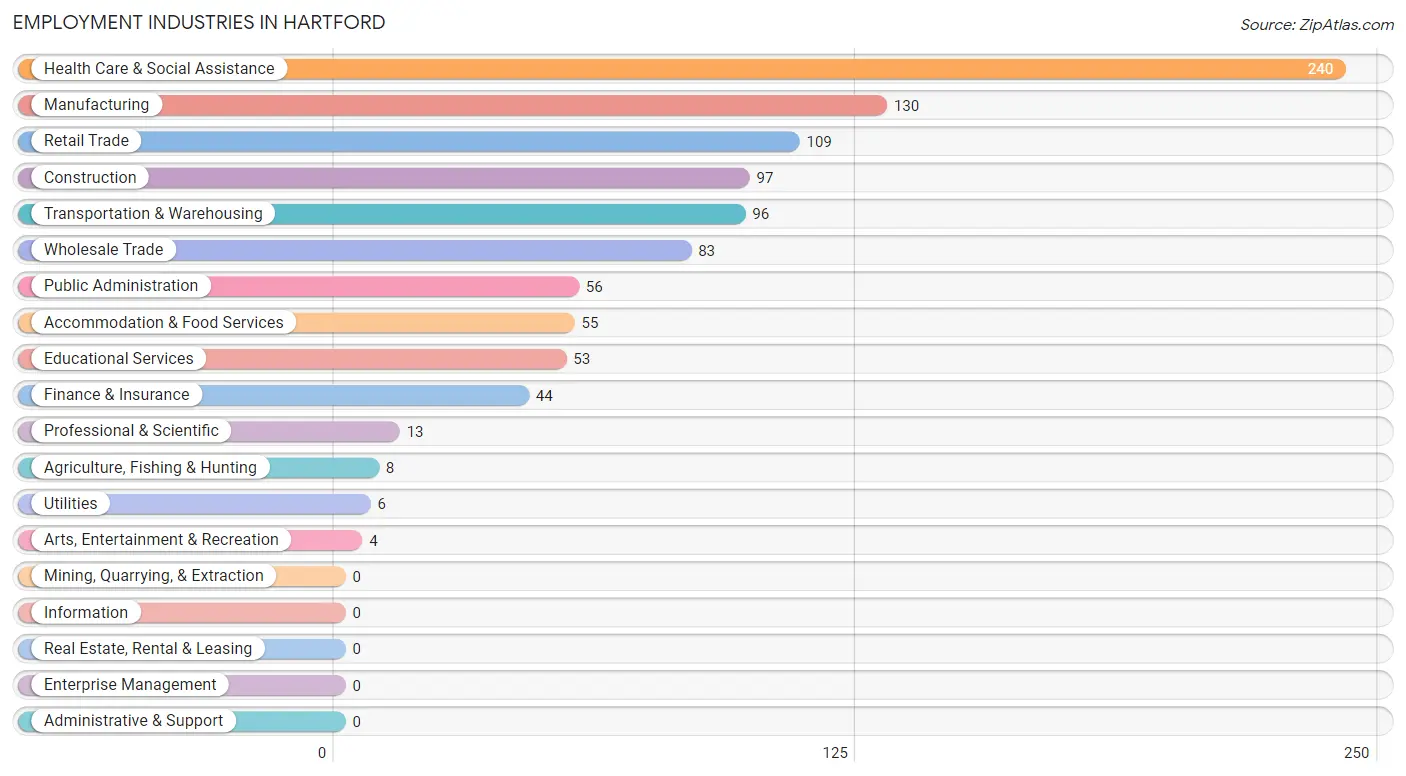
Employment Industries in Hartford
The major employment industries in Hartford include Health Care & Social Assistance (240 | 23.2%), Manufacturing (130 | 12.6%), Retail Trade (109 | 10.5%), Construction (97 | 9.4%), and Transportation & Warehousing (96 | 9.3%).
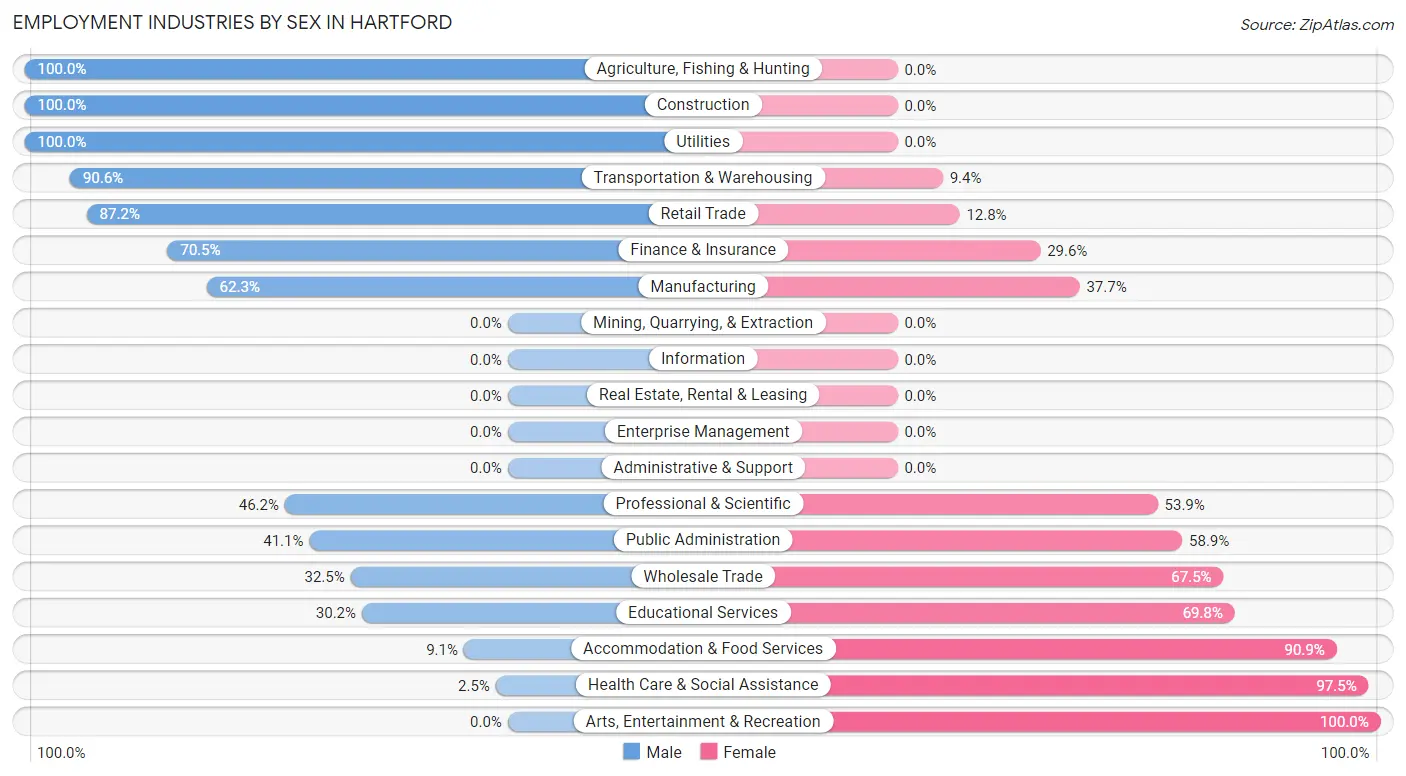
Employment Industries by Sex in Hartford
The Hartford industries that see more men than women are Agriculture, Fishing & Hunting (100.0%), Construction (100.0%), and Utilities (100.0%), whereas the industries that tend to have a higher number of women are Arts, Entertainment & Recreation (100.0%), Health Care & Social Assistance (97.5%), and Accommodation & Food Services (90.9%).
| Industry | Male | Female |
| Agriculture, Fishing & Hunting | 8 (100.0%) | 0 (0.0%) |
| Mining, Quarrying, & Extraction | 0 (0.0%) | 0 (0.0%) |
| Construction | 97 (100.0%) | 0 (0.0%) |
| Manufacturing | 81 (62.3%) | 49 (37.7%) |
| Wholesale Trade | 27 (32.5%) | 56 (67.5%) |
| Retail Trade | 95 (87.2%) | 14 (12.8%) |
| Transportation & Warehousing | 87 (90.6%) | 9 (9.4%) |
| Utilities | 6 (100.0%) | 0 (0.0%) |
| Information | 0 (0.0%) | 0 (0.0%) |
| Finance & Insurance | 31 (70.5%) | 13 (29.5%) |
| Real Estate, Rental & Leasing | 0 (0.0%) | 0 (0.0%) |
| Professional & Scientific | 6 (46.2%) | 7 (53.8%) |
| Enterprise Management | 0 (0.0%) | 0 (0.0%) |
| Administrative & Support | 0 (0.0%) | 0 (0.0%) |
| Educational Services | 16 (30.2%) | 37 (69.8%) |
| Health Care & Social Assistance | 6 (2.5%) | 234 (97.5%) |
| Arts, Entertainment & Recreation | 0 (0.0%) | 4 (100.0%) |
| Accommodation & Food Services | 5 (9.1%) | 50 (90.9%) |
| Public Administration | 23 (41.1%) | 33 (58.9%) |
| Total | 514 (49.6%) | 522 (50.4%) |
Education in Hartford
School Enrollment in Hartford
The most common levels of schooling among the 612 students in Hartford are middle school (205 | 33.5%), kindergarten (174 | 28.4%), and college / undergraduate (80 | 13.1%).
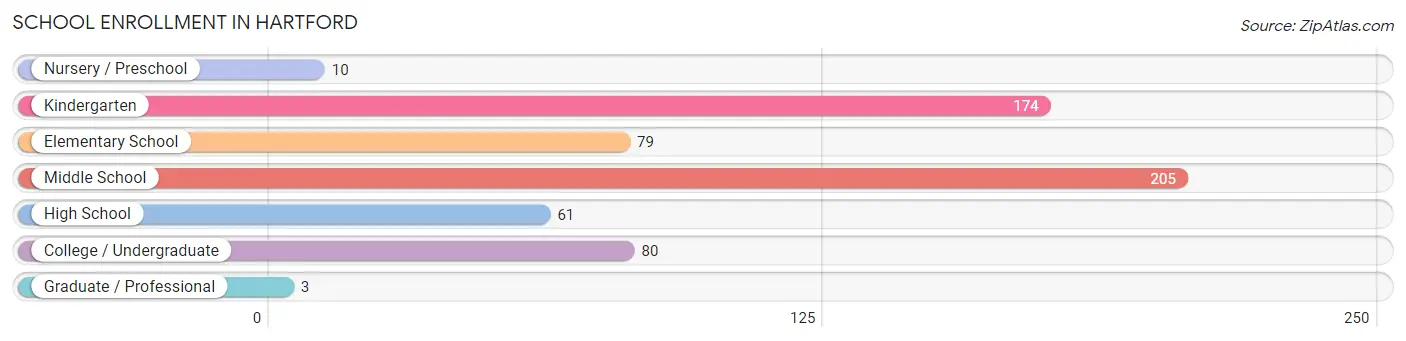
| School Level | # Students | % Students |
| Nursery / Preschool | 10 | 1.6% |
| Kindergarten | 174 | 28.4% |
| Elementary School | 79 | 12.9% |
| Middle School | 205 | 33.5% |
| High School | 61 | 10.0% |
| College / Undergraduate | 80 | 13.1% |
| Graduate / Professional | 3 | 0.5% |
| Total | 612 | 100.0% |
School Enrollment by Age by Funding Source in Hartford
Out of a total of 612 students who are enrolled in schools in Hartford, 78 (12.7%) attend a private institution, while the remaining 534 (87.3%) are enrolled in public schools. The age group of 15 to 17 year olds has the highest likelihood of being enrolled in private schools, with 24 (38.7% in the age bracket) enrolled. Conversely, the age group of 3 to 4 year olds has the lowest likelihood of being enrolled in a private school, with 10 (100.0% in the age bracket) attending a public institution.
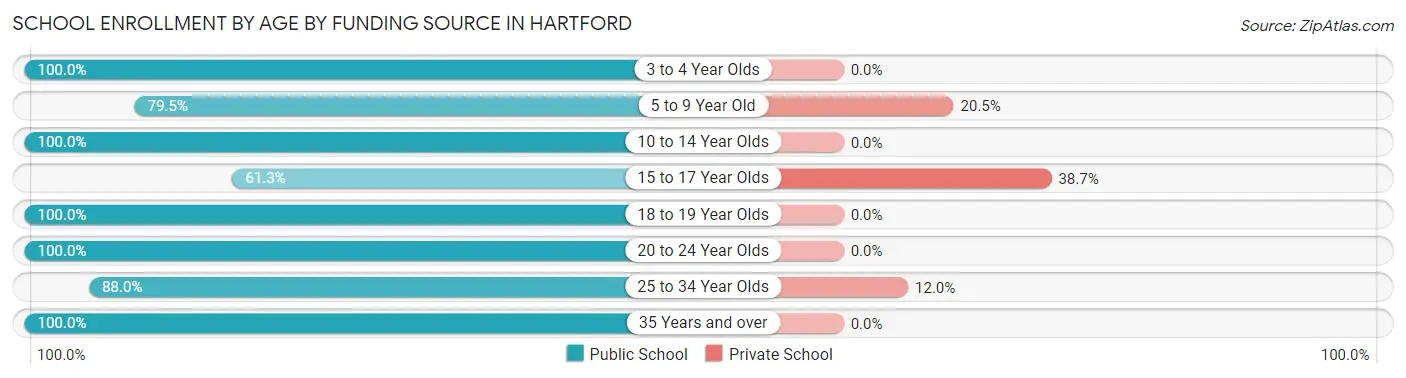
| Age Bracket | Public School | Private School |
| 3 to 4 Year Olds | 10 (100.0%) | 0 (0.0%) |
| 5 to 9 Year Old | 198 (79.5%) | 51 (20.5%) |
| 10 to 14 Year Olds | 202 (100.0%) | 0 (0.0%) |
| 15 to 17 Year Olds | 38 (61.3%) | 24 (38.7%) |
| 18 to 19 Year Olds | 6 (100.0%) | 0 (0.0%) |
| 20 to 24 Year Olds | 13 (100.0%) | 0 (0.0%) |
| 25 to 34 Year Olds | 22 (88.0%) | 3 (12.0%) |
| 35 Years and over | 45 (100.0%) | 0 (0.0%) |
| Total | 534 (87.3%) | 78 (12.7%) |
Educational Attainment by Field of Study in Hartford
Education (43 | 25.8%), business (28 | 16.8%), bio, nature & agricultural (25 | 15.0%), science & technology (23 | 13.8%), and liberal arts & history (17 | 10.2%) are the most common fields of study among 167 individuals in Hartford who have obtained a bachelor's degree or higher.
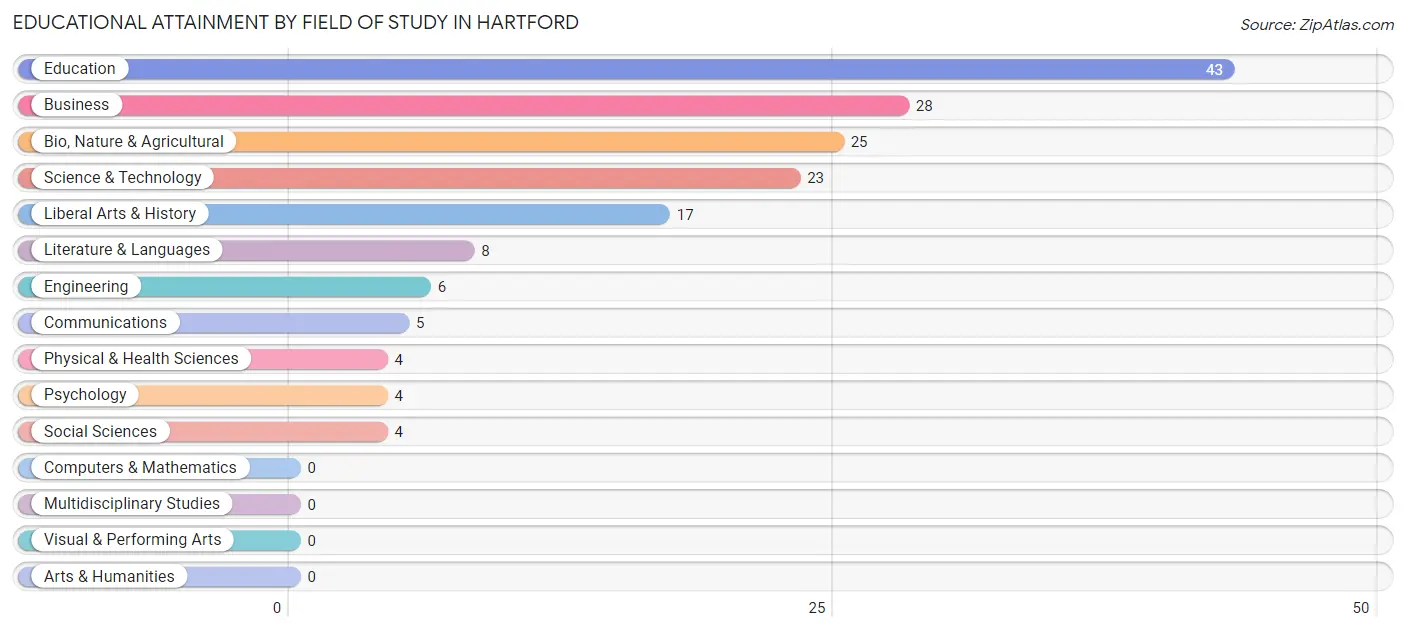
| Field of Study | # Graduates | % Graduates |
| Computers & Mathematics | 0 | 0.0% |
| Bio, Nature & Agricultural | 25 | 15.0% |
| Physical & Health Sciences | 4 | 2.4% |
| Psychology | 4 | 2.4% |
| Social Sciences | 4 | 2.4% |
| Engineering | 6 | 3.6% |
| Multidisciplinary Studies | 0 | 0.0% |
| Science & Technology | 23 | 13.8% |
| Business | 28 | 16.8% |
| Education | 43 | 25.8% |
| Literature & Languages | 8 | 4.8% |
| Liberal Arts & History | 17 | 10.2% |
| Visual & Performing Arts | 0 | 0.0% |
| Communications | 5 | 3.0% |
| Arts & Humanities | 0 | 0.0% |
| Total | 167 | 100.0% |
Transportation & Commute in Hartford
Vehicle Availability by Sex in Hartford
The most prevalent vehicle ownership categories in Hartford are males with 2 vehicles (224, accounting for 43.6%) and females with 2 vehicles (272, making up 44.0%).
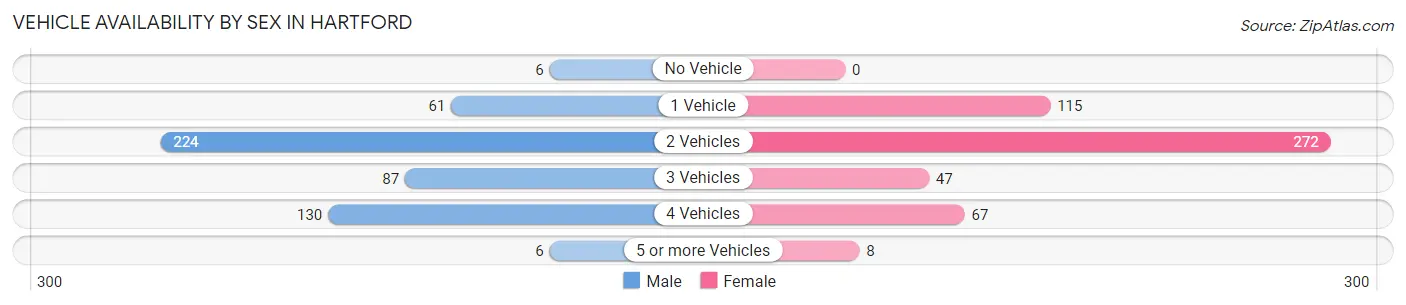
| Vehicles Available | Male | Female |
| No Vehicle | 6 (1.2%) | 0 (0.0%) |
| 1 Vehicle | 61 (11.9%) | 115 (22.6%) |
| 2 Vehicles | 224 (43.6%) | 272 (53.4%) |
| 3 Vehicles | 87 (16.9%) | 47 (9.2%) |
| 4 Vehicles | 130 (25.3%) | 67 (13.2%) |
| 5 or more Vehicles | 6 (1.2%) | 8 (1.6%) |
| Total | 514 (100.0%) | 509 (100.0%) |
Commute Time in Hartford
The most frequently occuring commute durations in Hartford are 15 to 19 minutes (169 commuters, 17.4%), 30 to 34 minutes (169 commuters, 17.4%), and 5 to 9 minutes (129 commuters, 13.3%).
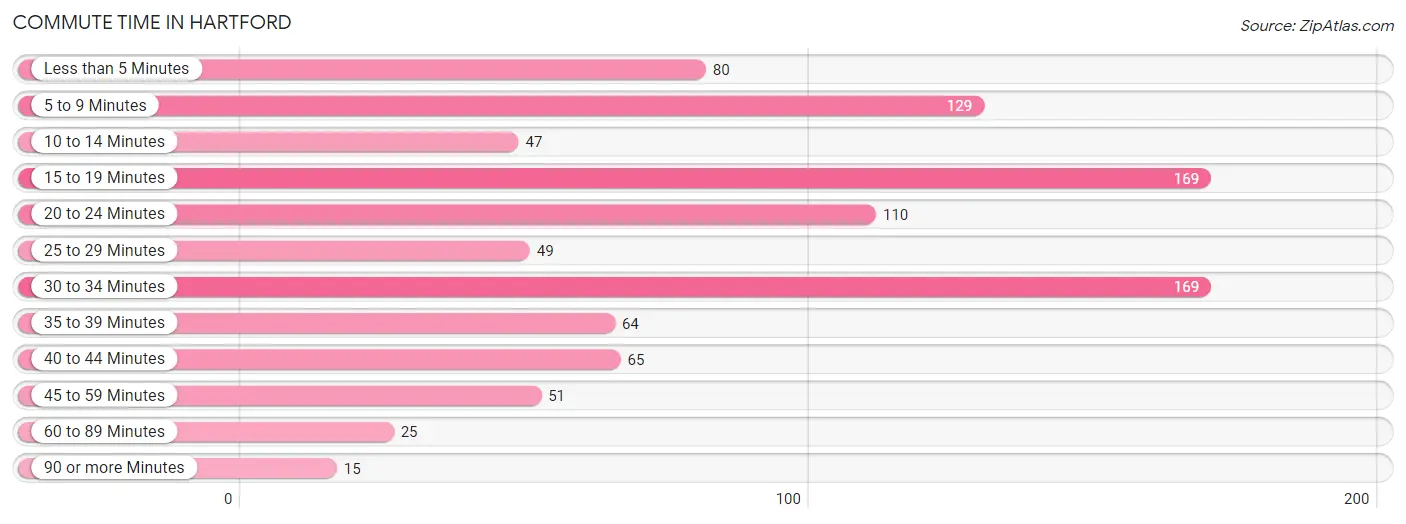
| Commute Time | # Commuters | % Commuters |
| Less than 5 Minutes | 80 | 8.2% |
| 5 to 9 Minutes | 129 | 13.3% |
| 10 to 14 Minutes | 47 | 4.8% |
| 15 to 19 Minutes | 169 | 17.4% |
| 20 to 24 Minutes | 110 | 11.3% |
| 25 to 29 Minutes | 49 | 5.0% |
| 30 to 34 Minutes | 169 | 17.4% |
| 35 to 39 Minutes | 64 | 6.6% |
| 40 to 44 Minutes | 65 | 6.7% |
| 45 to 59 Minutes | 51 | 5.2% |
| 60 to 89 Minutes | 25 | 2.6% |
| 90 or more Minutes | 15 | 1.5% |
Commute Time by Sex in Hartford
The most common commute times in Hartford are less than 5 minutes (68 commuters, 14.5%) for males and 15 to 19 minutes (125 commuters, 24.8%) for females.
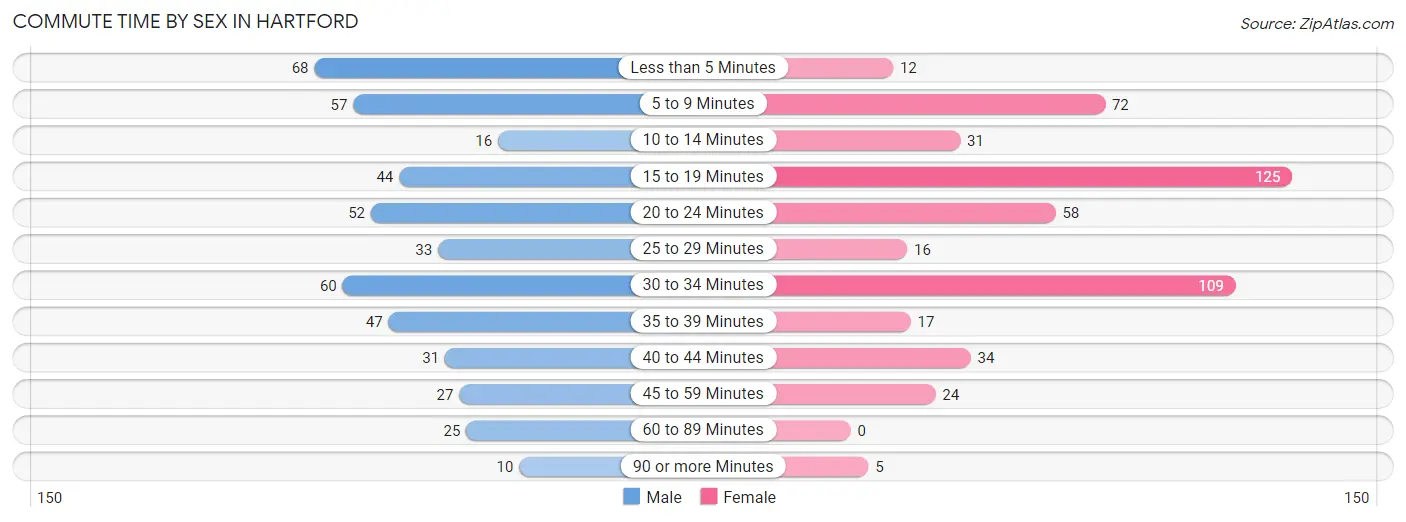
| Commute Time | Male | Female |
| Less than 5 Minutes | 68 (14.5%) | 12 (2.4%) |
| 5 to 9 Minutes | 57 (12.1%) | 72 (14.3%) |
| 10 to 14 Minutes | 16 (3.4%) | 31 (6.2%) |
| 15 to 19 Minutes | 44 (9.4%) | 125 (24.8%) |
| 20 to 24 Minutes | 52 (11.1%) | 58 (11.5%) |
| 25 to 29 Minutes | 33 (7.0%) | 16 (3.2%) |
| 30 to 34 Minutes | 60 (12.8%) | 109 (21.7%) |
| 35 to 39 Minutes | 47 (10.0%) | 17 (3.4%) |
| 40 to 44 Minutes | 31 (6.6%) | 34 (6.8%) |
| 45 to 59 Minutes | 27 (5.7%) | 24 (4.8%) |
| 60 to 89 Minutes | 25 (5.3%) | 0 (0.0%) |
| 90 or more Minutes | 10 (2.1%) | 5 (1.0%) |
Time of Departure to Work by Sex in Hartford
The most frequent times of departure to work in Hartford are 7:00 AM to 7:29 AM (110, 23.4%) for males and 7:00 AM to 7:29 AM (143, 28.4%) for females.
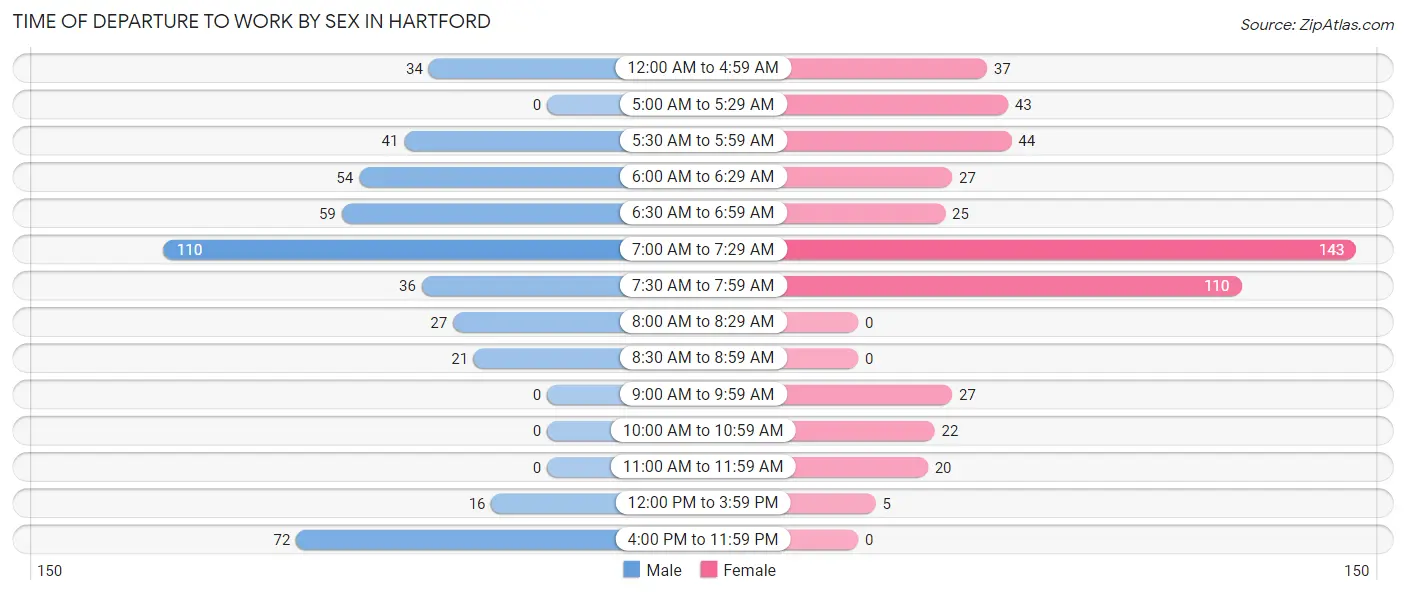
| Time of Departure | Male | Female |
| 12:00 AM to 4:59 AM | 34 (7.2%) | 37 (7.4%) |
| 5:00 AM to 5:29 AM | 0 (0.0%) | 43 (8.6%) |
| 5:30 AM to 5:59 AM | 41 (8.7%) | 44 (8.7%) |
| 6:00 AM to 6:29 AM | 54 (11.5%) | 27 (5.4%) |
| 6:30 AM to 6:59 AM | 59 (12.6%) | 25 (5.0%) |
| 7:00 AM to 7:29 AM | 110 (23.4%) | 143 (28.4%) |
| 7:30 AM to 7:59 AM | 36 (7.7%) | 110 (21.9%) |
| 8:00 AM to 8:29 AM | 27 (5.7%) | 0 (0.0%) |
| 8:30 AM to 8:59 AM | 21 (4.5%) | 0 (0.0%) |
| 9:00 AM to 9:59 AM | 0 (0.0%) | 27 (5.4%) |
| 10:00 AM to 10:59 AM | 0 (0.0%) | 22 (4.4%) |
| 11:00 AM to 11:59 AM | 0 (0.0%) | 20 (4.0%) |
| 12:00 PM to 3:59 PM | 16 (3.4%) | 5 (1.0%) |
| 4:00 PM to 11:59 PM | 72 (15.3%) | 0 (0.0%) |
| Total | 470 (100.0%) | 503 (100.0%) |
Housing Occupancy in Hartford
Occupancy by Ownership in Hartford
Of the total 975 dwellings in Hartford, owner-occupied units account for 596 (61.1%), while renter-occupied units make up 379 (38.9%).
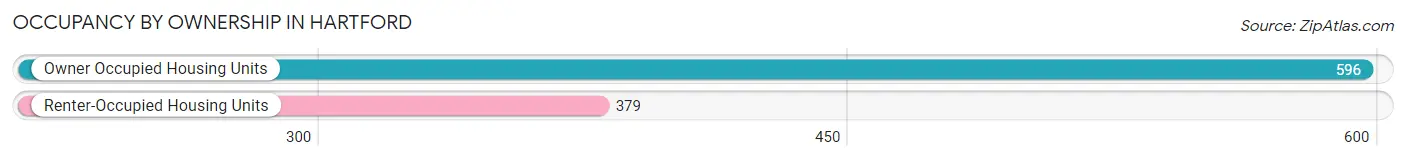
| Occupancy | # Housing Units | % Housing Units |
| Owner Occupied Housing Units | 596 | 61.1% |
| Renter-Occupied Housing Units | 379 | 38.9% |
| Total Occupied Housing Units | 975 | 100.0% |
Occupancy by Household Size in Hartford
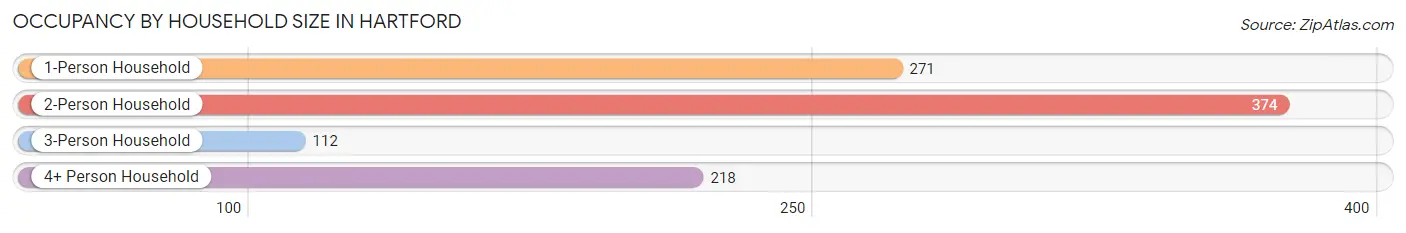
| Household Size | # Housing Units | % Housing Units |
| 1-Person Household | 271 | 27.8% |
| 2-Person Household | 374 | 38.4% |
| 3-Person Household | 112 | 11.5% |
| 4+ Person Household | 218 | 22.4% |
| Total Housing Units | 975 | 100.0% |
Occupancy by Ownership by Household Size in Hartford
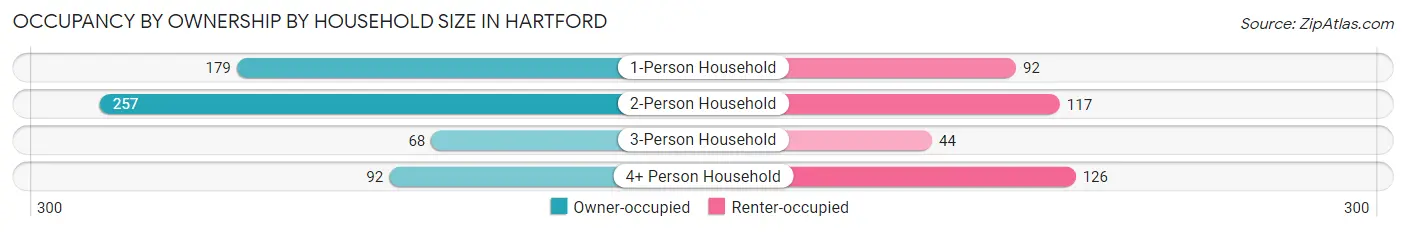
| Household Size | Owner-occupied | Renter-occupied |
| 1-Person Household | 179 (66.0%) | 92 (34.0%) |
| 2-Person Household | 257 (68.7%) | 117 (31.3%) |
| 3-Person Household | 68 (60.7%) | 44 (39.3%) |
| 4+ Person Household | 92 (42.2%) | 126 (57.8%) |
| Total Housing Units | 596 (61.1%) | 379 (38.9%) |
Occupancy by Educational Attainment in Hartford
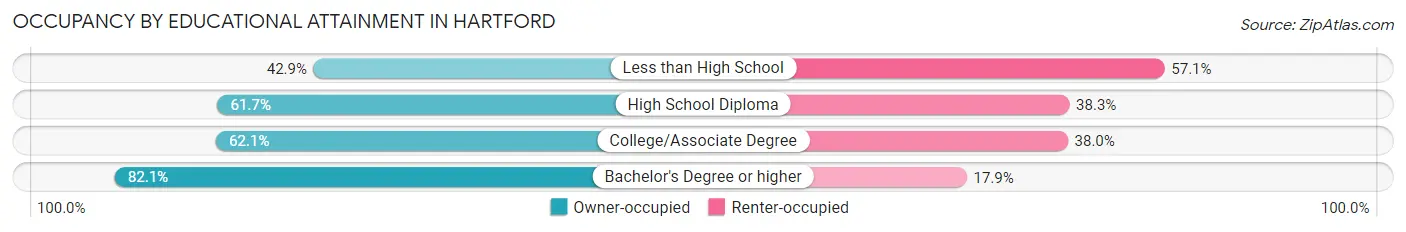
| Household Size | Owner-occupied | Renter-occupied |
| Less than High School | 48 (42.9%) | 64 (57.1%) |
| High School Diploma | 184 (61.7%) | 114 (38.3%) |
| College/Associate Degree | 309 (62.1%) | 189 (38.0%) |
| Bachelor's Degree or higher | 55 (82.1%) | 12 (17.9%) |
Occupancy by Age of Householder in Hartford
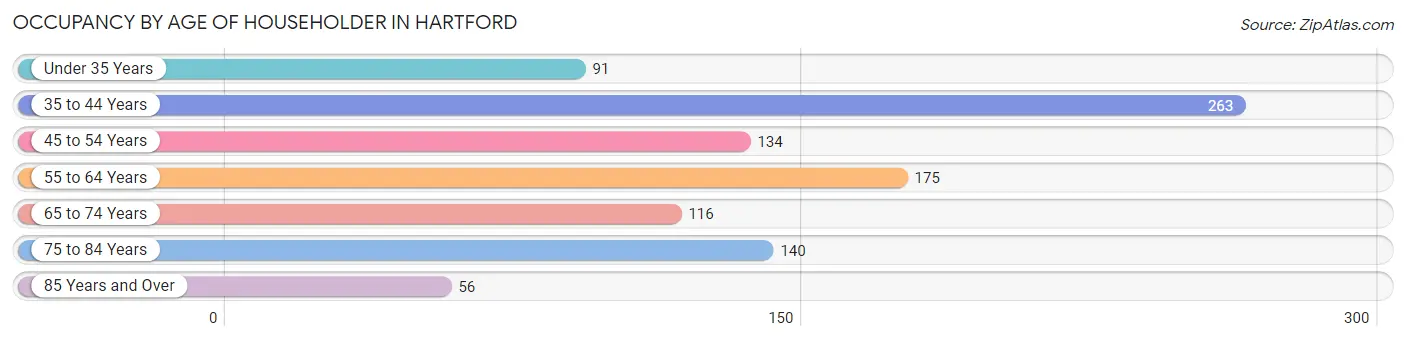
| Age Bracket | # Households | % Households |
| Under 35 Years | 91 | 9.3% |
| 35 to 44 Years | 263 | 27.0% |
| 45 to 54 Years | 134 | 13.7% |
| 55 to 64 Years | 175 | 17.9% |
| 65 to 74 Years | 116 | 11.9% |
| 75 to 84 Years | 140 | 14.4% |
| 85 Years and Over | 56 | 5.7% |
| Total | 975 | 100.0% |
Housing Finances in Hartford
Median Income by Occupancy in Hartford
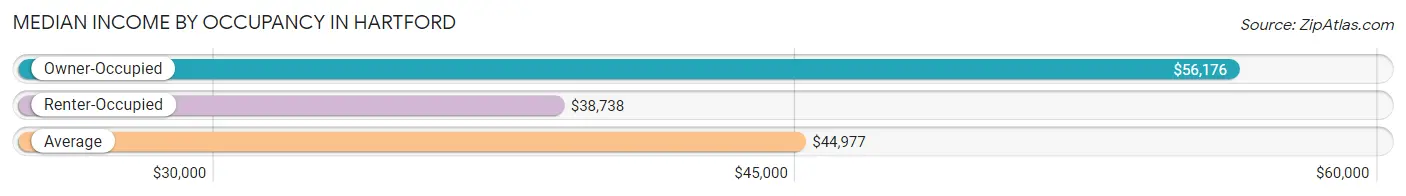
| Occupancy Type | # Households | Median Income |
| Owner-Occupied | 596 (61.1%) | $56,176 |
| Renter-Occupied | 379 (38.9%) | $38,738 |
| Average | 975 (100.0%) | $44,977 |
Occupancy by Householder Income Bracket in Hartford
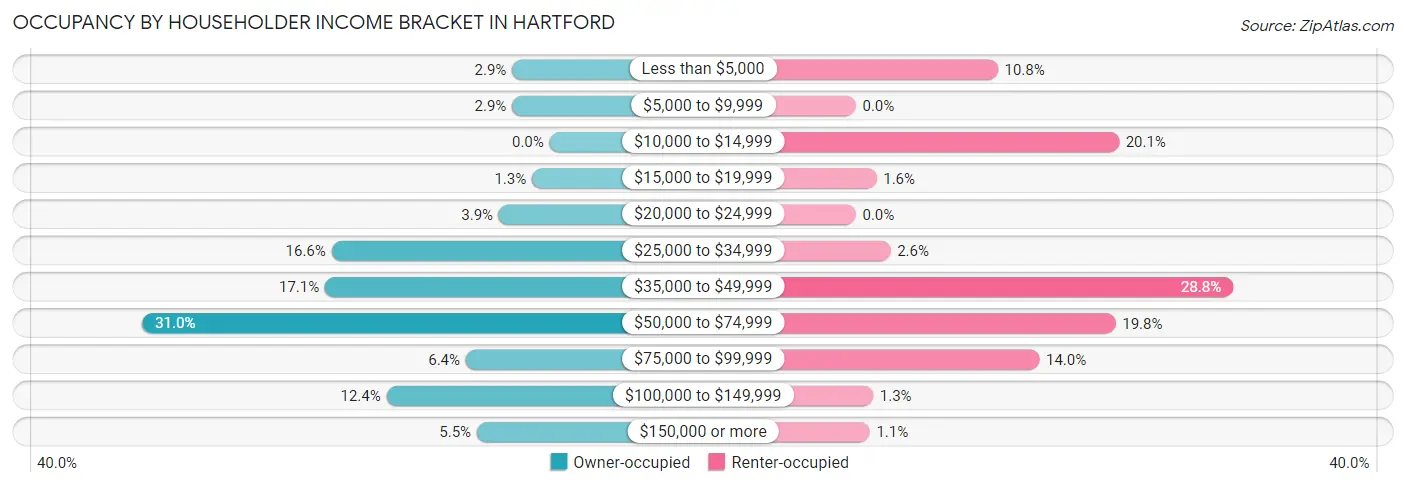
| Income Bracket | Owner-occupied | Renter-occupied |
| Less than $5,000 | 17 (2.9%) | 41 (10.8%) |
| $5,000 to $9,999 | 17 (2.9%) | 0 (0.0%) |
| $10,000 to $14,999 | 0 (0.0%) | 76 (20.1%) |
| $15,000 to $19,999 | 8 (1.3%) | 6 (1.6%) |
| $20,000 to $24,999 | 23 (3.9%) | 0 (0.0%) |
| $25,000 to $34,999 | 99 (16.6%) | 10 (2.6%) |
| $35,000 to $49,999 | 102 (17.1%) | 109 (28.8%) |
| $50,000 to $74,999 | 185 (31.0%) | 75 (19.8%) |
| $75,000 to $99,999 | 38 (6.4%) | 53 (14.0%) |
| $100,000 to $149,999 | 74 (12.4%) | 5 (1.3%) |
| $150,000 or more | 33 (5.5%) | 4 (1.1%) |
| Total | 596 (100.0%) | 379 (100.0%) |
Monthly Housing Cost Tiers in Hartford
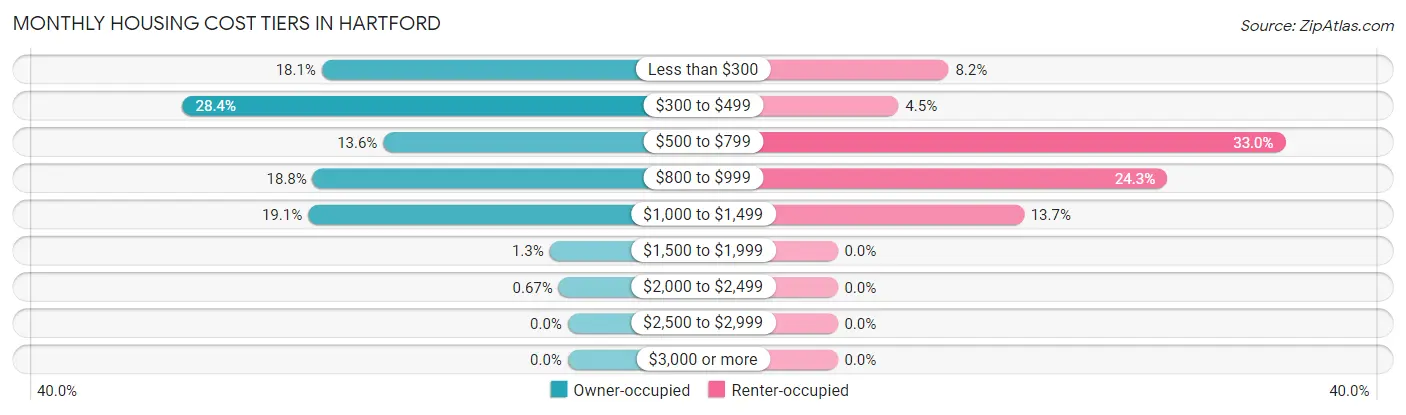
| Monthly Cost | Owner-occupied | Renter-occupied |
| Less than $300 | 108 (18.1%) | 31 (8.2%) |
| $300 to $499 | 169 (28.4%) | 17 (4.5%) |
| $500 to $799 | 81 (13.6%) | 125 (33.0%) |
| $800 to $999 | 112 (18.8%) | 92 (24.3%) |
| $1,000 to $1,499 | 114 (19.1%) | 52 (13.7%) |
| $1,500 to $1,999 | 8 (1.3%) | 0 (0.0%) |
| $2,000 to $2,499 | 4 (0.7%) | 0 (0.0%) |
| $2,500 to $2,999 | 0 (0.0%) | 0 (0.0%) |
| $3,000 or more | 0 (0.0%) | 0 (0.0%) |
| Total | 596 (100.0%) | 379 (100.0%) |
Physical Housing Characteristics in Hartford
Housing Structures in Hartford
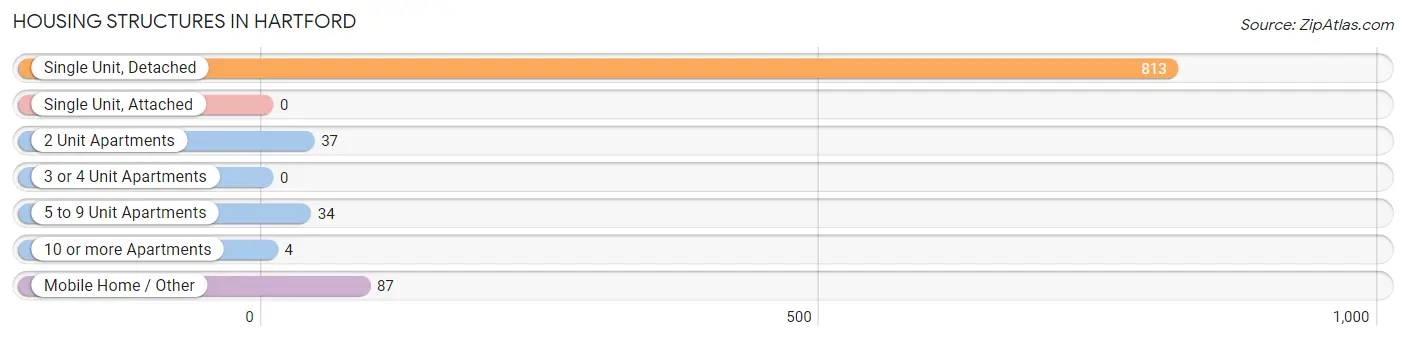
| Structure Type | # Housing Units | % Housing Units |
| Single Unit, Detached | 813 | 83.4% |
| Single Unit, Attached | 0 | 0.0% |
| 2 Unit Apartments | 37 | 3.8% |
| 3 or 4 Unit Apartments | 0 | 0.0% |
| 5 to 9 Unit Apartments | 34 | 3.5% |
| 10 or more Apartments | 4 | 0.4% |
| Mobile Home / Other | 87 | 8.9% |
| Total | 975 | 100.0% |
Housing Structures by Occupancy in Hartford
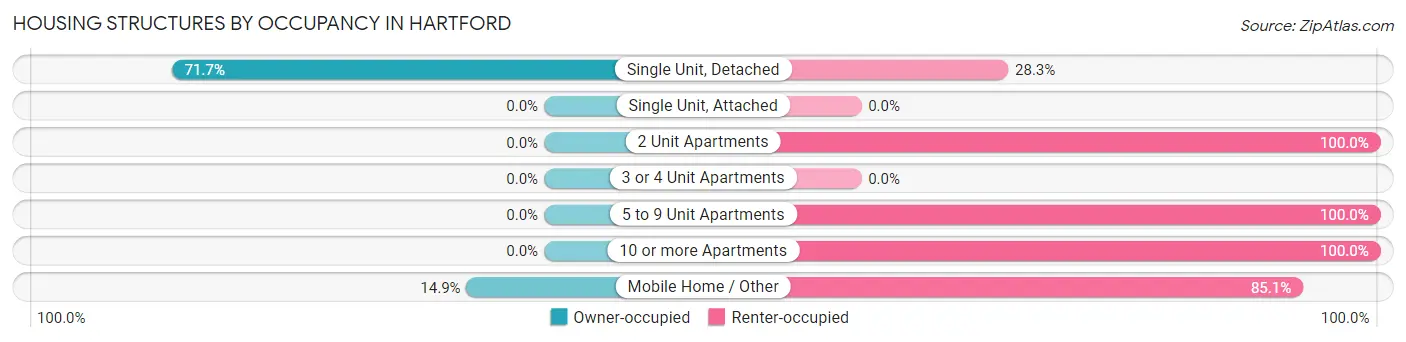
| Structure Type | Owner-occupied | Renter-occupied |
| Single Unit, Detached | 583 (71.7%) | 230 (28.3%) |
| Single Unit, Attached | 0 (0.0%) | 0 (0.0%) |
| 2 Unit Apartments | 0 (0.0%) | 37 (100.0%) |
| 3 or 4 Unit Apartments | 0 (0.0%) | 0 (0.0%) |
| 5 to 9 Unit Apartments | 0 (0.0%) | 34 (100.0%) |
| 10 or more Apartments | 0 (0.0%) | 4 (100.0%) |
| Mobile Home / Other | 13 (14.9%) | 74 (85.1%) |
| Total | 596 (61.1%) | 379 (38.9%) |
Housing Structures by Number of Rooms in Hartford
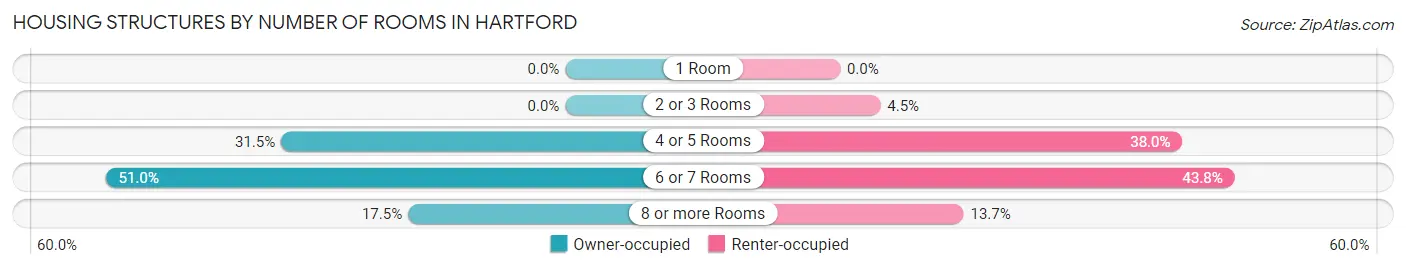
| Number of Rooms | Owner-occupied | Renter-occupied |
| 1 Room | 0 (0.0%) | 0 (0.0%) |
| 2 or 3 Rooms | 0 (0.0%) | 17 (4.5%) |
| 4 or 5 Rooms | 188 (31.5%) | 144 (38.0%) |
| 6 or 7 Rooms | 304 (51.0%) | 166 (43.8%) |
| 8 or more Rooms | 104 (17.4%) | 52 (13.7%) |
| Total | 596 (100.0%) | 379 (100.0%) |
Housing Structure by Heating Type in Hartford
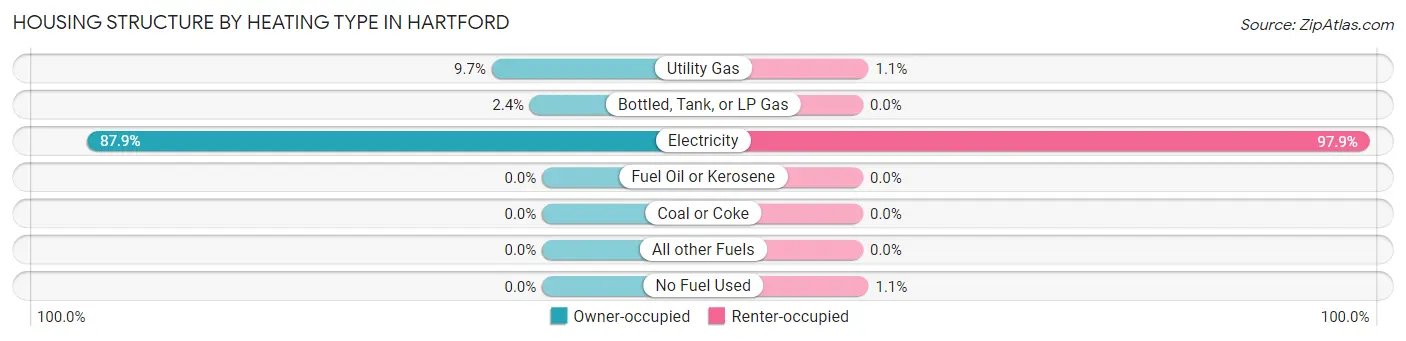
| Heating Type | Owner-occupied | Renter-occupied |
| Utility Gas | 58 (9.7%) | 4 (1.1%) |
| Bottled, Tank, or LP Gas | 14 (2.4%) | 0 (0.0%) |
| Electricity | 524 (87.9%) | 371 (97.9%) |
| Fuel Oil or Kerosene | 0 (0.0%) | 0 (0.0%) |
| Coal or Coke | 0 (0.0%) | 0 (0.0%) |
| All other Fuels | 0 (0.0%) | 0 (0.0%) |
| No Fuel Used | 0 (0.0%) | 4 (1.1%) |
| Total | 596 (100.0%) | 379 (100.0%) |
Household Vehicle Usage in Hartford
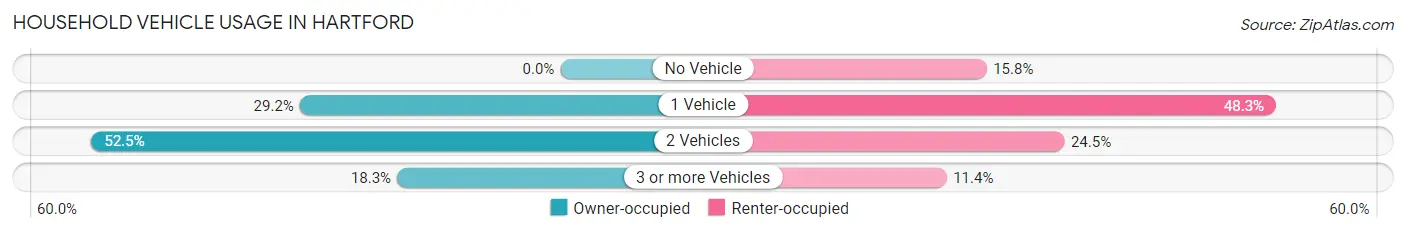
| Vehicles per Household | Owner-occupied | Renter-occupied |
| No Vehicle | 0 (0.0%) | 60 (15.8%) |
| 1 Vehicle | 174 (29.2%) | 183 (48.3%) |
| 2 Vehicles | 313 (52.5%) | 93 (24.5%) |
| 3 or more Vehicles | 109 (18.3%) | 43 (11.4%) |
| Total | 596 (100.0%) | 379 (100.0%) |
Real Estate & Mortgages in Hartford
Real Estate and Mortgage Overview in Hartford
| Characteristic | Without Mortgage | With Mortgage |
| Housing Units | 312 | 284 |
| Median Property Value | $91,200 | $158,300 |
| Median Household Income | $44,265 | $17 |
| Monthly Housing Costs | $353 | $0 |
| Real Estate Taxes | - | - |
Property Value by Mortgage Status in Hartford
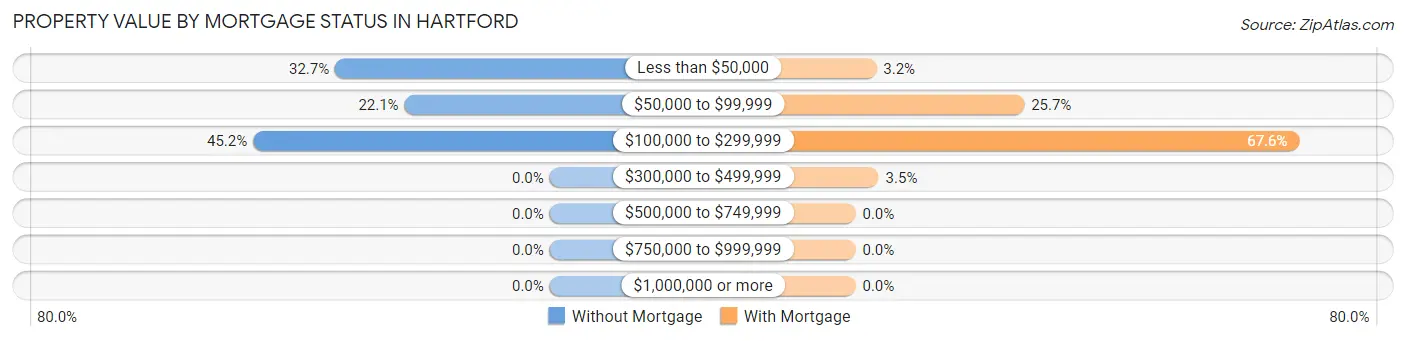
| Property Value | Without Mortgage | With Mortgage |
| Less than $50,000 | 102 (32.7%) | 9 (3.2%) |
| $50,000 to $99,999 | 69 (22.1%) | 73 (25.7%) |
| $100,000 to $299,999 | 141 (45.2%) | 192 (67.6%) |
| $300,000 to $499,999 | 0 (0.0%) | 10 (3.5%) |
| $500,000 to $749,999 | 0 (0.0%) | 0 (0.0%) |
| $750,000 to $999,999 | 0 (0.0%) | 0 (0.0%) |
| $1,000,000 or more | 0 (0.0%) | 0 (0.0%) |
| Total | 312 (100.0%) | 284 (100.0%) |
Household Income by Mortgage Status in Hartford
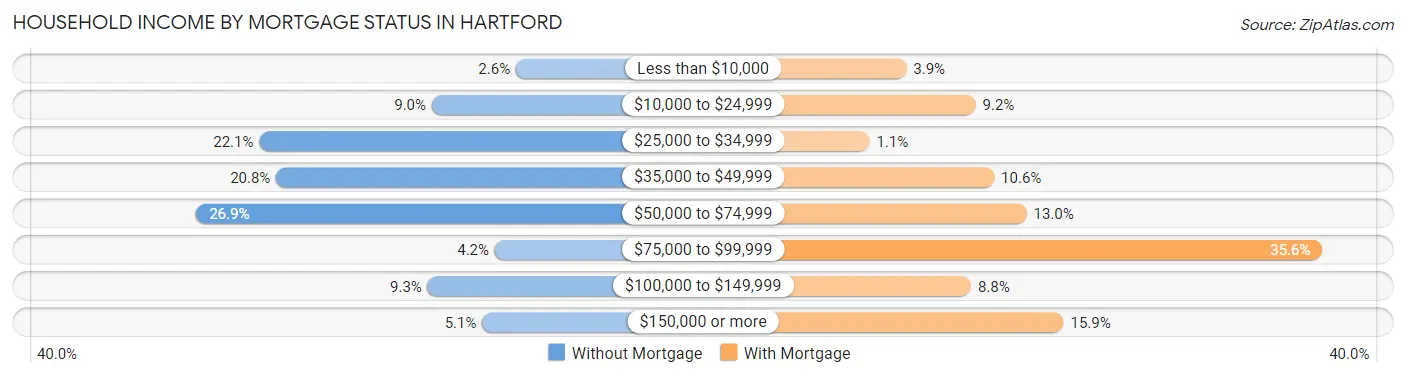
| Household Income | Without Mortgage | With Mortgage |
| Less than $10,000 | 8 (2.6%) | 11 (3.9%) |
| $10,000 to $24,999 | 28 (9.0%) | 26 (9.1%) |
| $25,000 to $34,999 | 69 (22.1%) | 3 (1.1%) |
| $35,000 to $49,999 | 65 (20.8%) | 30 (10.6%) |
| $50,000 to $74,999 | 84 (26.9%) | 37 (13.0%) |
| $75,000 to $99,999 | 13 (4.2%) | 101 (35.6%) |
| $100,000 to $149,999 | 29 (9.3%) | 25 (8.8%) |
| $150,000 or more | 16 (5.1%) | 45 (15.9%) |
| Total | 312 (100.0%) | 284 (100.0%) |
Property Value to Household Income Ratio in Hartford
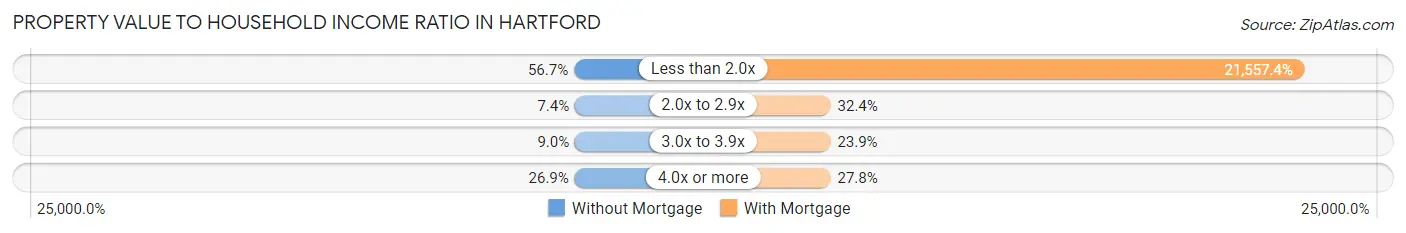
| Value-to-Income Ratio | Without Mortgage | With Mortgage |
| Less than 2.0x | 177 (56.7%) | 61,223 (21,557.4%) |
| 2.0x to 2.9x | 23 (7.4%) | 92 (32.4%) |
| 3.0x to 3.9x | 28 (9.0%) | 68 (23.9%) |
| 4.0x or more | 84 (26.9%) | 79 (27.8%) |
| Total | 312 (100.0%) | 284 (100.0%) |
Real Estate Taxes by Mortgage Status in Hartford
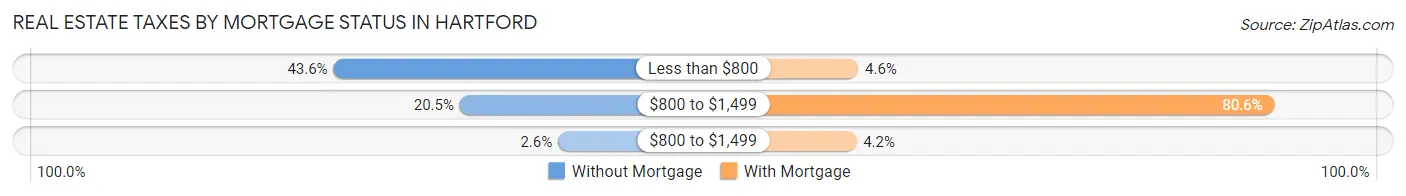
| Property Taxes | Without Mortgage | With Mortgage |
| Less than $800 | 136 (43.6%) | 13 (4.6%) |
| $800 to $1,499 | 64 (20.5%) | 229 (80.6%) |
| $800 to $1,499 | 8 (2.6%) | 12 (4.2%) |
| Total | 312 (100.0%) | 284 (100.0%) |
Health & Disability in Hartford
Health Insurance Coverage by Age in Hartford
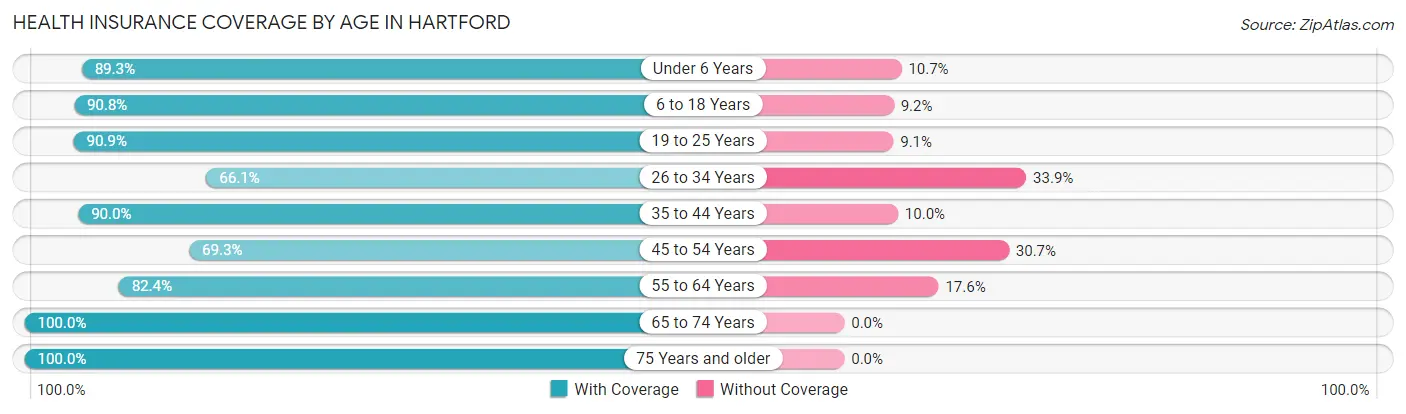
| Age Bracket | With Coverage | Without Coverage |
| Under 6 Years | 243 (89.3%) | 29 (10.7%) |
| 6 to 18 Years | 345 (90.8%) | 35 (9.2%) |
| 19 to 25 Years | 159 (90.9%) | 16 (9.1%) |
| 26 to 34 Years | 191 (66.1%) | 98 (33.9%) |
| 35 to 44 Years | 423 (90.0%) | 47 (10.0%) |
| 45 to 54 Years | 201 (69.3%) | 89 (30.7%) |
| 55 to 64 Years | 216 (82.4%) | 46 (17.6%) |
| 65 to 74 Years | 166 (100.0%) | 0 (0.0%) |
| 75 Years and older | 254 (100.0%) | 0 (0.0%) |
| Total | 2,198 (85.9%) | 360 (14.1%) |
Health Insurance Coverage by Citizenship Status in Hartford
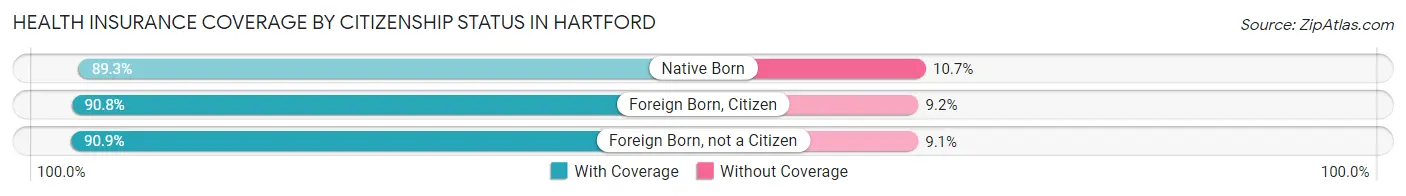
| Citizenship Status | With Coverage | Without Coverage |
| Native Born | 243 (89.3%) | 29 (10.7%) |
| Foreign Born, Citizen | 345 (90.8%) | 35 (9.2%) |
| Foreign Born, not a Citizen | 159 (90.9%) | 16 (9.1%) |
Health Insurance Coverage by Household Income in Hartford
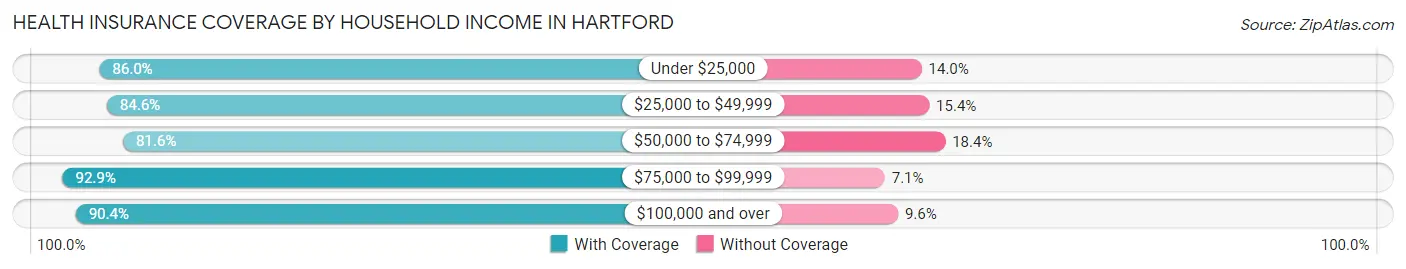
| Household Income | With Coverage | Without Coverage |
| Under $25,000 | 233 (86.0%) | 38 (14.0%) |
| $25,000 to $49,999 | 718 (84.6%) | 131 (15.4%) |
| $50,000 to $74,999 | 566 (81.6%) | 128 (18.4%) |
| $75,000 to $99,999 | 313 (92.9%) | 24 (7.1%) |
| $100,000 and over | 368 (90.4%) | 39 (9.6%) |
Public vs Private Health Insurance Coverage by Age in Hartford
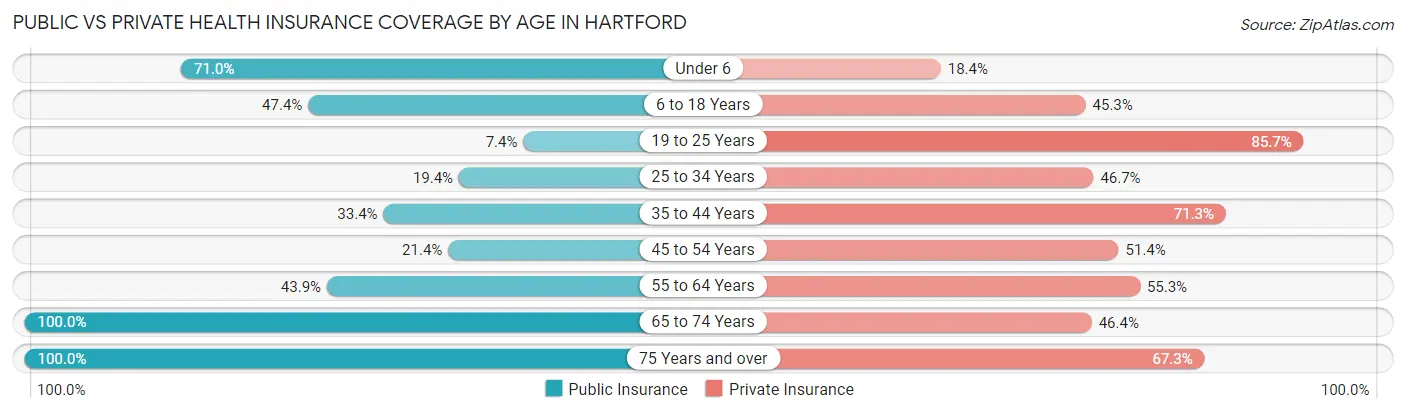
| Age Bracket | Public Insurance | Private Insurance |
| Under 6 | 193 (71.0%) | 50 (18.4%) |
| 6 to 18 Years | 180 (47.4%) | 172 (45.3%) |
| 19 to 25 Years | 13 (7.4%) | 150 (85.7%) |
| 25 to 34 Years | 56 (19.4%) | 135 (46.7%) |
| 35 to 44 Years | 157 (33.4%) | 335 (71.3%) |
| 45 to 54 Years | 62 (21.4%) | 149 (51.4%) |
| 55 to 64 Years | 115 (43.9%) | 145 (55.3%) |
| 65 to 74 Years | 166 (100.0%) | 77 (46.4%) |
| 75 Years and over | 254 (100.0%) | 171 (67.3%) |
| Total | 1,196 (46.8%) | 1,384 (54.1%) |
Disability Status by Sex by Age in Hartford
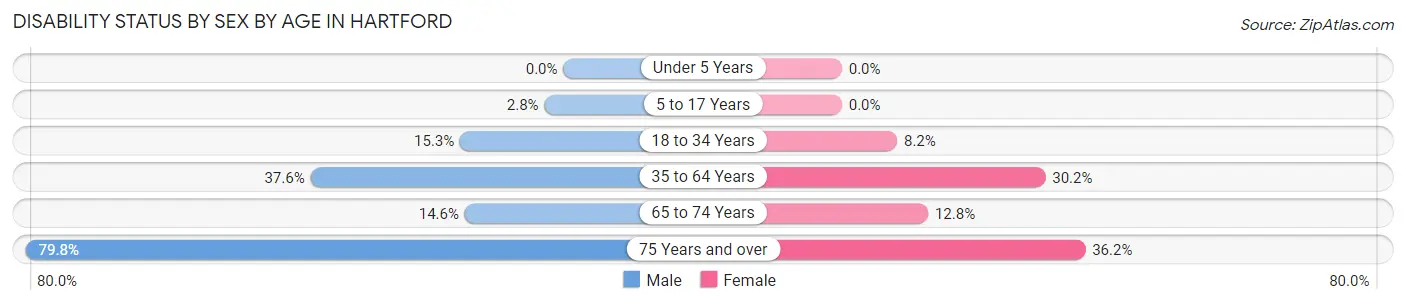
| Age Bracket | Male | Female |
| Under 5 Years | 0 (0.0%) | 0 (0.0%) |
| 5 to 17 Years | 7 (2.8%) | 0 (0.0%) |
| 18 to 34 Years | 44 (15.3%) | 15 (8.2%) |
| 35 to 64 Years | 175 (37.6%) | 168 (30.2%) |
| 65 to 74 Years | 6 (14.6%) | 16 (12.8%) |
| 75 Years and over | 99 (79.8%) | 47 (36.1%) |
Disability Class by Sex by Age in Hartford
Disability Class: Hearing Difficulty
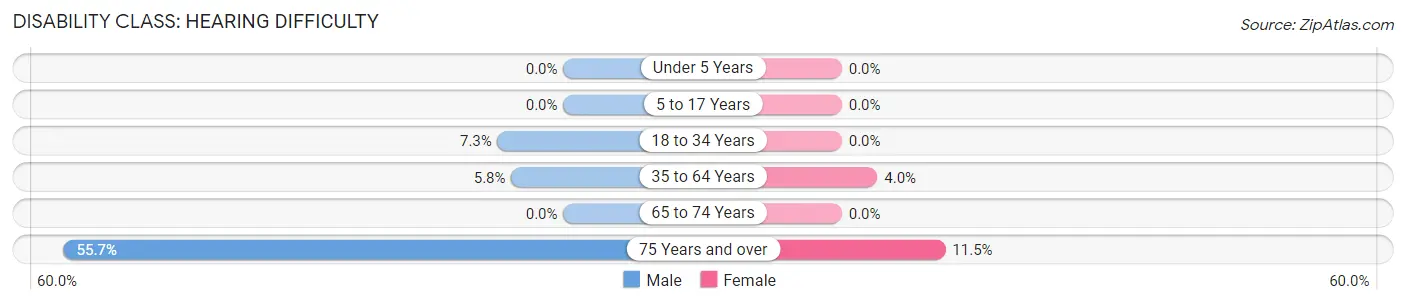
| Age Bracket | Male | Female |
| Under 5 Years | 0 (0.0%) | 0 (0.0%) |
| 5 to 17 Years | 0 (0.0%) | 0 (0.0%) |
| 18 to 34 Years | 21 (7.3%) | 0 (0.0%) |
| 35 to 64 Years | 27 (5.8%) | 22 (4.0%) |
| 65 to 74 Years | 0 (0.0%) | 0 (0.0%) |
| 75 Years and over | 69 (55.6%) | 15 (11.5%) |
Disability Class: Vision Difficulty
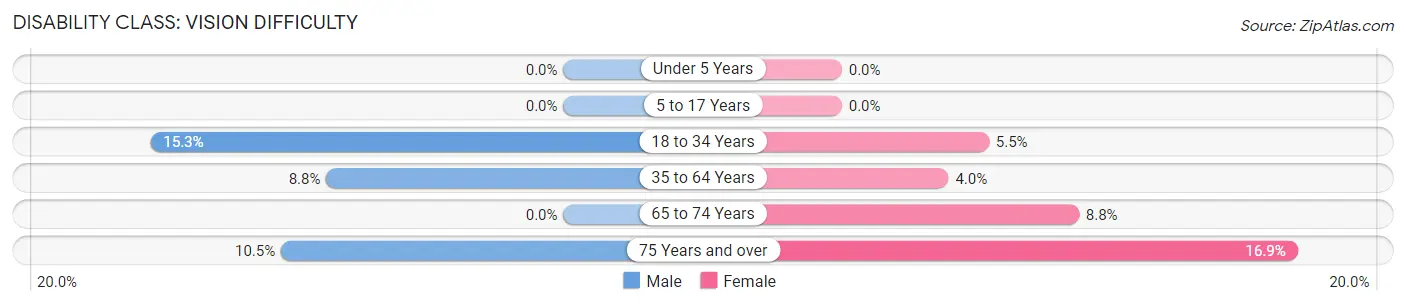
| Age Bracket | Male | Female |
| Under 5 Years | 0 (0.0%) | 0 (0.0%) |
| 5 to 17 Years | 0 (0.0%) | 0 (0.0%) |
| 18 to 34 Years | 44 (15.3%) | 10 (5.5%) |
| 35 to 64 Years | 41 (8.8%) | 22 (4.0%) |
| 65 to 74 Years | 0 (0.0%) | 11 (8.8%) |
| 75 Years and over | 13 (10.5%) | 22 (16.9%) |
Disability Class: Cognitive Difficulty
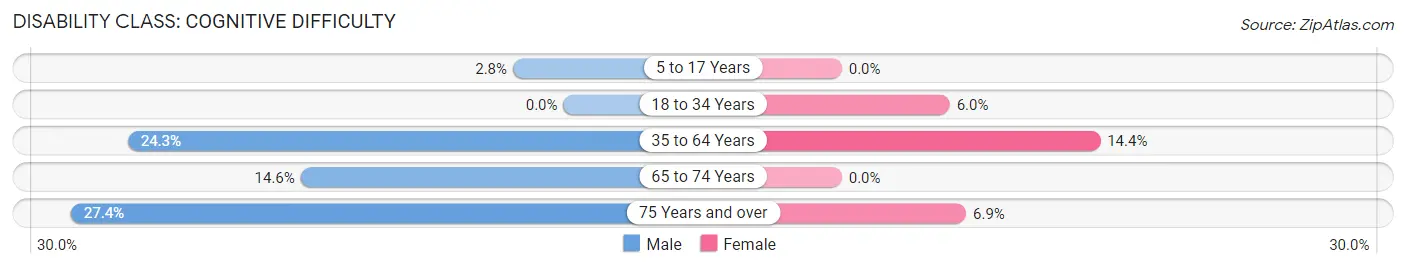
| Age Bracket | Male | Female |
| 5 to 17 Years | 7 (2.8%) | 0 (0.0%) |
| 18 to 34 Years | 0 (0.0%) | 11 (6.0%) |
| 35 to 64 Years | 113 (24.2%) | 80 (14.4%) |
| 65 to 74 Years | 6 (14.6%) | 0 (0.0%) |
| 75 Years and over | 34 (27.4%) | 9 (6.9%) |
Disability Class: Ambulatory Difficulty
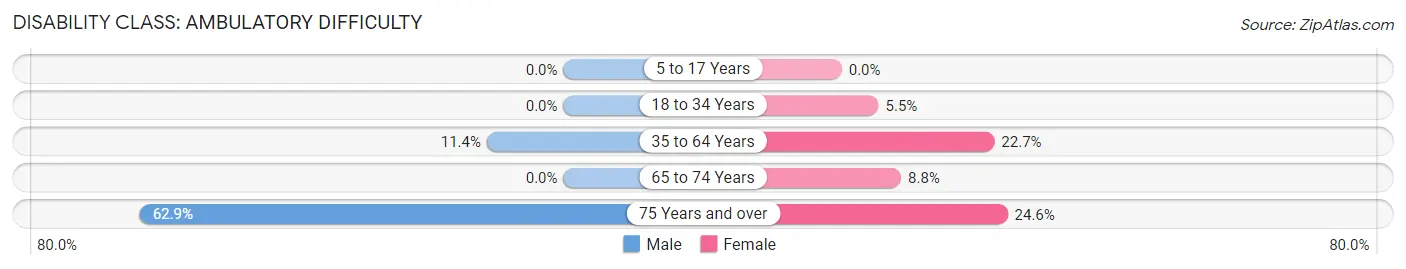
| Age Bracket | Male | Female |
| 5 to 17 Years | 0 (0.0%) | 0 (0.0%) |
| 18 to 34 Years | 0 (0.0%) | 10 (5.5%) |
| 35 to 64 Years | 53 (11.4%) | 126 (22.7%) |
| 65 to 74 Years | 0 (0.0%) | 11 (8.8%) |
| 75 Years and over | 78 (62.9%) | 32 (24.6%) |
Disability Class: Self-Care Difficulty
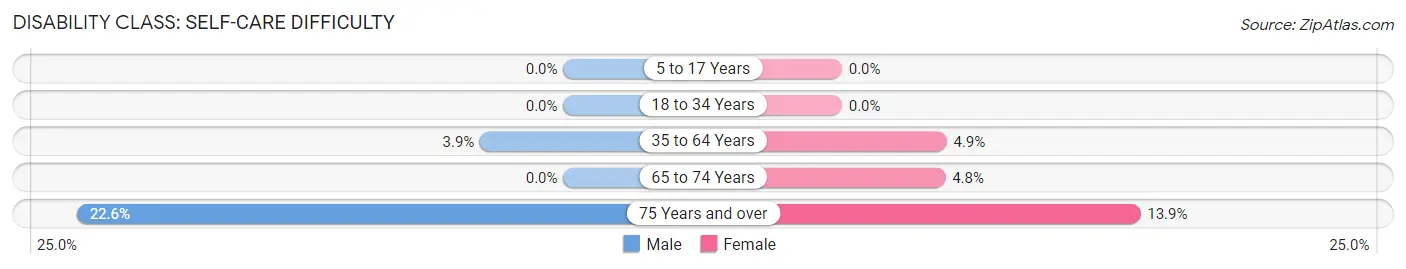
| Age Bracket | Male | Female |
| 5 to 17 Years | 0 (0.0%) | 0 (0.0%) |
| 18 to 34 Years | 0 (0.0%) | 0 (0.0%) |
| 35 to 64 Years | 18 (3.9%) | 27 (4.9%) |
| 65 to 74 Years | 0 (0.0%) | 6 (4.8%) |
| 75 Years and over | 28 (22.6%) | 18 (13.9%) |
Technology Access in Hartford
Computing Device Access in Hartford
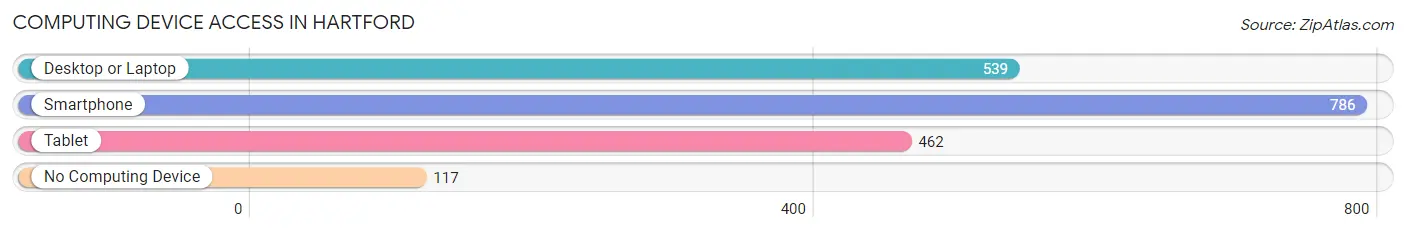
| Device Type | # Households | % Households |
| Desktop or Laptop | 539 | 55.3% |
| Smartphone | 786 | 80.6% |
| Tablet | 462 | 47.4% |
| No Computing Device | 117 | 12.0% |
| Total | 975 | 100.0% |
Internet Access in Hartford
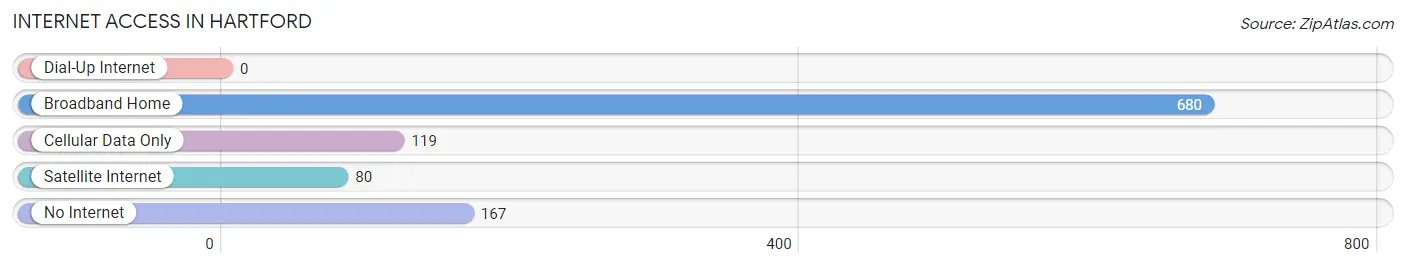
| Internet Type | # Households | % Households |
| Dial-Up Internet | 0 | 0.0% |
| Broadband Home | 680 | 69.7% |
| Cellular Data Only | 119 | 12.2% |
| Satellite Internet | 80 | 8.2% |
| No Internet | 167 | 17.1% |
| Total | 975 | 100.0% |
Hartford Summary
Hartford, Alabama is a small town located in Geneva County in the southeastern part of the state. It is situated on the banks of the Choctawhatchee River, and is part of the Dothan Metropolitan Statistical Area. The town has a population of approximately 1,500 people, and is known for its rural charm and friendly atmosphere.
History
Hartford was founded in 1836 by settlers from Georgia and South Carolina. The town was named after Hartford, Connecticut, and was originally known as Hartford Station. The town was incorporated in 1887, and the first mayor was elected in 1888.
In the late 19th century, Hartford was a thriving agricultural center, with cotton, corn, and peanuts being the main crops. The town also had a thriving lumber industry, and several sawmills were located in the area.
In the early 20th century, Hartford experienced a period of growth and prosperity. The town was home to several businesses, including a cotton gin, a grist mill, a sawmill, and a brick factory. The town also had a railroad station, which connected Hartford to other towns in the area.
Geography
Hartford is located in southeastern Alabama, in Geneva County. The town is situated on the banks of the Choctawhatchee River, and is part of the Dothan Metropolitan Statistical Area. The town has a total area of 2.2 square miles, all of which is land.
The climate in Hartford is humid subtropical, with hot, humid summers and mild winters. The average annual temperature is around 68 degrees Fahrenheit, and the average annual precipitation is around 50 inches.
Economy
The economy of Hartford is largely based on agriculture. The town is home to several farms, which produce cotton, corn, peanuts, and other crops. The town also has a thriving lumber industry, and several sawmills are located in the area.
In addition to agriculture, Hartford is home to several small businesses, including restaurants, retail stores, and service providers. The town also has a few manufacturing companies, which produce a variety of products, including furniture, clothing, and electronics.
Demographics
As of the 2010 census, the population of Hartford was 1,500. The racial makeup of the town was 79.2% White, 17.7% African American, 0.7% Native American, 0.3% Asian, 0.1% Pacific Islander, and 1.9% from other races. The median household income was $30,000, and the median family income was $35,000.
The town is served by the Geneva County School District, which includes two elementary schools, one middle school, and one high school. The town also has a public library, which offers a variety of services, including books, magazines, and internet access.
Common Questions
What is Per Capita Income in Hartford?
Per Capita income in Hartford is $22,852.
What is the Median Family Income in Hartford?
Median Family Income in Hartford is $60,080.
What is the Median Household income in Hartford?
Median Household Income in Hartford is $44,977.
What is Income or Wage Gap in Hartford?
Income or Wage Gap in Hartford is 8.9%.
Women in Hartford earn 91.1 cents for every dollar earned by a man.
What is Inequality or Gini Index in Hartford?
Inequality or Gini Index in Hartford is 0.40.
What is the Total Population of Hartford?
Total Population of Hartford is 2,660.
What is the Total Male Population of Hartford?
Total Male Population of Hartford is 1,272.
What is the Total Female Population of Hartford?
Total Female Population of Hartford is 1,388.
What is the Ratio of Males per 100 Females in Hartford?
There are 91.64 Males per 100 Females in Hartford.
What is the Ratio of Females per 100 Males in Hartford?
There are 109.12 Females per 100 Males in Hartford.
What is the Median Population Age in Hartford?
Median Population Age in Hartford is 39.1 Years.
What is the Average Family Size in Hartford
Average Family Size in Hartford is 3.1 People.
What is the Average Household Size in Hartford
Average Household Size in Hartford is 2.6 People.
How Large is the Labor Force in Hartford?
There are 1,043 People in the Labor Forcein in Hartford.
What is the Percentage of People in the Labor Force in Hartford?
51.3% of People are in the Labor Force in Hartford.
What is the Unemployment Rate in Hartford?
Unemployment Rate in Hartford is 0.6%.