Gulf Shores, AL Map & Demographics
Gulf Shores Map
Gulf Shores Overview
$41,513
PER CAPITA INCOME
$86,892
AVG FAMILY INCOME
$62,021
AVG HOUSEHOLD INCOME
34.8%
WAGE / INCOME GAP [ % ]
65.2¢/ $1
WAGE / INCOME GAP [ $ ]
0.45
INEQUALITY / GINI INDEX
15,178
TOTAL POPULATION
6,699
MALE POPULATION
8,479
FEMALE POPULATION
79.01
MALES / 100 FEMALES
126.57
FEMALES / 100 MALES
50.4
MEDIAN AGE
2.8
AVG FAMILY SIZE
2.2
AVG HOUSEHOLD SIZE
8,157
LABOR FORCE [ PEOPLE ]
60.5%
PERCENT IN LABOR FORCE
2.4%
UNEMPLOYMENT RATE
Gulf Shores Zip Codes
Gulf Shores Area Codes
Income in Gulf Shores
Income Overview in Gulf Shores
Per Capita Income in Gulf Shores is $41,513, while median incomes of families and households are $86,892 and $62,021 respectively.
| Characteristic | Number | Measure |
| Per Capita Income | 15,178 | $41,513 |
| Median Family Income | 4,178 | $86,892 |
| Mean Family Income | 4,178 | $109,499 |
| Median Household Income | 6,981 | $62,021 |
| Mean Household Income | 6,981 | $86,592 |
| Income Deficit | 4,178 | $0 |
| Wage / Income Gap (%) | 15,178 | 34.75% |
| Wage / Income Gap ($) | 15,178 | 65.25¢ per $1 |
| Gini / Inequality Index | 15,178 | 0.45 |
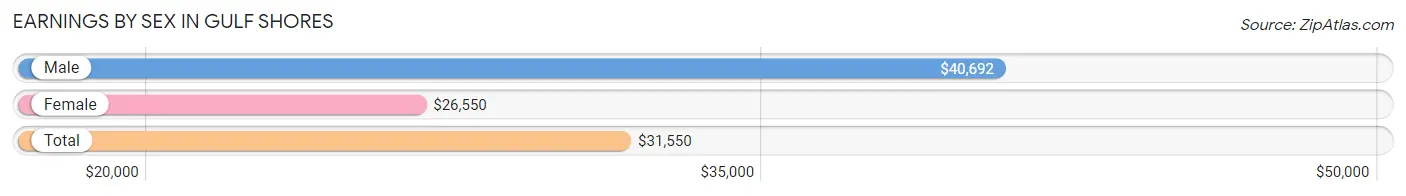
Earnings by Sex in Gulf Shores
Average Earnings in Gulf Shores are $31,550, $40,692 for men and $26,550 for women, a difference of 34.7%.
| Sex | Number | Average Earnings |
| Male | 3,879 (44.8%) | $40,692 |
| Female | 4,789 (55.2%) | $26,550 |
| Total | 8,668 (100.0%) | $31,550 |
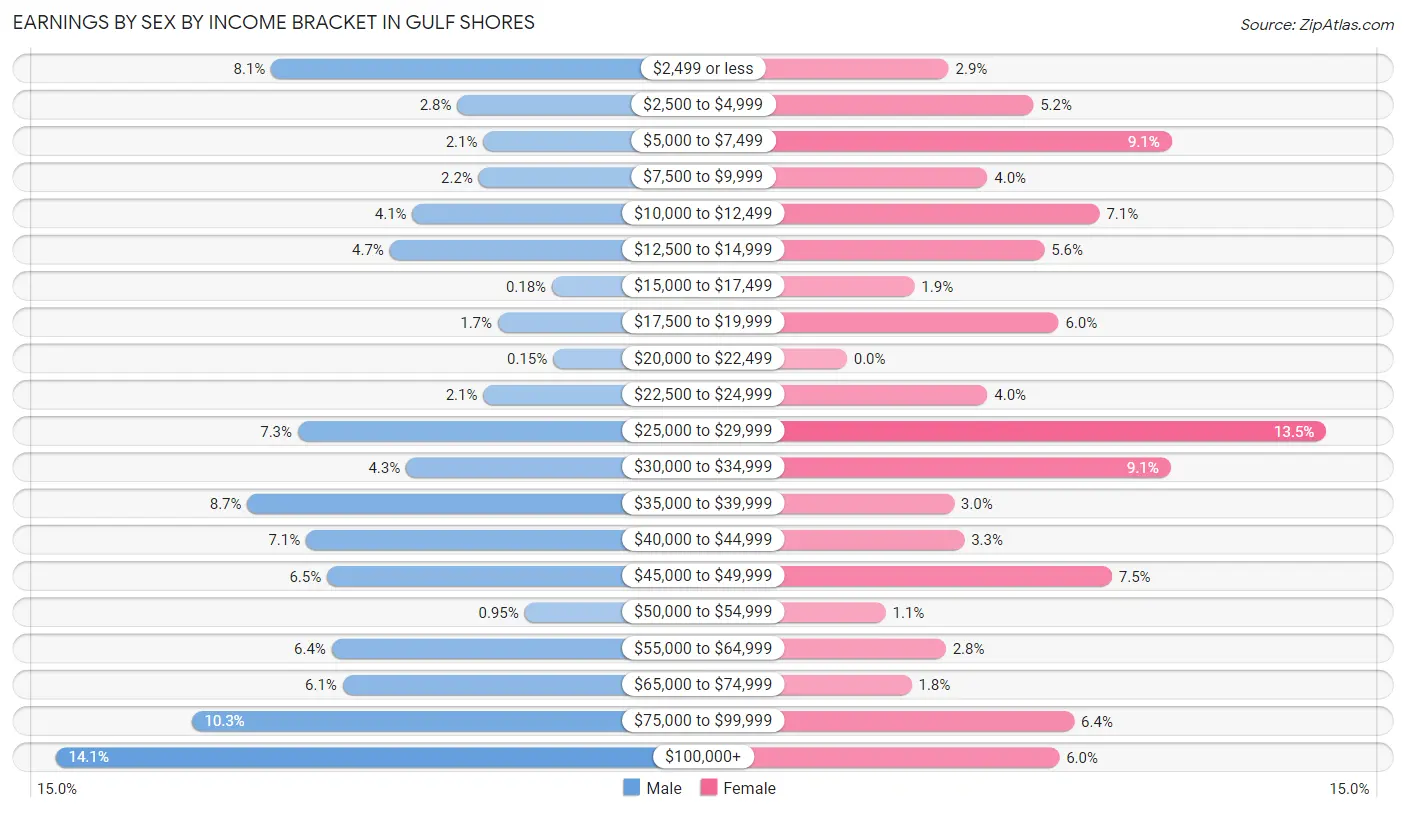
Earnings by Sex by Income Bracket in Gulf Shores
The most common earnings brackets in Gulf Shores are $100,000+ for men (548 | 14.1%) and $25,000 to $29,999 for women (645 | 13.5%).
| Income | Male | Female |
| $2,499 or less | 313 (8.1%) | 137 (2.9%) |
| $2,500 to $4,999 | 110 (2.8%) | 251 (5.2%) |
| $5,000 to $7,499 | 82 (2.1%) | 437 (9.1%) |
| $7,500 to $9,999 | 87 (2.2%) | 189 (4.0%) |
| $10,000 to $12,499 | 159 (4.1%) | 340 (7.1%) |
| $12,500 to $14,999 | 184 (4.7%) | 266 (5.6%) |
| $15,000 to $17,499 | 7 (0.2%) | 91 (1.9%) |
| $17,500 to $19,999 | 66 (1.7%) | 285 (5.9%) |
| $20,000 to $22,499 | 6 (0.2%) | 0 (0.0%) |
| $22,500 to $24,999 | 82 (2.1%) | 189 (4.0%) |
| $25,000 to $29,999 | 284 (7.3%) | 645 (13.5%) |
| $30,000 to $34,999 | 166 (4.3%) | 436 (9.1%) |
| $35,000 to $39,999 | 339 (8.7%) | 144 (3.0%) |
| $40,000 to $44,999 | 275 (7.1%) | 158 (3.3%) |
| $45,000 to $49,999 | 252 (6.5%) | 357 (7.4%) |
| $50,000 to $54,999 | 37 (0.9%) | 52 (1.1%) |
| $55,000 to $64,999 | 247 (6.4%) | 133 (2.8%) |
| $65,000 to $74,999 | 235 (6.1%) | 87 (1.8%) |
| $75,000 to $99,999 | 400 (10.3%) | 306 (6.4%) |
| $100,000+ | 548 (14.1%) | 286 (6.0%) |
| Total | 3,879 (100.0%) | 4,789 (100.0%) |
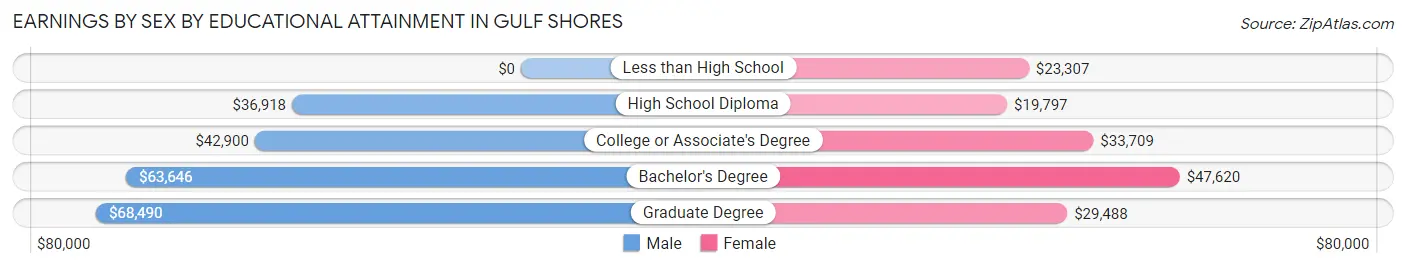
Earnings by Sex by Educational Attainment in Gulf Shores
Average earnings in Gulf Shores are $44,439 for men and $29,976 for women, a difference of 32.6%. Men with an educational attainment of graduate degree enjoy the highest average annual earnings of $68,490, while those with high school diploma education earn the least with $36,918. Women with an educational attainment of bachelor's degree earn the most with the average annual earnings of $47,620, while those with high school diploma education have the smallest earnings of $19,797.
| Educational Attainment | Male Income | Female Income |
| Less than High School | - | - |
| High School Diploma | $36,918 | $19,797 |
| College or Associate's Degree | $42,900 | $33,709 |
| Bachelor's Degree | $63,646 | $47,620 |
| Graduate Degree | $68,490 | $29,488 |
| Total | $44,439 | $29,976 |
Family Income in Gulf Shores
Family Income Brackets in Gulf Shores
According to the Gulf Shores family income data, there are 752 families falling into the $75,000 to $99,999 income range, which is the most common income bracket and makes up 18.0% of all families. Conversely, the less than $10,000 income bracket is the least frequent group with only 117 families (2.8%) belonging to this category.
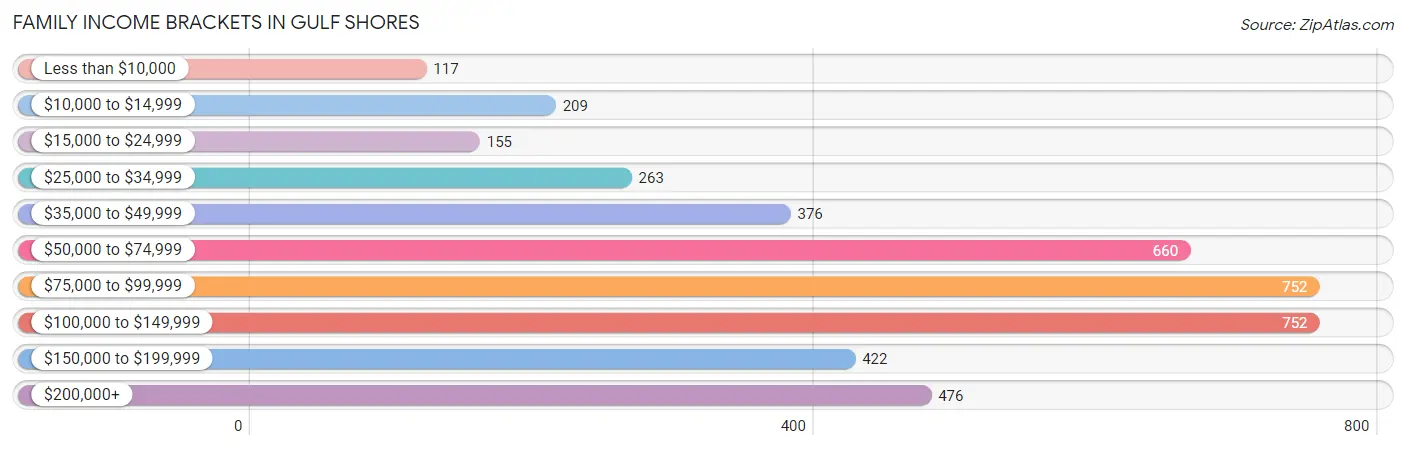
| Income Bracket | # Families | % Families |
| Less than $10,000 | 117 | 2.8% |
| $10,000 to $14,999 | 209 | 5.0% |
| $15,000 to $24,999 | 155 | 3.7% |
| $25,000 to $34,999 | 263 | 6.3% |
| $35,000 to $49,999 | 376 | 9.0% |
| $50,000 to $74,999 | 660 | 15.8% |
| $75,000 to $99,999 | 752 | 18.0% |
| $100,000 to $149,999 | 752 | 18.0% |
| $150,000 to $199,999 | 422 | 10.1% |
| $200,000+ | 476 | 11.4% |
Family Income by Famaliy Size in Gulf Shores
4-person families (337 | 8.1%) account for the highest median family income in Gulf Shores with $173,068 per family, while 4-person families (337 | 8.1%) have the highest median income of $43,267 per family member.
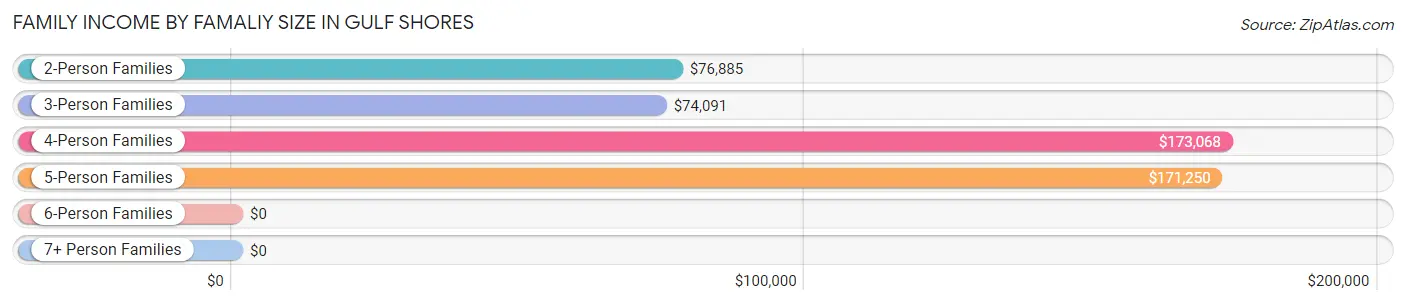
| Income Bracket | # Families | Median Income |
| 2-Person Families | 2,647 (63.4%) | $76,885 |
| 3-Person Families | 922 (22.1%) | $74,091 |
| 4-Person Families | 337 (8.1%) | $173,068 |
| 5-Person Families | 176 (4.2%) | $171,250 |
| 6-Person Families | 96 (2.3%) | $0 |
| 7+ Person Families | 0 (0.0%) | $0 |
| Total | 4,178 (100.0%) | $86,892 |
Family Income by Number of Earners in Gulf Shores
The median family income in Gulf Shores is $86,892, with families comprising 3+ earners (482) having the highest median family income of $131,218, while families with 1 earner (1,501) have the lowest median family income of $60,819, accounting for 11.5% and 35.9% of families, respectively.
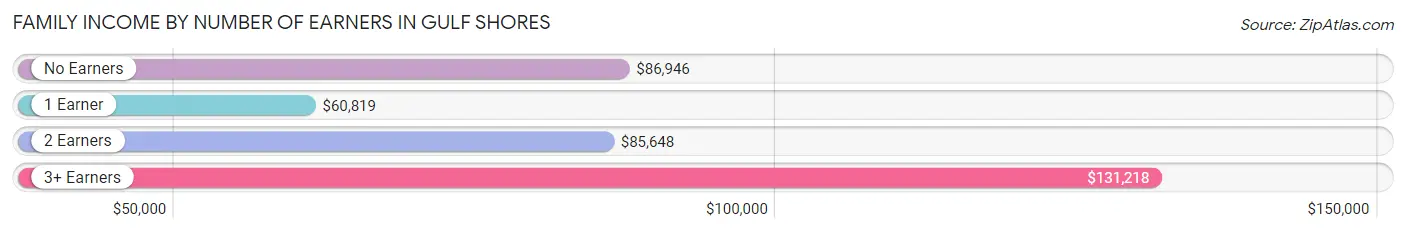
| Number of Earners | # Families | Median Income |
| No Earners | 839 (20.1%) | $86,946 |
| 1 Earner | 1,501 (35.9%) | $60,819 |
| 2 Earners | 1,356 (32.5%) | $85,648 |
| 3+ Earners | 482 (11.5%) | $131,218 |
| Total | 4,178 (100.0%) | $86,892 |
Household Income in Gulf Shores
Household Income Brackets in Gulf Shores
With 1,194 households falling in the category, the $50,000 to $74,999 income range is the most frequent in Gulf Shores, accounting for 17.1% of all households. In contrast, only 147 households (2.1%) fall into the less than $10,000 income bracket, making it the least populous group.
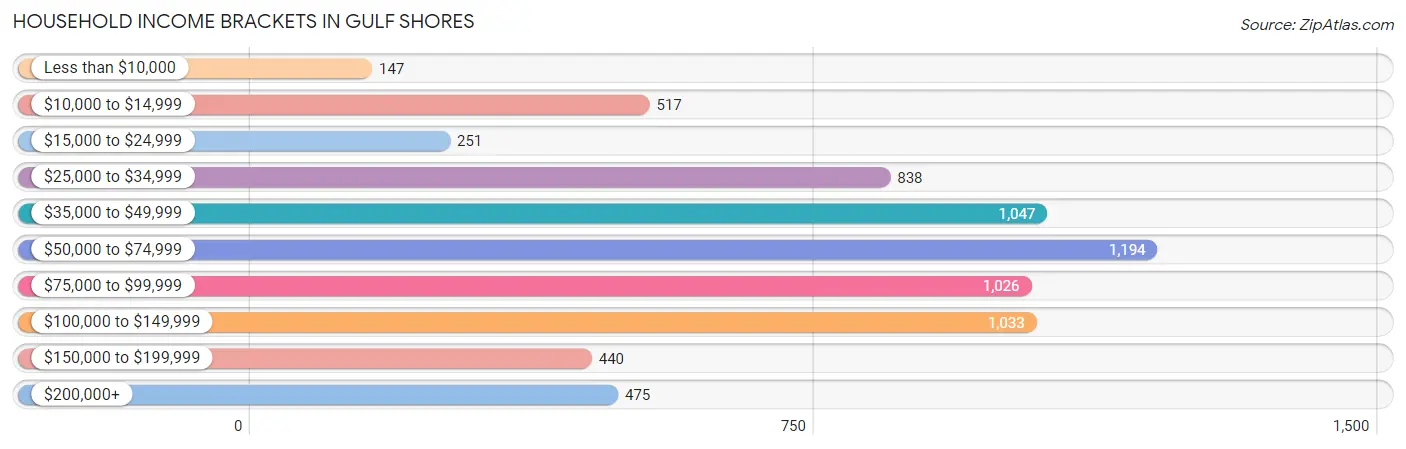
| Income Bracket | # Households | % Households |
| Less than $10,000 | 147 | 2.1% |
| $10,000 to $14,999 | 517 | 7.4% |
| $15,000 to $24,999 | 251 | 3.6% |
| $25,000 to $34,999 | 838 | 12.0% |
| $35,000 to $49,999 | 1,047 | 15.0% |
| $50,000 to $74,999 | 1,194 | 17.1% |
| $75,000 to $99,999 | 1,026 | 14.7% |
| $100,000 to $149,999 | 1,033 | 14.8% |
| $150,000 to $199,999 | 440 | 6.3% |
| $200,000+ | 475 | 6.8% |
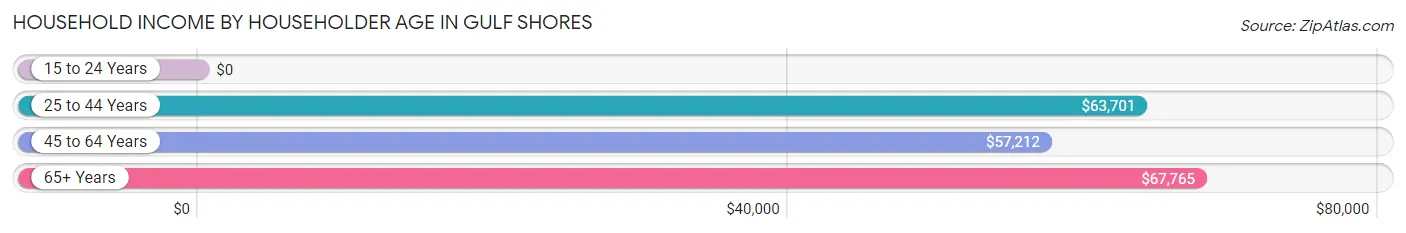
Household Income by Householder Age in Gulf Shores
The median household income in Gulf Shores is $62,021, with the highest median household income of $67,765 found in the 65+ years age bracket for the primary householder. A total of 2,331 households (33.4%) fall into this category. Meanwhile, the 15 to 24 years age bracket for the primary householder has the lowest median household income of $0, with 75 households (1.1%) in this group.
| Income Bracket | # Households | Median Income |
| 15 to 24 Years | 75 (1.1%) | $0 |
| 25 to 44 Years | 1,743 (25.0%) | $63,701 |
| 45 to 64 Years | 2,832 (40.6%) | $57,212 |
| 65+ Years | 2,331 (33.4%) | $67,765 |
| Total | 6,981 (100.0%) | $62,021 |
Poverty in Gulf Shores
Income Below Poverty by Sex and Age in Gulf Shores
With 8.2% poverty level for males and 9.0% for females among the residents of Gulf Shores, 25 to 34 year old males and 15 year old females are the most vulnerable to poverty, with 132 males (23.9%) and 21 females (100.0%) in their respective age groups living below the poverty level.
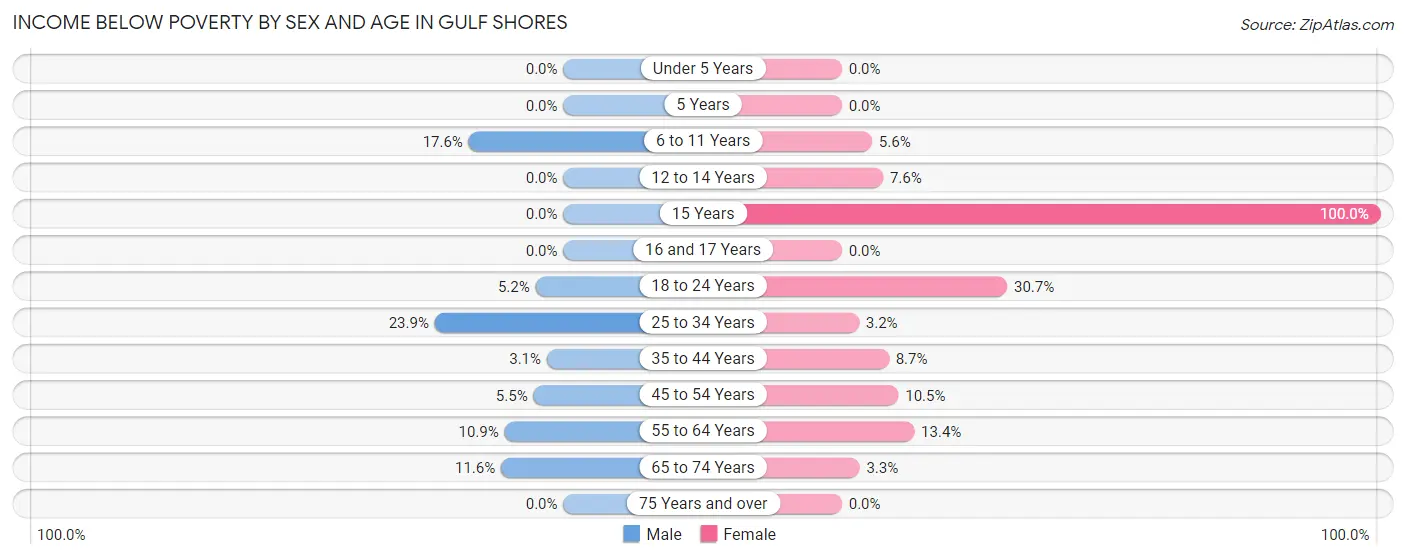
| Age Bracket | Male | Female |
| Under 5 Years | 0 (0.0%) | 0 (0.0%) |
| 5 Years | 0 (0.0%) | 0 (0.0%) |
| 6 to 11 Years | 55 (17.6%) | 20 (5.6%) |
| 12 to 14 Years | 0 (0.0%) | 22 (7.6%) |
| 15 Years | 0 (0.0%) | 21 (100.0%) |
| 16 and 17 Years | 0 (0.0%) | 0 (0.0%) |
| 18 to 24 Years | 16 (5.2%) | 231 (30.7%) |
| 25 to 34 Years | 132 (23.9%) | 31 (3.2%) |
| 35 to 44 Years | 24 (3.1%) | 92 (8.7%) |
| 45 to 54 Years | 61 (5.5%) | 122 (10.5%) |
| 55 to 64 Years | 101 (10.9%) | 179 (13.4%) |
| 65 to 74 Years | 161 (11.6%) | 43 (3.3%) |
| 75 Years and over | 0 (0.0%) | 0 (0.0%) |
| Total | 550 (8.2%) | 761 (9.0%) |
Income Above Poverty by Sex and Age in Gulf Shores
According to the poverty statistics in Gulf Shores, males aged under 5 years and females aged under 5 years are the age groups that are most secure financially, with 100.0% of males and 100.0% of females in these age groups living above the poverty line.
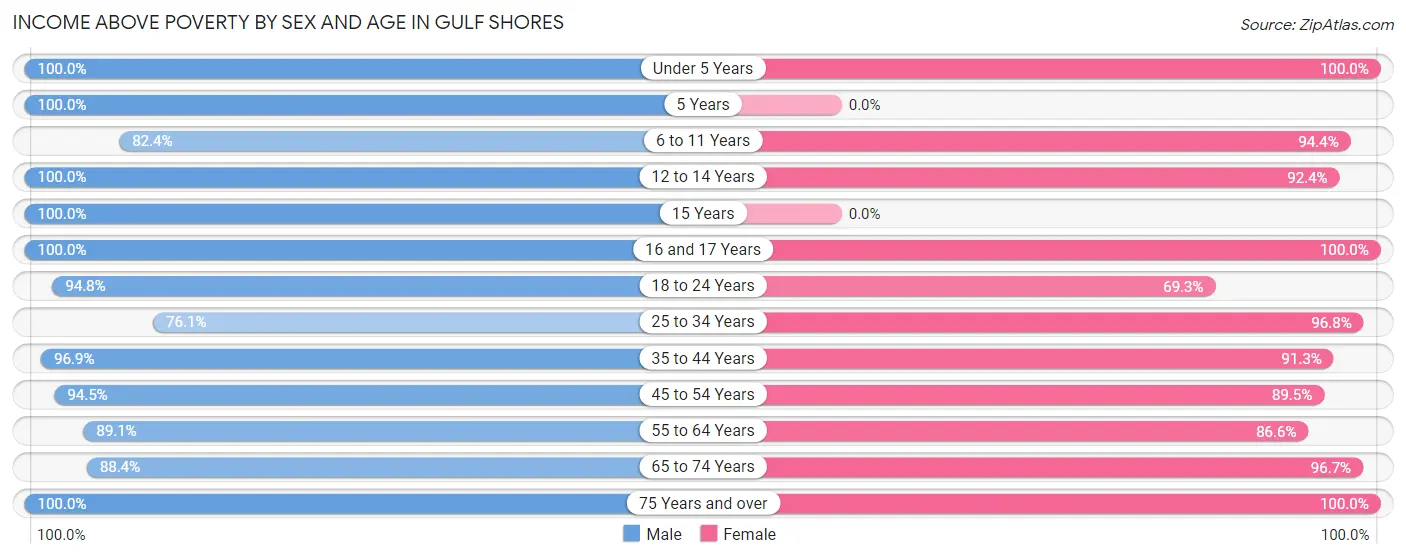
| Age Bracket | Male | Female |
| Under 5 Years | 100 (100.0%) | 134 (100.0%) |
| 5 Years | 15 (100.0%) | 0 (0.0%) |
| 6 to 11 Years | 258 (82.4%) | 338 (94.4%) |
| 12 to 14 Years | 321 (100.0%) | 266 (92.4%) |
| 15 Years | 145 (100.0%) | 0 (0.0%) |
| 16 and 17 Years | 190 (100.0%) | 291 (100.0%) |
| 18 to 24 Years | 294 (94.8%) | 522 (69.3%) |
| 25 to 34 Years | 421 (76.1%) | 946 (96.8%) |
| 35 to 44 Years | 761 (96.9%) | 964 (91.3%) |
| 45 to 54 Years | 1,040 (94.5%) | 1,041 (89.5%) |
| 55 to 64 Years | 824 (89.1%) | 1,154 (86.6%) |
| 65 to 74 Years | 1,232 (88.4%) | 1,268 (96.7%) |
| 75 Years and over | 525 (100.0%) | 792 (100.0%) |
| Total | 6,126 (91.8%) | 7,716 (91.0%) |
Income Below Poverty Among Married-Couple Families in Gulf Shores
The poverty statistics for married-couple families in Gulf Shores show that 3.8% or 121 of the total 3,155 families live below the poverty line. Families with no children have the highest poverty rate of 5.0%, comprising of 114 families. On the other hand, families with 3 or 4 children have the lowest poverty rate of 0.0%, which includes 0 families.
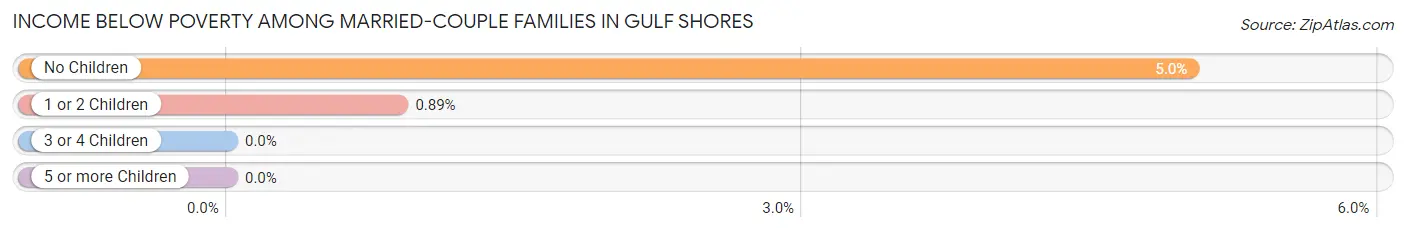
| Children | Above Poverty | Below Poverty |
| No Children | 2,158 (95.0%) | 114 (5.0%) |
| 1 or 2 Children | 782 (99.1%) | 7 (0.9%) |
| 3 or 4 Children | 94 (100.0%) | 0 (0.0%) |
| 5 or more Children | 0 (0.0%) | 0 (0.0%) |
| Total | 3,034 (96.2%) | 121 (3.8%) |
Income Below Poverty Among Single-Parent Households in Gulf Shores
According to the poverty data in Gulf Shores, 17.0% or 24 single-father households and 20.3% or 179 single-mother households are living below the poverty line. Among single-father households, those with 1 or 2 children have the highest poverty rate, with 24 households (17.0%) experiencing poverty. Likewise, among single-mother households, those with no children have the highest poverty rate, with 115 households (28.7%) falling below the poverty line.
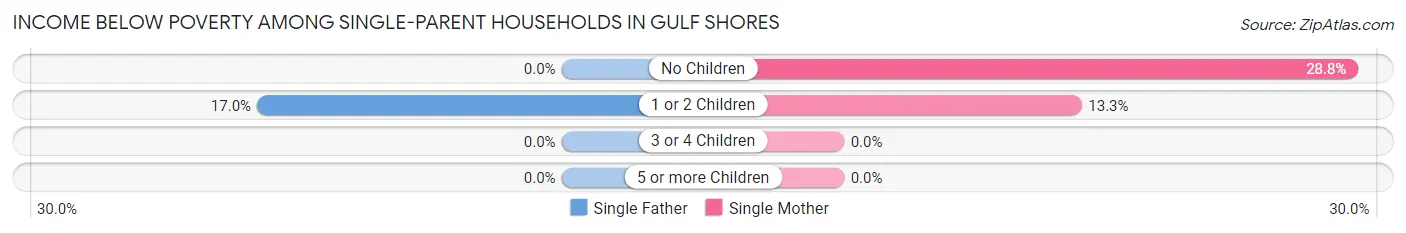
| Children | Single Father | Single Mother |
| No Children | 0 (0.0%) | 115 (28.7%) |
| 1 or 2 Children | 24 (17.0%) | 64 (13.3%) |
| 3 or 4 Children | 0 (0.0%) | 0 (0.0%) |
| 5 or more Children | 0 (0.0%) | 0 (0.0%) |
| Total | 24 (17.0%) | 179 (20.3%) |
Income Below Poverty Among Married-Couple vs Single-Parent Households in Gulf Shores
The poverty data for Gulf Shores shows that 121 of the married-couple family households (3.8%) and 203 of the single-parent households (19.8%) are living below the poverty level. Within the married-couple family households, those with no children have the highest poverty rate, with 114 households (5.0%) falling below the poverty line. Among the single-parent households, those with no children have the highest poverty rate, with 115 household (28.7%) living below poverty.
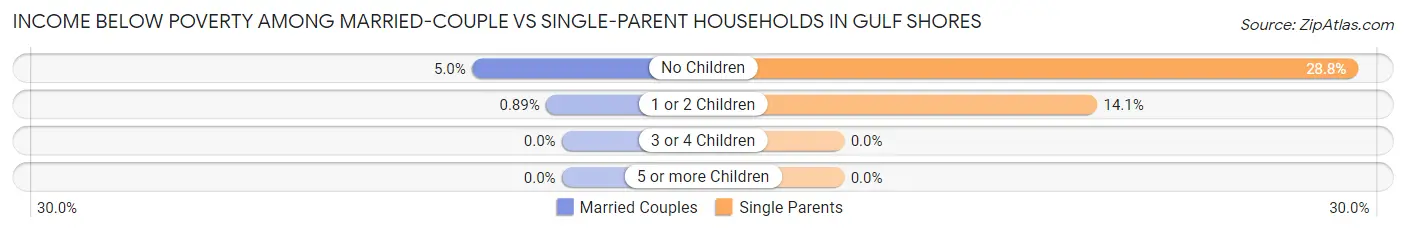
| Children | Married-Couple Families | Single-Parent Households |
| No Children | 114 (5.0%) | 115 (28.7%) |
| 1 or 2 Children | 7 (0.9%) | 88 (14.1%) |
| 3 or 4 Children | 0 (0.0%) | 0 (0.0%) |
| 5 or more Children | 0 (0.0%) | 0 (0.0%) |
| Total | 121 (3.8%) | 203 (19.8%) |
Race in Gulf Shores
The most populous races in Gulf Shores are White / Caucasian (14,055 | 92.6%), Hispanic or Latino (719 | 4.7%), and Black / African American (357 | 2.4%).
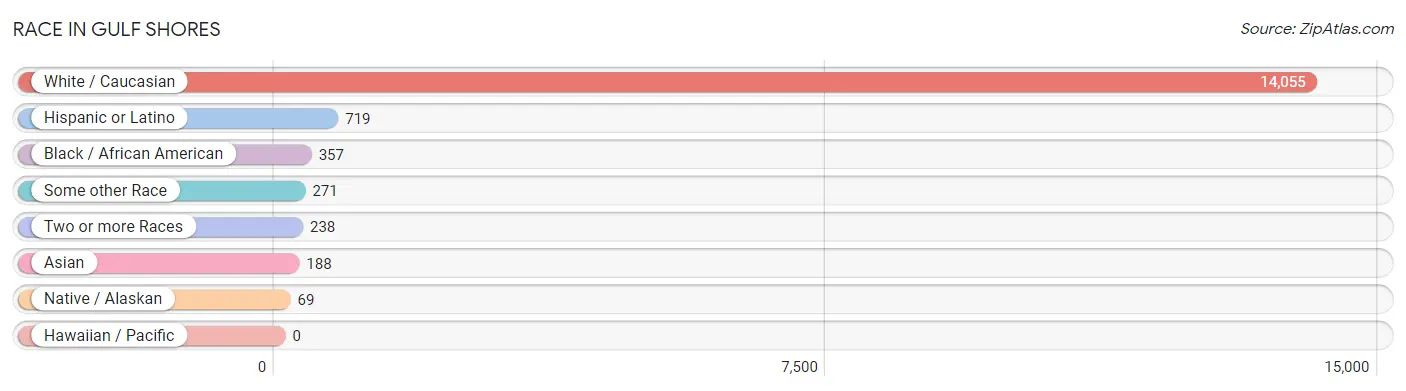
| Race | # Population | % Population |
| Asian | 188 | 1.2% |
| Black / African American | 357 | 2.4% |
| Hawaiian / Pacific | 0 | 0.0% |
| Hispanic or Latino | 719 | 4.7% |
| Native / Alaskan | 69 | 0.4% |
| White / Caucasian | 14,055 | 92.6% |
| Two or more Races | 238 | 1.6% |
| Some other Race | 271 | 1.8% |
| Total | 15,178 | 100.0% |
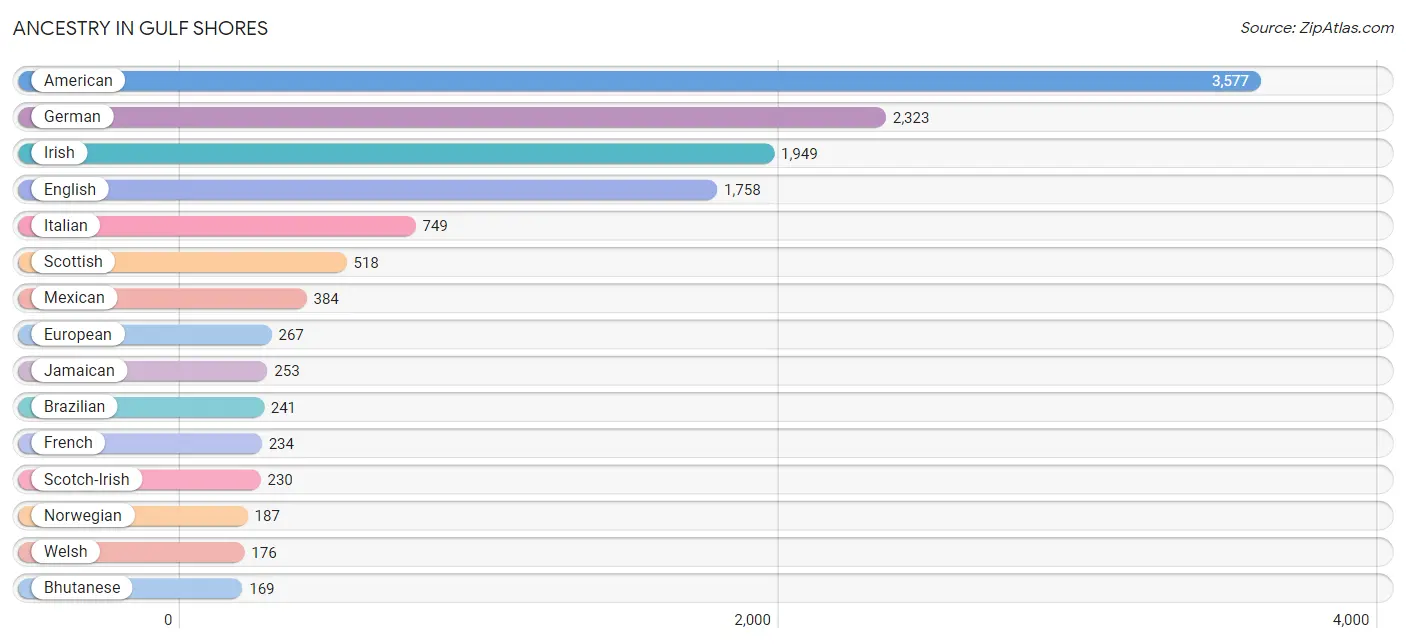
Ancestry in Gulf Shores
The most populous ancestries reported in Gulf Shores are American (3,577 | 23.6%), German (2,323 | 15.3%), Irish (1,949 | 12.8%), English (1,758 | 11.6%), and Italian (749 | 4.9%), together accounting for 68.2% of all Gulf Shores residents.
| Ancestry | # Population | % Population |
| American | 3,577 | 23.6% |
| Arab | 22 | 0.1% |
| Austrian | 7 | 0.1% |
| Bhutanese | 169 | 1.1% |
| Brazilian | 241 | 1.6% |
| British | 103 | 0.7% |
| Cherokee | 89 | 0.6% |
| Creek | 25 | 0.2% |
| Cuban | 43 | 0.3% |
| Czech | 32 | 0.2% |
| Danish | 38 | 0.3% |
| Dutch | 47 | 0.3% |
| Eastern European | 15 | 0.1% |
| English | 1,758 | 11.6% |
| European | 267 | 1.8% |
| Filipino | 9 | 0.1% |
| Finnish | 30 | 0.2% |
| French | 234 | 1.5% |
| French Canadian | 22 | 0.1% |
| German | 2,323 | 15.3% |
| Greek | 6 | 0.0% |
| Hungarian | 14 | 0.1% |
| Irish | 1,949 | 12.8% |
| Israeli | 9 | 0.1% |
| Italian | 749 | 4.9% |
| Jamaican | 253 | 1.7% |
| Lebanese | 22 | 0.1% |
| Lithuanian | 26 | 0.2% |
| Mexican | 384 | 2.5% |
| Northern European | 15 | 0.1% |
| Norwegian | 187 | 1.2% |
| Peruvian | 59 | 0.4% |
| Polish | 102 | 0.7% |
| Portuguese | 44 | 0.3% |
| Puerto Rican | 9 | 0.1% |
| Russian | 33 | 0.2% |
| Scandinavian | 34 | 0.2% |
| Scotch-Irish | 230 | 1.5% |
| Scottish | 518 | 3.4% |
| Sioux | 9 | 0.1% |
| Slovak | 10 | 0.1% |
| South American | 125 | 0.8% |
| Spaniard | 101 | 0.7% |
| Swedish | 55 | 0.4% |
| Swiss | 10 | 0.1% |
| Thai | 10 | 0.1% |
| Welsh | 176 | 1.2% | View All 47 Rows |
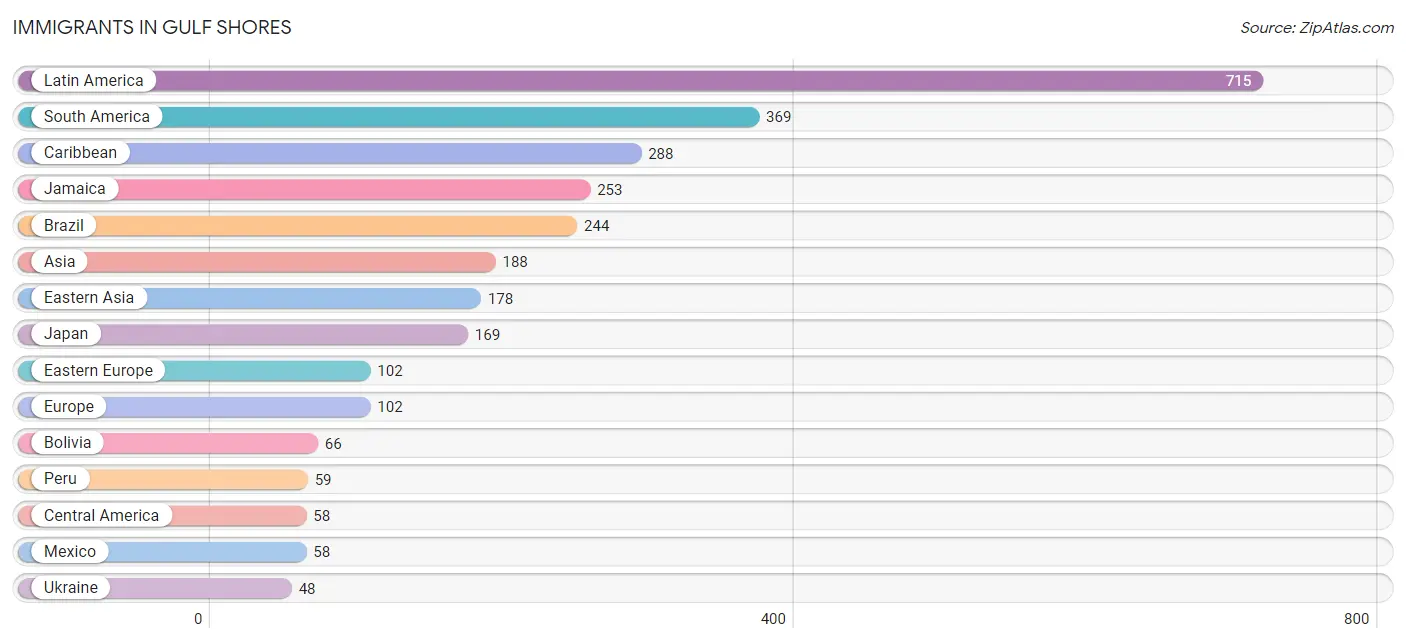
Immigrants in Gulf Shores
The most numerous immigrant groups reported in Gulf Shores came from Latin America (715 | 4.7%), South America (369 | 2.4%), Caribbean (288 | 1.9%), Jamaica (253 | 1.7%), and Brazil (244 | 1.6%), together accounting for 12.3% of all Gulf Shores residents.
| Immigration Origin | # Population | % Population |
| Asia | 188 | 1.2% |
| Australia | 37 | 0.2% |
| Bolivia | 66 | 0.4% |
| Brazil | 244 | 1.6% |
| Canada | 41 | 0.3% |
| Caribbean | 288 | 1.9% |
| Central America | 58 | 0.4% |
| China | 9 | 0.1% |
| Cuba | 35 | 0.2% |
| Czechoslovakia | 33 | 0.2% |
| Eastern Asia | 178 | 1.2% |
| Eastern Europe | 102 | 0.7% |
| Europe | 102 | 0.7% |
| India | 10 | 0.1% |
| Jamaica | 253 | 1.7% |
| Japan | 169 | 1.1% |
| Latin America | 715 | 4.7% |
| Mexico | 58 | 0.4% |
| Moldova | 21 | 0.1% |
| Oceania | 37 | 0.2% |
| Peru | 59 | 0.4% |
| South America | 369 | 2.4% |
| South Central Asia | 10 | 0.1% |
| Taiwan | 9 | 0.1% |
| Ukraine | 48 | 0.3% | View All 25 Rows |
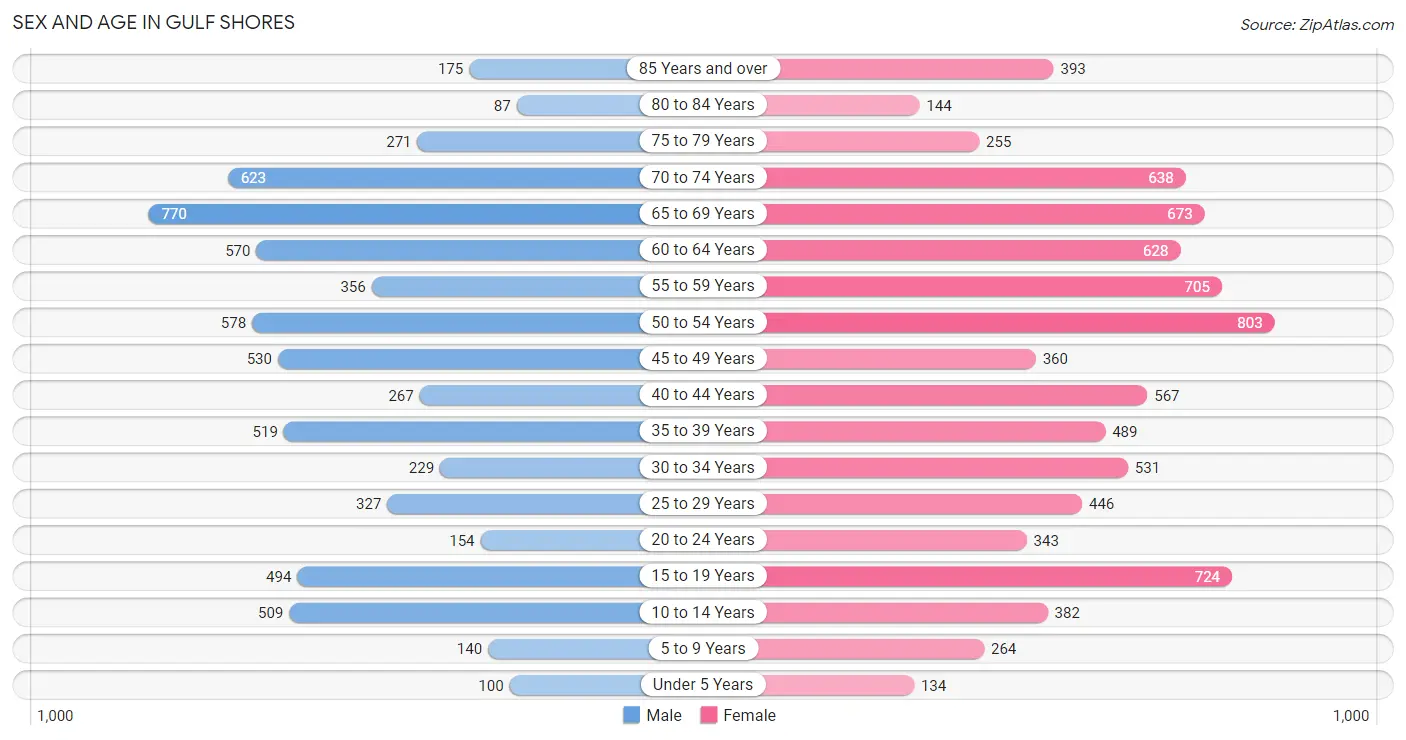
Sex and Age in Gulf Shores
Sex and Age in Gulf Shores
The most populous age groups in Gulf Shores are 65 to 69 Years (770 | 11.5%) for men and 50 to 54 Years (803 | 9.5%) for women.
| Age Bracket | Male | Female |
| Under 5 Years | 100 (1.5%) | 134 (1.6%) |
| 5 to 9 Years | 140 (2.1%) | 264 (3.1%) |
| 10 to 14 Years | 509 (7.6%) | 382 (4.5%) |
| 15 to 19 Years | 494 (7.4%) | 724 (8.5%) |
| 20 to 24 Years | 154 (2.3%) | 343 (4.1%) |
| 25 to 29 Years | 327 (4.9%) | 446 (5.3%) |
| 30 to 34 Years | 229 (3.4%) | 531 (6.3%) |
| 35 to 39 Years | 519 (7.7%) | 489 (5.8%) |
| 40 to 44 Years | 267 (4.0%) | 567 (6.7%) |
| 45 to 49 Years | 530 (7.9%) | 360 (4.3%) |
| 50 to 54 Years | 578 (8.6%) | 803 (9.5%) |
| 55 to 59 Years | 356 (5.3%) | 705 (8.3%) |
| 60 to 64 Years | 570 (8.5%) | 628 (7.4%) |
| 65 to 69 Years | 770 (11.5%) | 673 (7.9%) |
| 70 to 74 Years | 623 (9.3%) | 638 (7.5%) |
| 75 to 79 Years | 271 (4.1%) | 255 (3.0%) |
| 80 to 84 Years | 87 (1.3%) | 144 (1.7%) |
| 85 Years and over | 175 (2.6%) | 393 (4.6%) |
| Total | 6,699 (100.0%) | 8,479 (100.0%) |
Families and Households in Gulf Shores
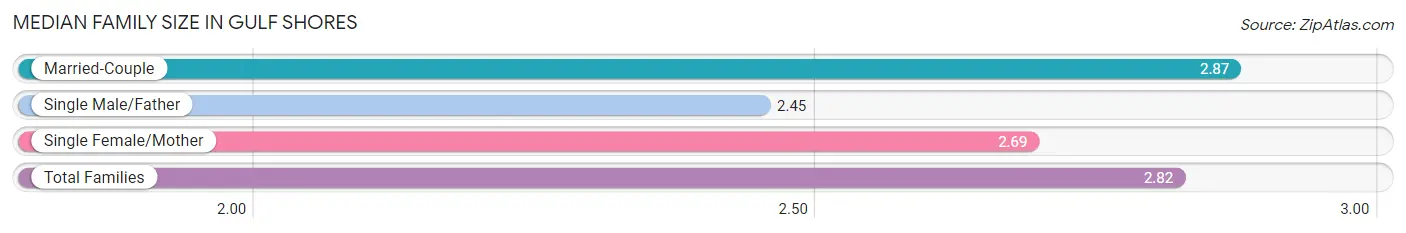
Median Family Size in Gulf Shores
The median family size in Gulf Shores is 2.82 persons per family, with married-couple families (3,155 | 75.5%) accounting for the largest median family size of 2.87 persons per family. On the other hand, single male/father families (141 | 3.4%) represent the smallest median family size with 2.45 persons per family.
| Family Type | # Families | Family Size |
| Married-Couple | 3,155 (75.5%) | 2.87 |
| Single Male/Father | 141 (3.4%) | 2.45 |
| Single Female/Mother | 882 (21.1%) | 2.69 |
| Total Families | 4,178 (100.0%) | 2.82 |
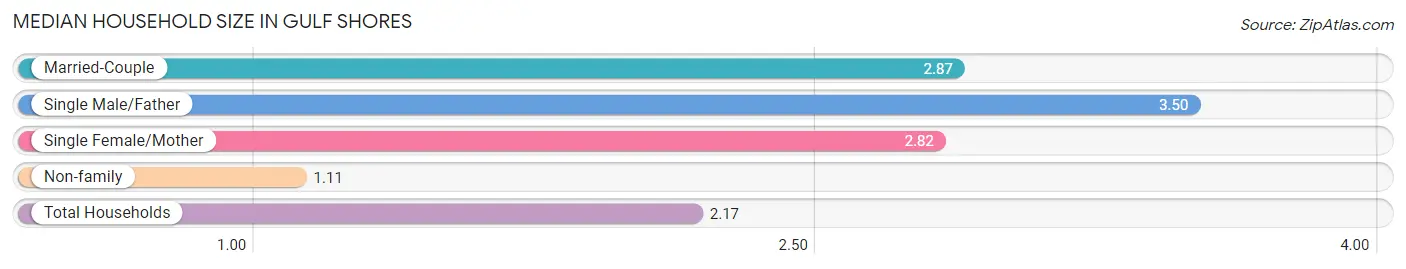
Median Household Size in Gulf Shores
The median household size in Gulf Shores is 2.17 persons per household, with single male/father households (141 | 2.0%) accounting for the largest median household size of 3.5 persons per household. non-family households (2,803 | 40.2%) represent the smallest median household size with 1.11 persons per household.
| Household Type | # Households | Household Size |
| Married-Couple | 3,155 (45.2%) | 2.87 |
| Single Male/Father | 141 (2.0%) | 3.50 |
| Single Female/Mother | 882 (12.6%) | 2.82 |
| Non-family | 2,803 (40.2%) | 1.11 |
| Total Households | 6,981 (100.0%) | 2.17 |
Household Size by Marriage Status in Gulf Shores
Out of a total of 6,981 households in Gulf Shores, 4,178 (59.9%) are family households, while 2,803 (40.2%) are nonfamily households. The most numerous type of family households are 2-person households, comprising 2,513, and the most common type of nonfamily households are 1-person households, comprising 2,549.
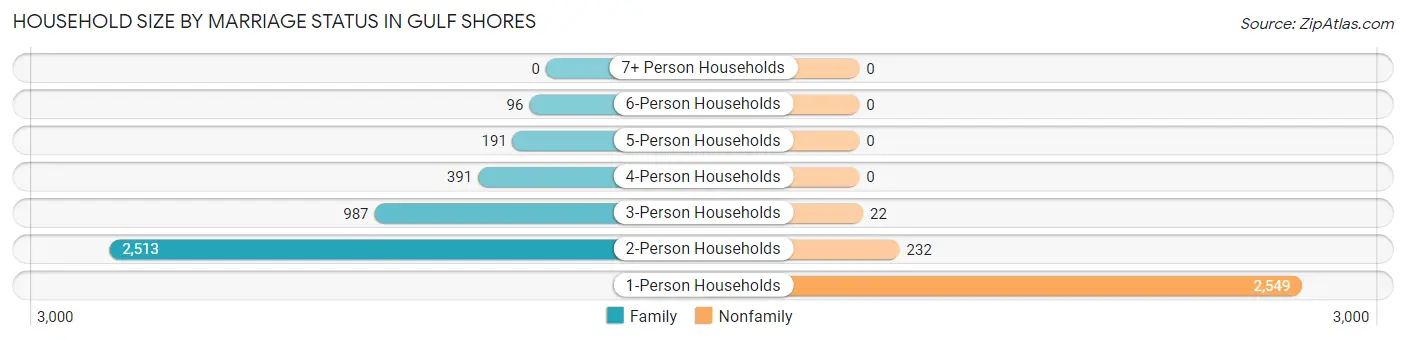
| Household Size | Family Households | Nonfamily Households |
| 1-Person Households | - | 2,549 (36.5%) |
| 2-Person Households | 2,513 (36.0%) | 232 (3.3%) |
| 3-Person Households | 987 (14.1%) | 22 (0.3%) |
| 4-Person Households | 391 (5.6%) | 0 (0.0%) |
| 5-Person Households | 191 (2.7%) | 0 (0.0%) |
| 6-Person Households | 96 (1.4%) | 0 (0.0%) |
| 7+ Person Households | 0 (0.0%) | 0 (0.0%) |
| Total | 4,178 (59.9%) | 2,803 (40.2%) |
Female Fertility in Gulf Shores
Fertility by Age in Gulf Shores
Average fertility rate in Gulf Shores is 6.0 births per 1,000 women. Women in the age bracket of 20 to 34 years have the highest fertility rate with 16.0 births per 1,000 women. Women in the age bracket of 20 to 34 years acount for 100.0% of all women with births.
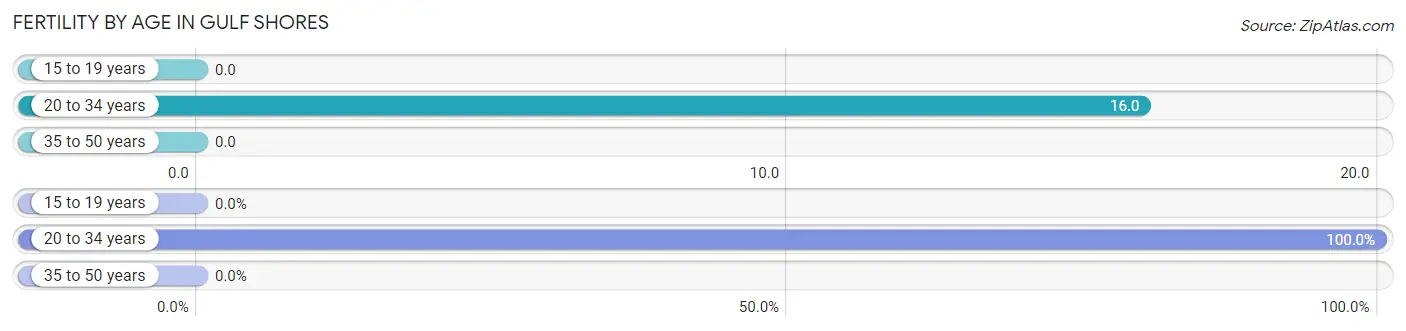
| Age Bracket | Women with Births | Births / 1,000 Women |
| 15 to 19 years | 0 (0.0%) | 0.0 |
| 20 to 34 years | 21 (100.0%) | 16.0 |
| 35 to 50 years | 0 (0.0%) | 0.0 |
| Total | 21 (100.0%) | 6.0 |
Fertility by Age by Marriage Status in Gulf Shores
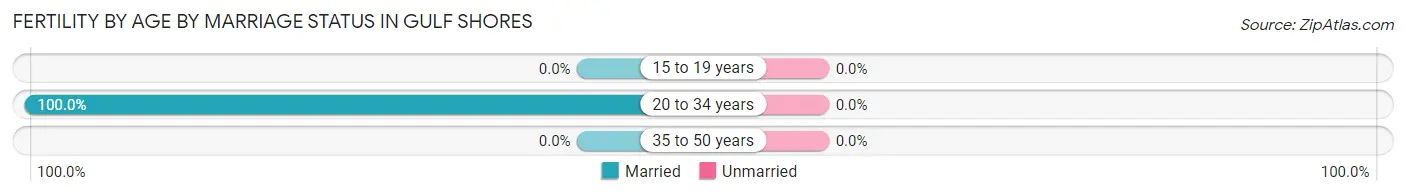
| Age Bracket | Married | Unmarried |
| 15 to 19 years | 0 (0.0%) | 0 (0.0%) |
| 20 to 34 years | 21 (100.0%) | 0 (0.0%) |
| 35 to 50 years | 0 (0.0%) | 0 (0.0%) |
| Total | 21 (100.0%) | 0 (0.0%) |
Fertility by Education in Gulf Shores
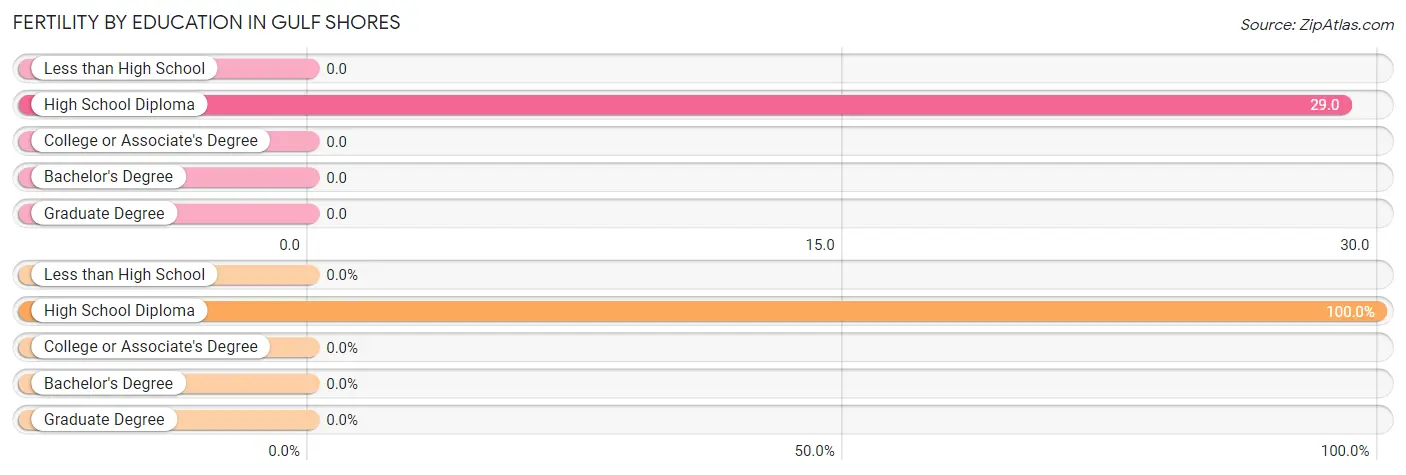
| Educational Attainment | Women with Births | Births / 1,000 Women |
| Less than High School | 0 (0.0%) | 0.0 |
| High School Diploma | 21 (100.0%) | 29.0 |
| College or Associate's Degree | 0 (0.0%) | 0.0 |
| Bachelor's Degree | 0 (0.0%) | 0.0 |
| Graduate Degree | 0 (0.0%) | 0.0 |
| Total | 21 (100.0%) | 6.0 |
Fertility by Education by Marriage Status in Gulf Shores
| Educational Attainment | Married | Unmarried |
| Less than High School | 0 (0.0%) | 0 (0.0%) |
| High School Diploma | 21 (100.0%) | 0 (0.0%) |
| College or Associate's Degree | 0 (0.0%) | 0 (0.0%) |
| Bachelor's Degree | 0 (0.0%) | 0 (0.0%) |
| Graduate Degree | 0 (0.0%) | 0 (0.0%) |
| Total | 21 (100.0%) | 0 (0.0%) |
Employment Characteristics in Gulf Shores
Employment by Class of Employer in Gulf Shores
Among the 7,753 employed individuals in Gulf Shores, private company employees (4,862 | 62.7%), self-employed (not incorporated) (954 | 12.3%), and self-employed (incorporated) (704 | 9.1%) make up the most common classes of employment.
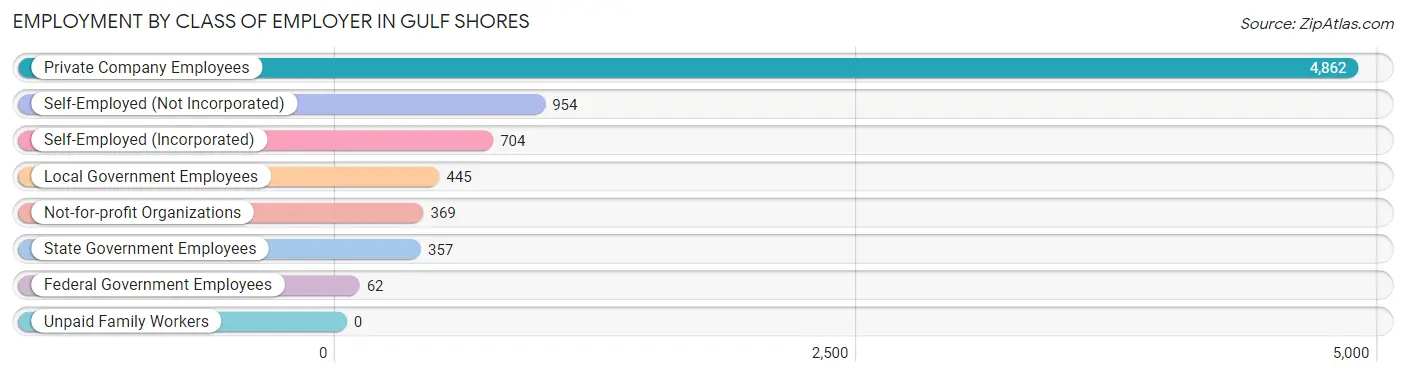
| Employer Class | # Employees | % Employees |
| Private Company Employees | 4,862 | 62.7% |
| Self-Employed (Incorporated) | 704 | 9.1% |
| Self-Employed (Not Incorporated) | 954 | 12.3% |
| Not-for-profit Organizations | 369 | 4.8% |
| Local Government Employees | 445 | 5.7% |
| State Government Employees | 357 | 4.6% |
| Federal Government Employees | 62 | 0.8% |
| Unpaid Family Workers | 0 | 0.0% |
| Total | 7,753 | 100.0% |
Employment Status by Age in Gulf Shores
According to the labor force statistics for Gulf Shores, out of the total population over 16 years of age (13,483), 60.5% or 8,157 individuals are in the labor force, with 2.4% or 196 of them unemployed. The age group with the highest labor force participation rate is 25 to 29 years, with 100.0% or 773 individuals in the labor force. Within the labor force, the 55 to 59 years age range has the highest percentage of unemployed individuals, with 5.1% or 38 of them being unemployed.
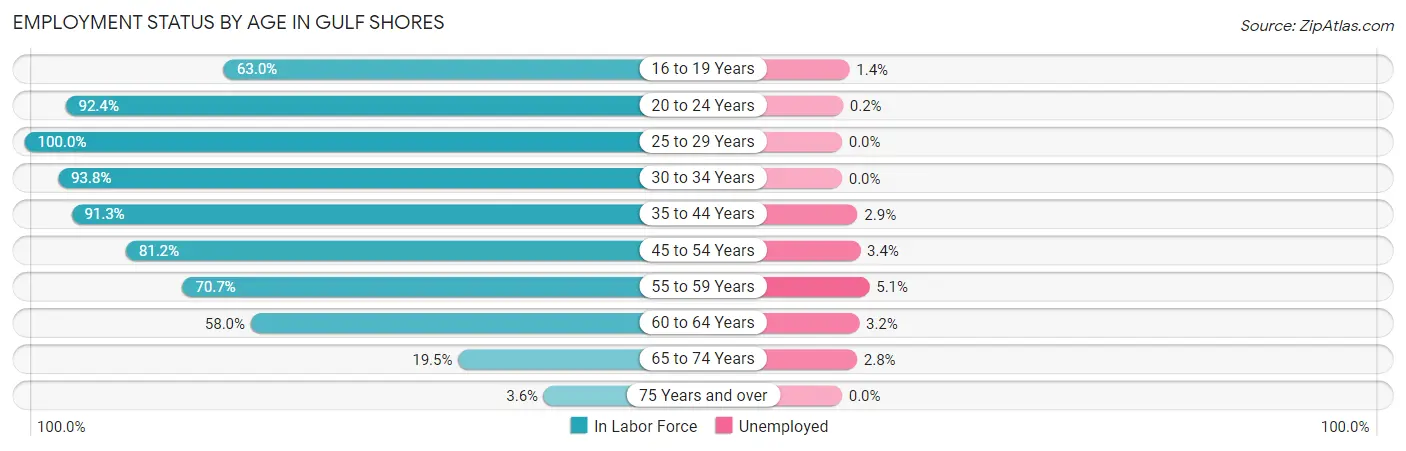
| Age Bracket | In Labor Force | Unemployed |
| 16 to 19 Years | 663 (63.0%) | 9 (1.4%) |
| 20 to 24 Years | 459 (92.4%) | 1 (0.2%) |
| 25 to 29 Years | 773 (100.0%) | 0 (0.0%) |
| 30 to 34 Years | 713 (93.8%) | 0 (0.0%) |
| 35 to 44 Years | 1,682 (91.3%) | 49 (2.9%) |
| 45 to 54 Years | 1,844 (81.2%) | 63 (3.4%) |
| 55 to 59 Years | 750 (70.7%) | 38 (5.1%) |
| 60 to 64 Years | 695 (58.0%) | 22 (3.2%) |
| 65 to 74 Years | 527 (19.5%) | 15 (2.8%) |
| 75 Years and over | 48 (3.6%) | 0 (0.0%) |
| Total | 8,157 (60.5%) | 196 (2.4%) |
Employment Status by Educational Attainment in Gulf Shores
According to labor force statistics for Gulf Shores, 81.7% of individuals (6,458) out of the total population between 25 and 64 years of age (7,905) are in the labor force, with 2.6% or 168 of them being unemployed. The group with the highest labor force participation rate are those with the educational attainment of high school diploma, with 85.9% or 1,819 individuals in the labor force. Within the labor force, individuals with college / associate degree education have the highest percentage of unemployment, with 5.5% or 123 of them being unemployed.
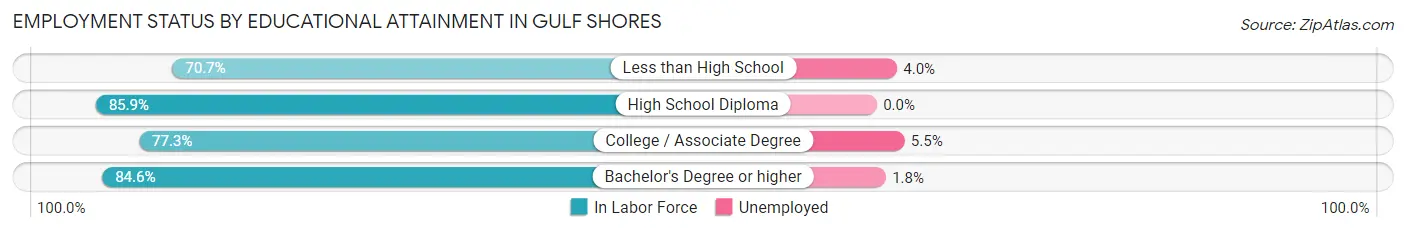
| Educational Attainment | In Labor Force | Unemployed |
| Less than High School | 253 (70.7%) | 14 (4.0%) |
| High School Diploma | 1,819 (85.9%) | 0 (0.0%) |
| College / Associate Degree | 2,229 (77.3%) | 159 (5.5%) |
| Bachelor's Degree or higher | 2,154 (84.6%) | 46 (1.8%) |
| Total | 6,458 (81.7%) | 206 (2.6%) |
Employment Occupations by Sex in Gulf Shores
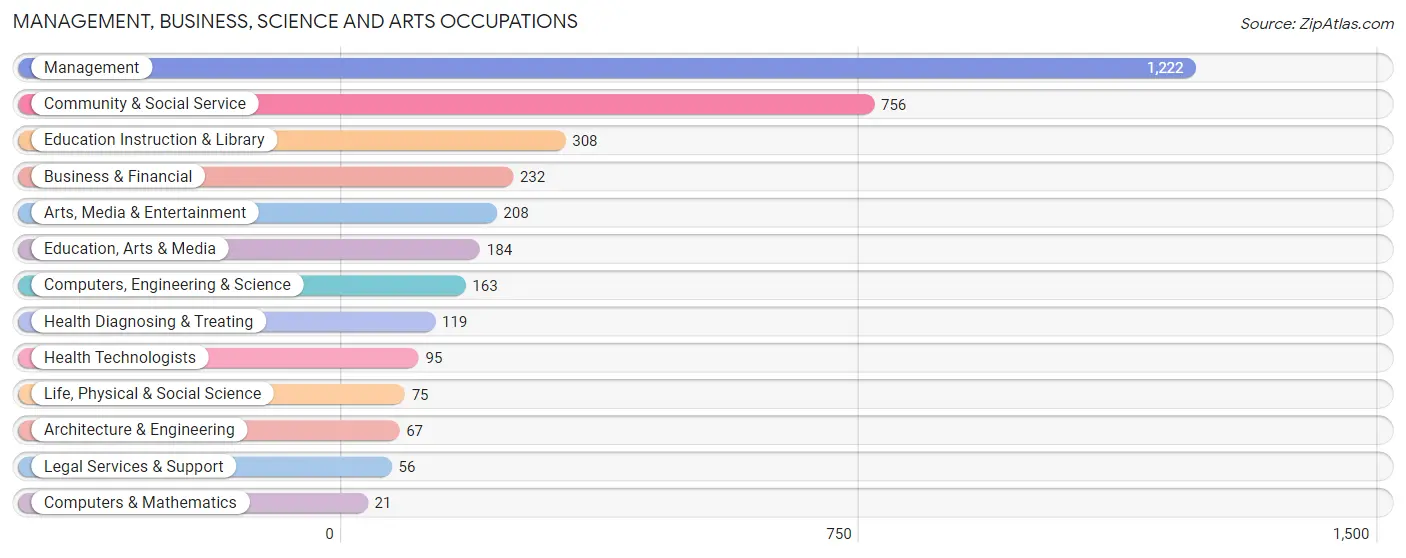
Management, Business, Science and Arts Occupations
The most common Management, Business, Science and Arts occupations in Gulf Shores are Management (1,222 | 15.4%), Community & Social Service (756 | 9.5%), Education Instruction & Library (308 | 3.9%), Business & Financial (232 | 2.9%), and Arts, Media & Entertainment (208 | 2.6%).
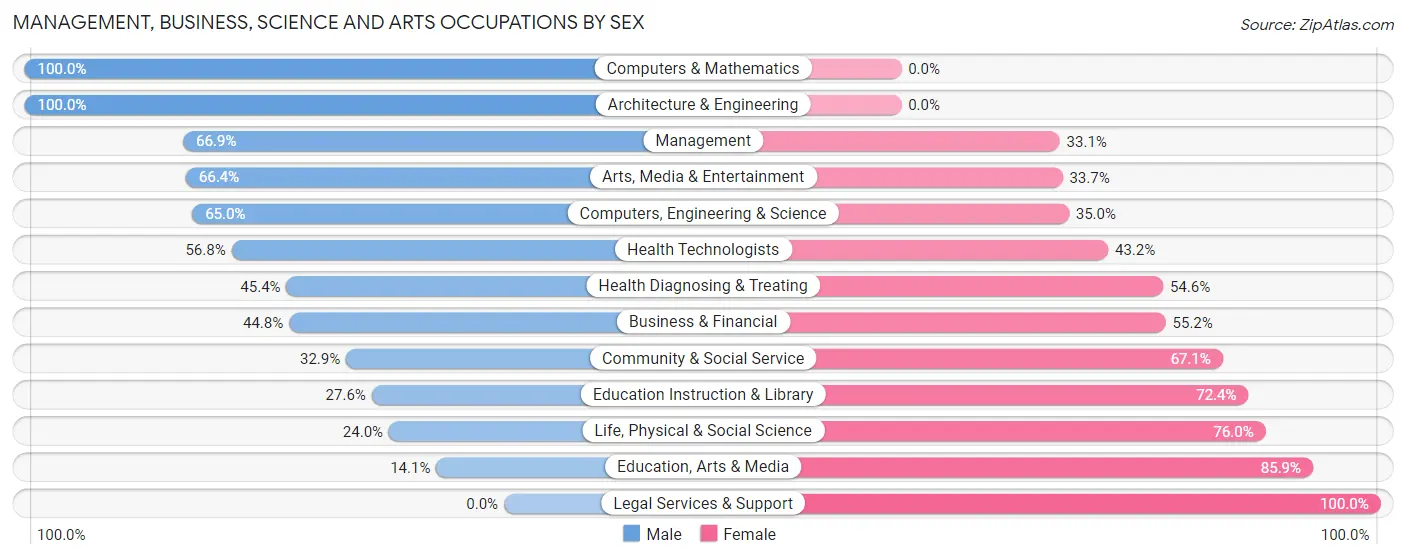
Management, Business, Science and Arts Occupations by Sex
Within the Management, Business, Science and Arts occupations in Gulf Shores, the most male-oriented occupations are Computers & Mathematics (100.0%), Architecture & Engineering (100.0%), and Management (66.9%), while the most female-oriented occupations are Legal Services & Support (100.0%), Education, Arts & Media (85.9%), and Life, Physical & Social Science (76.0%).
| Occupation | Male | Female |
| Management | 818 (66.9%) | 404 (33.1%) |
| Business & Financial | 104 (44.8%) | 128 (55.2%) |
| Computers, Engineering & Science | 106 (65.0%) | 57 (35.0%) |
| Computers & Mathematics | 21 (100.0%) | 0 (0.0%) |
| Architecture & Engineering | 67 (100.0%) | 0 (0.0%) |
| Life, Physical & Social Science | 18 (24.0%) | 57 (76.0%) |
| Community & Social Service | 249 (32.9%) | 507 (67.1%) |
| Education, Arts & Media | 26 (14.1%) | 158 (85.9%) |
| Legal Services & Support | 0 (0.0%) | 56 (100.0%) |
| Education Instruction & Library | 85 (27.6%) | 223 (72.4%) |
| Arts, Media & Entertainment | 138 (66.3%) | 70 (33.7%) |
| Health Diagnosing & Treating | 54 (45.4%) | 65 (54.6%) |
| Health Technologists | 54 (56.8%) | 41 (43.2%) |
| Total (Category) | 1,331 (53.4%) | 1,161 (46.6%) |
| Total (Overall) | 3,444 (43.3%) | 4,514 (56.7%) |
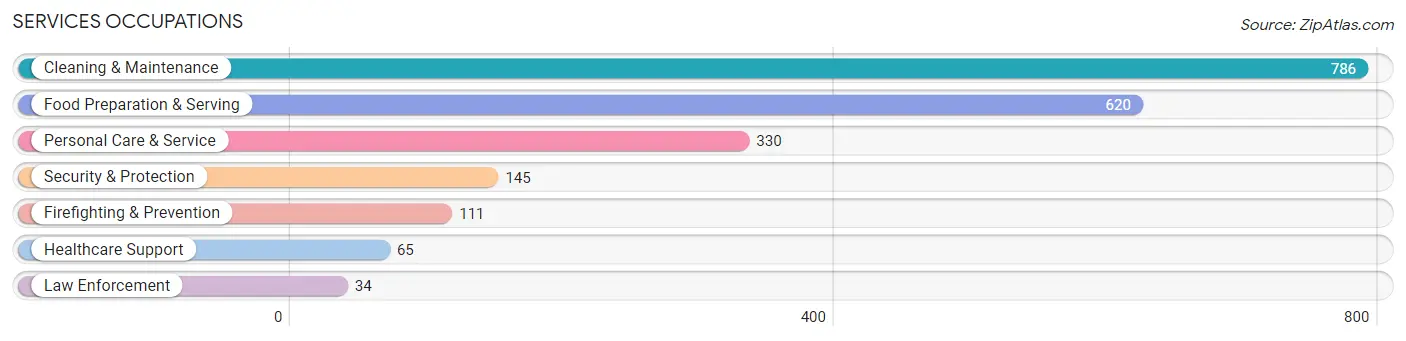
Services Occupations
The most common Services occupations in Gulf Shores are Cleaning & Maintenance (786 | 9.9%), Food Preparation & Serving (620 | 7.8%), Personal Care & Service (330 | 4.2%), Security & Protection (145 | 1.8%), and Firefighting & Prevention (111 | 1.4%).
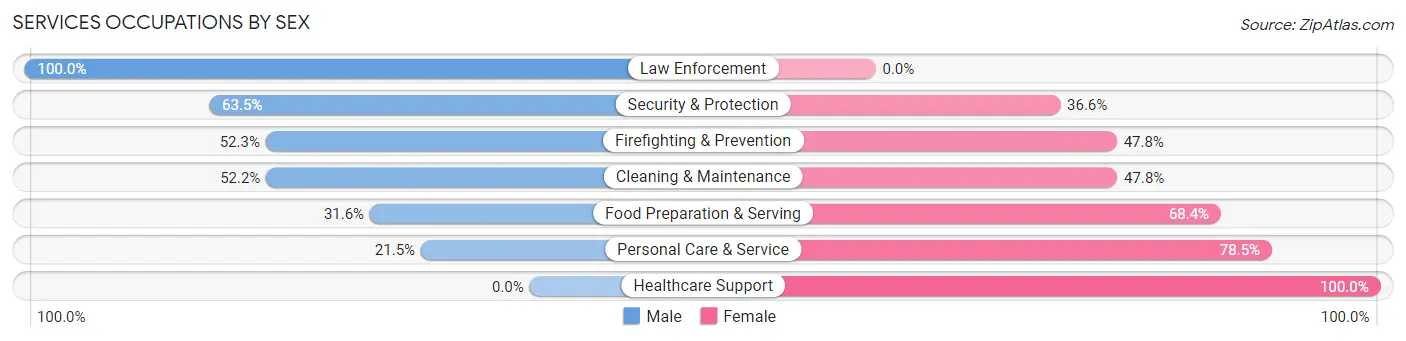
Services Occupations by Sex
Within the Services occupations in Gulf Shores, the most male-oriented occupations are Law Enforcement (100.0%), Security & Protection (63.4%), and Firefighting & Prevention (52.2%), while the most female-oriented occupations are Healthcare Support (100.0%), Personal Care & Service (78.5%), and Food Preparation & Serving (68.4%).
| Occupation | Male | Female |
| Healthcare Support | 0 (0.0%) | 65 (100.0%) |
| Security & Protection | 92 (63.4%) | 53 (36.5%) |
| Firefighting & Prevention | 58 (52.2%) | 53 (47.7%) |
| Law Enforcement | 34 (100.0%) | 0 (0.0%) |
| Food Preparation & Serving | 196 (31.6%) | 424 (68.4%) |
| Cleaning & Maintenance | 410 (52.2%) | 376 (47.8%) |
| Personal Care & Service | 71 (21.5%) | 259 (78.5%) |
| Total (Category) | 769 (39.5%) | 1,177 (60.5%) |
| Total (Overall) | 3,444 (43.3%) | 4,514 (56.7%) |
Sales and Office Occupations
The most common Sales and Office occupations in Gulf Shores are Sales & Related (1,351 | 17.0%), and Office & Administration (985 | 12.4%).
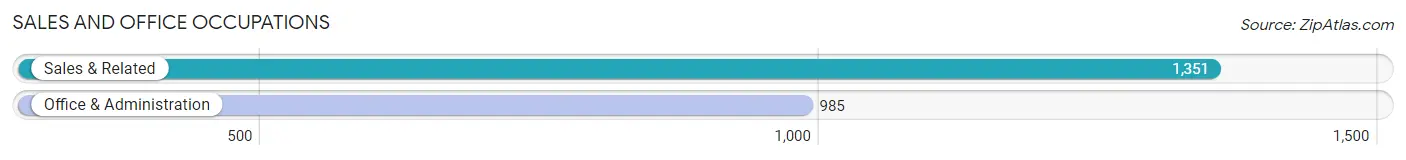
Sales and Office Occupations by Sex

| Occupation | Male | Female |
| Sales & Related | 394 (29.2%) | 957 (70.8%) |
| Office & Administration | 182 (18.5%) | 803 (81.5%) |
| Total (Category) | 576 (24.7%) | 1,760 (75.3%) |
| Total (Overall) | 3,444 (43.3%) | 4,514 (56.7%) |
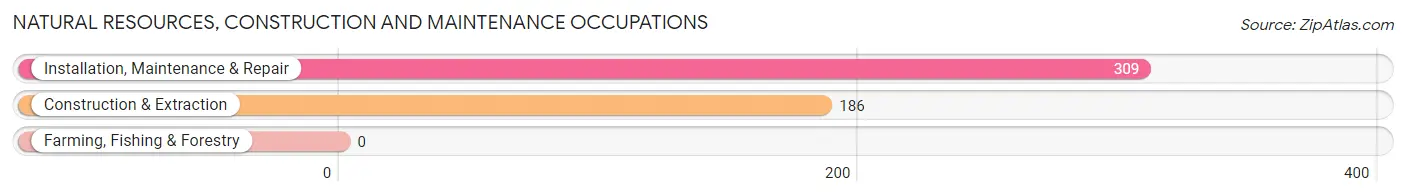
Natural Resources, Construction and Maintenance Occupations
The most common Natural Resources, Construction and Maintenance occupations in Gulf Shores are Installation, Maintenance & Repair (309 | 3.9%), and Construction & Extraction (186 | 2.3%).
Natural Resources, Construction and Maintenance Occupations by Sex
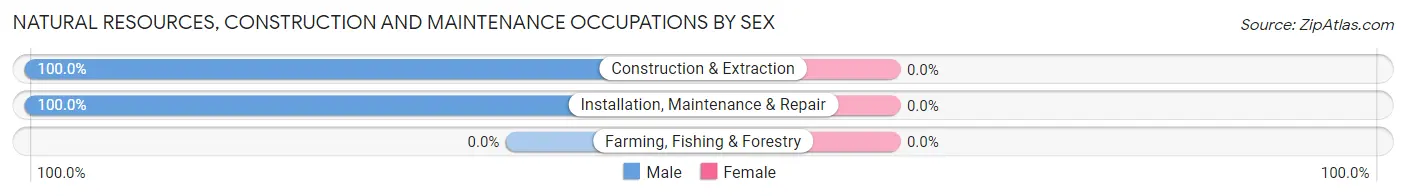
| Occupation | Male | Female |
| Farming, Fishing & Forestry | 0 (0.0%) | 0 (0.0%) |
| Construction & Extraction | 186 (100.0%) | 0 (0.0%) |
| Installation, Maintenance & Repair | 309 (100.0%) | 0 (0.0%) |
| Total (Category) | 495 (100.0%) | 0 (0.0%) |
| Total (Overall) | 3,444 (43.3%) | 4,514 (56.7%) |
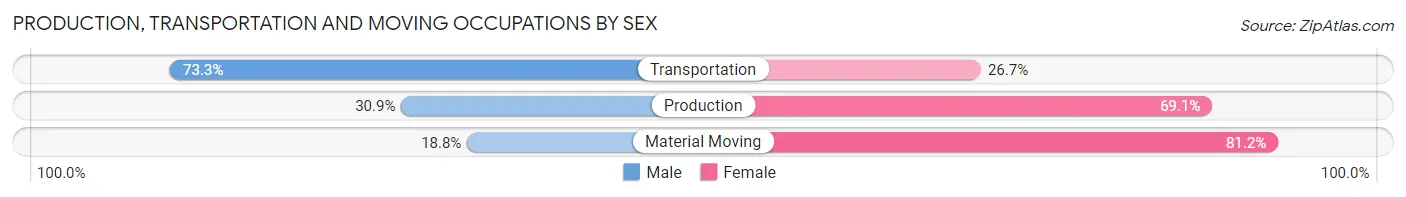
Production, Transportation and Moving Occupations
The most common Production, Transportation and Moving occupations in Gulf Shores are Material Moving (330 | 4.2%), Transportation (236 | 3.0%), and Production (123 | 1.5%).
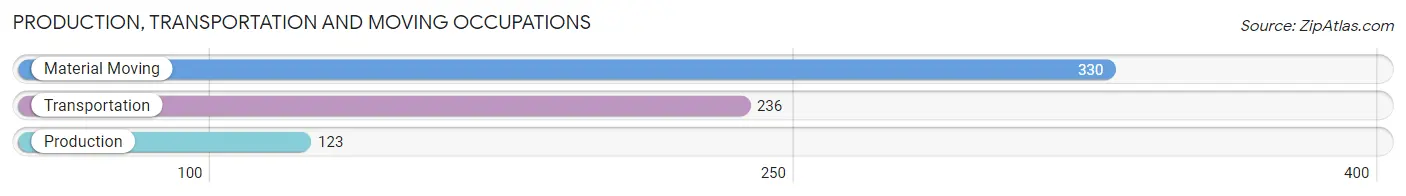
Production, Transportation and Moving Occupations by Sex
| Occupation | Male | Female |
| Production | 38 (30.9%) | 85 (69.1%) |
| Transportation | 173 (73.3%) | 63 (26.7%) |
| Material Moving | 62 (18.8%) | 268 (81.2%) |
| Total (Category) | 273 (39.6%) | 416 (60.4%) |
| Total (Overall) | 3,444 (43.3%) | 4,514 (56.7%) |
Employment Industries by Sex in Gulf Shores
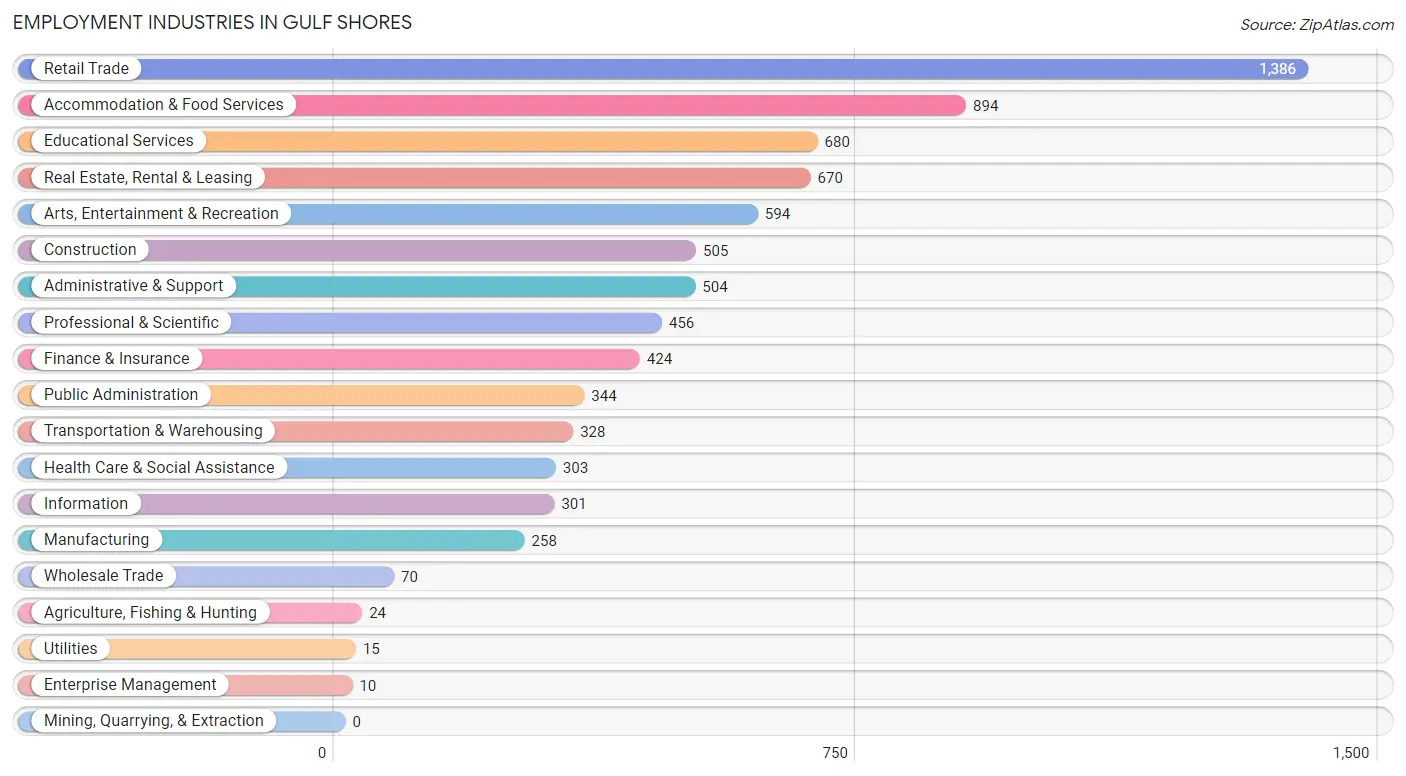
Employment Industries in Gulf Shores
The major employment industries in Gulf Shores include Retail Trade (1,386 | 17.4%), Accommodation & Food Services (894 | 11.2%), Educational Services (680 | 8.5%), Real Estate, Rental & Leasing (670 | 8.4%), and Arts, Entertainment & Recreation (594 | 7.5%).
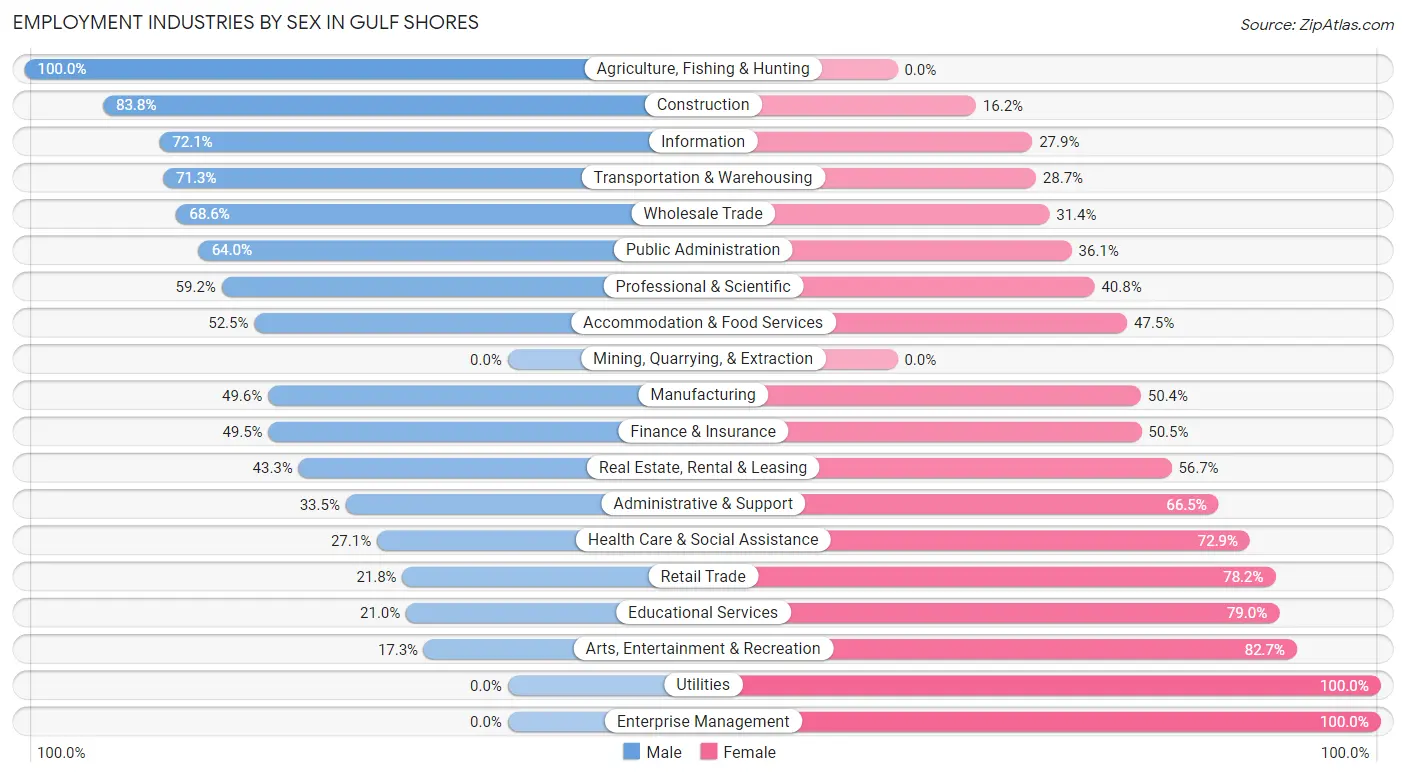
Employment Industries by Sex in Gulf Shores
The Gulf Shores industries that see more men than women are Agriculture, Fishing & Hunting (100.0%), Construction (83.8%), and Information (72.1%), whereas the industries that tend to have a higher number of women are Utilities (100.0%), Enterprise Management (100.0%), and Arts, Entertainment & Recreation (82.7%).
| Industry | Male | Female |
| Agriculture, Fishing & Hunting | 24 (100.0%) | 0 (0.0%) |
| Mining, Quarrying, & Extraction | 0 (0.0%) | 0 (0.0%) |
| Construction | 423 (83.8%) | 82 (16.2%) |
| Manufacturing | 128 (49.6%) | 130 (50.4%) |
| Wholesale Trade | 48 (68.6%) | 22 (31.4%) |
| Retail Trade | 302 (21.8%) | 1,084 (78.2%) |
| Transportation & Warehousing | 234 (71.3%) | 94 (28.7%) |
| Utilities | 0 (0.0%) | 15 (100.0%) |
| Information | 217 (72.1%) | 84 (27.9%) |
| Finance & Insurance | 210 (49.5%) | 214 (50.5%) |
| Real Estate, Rental & Leasing | 290 (43.3%) | 380 (56.7%) |
| Professional & Scientific | 270 (59.2%) | 186 (40.8%) |
| Enterprise Management | 0 (0.0%) | 10 (100.0%) |
| Administrative & Support | 169 (33.5%) | 335 (66.5%) |
| Educational Services | 143 (21.0%) | 537 (79.0%) |
| Health Care & Social Assistance | 82 (27.1%) | 221 (72.9%) |
| Arts, Entertainment & Recreation | 103 (17.3%) | 491 (82.7%) |
| Accommodation & Food Services | 469 (52.5%) | 425 (47.5%) |
| Public Administration | 220 (63.9%) | 124 (36.0%) |
| Total | 3,444 (43.3%) | 4,514 (56.7%) |
Education in Gulf Shores
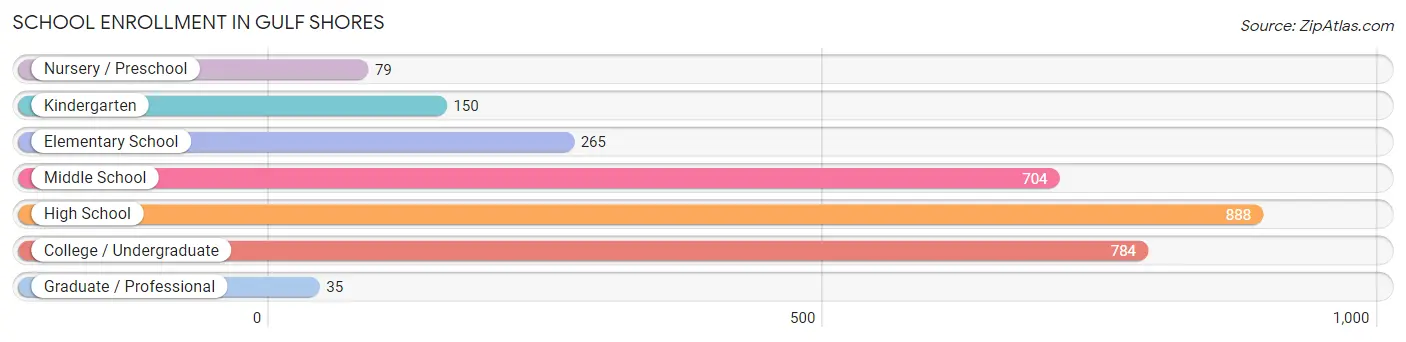
School Enrollment in Gulf Shores
The most common levels of schooling among the 2,905 students in Gulf Shores are high school (888 | 30.6%), college / undergraduate (784 | 27.0%), and middle school (704 | 24.2%).
| School Level | # Students | % Students |
| Nursery / Preschool | 79 | 2.7% |
| Kindergarten | 150 | 5.2% |
| Elementary School | 265 | 9.1% |
| Middle School | 704 | 24.2% |
| High School | 888 | 30.6% |
| College / Undergraduate | 784 | 27.0% |
| Graduate / Professional | 35 | 1.2% |
| Total | 2,905 | 100.0% |
School Enrollment by Age by Funding Source in Gulf Shores
Out of a total of 2,905 students who are enrolled in schools in Gulf Shores, 497 (17.1%) attend a private institution, while the remaining 2,408 (82.9%) are enrolled in public schools. The age group of 3 to 4 year olds has the highest likelihood of being enrolled in private schools, with 64 (100.0% in the age bracket) enrolled. Conversely, the age group of 20 to 24 year olds has the lowest likelihood of being enrolled in a private school, with 247 (100.0% in the age bracket) attending a public institution.
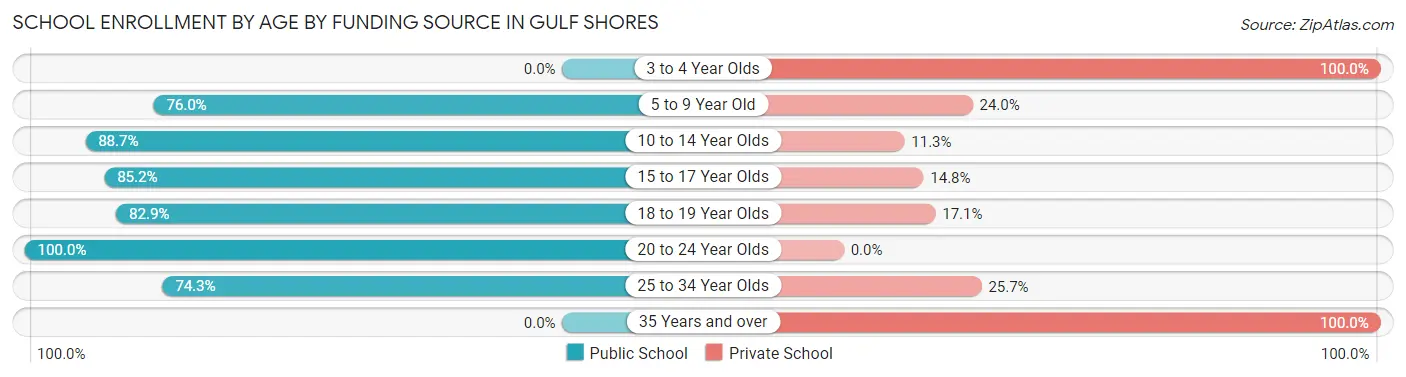
| Age Bracket | Public School | Private School |
| 3 to 4 Year Olds | 0 (0.0%) | 64 (100.0%) |
| 5 to 9 Year Old | 307 (76.0%) | 97 (24.0%) |
| 10 to 14 Year Olds | 769 (88.7%) | 98 (11.3%) |
| 15 to 17 Year Olds | 528 (85.2%) | 92 (14.8%) |
| 18 to 19 Year Olds | 389 (82.9%) | 80 (17.1%) |
| 20 to 24 Year Olds | 247 (100.0%) | 0 (0.0%) |
| 25 to 34 Year Olds | 168 (74.3%) | 58 (25.7%) |
| 35 Years and over | 0 (0.0%) | 8 (100.0%) |
| Total | 2,408 (82.9%) | 497 (17.1%) |
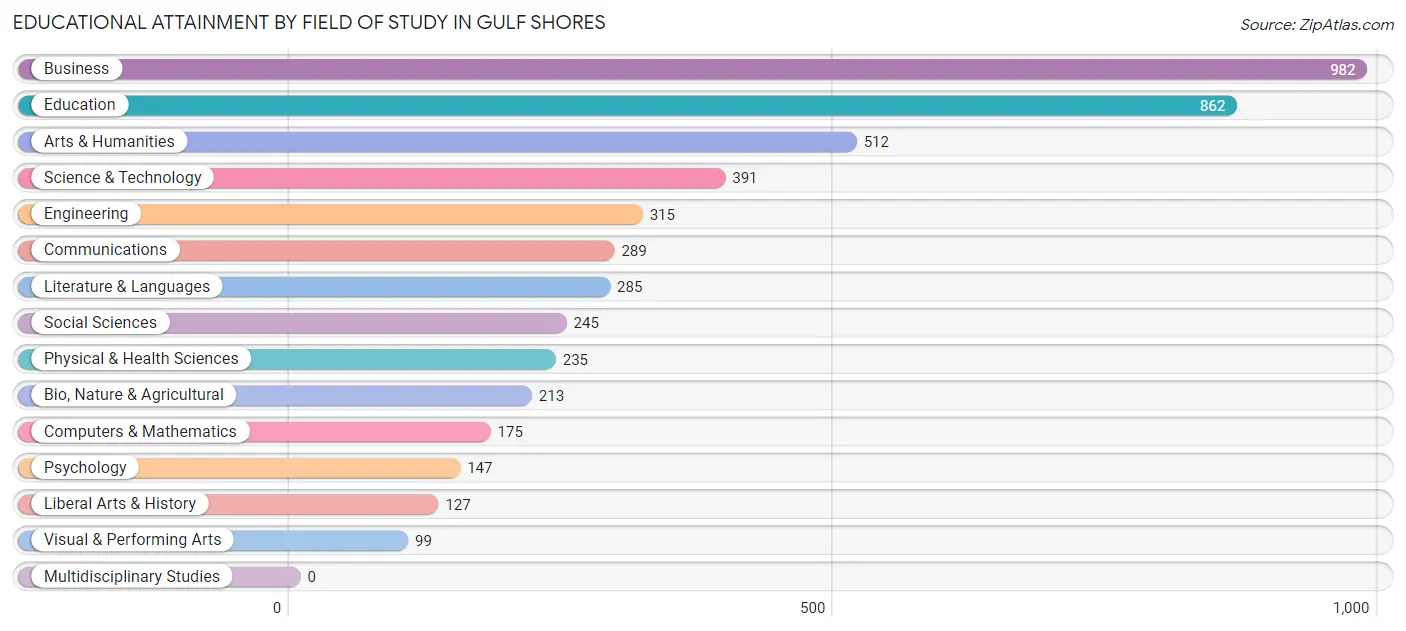
Educational Attainment by Field of Study in Gulf Shores
Business (982 | 20.1%), education (862 | 17.7%), arts & humanities (512 | 10.5%), science & technology (391 | 8.0%), and engineering (315 | 6.5%) are the most common fields of study among 4,877 individuals in Gulf Shores who have obtained a bachelor's degree or higher.
| Field of Study | # Graduates | % Graduates |
| Computers & Mathematics | 175 | 3.6% |
| Bio, Nature & Agricultural | 213 | 4.4% |
| Physical & Health Sciences | 235 | 4.8% |
| Psychology | 147 | 3.0% |
| Social Sciences | 245 | 5.0% |
| Engineering | 315 | 6.5% |
| Multidisciplinary Studies | 0 | 0.0% |
| Science & Technology | 391 | 8.0% |
| Business | 982 | 20.1% |
| Education | 862 | 17.7% |
| Literature & Languages | 285 | 5.8% |
| Liberal Arts & History | 127 | 2.6% |
| Visual & Performing Arts | 99 | 2.0% |
| Communications | 289 | 5.9% |
| Arts & Humanities | 512 | 10.5% |
| Total | 4,877 | 100.0% |
Transportation & Commute in Gulf Shores
Vehicle Availability by Sex in Gulf Shores
The most prevalent vehicle ownership categories in Gulf Shores are males with 2 vehicles (1,479, accounting for 43.6%) and females with 2 vehicles (1,705, making up 33.9%).
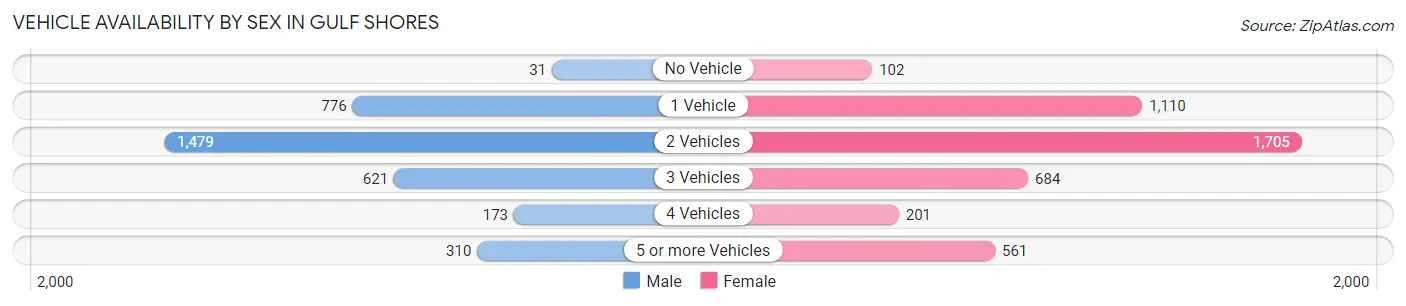
| Vehicles Available | Male | Female |
| No Vehicle | 31 (0.9%) | 102 (2.3%) |
| 1 Vehicle | 776 (22.9%) | 1,110 (25.4%) |
| 2 Vehicles | 1,479 (43.6%) | 1,705 (39.1%) |
| 3 Vehicles | 621 (18.3%) | 684 (15.7%) |
| 4 Vehicles | 173 (5.1%) | 201 (4.6%) |
| 5 or more Vehicles | 310 (9.1%) | 561 (12.9%) |
| Total | 3,390 (100.0%) | 4,363 (100.0%) |
Commute Time in Gulf Shores
The most frequently occuring commute durations in Gulf Shores are 10 to 14 minutes (1,764 commuters, 25.9%), 15 to 19 minutes (1,320 commuters, 19.4%), and 5 to 9 minutes (1,045 commuters, 15.4%).
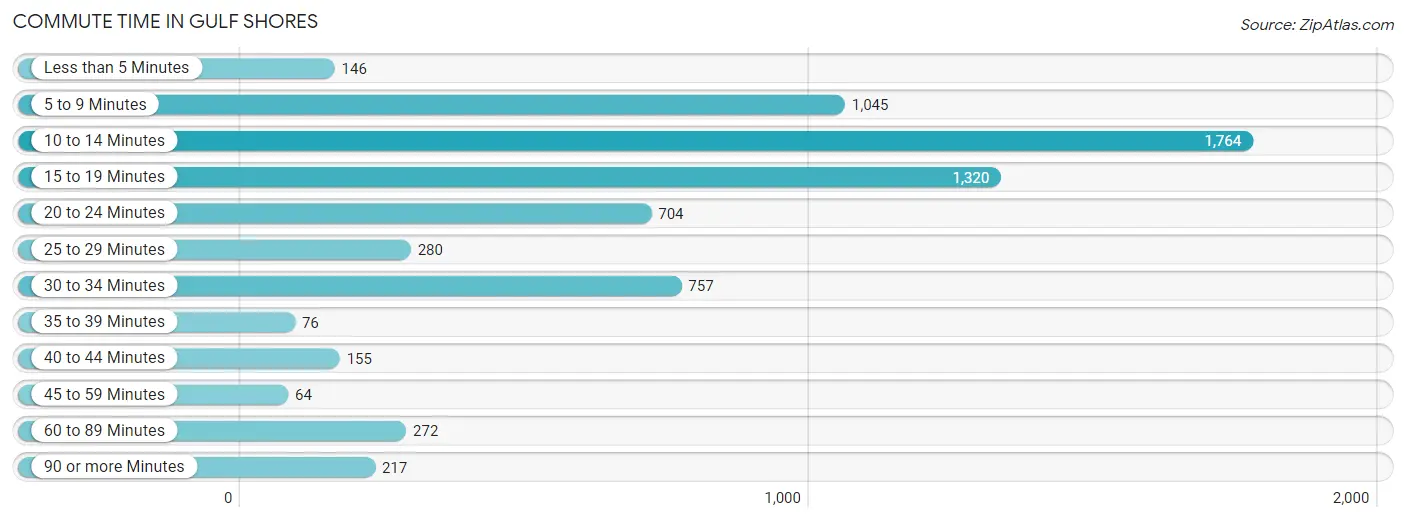
| Commute Time | # Commuters | % Commuters |
| Less than 5 Minutes | 146 | 2.1% |
| 5 to 9 Minutes | 1,045 | 15.4% |
| 10 to 14 Minutes | 1,764 | 25.9% |
| 15 to 19 Minutes | 1,320 | 19.4% |
| 20 to 24 Minutes | 704 | 10.3% |
| 25 to 29 Minutes | 280 | 4.1% |
| 30 to 34 Minutes | 757 | 11.1% |
| 35 to 39 Minutes | 76 | 1.1% |
| 40 to 44 Minutes | 155 | 2.3% |
| 45 to 59 Minutes | 64 | 0.9% |
| 60 to 89 Minutes | 272 | 4.0% |
| 90 or more Minutes | 217 | 3.2% |
Commute Time by Sex in Gulf Shores
The most common commute times in Gulf Shores are 10 to 14 minutes (898 commuters, 30.1%) for males and 10 to 14 minutes (866 commuters, 22.7%) for females.
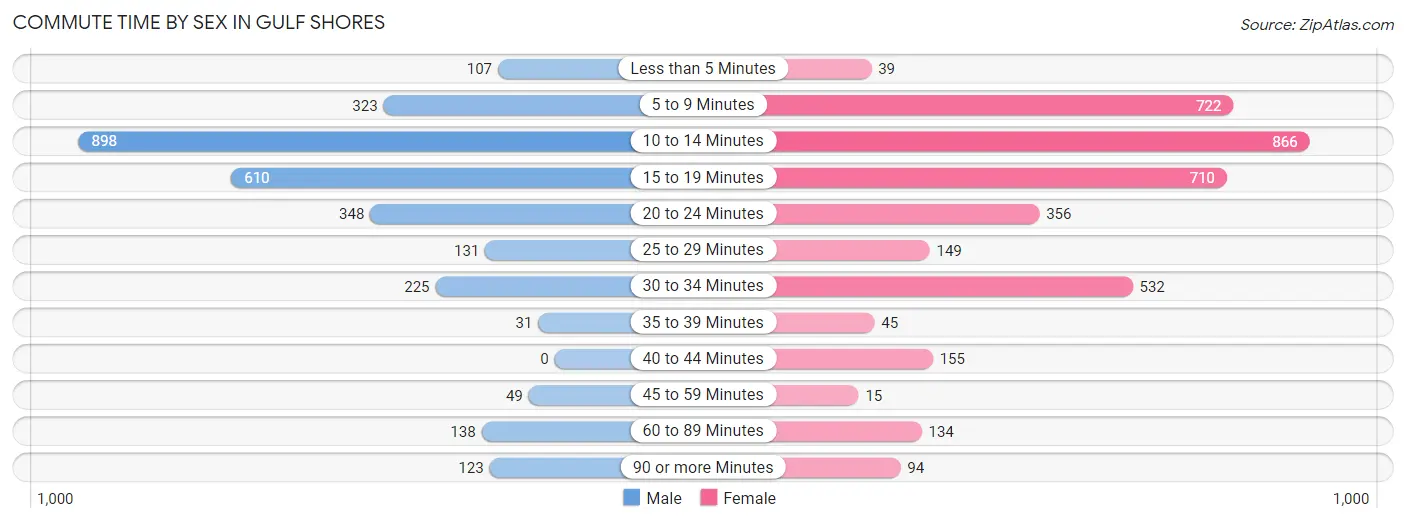
| Commute Time | Male | Female |
| Less than 5 Minutes | 107 (3.6%) | 39 (1.0%) |
| 5 to 9 Minutes | 323 (10.8%) | 722 (18.9%) |
| 10 to 14 Minutes | 898 (30.1%) | 866 (22.7%) |
| 15 to 19 Minutes | 610 (20.4%) | 710 (18.6%) |
| 20 to 24 Minutes | 348 (11.7%) | 356 (9.3%) |
| 25 to 29 Minutes | 131 (4.4%) | 149 (3.9%) |
| 30 to 34 Minutes | 225 (7.5%) | 532 (13.9%) |
| 35 to 39 Minutes | 31 (1.0%) | 45 (1.2%) |
| 40 to 44 Minutes | 0 (0.0%) | 155 (4.1%) |
| 45 to 59 Minutes | 49 (1.6%) | 15 (0.4%) |
| 60 to 89 Minutes | 138 (4.6%) | 134 (3.5%) |
| 90 or more Minutes | 123 (4.1%) | 94 (2.5%) |
Time of Departure to Work by Sex in Gulf Shores
The most frequent times of departure to work in Gulf Shores are 8:00 AM to 8:29 AM (444, 14.9%) for males and 9:00 AM to 9:59 AM (704, 18.4%) for females.
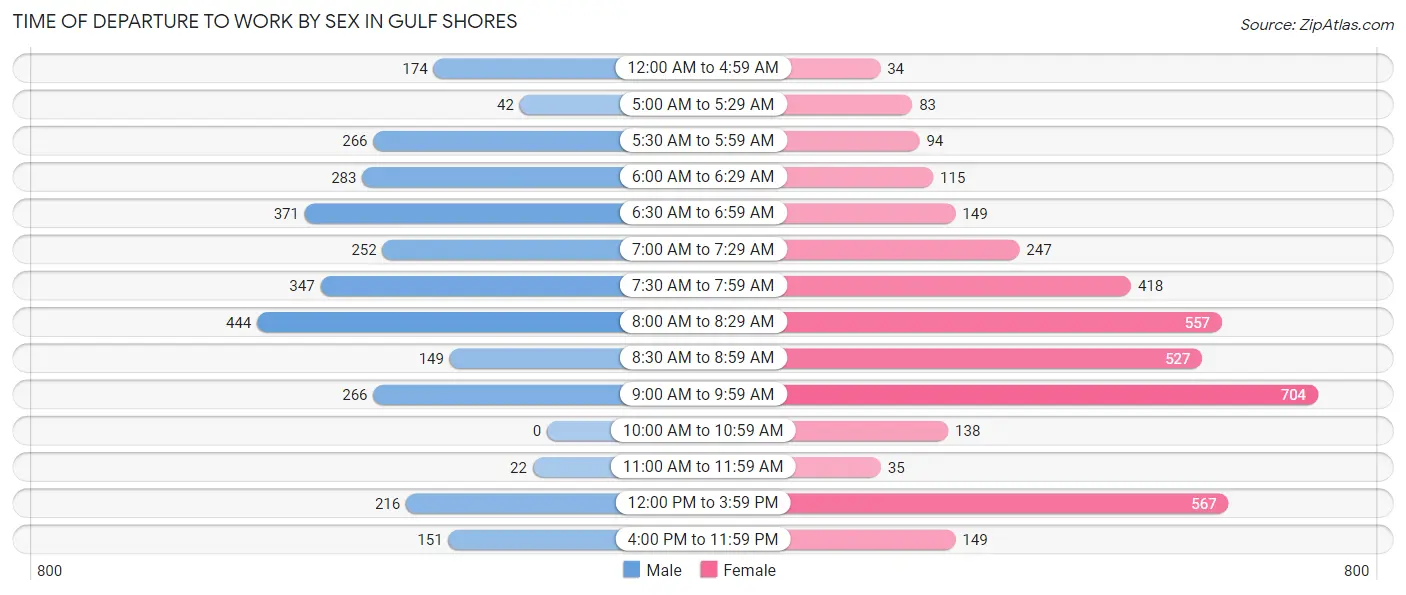
| Time of Departure | Male | Female |
| 12:00 AM to 4:59 AM | 174 (5.8%) | 34 (0.9%) |
| 5:00 AM to 5:29 AM | 42 (1.4%) | 83 (2.2%) |
| 5:30 AM to 5:59 AM | 266 (8.9%) | 94 (2.5%) |
| 6:00 AM to 6:29 AM | 283 (9.5%) | 115 (3.0%) |
| 6:30 AM to 6:59 AM | 371 (12.4%) | 149 (3.9%) |
| 7:00 AM to 7:29 AM | 252 (8.5%) | 247 (6.5%) |
| 7:30 AM to 7:59 AM | 347 (11.6%) | 418 (11.0%) |
| 8:00 AM to 8:29 AM | 444 (14.9%) | 557 (14.6%) |
| 8:30 AM to 8:59 AM | 149 (5.0%) | 527 (13.8%) |
| 9:00 AM to 9:59 AM | 266 (8.9%) | 704 (18.4%) |
| 10:00 AM to 10:59 AM | 0 (0.0%) | 138 (3.6%) |
| 11:00 AM to 11:59 AM | 22 (0.7%) | 35 (0.9%) |
| 12:00 PM to 3:59 PM | 216 (7.2%) | 567 (14.8%) |
| 4:00 PM to 11:59 PM | 151 (5.1%) | 149 (3.9%) |
| Total | 2,983 (100.0%) | 3,817 (100.0%) |
Housing Occupancy in Gulf Shores
Occupancy by Ownership in Gulf Shores
Of the total 6,981 dwellings in Gulf Shores, owner-occupied units account for 4,623 (66.2%), while renter-occupied units make up 2,358 (33.8%).
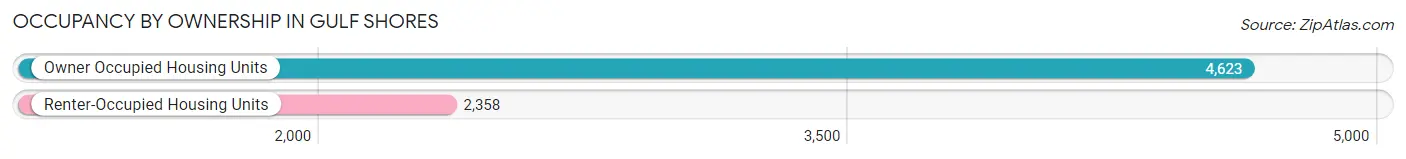
| Occupancy | # Housing Units | % Housing Units |
| Owner Occupied Housing Units | 4,623 | 66.2% |
| Renter-Occupied Housing Units | 2,358 | 33.8% |
| Total Occupied Housing Units | 6,981 | 100.0% |
Occupancy by Household Size in Gulf Shores
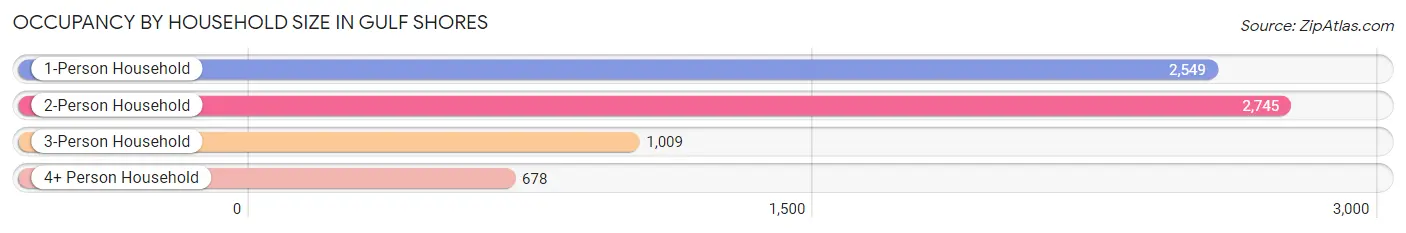
| Household Size | # Housing Units | % Housing Units |
| 1-Person Household | 2,549 | 36.5% |
| 2-Person Household | 2,745 | 39.3% |
| 3-Person Household | 1,009 | 14.4% |
| 4+ Person Household | 678 | 9.7% |
| Total Housing Units | 6,981 | 100.0% |
Occupancy by Ownership by Household Size in Gulf Shores
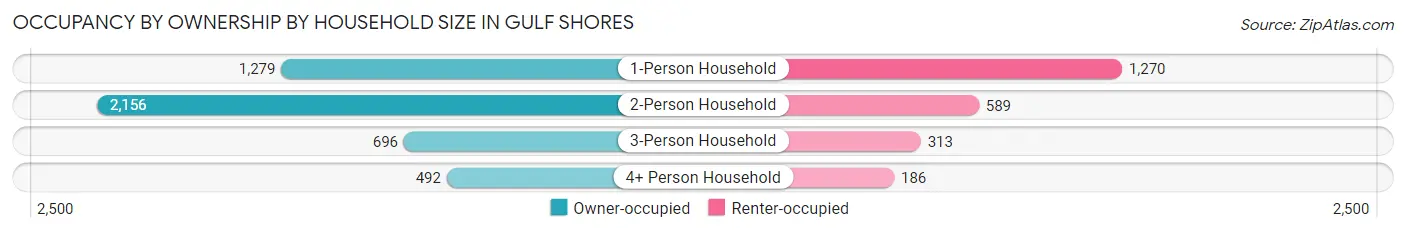
| Household Size | Owner-occupied | Renter-occupied |
| 1-Person Household | 1,279 (50.2%) | 1,270 (49.8%) |
| 2-Person Household | 2,156 (78.5%) | 589 (21.5%) |
| 3-Person Household | 696 (69.0%) | 313 (31.0%) |
| 4+ Person Household | 492 (72.6%) | 186 (27.4%) |
| Total Housing Units | 4,623 (66.2%) | 2,358 (33.8%) |
Occupancy by Educational Attainment in Gulf Shores
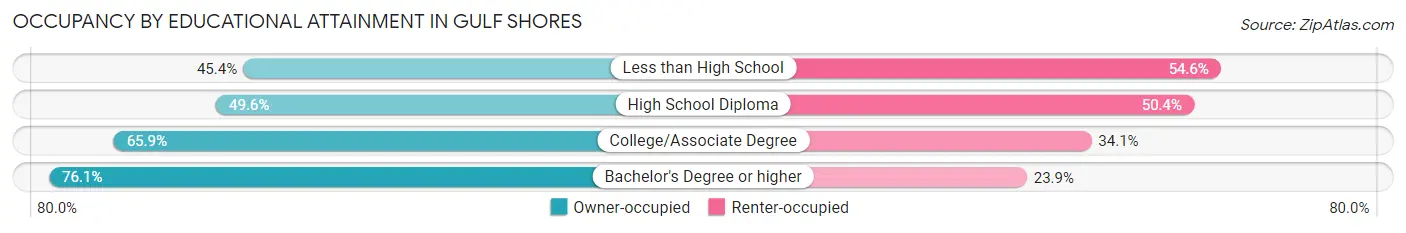
| Household Size | Owner-occupied | Renter-occupied |
| Less than High School | 88 (45.4%) | 106 (54.6%) |
| High School Diploma | 713 (49.6%) | 724 (50.4%) |
| College/Associate Degree | 1,605 (65.9%) | 832 (34.1%) |
| Bachelor's Degree or higher | 2,217 (76.1%) | 696 (23.9%) |
Occupancy by Age of Householder in Gulf Shores
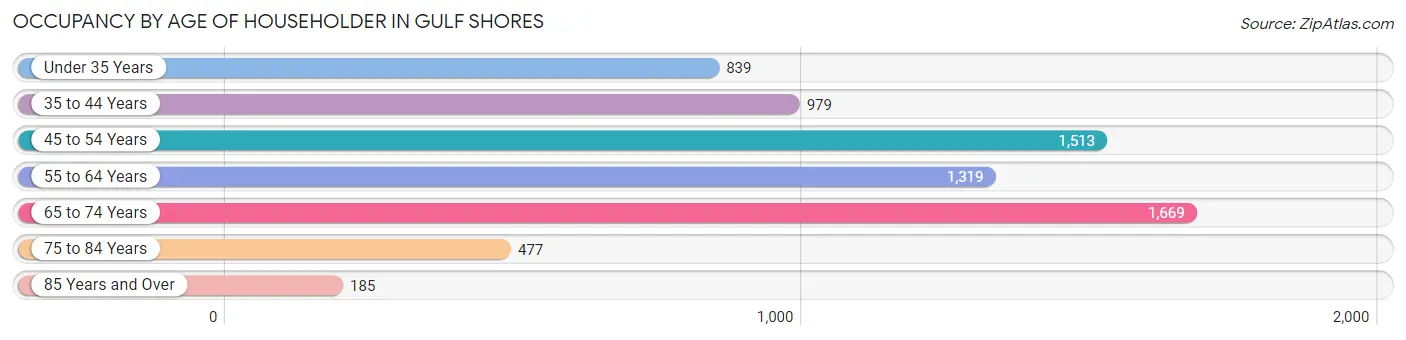
| Age Bracket | # Households | % Households |
| Under 35 Years | 839 | 12.0% |
| 35 to 44 Years | 979 | 14.0% |
| 45 to 54 Years | 1,513 | 21.7% |
| 55 to 64 Years | 1,319 | 18.9% |
| 65 to 74 Years | 1,669 | 23.9% |
| 75 to 84 Years | 477 | 6.8% |
| 85 Years and Over | 185 | 2.6% |
| Total | 6,981 | 100.0% |
Housing Finances in Gulf Shores
Median Income by Occupancy in Gulf Shores
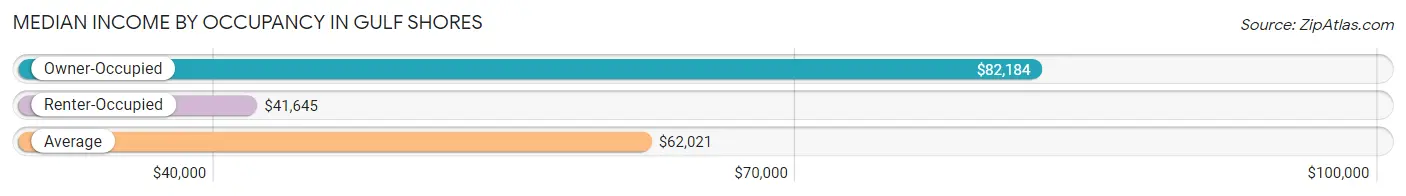
| Occupancy Type | # Households | Median Income |
| Owner-Occupied | 4,623 (66.2%) | $82,184 |
| Renter-Occupied | 2,358 (33.8%) | $41,645 |
| Average | 6,981 (100.0%) | $62,021 |
Occupancy by Householder Income Bracket in Gulf Shores
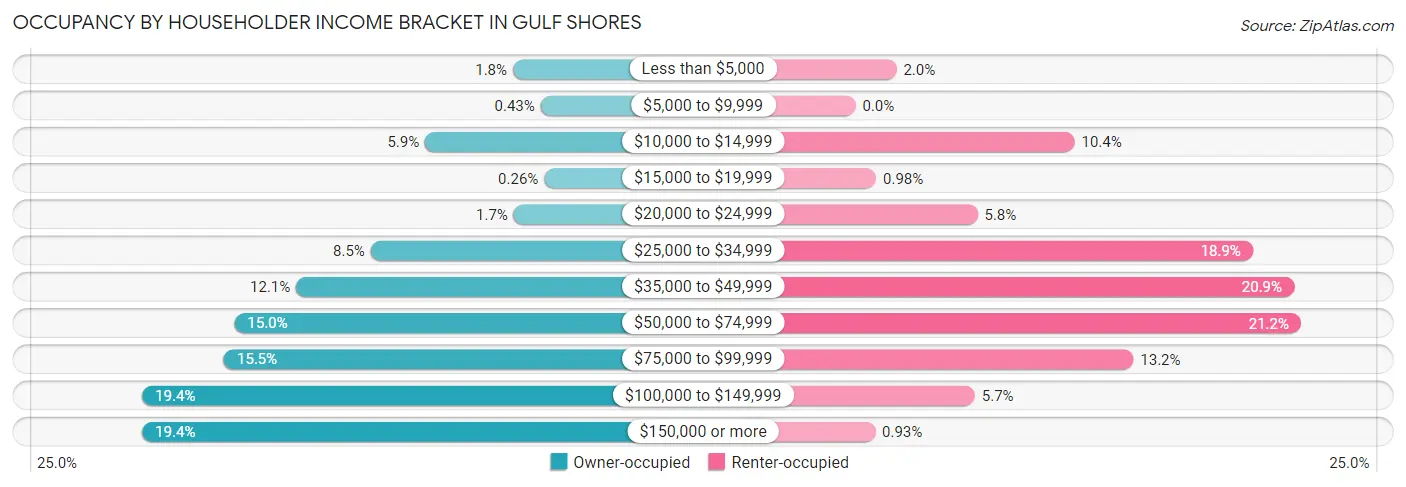
| Income Bracket | Owner-occupied | Renter-occupied |
| Less than $5,000 | 81 (1.8%) | 46 (1.9%) |
| $5,000 to $9,999 | 20 (0.4%) | 0 (0.0%) |
| $10,000 to $14,999 | 274 (5.9%) | 246 (10.4%) |
| $15,000 to $19,999 | 12 (0.3%) | 23 (1.0%) |
| $20,000 to $24,999 | 79 (1.7%) | 137 (5.8%) |
| $25,000 to $34,999 | 394 (8.5%) | 446 (18.9%) |
| $35,000 to $49,999 | 558 (12.1%) | 492 (20.9%) |
| $50,000 to $74,999 | 694 (15.0%) | 500 (21.2%) |
| $75,000 to $99,999 | 717 (15.5%) | 312 (13.2%) |
| $100,000 to $149,999 | 897 (19.4%) | 134 (5.7%) |
| $150,000 or more | 897 (19.4%) | 22 (0.9%) |
| Total | 4,623 (100.0%) | 2,358 (100.0%) |
Monthly Housing Cost Tiers in Gulf Shores
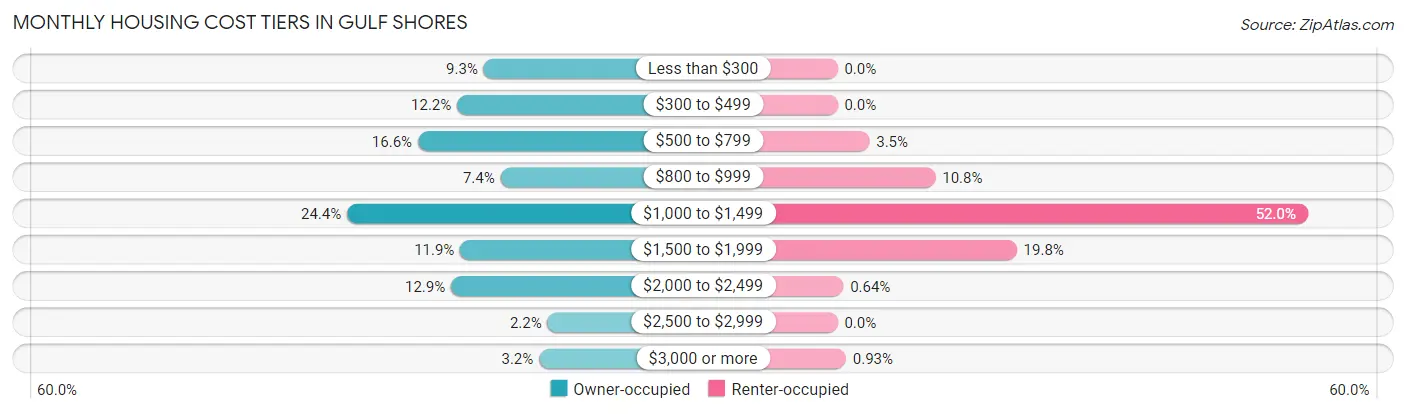
| Monthly Cost | Owner-occupied | Renter-occupied |
| Less than $300 | 429 (9.3%) | 0 (0.0%) |
| $300 to $499 | 565 (12.2%) | 0 (0.0%) |
| $500 to $799 | 765 (16.6%) | 83 (3.5%) |
| $800 to $999 | 343 (7.4%) | 255 (10.8%) |
| $1,000 to $1,499 | 1,127 (24.4%) | 1,225 (51.9%) |
| $1,500 to $1,999 | 549 (11.9%) | 467 (19.8%) |
| $2,000 to $2,499 | 596 (12.9%) | 15 (0.6%) |
| $2,500 to $2,999 | 103 (2.2%) | 0 (0.0%) |
| $3,000 or more | 146 (3.2%) | 22 (0.9%) |
| Total | 4,623 (100.0%) | 2,358 (100.0%) |
Physical Housing Characteristics in Gulf Shores
Housing Structures in Gulf Shores
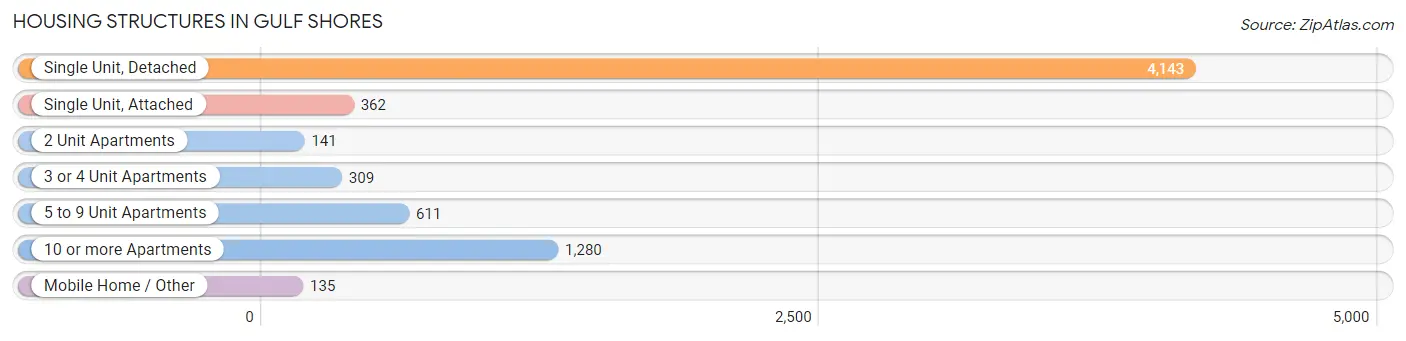
| Structure Type | # Housing Units | % Housing Units |
| Single Unit, Detached | 4,143 | 59.4% |
| Single Unit, Attached | 362 | 5.2% |
| 2 Unit Apartments | 141 | 2.0% |
| 3 or 4 Unit Apartments | 309 | 4.4% |
| 5 to 9 Unit Apartments | 611 | 8.7% |
| 10 or more Apartments | 1,280 | 18.3% |
| Mobile Home / Other | 135 | 1.9% |
| Total | 6,981 | 100.0% |
Housing Structures by Occupancy in Gulf Shores
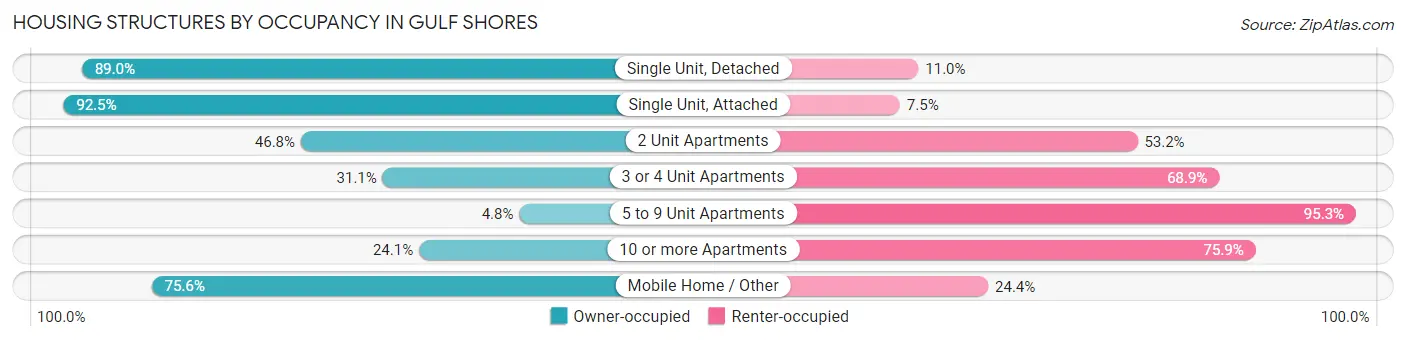
| Structure Type | Owner-occupied | Renter-occupied |
| Single Unit, Detached | 3,687 (89.0%) | 456 (11.0%) |
| Single Unit, Attached | 335 (92.5%) | 27 (7.5%) |
| 2 Unit Apartments | 66 (46.8%) | 75 (53.2%) |
| 3 or 4 Unit Apartments | 96 (31.1%) | 213 (68.9%) |
| 5 to 9 Unit Apartments | 29 (4.8%) | 582 (95.3%) |
| 10 or more Apartments | 308 (24.1%) | 972 (75.9%) |
| Mobile Home / Other | 102 (75.6%) | 33 (24.4%) |
| Total | 4,623 (66.2%) | 2,358 (33.8%) |
Housing Structures by Number of Rooms in Gulf Shores
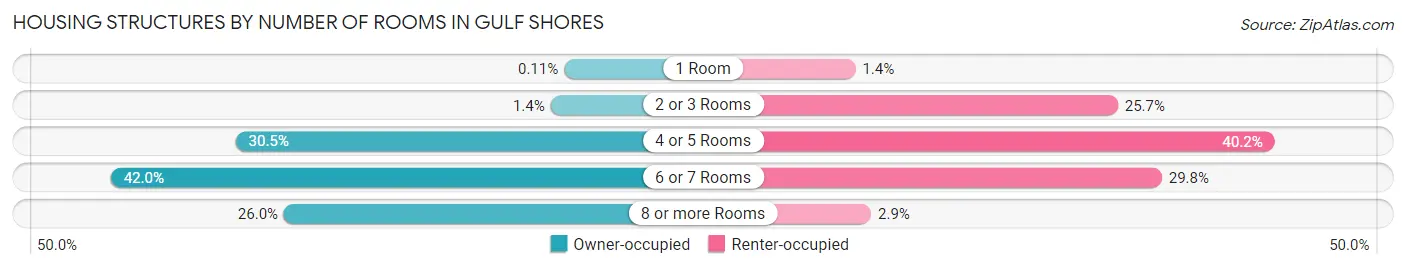
| Number of Rooms | Owner-occupied | Renter-occupied |
| 1 Room | 5 (0.1%) | 34 (1.4%) |
| 2 or 3 Rooms | 63 (1.4%) | 606 (25.7%) |
| 4 or 5 Rooms | 1,409 (30.5%) | 948 (40.2%) |
| 6 or 7 Rooms | 1,943 (42.0%) | 702 (29.8%) |
| 8 or more Rooms | 1,203 (26.0%) | 68 (2.9%) |
| Total | 4,623 (100.0%) | 2,358 (100.0%) |
Housing Structure by Heating Type in Gulf Shores
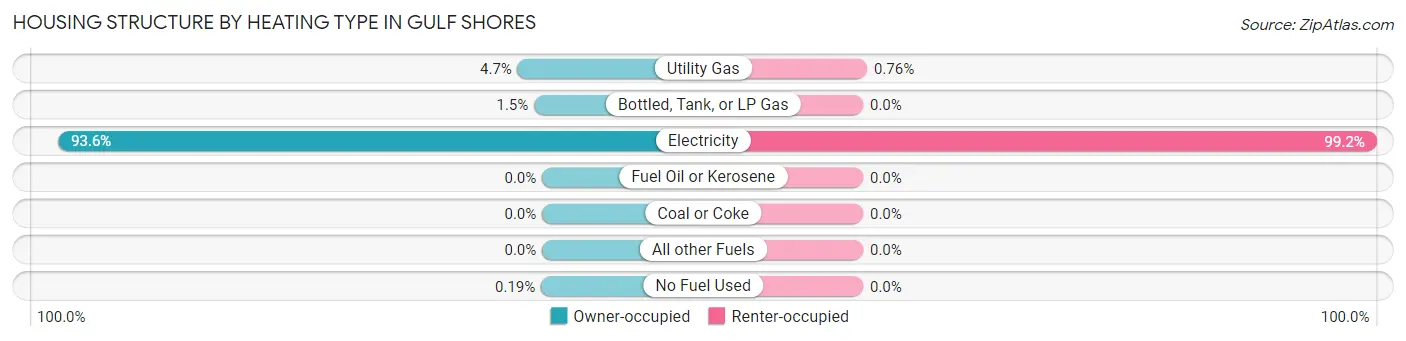
| Heating Type | Owner-occupied | Renter-occupied |
| Utility Gas | 218 (4.7%) | 18 (0.8%) |
| Bottled, Tank, or LP Gas | 71 (1.5%) | 0 (0.0%) |
| Electricity | 4,325 (93.5%) | 2,340 (99.2%) |
| Fuel Oil or Kerosene | 0 (0.0%) | 0 (0.0%) |
| Coal or Coke | 0 (0.0%) | 0 (0.0%) |
| All other Fuels | 0 (0.0%) | 0 (0.0%) |
| No Fuel Used | 9 (0.2%) | 0 (0.0%) |
| Total | 4,623 (100.0%) | 2,358 (100.0%) |
Household Vehicle Usage in Gulf Shores
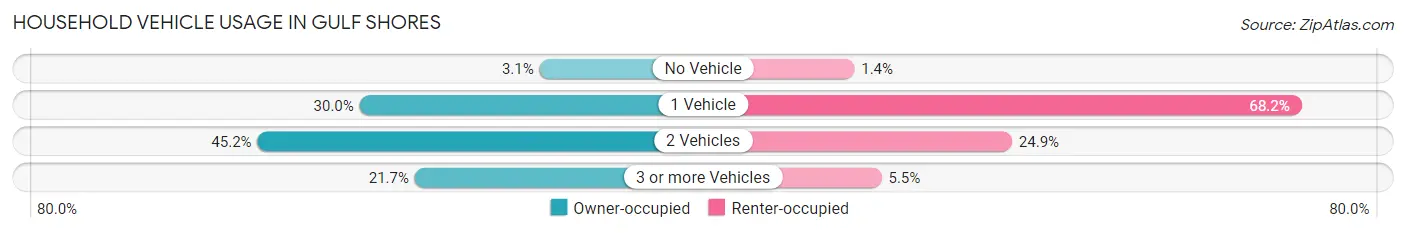
| Vehicles per Household | Owner-occupied | Renter-occupied |
| No Vehicle | 143 (3.1%) | 33 (1.4%) |
| 1 Vehicle | 1,385 (30.0%) | 1,608 (68.2%) |
| 2 Vehicles | 2,091 (45.2%) | 588 (24.9%) |
| 3 or more Vehicles | 1,004 (21.7%) | 129 (5.5%) |
| Total | 4,623 (100.0%) | 2,358 (100.0%) |
Real Estate & Mortgages in Gulf Shores
Real Estate and Mortgage Overview in Gulf Shores
| Characteristic | Without Mortgage | With Mortgage |
| Housing Units | 2,196 | 2,427 |
| Median Property Value | $339,900 | $322,000 |
| Median Household Income | $63,676 | $620 |
| Monthly Housing Costs | $539 | $146 |
| Real Estate Taxes | $909 | $196 |
Property Value by Mortgage Status in Gulf Shores
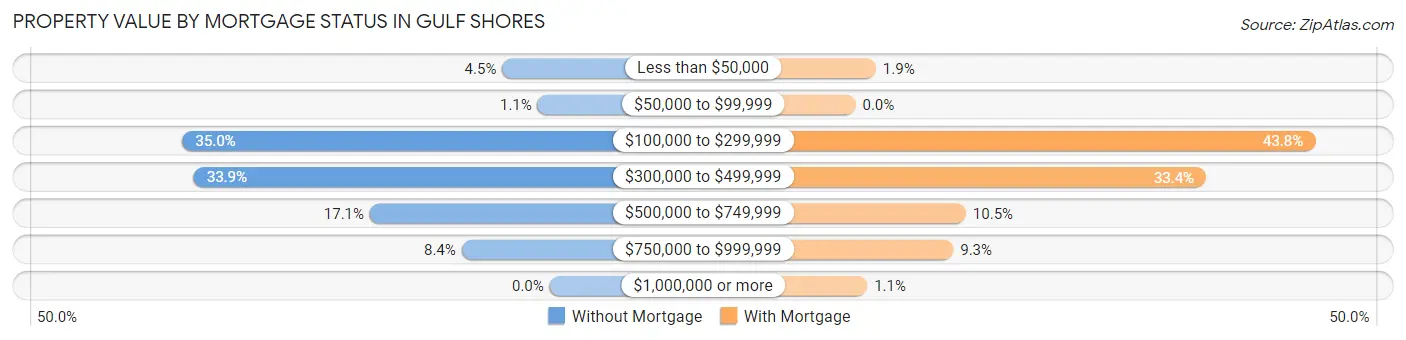
| Property Value | Without Mortgage | With Mortgage |
| Less than $50,000 | 99 (4.5%) | 47 (1.9%) |
| $50,000 to $99,999 | 25 (1.1%) | 0 (0.0%) |
| $100,000 to $299,999 | 768 (35.0%) | 1,062 (43.8%) |
| $300,000 to $499,999 | 744 (33.9%) | 810 (33.4%) |
| $500,000 to $749,999 | 376 (17.1%) | 255 (10.5%) |
| $750,000 to $999,999 | 184 (8.4%) | 226 (9.3%) |
| $1,000,000 or more | 0 (0.0%) | 27 (1.1%) |
| Total | 2,196 (100.0%) | 2,427 (100.0%) |
Household Income by Mortgage Status in Gulf Shores
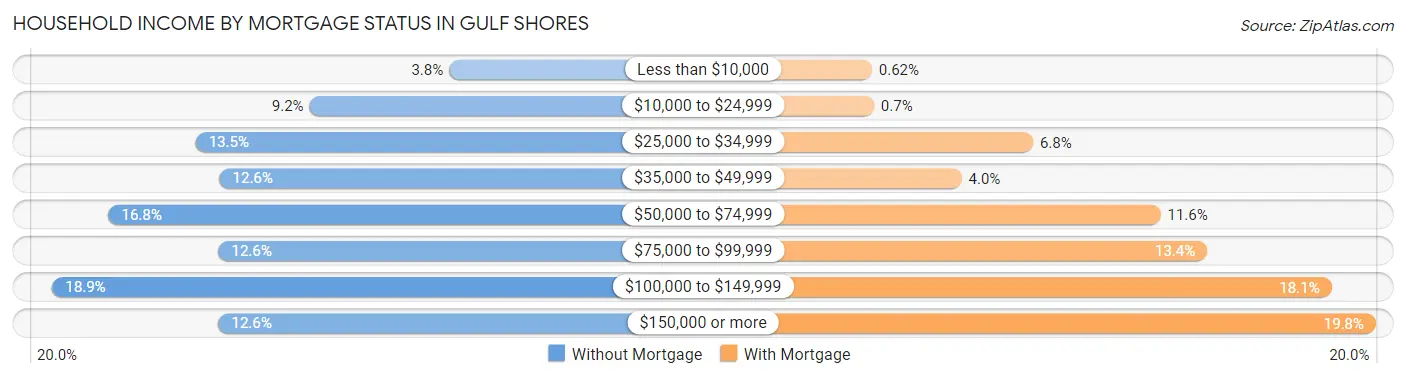
| Household Income | Without Mortgage | With Mortgage |
| Less than $10,000 | 84 (3.8%) | 15 (0.6%) |
| $10,000 to $24,999 | 201 (9.1%) | 17 (0.7%) |
| $25,000 to $34,999 | 296 (13.5%) | 164 (6.8%) |
| $35,000 to $49,999 | 276 (12.6%) | 98 (4.0%) |
| $50,000 to $74,999 | 369 (16.8%) | 282 (11.6%) |
| $75,000 to $99,999 | 277 (12.6%) | 325 (13.4%) |
| $100,000 to $149,999 | 416 (18.9%) | 440 (18.1%) |
| $150,000 or more | 277 (12.6%) | 481 (19.8%) |
| Total | 2,196 (100.0%) | 2,427 (100.0%) |
Property Value to Household Income Ratio in Gulf Shores
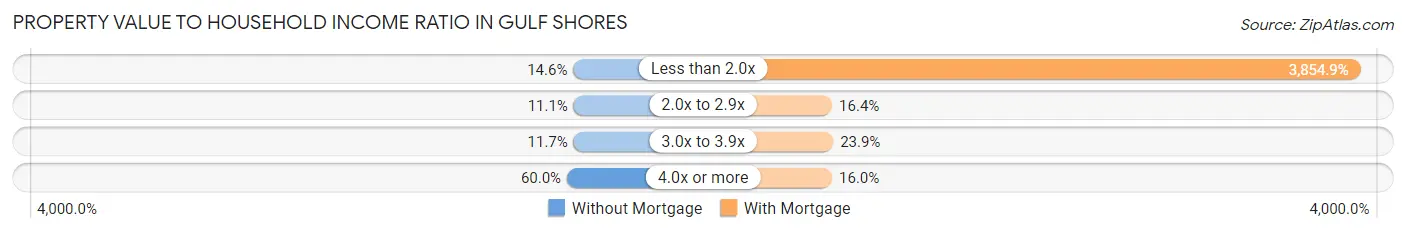
| Value-to-Income Ratio | Without Mortgage | With Mortgage |
| Less than 2.0x | 320 (14.6%) | 93,559 (3,854.9%) |
| 2.0x to 2.9x | 244 (11.1%) | 398 (16.4%) |
| 3.0x to 3.9x | 257 (11.7%) | 580 (23.9%) |
| 4.0x or more | 1,318 (60.0%) | 388 (16.0%) |
| Total | 2,196 (100.0%) | 2,427 (100.0%) |
Real Estate Taxes by Mortgage Status in Gulf Shores
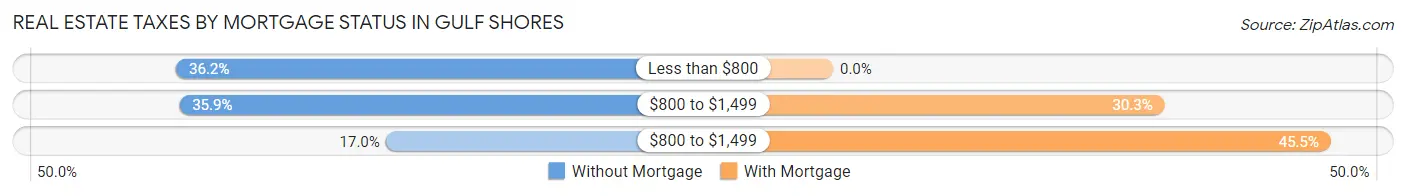
| Property Taxes | Without Mortgage | With Mortgage |
| Less than $800 | 794 (36.2%) | 0 (0.0%) |
| $800 to $1,499 | 788 (35.9%) | 735 (30.3%) |
| $800 to $1,499 | 374 (17.0%) | 1,103 (45.5%) |
| Total | 2,196 (100.0%) | 2,427 (100.0%) |
Health & Disability in Gulf Shores
Health Insurance Coverage by Age in Gulf Shores
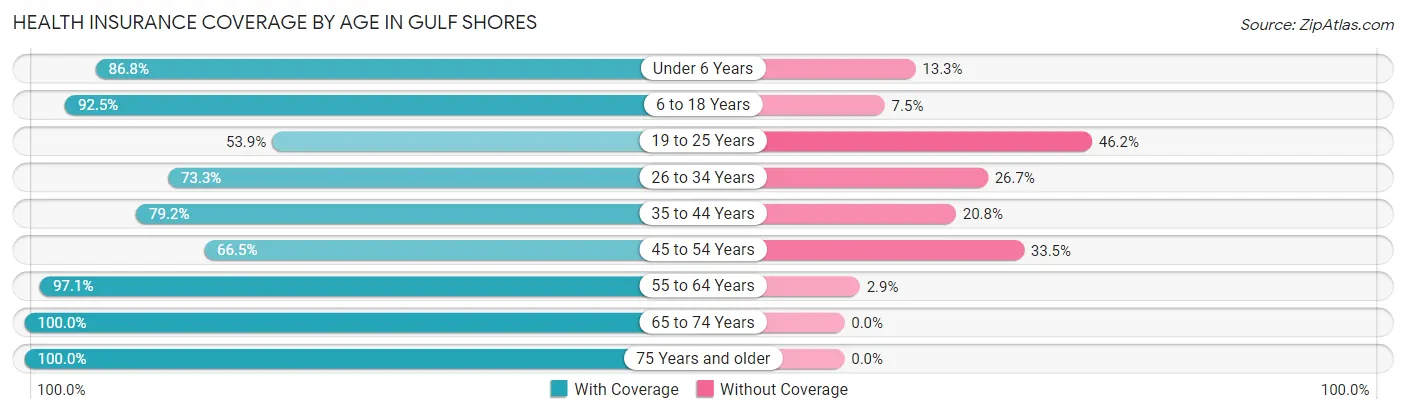
| Age Bracket | With Coverage | Without Coverage |
| Under 6 Years | 216 (86.8%) | 33 (13.3%) |
| 6 to 18 Years | 1,915 (92.5%) | 156 (7.5%) |
| 19 to 25 Years | 532 (53.8%) | 456 (46.2%) |
| 26 to 34 Years | 1,074 (73.3%) | 392 (26.7%) |
| 35 to 44 Years | 1,458 (79.2%) | 383 (20.8%) |
| 45 to 54 Years | 1,506 (66.5%) | 758 (33.5%) |
| 55 to 64 Years | 2,193 (97.1%) | 65 (2.9%) |
| 65 to 74 Years | 2,704 (100.0%) | 0 (0.0%) |
| 75 Years and older | 1,317 (100.0%) | 0 (0.0%) |
| Total | 12,915 (85.2%) | 2,243 (14.8%) |
Health Insurance Coverage by Citizenship Status in Gulf Shores
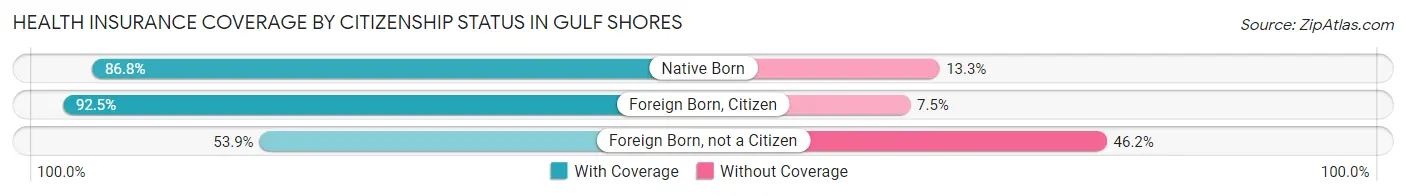
| Citizenship Status | With Coverage | Without Coverage |
| Native Born | 216 (86.8%) | 33 (13.3%) |
| Foreign Born, Citizen | 1,915 (92.5%) | 156 (7.5%) |
| Foreign Born, not a Citizen | 532 (53.8%) | 456 (46.2%) |
Health Insurance Coverage by Household Income in Gulf Shores
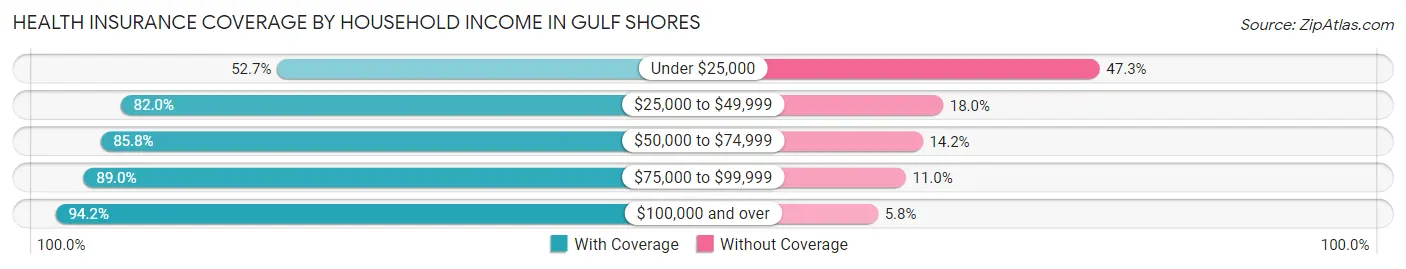
| Household Income | With Coverage | Without Coverage |
| Under $25,000 | 917 (52.7%) | 824 (47.3%) |
| $25,000 to $49,999 | 2,239 (82.0%) | 491 (18.0%) |
| $50,000 to $74,999 | 1,938 (85.8%) | 320 (14.2%) |
| $75,000 to $99,999 | 2,055 (89.0%) | 254 (11.0%) |
| $100,000 and over | 5,761 (94.2%) | 354 (5.8%) |
Public vs Private Health Insurance Coverage by Age in Gulf Shores
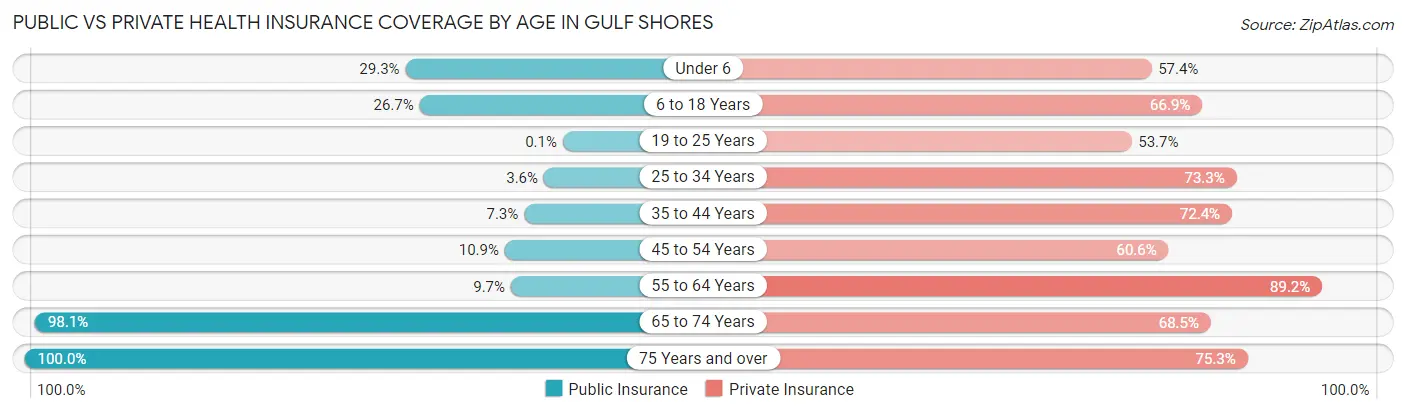
| Age Bracket | Public Insurance | Private Insurance |
| Under 6 | 73 (29.3%) | 143 (57.4%) |
| 6 to 18 Years | 553 (26.7%) | 1,385 (66.9%) |
| 19 to 25 Years | 1 (0.1%) | 531 (53.7%) |
| 25 to 34 Years | 53 (3.6%) | 1,074 (73.3%) |
| 35 to 44 Years | 134 (7.3%) | 1,333 (72.4%) |
| 45 to 54 Years | 246 (10.9%) | 1,373 (60.6%) |
| 55 to 64 Years | 220 (9.7%) | 2,013 (89.1%) |
| 65 to 74 Years | 2,652 (98.1%) | 1,852 (68.5%) |
| 75 Years and over | 1,317 (100.0%) | 992 (75.3%) |
| Total | 5,249 (34.6%) | 10,696 (70.6%) |
Disability Status by Sex by Age in Gulf Shores
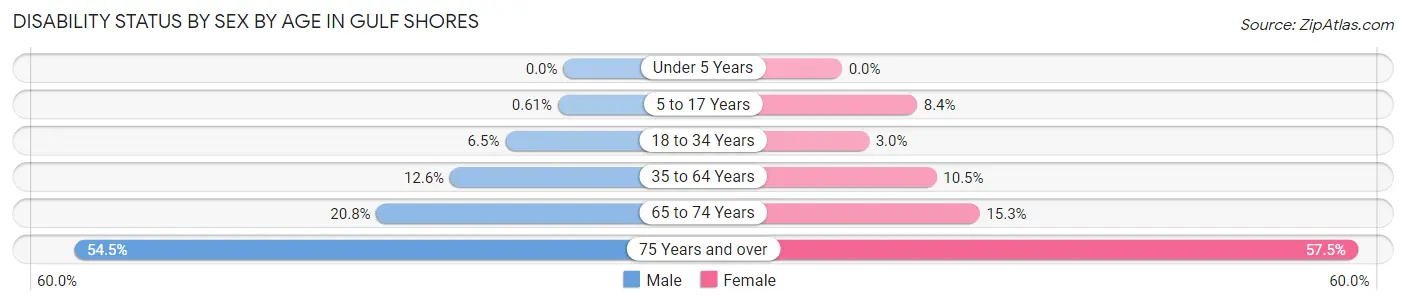
| Age Bracket | Male | Female |
| Under 5 Years | 0 (0.0%) | 0 (0.0%) |
| 5 to 17 Years | 6 (0.6%) | 80 (8.4%) |
| 18 to 34 Years | 56 (6.5%) | 52 (3.0%) |
| 35 to 64 Years | 355 (12.6%) | 374 (10.5%) |
| 65 to 74 Years | 290 (20.8%) | 201 (15.3%) |
| 75 Years and over | 286 (54.5%) | 455 (57.5%) |
Disability Class by Sex by Age in Gulf Shores
Disability Class: Hearing Difficulty
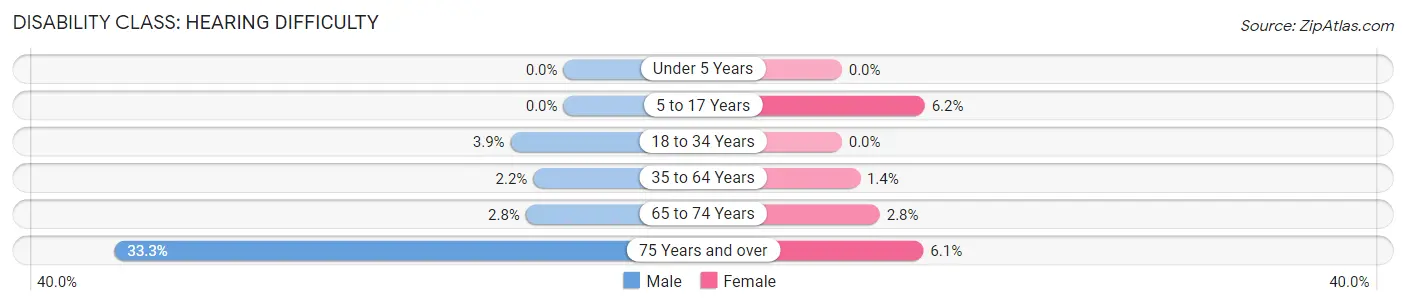
| Age Bracket | Male | Female |
| Under 5 Years | 0 (0.0%) | 0 (0.0%) |
| 5 to 17 Years | 0 (0.0%) | 59 (6.2%) |
| 18 to 34 Years | 34 (3.9%) | 0 (0.0%) |
| 35 to 64 Years | 63 (2.2%) | 48 (1.3%) |
| 65 to 74 Years | 39 (2.8%) | 37 (2.8%) |
| 75 Years and over | 175 (33.3%) | 48 (6.1%) |
Disability Class: Vision Difficulty
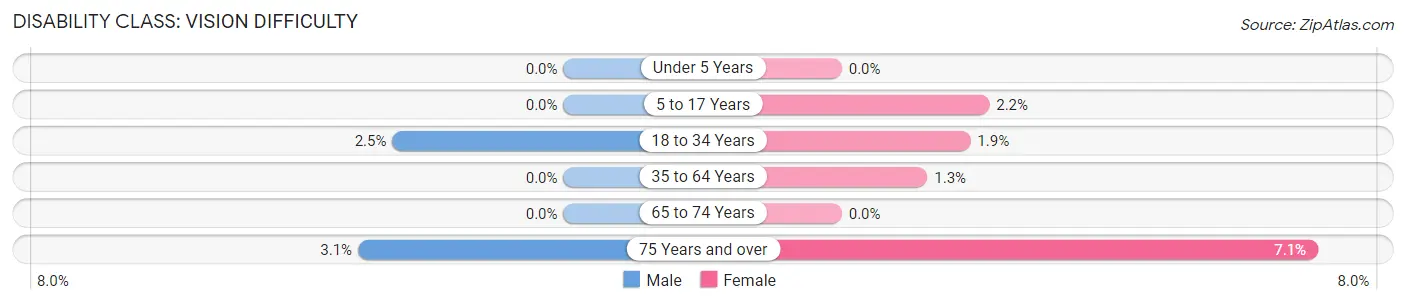
| Age Bracket | Male | Female |
| Under 5 Years | 0 (0.0%) | 0 (0.0%) |
| 5 to 17 Years | 0 (0.0%) | 21 (2.2%) |
| 18 to 34 Years | 22 (2.5%) | 33 (1.9%) |
| 35 to 64 Years | 0 (0.0%) | 45 (1.3%) |
| 65 to 74 Years | 0 (0.0%) | 0 (0.0%) |
| 75 Years and over | 16 (3.0%) | 56 (7.1%) |
Disability Class: Cognitive Difficulty
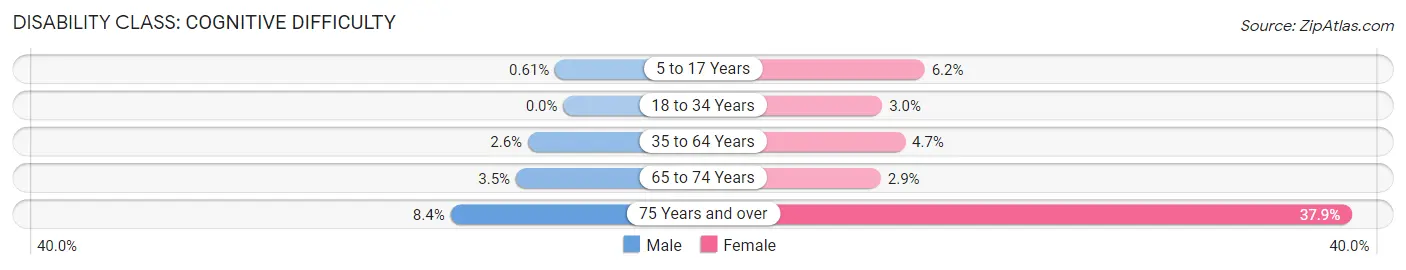
| Age Bracket | Male | Female |
| 5 to 17 Years | 6 (0.6%) | 59 (6.2%) |
| 18 to 34 Years | 0 (0.0%) | 52 (3.0%) |
| 35 to 64 Years | 74 (2.6%) | 167 (4.7%) |
| 65 to 74 Years | 49 (3.5%) | 38 (2.9%) |
| 75 Years and over | 44 (8.4%) | 300 (37.9%) |
Disability Class: Ambulatory Difficulty
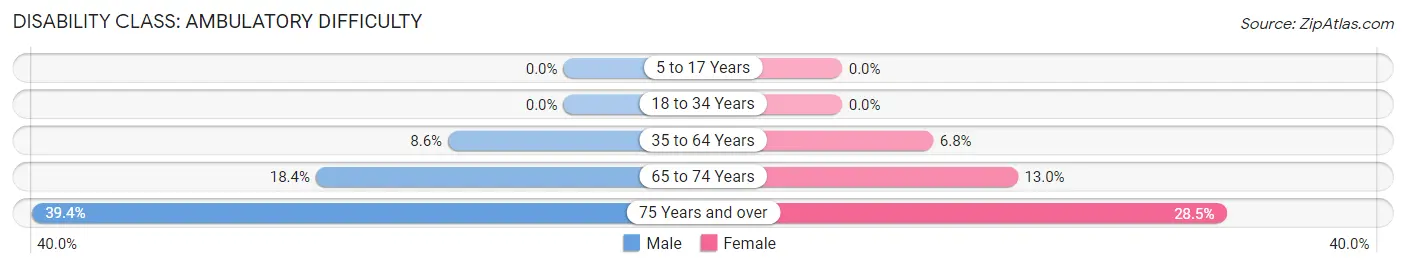
| Age Bracket | Male | Female |
| 5 to 17 Years | 0 (0.0%) | 0 (0.0%) |
| 18 to 34 Years | 0 (0.0%) | 0 (0.0%) |
| 35 to 64 Years | 241 (8.6%) | 240 (6.8%) |
| 65 to 74 Years | 256 (18.4%) | 171 (13.0%) |
| 75 Years and over | 207 (39.4%) | 226 (28.5%) |
Disability Class: Self-Care Difficulty
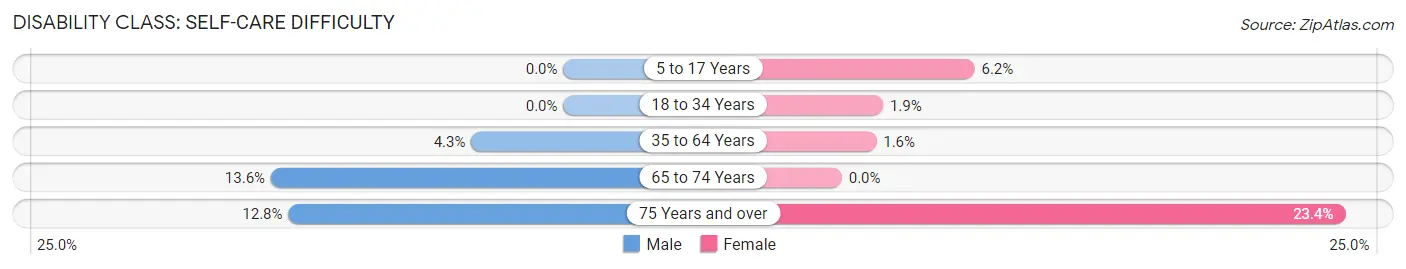
| Age Bracket | Male | Female |
| 5 to 17 Years | 0 (0.0%) | 59 (6.2%) |
| 18 to 34 Years | 0 (0.0%) | 33 (1.9%) |
| 35 to 64 Years | 120 (4.3%) | 57 (1.6%) |
| 65 to 74 Years | 189 (13.6%) | 0 (0.0%) |
| 75 Years and over | 67 (12.8%) | 185 (23.4%) |
Technology Access in Gulf Shores
Computing Device Access in Gulf Shores
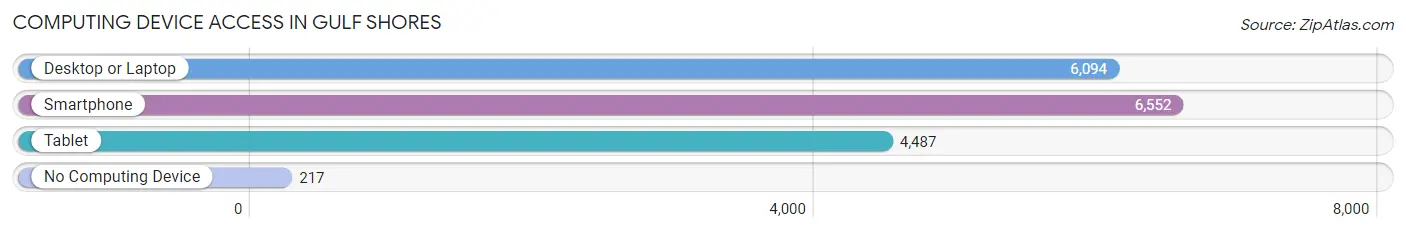
| Device Type | # Households | % Households |
| Desktop or Laptop | 6,094 | 87.3% |
| Smartphone | 6,552 | 93.9% |
| Tablet | 4,487 | 64.3% |
| No Computing Device | 217 | 3.1% |
| Total | 6,981 | 100.0% |
Internet Access in Gulf Shores
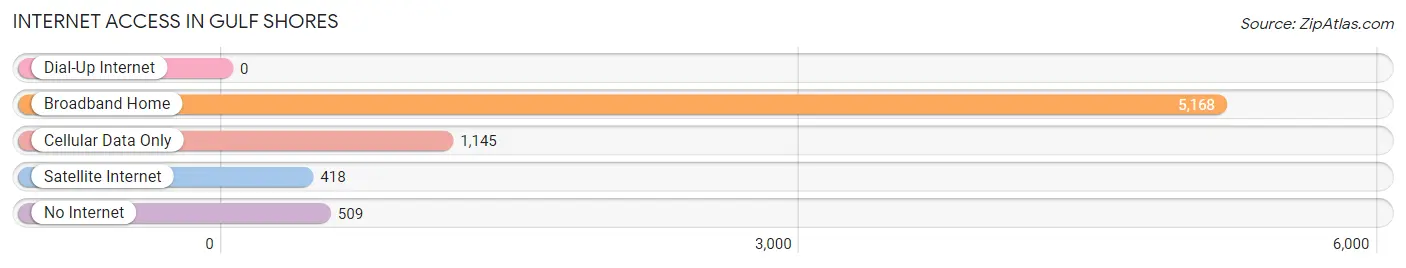
| Internet Type | # Households | % Households |
| Dial-Up Internet | 0 | 0.0% |
| Broadband Home | 5,168 | 74.0% |
| Cellular Data Only | 1,145 | 16.4% |
| Satellite Internet | 418 | 6.0% |
| No Internet | 509 | 7.3% |
| Total | 6,981 | 100.0% |
Gulf Shores Summary
Gulf Shores, Alabama is a coastal city located in Baldwin County, Alabama. It is situated on the Gulf of Mexico, and is part of the Mobile metropolitan area. The city has a population of 11,244 as of the 2010 census, and is a popular tourist destination due to its white-sand beaches and numerous attractions.
History
Gulf Shores was originally inhabited by Native American tribes, including the Choctaw and Creek. The area was first explored by Europeans in the late 17th century, and was later settled by French and Spanish colonists. The area was part of the Louisiana Purchase in 1803, and was later annexed by the United States.
In the early 19th century, the area was settled by pioneers from the United States, and the town of Gulf Shores was established in 1883. The town was named after the nearby Gulf of Mexico, and was incorporated in 1947.
Geography
Gulf Shores is located in Baldwin County, Alabama, on the Gulf of Mexico. It is situated on the western shore of Mobile Bay, and is bordered by the cities of Foley and Orange Beach. The city has a total area of 16.2 square miles, of which 15.7 square miles is land and 0.5 square miles is water.
The city has a humid subtropical climate, with hot, humid summers and mild winters. The average temperature in July is 81°F, and the average temperature in January is 51°F. The city receives an average of 62 inches of precipitation per year.
Economy
Gulf Shores is a popular tourist destination, and the city’s economy is largely based on tourism. The city is home to numerous attractions, including the Gulf State Park, Waterville USA, and the Alabama Gulf Coast Zoo. The city is also home to several golf courses, and is a popular destination for fishing and boating.
The city’s largest employers include the Gulf Shores City Schools, the Gulf Shores Hospital, and the Gulf Shores Police Department. Other major employers include the Gulf Shores Public Library, the Gulf Shores Convention and Visitors Bureau, and the Gulf Shores Chamber of Commerce.
Demographics
As of the 2010 census, Gulf Shores had a population of 11,244. The racial makeup of the city was 87.3% White, 8.2% African American, 0.7% Native American, 0.9% Asian, 0.1% Pacific Islander, 1.2% from other races, and 1.6% from two or more races. Hispanic or Latino of any race were 3.2% of the population.
The median income for a household in the city was $45,945, and the median income for a family was $54,945. The per capita income for the city was $25,945. About 8.2% of families and 11.2% of the population were below the poverty line, including 16.2% of those under age 18 and 6.2% of those age 65 or over.
Common Questions
What is Per Capita Income in Gulf Shores?
Per Capita income in Gulf Shores is $41,513.
What is the Median Family Income in Gulf Shores?
Median Family Income in Gulf Shores is $86,892.
What is the Median Household income in Gulf Shores?
Median Household Income in Gulf Shores is $62,021.
What is Income or Wage Gap in Gulf Shores?
Income or Wage Gap in Gulf Shores is 34.8%.
Women in Gulf Shores earn 65.2 cents for every dollar earned by a man.
What is Inequality or Gini Index in Gulf Shores?
Inequality or Gini Index in Gulf Shores is 0.45.
What is the Total Population of Gulf Shores?
Total Population of Gulf Shores is 15,178.
What is the Total Male Population of Gulf Shores?
Total Male Population of Gulf Shores is 6,699.
What is the Total Female Population of Gulf Shores?
Total Female Population of Gulf Shores is 8,479.
What is the Ratio of Males per 100 Females in Gulf Shores?
There are 79.01 Males per 100 Females in Gulf Shores.
What is the Ratio of Females per 100 Males in Gulf Shores?
There are 126.57 Females per 100 Males in Gulf Shores.
What is the Median Population Age in Gulf Shores?
Median Population Age in Gulf Shores is 50.4 Years.
What is the Average Family Size in Gulf Shores
Average Family Size in Gulf Shores is 2.8 People.
What is the Average Household Size in Gulf Shores
Average Household Size in Gulf Shores is 2.2 People.
How Large is the Labor Force in Gulf Shores?
There are 8,157 People in the Labor Forcein in Gulf Shores.
What is the Percentage of People in the Labor Force in Gulf Shores?
60.5% of People are in the Labor Force in Gulf Shores.
What is the Unemployment Rate in Gulf Shores?
Unemployment Rate in Gulf Shores is 2.4%.