Roanoke, AL Map & Demographics
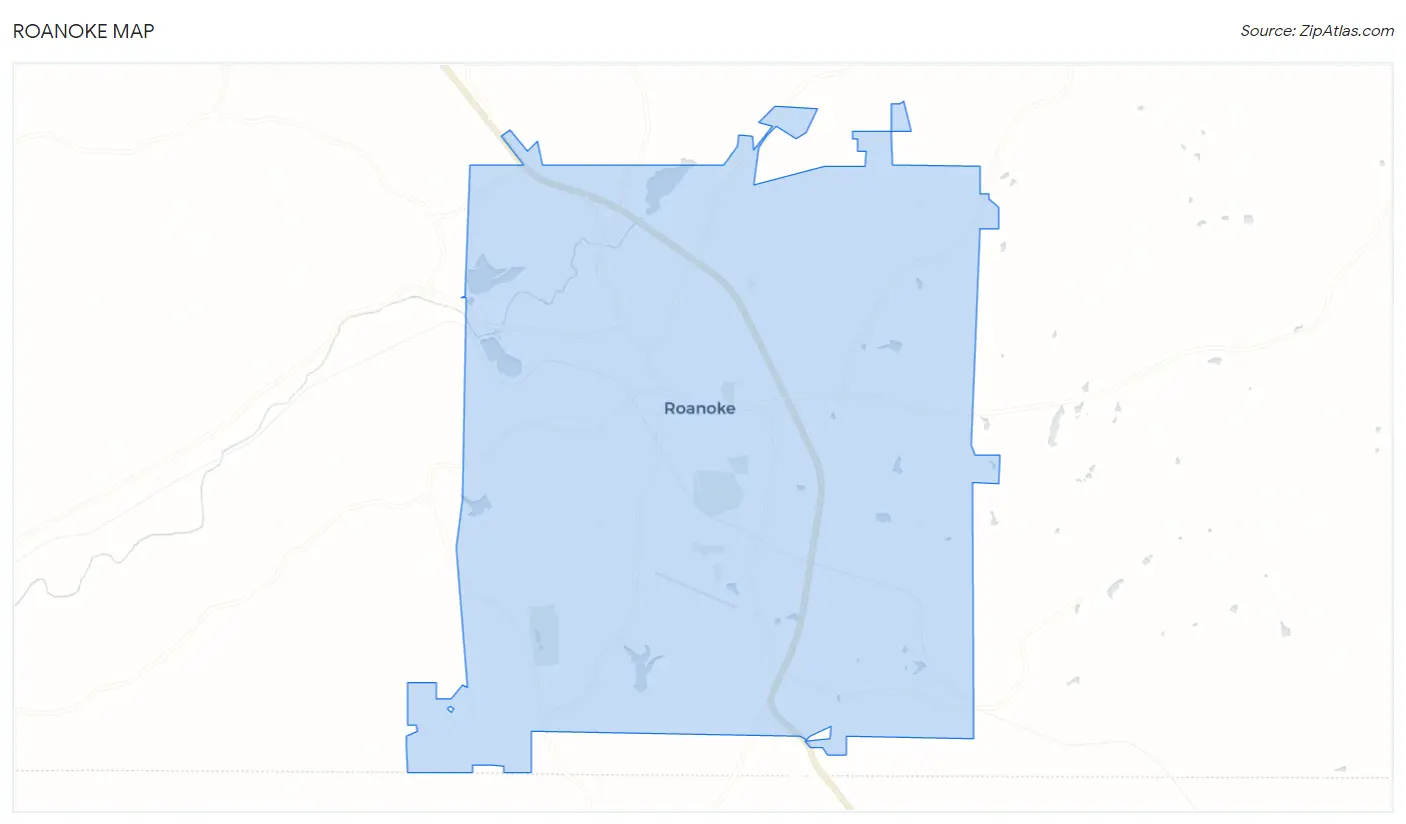
Roanoke Map
Roanoke Overview
$23,242
PER CAPITA INCOME
$55,924
AVG FAMILY INCOME
$43,664
AVG HOUSEHOLD INCOME
23.6%
WAGE / INCOME GAP [ % ]
76.4¢/ $1
WAGE / INCOME GAP [ $ ]
0.45
INEQUALITY / GINI INDEX
5,346
TOTAL POPULATION
2,613
MALE POPULATION
2,733
FEMALE POPULATION
95.61
MALES / 100 FEMALES
104.59
FEMALES / 100 MALES
43.4
MEDIAN AGE
3.0
AVG FAMILY SIZE
2.5
AVG HOUSEHOLD SIZE
2,256
LABOR FORCE [ PEOPLE ]
51.4%
PERCENT IN LABOR FORCE
3.4%
UNEMPLOYMENT RATE
Roanoke Zip Codes
Roanoke Area Codes
Income in Roanoke
Income Overview in Roanoke
Per Capita Income in Roanoke is $23,242, while median incomes of families and households are $55,924 and $43,664 respectively.
| Characteristic | Number | Measure |
| Per Capita Income | 5,346 | $23,242 |
| Median Family Income | 1,476 | $55,924 |
| Mean Family Income | 1,476 | $68,875 |
| Median Household Income | 2,101 | $43,664 |
| Mean Household Income | 2,101 | $56,369 |
| Income Deficit | 1,476 | $0 |
| Wage / Income Gap (%) | 5,346 | 23.58% |
| Wage / Income Gap ($) | 5,346 | 76.42¢ per $1 |
| Gini / Inequality Index | 5,346 | 0.45 |
Earnings by Sex in Roanoke
Average Earnings in Roanoke are $30,515, $38,125 for men and $29,135 for women, a difference of 23.6%.
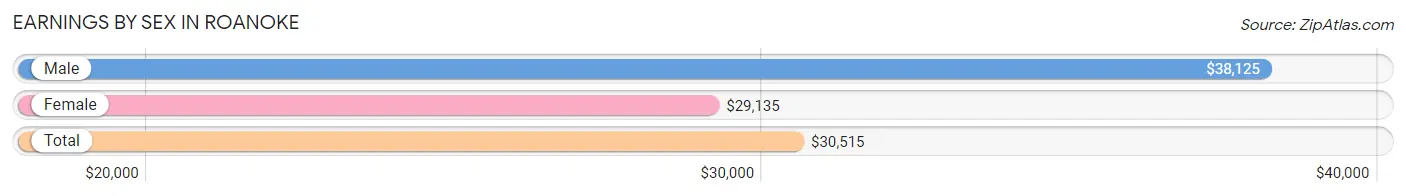
| Sex | Number | Average Earnings |
| Male | 1,100 (46.4%) | $38,125 |
| Female | 1,272 (53.6%) | $29,135 |
| Total | 2,372 (100.0%) | $30,515 |
Earnings by Sex by Income Bracket in Roanoke
The most common earnings brackets in Roanoke are $25,000 to $29,999 for men (168 | 15.3%) and $30,000 to $34,999 for women (203 | 16.0%).
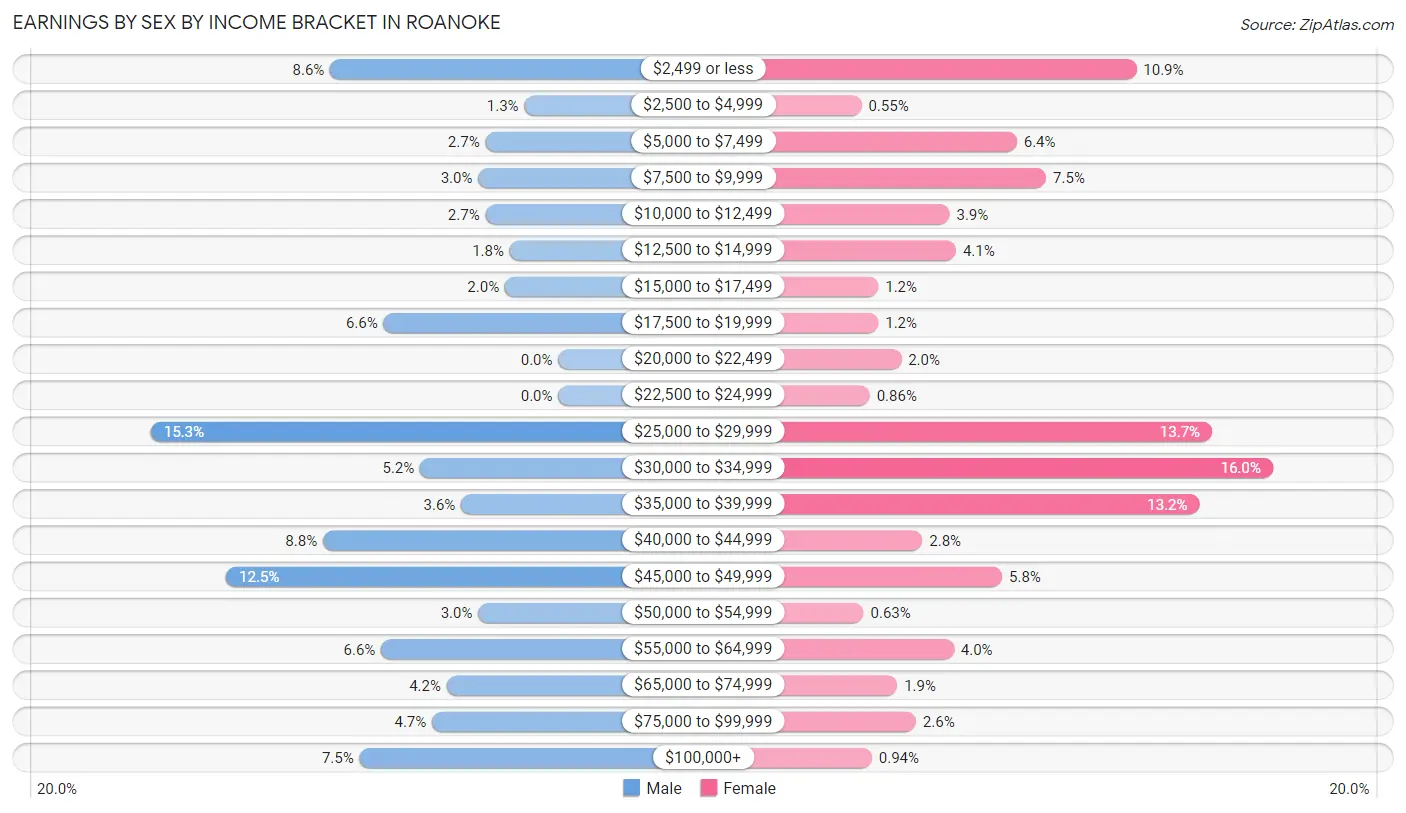
| Income | Male | Female |
| $2,499 or less | 94 (8.6%) | 138 (10.8%) |
| $2,500 to $4,999 | 14 (1.3%) | 7 (0.5%) |
| $5,000 to $7,499 | 30 (2.7%) | 81 (6.4%) |
| $7,500 to $9,999 | 33 (3.0%) | 95 (7.5%) |
| $10,000 to $12,499 | 30 (2.7%) | 49 (3.8%) |
| $12,500 to $14,999 | 20 (1.8%) | 52 (4.1%) |
| $15,000 to $17,499 | 22 (2.0%) | 15 (1.2%) |
| $17,500 to $19,999 | 72 (6.6%) | 15 (1.2%) |
| $20,000 to $22,499 | 0 (0.0%) | 26 (2.0%) |
| $22,500 to $24,999 | 0 (0.0%) | 11 (0.9%) |
| $25,000 to $29,999 | 168 (15.3%) | 174 (13.7%) |
| $30,000 to $34,999 | 57 (5.2%) | 203 (16.0%) |
| $35,000 to $39,999 | 40 (3.6%) | 168 (13.2%) |
| $40,000 to $44,999 | 97 (8.8%) | 36 (2.8%) |
| $45,000 to $49,999 | 137 (12.4%) | 74 (5.8%) |
| $50,000 to $54,999 | 33 (3.0%) | 8 (0.6%) |
| $55,000 to $64,999 | 73 (6.6%) | 51 (4.0%) |
| $65,000 to $74,999 | 46 (4.2%) | 24 (1.9%) |
| $75,000 to $99,999 | 52 (4.7%) | 33 (2.6%) |
| $100,000+ | 82 (7.4%) | 12 (0.9%) |
| Total | 1,100 (100.0%) | 1,272 (100.0%) |
Earnings by Sex by Educational Attainment in Roanoke
Average earnings in Roanoke are $42,029 for men and $30,344 for women, a difference of 27.8%. Men with an educational attainment of high school diploma enjoy the highest average annual earnings of $45,633, while those with college or associate's degree education earn the least with $34,435. Women with an educational attainment of bachelor's degree earn the most with the average annual earnings of $41,023, while those with college or associate's degree education have the smallest earnings of $27,766.
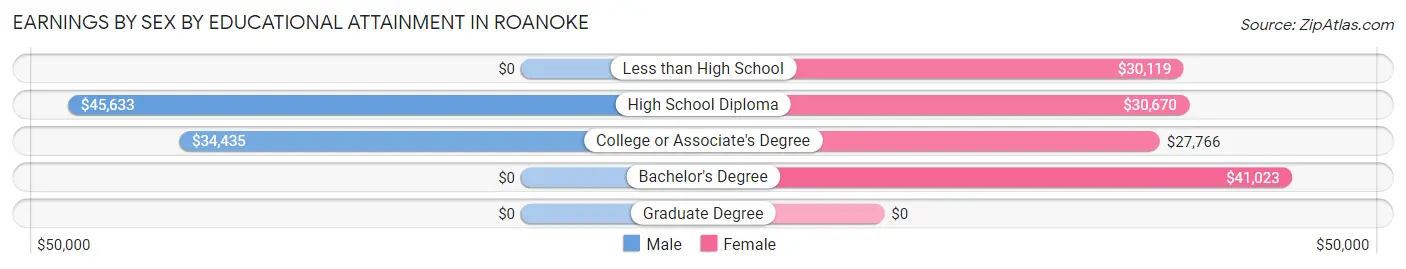
| Educational Attainment | Male Income | Female Income |
| Less than High School | - | - |
| High School Diploma | $45,633 | $30,670 |
| College or Associate's Degree | $34,435 | $27,766 |
| Bachelor's Degree | - | - |
| Graduate Degree | - | - |
| Total | $42,029 | $30,344 |
Family Income in Roanoke
Family Income Brackets in Roanoke
According to the Roanoke family income data, there are 370 families falling into the $50,000 to $74,999 income range, which is the most common income bracket and makes up 25.1% of all families.
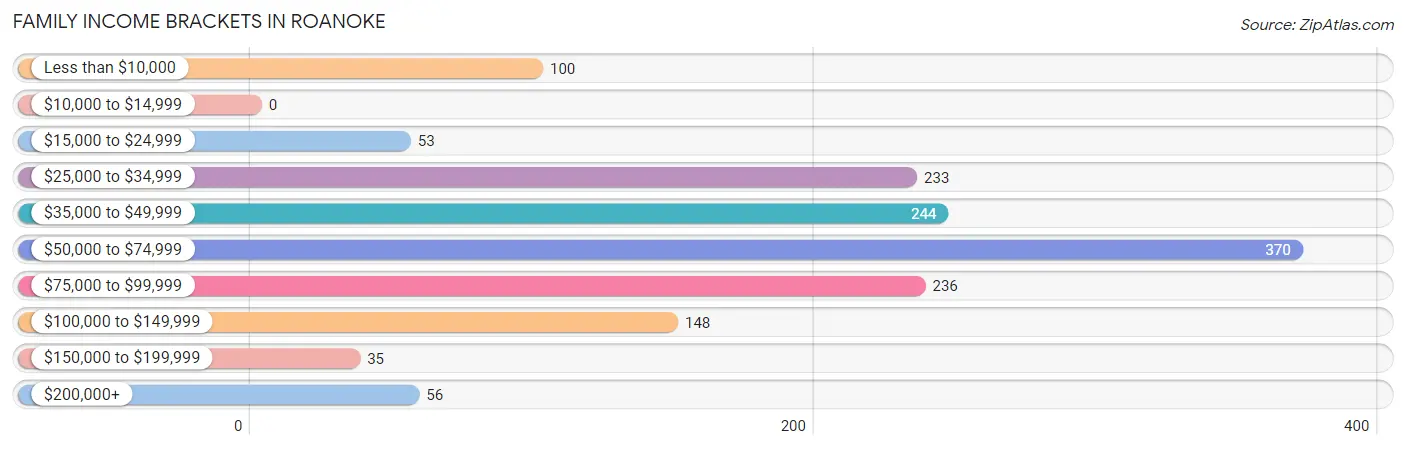
| Income Bracket | # Families | % Families |
| Less than $10,000 | 100 | 6.8% |
| $10,000 to $14,999 | 0 | 0.0% |
| $15,000 to $24,999 | 53 | 3.6% |
| $25,000 to $34,999 | 233 | 15.8% |
| $35,000 to $49,999 | 244 | 16.5% |
| $50,000 to $74,999 | 370 | 25.1% |
| $75,000 to $99,999 | 236 | 16.0% |
| $100,000 to $149,999 | 148 | 10.0% |
| $150,000 to $199,999 | 35 | 2.4% |
| $200,000+ | 56 | 3.8% |
Family Income by Famaliy Size in Roanoke
5-person families (88 | 6.0%) account for the highest median family income in Roanoke with $88,333 per family, while 3-person families (236 | 16.0%) have the highest median income of $25,300 per family member.
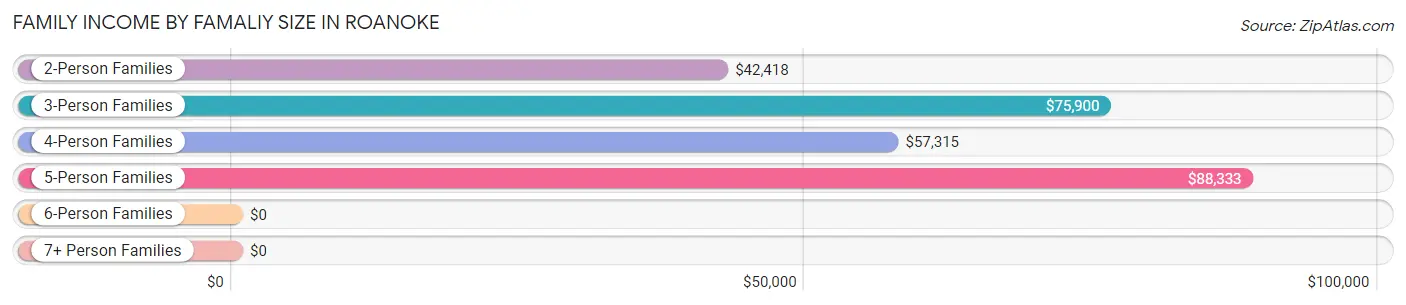
| Income Bracket | # Families | Median Income |
| 2-Person Families | 855 (57.9%) | $42,418 |
| 3-Person Families | 236 (16.0%) | $75,900 |
| 4-Person Families | 254 (17.2%) | $57,315 |
| 5-Person Families | 88 (6.0%) | $88,333 |
| 6-Person Families | 15 (1.0%) | $0 |
| 7+ Person Families | 28 (1.9%) | $0 |
| Total | 1,476 (100.0%) | $55,924 |
Family Income by Number of Earners in Roanoke
The median family income in Roanoke is $55,924, with families comprising 2 earners (481) having the highest median family income of $84,858, while families with 1 earner (589) have the lowest median family income of $34,597, accounting for 32.6% and 39.9% of families, respectively.
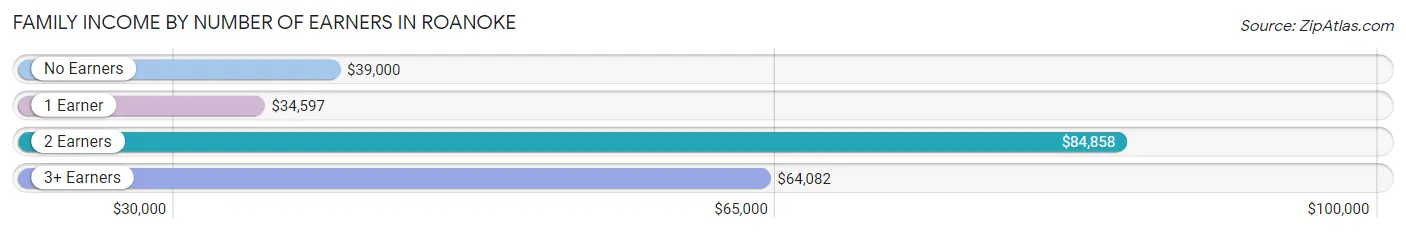
| Number of Earners | # Families | Median Income |
| No Earners | 268 (18.2%) | $39,000 |
| 1 Earner | 589 (39.9%) | $34,597 |
| 2 Earners | 481 (32.6%) | $84,858 |
| 3+ Earners | 138 (9.3%) | $64,082 |
| Total | 1,476 (100.0%) | $55,924 |
Household Income in Roanoke
Household Income Brackets in Roanoke
With 416 households falling in the category, the $50,000 to $74,999 income range is the most frequent in Roanoke, accounting for 19.8% of all households. In contrast, only 36 households (1.7%) fall into the $150,000 to $199,999 income bracket, making it the least populous group.
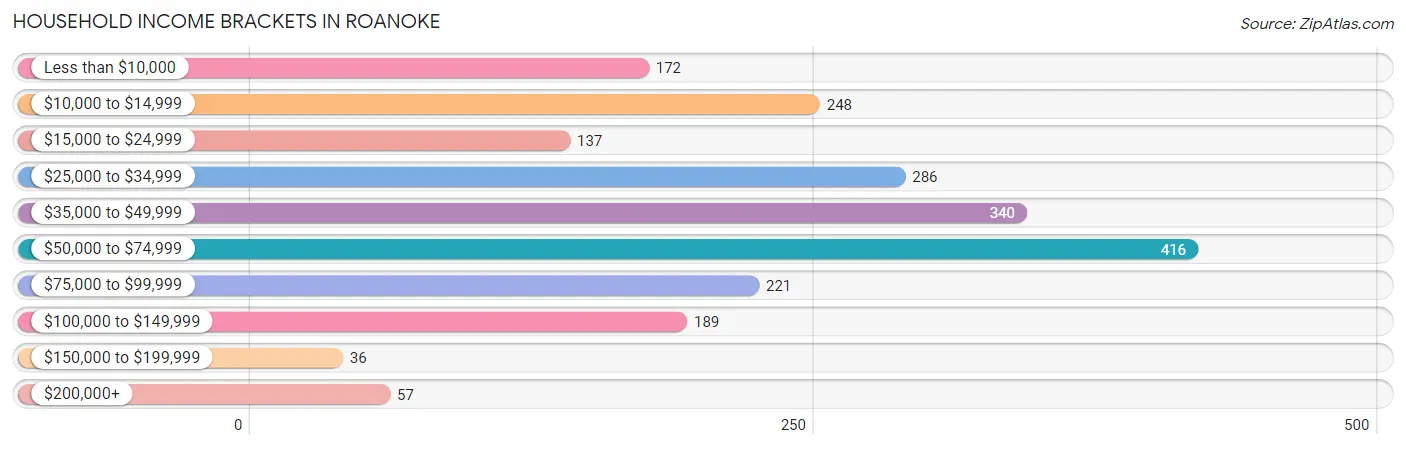
| Income Bracket | # Households | % Households |
| Less than $10,000 | 172 | 8.2% |
| $10,000 to $14,999 | 248 | 11.8% |
| $15,000 to $24,999 | 137 | 6.5% |
| $25,000 to $34,999 | 286 | 13.6% |
| $35,000 to $49,999 | 340 | 16.2% |
| $50,000 to $74,999 | 416 | 19.8% |
| $75,000 to $99,999 | 221 | 10.5% |
| $100,000 to $149,999 | 189 | 9.0% |
| $150,000 to $199,999 | 36 | 1.7% |
| $200,000+ | 57 | 2.7% |
Household Income by Householder Age in Roanoke
The median household income in Roanoke is $43,664, with the highest median household income of $49,926 found in the 45 to 64 years age bracket for the primary householder. A total of 784 households (37.3%) fall into this category. Meanwhile, the 15 to 24 years age bracket for the primary householder has the lowest median household income of $0, with 18 households (0.9%) in this group.
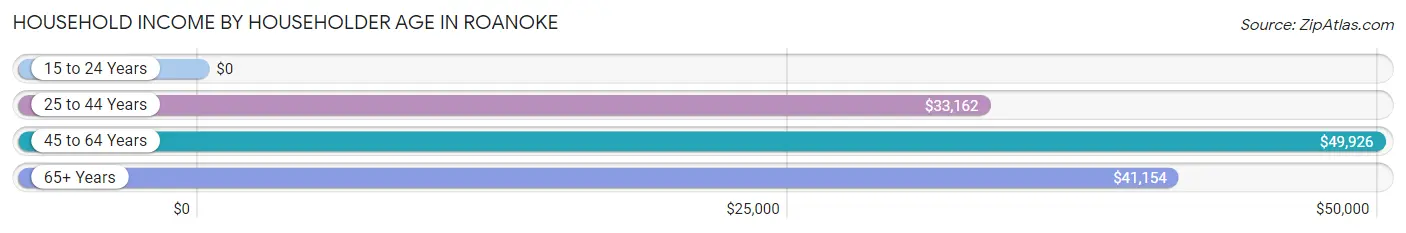
| Income Bracket | # Households | Median Income |
| 15 to 24 Years | 18 (0.9%) | $0 |
| 25 to 44 Years | 579 (27.6%) | $33,162 |
| 45 to 64 Years | 784 (37.3%) | $49,926 |
| 65+ Years | 720 (34.3%) | $41,154 |
| Total | 2,101 (100.0%) | $43,664 |
Poverty in Roanoke
Income Below Poverty by Sex and Age in Roanoke
With 16.4% poverty level for males and 17.3% for females among the residents of Roanoke, under 5 year old males and 5 year old females are the most vulnerable to poverty, with 116 males (89.2%) and 29 females (69.1%) in their respective age groups living below the poverty level.
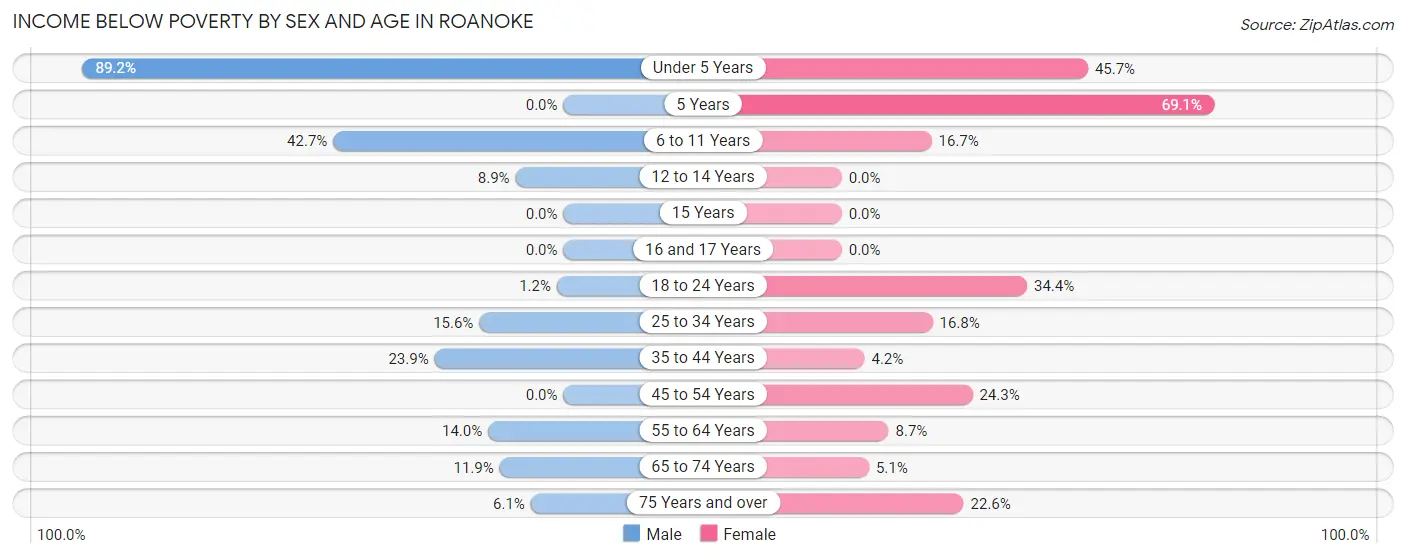
| Age Bracket | Male | Female |
| Under 5 Years | 116 (89.2%) | 53 (45.7%) |
| 5 Years | 0 (0.0%) | 29 (69.1%) |
| 6 to 11 Years | 47 (42.7%) | 16 (16.7%) |
| 12 to 14 Years | 12 (8.9%) | 0 (0.0%) |
| 15 Years | 0 (0.0%) | 0 (0.0%) |
| 16 and 17 Years | 0 (0.0%) | 0 (0.0%) |
| 18 to 24 Years | 3 (1.2%) | 65 (34.4%) |
| 25 to 34 Years | 45 (15.6%) | 50 (16.8%) |
| 35 to 44 Years | 100 (23.9%) | 13 (4.2%) |
| 45 to 54 Years | 0 (0.0%) | 99 (24.3%) |
| 55 to 64 Years | 53 (14.0%) | 23 (8.7%) |
| 65 to 74 Years | 25 (11.8%) | 14 (5.1%) |
| 75 Years and over | 12 (6.1%) | 90 (22.6%) |
| Total | 413 (16.4%) | 452 (17.3%) |
Income Above Poverty by Sex and Age in Roanoke
According to the poverty statistics in Roanoke, males aged 5 years and females aged 12 to 14 years are the age groups that are most secure financially, with 100.0% of males and 100.0% of females in these age groups living above the poverty line.
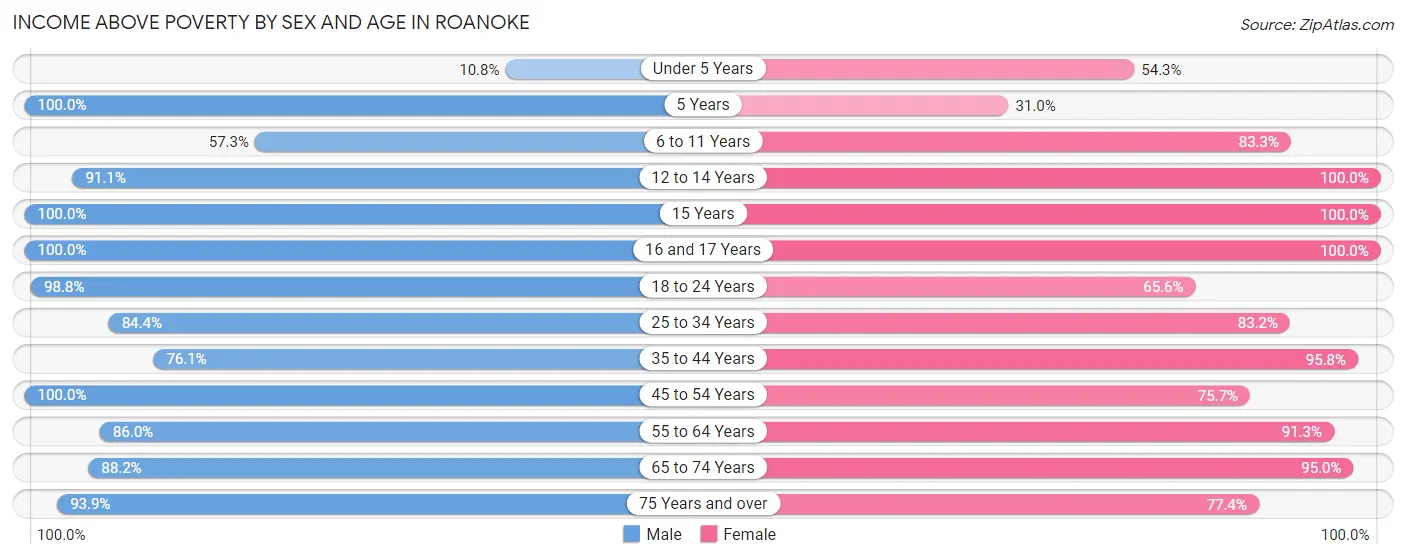
| Age Bracket | Male | Female |
| Under 5 Years | 14 (10.8%) | 63 (54.3%) |
| 5 Years | 10 (100.0%) | 13 (30.9%) |
| 6 to 11 Years | 63 (57.3%) | 80 (83.3%) |
| 12 to 14 Years | 123 (91.1%) | 135 (100.0%) |
| 15 Years | 119 (100.0%) | 41 (100.0%) |
| 16 and 17 Years | 57 (100.0%) | 38 (100.0%) |
| 18 to 24 Years | 244 (98.8%) | 124 (65.6%) |
| 25 to 34 Years | 243 (84.4%) | 247 (83.2%) |
| 35 to 44 Years | 318 (76.1%) | 295 (95.8%) |
| 45 to 54 Years | 224 (100.0%) | 309 (75.7%) |
| 55 to 64 Years | 326 (86.0%) | 242 (91.3%) |
| 65 to 74 Years | 186 (88.1%) | 263 (95.0%) |
| 75 Years and over | 186 (93.9%) | 308 (77.4%) |
| Total | 2,113 (83.7%) | 2,158 (82.7%) |
Income Below Poverty Among Married-Couple Families in Roanoke
The poverty statistics for married-couple families in Roanoke show that 1.6% or 13 of the total 804 families live below the poverty line. Families with no children have the highest poverty rate of 2.1%, comprising of 13 families. On the other hand, families with 1 or 2 children have the lowest poverty rate of 0.0%, which includes 0 families.
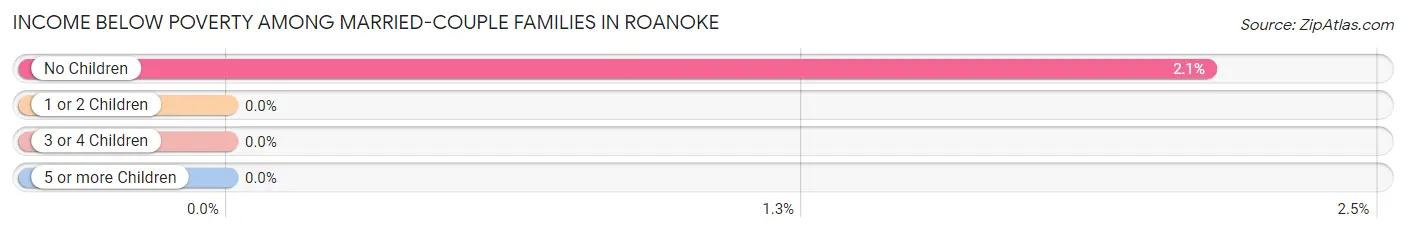
| Children | Above Poverty | Below Poverty |
| No Children | 596 (97.9%) | 13 (2.1%) |
| 1 or 2 Children | 180 (100.0%) | 0 (0.0%) |
| 3 or 4 Children | 15 (100.0%) | 0 (0.0%) |
| 5 or more Children | 0 (0.0%) | 0 (0.0%) |
| Total | 791 (98.4%) | 13 (1.6%) |
Income Below Poverty Among Single-Parent Households in Roanoke
According to the poverty data in Roanoke, 59.8% or 67 single-father households and 11.3% or 63 single-mother households are living below the poverty line. Among single-father households, those with 1 or 2 children have the highest poverty rate, with 67 households (100.0%) experiencing poverty. Likewise, among single-mother households, those with 3 or 4 children have the highest poverty rate, with 36 households (100.0%) falling below the poverty line.
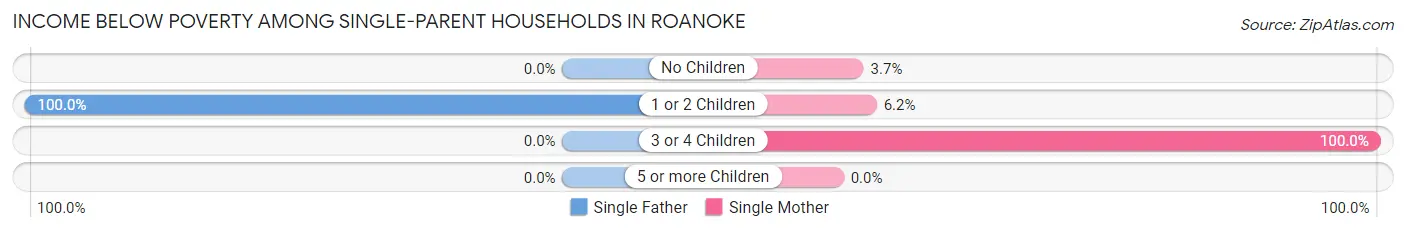
| Children | Single Father | Single Mother |
| No Children | 0 (0.0%) | 8 (3.7%) |
| 1 or 2 Children | 67 (100.0%) | 19 (6.1%) |
| 3 or 4 Children | 0 (0.0%) | 36 (100.0%) |
| 5 or more Children | 0 (0.0%) | 0 (0.0%) |
| Total | 67 (59.8%) | 63 (11.3%) |
Income Below Poverty Among Married-Couple vs Single-Parent Households in Roanoke
The poverty data for Roanoke shows that 13 of the married-couple family households (1.6%) and 130 of the single-parent households (19.4%) are living below the poverty level. Within the married-couple family households, those with no children have the highest poverty rate, with 13 households (2.1%) falling below the poverty line. Among the single-parent households, those with 3 or 4 children have the highest poverty rate, with 36 household (72.0%) living below poverty.
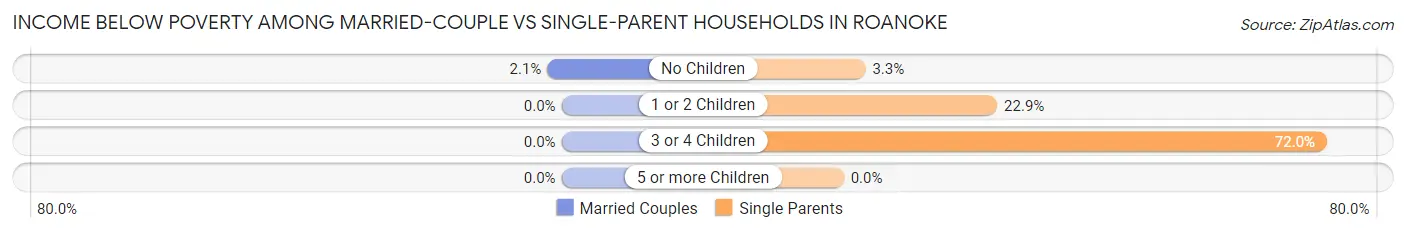
| Children | Married-Couple Families | Single-Parent Households |
| No Children | 13 (2.1%) | 8 (3.3%) |
| 1 or 2 Children | 0 (0.0%) | 86 (22.9%) |
| 3 or 4 Children | 0 (0.0%) | 36 (72.0%) |
| 5 or more Children | 0 (0.0%) | 0 (0.0%) |
| Total | 13 (1.6%) | 130 (19.4%) |
Race in Roanoke
The most populous races in Roanoke are White / Caucasian (2,802 | 52.4%), Black / African American (2,368 | 44.3%), and Two or more Races (119 | 2.2%).
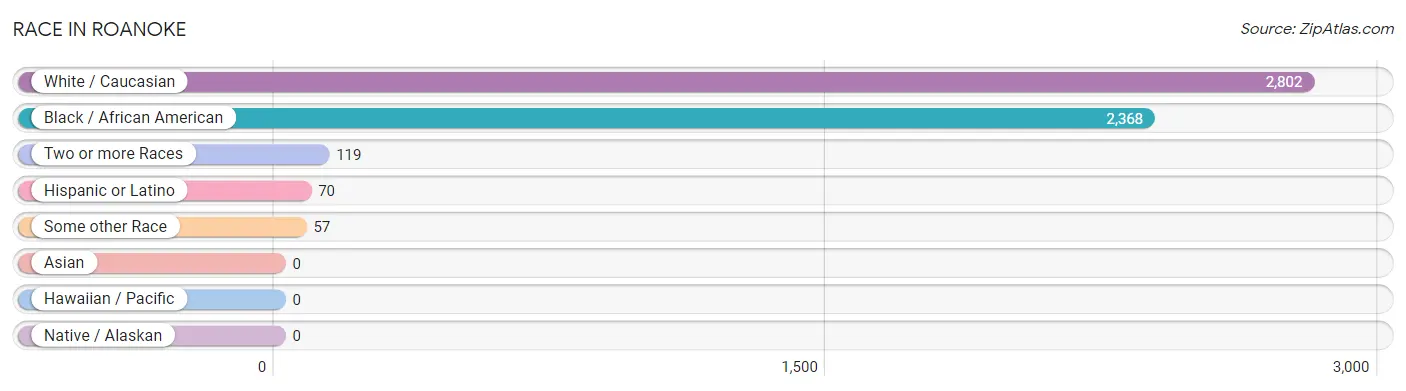
| Race | # Population | % Population |
| Asian | 0 | 0.0% |
| Black / African American | 2,368 | 44.3% |
| Hawaiian / Pacific | 0 | 0.0% |
| Hispanic or Latino | 70 | 1.3% |
| Native / Alaskan | 0 | 0.0% |
| White / Caucasian | 2,802 | 52.4% |
| Two or more Races | 119 | 2.2% |
| Some other Race | 57 | 1.1% |
| Total | 5,346 | 100.0% |
Ancestry in Roanoke
The most populous ancestries reported in Roanoke are American (1,022 | 19.1%), English (481 | 9.0%), Subsaharan African (313 | 5.9%), African (304 | 5.7%), and European (174 | 3.3%), together accounting for 42.9% of all Roanoke residents.
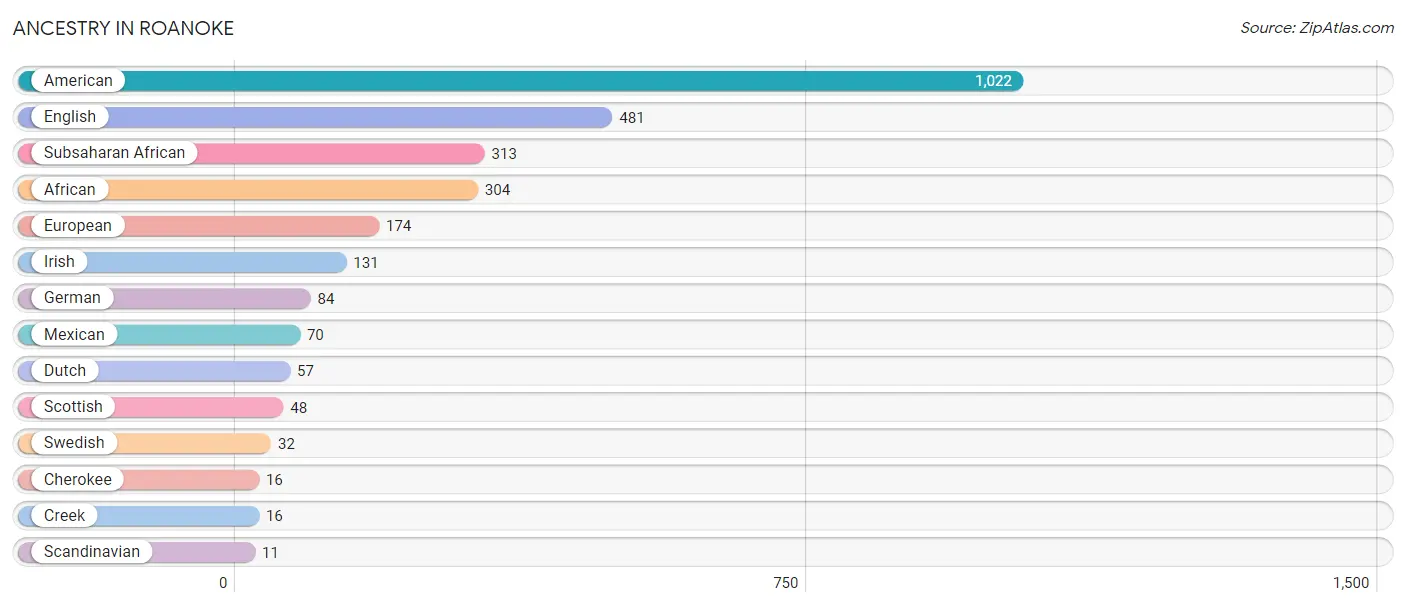
| Ancestry | # Population | % Population |
| African | 304 | 5.7% |
| American | 1,022 | 19.1% |
| Cherokee | 16 | 0.3% |
| Creek | 16 | 0.3% |
| Dutch | 57 | 1.1% |
| English | 481 | 9.0% |
| European | 174 | 3.3% |
| German | 84 | 1.6% |
| Irish | 131 | 2.5% |
| Mexican | 70 | 1.3% |
| Scandinavian | 11 | 0.2% |
| Scottish | 48 | 0.9% |
| Subsaharan African | 313 | 5.9% |
| Swedish | 32 | 0.6% | View All 14 Rows |
Immigrants in Roanoke
The most numerous immigrant groups reported in Roanoke came from Central America (61 | 1.1%), Latin America (61 | 1.1%), Mexico (61 | 1.1%), Africa (9 | 0.2%), and Eastern Africa (9 | 0.2%), together accounting for 3.8% of all Roanoke residents.
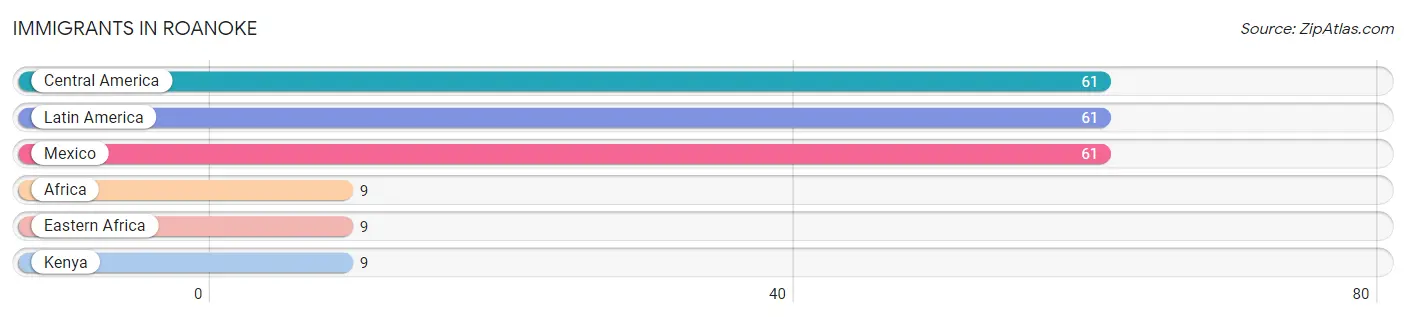
| Immigration Origin | # Population | % Population |
| Africa | 9 | 0.2% |
| Central America | 61 | 1.1% |
| Eastern Africa | 9 | 0.2% |
| Kenya | 9 | 0.2% |
| Latin America | 61 | 1.1% |
| Mexico | 61 | 1.1% | View All 6 Rows |
Sex and Age in Roanoke
Sex and Age in Roanoke
The most populous age groups in Roanoke are 15 to 19 Years (295 | 11.3%) for men and 45 to 49 Years (266 | 9.7%) for women.
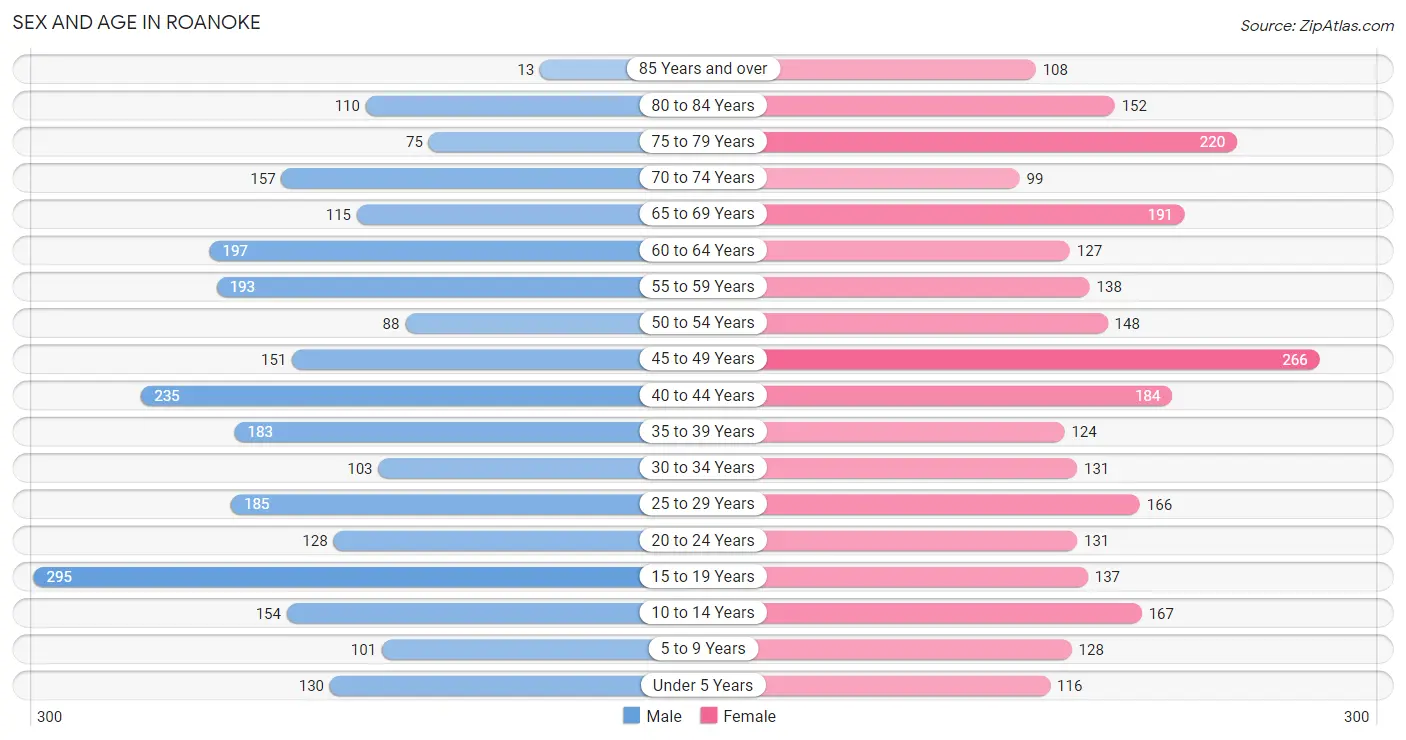
| Age Bracket | Male | Female |
| Under 5 Years | 130 (5.0%) | 116 (4.2%) |
| 5 to 9 Years | 101 (3.9%) | 128 (4.7%) |
| 10 to 14 Years | 154 (5.9%) | 167 (6.1%) |
| 15 to 19 Years | 295 (11.3%) | 137 (5.0%) |
| 20 to 24 Years | 128 (4.9%) | 131 (4.8%) |
| 25 to 29 Years | 185 (7.1%) | 166 (6.1%) |
| 30 to 34 Years | 103 (3.9%) | 131 (4.8%) |
| 35 to 39 Years | 183 (7.0%) | 124 (4.5%) |
| 40 to 44 Years | 235 (9.0%) | 184 (6.7%) |
| 45 to 49 Years | 151 (5.8%) | 266 (9.7%) |
| 50 to 54 Years | 88 (3.4%) | 148 (5.4%) |
| 55 to 59 Years | 193 (7.4%) | 138 (5.1%) |
| 60 to 64 Years | 197 (7.5%) | 127 (4.6%) |
| 65 to 69 Years | 115 (4.4%) | 191 (7.0%) |
| 70 to 74 Years | 157 (6.0%) | 99 (3.6%) |
| 75 to 79 Years | 75 (2.9%) | 220 (8.1%) |
| 80 to 84 Years | 110 (4.2%) | 152 (5.6%) |
| 85 Years and over | 13 (0.5%) | 108 (4.0%) |
| Total | 2,613 (100.0%) | 2,733 (100.0%) |
Families and Households in Roanoke
Median Family Size in Roanoke
The median family size in Roanoke is 2.96 persons per family, with single female/mother families (560 | 37.9%) accounting for the largest median family size of 3.16 persons per family. On the other hand, single male/father families (112 | 7.6%) represent the smallest median family size with 2.79 persons per family.
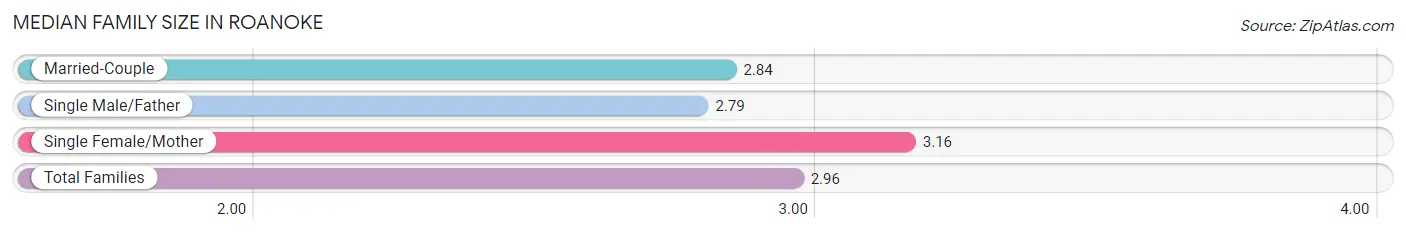
| Family Type | # Families | Family Size |
| Married-Couple | 804 (54.5%) | 2.84 |
| Single Male/Father | 112 (7.6%) | 2.79 |
| Single Female/Mother | 560 (37.9%) | 3.16 |
| Total Families | 1,476 (100.0%) | 2.96 |
Median Household Size in Roanoke
The median household size in Roanoke is 2.46 persons per household, with single male/father households (112 | 5.3%) accounting for the largest median household size of 3.57 persons per household. non-family households (625 | 29.7%) represent the smallest median household size with 1.03 persons per household.
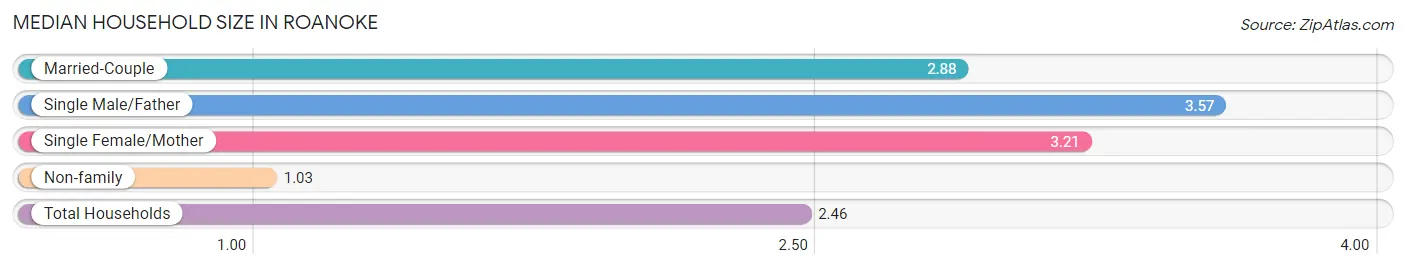
| Household Type | # Households | Household Size |
| Married-Couple | 804 (38.3%) | 2.88 |
| Single Male/Father | 112 (5.3%) | 3.57 |
| Single Female/Mother | 560 (26.7%) | 3.21 |
| Non-family | 625 (29.7%) | 1.03 |
| Total Households | 2,101 (100.0%) | 2.46 |
Household Size by Marriage Status in Roanoke
Out of a total of 2,101 households in Roanoke, 1,476 (70.3%) are family households, while 625 (29.7%) are nonfamily households. The most numerous type of family households are 2-person households, comprising 763, and the most common type of nonfamily households are 1-person households, comprising 603.
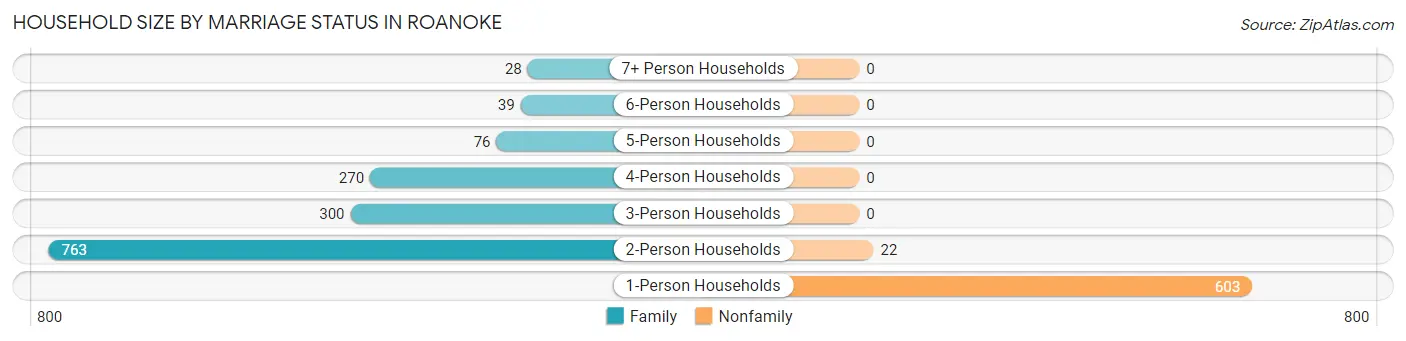
| Household Size | Family Households | Nonfamily Households |
| 1-Person Households | - | 603 (28.7%) |
| 2-Person Households | 763 (36.3%) | 22 (1.1%) |
| 3-Person Households | 300 (14.3%) | 0 (0.0%) |
| 4-Person Households | 270 (12.9%) | 0 (0.0%) |
| 5-Person Households | 76 (3.6%) | 0 (0.0%) |
| 6-Person Households | 39 (1.9%) | 0 (0.0%) |
| 7+ Person Households | 28 (1.3%) | 0 (0.0%) |
| Total | 1,476 (70.3%) | 625 (29.7%) |
Female Fertility in Roanoke
Fertility by Age in Roanoke
Average fertility rate in Roanoke is 96.0 births per 1,000 women. Women in the age bracket of 20 to 34 years have the highest fertility rate with 220.0 births per 1,000 women. Women in the age bracket of 20 to 34 years acount for 85.5% of all women with births.
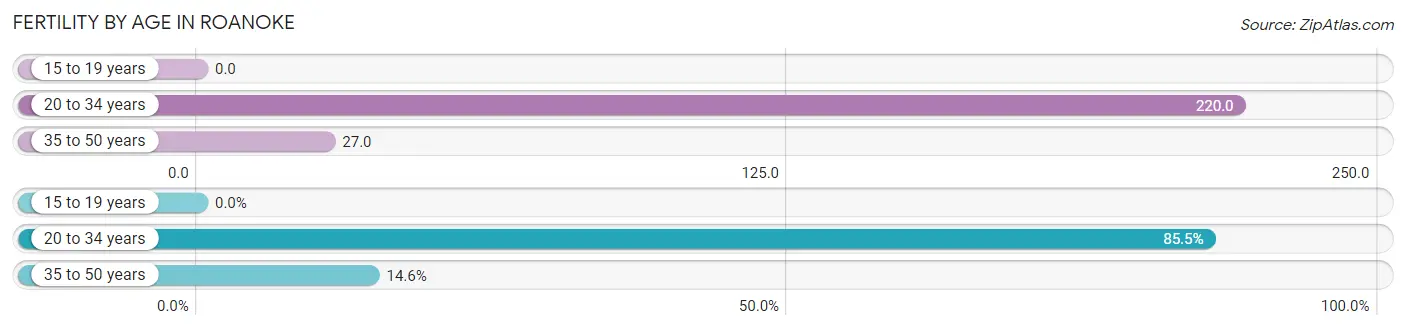
| Age Bracket | Women with Births | Births / 1,000 Women |
| 15 to 19 years | 0 (0.0%) | 0.0 |
| 20 to 34 years | 94 (85.5%) | 220.0 |
| 35 to 50 years | 16 (14.5%) | 27.0 |
| Total | 110 (100.0%) | 96.0 |
Fertility by Age by Marriage Status in Roanoke
26.4% of women with births (110) in Roanoke are married. The highest percentage of unmarried women with births falls into 20 to 34 years age bracket with 86.2% of them unmarried at the time of birth, while the lowest percentage of unmarried women with births belong to 35 to 50 years age bracket with 0.0% of them unmarried.
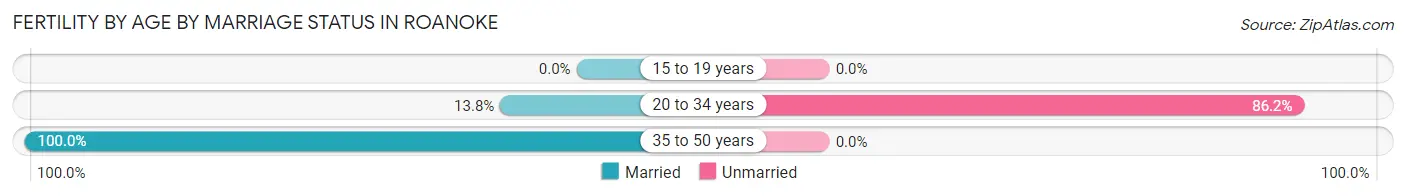
| Age Bracket | Married | Unmarried |
| 15 to 19 years | 0 (0.0%) | 0 (0.0%) |
| 20 to 34 years | 13 (13.8%) | 81 (86.2%) |
| 35 to 50 years | 16 (100.0%) | 0 (0.0%) |
| Total | 29 (26.4%) | 81 (73.6%) |
Fertility by Education in Roanoke
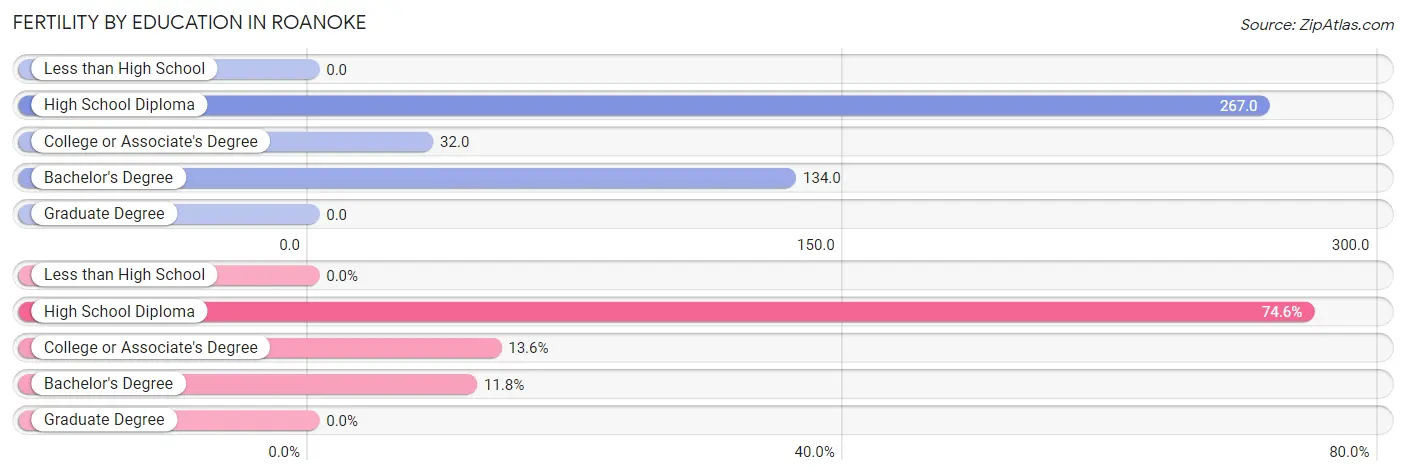
| Educational Attainment | Women with Births | Births / 1,000 Women |
| Less than High School | 0 (0.0%) | 0.0 |
| High School Diploma | 82 (74.6%) | 267.0 |
| College or Associate's Degree | 15 (13.6%) | 32.0 |
| Bachelor's Degree | 13 (11.8%) | 134.0 |
| Graduate Degree | 0 (0.0%) | 0.0 |
| Total | 110 (100.0%) | 96.0 |
Fertility by Education by Marriage Status in Roanoke
73.6% of women with births in Roanoke are unmarried. Women with the educational attainment of bachelor's degree are most likely to be married with 100.0% of them married at childbirth, while women with the educational attainment of college or associate's degree are least likely to be married with 100.0% of them unmarried at childbirth.
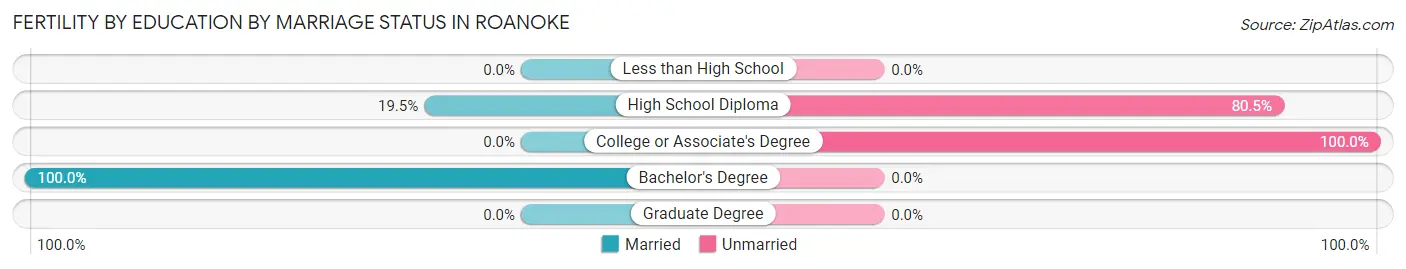
| Educational Attainment | Married | Unmarried |
| Less than High School | 0 (0.0%) | 0 (0.0%) |
| High School Diploma | 16 (19.5%) | 66 (80.5%) |
| College or Associate's Degree | 0 (0.0%) | 15 (100.0%) |
| Bachelor's Degree | 13 (100.0%) | 0 (0.0%) |
| Graduate Degree | 0 (0.0%) | 0 (0.0%) |
| Total | 29 (26.4%) | 81 (73.6%) |
Employment Characteristics in Roanoke
Employment by Class of Employer in Roanoke
Among the 2,155 employed individuals in Roanoke, private company employees (1,676 | 77.8%), not-for-profit organizations (201 | 9.3%), and state government employees (132 | 6.1%) make up the most common classes of employment.
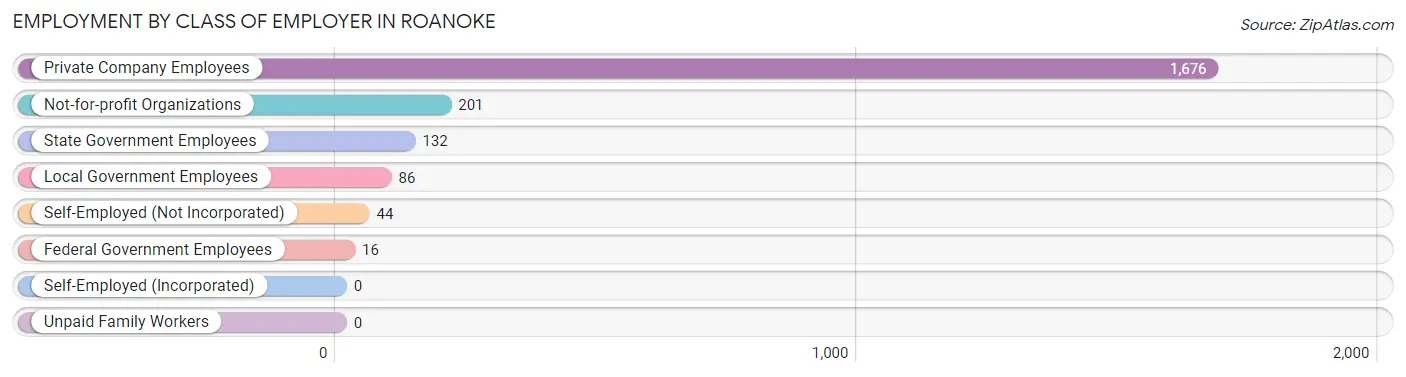
| Employer Class | # Employees | % Employees |
| Private Company Employees | 1,676 | 77.8% |
| Self-Employed (Incorporated) | 0 | 0.0% |
| Self-Employed (Not Incorporated) | 44 | 2.0% |
| Not-for-profit Organizations | 201 | 9.3% |
| Local Government Employees | 86 | 4.0% |
| State Government Employees | 132 | 6.1% |
| Federal Government Employees | 16 | 0.7% |
| Unpaid Family Workers | 0 | 0.0% |
| Total | 2,155 | 100.0% |
Employment Status by Age in Roanoke
According to the labor force statistics for Roanoke, out of the total population over 16 years of age (4,390), 51.4% or 2,256 individuals are in the labor force, with 3.4% or 77 of them unemployed. The age group with the highest labor force participation rate is 45 to 54 years, with 76.7% or 501 individuals in the labor force. Within the labor force, the 20 to 24 years age range has the highest percentage of unemployed individuals, with 10.9% or 16 of them being unemployed.
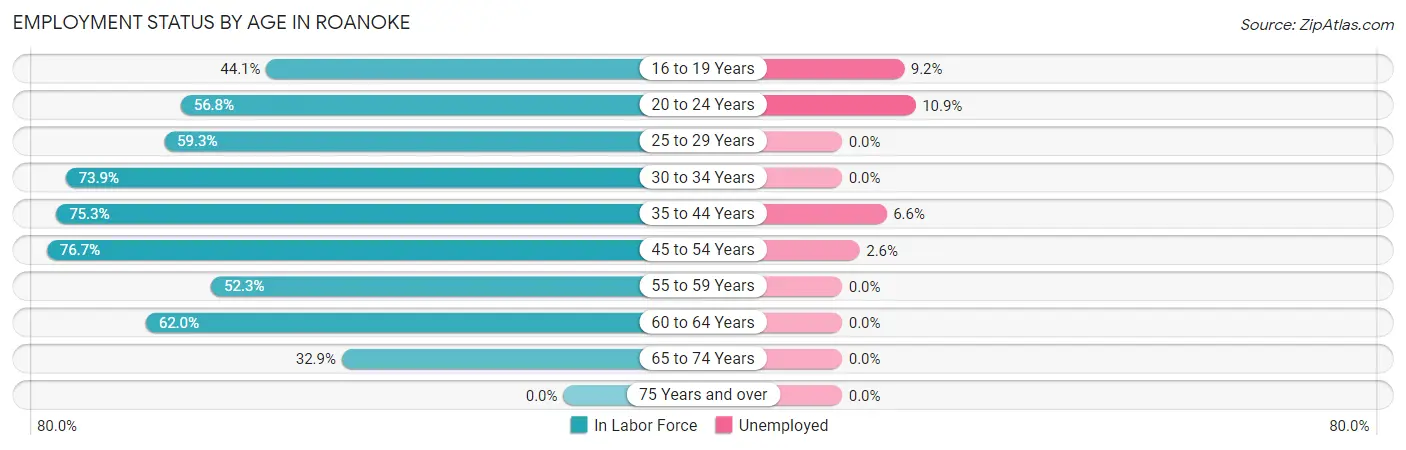
| Age Bracket | In Labor Force | Unemployed |
| 16 to 19 Years | 120 (44.1%) | 11 (9.2%) |
| 20 to 24 Years | 147 (56.8%) | 16 (10.9%) |
| 25 to 29 Years | 208 (59.3%) | 0 (0.0%) |
| 30 to 34 Years | 173 (73.9%) | 0 (0.0%) |
| 35 to 44 Years | 547 (75.3%) | 36 (6.6%) |
| 45 to 54 Years | 501 (76.7%) | 13 (2.6%) |
| 55 to 59 Years | 173 (52.3%) | 0 (0.0%) |
| 60 to 64 Years | 201 (62.0%) | 0 (0.0%) |
| 65 to 74 Years | 185 (32.9%) | 0 (0.0%) |
| 75 Years and over | 0 (0.0%) | 0 (0.0%) |
| Total | 2,256 (51.4%) | 77 (3.4%) |
Employment Status by Educational Attainment in Roanoke
According to labor force statistics for Roanoke, 68.8% of individuals (1,802) out of the total population between 25 and 64 years of age (2,619) are in the labor force, with 2.7% or 49 of them being unemployed. The group with the highest labor force participation rate are those with the educational attainment of bachelor's degree or higher, with 85.6% or 304 individuals in the labor force. Within the labor force, individuals with less than high school education have the highest percentage of unemployment, with 16.3% or 25 of them being unemployed.
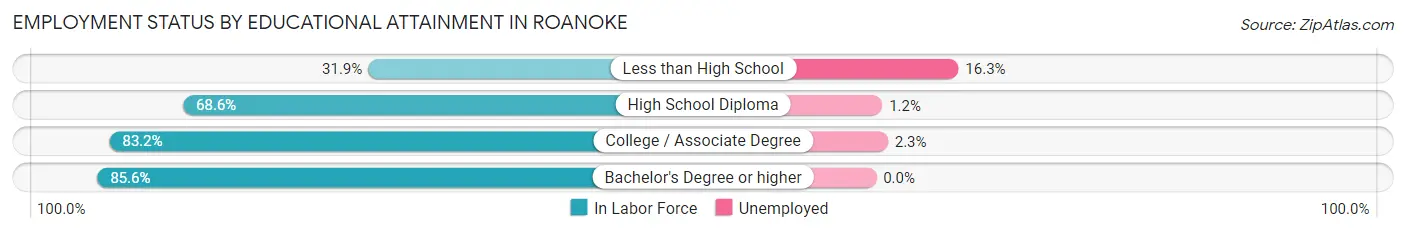
| Educational Attainment | In Labor Force | Unemployed |
| Less than High School | 153 (31.9%) | 78 (16.3%) |
| High School Diploma | 651 (68.6%) | 11 (1.2%) |
| College / Associate Degree | 695 (83.2%) | 19 (2.3%) |
| Bachelor's Degree or higher | 304 (85.6%) | 0 (0.0%) |
| Total | 1,802 (68.8%) | 71 (2.7%) |
Employment Occupations by Sex in Roanoke
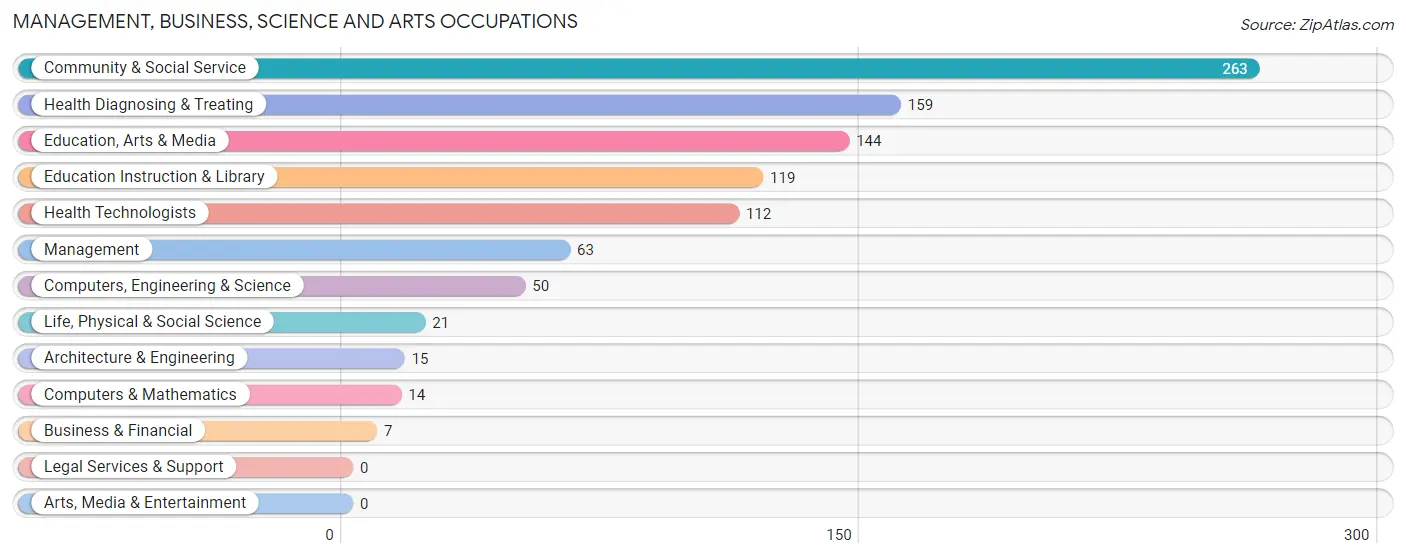
Management, Business, Science and Arts Occupations
The most common Management, Business, Science and Arts occupations in Roanoke are Community & Social Service (263 | 12.1%), Health Diagnosing & Treating (159 | 7.3%), Education, Arts & Media (144 | 6.6%), Education Instruction & Library (119 | 5.5%), and Health Technologists (112 | 5.1%).
Management, Business, Science and Arts Occupations by Sex
Within the Management, Business, Science and Arts occupations in Roanoke, the most male-oriented occupations are Business & Financial (100.0%), Computers & Mathematics (100.0%), and Architecture & Engineering (100.0%), while the most female-oriented occupations are Health Diagnosing & Treating (91.8%), Health Technologists (88.4%), and Education Instruction & Library (72.3%).
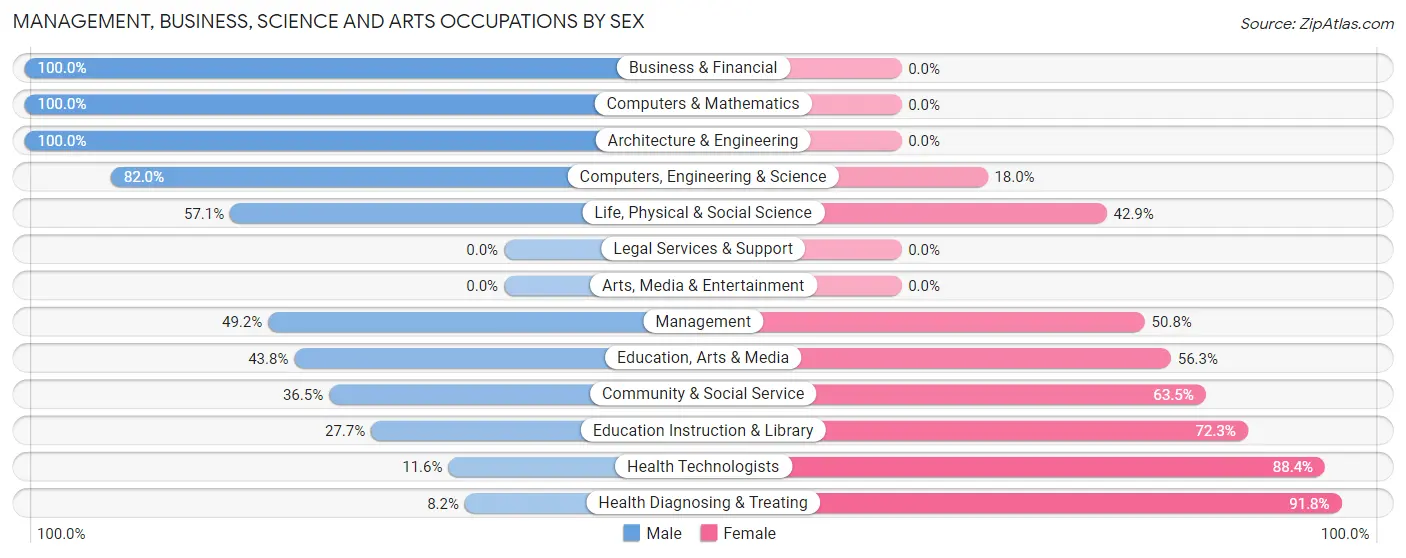
| Occupation | Male | Female |
| Management | 31 (49.2%) | 32 (50.8%) |
| Business & Financial | 7 (100.0%) | 0 (0.0%) |
| Computers, Engineering & Science | 41 (82.0%) | 9 (18.0%) |
| Computers & Mathematics | 14 (100.0%) | 0 (0.0%) |
| Architecture & Engineering | 15 (100.0%) | 0 (0.0%) |
| Life, Physical & Social Science | 12 (57.1%) | 9 (42.9%) |
| Community & Social Service | 96 (36.5%) | 167 (63.5%) |
| Education, Arts & Media | 63 (43.8%) | 81 (56.2%) |
| Legal Services & Support | 0 (0.0%) | 0 (0.0%) |
| Education Instruction & Library | 33 (27.7%) | 86 (72.3%) |
| Arts, Media & Entertainment | 0 (0.0%) | 0 (0.0%) |
| Health Diagnosing & Treating | 13 (8.2%) | 146 (91.8%) |
| Health Technologists | 13 (11.6%) | 99 (88.4%) |
| Total (Category) | 188 (34.7%) | 354 (65.3%) |
| Total (Overall) | 992 (45.5%) | 1,187 (54.5%) |
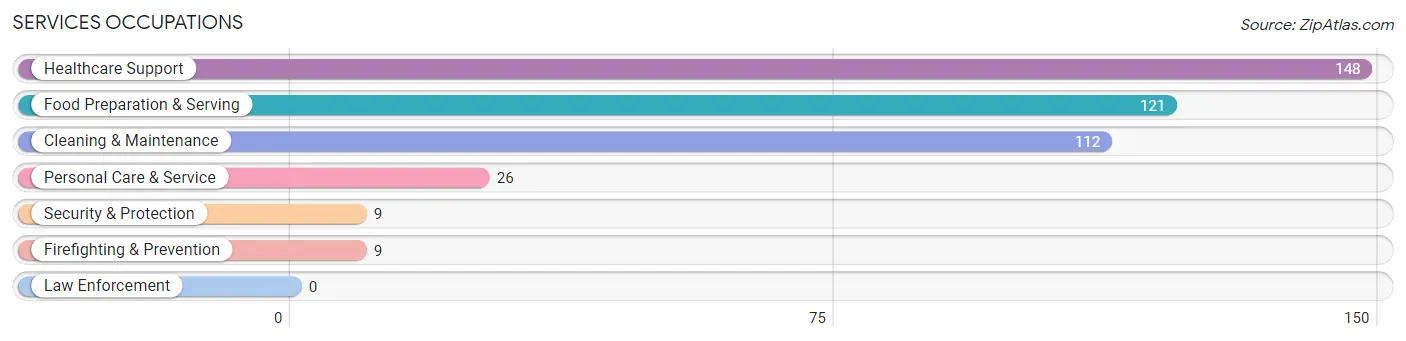
Services Occupations
The most common Services occupations in Roanoke are Healthcare Support (148 | 6.8%), Food Preparation & Serving (121 | 5.6%), Cleaning & Maintenance (112 | 5.1%), Personal Care & Service (26 | 1.2%), and Security & Protection (9 | 0.4%).
Services Occupations by Sex
Within the Services occupations in Roanoke, the most male-oriented occupations are Security & Protection (100.0%), Firefighting & Prevention (100.0%), and Cleaning & Maintenance (75.9%), while the most female-oriented occupations are Food Preparation & Serving (100.0%), Personal Care & Service (100.0%), and Healthcare Support (69.6%).
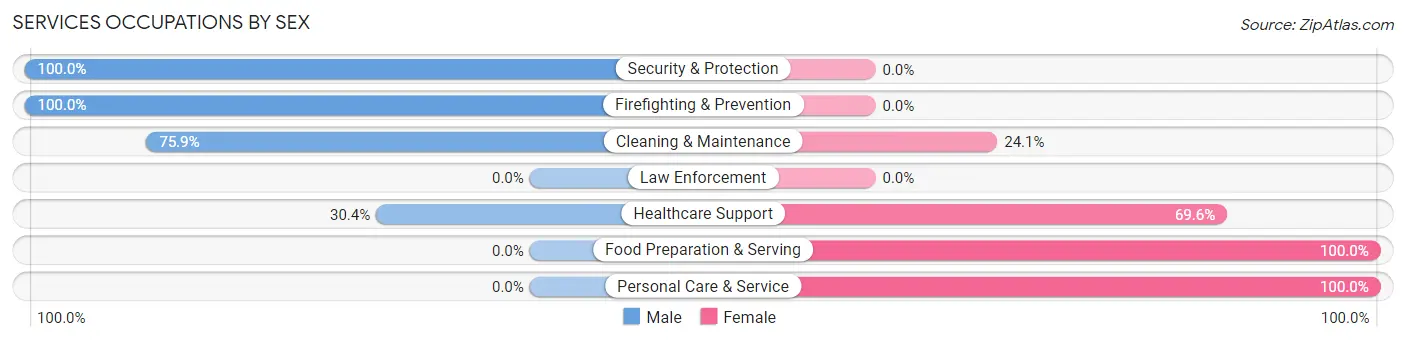
| Occupation | Male | Female |
| Healthcare Support | 45 (30.4%) | 103 (69.6%) |
| Security & Protection | 9 (100.0%) | 0 (0.0%) |
| Firefighting & Prevention | 9 (100.0%) | 0 (0.0%) |
| Law Enforcement | 0 (0.0%) | 0 (0.0%) |
| Food Preparation & Serving | 0 (0.0%) | 121 (100.0%) |
| Cleaning & Maintenance | 85 (75.9%) | 27 (24.1%) |
| Personal Care & Service | 0 (0.0%) | 26 (100.0%) |
| Total (Category) | 139 (33.4%) | 277 (66.6%) |
| Total (Overall) | 992 (45.5%) | 1,187 (54.5%) |
Sales and Office Occupations
The most common Sales and Office occupations in Roanoke are Office & Administration (210 | 9.6%), and Sales & Related (148 | 6.8%).
Sales and Office Occupations by Sex
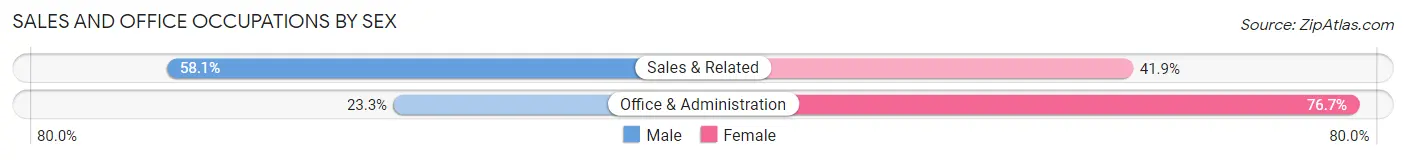
| Occupation | Male | Female |
| Sales & Related | 86 (58.1%) | 62 (41.9%) |
| Office & Administration | 49 (23.3%) | 161 (76.7%) |
| Total (Category) | 135 (37.7%) | 223 (62.3%) |
| Total (Overall) | 992 (45.5%) | 1,187 (54.5%) |
Natural Resources, Construction and Maintenance Occupations
The most common Natural Resources, Construction and Maintenance occupations in Roanoke are Construction & Extraction (45 | 2.1%), and Installation, Maintenance & Repair (17 | 0.8%).
Natural Resources, Construction and Maintenance Occupations by Sex
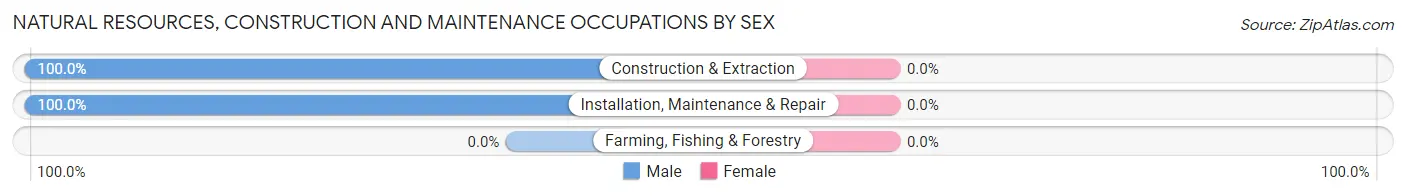
| Occupation | Male | Female |
| Farming, Fishing & Forestry | 0 (0.0%) | 0 (0.0%) |
| Construction & Extraction | 45 (100.0%) | 0 (0.0%) |
| Installation, Maintenance & Repair | 17 (100.0%) | 0 (0.0%) |
| Total (Category) | 62 (100.0%) | 0 (0.0%) |
| Total (Overall) | 992 (45.5%) | 1,187 (54.5%) |
Production, Transportation and Moving Occupations
The most common Production, Transportation and Moving occupations in Roanoke are Production (534 | 24.5%), Material Moving (219 | 10.1%), and Transportation (48 | 2.2%).
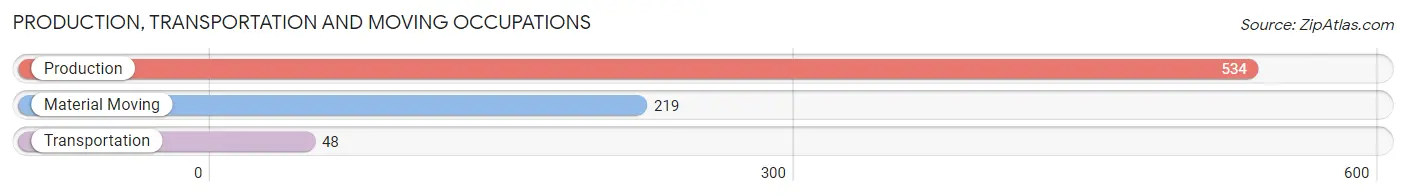
Production, Transportation and Moving Occupations by Sex
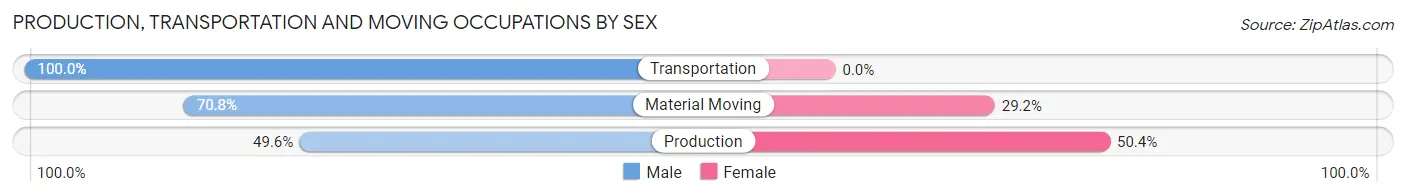
| Occupation | Male | Female |
| Production | 265 (49.6%) | 269 (50.4%) |
| Transportation | 48 (100.0%) | 0 (0.0%) |
| Material Moving | 155 (70.8%) | 64 (29.2%) |
| Total (Category) | 468 (58.4%) | 333 (41.6%) |
| Total (Overall) | 992 (45.5%) | 1,187 (54.5%) |
Employment Industries by Sex in Roanoke
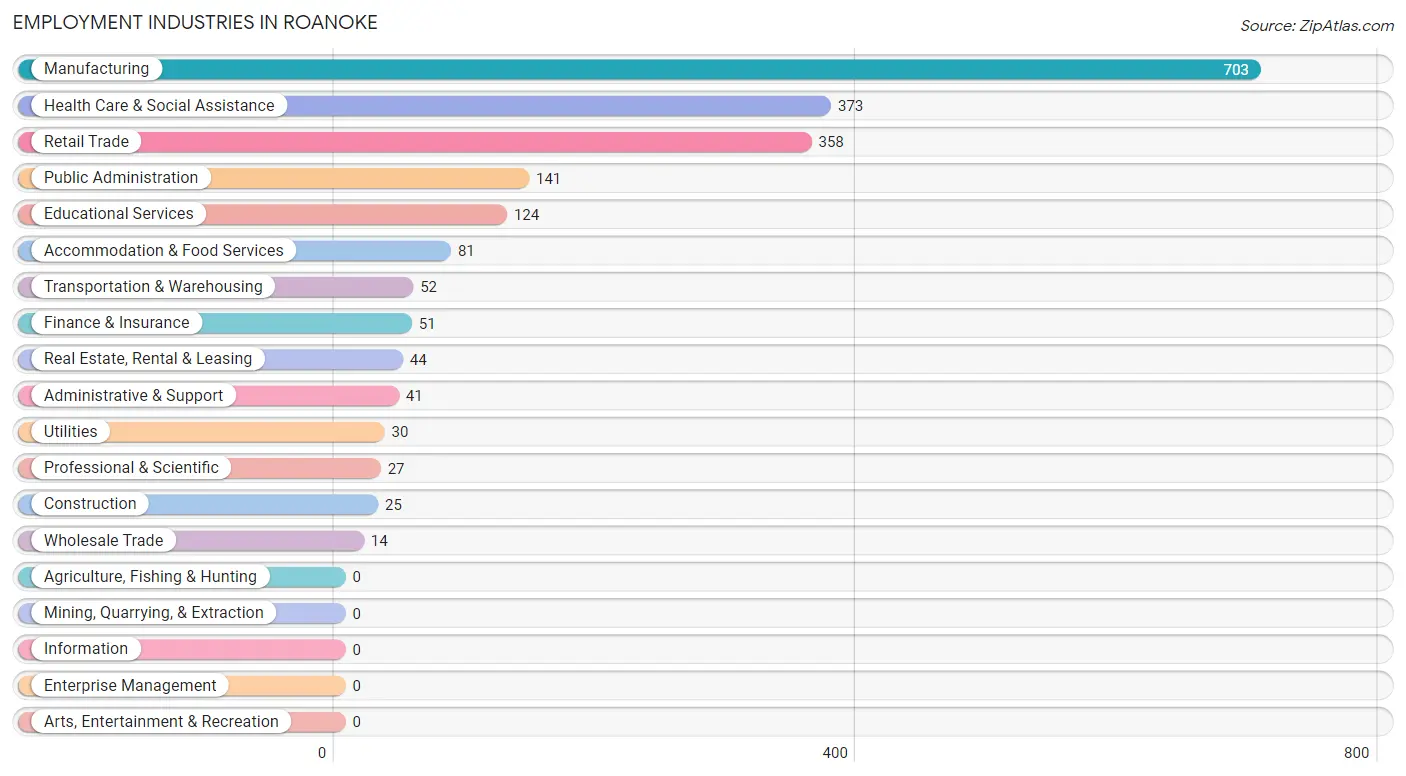
Employment Industries in Roanoke
The major employment industries in Roanoke include Manufacturing (703 | 32.3%), Health Care & Social Assistance (373 | 17.1%), Retail Trade (358 | 16.4%), Public Administration (141 | 6.5%), and Educational Services (124 | 5.7%).
Employment Industries by Sex in Roanoke
The Roanoke industries that see more men than women are Construction (100.0%), Wholesale Trade (100.0%), and Professional & Scientific (100.0%), whereas the industries that tend to have a higher number of women are Finance & Insurance (100.0%), Real Estate, Rental & Leasing (100.0%), and Accommodation & Food Services (100.0%).
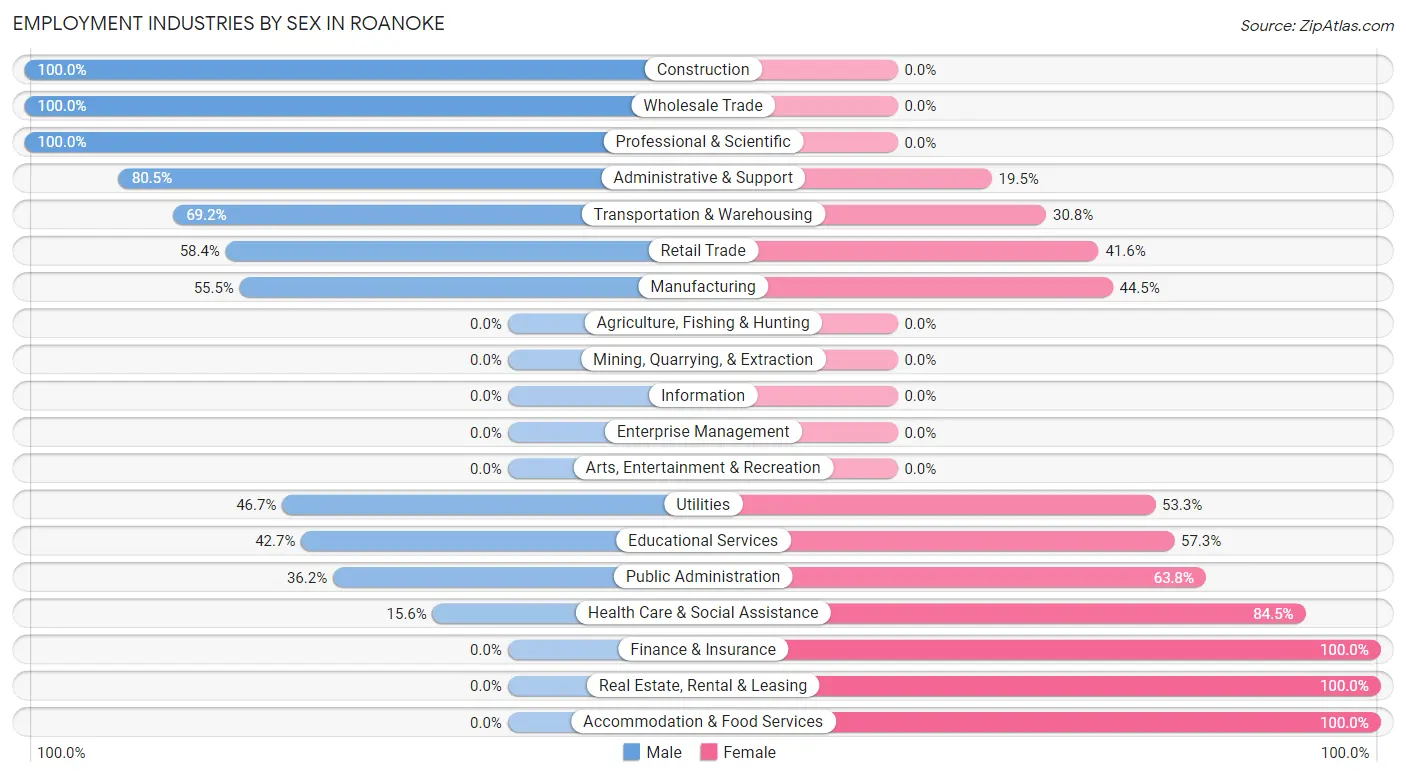
| Industry | Male | Female |
| Agriculture, Fishing & Hunting | 0 (0.0%) | 0 (0.0%) |
| Mining, Quarrying, & Extraction | 0 (0.0%) | 0 (0.0%) |
| Construction | 25 (100.0%) | 0 (0.0%) |
| Manufacturing | 390 (55.5%) | 313 (44.5%) |
| Wholesale Trade | 14 (100.0%) | 0 (0.0%) |
| Retail Trade | 209 (58.4%) | 149 (41.6%) |
| Transportation & Warehousing | 36 (69.2%) | 16 (30.8%) |
| Utilities | 14 (46.7%) | 16 (53.3%) |
| Information | 0 (0.0%) | 0 (0.0%) |
| Finance & Insurance | 0 (0.0%) | 51 (100.0%) |
| Real Estate, Rental & Leasing | 0 (0.0%) | 44 (100.0%) |
| Professional & Scientific | 27 (100.0%) | 0 (0.0%) |
| Enterprise Management | 0 (0.0%) | 0 (0.0%) |
| Administrative & Support | 33 (80.5%) | 8 (19.5%) |
| Educational Services | 53 (42.7%) | 71 (57.3%) |
| Health Care & Social Assistance | 58 (15.5%) | 315 (84.5%) |
| Arts, Entertainment & Recreation | 0 (0.0%) | 0 (0.0%) |
| Accommodation & Food Services | 0 (0.0%) | 81 (100.0%) |
| Public Administration | 51 (36.2%) | 90 (63.8%) |
| Total | 992 (45.5%) | 1,187 (54.5%) |
Education in Roanoke
School Enrollment in Roanoke
The most common levels of schooling among the 1,093 students in Roanoke are high school (546 | 49.9%), college / undergraduate (229 | 20.9%), and elementary school (141 | 12.9%).
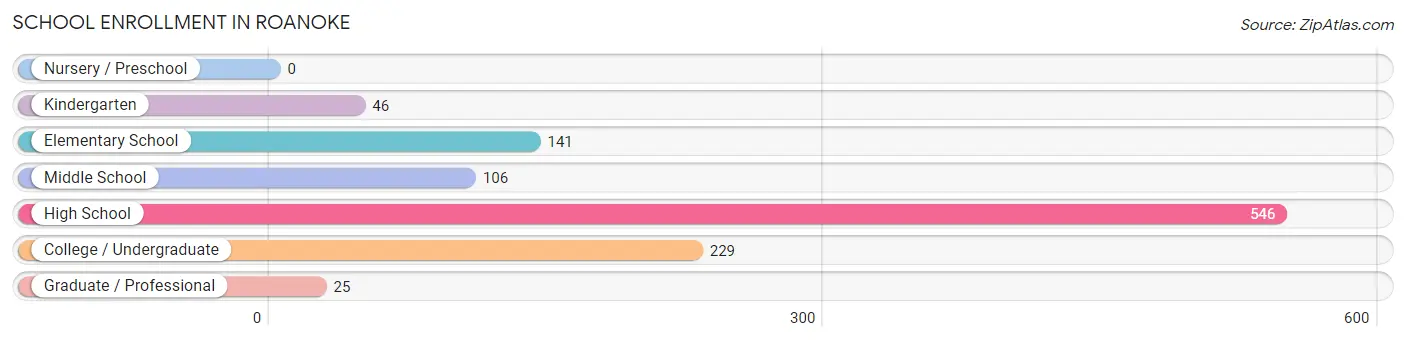
| School Level | # Students | % Students |
| Nursery / Preschool | 0 | 0.0% |
| Kindergarten | 46 | 4.2% |
| Elementary School | 141 | 12.9% |
| Middle School | 106 | 9.7% |
| High School | 546 | 49.9% |
| College / Undergraduate | 229 | 20.9% |
| Graduate / Professional | 25 | 2.3% |
| Total | 1,093 | 100.0% |
School Enrollment by Age by Funding Source in Roanoke
Out of a total of 1,093 students who are enrolled in schools in Roanoke, 52 (4.8%) attend a private institution, while the remaining 1,041 (95.2%) are enrolled in public schools. The age group of 35 years and over has the highest likelihood of being enrolled in private schools, with 30 (52.6% in the age bracket) enrolled. Conversely, the age group of 5 to 9 year old has the lowest likelihood of being enrolled in a private school, with 177 (100.0% in the age bracket) attending a public institution.
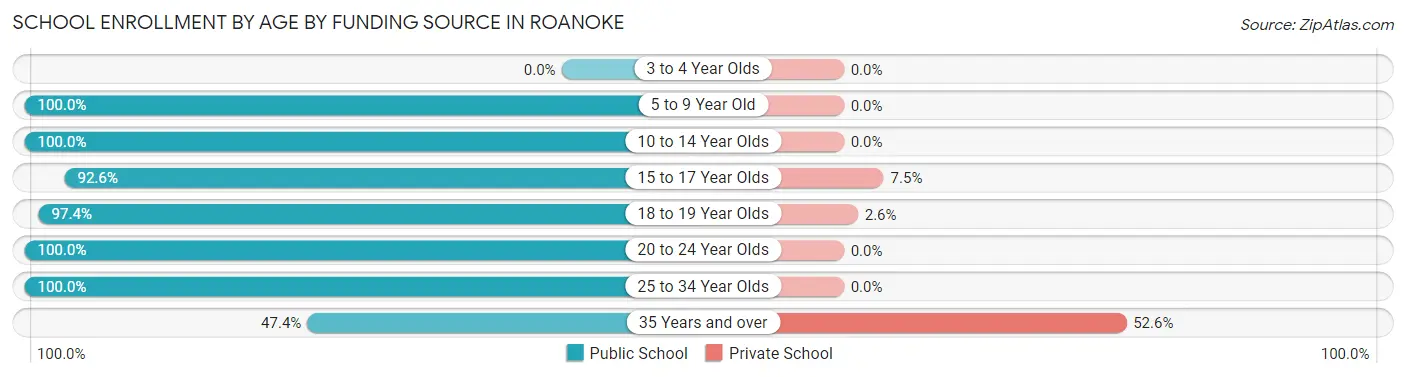
| Age Bracket | Public School | Private School |
| 3 to 4 Year Olds | 0 (0.0%) | 0 (0.0%) |
| 5 to 9 Year Old | 177 (100.0%) | 0 (0.0%) |
| 10 to 14 Year Olds | 302 (100.0%) | 0 (0.0%) |
| 15 to 17 Year Olds | 236 (92.5%) | 19 (7.4%) |
| 18 to 19 Year Olds | 111 (97.4%) | 3 (2.6%) |
| 20 to 24 Year Olds | 155 (100.0%) | 0 (0.0%) |
| 25 to 34 Year Olds | 33 (100.0%) | 0 (0.0%) |
| 35 Years and over | 27 (47.4%) | 30 (52.6%) |
| Total | 1,041 (95.2%) | 52 (4.8%) |
Educational Attainment by Field of Study in Roanoke
Education (141 | 25.9%), business (83 | 15.2%), science & technology (78 | 14.3%), social sciences (55 | 10.1%), and liberal arts & history (53 | 9.7%) are the most common fields of study among 545 individuals in Roanoke who have obtained a bachelor's degree or higher.
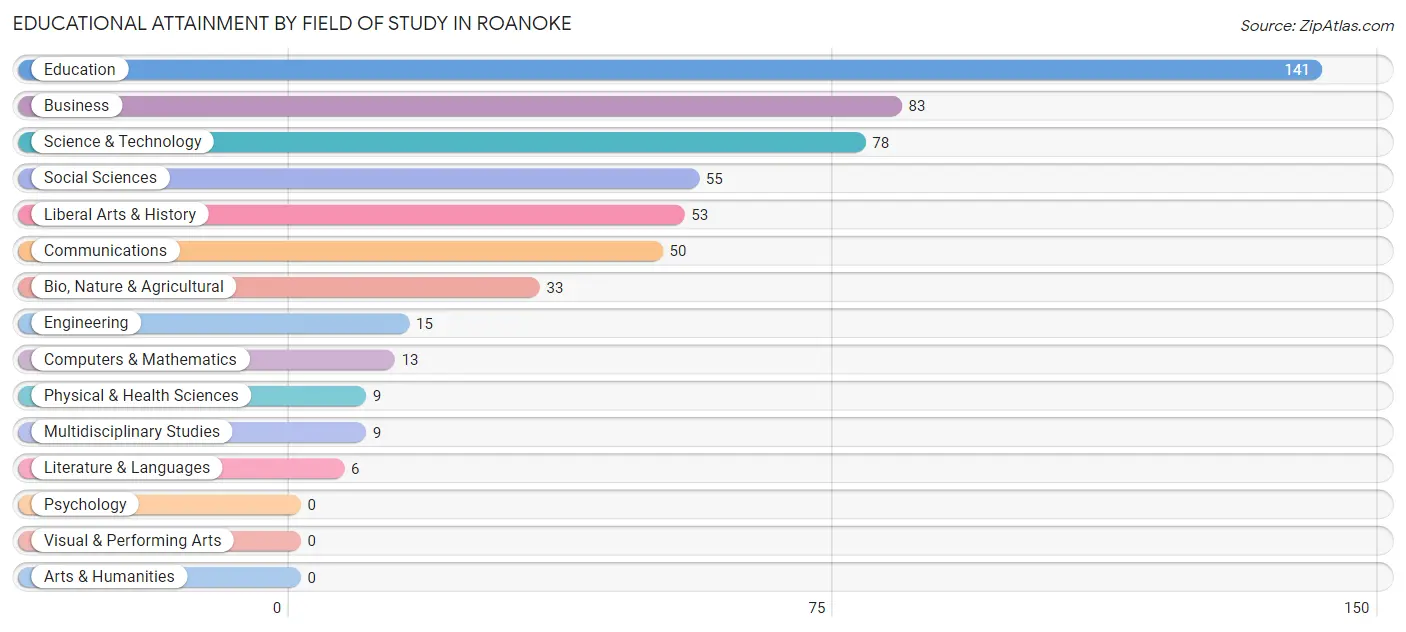
| Field of Study | # Graduates | % Graduates |
| Computers & Mathematics | 13 | 2.4% |
| Bio, Nature & Agricultural | 33 | 6.1% |
| Physical & Health Sciences | 9 | 1.7% |
| Psychology | 0 | 0.0% |
| Social Sciences | 55 | 10.1% |
| Engineering | 15 | 2.8% |
| Multidisciplinary Studies | 9 | 1.7% |
| Science & Technology | 78 | 14.3% |
| Business | 83 | 15.2% |
| Education | 141 | 25.9% |
| Literature & Languages | 6 | 1.1% |
| Liberal Arts & History | 53 | 9.7% |
| Visual & Performing Arts | 0 | 0.0% |
| Communications | 50 | 9.2% |
| Arts & Humanities | 0 | 0.0% |
| Total | 545 | 100.0% |
Transportation & Commute in Roanoke
Vehicle Availability by Sex in Roanoke
The most prevalent vehicle ownership categories in Roanoke are males with 2 vehicles (438, accounting for 44.2%) and females with 2 vehicles (390, making up 37.7%).
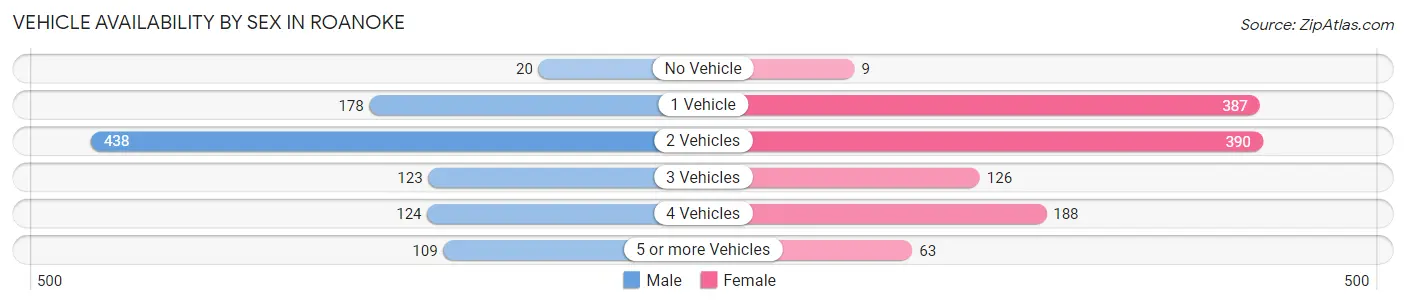
| Vehicles Available | Male | Female |
| No Vehicle | 20 (2.0%) | 9 (0.8%) |
| 1 Vehicle | 178 (17.9%) | 387 (33.3%) |
| 2 Vehicles | 438 (44.2%) | 390 (33.5%) |
| 3 Vehicles | 123 (12.4%) | 126 (10.8%) |
| 4 Vehicles | 124 (12.5%) | 188 (16.2%) |
| 5 or more Vehicles | 109 (11.0%) | 63 (5.4%) |
| Total | 992 (100.0%) | 1,163 (100.0%) |
Commute Time in Roanoke
The most frequently occuring commute durations in Roanoke are 5 to 9 minutes (440 commuters, 21.0%), 10 to 14 minutes (367 commuters, 17.5%), and 45 to 59 minutes (325 commuters, 15.5%).
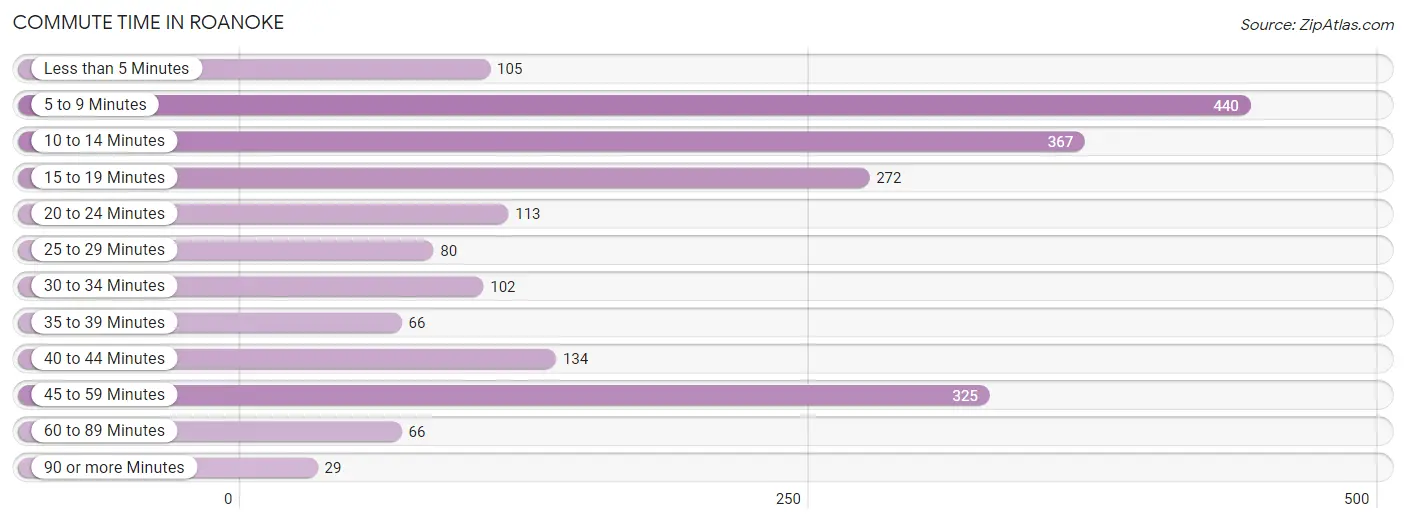
| Commute Time | # Commuters | % Commuters |
| Less than 5 Minutes | 105 | 5.0% |
| 5 to 9 Minutes | 440 | 21.0% |
| 10 to 14 Minutes | 367 | 17.5% |
| 15 to 19 Minutes | 272 | 13.0% |
| 20 to 24 Minutes | 113 | 5.4% |
| 25 to 29 Minutes | 80 | 3.8% |
| 30 to 34 Minutes | 102 | 4.9% |
| 35 to 39 Minutes | 66 | 3.1% |
| 40 to 44 Minutes | 134 | 6.4% |
| 45 to 59 Minutes | 325 | 15.5% |
| 60 to 89 Minutes | 66 | 3.1% |
| 90 or more Minutes | 29 | 1.4% |
Commute Time by Sex in Roanoke
The most common commute times in Roanoke are 15 to 19 minutes (196 commuters, 20.9%) for males and 5 to 9 minutes (289 commuters, 24.8%) for females.
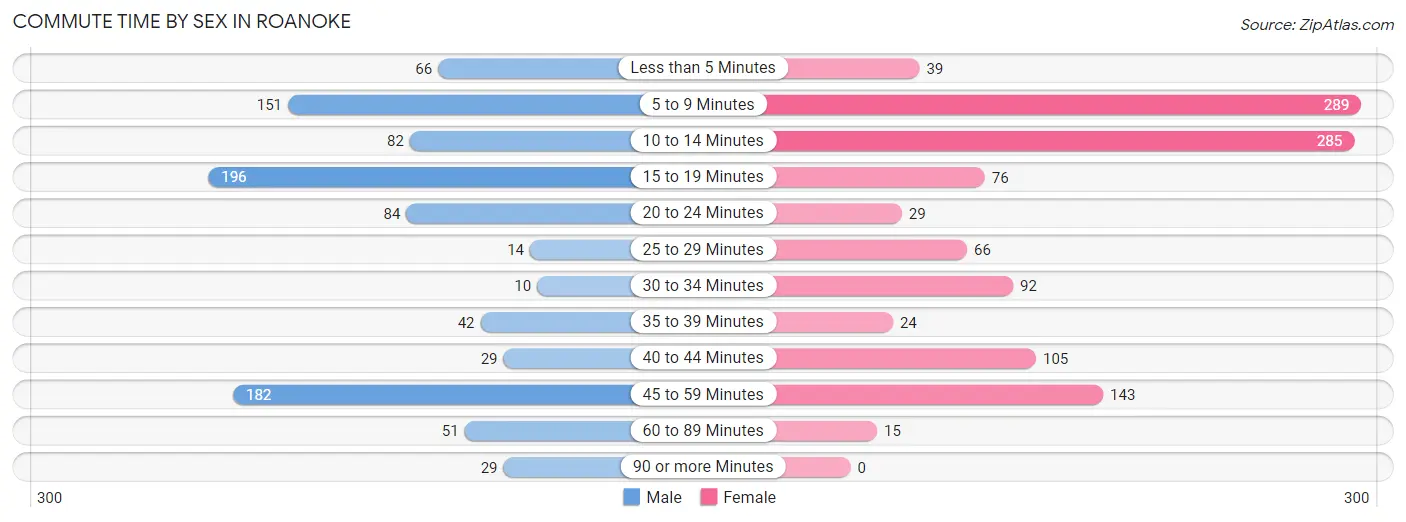
| Commute Time | Male | Female |
| Less than 5 Minutes | 66 (7.0%) | 39 (3.4%) |
| 5 to 9 Minutes | 151 (16.1%) | 289 (24.8%) |
| 10 to 14 Minutes | 82 (8.8%) | 285 (24.5%) |
| 15 to 19 Minutes | 196 (20.9%) | 76 (6.5%) |
| 20 to 24 Minutes | 84 (9.0%) | 29 (2.5%) |
| 25 to 29 Minutes | 14 (1.5%) | 66 (5.7%) |
| 30 to 34 Minutes | 10 (1.1%) | 92 (7.9%) |
| 35 to 39 Minutes | 42 (4.5%) | 24 (2.1%) |
| 40 to 44 Minutes | 29 (3.1%) | 105 (9.0%) |
| 45 to 59 Minutes | 182 (19.4%) | 143 (12.3%) |
| 60 to 89 Minutes | 51 (5.4%) | 15 (1.3%) |
| 90 or more Minutes | 29 (3.1%) | 0 (0.0%) |
Time of Departure to Work by Sex in Roanoke
The most frequent times of departure to work in Roanoke are 4:00 PM to 11:59 PM (167, 17.8%) for males and 7:30 AM to 7:59 AM (224, 19.3%) for females.
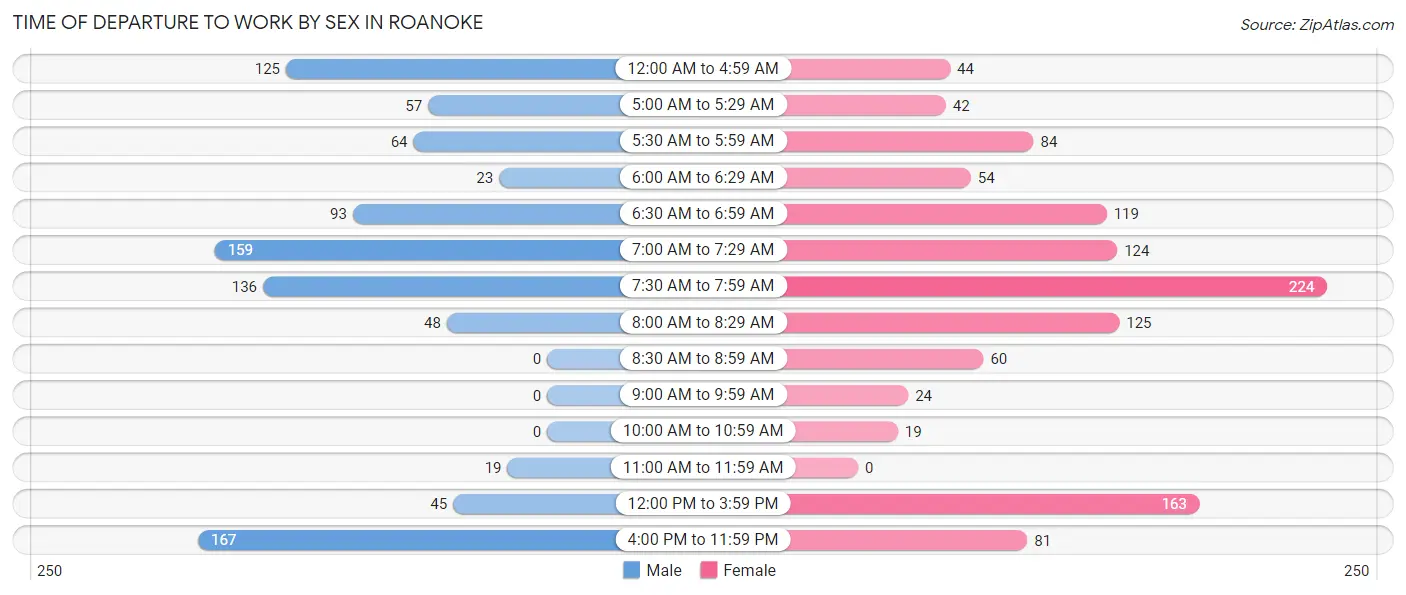
| Time of Departure | Male | Female |
| 12:00 AM to 4:59 AM | 125 (13.4%) | 44 (3.8%) |
| 5:00 AM to 5:29 AM | 57 (6.1%) | 42 (3.6%) |
| 5:30 AM to 5:59 AM | 64 (6.8%) | 84 (7.2%) |
| 6:00 AM to 6:29 AM | 23 (2.5%) | 54 (4.6%) |
| 6:30 AM to 6:59 AM | 93 (9.9%) | 119 (10.2%) |
| 7:00 AM to 7:29 AM | 159 (17.0%) | 124 (10.7%) |
| 7:30 AM to 7:59 AM | 136 (14.5%) | 224 (19.3%) |
| 8:00 AM to 8:29 AM | 48 (5.1%) | 125 (10.7%) |
| 8:30 AM to 8:59 AM | 0 (0.0%) | 60 (5.2%) |
| 9:00 AM to 9:59 AM | 0 (0.0%) | 24 (2.1%) |
| 10:00 AM to 10:59 AM | 0 (0.0%) | 19 (1.6%) |
| 11:00 AM to 11:59 AM | 19 (2.0%) | 0 (0.0%) |
| 12:00 PM to 3:59 PM | 45 (4.8%) | 163 (14.0%) |
| 4:00 PM to 11:59 PM | 167 (17.8%) | 81 (7.0%) |
| Total | 936 (100.0%) | 1,163 (100.0%) |
Housing Occupancy in Roanoke
Occupancy by Ownership in Roanoke
Of the total 2,101 dwellings in Roanoke, owner-occupied units account for 1,462 (69.6%), while renter-occupied units make up 639 (30.4%).
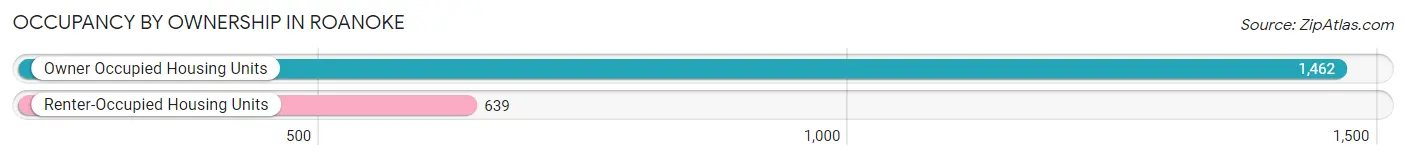
| Occupancy | # Housing Units | % Housing Units |
| Owner Occupied Housing Units | 1,462 | 69.6% |
| Renter-Occupied Housing Units | 639 | 30.4% |
| Total Occupied Housing Units | 2,101 | 100.0% |
Occupancy by Household Size in Roanoke
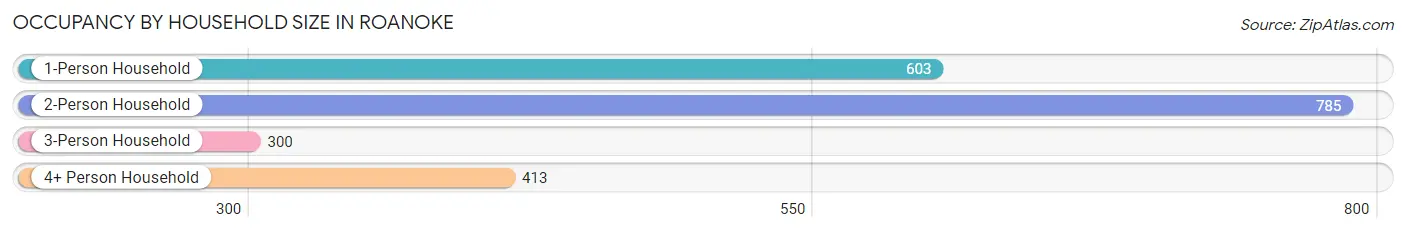
| Household Size | # Housing Units | % Housing Units |
| 1-Person Household | 603 | 28.7% |
| 2-Person Household | 785 | 37.4% |
| 3-Person Household | 300 | 14.3% |
| 4+ Person Household | 413 | 19.7% |
| Total Housing Units | 2,101 | 100.0% |
Occupancy by Ownership by Household Size in Roanoke
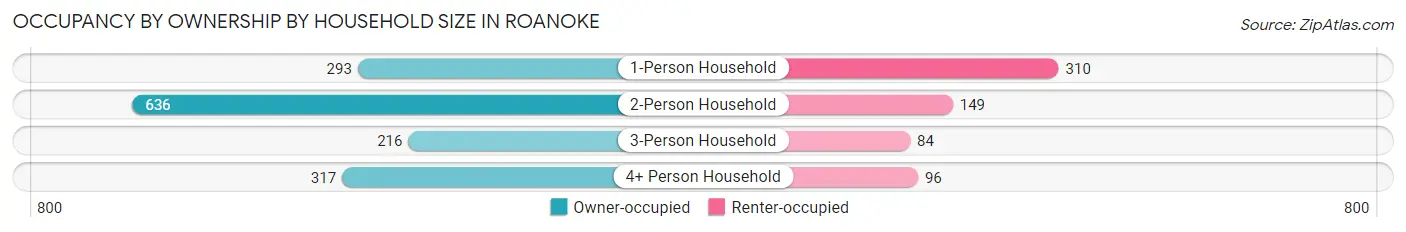
| Household Size | Owner-occupied | Renter-occupied |
| 1-Person Household | 293 (48.6%) | 310 (51.4%) |
| 2-Person Household | 636 (81.0%) | 149 (19.0%) |
| 3-Person Household | 216 (72.0%) | 84 (28.0%) |
| 4+ Person Household | 317 (76.8%) | 96 (23.2%) |
| Total Housing Units | 1,462 (69.6%) | 639 (30.4%) |
Occupancy by Educational Attainment in Roanoke
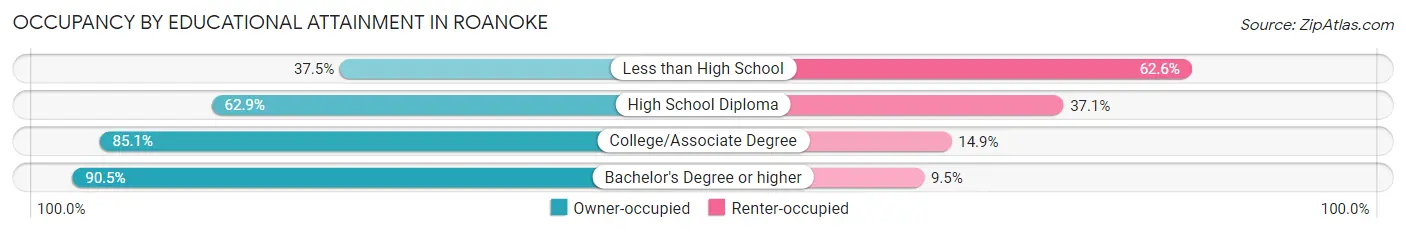
| Household Size | Owner-occupied | Renter-occupied |
| Less than High School | 103 (37.4%) | 172 (62.5%) |
| High School Diploma | 594 (62.9%) | 350 (37.1%) |
| College/Associate Degree | 526 (85.1%) | 92 (14.9%) |
| Bachelor's Degree or higher | 239 (90.5%) | 25 (9.5%) |
Occupancy by Age of Householder in Roanoke
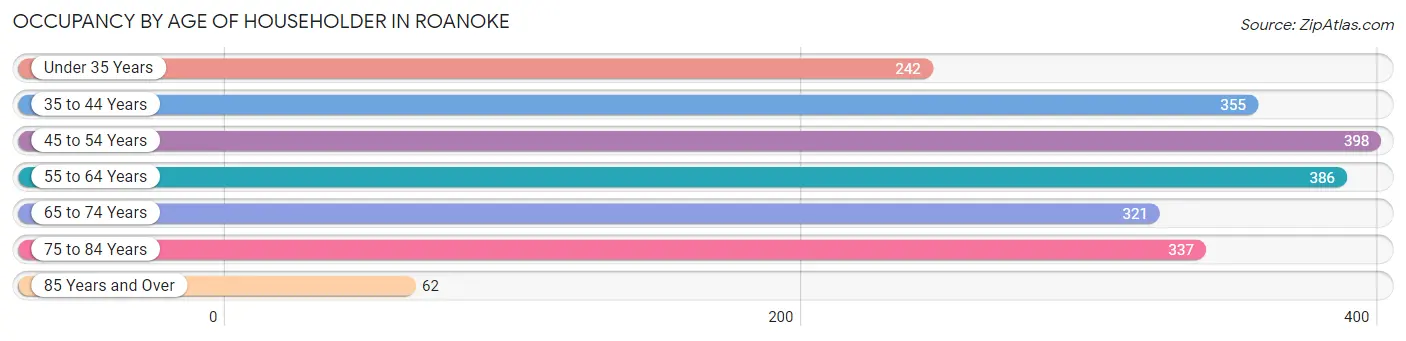
| Age Bracket | # Households | % Households |
| Under 35 Years | 242 | 11.5% |
| 35 to 44 Years | 355 | 16.9% |
| 45 to 54 Years | 398 | 18.9% |
| 55 to 64 Years | 386 | 18.4% |
| 65 to 74 Years | 321 | 15.3% |
| 75 to 84 Years | 337 | 16.0% |
| 85 Years and Over | 62 | 2.9% |
| Total | 2,101 | 100.0% |
Housing Finances in Roanoke
Median Income by Occupancy in Roanoke
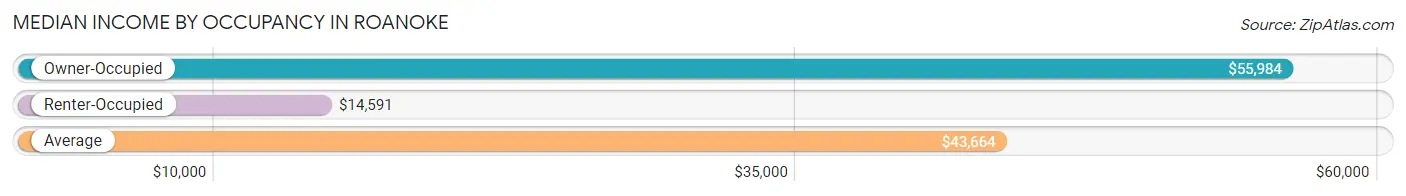
| Occupancy Type | # Households | Median Income |
| Owner-Occupied | 1,462 (69.6%) | $55,984 |
| Renter-Occupied | 639 (30.4%) | $14,591 |
| Average | 2,101 (100.0%) | $43,664 |
Occupancy by Householder Income Bracket in Roanoke
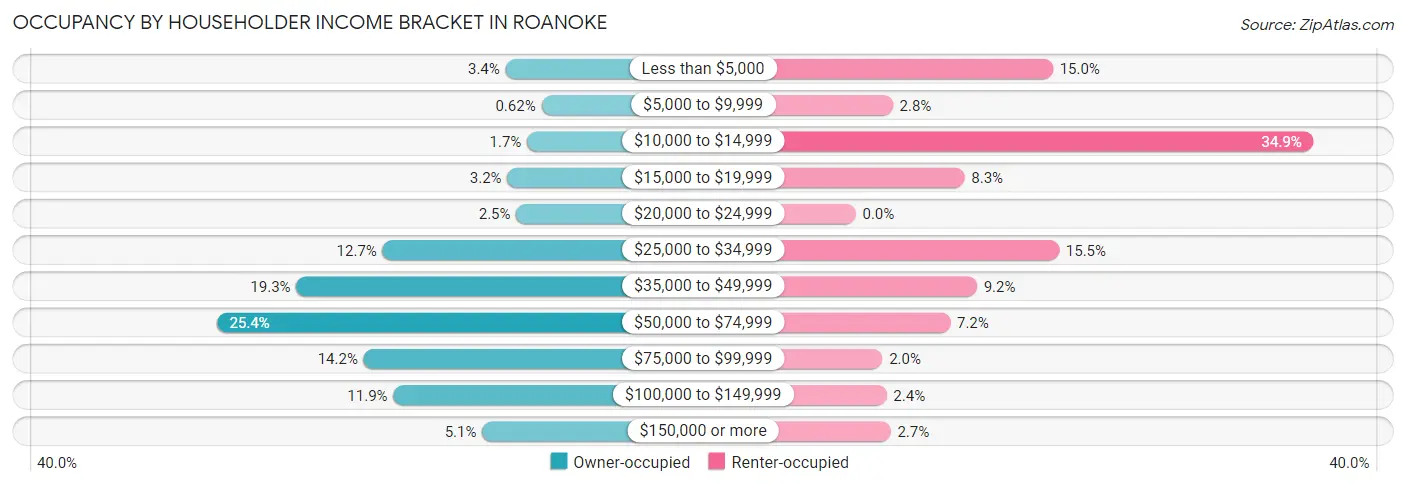
| Income Bracket | Owner-occupied | Renter-occupied |
| Less than $5,000 | 49 (3.4%) | 96 (15.0%) |
| $5,000 to $9,999 | 9 (0.6%) | 18 (2.8%) |
| $10,000 to $14,999 | 25 (1.7%) | 223 (34.9%) |
| $15,000 to $19,999 | 47 (3.2%) | 53 (8.3%) |
| $20,000 to $24,999 | 37 (2.5%) | 0 (0.0%) |
| $25,000 to $34,999 | 186 (12.7%) | 99 (15.5%) |
| $35,000 to $49,999 | 282 (19.3%) | 59 (9.2%) |
| $50,000 to $74,999 | 371 (25.4%) | 46 (7.2%) |
| $75,000 to $99,999 | 207 (14.2%) | 13 (2.0%) |
| $100,000 to $149,999 | 174 (11.9%) | 15 (2.4%) |
| $150,000 or more | 75 (5.1%) | 17 (2.7%) |
| Total | 1,462 (100.0%) | 639 (100.0%) |
Monthly Housing Cost Tiers in Roanoke
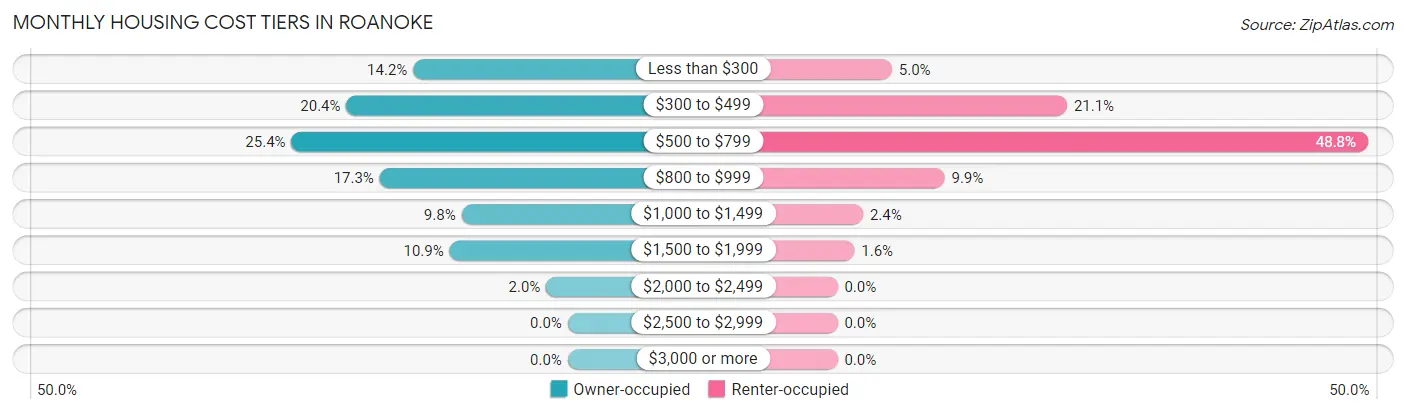
| Monthly Cost | Owner-occupied | Renter-occupied |
| Less than $300 | 208 (14.2%) | 32 (5.0%) |
| $300 to $499 | 298 (20.4%) | 135 (21.1%) |
| $500 to $799 | 372 (25.4%) | 312 (48.8%) |
| $800 to $999 | 253 (17.3%) | 63 (9.9%) |
| $1,000 to $1,499 | 143 (9.8%) | 15 (2.4%) |
| $1,500 to $1,999 | 159 (10.9%) | 10 (1.6%) |
| $2,000 to $2,499 | 29 (2.0%) | 0 (0.0%) |
| $2,500 to $2,999 | 0 (0.0%) | 0 (0.0%) |
| $3,000 or more | 0 (0.0%) | 0 (0.0%) |
| Total | 1,462 (100.0%) | 639 (100.0%) |
Physical Housing Characteristics in Roanoke
Housing Structures in Roanoke
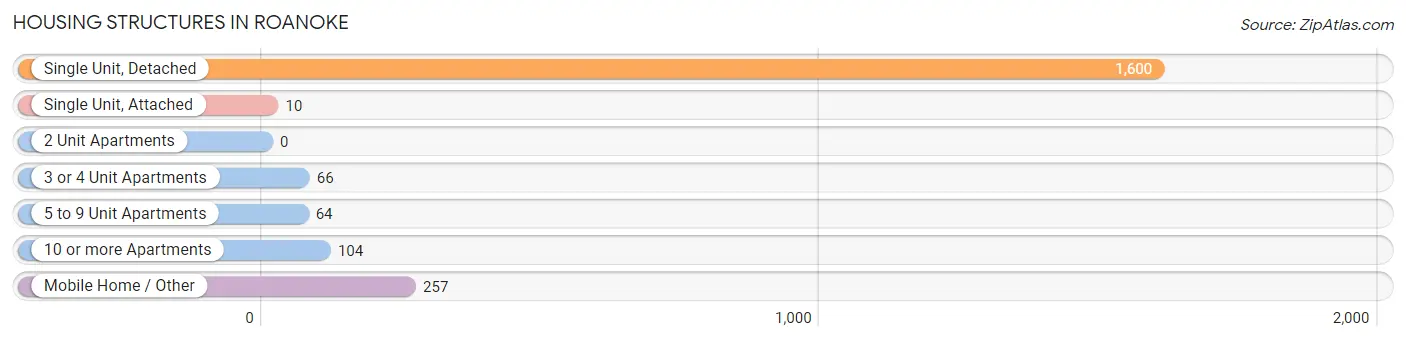
| Structure Type | # Housing Units | % Housing Units |
| Single Unit, Detached | 1,600 | 76.1% |
| Single Unit, Attached | 10 | 0.5% |
| 2 Unit Apartments | 0 | 0.0% |
| 3 or 4 Unit Apartments | 66 | 3.1% |
| 5 to 9 Unit Apartments | 64 | 3.0% |
| 10 or more Apartments | 104 | 5.0% |
| Mobile Home / Other | 257 | 12.2% |
| Total | 2,101 | 100.0% |
Housing Structures by Occupancy in Roanoke
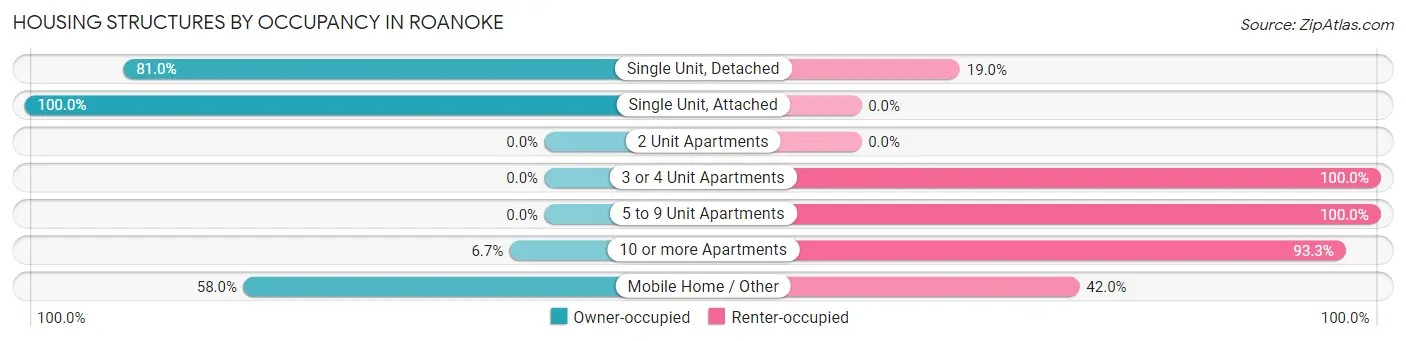
| Structure Type | Owner-occupied | Renter-occupied |
| Single Unit, Detached | 1,296 (81.0%) | 304 (19.0%) |
| Single Unit, Attached | 10 (100.0%) | 0 (0.0%) |
| 2 Unit Apartments | 0 (0.0%) | 0 (0.0%) |
| 3 or 4 Unit Apartments | 0 (0.0%) | 66 (100.0%) |
| 5 to 9 Unit Apartments | 0 (0.0%) | 64 (100.0%) |
| 10 or more Apartments | 7 (6.7%) | 97 (93.3%) |
| Mobile Home / Other | 149 (58.0%) | 108 (42.0%) |
| Total | 1,462 (69.6%) | 639 (30.4%) |
Housing Structures by Number of Rooms in Roanoke
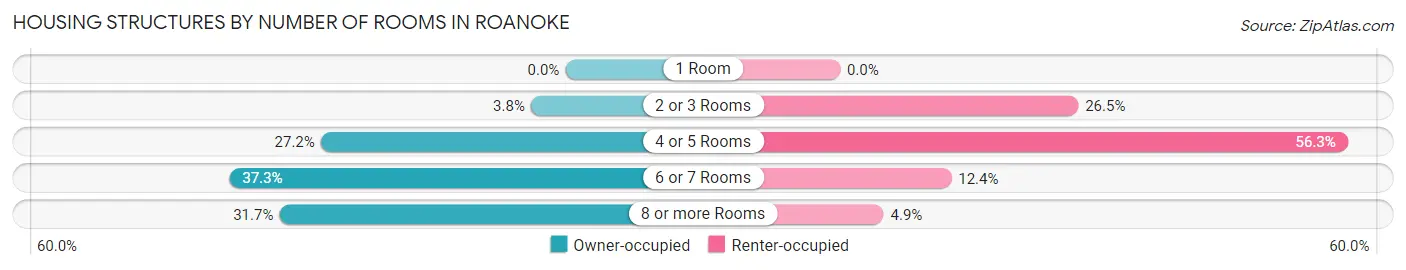
| Number of Rooms | Owner-occupied | Renter-occupied |
| 1 Room | 0 (0.0%) | 0 (0.0%) |
| 2 or 3 Rooms | 56 (3.8%) | 169 (26.5%) |
| 4 or 5 Rooms | 397 (27.2%) | 360 (56.3%) |
| 6 or 7 Rooms | 545 (37.3%) | 79 (12.4%) |
| 8 or more Rooms | 464 (31.7%) | 31 (4.9%) |
| Total | 1,462 (100.0%) | 639 (100.0%) |
Housing Structure by Heating Type in Roanoke
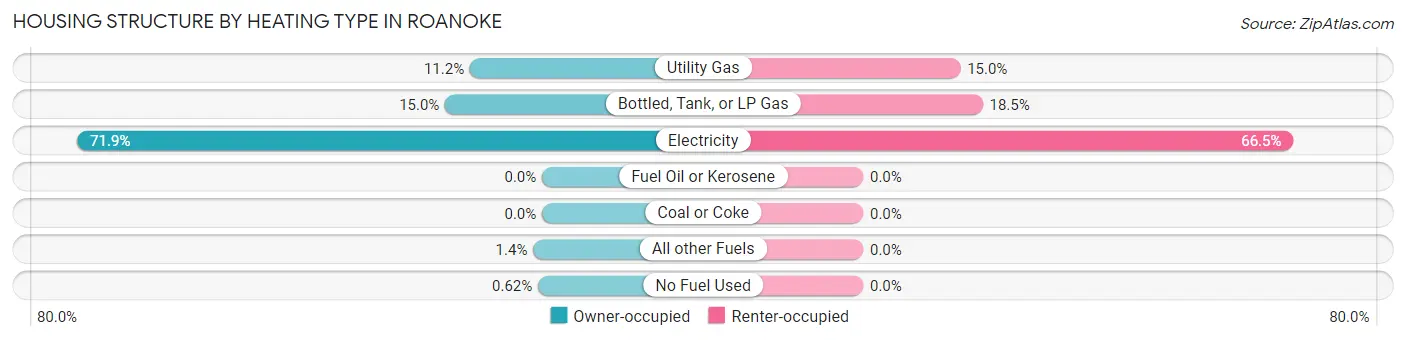
| Heating Type | Owner-occupied | Renter-occupied |
| Utility Gas | 163 (11.2%) | 96 (15.0%) |
| Bottled, Tank, or LP Gas | 219 (15.0%) | 118 (18.5%) |
| Electricity | 1,051 (71.9%) | 425 (66.5%) |
| Fuel Oil or Kerosene | 0 (0.0%) | 0 (0.0%) |
| Coal or Coke | 0 (0.0%) | 0 (0.0%) |
| All other Fuels | 20 (1.4%) | 0 (0.0%) |
| No Fuel Used | 9 (0.6%) | 0 (0.0%) |
| Total | 1,462 (100.0%) | 639 (100.0%) |
Household Vehicle Usage in Roanoke
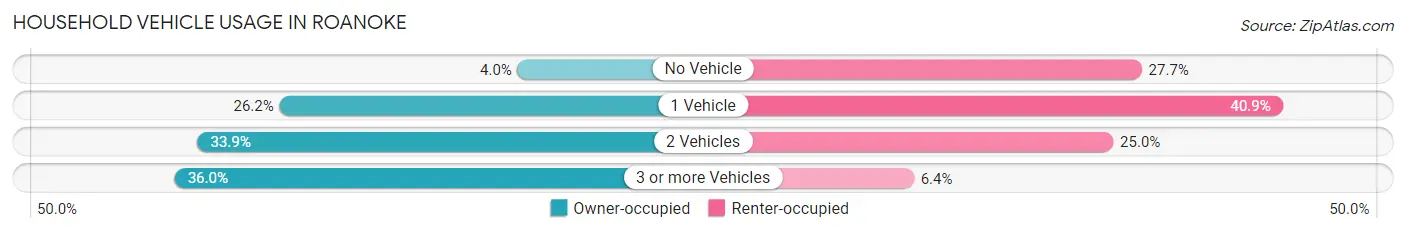
| Vehicles per Household | Owner-occupied | Renter-occupied |
| No Vehicle | 58 (4.0%) | 177 (27.7%) |
| 1 Vehicle | 383 (26.2%) | 261 (40.8%) |
| 2 Vehicles | 495 (33.9%) | 160 (25.0%) |
| 3 or more Vehicles | 526 (36.0%) | 41 (6.4%) |
| Total | 1,462 (100.0%) | 639 (100.0%) |
Real Estate & Mortgages in Roanoke
Real Estate and Mortgage Overview in Roanoke
| Characteristic | Without Mortgage | With Mortgage |
| Housing Units | 825 | 637 |
| Median Property Value | $130,900 | $101,700 |
| Median Household Income | $55,746 | $35 |
| Monthly Housing Costs | $437 | $0 |
| Real Estate Taxes | $469 | $54 |
Property Value by Mortgage Status in Roanoke
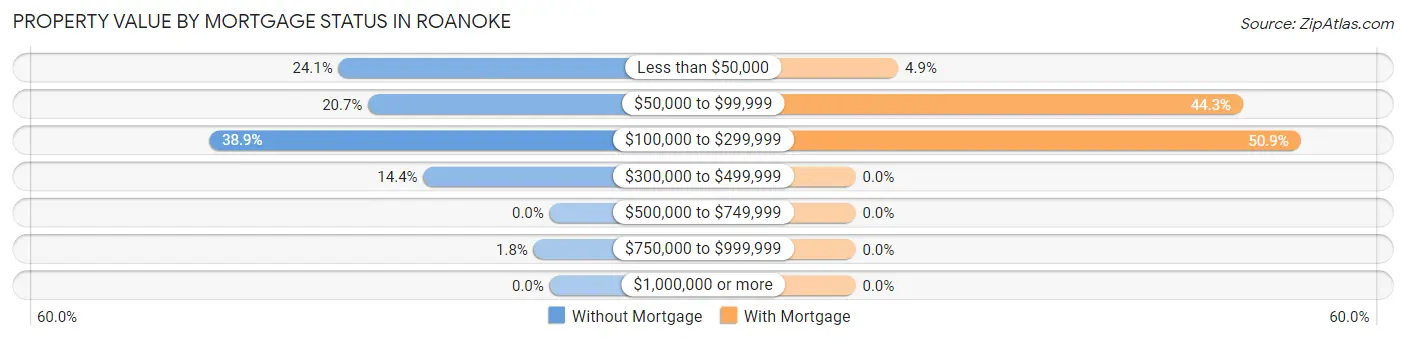
| Property Value | Without Mortgage | With Mortgage |
| Less than $50,000 | 199 (24.1%) | 31 (4.9%) |
| $50,000 to $99,999 | 171 (20.7%) | 282 (44.3%) |
| $100,000 to $299,999 | 321 (38.9%) | 324 (50.9%) |
| $300,000 to $499,999 | 119 (14.4%) | 0 (0.0%) |
| $500,000 to $749,999 | 0 (0.0%) | 0 (0.0%) |
| $750,000 to $999,999 | 15 (1.8%) | 0 (0.0%) |
| $1,000,000 or more | 0 (0.0%) | 0 (0.0%) |
| Total | 825 (100.0%) | 637 (100.0%) |
Household Income by Mortgage Status in Roanoke
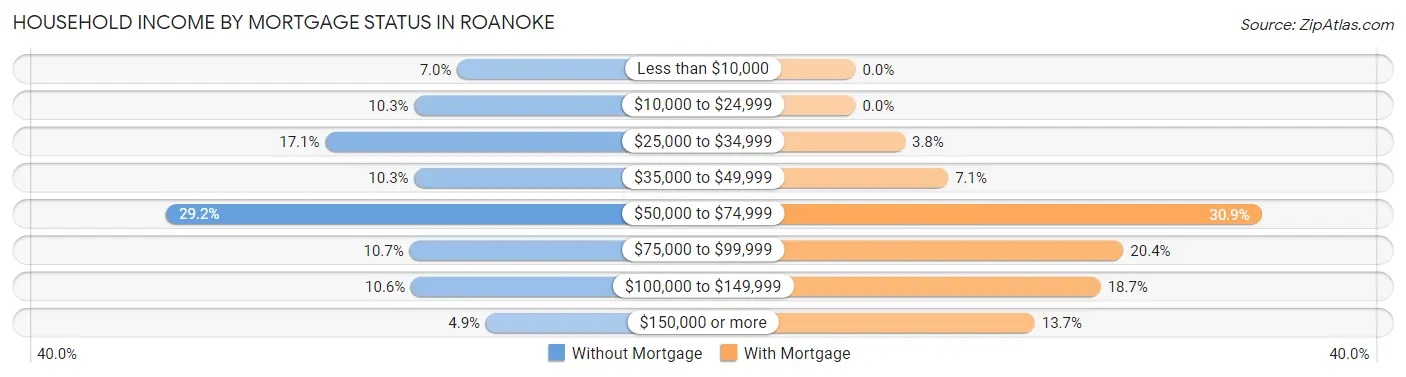
| Household Income | Without Mortgage | With Mortgage |
| Less than $10,000 | 58 (7.0%) | 0 (0.0%) |
| $10,000 to $24,999 | 85 (10.3%) | 0 (0.0%) |
| $25,000 to $34,999 | 141 (17.1%) | 24 (3.8%) |
| $35,000 to $49,999 | 85 (10.3%) | 45 (7.1%) |
| $50,000 to $74,999 | 241 (29.2%) | 197 (30.9%) |
| $75,000 to $99,999 | 88 (10.7%) | 130 (20.4%) |
| $100,000 to $149,999 | 87 (10.5%) | 119 (18.7%) |
| $150,000 or more | 40 (4.9%) | 87 (13.7%) |
| Total | 825 (100.0%) | 637 (100.0%) |
Property Value to Household Income Ratio in Roanoke
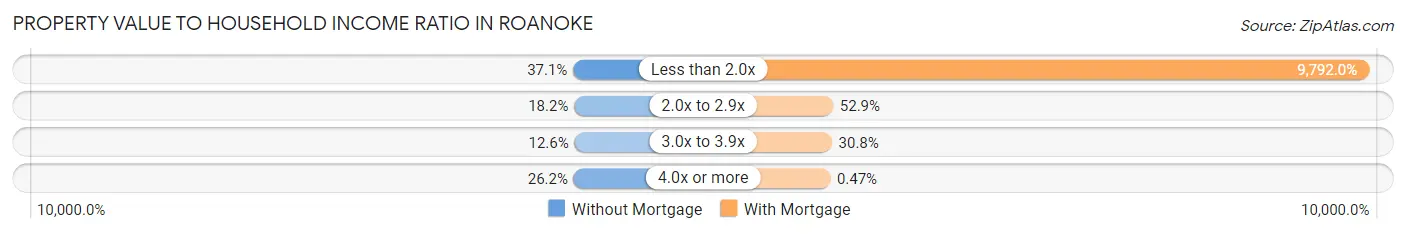
| Value-to-Income Ratio | Without Mortgage | With Mortgage |
| Less than 2.0x | 306 (37.1%) | 62,375 (9,792.0%) |
| 2.0x to 2.9x | 150 (18.2%) | 337 (52.9%) |
| 3.0x to 3.9x | 104 (12.6%) | 196 (30.8%) |
| 4.0x or more | 216 (26.2%) | 3 (0.5%) |
| Total | 825 (100.0%) | 637 (100.0%) |
Real Estate Taxes by Mortgage Status in Roanoke
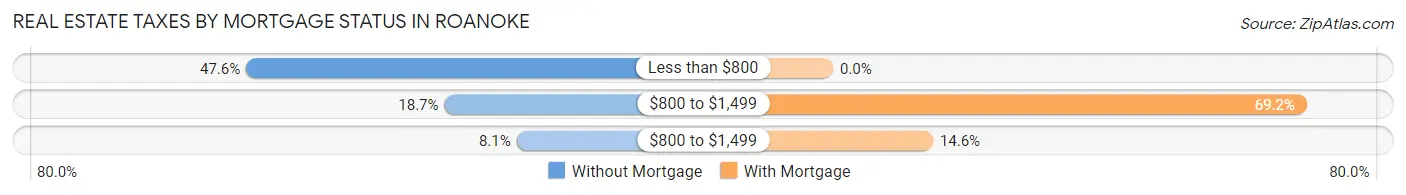
| Property Taxes | Without Mortgage | With Mortgage |
| Less than $800 | 393 (47.6%) | 0 (0.0%) |
| $800 to $1,499 | 154 (18.7%) | 441 (69.2%) |
| $800 to $1,499 | 67 (8.1%) | 93 (14.6%) |
| Total | 825 (100.0%) | 637 (100.0%) |
Health & Disability in Roanoke
Health Insurance Coverage by Age in Roanoke
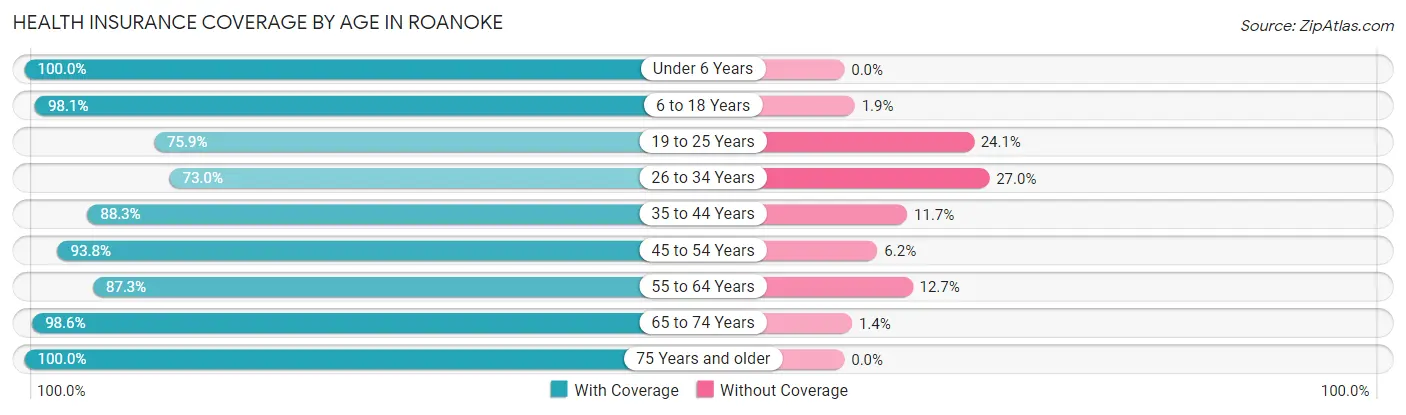
| Age Bracket | With Coverage | Without Coverage |
| Under 6 Years | 298 (100.0%) | 0 (0.0%) |
| 6 to 18 Years | 809 (98.1%) | 16 (1.9%) |
| 19 to 25 Years | 327 (75.9%) | 104 (24.1%) |
| 26 to 34 Years | 378 (73.0%) | 140 (27.0%) |
| 35 to 44 Years | 641 (88.3%) | 85 (11.7%) |
| 45 to 54 Years | 593 (93.8%) | 39 (6.2%) |
| 55 to 64 Years | 562 (87.3%) | 82 (12.7%) |
| 65 to 74 Years | 481 (98.6%) | 7 (1.4%) |
| 75 Years and older | 596 (100.0%) | 0 (0.0%) |
| Total | 4,685 (90.8%) | 473 (9.2%) |
Health Insurance Coverage by Citizenship Status in Roanoke
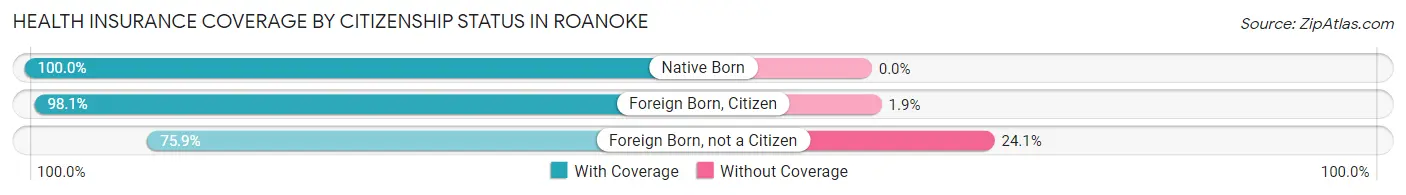
| Citizenship Status | With Coverage | Without Coverage |
| Native Born | 298 (100.0%) | 0 (0.0%) |
| Foreign Born, Citizen | 809 (98.1%) | 16 (1.9%) |
| Foreign Born, not a Citizen | 327 (75.9%) | 104 (24.1%) |
Health Insurance Coverage by Household Income in Roanoke
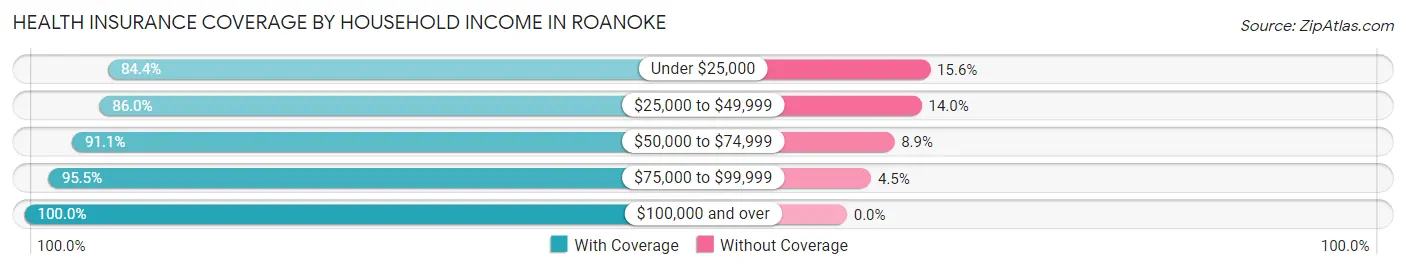
| Household Income | With Coverage | Without Coverage |
| Under $25,000 | 751 (84.4%) | 139 (15.6%) |
| $25,000 to $49,999 | 1,130 (86.0%) | 184 (14.0%) |
| $50,000 to $74,999 | 1,169 (91.1%) | 114 (8.9%) |
| $75,000 to $99,999 | 757 (95.5%) | 36 (4.5%) |
| $100,000 and over | 878 (100.0%) | 0 (0.0%) |
Public vs Private Health Insurance Coverage by Age in Roanoke
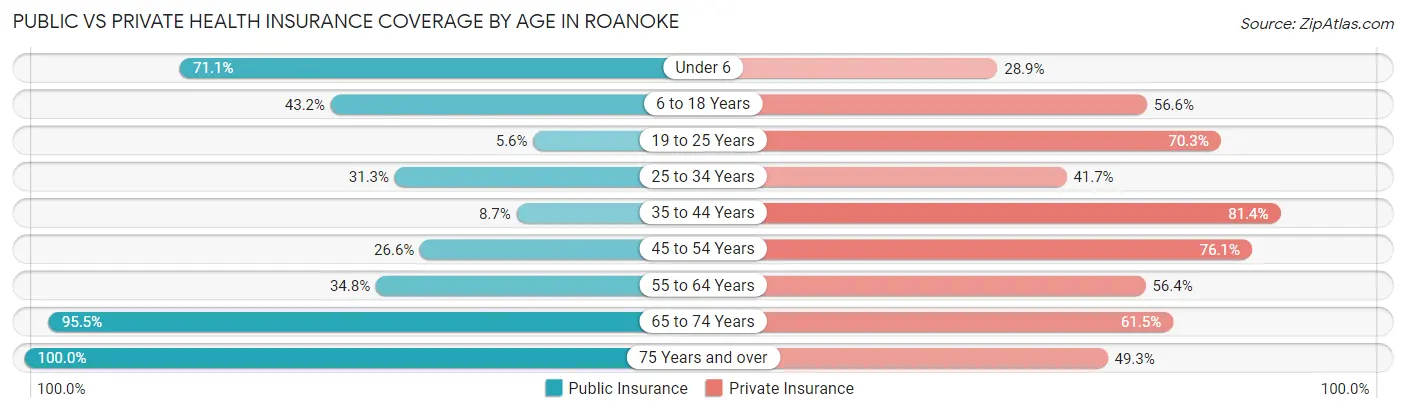
| Age Bracket | Public Insurance | Private Insurance |
| Under 6 | 212 (71.1%) | 86 (28.9%) |
| 6 to 18 Years | 356 (43.1%) | 467 (56.6%) |
| 19 to 25 Years | 24 (5.6%) | 303 (70.3%) |
| 25 to 34 Years | 162 (31.3%) | 216 (41.7%) |
| 35 to 44 Years | 63 (8.7%) | 591 (81.4%) |
| 45 to 54 Years | 168 (26.6%) | 481 (76.1%) |
| 55 to 64 Years | 224 (34.8%) | 363 (56.4%) |
| 65 to 74 Years | 466 (95.5%) | 300 (61.5%) |
| 75 Years and over | 596 (100.0%) | 294 (49.3%) |
| Total | 2,271 (44.0%) | 3,101 (60.1%) |
Disability Status by Sex by Age in Roanoke
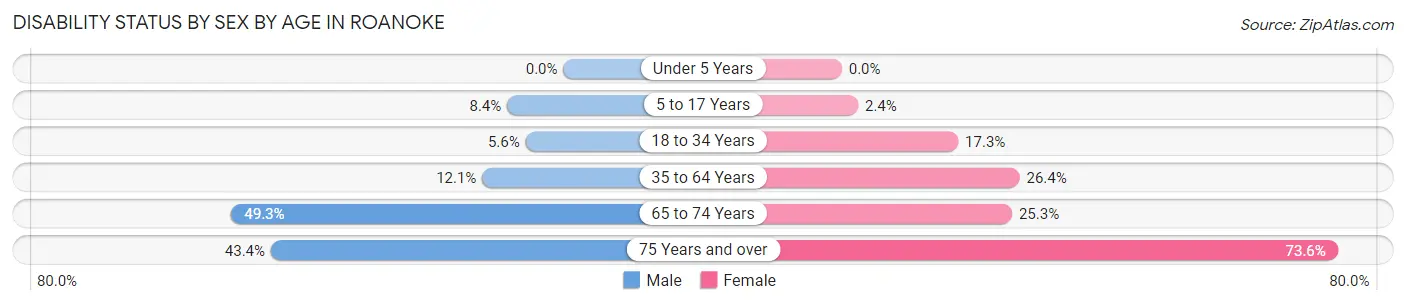
| Age Bracket | Male | Female |
| Under 5 Years | 0 (0.0%) | 0 (0.0%) |
| 5 to 17 Years | 36 (8.4%) | 9 (2.4%) |
| 18 to 34 Years | 30 (5.6%) | 84 (17.3%) |
| 35 to 64 Years | 123 (12.0%) | 259 (26.4%) |
| 65 to 74 Years | 104 (49.3%) | 70 (25.3%) |
| 75 Years and over | 86 (43.4%) | 293 (73.6%) |
Disability Class by Sex by Age in Roanoke
Disability Class: Hearing Difficulty
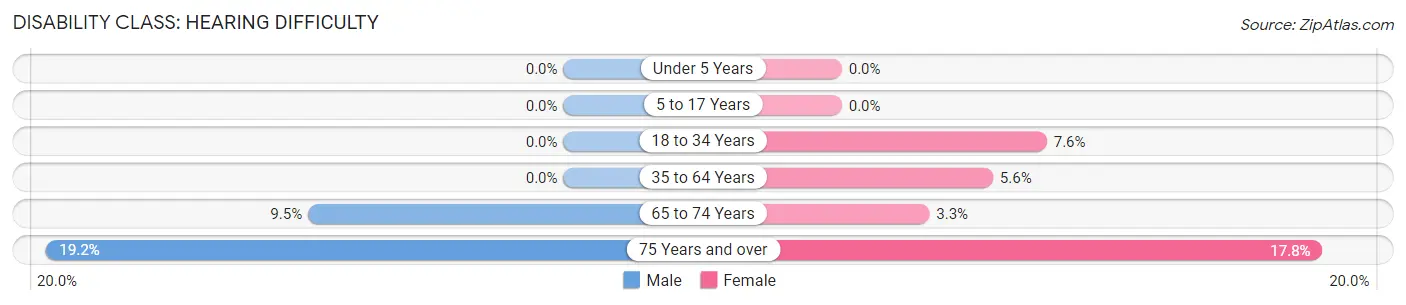
| Age Bracket | Male | Female |
| Under 5 Years | 0 (0.0%) | 0 (0.0%) |
| 5 to 17 Years | 0 (0.0%) | 0 (0.0%) |
| 18 to 34 Years | 0 (0.0%) | 37 (7.6%) |
| 35 to 64 Years | 0 (0.0%) | 55 (5.6%) |
| 65 to 74 Years | 20 (9.5%) | 9 (3.3%) |
| 75 Years and over | 38 (19.2%) | 71 (17.8%) |
Disability Class: Vision Difficulty
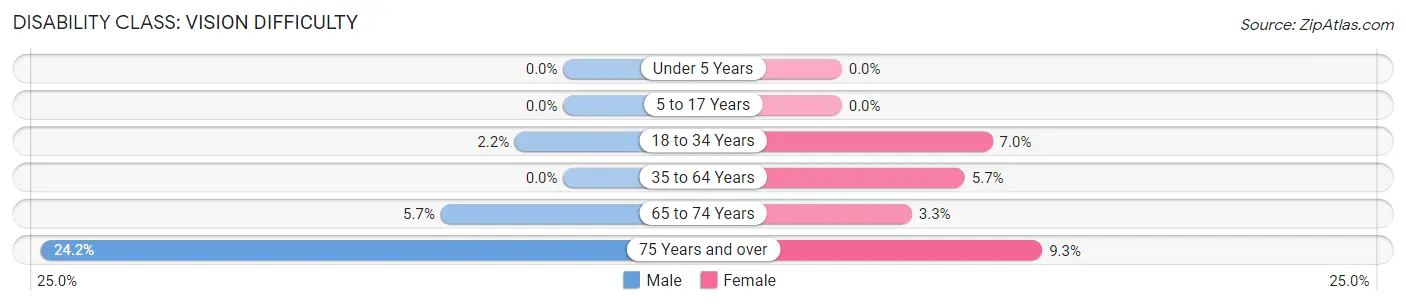
| Age Bracket | Male | Female |
| Under 5 Years | 0 (0.0%) | 0 (0.0%) |
| 5 to 17 Years | 0 (0.0%) | 0 (0.0%) |
| 18 to 34 Years | 12 (2.2%) | 34 (7.0%) |
| 35 to 64 Years | 0 (0.0%) | 56 (5.7%) |
| 65 to 74 Years | 12 (5.7%) | 9 (3.3%) |
| 75 Years and over | 48 (24.2%) | 37 (9.3%) |
Disability Class: Cognitive Difficulty
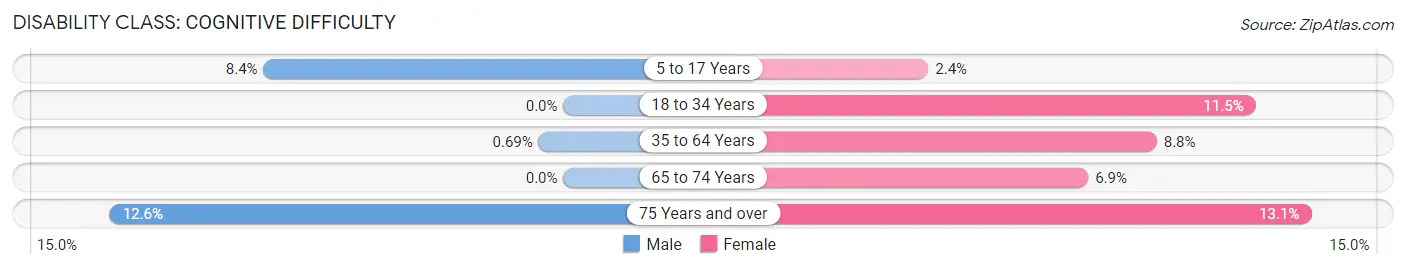
| Age Bracket | Male | Female |
| 5 to 17 Years | 36 (8.4%) | 9 (2.4%) |
| 18 to 34 Years | 0 (0.0%) | 56 (11.5%) |
| 35 to 64 Years | 7 (0.7%) | 86 (8.8%) |
| 65 to 74 Years | 0 (0.0%) | 19 (6.9%) |
| 75 Years and over | 25 (12.6%) | 52 (13.1%) |
Disability Class: Ambulatory Difficulty
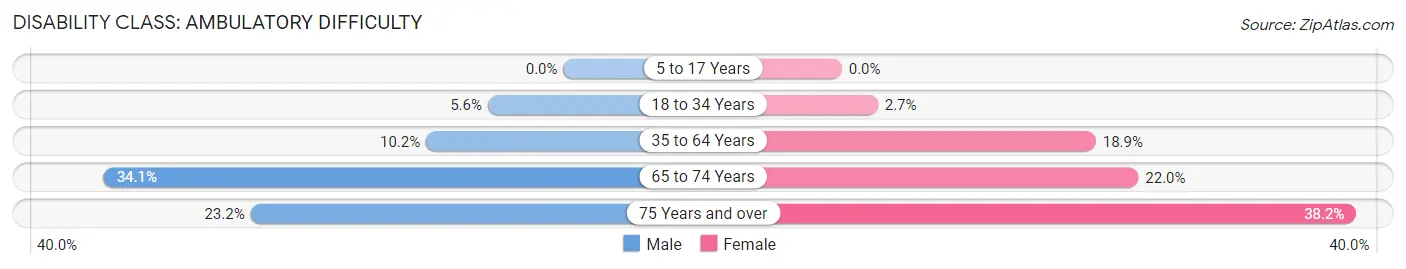
| Age Bracket | Male | Female |
| 5 to 17 Years | 0 (0.0%) | 0 (0.0%) |
| 18 to 34 Years | 30 (5.6%) | 13 (2.7%) |
| 35 to 64 Years | 104 (10.2%) | 185 (18.9%) |
| 65 to 74 Years | 72 (34.1%) | 61 (22.0%) |
| 75 Years and over | 46 (23.2%) | 152 (38.2%) |
Disability Class: Self-Care Difficulty
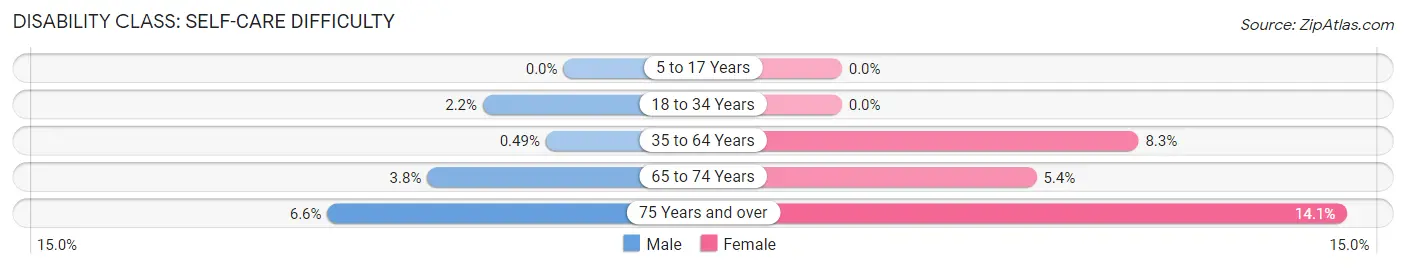
| Age Bracket | Male | Female |
| 5 to 17 Years | 0 (0.0%) | 0 (0.0%) |
| 18 to 34 Years | 12 (2.2%) | 0 (0.0%) |
| 35 to 64 Years | 5 (0.5%) | 81 (8.3%) |
| 65 to 74 Years | 8 (3.8%) | 15 (5.4%) |
| 75 Years and over | 13 (6.6%) | 56 (14.1%) |
Technology Access in Roanoke
Computing Device Access in Roanoke
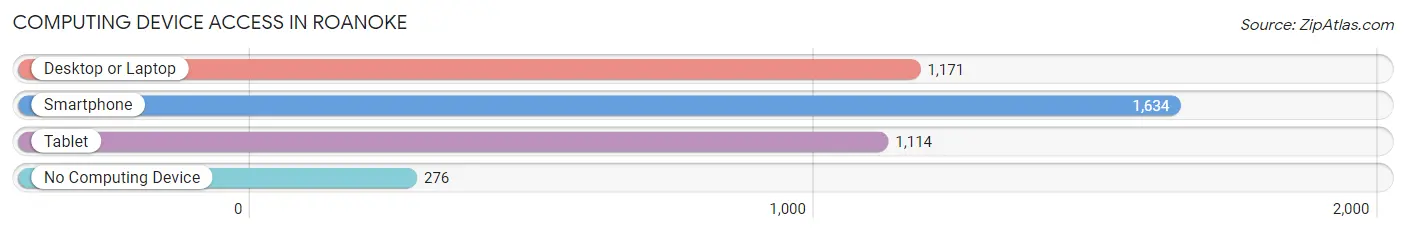
| Device Type | # Households | % Households |
| Desktop or Laptop | 1,171 | 55.7% |
| Smartphone | 1,634 | 77.8% |
| Tablet | 1,114 | 53.0% |
| No Computing Device | 276 | 13.1% |
| Total | 2,101 | 100.0% |
Internet Access in Roanoke
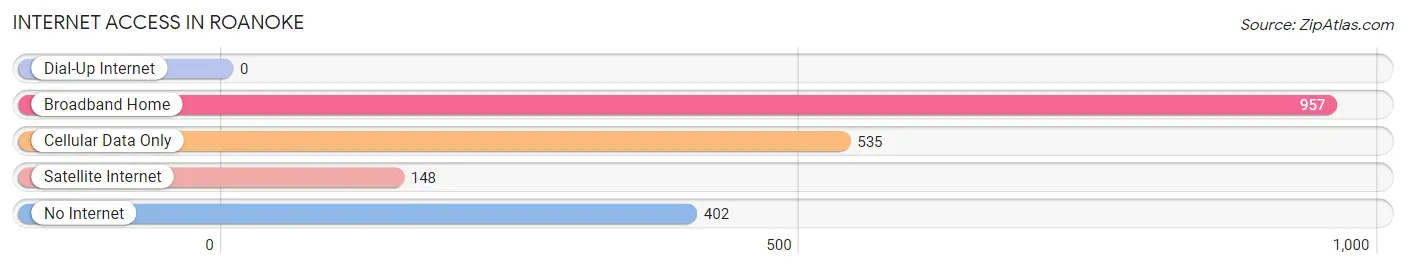
| Internet Type | # Households | % Households |
| Dial-Up Internet | 0 | 0.0% |
| Broadband Home | 957 | 45.6% |
| Cellular Data Only | 535 | 25.5% |
| Satellite Internet | 148 | 7.0% |
| No Internet | 402 | 19.1% |
| Total | 2,101 | 100.0% |
Roanoke Summary
Roanoke, Alabama is a small city located in Randolph County in the east-central part of the state. It is situated on the banks of the Coosa River, about halfway between Birmingham and Atlanta. The city has a population of 6,717 as of the 2010 census, and is the county seat of Randolph County.
History
The area that is now Roanoke was first settled in the early 1800s by settlers from Georgia and the Carolinas. The town was originally known as “Cotton Town” due to the large amount of cotton grown in the area. In 1832, the town was renamed Roanoke after the Roanoke River in Virginia. The town was officially incorporated in 1837.
During the Civil War, Roanoke was a major supply center for the Confederate Army. The town was also the site of a major battle in 1864, when Union forces attempted to capture the city. The Union forces were unsuccessful, and the town remained in Confederate hands until the end of the war.
Geography
Roanoke is located in east-central Alabama, about halfway between Birmingham and Atlanta. The city is situated on the banks of the Coosa River, and is surrounded by rolling hills and forests. The city has a total area of 8.2 square miles, all of which is land.
Economy
The economy of Roanoke is largely based on agriculture and manufacturing. The city is home to several large manufacturing plants, including a paper mill, a furniture factory, and a plastics plant. Agriculture is also an important part of the local economy, with cotton, corn, and soybeans being the main crops grown in the area.
Demographics
As of the 2010 census, Roanoke had a population of 6,717. The racial makeup of the city was 79.2% White, 17.7% African American, 0.3% Native American, 0.4% Asian, 0.1% Pacific Islander, and 2.3% from other races. Hispanic or Latino of any race were 1.7% of the population.
The median household income in Roanoke was $30,945, and the median family income was $37,917. The per capita income for the city was $17,845. About 17.2% of families and 20.3% of the population were below the poverty line, including 28.3% of those under age 18 and 16.2% of those age 65 or over.
Roanoke is served by the Randolph County School System, which includes two elementary schools, one middle school, and one high school. The city is also home to several churches, including the First United Methodist Church, the First Baptist Church, and the Church of Christ.
Roanoke is a small city with a rich history and a diverse population. The city is home to several large manufacturing plants, and agriculture is an important part of the local economy. The city is served by the Randolph County School System, and is home to several churches. Roanoke is a great place to live, work, and raise a family.
Common Questions
What is Per Capita Income in Roanoke?
Per Capita income in Roanoke is $23,242.
What is the Median Family Income in Roanoke?
Median Family Income in Roanoke is $55,924.
What is the Median Household income in Roanoke?
Median Household Income in Roanoke is $43,664.
What is Income or Wage Gap in Roanoke?
Income or Wage Gap in Roanoke is 23.6%.
Women in Roanoke earn 76.4 cents for every dollar earned by a man.
What is Inequality or Gini Index in Roanoke?
Inequality or Gini Index in Roanoke is 0.45.
What is the Total Population of Roanoke?
Total Population of Roanoke is 5,346.
What is the Total Male Population of Roanoke?
Total Male Population of Roanoke is 2,613.
What is the Total Female Population of Roanoke?
Total Female Population of Roanoke is 2,733.
What is the Ratio of Males per 100 Females in Roanoke?
There are 95.61 Males per 100 Females in Roanoke.
What is the Ratio of Females per 100 Males in Roanoke?
There are 104.59 Females per 100 Males in Roanoke.
What is the Median Population Age in Roanoke?
Median Population Age in Roanoke is 43.4 Years.
What is the Average Family Size in Roanoke
Average Family Size in Roanoke is 3.0 People.
What is the Average Household Size in Roanoke
Average Household Size in Roanoke is 2.5 People.
How Large is the Labor Force in Roanoke?
There are 2,256 People in the Labor Forcein in Roanoke.
What is the Percentage of People in the Labor Force in Roanoke?
51.4% of People are in the Labor Force in Roanoke.
What is the Unemployment Rate in Roanoke?
Unemployment Rate in Roanoke is 3.4%.