Langston, AL Map & Demographics
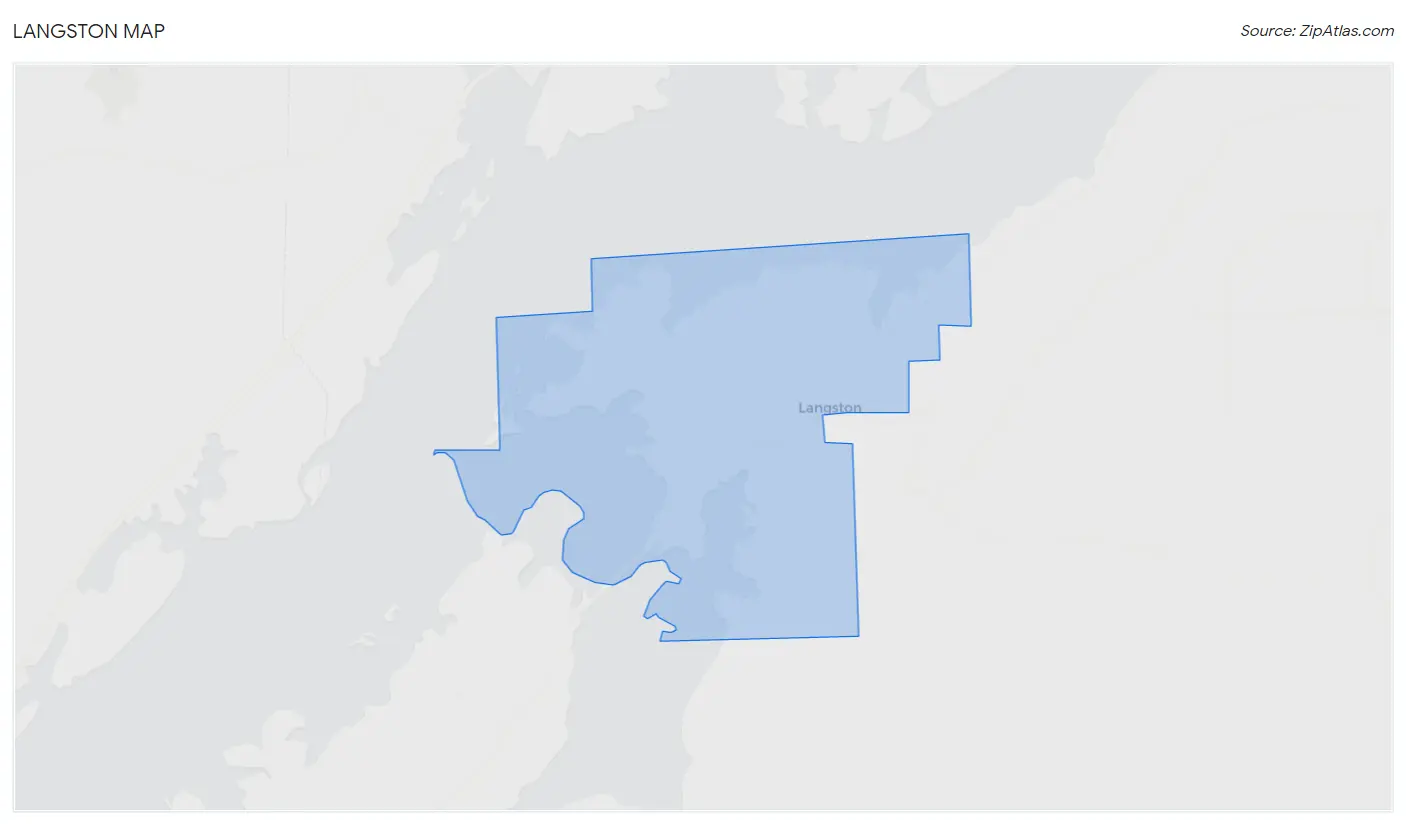
Langston Map
Langston Overview
$40,202
PER CAPITA INCOME
$56,071
AVG FAMILY INCOME
$53,333
AVG HOUSEHOLD INCOME
0.53
INEQUALITY / GINI INDEX
240
TOTAL POPULATION
126
MALE POPULATION
114
FEMALE POPULATION
110.53
MALES / 100 FEMALES
90.48
FEMALES / 100 MALES
56.9
MEDIAN AGE
2.5
AVG FAMILY SIZE
2.1
AVG HOUSEHOLD SIZE
108
LABOR FORCE [ PEOPLE ]
46.8%
PERCENT IN LABOR FORCE
13.9%
UNEMPLOYMENT RATE
Langston Zip Codes
Income in Langston
Income Overview in Langston
Per Capita Income in Langston is $40,202, while median incomes of families and households are $56,071 and $53,333 respectively.
| Characteristic | Number | Measure |
| Per Capita Income | 240 | $40,202 |
| Median Family Income | 76 | $56,071 |
| Mean Family Income | 76 | $95,328 |
| Median Household Income | 116 | $53,333 |
| Mean Household Income | 116 | $79,234 |
| Income Deficit | 76 | $0 |
| Wage / Income Gap (%) | 240 | 0.00% |
| Wage / Income Gap ($) | 240 | 100.00¢ per $1 |
| Gini / Inequality Index | 240 | 0.53 |
Earnings by Sex in Langston
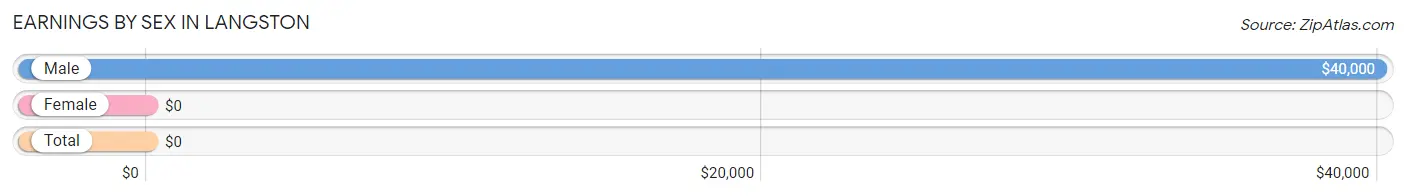
| Sex | Number | Average Earnings |
| Male | 58 (53.2%) | $40,000 |
| Female | 51 (46.8%) | $0 |
| Total | 109 (100.0%) | $0 |
Earnings by Sex by Income Bracket in Langston
The most common earnings brackets in Langston are $45,000 to $49,999 for men (10 | 17.2%) and $2,500 to $4,999 for women (14 | 27.5%).
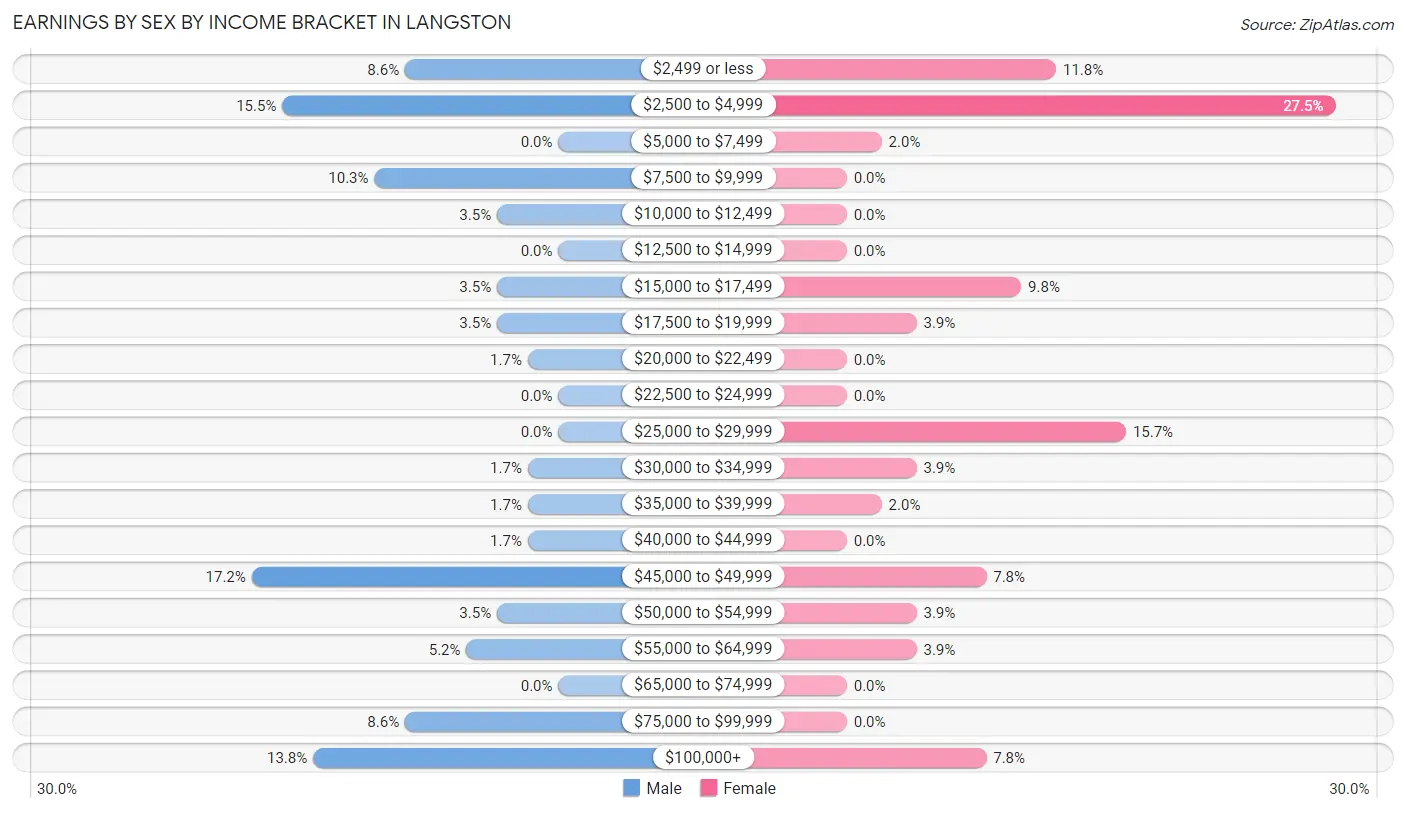
| Income | Male | Female |
| $2,499 or less | 5 (8.6%) | 6 (11.8%) |
| $2,500 to $4,999 | 9 (15.5%) | 14 (27.5%) |
| $5,000 to $7,499 | 0 (0.0%) | 1 (2.0%) |
| $7,500 to $9,999 | 6 (10.3%) | 0 (0.0%) |
| $10,000 to $12,499 | 2 (3.5%) | 0 (0.0%) |
| $12,500 to $14,999 | 0 (0.0%) | 0 (0.0%) |
| $15,000 to $17,499 | 2 (3.5%) | 5 (9.8%) |
| $17,500 to $19,999 | 2 (3.5%) | 2 (3.9%) |
| $20,000 to $22,499 | 1 (1.7%) | 0 (0.0%) |
| $22,500 to $24,999 | 0 (0.0%) | 0 (0.0%) |
| $25,000 to $29,999 | 0 (0.0%) | 8 (15.7%) |
| $30,000 to $34,999 | 1 (1.7%) | 2 (3.9%) |
| $35,000 to $39,999 | 1 (1.7%) | 1 (2.0%) |
| $40,000 to $44,999 | 1 (1.7%) | 0 (0.0%) |
| $45,000 to $49,999 | 10 (17.2%) | 4 (7.8%) |
| $50,000 to $54,999 | 2 (3.5%) | 2 (3.9%) |
| $55,000 to $64,999 | 3 (5.2%) | 2 (3.9%) |
| $65,000 to $74,999 | 0 (0.0%) | 0 (0.0%) |
| $75,000 to $99,999 | 5 (8.6%) | 0 (0.0%) |
| $100,000+ | 8 (13.8%) | 4 (7.8%) |
| Total | 58 (100.0%) | 51 (100.0%) |
Earnings by Sex by Educational Attainment in Langston
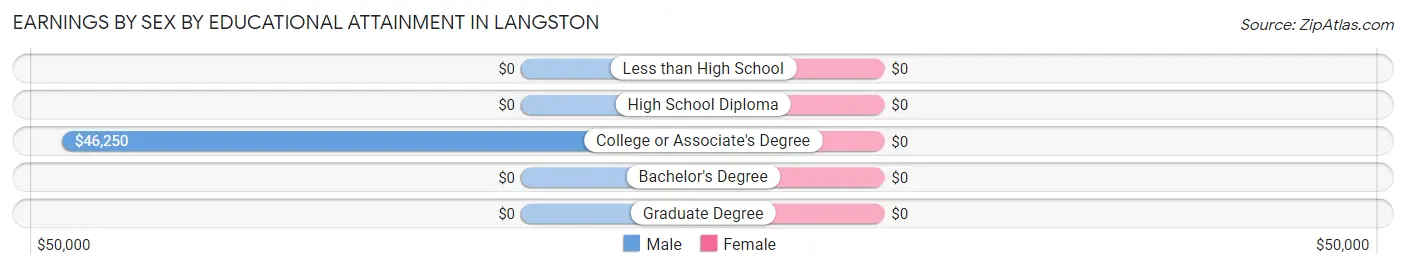
| Educational Attainment | Male Income | Female Income |
| Less than High School | - | - |
| High School Diploma | - | - |
| College or Associate's Degree | $46,250 | $0 |
| Bachelor's Degree | - | - |
| Graduate Degree | - | - |
| Total | $46,250 | $0 |
Family Income in Langston
Family Income Brackets in Langston
According to the Langston family income data, there are 18 families falling into the $50,000 to $74,999 income range, which is the most common income bracket and makes up 23.7% of all families.
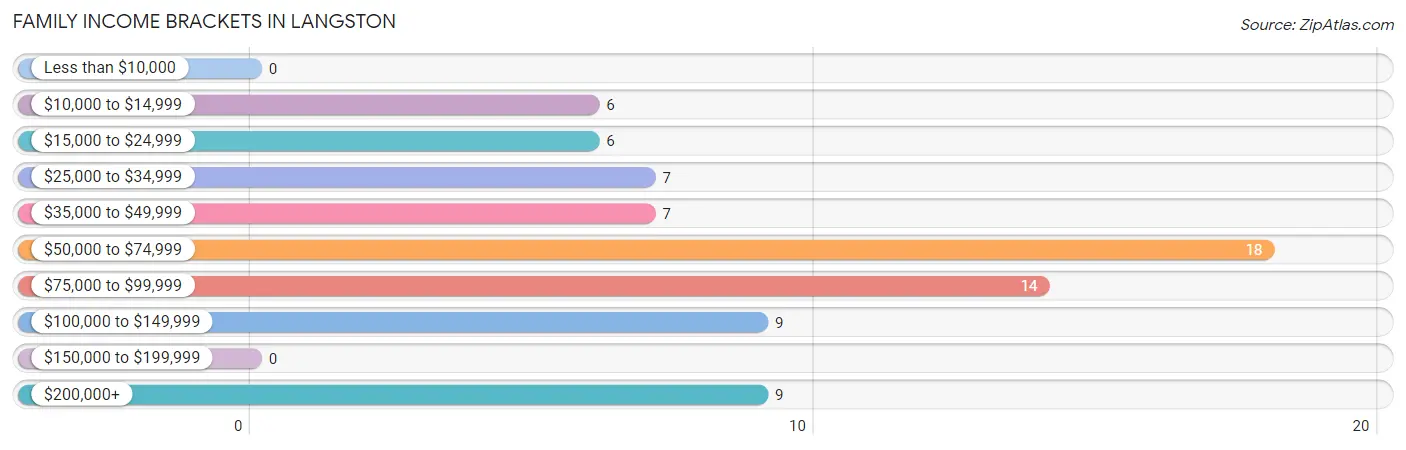
| Income Bracket | # Families | % Families |
| Less than $10,000 | 0 | 0.0% |
| $10,000 to $14,999 | 6 | 7.9% |
| $15,000 to $24,999 | 6 | 7.9% |
| $25,000 to $34,999 | 7 | 9.2% |
| $35,000 to $49,999 | 7 | 9.2% |
| $50,000 to $74,999 | 18 | 23.7% |
| $75,000 to $99,999 | 14 | 18.4% |
| $100,000 to $149,999 | 9 | 11.8% |
| $150,000 to $199,999 | 0 | 0.0% |
| $200,000+ | 9 | 11.8% |
Family Income by Famaliy Size in Langston
2-person families (60 | 78.9%) account for the highest median family income in Langston with $57,500 per family, while 2-person families (60 | 78.9%) have the highest median income of $28,750 per family member.
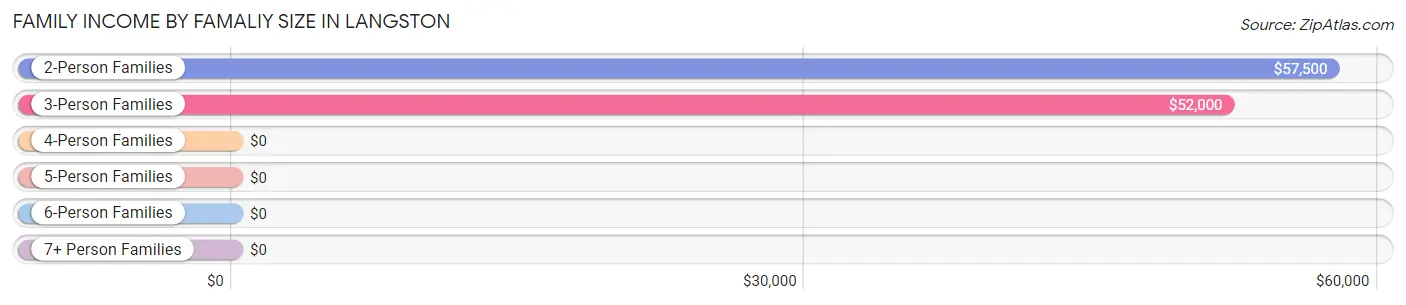
| Income Bracket | # Families | Median Income |
| 2-Person Families | 60 (78.9%) | $57,500 |
| 3-Person Families | 10 (13.2%) | $52,000 |
| 4-Person Families | 6 (7.9%) | $0 |
| 5-Person Families | 0 (0.0%) | $0 |
| 6-Person Families | 0 (0.0%) | $0 |
| 7+ Person Families | 0 (0.0%) | $0 |
| Total | 76 (100.0%) | $56,071 |
Family Income by Number of Earners in Langston
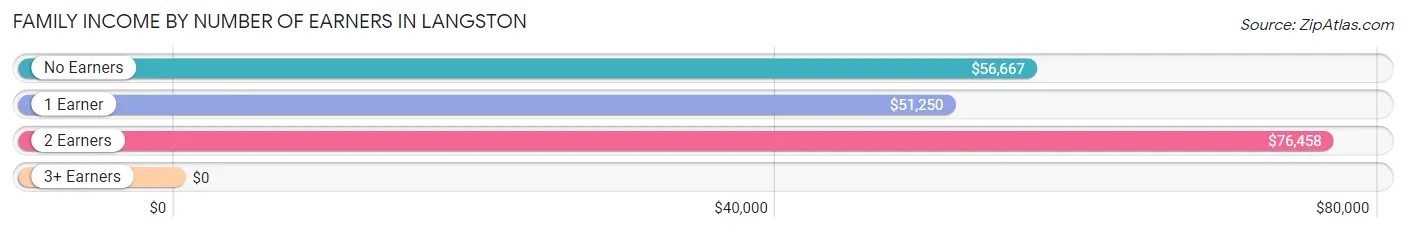
| Number of Earners | # Families | Median Income |
| No Earners | 28 (36.8%) | $56,667 |
| 1 Earner | 23 (30.3%) | $51,250 |
| 2 Earners | 25 (32.9%) | $76,458 |
| 3+ Earners | 0 (0.0%) | $0 |
| Total | 76 (100.0%) | $56,071 |
Household Income in Langston
Household Income Brackets in Langston
With 27 households falling in the category, the $50,000 to $74,999 income range is the most frequent in Langston, accounting for 23.3% of all households.
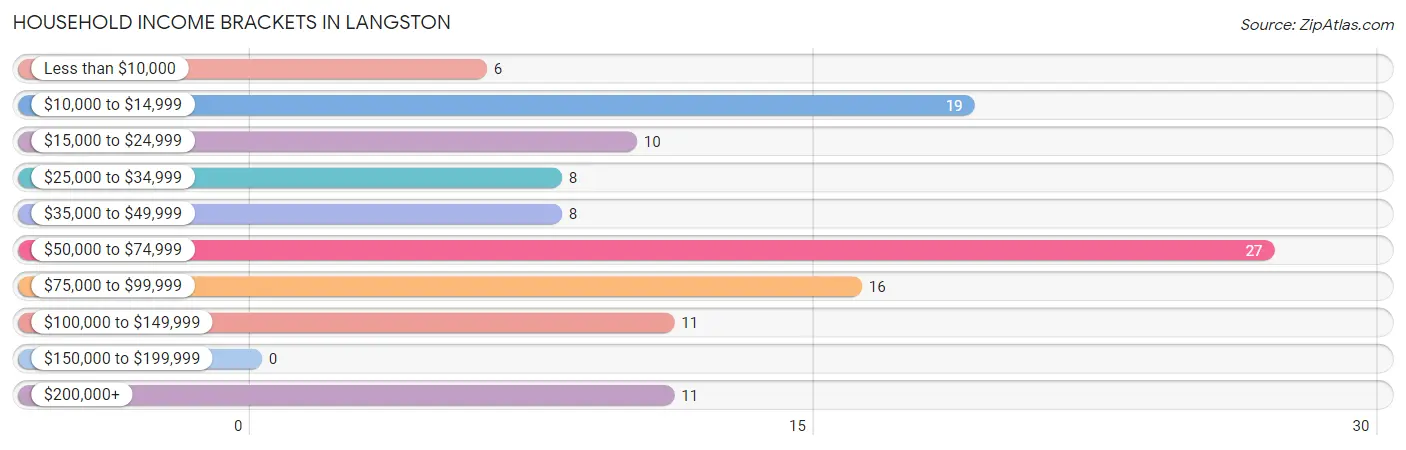
| Income Bracket | # Households | % Households |
| Less than $10,000 | 6 | 5.2% |
| $10,000 to $14,999 | 19 | 16.4% |
| $15,000 to $24,999 | 10 | 8.6% |
| $25,000 to $34,999 | 8 | 6.9% |
| $35,000 to $49,999 | 8 | 6.9% |
| $50,000 to $74,999 | 27 | 23.3% |
| $75,000 to $99,999 | 16 | 13.8% |
| $100,000 to $149,999 | 11 | 9.5% |
| $150,000 to $199,999 | 0 | 0.0% |
| $200,000+ | 11 | 9.5% |
Household Income by Householder Age in Langston
The median household income in Langston is $53,333, with the highest median household income of $55,000 found in the 65+ years age bracket for the primary householder. A total of 46 households (39.7%) fall into this category. Meanwhile, the 15 to 24 years age bracket for the primary householder has the lowest median household income of $0, with 1 households (0.9%) in this group.
| Income Bracket | # Households | Median Income |
| 15 to 24 Years | 1 (0.9%) | $0 |
| 25 to 44 Years | 13 (11.2%) | $0 |
| 45 to 64 Years | 56 (48.3%) | $47,500 |
| 65+ Years | 46 (39.7%) | $55,000 |
| Total | 116 (100.0%) | $53,333 |
Poverty in Langston
Income Below Poverty by Sex and Age in Langston
With 27.0% poverty level for males and 28.1% for females among the residents of Langston, 12 to 14 year old males and 25 to 34 year old females are the most vulnerable to poverty, with 7 males (100.0%) and 9 females (81.8%) in their respective age groups living below the poverty level.
| Age Bracket | Male | Female |
| Under 5 Years | 0 (0.0%) | 0 (0.0%) |
| 5 Years | 0 (0.0%) | 0 (0.0%) |
| 6 to 11 Years | 0 (0.0%) | 0 (0.0%) |
| 12 to 14 Years | 7 (100.0%) | 0 (0.0%) |
| 15 Years | 0 (0.0%) | 0 (0.0%) |
| 16 and 17 Years | 0 (0.0%) | 0 (0.0%) |
| 18 to 24 Years | 0 (0.0%) | 0 (0.0%) |
| 25 to 34 Years | 9 (100.0%) | 9 (81.8%) |
| 35 to 44 Years | 0 (0.0%) | 6 (75.0%) |
| 45 to 54 Years | 0 (0.0%) | 14 (53.8%) |
| 55 to 64 Years | 18 (47.4%) | 1 (3.2%) |
| 65 to 74 Years | 0 (0.0%) | 0 (0.0%) |
| 75 Years and over | 0 (0.0%) | 2 (25.0%) |
| Total | 34 (27.0%) | 32 (28.1%) |
Income Above Poverty by Sex and Age in Langston
According to the poverty statistics in Langston, males aged under 5 years and females aged 18 to 24 years are the age groups that are most secure financially, with 100.0% of males and 100.0% of females in these age groups living above the poverty line.
| Age Bracket | Male | Female |
| Under 5 Years | 2 (100.0%) | 0 (0.0%) |
| 5 Years | 0 (0.0%) | 0 (0.0%) |
| 6 to 11 Years | 0 (0.0%) | 0 (0.0%) |
| 12 to 14 Years | 0 (0.0%) | 0 (0.0%) |
| 15 Years | 0 (0.0%) | 0 (0.0%) |
| 16 and 17 Years | 5 (100.0%) | 0 (0.0%) |
| 18 to 24 Years | 1 (100.0%) | 1 (100.0%) |
| 25 to 34 Years | 0 (0.0%) | 2 (18.2%) |
| 35 to 44 Years | 10 (100.0%) | 2 (25.0%) |
| 45 to 54 Years | 12 (100.0%) | 12 (46.2%) |
| 55 to 64 Years | 20 (52.6%) | 30 (96.8%) |
| 65 to 74 Years | 32 (100.0%) | 29 (100.0%) |
| 75 Years and over | 10 (100.0%) | 6 (75.0%) |
| Total | 92 (73.0%) | 82 (71.9%) |
Income Below Poverty Among Married-Couple Families in Langston
The poverty statistics for married-couple families in Langston show that 6.1% or 4 of the total 66 families live below the poverty line. Families with no children have the highest poverty rate of 6.9%, comprising of 4 families. On the other hand, families with 1 or 2 children have the lowest poverty rate of 0.0%, which includes 0 families.
| Children | Above Poverty | Below Poverty |
| No Children | 54 (93.1%) | 4 (6.9%) |
| 1 or 2 Children | 8 (100.0%) | 0 (0.0%) |
| 3 or 4 Children | 0 (0.0%) | 0 (0.0%) |
| 5 or more Children | 0 (0.0%) | 0 (0.0%) |
| Total | 62 (93.9%) | 4 (6.1%) |
Income Below Poverty Among Single-Parent Households in Langston
| Children | Single Father | Single Mother |
| No Children | 0 (0.0%) | 0 (0.0%) |
| 1 or 2 Children | 8 (100.0%) | 0 (0.0%) |
| 3 or 4 Children | 0 (0.0%) | 0 (0.0%) |
| 5 or more Children | 0 (0.0%) | 0 (0.0%) |
| Total | 8 (80.0%) | 0 (0.0%) |
Income Below Poverty Among Married-Couple vs Single-Parent Households in Langston
The poverty data for Langston shows that 4 of the married-couple family households (6.1%) and 8 of the single-parent households (80.0%) are living below the poverty level. Within the married-couple family households, those with no children have the highest poverty rate, with 4 households (6.9%) falling below the poverty line. Among the single-parent households, those with 1 or 2 children have the highest poverty rate, with 8 household (100.0%) living below poverty.
| Children | Married-Couple Families | Single-Parent Households |
| No Children | 4 (6.9%) | 0 (0.0%) |
| 1 or 2 Children | 0 (0.0%) | 8 (100.0%) |
| 3 or 4 Children | 0 (0.0%) | 0 (0.0%) |
| 5 or more Children | 0 (0.0%) | 0 (0.0%) |
| Total | 4 (6.1%) | 8 (80.0%) |
Race in Langston
The most populous races in Langston are White / Caucasian (233 | 97.1%), Hispanic or Latino (7 | 2.9%), and Black / African American (4 | 1.7%).
| Race | # Population | % Population |
| Asian | 0 | 0.0% |
| Black / African American | 4 | 1.7% |
| Hawaiian / Pacific | 0 | 0.0% |
| Hispanic or Latino | 7 | 2.9% |
| Native / Alaskan | 0 | 0.0% |
| White / Caucasian | 233 | 97.1% |
| Two or more Races | 0 | 0.0% |
| Some other Race | 3 | 1.3% |
| Total | 240 | 100.0% |
Ancestry in Langston
The most populous ancestries reported in Langston are American (24 | 10.0%), English (23 | 9.6%), German (22 | 9.2%), Scottish (20 | 8.3%), and Scotch-Irish (13 | 5.4%), together accounting for 42.5% of all Langston residents.
| Ancestry | # Population | % Population |
| American | 24 | 10.0% |
| British | 5 | 2.1% |
| English | 23 | 9.6% |
| European | 2 | 0.8% |
| French | 3 | 1.3% |
| French Canadian | 2 | 0.8% |
| German | 22 | 9.2% |
| Hungarian | 11 | 4.6% |
| Irish | 10 | 4.2% |
| Italian | 5 | 2.1% |
| Polish | 2 | 0.8% |
| Scotch-Irish | 13 | 5.4% |
| Scottish | 20 | 8.3% |
| Spaniard | 7 | 2.9% |
| Swedish | 2 | 0.8% |
| Welsh | 3 | 1.3% | View All 16 Rows |
Immigrants in Langston

| Immigration Origin | # Population | % Population | View All 0 Rows |
Sex and Age in Langston
Sex and Age in Langston
The most populous age groups in Langston are 55 to 59 Years (26 | 20.6%) for men and 55 to 59 Years (21 | 18.4%) for women.
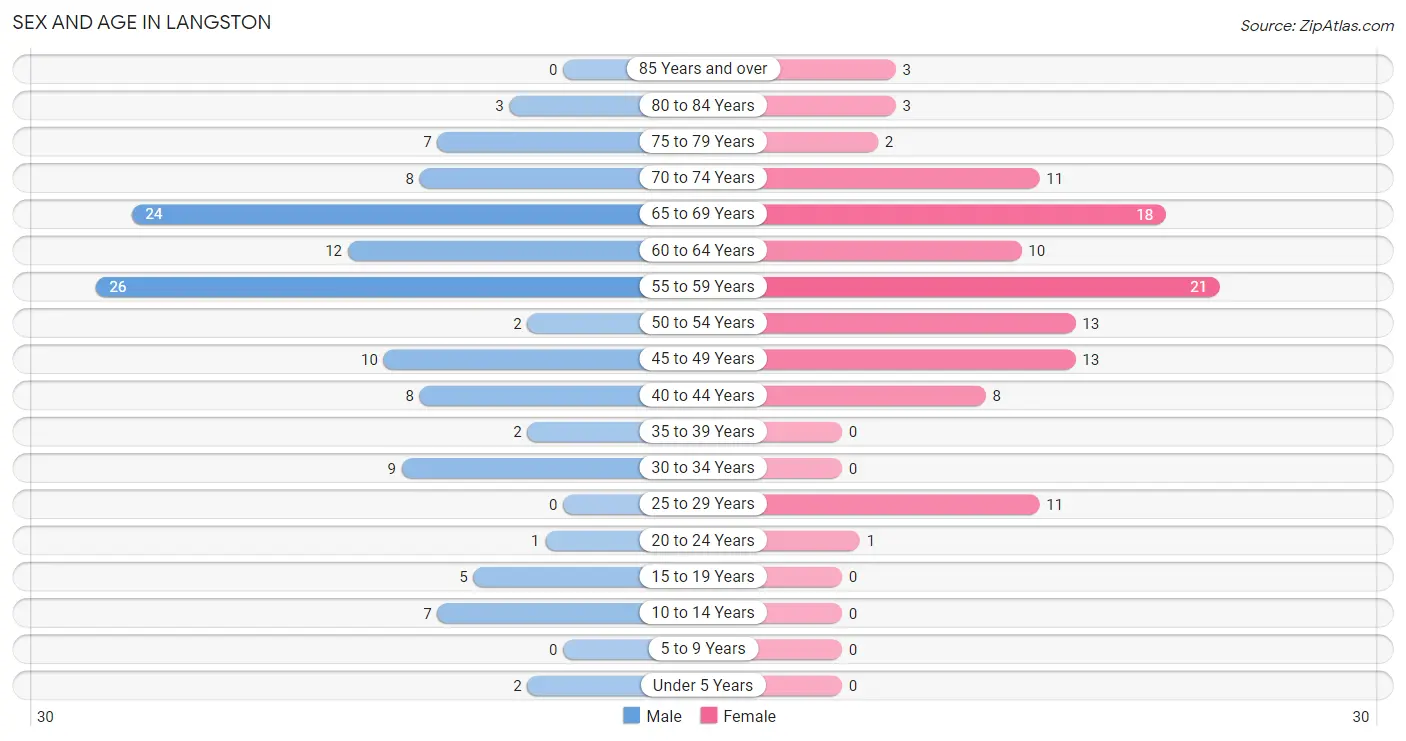
| Age Bracket | Male | Female |
| Under 5 Years | 2 (1.6%) | 0 (0.0%) |
| 5 to 9 Years | 0 (0.0%) | 0 (0.0%) |
| 10 to 14 Years | 7 (5.6%) | 0 (0.0%) |
| 15 to 19 Years | 5 (4.0%) | 0 (0.0%) |
| 20 to 24 Years | 1 (0.8%) | 1 (0.9%) |
| 25 to 29 Years | 0 (0.0%) | 11 (9.7%) |
| 30 to 34 Years | 9 (7.1%) | 0 (0.0%) |
| 35 to 39 Years | 2 (1.6%) | 0 (0.0%) |
| 40 to 44 Years | 8 (6.4%) | 8 (7.0%) |
| 45 to 49 Years | 10 (7.9%) | 13 (11.4%) |
| 50 to 54 Years | 2 (1.6%) | 13 (11.4%) |
| 55 to 59 Years | 26 (20.6%) | 21 (18.4%) |
| 60 to 64 Years | 12 (9.5%) | 10 (8.8%) |
| 65 to 69 Years | 24 (19.1%) | 18 (15.8%) |
| 70 to 74 Years | 8 (6.4%) | 11 (9.7%) |
| 75 to 79 Years | 7 (5.6%) | 2 (1.8%) |
| 80 to 84 Years | 3 (2.4%) | 3 (2.6%) |
| 85 Years and over | 0 (0.0%) | 3 (2.6%) |
| Total | 126 (100.0%) | 114 (100.0%) |
Families and Households in Langston
Median Family Size in Langston
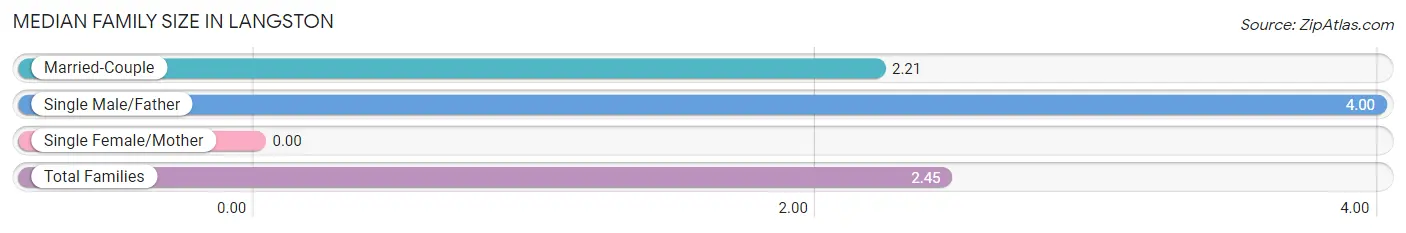
| Family Type | # Families | Family Size |
| Married-Couple | 66 (86.8%) | 2.21 |
| Single Male/Father | 10 (13.2%) | 4.00 |
| Single Female/Mother | 0 (0.0%) | - |
| Total Families | 76 (100.0%) | 2.45 |
Median Household Size in Langston
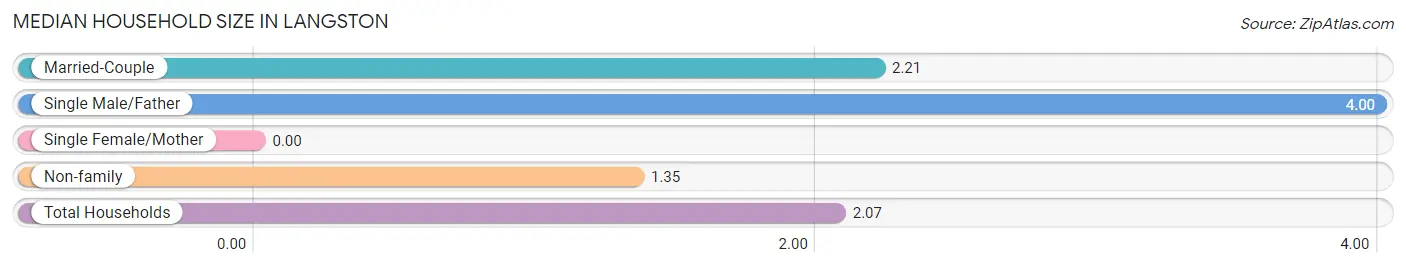
| Household Type | # Households | Household Size |
| Married-Couple | 66 (56.9%) | 2.21 |
| Single Male/Father | 10 (8.6%) | 4.00 |
| Single Female/Mother | 0 (0.0%) | - |
| Non-family | 40 (34.5%) | 1.35 |
| Total Households | 116 (100.0%) | 2.07 |
Household Size by Marriage Status in Langston
Out of a total of 116 households in Langston, 76 (65.5%) are family households, while 40 (34.5%) are nonfamily households. The most numerous type of family households are 2-person households, comprising 60, and the most common type of nonfamily households are 1-person households, comprising 28.
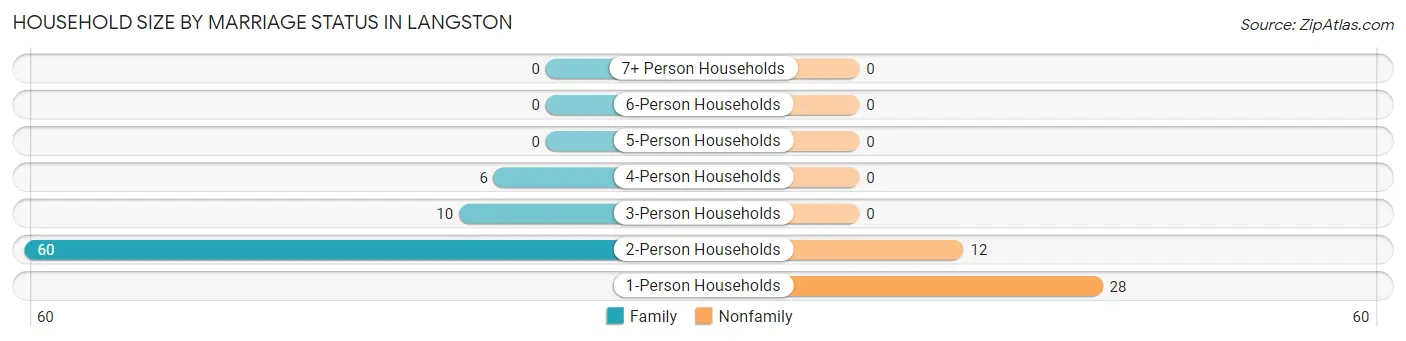
| Household Size | Family Households | Nonfamily Households |
| 1-Person Households | - | 28 (24.1%) |
| 2-Person Households | 60 (51.7%) | 12 (10.3%) |
| 3-Person Households | 10 (8.6%) | 0 (0.0%) |
| 4-Person Households | 6 (5.2%) | 0 (0.0%) |
| 5-Person Households | 0 (0.0%) | 0 (0.0%) |
| 6-Person Households | 0 (0.0%) | 0 (0.0%) |
| 7+ Person Households | 0 (0.0%) | 0 (0.0%) |
| Total | 76 (65.5%) | 40 (34.5%) |
Female Fertility in Langston
Fertility by Age in Langston
Average fertility rate in Langston is 86.0 births per 1,000 women. Women in the age bracket of 20 to 34 years have the highest fertility rate with 250.0 births per 1,000 women. Women in the age bracket of 20 to 34 years acount for 100.0% of all women with births.
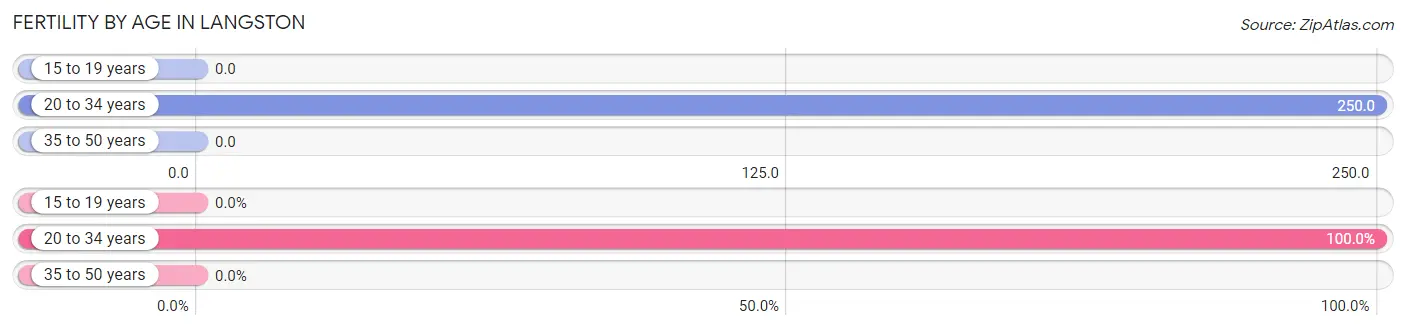
| Age Bracket | Women with Births | Births / 1,000 Women |
| 15 to 19 years | 0 (0.0%) | 0.0 |
| 20 to 34 years | 3 (100.0%) | 250.0 |
| 35 to 50 years | 0 (0.0%) | 0.0 |
| Total | 3 (100.0%) | 86.0 |
Fertility by Age by Marriage Status in Langston
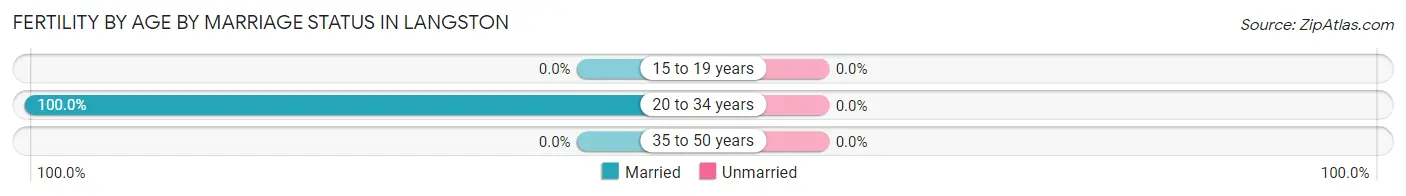
| Age Bracket | Married | Unmarried |
| 15 to 19 years | 0 (0.0%) | 0 (0.0%) |
| 20 to 34 years | 3 (100.0%) | 0 (0.0%) |
| 35 to 50 years | 0 (0.0%) | 0 (0.0%) |
| Total | 3 (100.0%) | 0 (0.0%) |
Fertility by Education in Langston
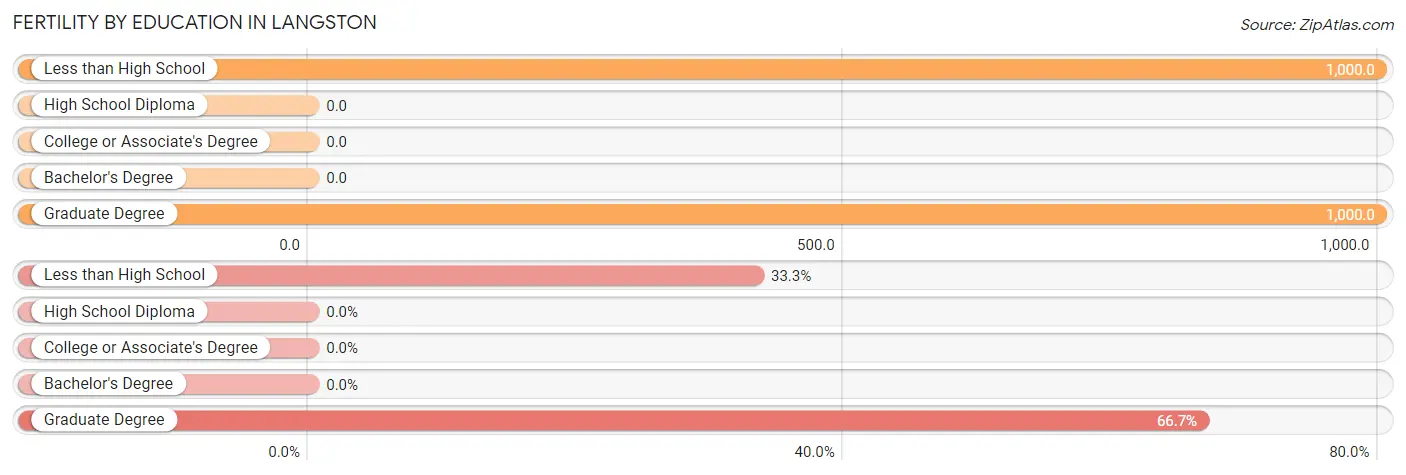
| Educational Attainment | Women with Births | Births / 1,000 Women |
| Less than High School | 1 (33.3%) | 1,000.0 |
| High School Diploma | 0 (0.0%) | 0.0 |
| College or Associate's Degree | 0 (0.0%) | 0.0 |
| Bachelor's Degree | 0 (0.0%) | 0.0 |
| Graduate Degree | 2 (66.7%) | 1,000.0 |
| Total | 3 (100.0%) | 86.0 |
Fertility by Education by Marriage Status in Langston
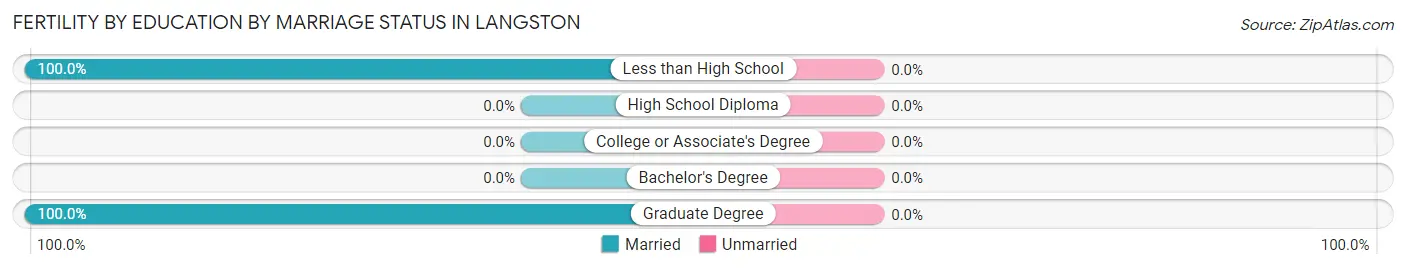
| Educational Attainment | Married | Unmarried |
| Less than High School | 1 (100.0%) | 0 (0.0%) |
| High School Diploma | 0 (0.0%) | 0 (0.0%) |
| College or Associate's Degree | 0 (0.0%) | 0 (0.0%) |
| Bachelor's Degree | 0 (0.0%) | 0 (0.0%) |
| Graduate Degree | 2 (100.0%) | 0 (0.0%) |
| Total | 3 (100.0%) | 0 (0.0%) |
Employment Characteristics in Langston
Employment by Class of Employer in Langston
Among the 93 employed individuals in Langston, private company employees (54 | 58.1%), self-employed (not incorporated) (9 | 9.7%), and not-for-profit organizations (9 | 9.7%) make up the most common classes of employment.
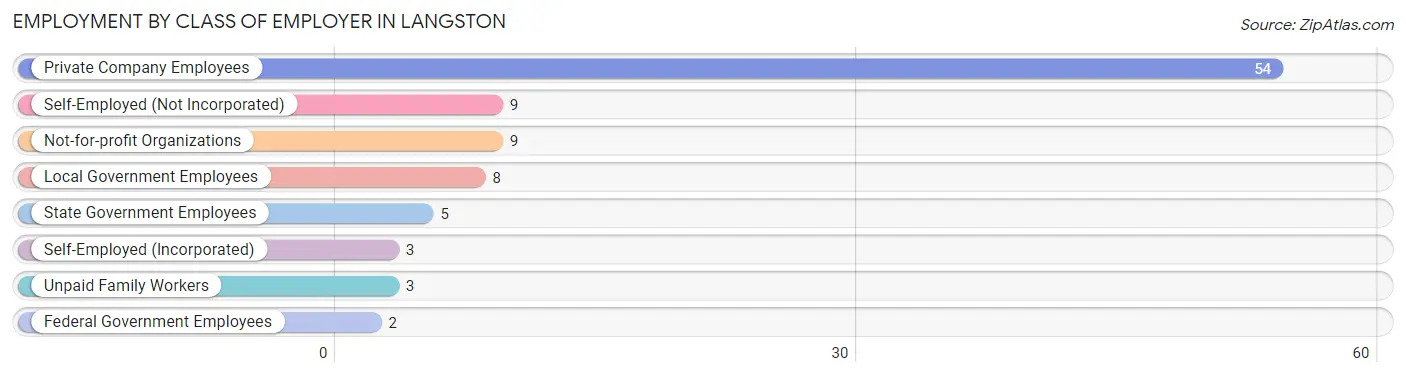
| Employer Class | # Employees | % Employees |
| Private Company Employees | 54 | 58.1% |
| Self-Employed (Incorporated) | 3 | 3.2% |
| Self-Employed (Not Incorporated) | 9 | 9.7% |
| Not-for-profit Organizations | 9 | 9.7% |
| Local Government Employees | 8 | 8.6% |
| State Government Employees | 5 | 5.4% |
| Federal Government Employees | 2 | 2.1% |
| Unpaid Family Workers | 3 | 3.2% |
| Total | 93 | 100.0% |
Employment Status by Age in Langston
According to the labor force statistics for Langston, out of the total population over 16 years of age (231), 46.8% or 108 individuals are in the labor force, with 13.9% or 15 of them unemployed. The age group with the highest labor force participation rate is 16 to 19 years, with 100.0% or 5 individuals in the labor force. Within the labor force, the 25 to 29 years age range has the highest percentage of unemployed individuals, with 81.8% or 9 of them being unemployed.
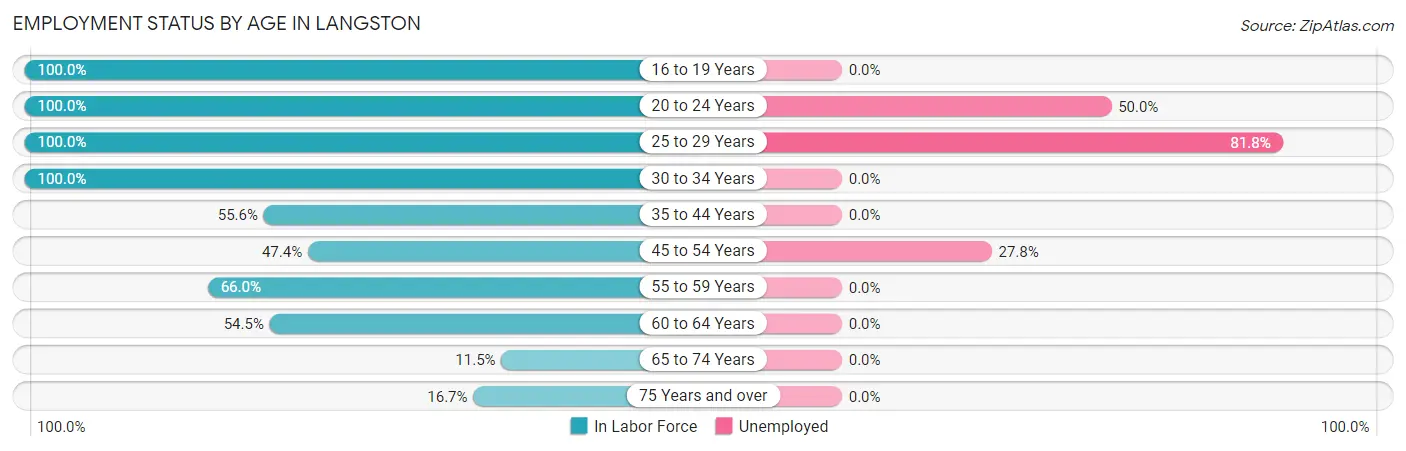
| Age Bracket | In Labor Force | Unemployed |
| 16 to 19 Years | 5 (100.0%) | 0 (0.0%) |
| 20 to 24 Years | 2 (100.0%) | 1 (50.0%) |
| 25 to 29 Years | 11 (100.0%) | 9 (81.8%) |
| 30 to 34 Years | 9 (100.0%) | 0 (0.0%) |
| 35 to 44 Years | 10 (55.6%) | 0 (0.0%) |
| 45 to 54 Years | 18 (47.4%) | 5 (27.8%) |
| 55 to 59 Years | 31 (66.0%) | 0 (0.0%) |
| 60 to 64 Years | 12 (54.5%) | 0 (0.0%) |
| 65 to 74 Years | 7 (11.5%) | 0 (0.0%) |
| 75 Years and over | 3 (16.7%) | 0 (0.0%) |
| Total | 108 (46.8%) | 15 (13.9%) |
Employment Status by Educational Attainment in Langston
According to labor force statistics for Langston, 62.8% of individuals (91) out of the total population between 25 and 64 years of age (145) are in the labor force, with 15.4% or 14 of them being unemployed. The group with the highest labor force participation rate are those with the educational attainment of high school diploma, with 69.6% or 39 individuals in the labor force. Within the labor force, individuals with high school diploma education have the highest percentage of unemployment, with 23.1% or 9 of them being unemployed.
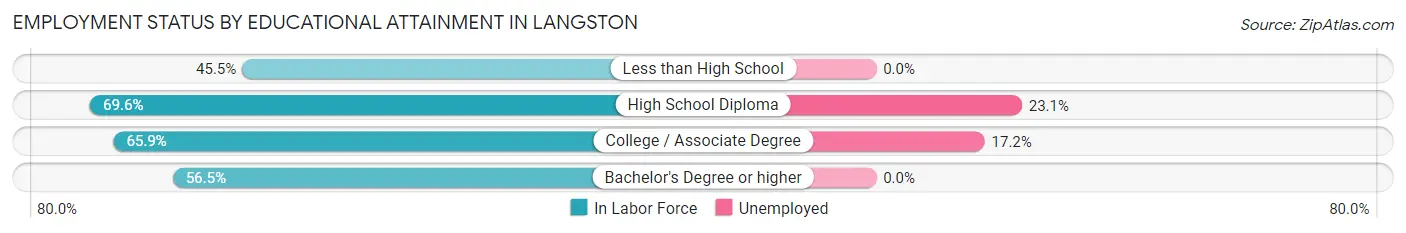
| Educational Attainment | In Labor Force | Unemployed |
| Less than High School | 10 (45.5%) | 0 (0.0%) |
| High School Diploma | 39 (69.6%) | 13 (23.1%) |
| College / Associate Degree | 29 (65.9%) | 8 (17.2%) |
| Bachelor's Degree or higher | 13 (56.5%) | 0 (0.0%) |
| Total | 91 (62.8%) | 22 (15.4%) |
Employment Occupations by Sex in Langston
Management, Business, Science and Arts Occupations
The most common Management, Business, Science and Arts occupations in Langston are Management (7 | 7.5%), Health Diagnosing & Treating (7 | 7.5%), Health Technologists (7 | 7.5%), Community & Social Service (6 | 6.5%), and Computers, Engineering & Science (4 | 4.3%).
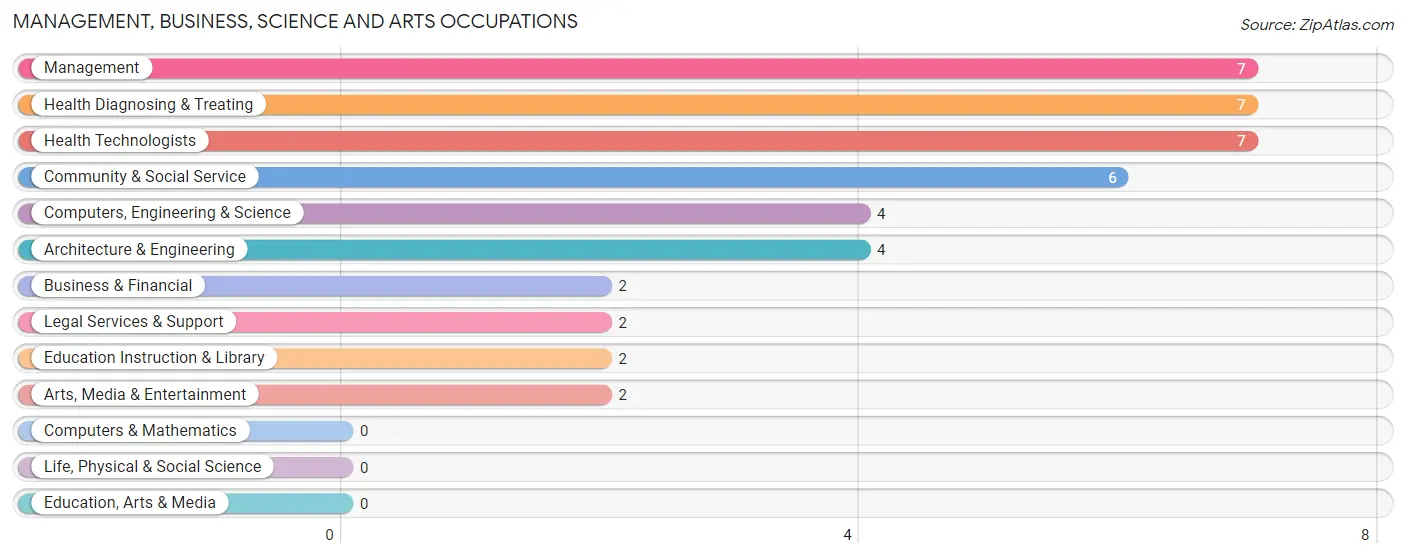
Management, Business, Science and Arts Occupations by Sex
Within the Management, Business, Science and Arts occupations in Langston, the most male-oriented occupations are Business & Financial (100.0%), Management (85.7%), and Health Diagnosing & Treating (71.4%), while the most female-oriented occupations are Community & Social Service (100.0%), Legal Services & Support (100.0%), and Education Instruction & Library (100.0%).
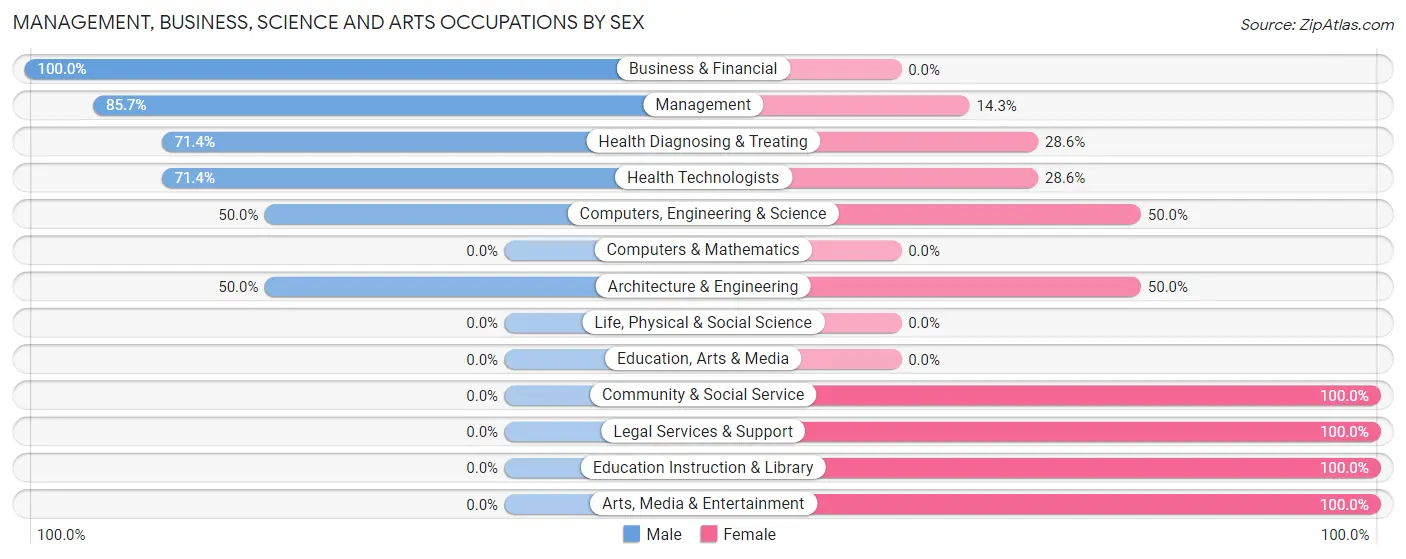
| Occupation | Male | Female |
| Management | 6 (85.7%) | 1 (14.3%) |
| Business & Financial | 2 (100.0%) | 0 (0.0%) |
| Computers, Engineering & Science | 2 (50.0%) | 2 (50.0%) |
| Computers & Mathematics | 0 (0.0%) | 0 (0.0%) |
| Architecture & Engineering | 2 (50.0%) | 2 (50.0%) |
| Life, Physical & Social Science | 0 (0.0%) | 0 (0.0%) |
| Community & Social Service | 0 (0.0%) | 6 (100.0%) |
| Education, Arts & Media | 0 (0.0%) | 0 (0.0%) |
| Legal Services & Support | 0 (0.0%) | 2 (100.0%) |
| Education Instruction & Library | 0 (0.0%) | 2 (100.0%) |
| Arts, Media & Entertainment | 0 (0.0%) | 2 (100.0%) |
| Health Diagnosing & Treating | 5 (71.4%) | 2 (28.6%) |
| Health Technologists | 5 (71.4%) | 2 (28.6%) |
| Total (Category) | 15 (57.7%) | 11 (42.3%) |
| Total (Overall) | 58 (62.4%) | 35 (37.6%) |
Services Occupations
The most common Services occupations in Langston are Cleaning & Maintenance (4 | 4.3%), Security & Protection (2 | 2.1%), and Firefighting & Prevention (2 | 2.1%).
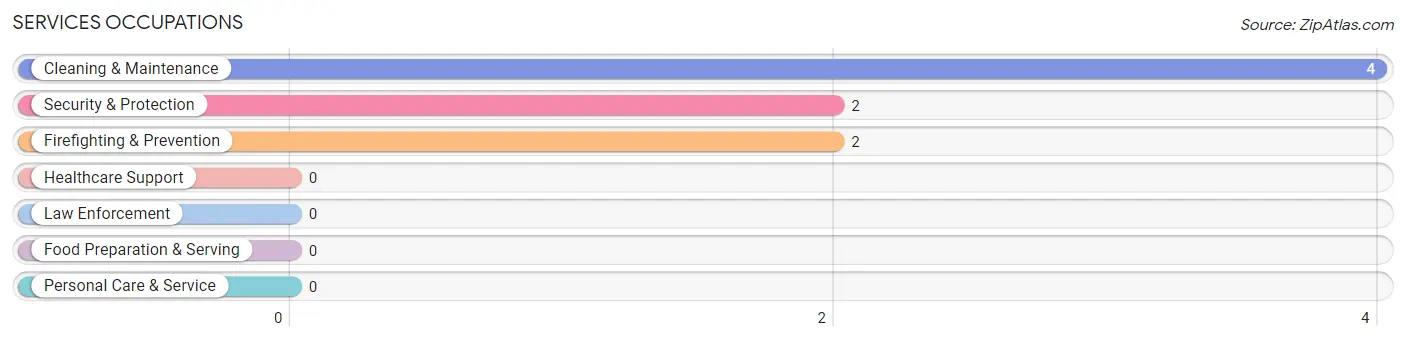
Services Occupations by Sex
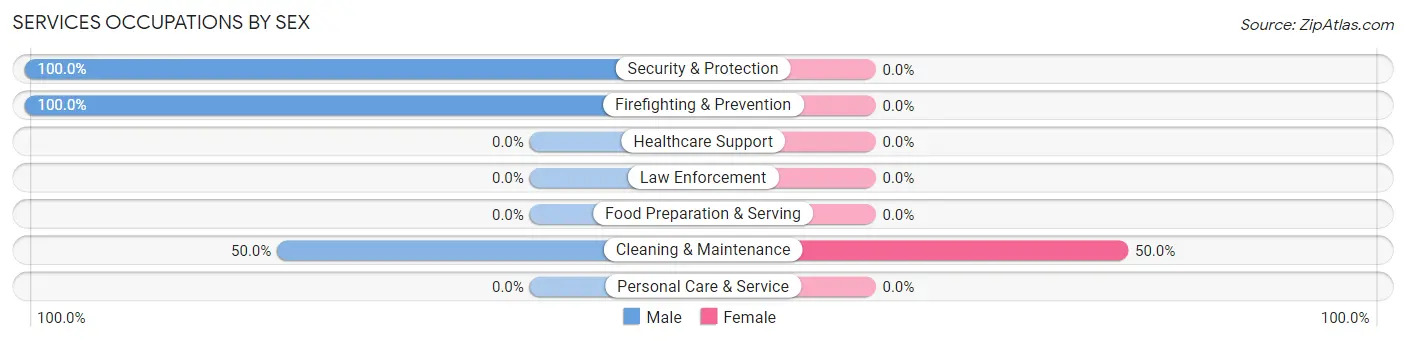
| Occupation | Male | Female |
| Healthcare Support | 0 (0.0%) | 0 (0.0%) |
| Security & Protection | 2 (100.0%) | 0 (0.0%) |
| Firefighting & Prevention | 2 (100.0%) | 0 (0.0%) |
| Law Enforcement | 0 (0.0%) | 0 (0.0%) |
| Food Preparation & Serving | 0 (0.0%) | 0 (0.0%) |
| Cleaning & Maintenance | 2 (50.0%) | 2 (50.0%) |
| Personal Care & Service | 0 (0.0%) | 0 (0.0%) |
| Total (Category) | 4 (66.7%) | 2 (33.3%) |
| Total (Overall) | 58 (62.4%) | 35 (37.6%) |
Sales and Office Occupations
The most common Sales and Office occupations in Langston are Office & Administration (15 | 16.1%), and Sales & Related (12 | 12.9%).
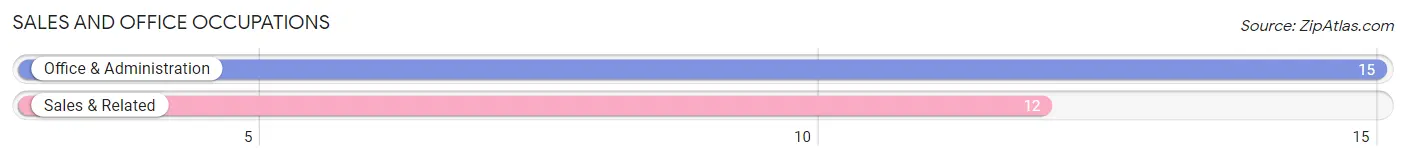
Sales and Office Occupations by Sex
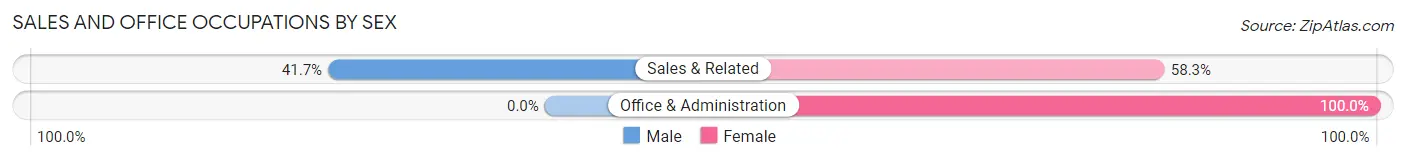
| Occupation | Male | Female |
| Sales & Related | 5 (41.7%) | 7 (58.3%) |
| Office & Administration | 0 (0.0%) | 15 (100.0%) |
| Total (Category) | 5 (18.5%) | 22 (81.5%) |
| Total (Overall) | 58 (62.4%) | 35 (37.6%) |
Natural Resources, Construction and Maintenance Occupations
The most common Natural Resources, Construction and Maintenance occupations in Langston are , and Construction & Extraction (9 | 9.7%).
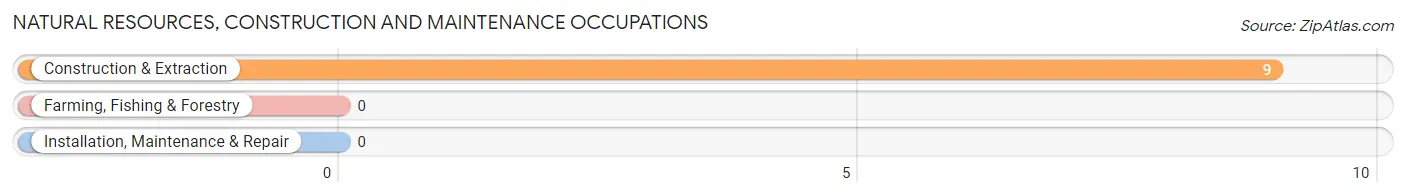
Natural Resources, Construction and Maintenance Occupations by Sex
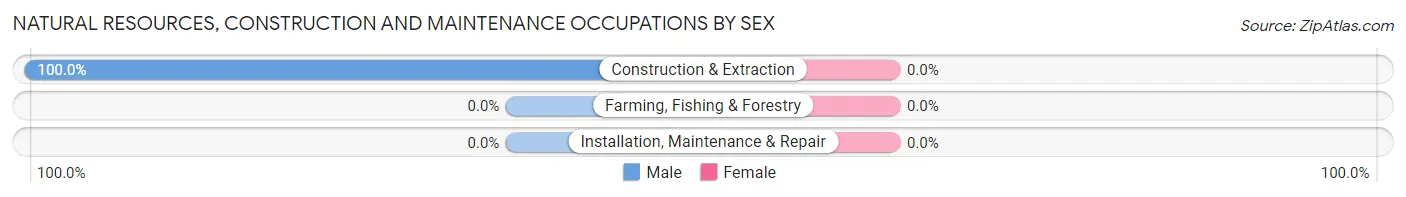
| Occupation | Male | Female |
| Farming, Fishing & Forestry | 0 (0.0%) | 0 (0.0%) |
| Construction & Extraction | 9 (100.0%) | 0 (0.0%) |
| Installation, Maintenance & Repair | 0 (0.0%) | 0 (0.0%) |
| Total (Category) | 9 (100.0%) | 0 (0.0%) |
| Total (Overall) | 58 (62.4%) | 35 (37.6%) |
Production, Transportation and Moving Occupations
The most common Production, Transportation and Moving occupations in Langston are Material Moving (14 | 15.0%), Transportation (6 | 6.5%), and Production (5 | 5.4%).
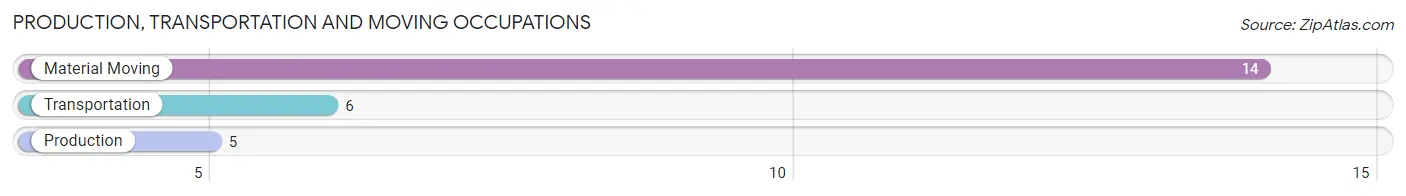
Production, Transportation and Moving Occupations by Sex
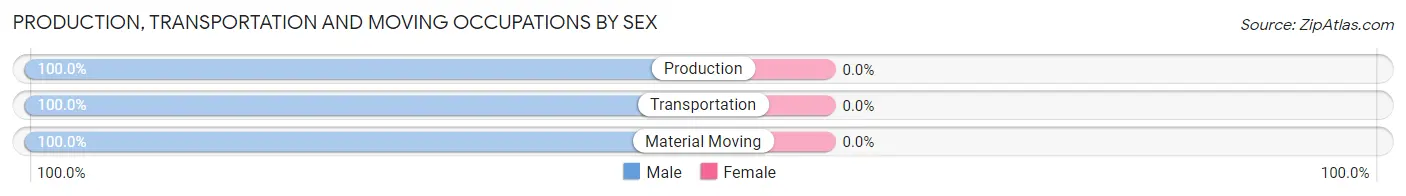
| Occupation | Male | Female |
| Production | 5 (100.0%) | 0 (0.0%) |
| Transportation | 6 (100.0%) | 0 (0.0%) |
| Material Moving | 14 (100.0%) | 0 (0.0%) |
| Total (Category) | 25 (100.0%) | 0 (0.0%) |
| Total (Overall) | 58 (62.4%) | 35 (37.6%) |
Employment Industries by Sex in Langston
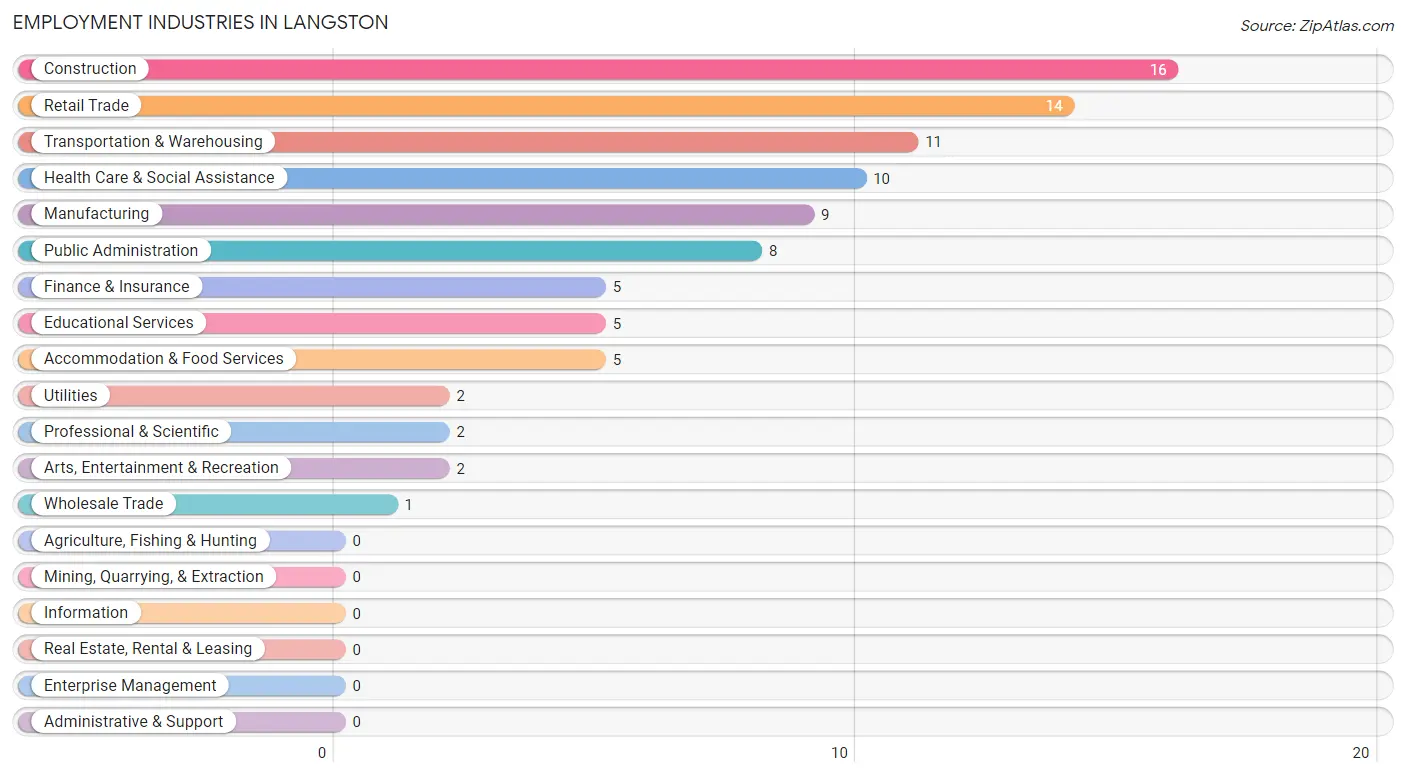
Employment Industries in Langston
The major employment industries in Langston include Construction (16 | 17.2%), Retail Trade (14 | 15.0%), Transportation & Warehousing (11 | 11.8%), Health Care & Social Assistance (10 | 10.7%), and Manufacturing (9 | 9.7%).
Employment Industries by Sex in Langston
The Langston industries that see more men than women are Wholesale Trade (100.0%), Transportation & Warehousing (100.0%), and Utilities (100.0%), whereas the industries that tend to have a higher number of women are Professional & Scientific (100.0%), Arts, Entertainment & Recreation (100.0%), and Accommodation & Food Services (100.0%).
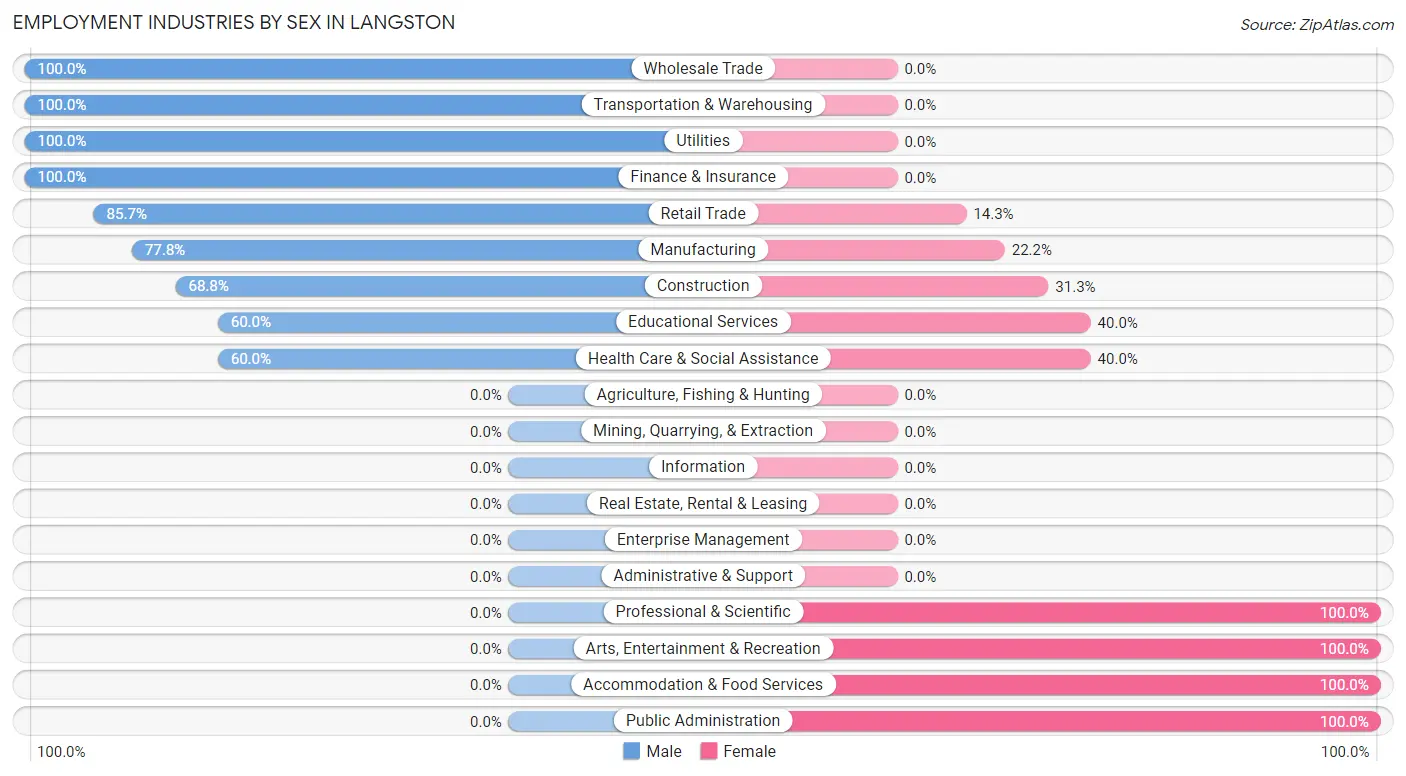
| Industry | Male | Female |
| Agriculture, Fishing & Hunting | 0 (0.0%) | 0 (0.0%) |
| Mining, Quarrying, & Extraction | 0 (0.0%) | 0 (0.0%) |
| Construction | 11 (68.8%) | 5 (31.2%) |
| Manufacturing | 7 (77.8%) | 2 (22.2%) |
| Wholesale Trade | 1 (100.0%) | 0 (0.0%) |
| Retail Trade | 12 (85.7%) | 2 (14.3%) |
| Transportation & Warehousing | 11 (100.0%) | 0 (0.0%) |
| Utilities | 2 (100.0%) | 0 (0.0%) |
| Information | 0 (0.0%) | 0 (0.0%) |
| Finance & Insurance | 5 (100.0%) | 0 (0.0%) |
| Real Estate, Rental & Leasing | 0 (0.0%) | 0 (0.0%) |
| Professional & Scientific | 0 (0.0%) | 2 (100.0%) |
| Enterprise Management | 0 (0.0%) | 0 (0.0%) |
| Administrative & Support | 0 (0.0%) | 0 (0.0%) |
| Educational Services | 3 (60.0%) | 2 (40.0%) |
| Health Care & Social Assistance | 6 (60.0%) | 4 (40.0%) |
| Arts, Entertainment & Recreation | 0 (0.0%) | 2 (100.0%) |
| Accommodation & Food Services | 0 (0.0%) | 5 (100.0%) |
| Public Administration | 0 (0.0%) | 8 (100.0%) |
| Total | 58 (62.4%) | 35 (37.6%) |
Education in Langston
School Enrollment in Langston
The most common levels of schooling among the 12 students in Langston are middle school (7 | 58.3%), and high school (5 | 41.7%).
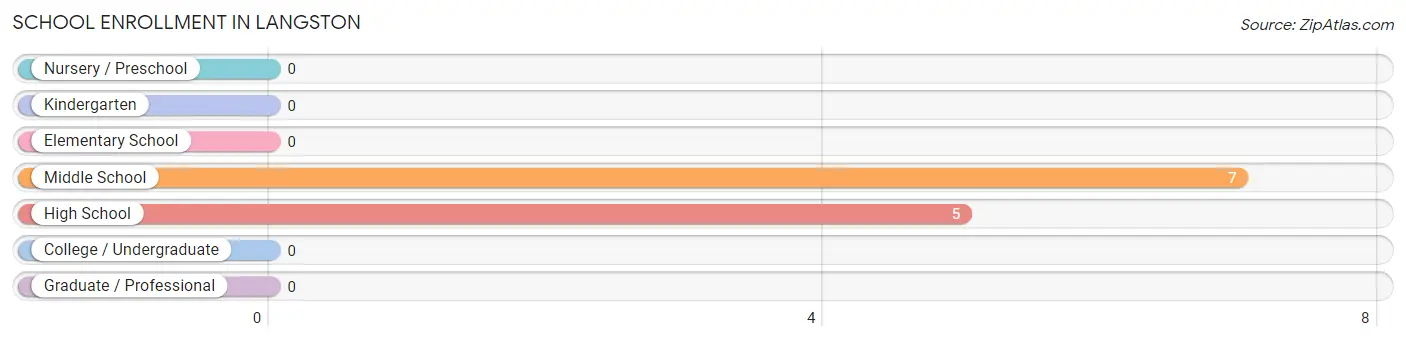
| School Level | # Students | % Students |
| Nursery / Preschool | 0 | 0.0% |
| Kindergarten | 0 | 0.0% |
| Elementary School | 0 | 0.0% |
| Middle School | 7 | 58.3% |
| High School | 5 | 41.7% |
| College / Undergraduate | 0 | 0.0% |
| Graduate / Professional | 0 | 0.0% |
| Total | 12 | 100.0% |
School Enrollment by Age by Funding Source in Langston
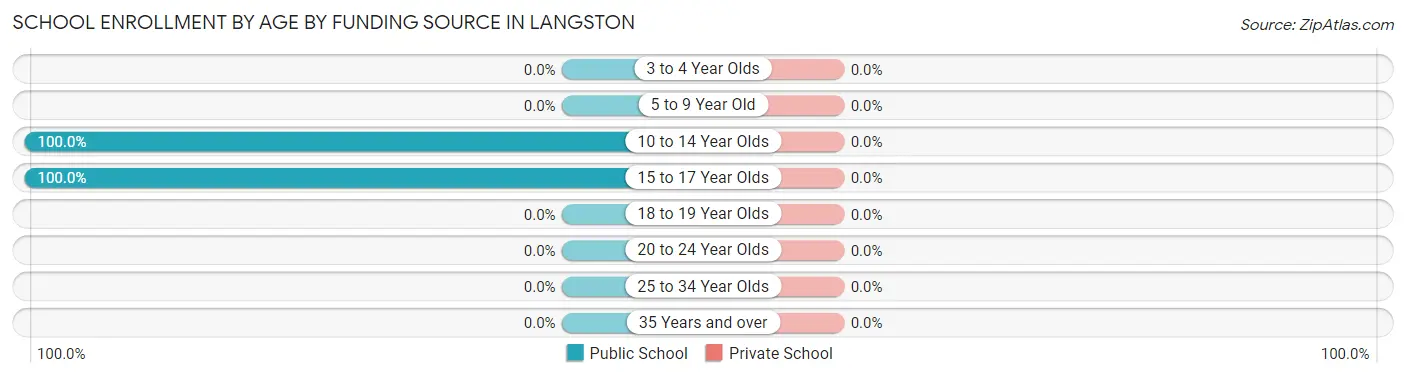
| Age Bracket | Public School | Private School |
| 3 to 4 Year Olds | 0 (0.0%) | 0 (0.0%) |
| 5 to 9 Year Old | 0 (0.0%) | 0 (0.0%) |
| 10 to 14 Year Olds | 7 (100.0%) | 0 (0.0%) |
| 15 to 17 Year Olds | 5 (100.0%) | 0 (0.0%) |
| 18 to 19 Year Olds | 0 (0.0%) | 0 (0.0%) |
| 20 to 24 Year Olds | 0 (0.0%) | 0 (0.0%) |
| 25 to 34 Year Olds | 0 (0.0%) | 0 (0.0%) |
| 35 Years and over | 0 (0.0%) | 0 (0.0%) |
| Total | 12 (100.0%) | 0 (0.0%) |
Educational Attainment by Field of Study in Langston
Education (11 | 22.5%), bio, nature & agricultural (7 | 14.3%), engineering (6 | 12.2%), science & technology (6 | 12.2%), and business (4 | 8.2%) are the most common fields of study among 49 individuals in Langston who have obtained a bachelor's degree or higher.
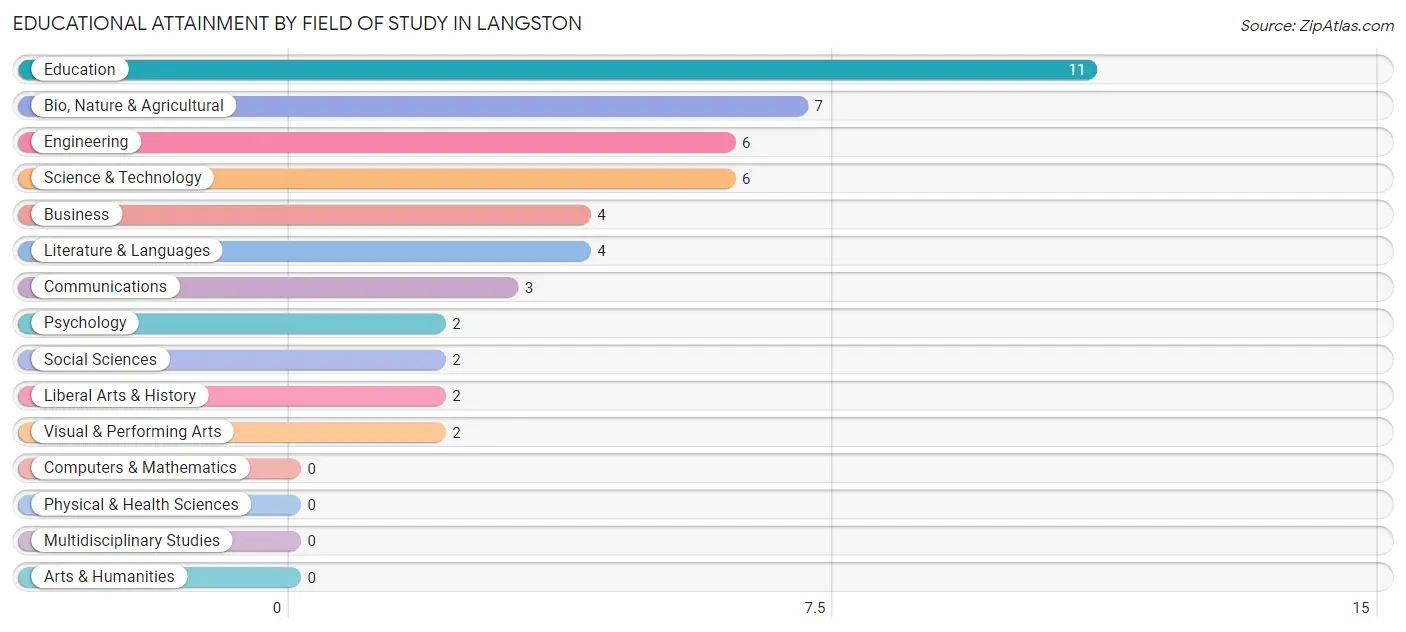
| Field of Study | # Graduates | % Graduates |
| Computers & Mathematics | 0 | 0.0% |
| Bio, Nature & Agricultural | 7 | 14.3% |
| Physical & Health Sciences | 0 | 0.0% |
| Psychology | 2 | 4.1% |
| Social Sciences | 2 | 4.1% |
| Engineering | 6 | 12.2% |
| Multidisciplinary Studies | 0 | 0.0% |
| Science & Technology | 6 | 12.2% |
| Business | 4 | 8.2% |
| Education | 11 | 22.5% |
| Literature & Languages | 4 | 8.2% |
| Liberal Arts & History | 2 | 4.1% |
| Visual & Performing Arts | 2 | 4.1% |
| Communications | 3 | 6.1% |
| Arts & Humanities | 0 | 0.0% |
| Total | 49 | 100.0% |
Transportation & Commute in Langston
Vehicle Availability by Sex in Langston
The most prevalent vehicle ownership categories in Langston are males with 3 vehicles (22, accounting for 37.9%) and females with 3 vehicles (13, making up 62.9%).
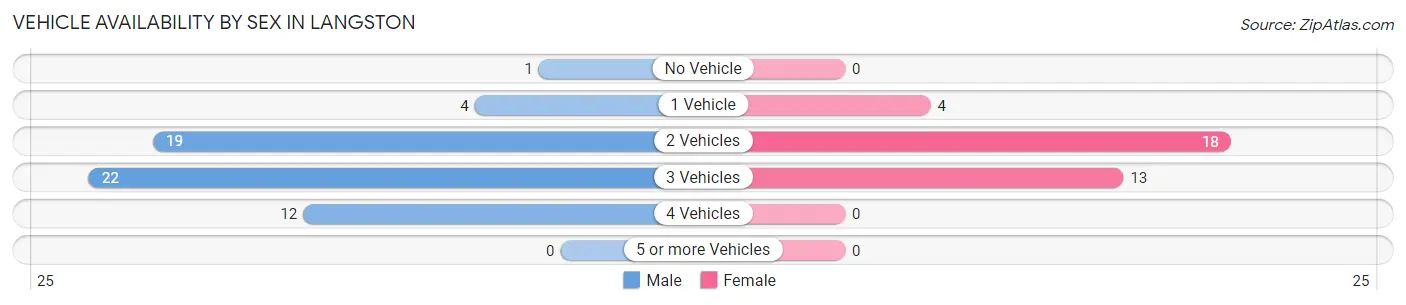
| Vehicles Available | Male | Female |
| No Vehicle | 1 (1.7%) | 0 (0.0%) |
| 1 Vehicle | 4 (6.9%) | 4 (11.4%) |
| 2 Vehicles | 19 (32.8%) | 18 (51.4%) |
| 3 Vehicles | 22 (37.9%) | 13 (37.1%) |
| 4 Vehicles | 12 (20.7%) | 0 (0.0%) |
| 5 or more Vehicles | 0 (0.0%) | 0 (0.0%) |
| Total | 58 (100.0%) | 35 (100.0%) |
Commute Time in Langston
The most frequently occuring commute durations in Langston are 25 to 29 minutes (21 commuters, 23.3%), 20 to 24 minutes (19 commuters, 21.1%), and 30 to 34 minutes (14 commuters, 15.6%).
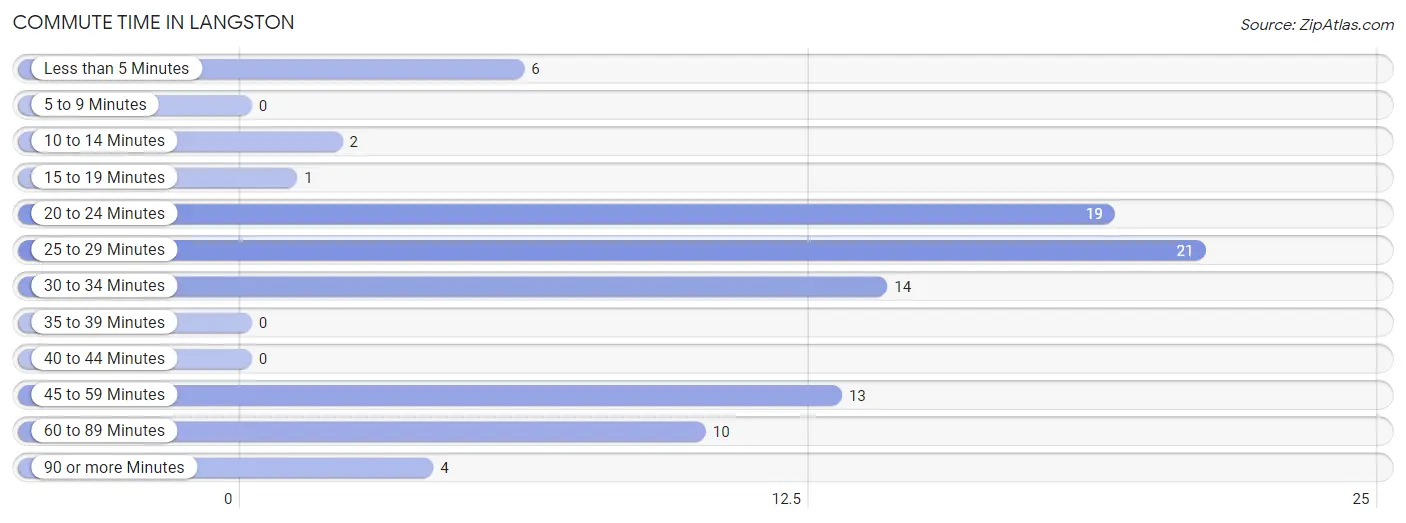
| Commute Time | # Commuters | % Commuters |
| Less than 5 Minutes | 6 | 6.7% |
| 5 to 9 Minutes | 0 | 0.0% |
| 10 to 14 Minutes | 2 | 2.2% |
| 15 to 19 Minutes | 1 | 1.1% |
| 20 to 24 Minutes | 19 | 21.1% |
| 25 to 29 Minutes | 21 | 23.3% |
| 30 to 34 Minutes | 14 | 15.6% |
| 35 to 39 Minutes | 0 | 0.0% |
| 40 to 44 Minutes | 0 | 0.0% |
| 45 to 59 Minutes | 13 | 14.4% |
| 60 to 89 Minutes | 10 | 11.1% |
| 90 or more Minutes | 4 | 4.4% |
Commute Time by Sex in Langston
The most common commute times in Langston are 25 to 29 minutes (19 commuters, 34.5%) for males and 30 to 34 minutes (10 commuters, 28.6%) for females.
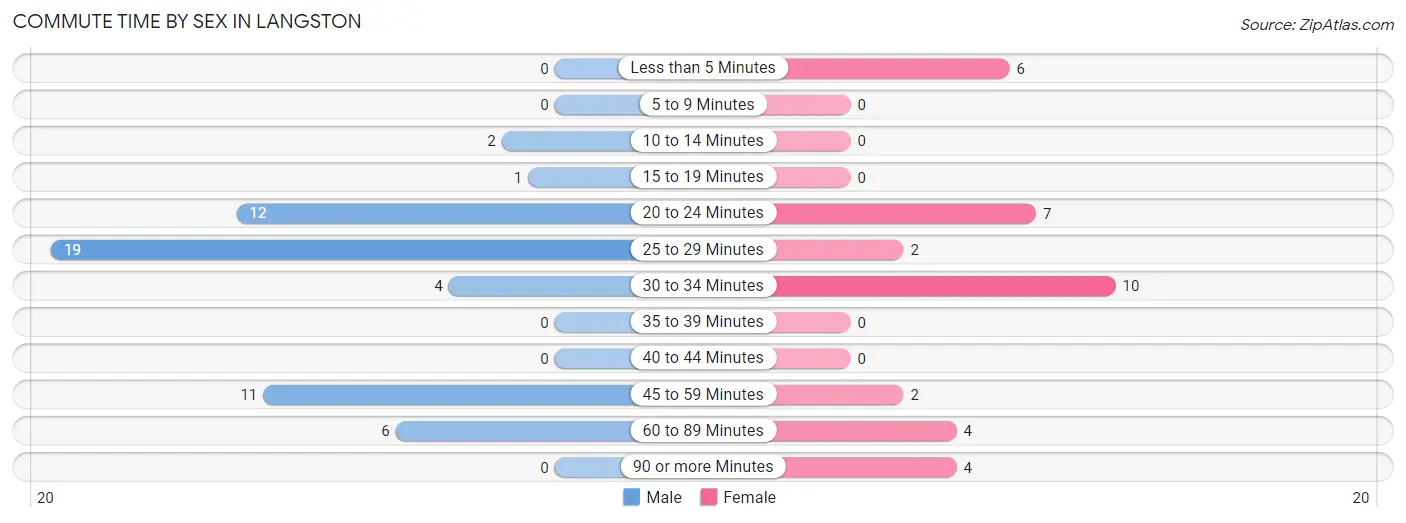
| Commute Time | Male | Female |
| Less than 5 Minutes | 0 (0.0%) | 6 (17.1%) |
| 5 to 9 Minutes | 0 (0.0%) | 0 (0.0%) |
| 10 to 14 Minutes | 2 (3.6%) | 0 (0.0%) |
| 15 to 19 Minutes | 1 (1.8%) | 0 (0.0%) |
| 20 to 24 Minutes | 12 (21.8%) | 7 (20.0%) |
| 25 to 29 Minutes | 19 (34.5%) | 2 (5.7%) |
| 30 to 34 Minutes | 4 (7.3%) | 10 (28.6%) |
| 35 to 39 Minutes | 0 (0.0%) | 0 (0.0%) |
| 40 to 44 Minutes | 0 (0.0%) | 0 (0.0%) |
| 45 to 59 Minutes | 11 (20.0%) | 2 (5.7%) |
| 60 to 89 Minutes | 6 (10.9%) | 4 (11.4%) |
| 90 or more Minutes | 0 (0.0%) | 4 (11.4%) |
Time of Departure to Work by Sex in Langston
The most frequent times of departure to work in Langston are 4:00 PM to 11:59 PM (13, 23.6%) for males and 8:00 AM to 8:29 AM (10, 28.6%) for females.
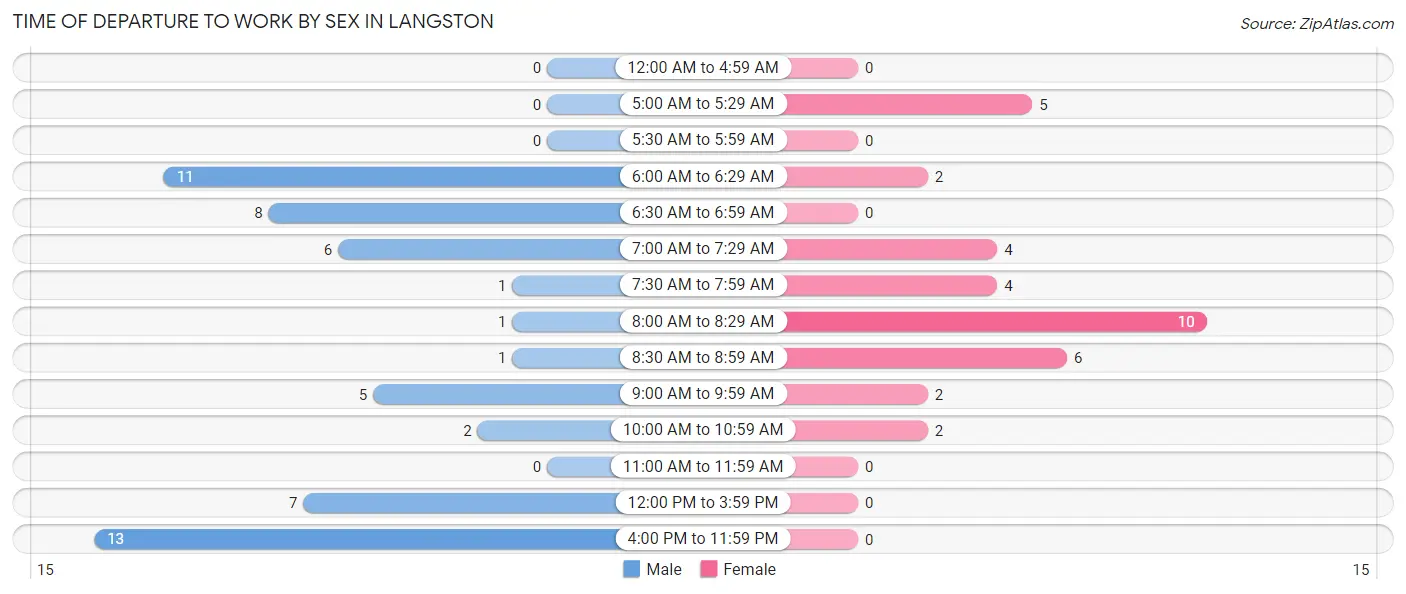
| Time of Departure | Male | Female |
| 12:00 AM to 4:59 AM | 0 (0.0%) | 0 (0.0%) |
| 5:00 AM to 5:29 AM | 0 (0.0%) | 5 (14.3%) |
| 5:30 AM to 5:59 AM | 0 (0.0%) | 0 (0.0%) |
| 6:00 AM to 6:29 AM | 11 (20.0%) | 2 (5.7%) |
| 6:30 AM to 6:59 AM | 8 (14.5%) | 0 (0.0%) |
| 7:00 AM to 7:29 AM | 6 (10.9%) | 4 (11.4%) |
| 7:30 AM to 7:59 AM | 1 (1.8%) | 4 (11.4%) |
| 8:00 AM to 8:29 AM | 1 (1.8%) | 10 (28.6%) |
| 8:30 AM to 8:59 AM | 1 (1.8%) | 6 (17.1%) |
| 9:00 AM to 9:59 AM | 5 (9.1%) | 2 (5.7%) |
| 10:00 AM to 10:59 AM | 2 (3.6%) | 2 (5.7%) |
| 11:00 AM to 11:59 AM | 0 (0.0%) | 0 (0.0%) |
| 12:00 PM to 3:59 PM | 7 (12.7%) | 0 (0.0%) |
| 4:00 PM to 11:59 PM | 13 (23.6%) | 0 (0.0%) |
| Total | 55 (100.0%) | 35 (100.0%) |
Housing Occupancy in Langston
Occupancy by Ownership in Langston
Of the total 116 dwellings in Langston, owner-occupied units account for 86 (74.1%), while renter-occupied units make up 30 (25.9%).
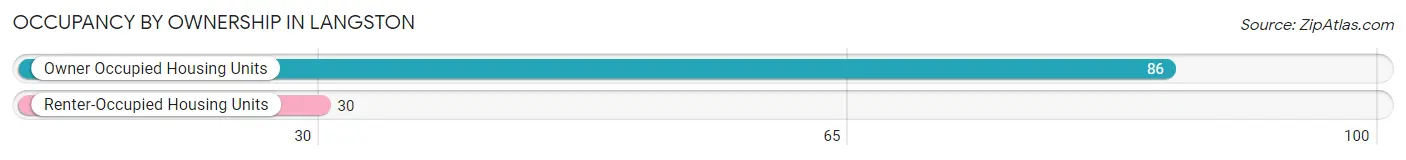
| Occupancy | # Housing Units | % Housing Units |
| Owner Occupied Housing Units | 86 | 74.1% |
| Renter-Occupied Housing Units | 30 | 25.9% |
| Total Occupied Housing Units | 116 | 100.0% |
Occupancy by Household Size in Langston
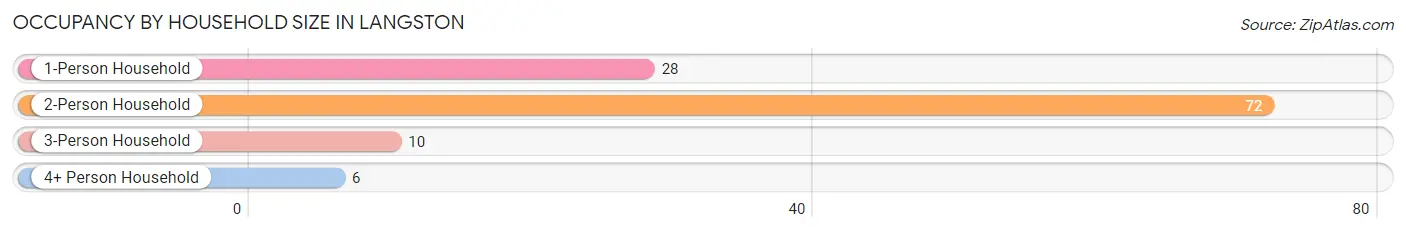
| Household Size | # Housing Units | % Housing Units |
| 1-Person Household | 28 | 24.1% |
| 2-Person Household | 72 | 62.1% |
| 3-Person Household | 10 | 8.6% |
| 4+ Person Household | 6 | 5.2% |
| Total Housing Units | 116 | 100.0% |
Occupancy by Ownership by Household Size in Langston
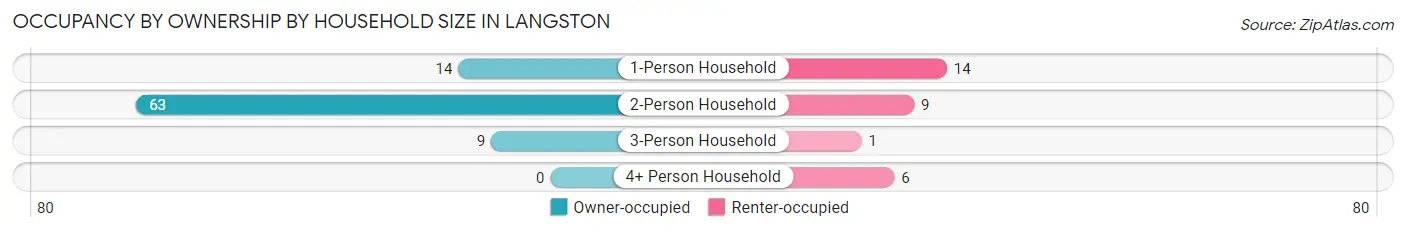
| Household Size | Owner-occupied | Renter-occupied |
| 1-Person Household | 14 (50.0%) | 14 (50.0%) |
| 2-Person Household | 63 (87.5%) | 9 (12.5%) |
| 3-Person Household | 9 (90.0%) | 1 (10.0%) |
| 4+ Person Household | 0 (0.0%) | 6 (100.0%) |
| Total Housing Units | 86 (74.1%) | 30 (25.9%) |
Occupancy by Educational Attainment in Langston
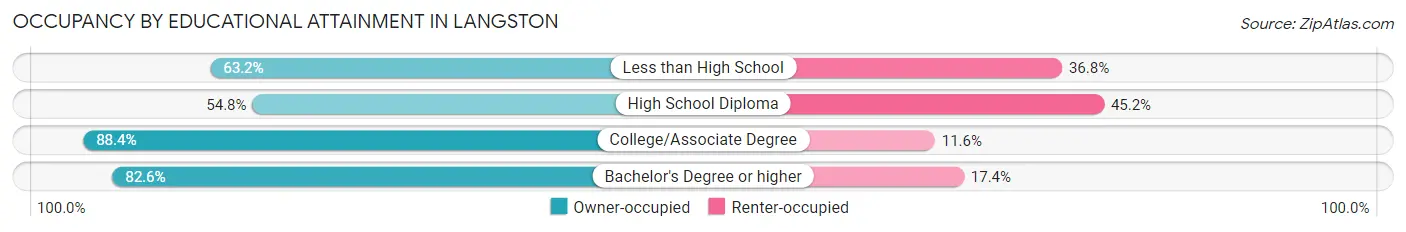
| Household Size | Owner-occupied | Renter-occupied |
| Less than High School | 12 (63.2%) | 7 (36.8%) |
| High School Diploma | 17 (54.8%) | 14 (45.2%) |
| College/Associate Degree | 38 (88.4%) | 5 (11.6%) |
| Bachelor's Degree or higher | 19 (82.6%) | 4 (17.4%) |
Occupancy by Age of Householder in Langston
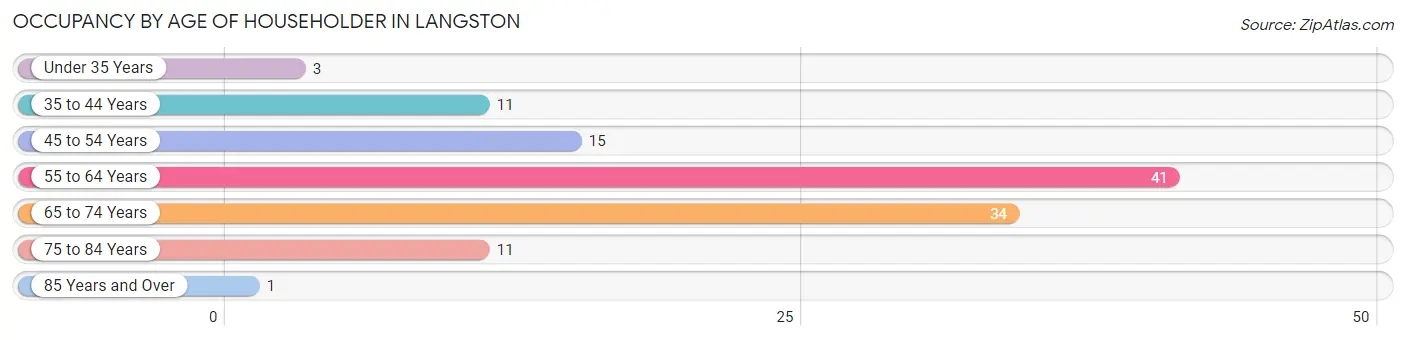
| Age Bracket | # Households | % Households |
| Under 35 Years | 3 | 2.6% |
| 35 to 44 Years | 11 | 9.5% |
| 45 to 54 Years | 15 | 12.9% |
| 55 to 64 Years | 41 | 35.3% |
| 65 to 74 Years | 34 | 29.3% |
| 75 to 84 Years | 11 | 9.5% |
| 85 Years and Over | 1 | 0.9% |
| Total | 116 | 100.0% |
Housing Finances in Langston
Median Income by Occupancy in Langston
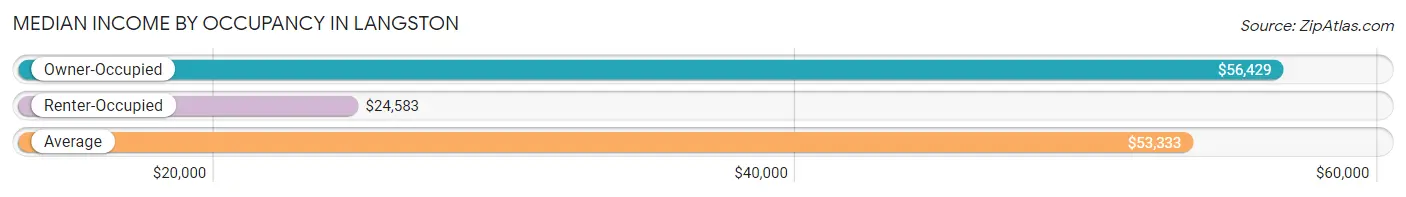
| Occupancy Type | # Households | Median Income |
| Owner-Occupied | 86 (74.1%) | $56,429 |
| Renter-Occupied | 30 (25.9%) | $24,583 |
| Average | 116 (100.0%) | $53,333 |
Occupancy by Householder Income Bracket in Langston
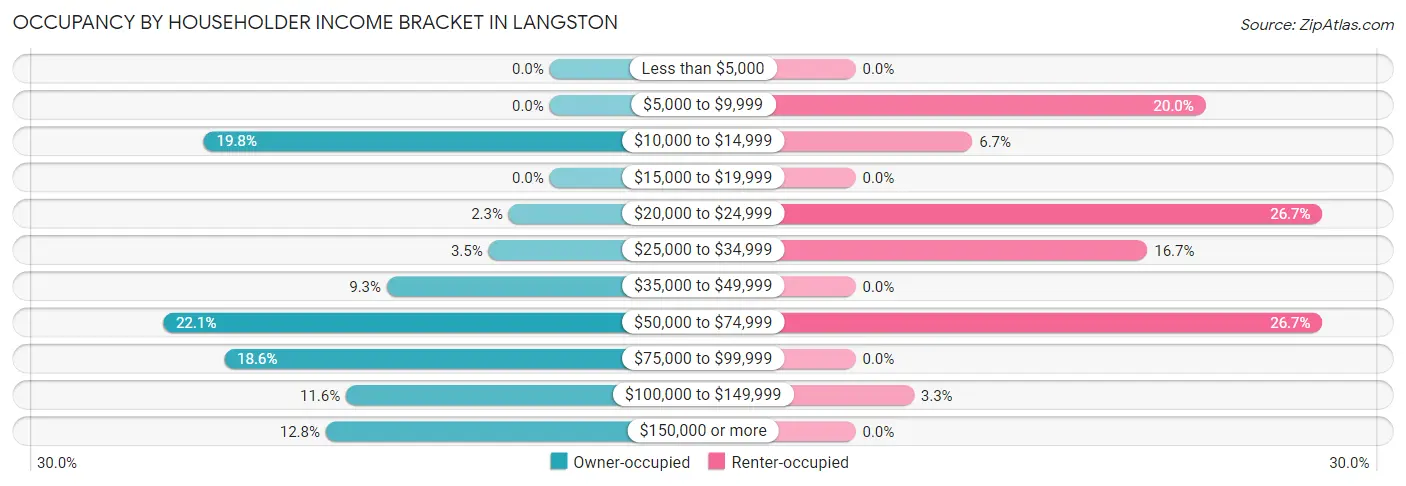
| Income Bracket | Owner-occupied | Renter-occupied |
| Less than $5,000 | 0 (0.0%) | 0 (0.0%) |
| $5,000 to $9,999 | 0 (0.0%) | 6 (20.0%) |
| $10,000 to $14,999 | 17 (19.8%) | 2 (6.7%) |
| $15,000 to $19,999 | 0 (0.0%) | 0 (0.0%) |
| $20,000 to $24,999 | 2 (2.3%) | 8 (26.7%) |
| $25,000 to $34,999 | 3 (3.5%) | 5 (16.7%) |
| $35,000 to $49,999 | 8 (9.3%) | 0 (0.0%) |
| $50,000 to $74,999 | 19 (22.1%) | 8 (26.7%) |
| $75,000 to $99,999 | 16 (18.6%) | 0 (0.0%) |
| $100,000 to $149,999 | 10 (11.6%) | 1 (3.3%) |
| $150,000 or more | 11 (12.8%) | 0 (0.0%) |
| Total | 86 (100.0%) | 30 (100.0%) |
Monthly Housing Cost Tiers in Langston
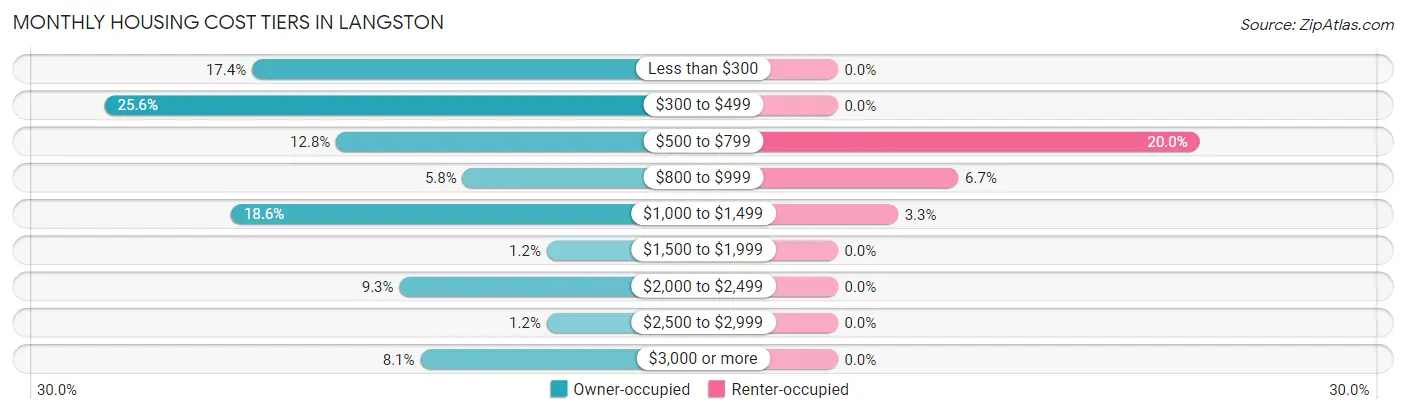
| Monthly Cost | Owner-occupied | Renter-occupied |
| Less than $300 | 15 (17.4%) | 0 (0.0%) |
| $300 to $499 | 22 (25.6%) | 0 (0.0%) |
| $500 to $799 | 11 (12.8%) | 6 (20.0%) |
| $800 to $999 | 5 (5.8%) | 2 (6.7%) |
| $1,000 to $1,499 | 16 (18.6%) | 1 (3.3%) |
| $1,500 to $1,999 | 1 (1.2%) | 0 (0.0%) |
| $2,000 to $2,499 | 8 (9.3%) | 0 (0.0%) |
| $2,500 to $2,999 | 1 (1.2%) | 0 (0.0%) |
| $3,000 or more | 7 (8.1%) | 0 (0.0%) |
| Total | 86 (100.0%) | 30 (100.0%) |
Physical Housing Characteristics in Langston
Housing Structures in Langston
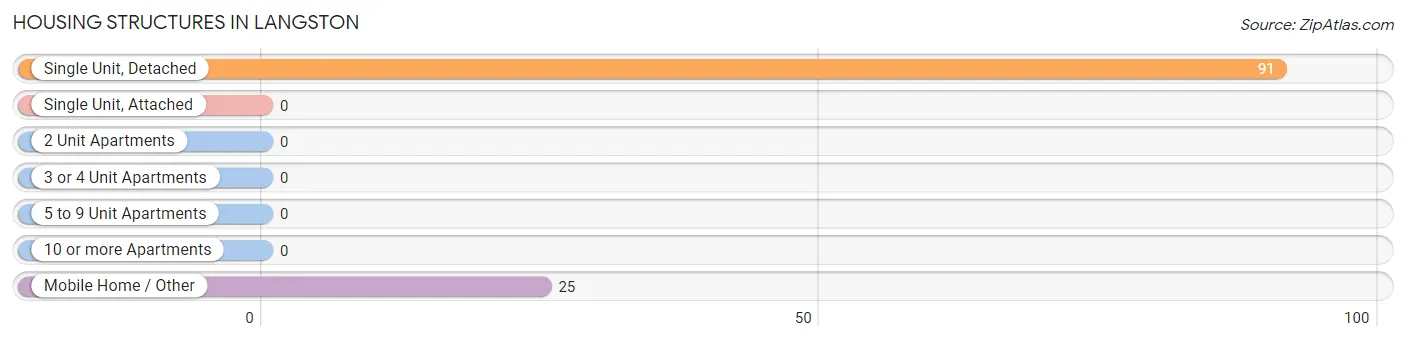
| Structure Type | # Housing Units | % Housing Units |
| Single Unit, Detached | 91 | 78.4% |
| Single Unit, Attached | 0 | 0.0% |
| 2 Unit Apartments | 0 | 0.0% |
| 3 or 4 Unit Apartments | 0 | 0.0% |
| 5 to 9 Unit Apartments | 0 | 0.0% |
| 10 or more Apartments | 0 | 0.0% |
| Mobile Home / Other | 25 | 21.5% |
| Total | 116 | 100.0% |
Housing Structures by Occupancy in Langston
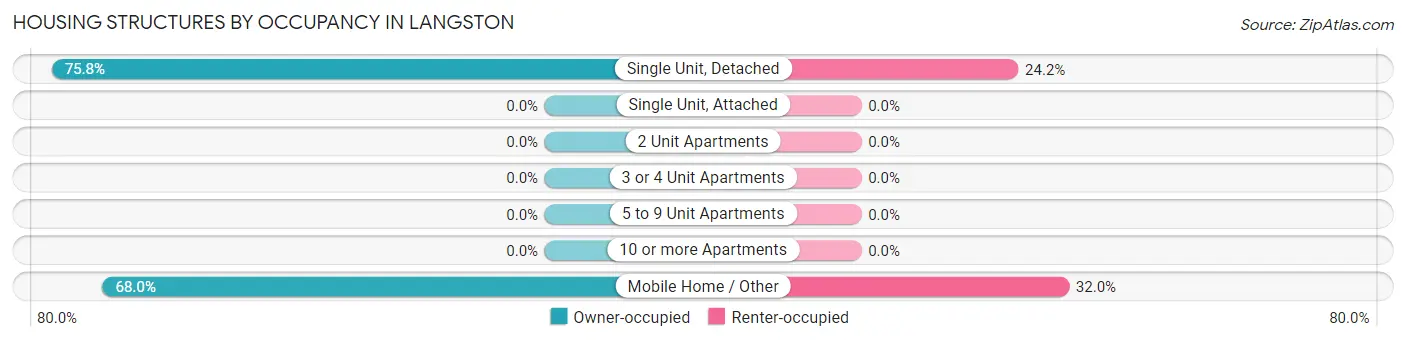
| Structure Type | Owner-occupied | Renter-occupied |
| Single Unit, Detached | 69 (75.8%) | 22 (24.2%) |
| Single Unit, Attached | 0 (0.0%) | 0 (0.0%) |
| 2 Unit Apartments | 0 (0.0%) | 0 (0.0%) |
| 3 or 4 Unit Apartments | 0 (0.0%) | 0 (0.0%) |
| 5 to 9 Unit Apartments | 0 (0.0%) | 0 (0.0%) |
| 10 or more Apartments | 0 (0.0%) | 0 (0.0%) |
| Mobile Home / Other | 17 (68.0%) | 8 (32.0%) |
| Total | 86 (74.1%) | 30 (25.9%) |
Housing Structures by Number of Rooms in Langston
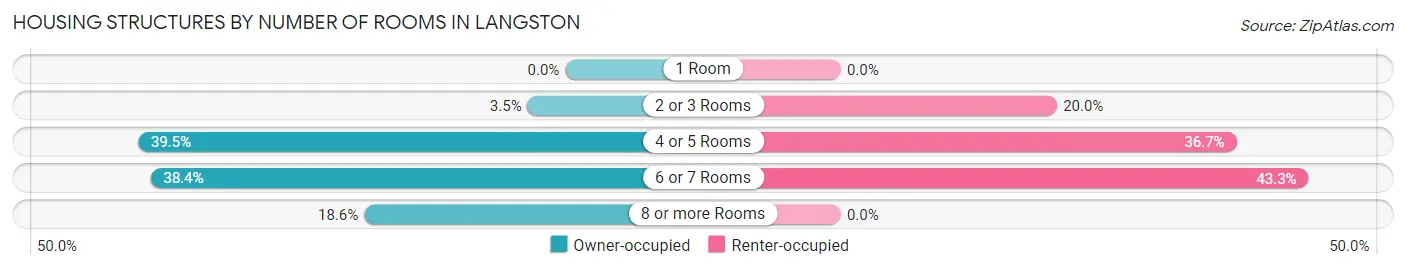
| Number of Rooms | Owner-occupied | Renter-occupied |
| 1 Room | 0 (0.0%) | 0 (0.0%) |
| 2 or 3 Rooms | 3 (3.5%) | 6 (20.0%) |
| 4 or 5 Rooms | 34 (39.5%) | 11 (36.7%) |
| 6 or 7 Rooms | 33 (38.4%) | 13 (43.3%) |
| 8 or more Rooms | 16 (18.6%) | 0 (0.0%) |
| Total | 86 (100.0%) | 30 (100.0%) |
Housing Structure by Heating Type in Langston
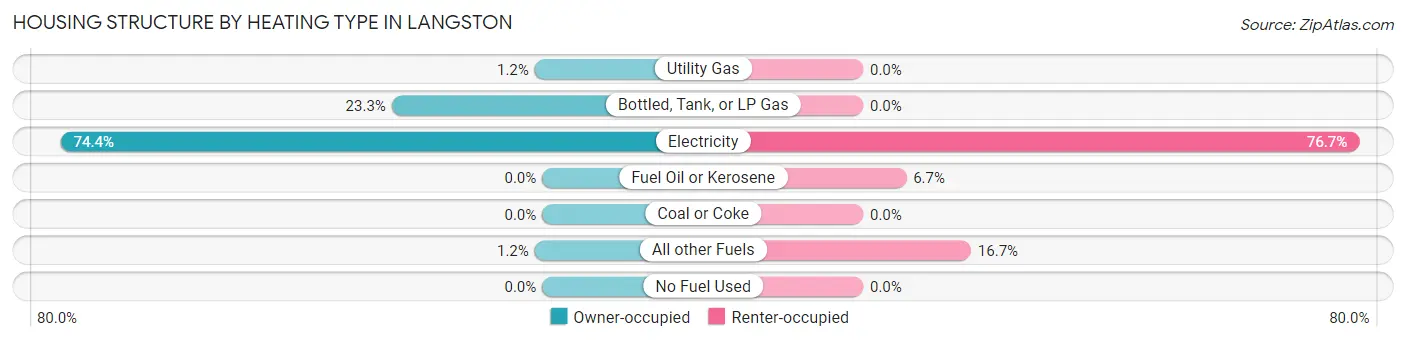
| Heating Type | Owner-occupied | Renter-occupied |
| Utility Gas | 1 (1.2%) | 0 (0.0%) |
| Bottled, Tank, or LP Gas | 20 (23.3%) | 0 (0.0%) |
| Electricity | 64 (74.4%) | 23 (76.7%) |
| Fuel Oil or Kerosene | 0 (0.0%) | 2 (6.7%) |
| Coal or Coke | 0 (0.0%) | 0 (0.0%) |
| All other Fuels | 1 (1.2%) | 5 (16.7%) |
| No Fuel Used | 0 (0.0%) | 0 (0.0%) |
| Total | 86 (100.0%) | 30 (100.0%) |
Household Vehicle Usage in Langston
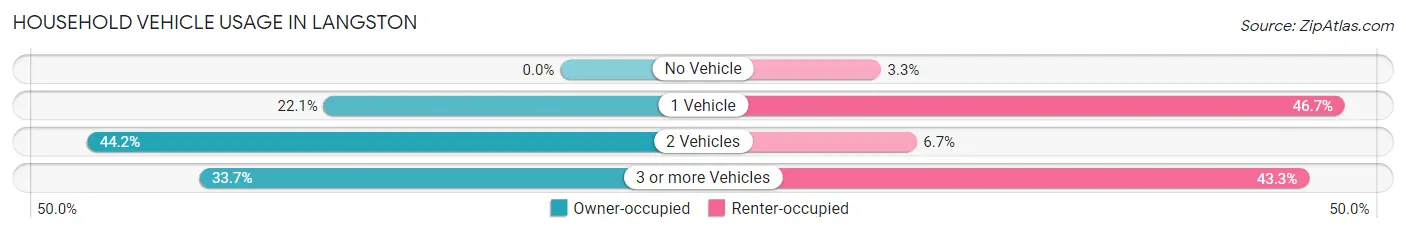
| Vehicles per Household | Owner-occupied | Renter-occupied |
| No Vehicle | 0 (0.0%) | 1 (3.3%) |
| 1 Vehicle | 19 (22.1%) | 14 (46.7%) |
| 2 Vehicles | 38 (44.2%) | 2 (6.7%) |
| 3 or more Vehicles | 29 (33.7%) | 13 (43.3%) |
| Total | 86 (100.0%) | 30 (100.0%) |
Real Estate & Mortgages in Langston
Real Estate and Mortgage Overview in Langston
| Characteristic | Without Mortgage | With Mortgage |
| Housing Units | 48 | 38 |
| Median Property Value | - | - |
| Median Household Income | $53,750 | $5 |
| Monthly Housing Costs | $350 | $7 |
| Real Estate Taxes | - | - |
Property Value by Mortgage Status in Langston
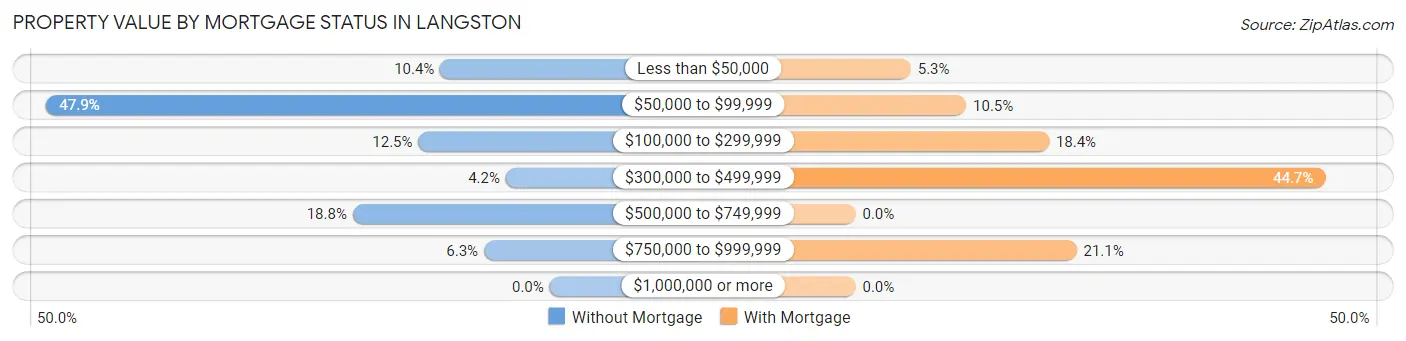
| Property Value | Without Mortgage | With Mortgage |
| Less than $50,000 | 5 (10.4%) | 2 (5.3%) |
| $50,000 to $99,999 | 23 (47.9%) | 4 (10.5%) |
| $100,000 to $299,999 | 6 (12.5%) | 7 (18.4%) |
| $300,000 to $499,999 | 2 (4.2%) | 17 (44.7%) |
| $500,000 to $749,999 | 9 (18.8%) | 0 (0.0%) |
| $750,000 to $999,999 | 3 (6.2%) | 8 (21.0%) |
| $1,000,000 or more | 0 (0.0%) | 0 (0.0%) |
| Total | 48 (100.0%) | 38 (100.0%) |
Household Income by Mortgage Status in Langston
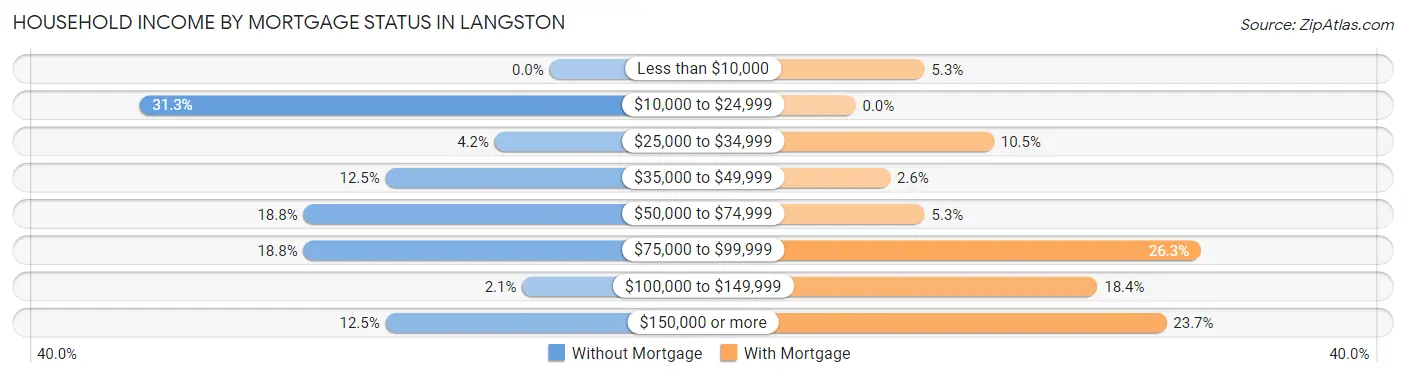
| Household Income | Without Mortgage | With Mortgage |
| Less than $10,000 | 0 (0.0%) | 2 (5.3%) |
| $10,000 to $24,999 | 15 (31.2%) | 0 (0.0%) |
| $25,000 to $34,999 | 2 (4.2%) | 4 (10.5%) |
| $35,000 to $49,999 | 6 (12.5%) | 1 (2.6%) |
| $50,000 to $74,999 | 9 (18.8%) | 2 (5.3%) |
| $75,000 to $99,999 | 9 (18.8%) | 10 (26.3%) |
| $100,000 to $149,999 | 1 (2.1%) | 7 (18.4%) |
| $150,000 or more | 6 (12.5%) | 9 (23.7%) |
| Total | 48 (100.0%) | 38 (100.0%) |
Property Value to Household Income Ratio in Langston
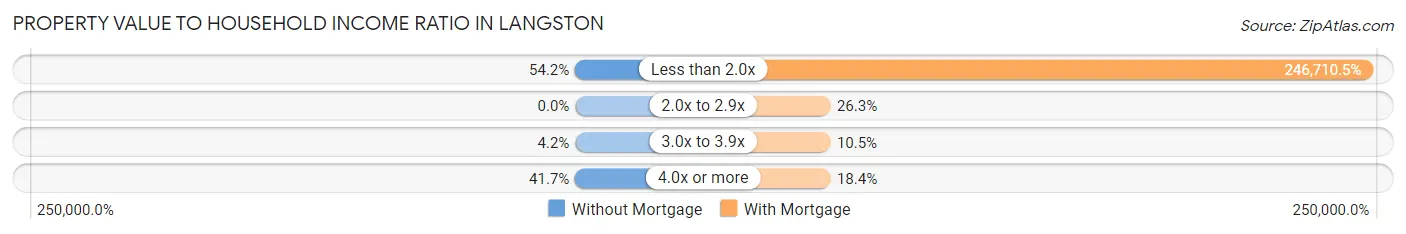
| Value-to-Income Ratio | Without Mortgage | With Mortgage |
| Less than 2.0x | 26 (54.2%) | 93,750 (246,710.5%) |
| 2.0x to 2.9x | 0 (0.0%) | 10 (26.3%) |
| 3.0x to 3.9x | 2 (4.2%) | 4 (10.5%) |
| 4.0x or more | 20 (41.7%) | 7 (18.4%) |
| Total | 48 (100.0%) | 38 (100.0%) |
Real Estate Taxes by Mortgage Status in Langston
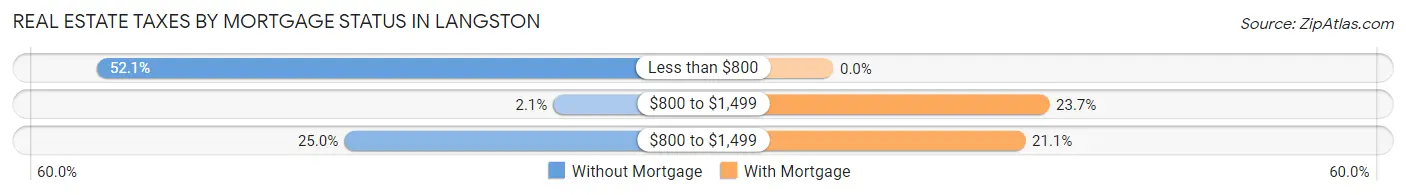
| Property Taxes | Without Mortgage | With Mortgage |
| Less than $800 | 25 (52.1%) | 0 (0.0%) |
| $800 to $1,499 | 1 (2.1%) | 9 (23.7%) |
| $800 to $1,499 | 12 (25.0%) | 8 (21.0%) |
| Total | 48 (100.0%) | 38 (100.0%) |
Health & Disability in Langston
Health Insurance Coverage by Age in Langston
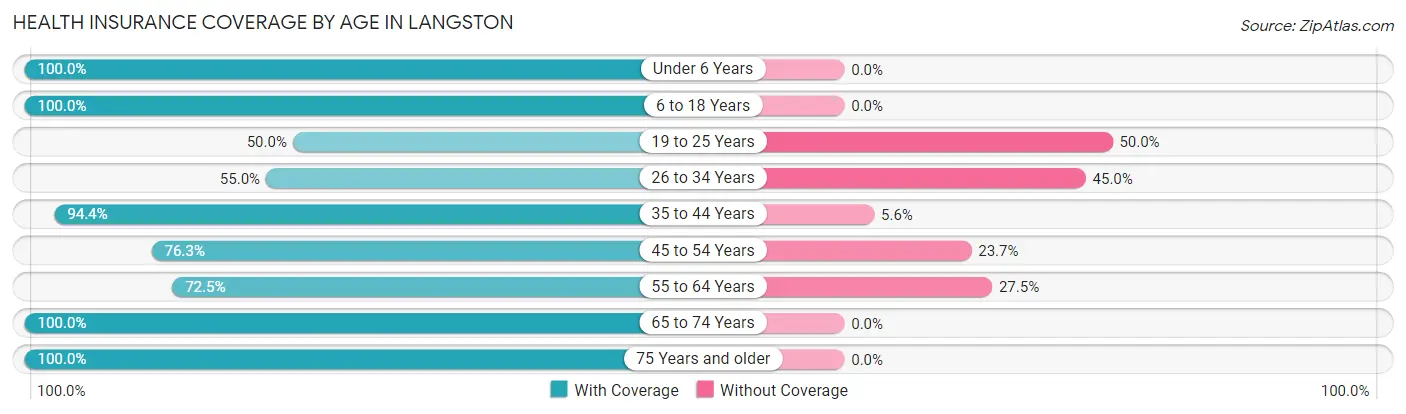
| Age Bracket | With Coverage | Without Coverage |
| Under 6 Years | 2 (100.0%) | 0 (0.0%) |
| 6 to 18 Years | 12 (100.0%) | 0 (0.0%) |
| 19 to 25 Years | 1 (50.0%) | 1 (50.0%) |
| 26 to 34 Years | 11 (55.0%) | 9 (45.0%) |
| 35 to 44 Years | 17 (94.4%) | 1 (5.6%) |
| 45 to 54 Years | 29 (76.3%) | 9 (23.7%) |
| 55 to 64 Years | 50 (72.5%) | 19 (27.5%) |
| 65 to 74 Years | 61 (100.0%) | 0 (0.0%) |
| 75 Years and older | 18 (100.0%) | 0 (0.0%) |
| Total | 201 (83.8%) | 39 (16.3%) |
Health Insurance Coverage by Citizenship Status in Langston
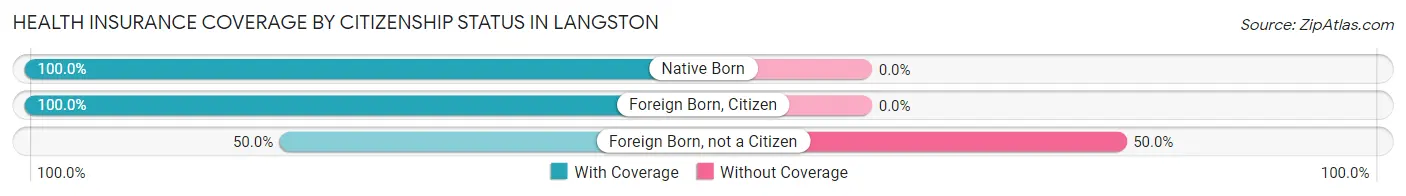
| Citizenship Status | With Coverage | Without Coverage |
| Native Born | 2 (100.0%) | 0 (0.0%) |
| Foreign Born, Citizen | 12 (100.0%) | 0 (0.0%) |
| Foreign Born, not a Citizen | 1 (50.0%) | 1 (50.0%) |
Health Insurance Coverage by Household Income in Langston
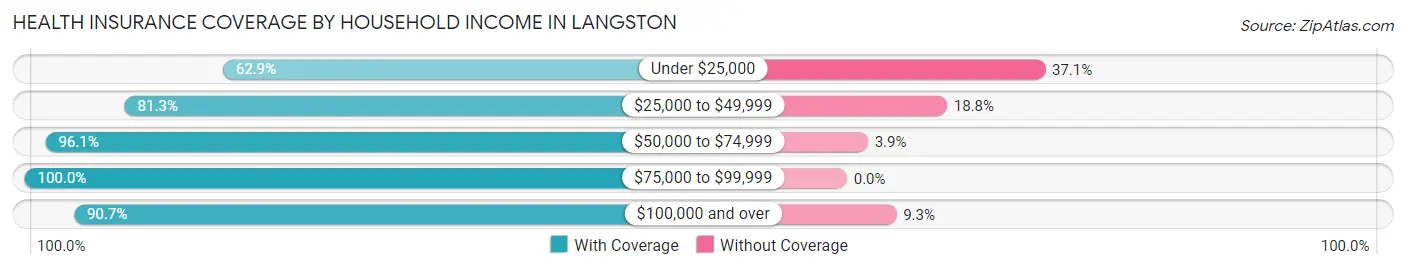
| Household Income | With Coverage | Without Coverage |
| Under $25,000 | 44 (62.9%) | 26 (37.1%) |
| $25,000 to $49,999 | 26 (81.2%) | 6 (18.8%) |
| $50,000 to $74,999 | 49 (96.1%) | 2 (3.9%) |
| $75,000 to $99,999 | 33 (100.0%) | 0 (0.0%) |
| $100,000 and over | 49 (90.7%) | 5 (9.3%) |
Public vs Private Health Insurance Coverage by Age in Langston
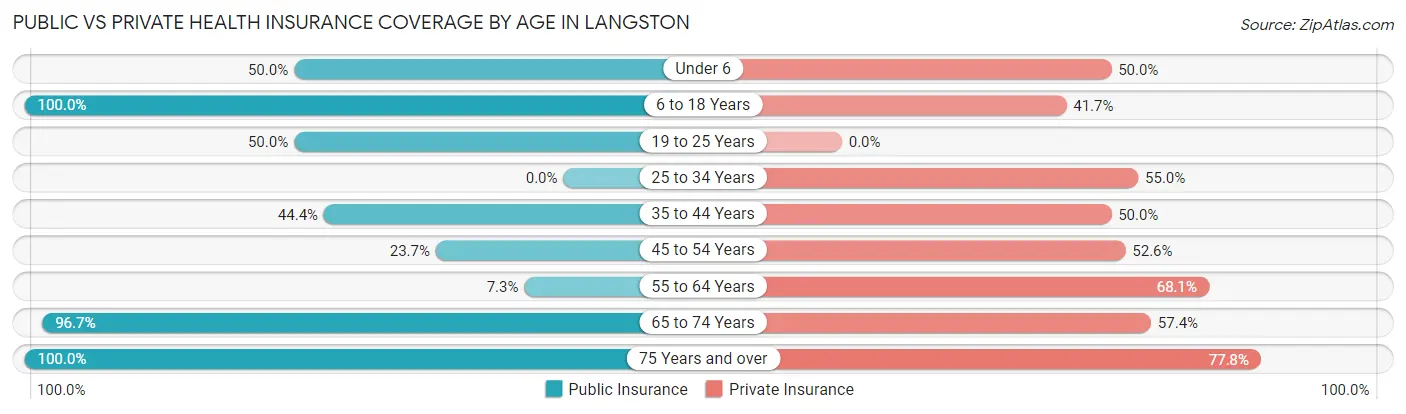
| Age Bracket | Public Insurance | Private Insurance |
| Under 6 | 1 (50.0%) | 1 (50.0%) |
| 6 to 18 Years | 12 (100.0%) | 5 (41.7%) |
| 19 to 25 Years | 1 (50.0%) | 0 (0.0%) |
| 25 to 34 Years | 0 (0.0%) | 11 (55.0%) |
| 35 to 44 Years | 8 (44.4%) | 9 (50.0%) |
| 45 to 54 Years | 9 (23.7%) | 20 (52.6%) |
| 55 to 64 Years | 5 (7.2%) | 47 (68.1%) |
| 65 to 74 Years | 59 (96.7%) | 35 (57.4%) |
| 75 Years and over | 18 (100.0%) | 14 (77.8%) |
| Total | 113 (47.1%) | 142 (59.2%) |
Disability Status by Sex by Age in Langston
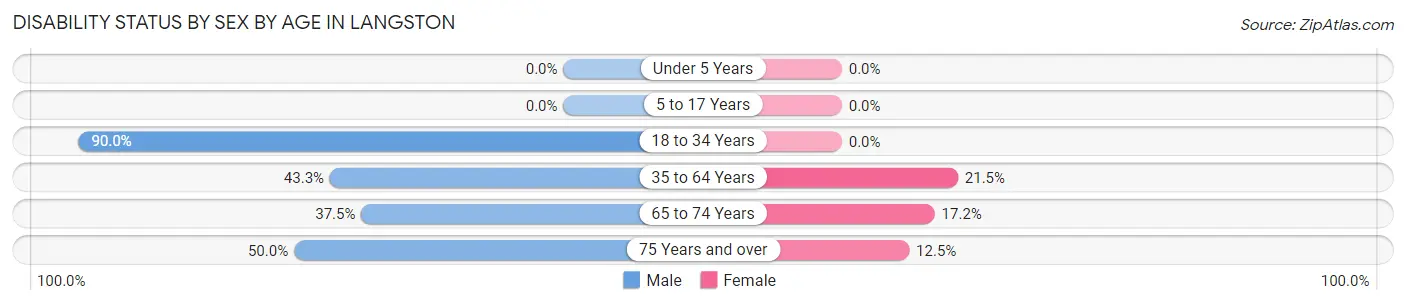
| Age Bracket | Male | Female |
| Under 5 Years | 0 (0.0%) | 0 (0.0%) |
| 5 to 17 Years | 0 (0.0%) | 0 (0.0%) |
| 18 to 34 Years | 9 (90.0%) | 0 (0.0%) |
| 35 to 64 Years | 26 (43.3%) | 14 (21.5%) |
| 65 to 74 Years | 12 (37.5%) | 5 (17.2%) |
| 75 Years and over | 5 (50.0%) | 1 (12.5%) |
Disability Class by Sex by Age in Langston
Disability Class: Hearing Difficulty
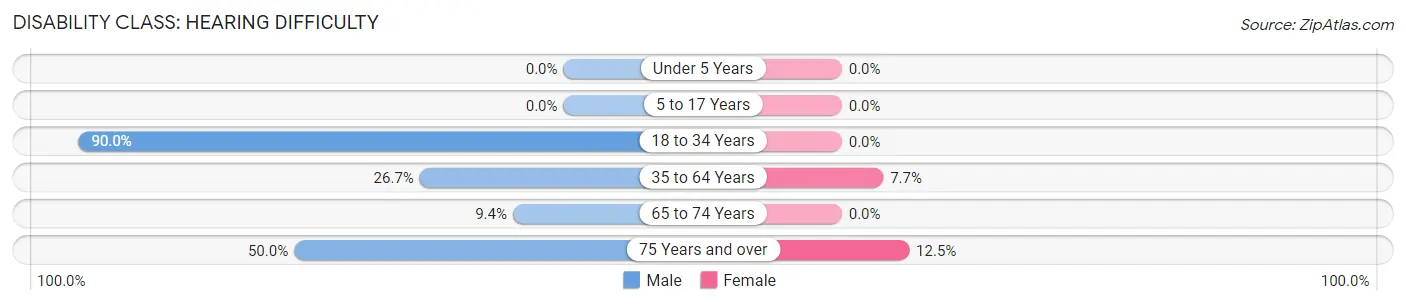
| Age Bracket | Male | Female |
| Under 5 Years | 0 (0.0%) | 0 (0.0%) |
| 5 to 17 Years | 0 (0.0%) | 0 (0.0%) |
| 18 to 34 Years | 9 (90.0%) | 0 (0.0%) |
| 35 to 64 Years | 16 (26.7%) | 5 (7.7%) |
| 65 to 74 Years | 3 (9.4%) | 0 (0.0%) |
| 75 Years and over | 5 (50.0%) | 1 (12.5%) |
Disability Class: Vision Difficulty
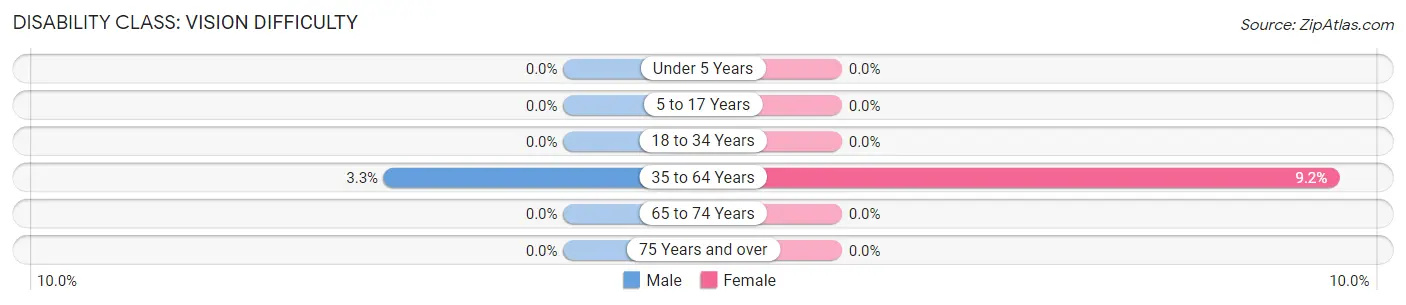
| Age Bracket | Male | Female |
| Under 5 Years | 0 (0.0%) | 0 (0.0%) |
| 5 to 17 Years | 0 (0.0%) | 0 (0.0%) |
| 18 to 34 Years | 0 (0.0%) | 0 (0.0%) |
| 35 to 64 Years | 2 (3.3%) | 6 (9.2%) |
| 65 to 74 Years | 0 (0.0%) | 0 (0.0%) |
| 75 Years and over | 0 (0.0%) | 0 (0.0%) |
Disability Class: Cognitive Difficulty
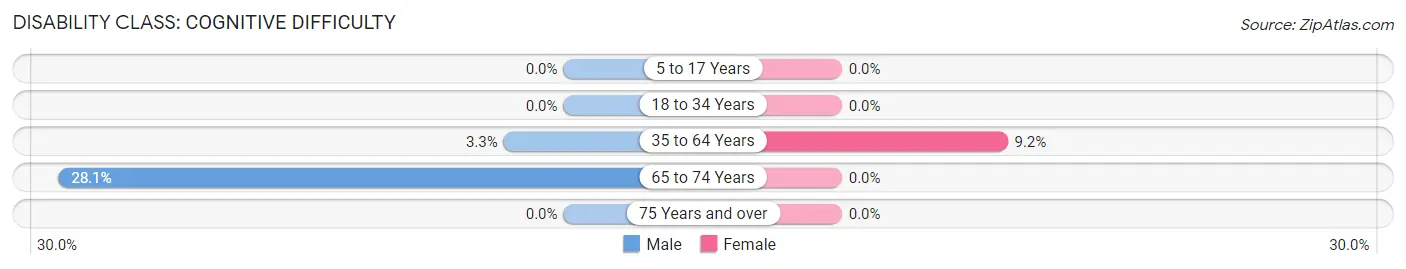
| Age Bracket | Male | Female |
| 5 to 17 Years | 0 (0.0%) | 0 (0.0%) |
| 18 to 34 Years | 0 (0.0%) | 0 (0.0%) |
| 35 to 64 Years | 2 (3.3%) | 6 (9.2%) |
| 65 to 74 Years | 9 (28.1%) | 0 (0.0%) |
| 75 Years and over | 0 (0.0%) | 0 (0.0%) |
Disability Class: Ambulatory Difficulty
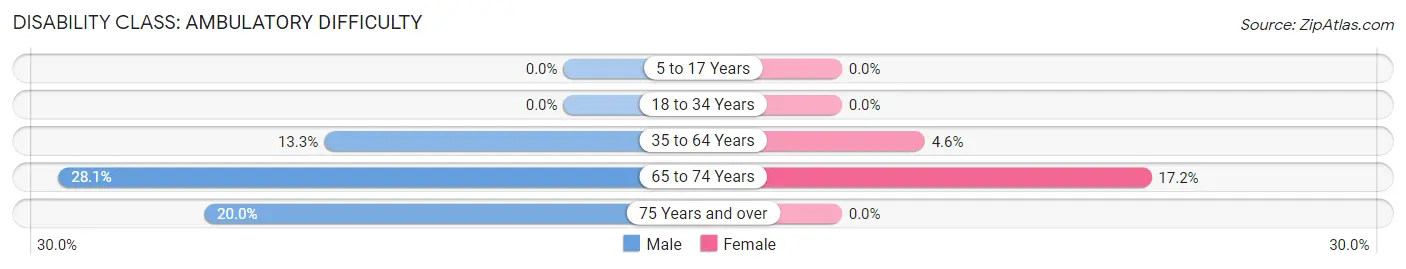
| Age Bracket | Male | Female |
| 5 to 17 Years | 0 (0.0%) | 0 (0.0%) |
| 18 to 34 Years | 0 (0.0%) | 0 (0.0%) |
| 35 to 64 Years | 8 (13.3%) | 3 (4.6%) |
| 65 to 74 Years | 9 (28.1%) | 5 (17.2%) |
| 75 Years and over | 2 (20.0%) | 0 (0.0%) |
Disability Class: Self-Care Difficulty
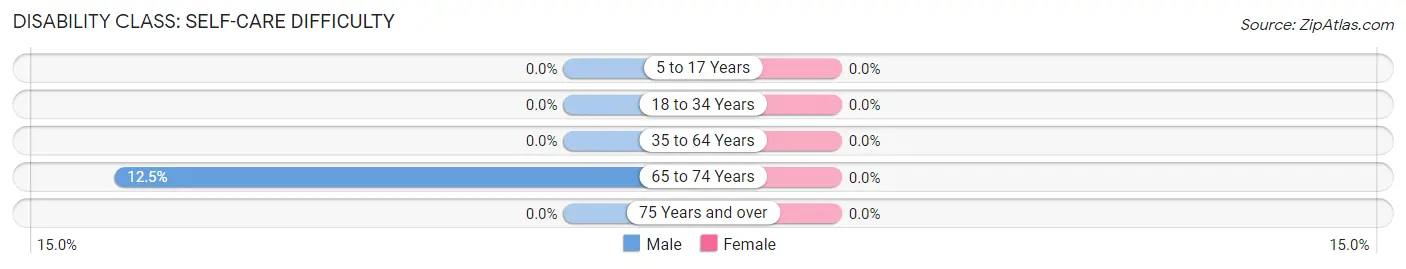
| Age Bracket | Male | Female |
| 5 to 17 Years | 0 (0.0%) | 0 (0.0%) |
| 18 to 34 Years | 0 (0.0%) | 0 (0.0%) |
| 35 to 64 Years | 0 (0.0%) | 0 (0.0%) |
| 65 to 74 Years | 4 (12.5%) | 0 (0.0%) |
| 75 Years and over | 0 (0.0%) | 0 (0.0%) |
Technology Access in Langston
Computing Device Access in Langston
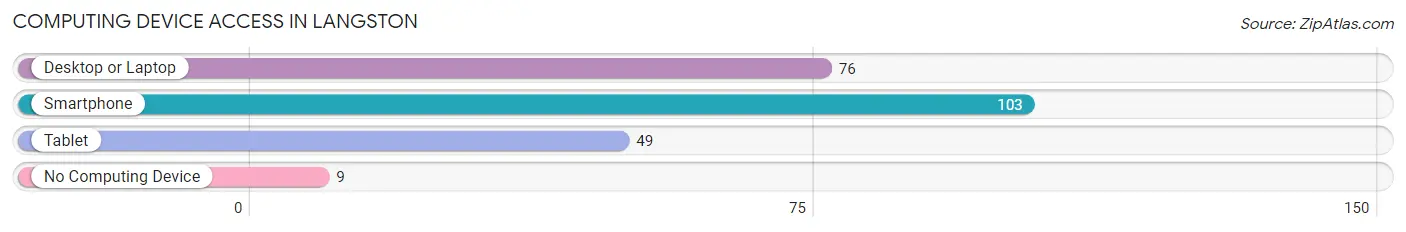
| Device Type | # Households | % Households |
| Desktop or Laptop | 76 | 65.5% |
| Smartphone | 103 | 88.8% |
| Tablet | 49 | 42.2% |
| No Computing Device | 9 | 7.8% |
| Total | 116 | 100.0% |
Internet Access in Langston
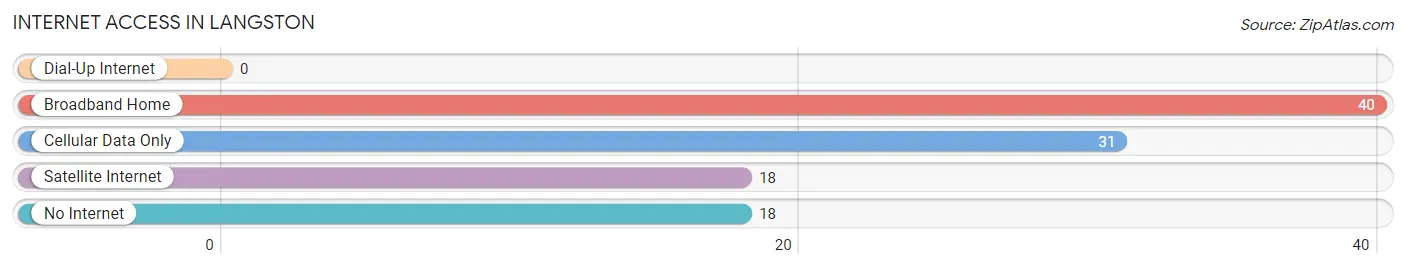
| Internet Type | # Households | % Households |
| Dial-Up Internet | 0 | 0.0% |
| Broadband Home | 40 | 34.5% |
| Cellular Data Only | 31 | 26.7% |
| Satellite Internet | 18 | 15.5% |
| No Internet | 18 | 15.5% |
| Total | 116 | 100.0% |
Langston Summary
Langston is a small town located in the state of Alabama, in the United States. It is situated in the northwest corner of the state, in the foothills of the Appalachian Mountains. The town is located in the county of Jackson, and is part of the Huntsville-Decatur Combined Statistical Area. The population of Langston was estimated to be 1,845 in the year 2000.
Geography
Langston is located in the northwest corner of Alabama, in the foothills of the Appalachian Mountains. The town is situated in the county of Jackson, and is part of the Huntsville-Decatur Combined Statistical Area. The town is located at an elevation of 845 feet above sea level. The town is surrounded by rolling hills and forests, and is located near the Tennessee River. The climate in Langston is humid subtropical, with hot summers and mild winters.
Economy
The economy of Langston is largely based on agriculture and forestry. The town is home to several farms, and the surrounding area is known for its timber production. The town is also home to several small businesses, including a grocery store, a hardware store, and a few restaurants. The town is also home to a few manufacturing plants, which produce a variety of products, including furniture, clothing, and automotive parts.
Demographics
The population of Langston was estimated to be 1,845 in the year 2000. The racial makeup of the town was 97.2% White, 0.9% African American, 0.3% Native American, 0.2% Asian, 0.1% Pacific Islander, and 0.3% from other races. The median household income in Langston was estimated to be $30,938 in the year 2000. The median age of the population was estimated to be 37.7 years.
History
Langston was founded in 1818 by settlers from North Carolina. The town was named after the first settler, John Langston. The town was originally a farming community, and the surrounding area was known for its timber production. The town was also home to several small businesses, including a grocery store, a hardware store, and a few restaurants. The town was also home to a few manufacturing plants, which produced a variety of products, including furniture, clothing, and automotive parts.
In the late 19th century, Langston was a popular destination for tourists, who came to enjoy the scenic beauty of the area. The town was also home to several churches, and was known for its religious tolerance. In the early 20th century, the town was home to several schools, including a high school and a college. The town was also home to a few banks, and was known for its financial stability.
In the late 20th century, the town began to decline, as many of its businesses and industries closed. The town was also affected by the decline of the timber industry, and the population began to decline. In recent years, the town has seen a resurgence, as new businesses have opened and the population has begun to grow. The town is now home to several small businesses, and is a popular destination for tourists.
Common Questions
What is Per Capita Income in Langston?
Per Capita income in Langston is $40,202.
What is the Median Family Income in Langston?
Median Family Income in Langston is $56,071.
What is the Median Household income in Langston?
Median Household Income in Langston is $53,333.
What is Inequality or Gini Index in Langston?
Inequality or Gini Index in Langston is 0.53.
What is the Total Population of Langston?
Total Population of Langston is 240.
What is the Total Male Population of Langston?
Total Male Population of Langston is 126.
What is the Total Female Population of Langston?
Total Female Population of Langston is 114.
What is the Ratio of Males per 100 Females in Langston?
There are 110.53 Males per 100 Females in Langston.
What is the Ratio of Females per 100 Males in Langston?
There are 90.48 Females per 100 Males in Langston.
What is the Median Population Age in Langston?
Median Population Age in Langston is 56.9 Years.
What is the Average Family Size in Langston
Average Family Size in Langston is 2.5 People.
What is the Average Household Size in Langston
Average Household Size in Langston is 2.1 People.
How Large is the Labor Force in Langston?
There are 108 People in the Labor Forcein in Langston.
What is the Percentage of People in the Labor Force in Langston?
46.8% of People are in the Labor Force in Langston.
What is the Unemployment Rate in Langston?
Unemployment Rate in Langston is 13.9%.