Bon Secour, AL Map & Demographics
Bon Secour Map
Bon Secour Overview
$45,195
PER CAPITA INCOME
$116,157
AVG FAMILY INCOME
$58,500
AVG HOUSEHOLD INCOME
5.5%
WAGE / INCOME GAP [ % ]
94.5¢/ $1
WAGE / INCOME GAP [ $ ]
0.56
INEQUALITY / GINI INDEX
2,791
TOTAL POPULATION
1,838
MALE POPULATION
953
FEMALE POPULATION
192.86
MALES / 100 FEMALES
51.85
FEMALES / 100 MALES
39.9
MEDIAN AGE
3.1
AVG FAMILY SIZE
3.1
AVG HOUSEHOLD SIZE
1,777
LABOR FORCE [ PEOPLE ]
75.5%
PERCENT IN LABOR FORCE
6.2%
UNEMPLOYMENT RATE
Bon Secour Zip Codes
Bon Secour Area Codes
Income in Bon Secour
Income Overview in Bon Secour
Per Capita Income in Bon Secour is $45,195, while median incomes of families and households are $116,157 and $58,500 respectively.
| Characteristic | Number | Measure |
| Per Capita Income | 2,791 | $45,195 |
| Median Family Income | 474 | $116,157 |
| Mean Family Income | 474 | $139,172 |
| Median Household Income | 908 | $58,500 |
| Mean Household Income | 908 | $112,330 |
| Income Deficit | 474 | $0 |
| Wage / Income Gap (%) | 2,791 | 5.54% |
| Wage / Income Gap ($) | 2,791 | 94.46¢ per $1 |
| Gini / Inequality Index | 2,791 | 0.56 |
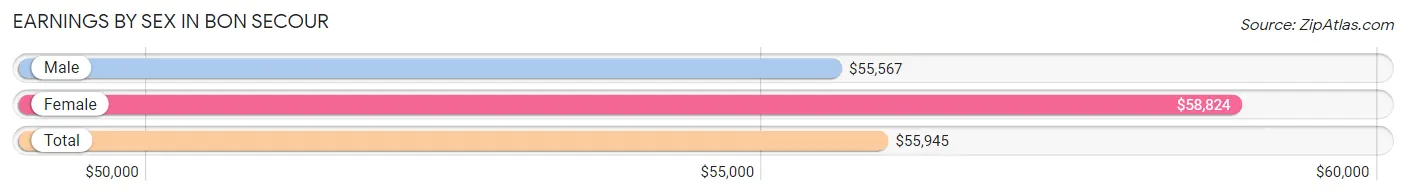
Earnings by Sex in Bon Secour
Average Earnings in Bon Secour are $55,945, $55,567 for men and $58,824 for women, a difference of 5.5%.
| Sex | Number | Average Earnings |
| Male | 1,242 (74.6%) | $55,567 |
| Female | 424 (25.5%) | $58,824 |
| Total | 1,666 (100.0%) | $55,945 |
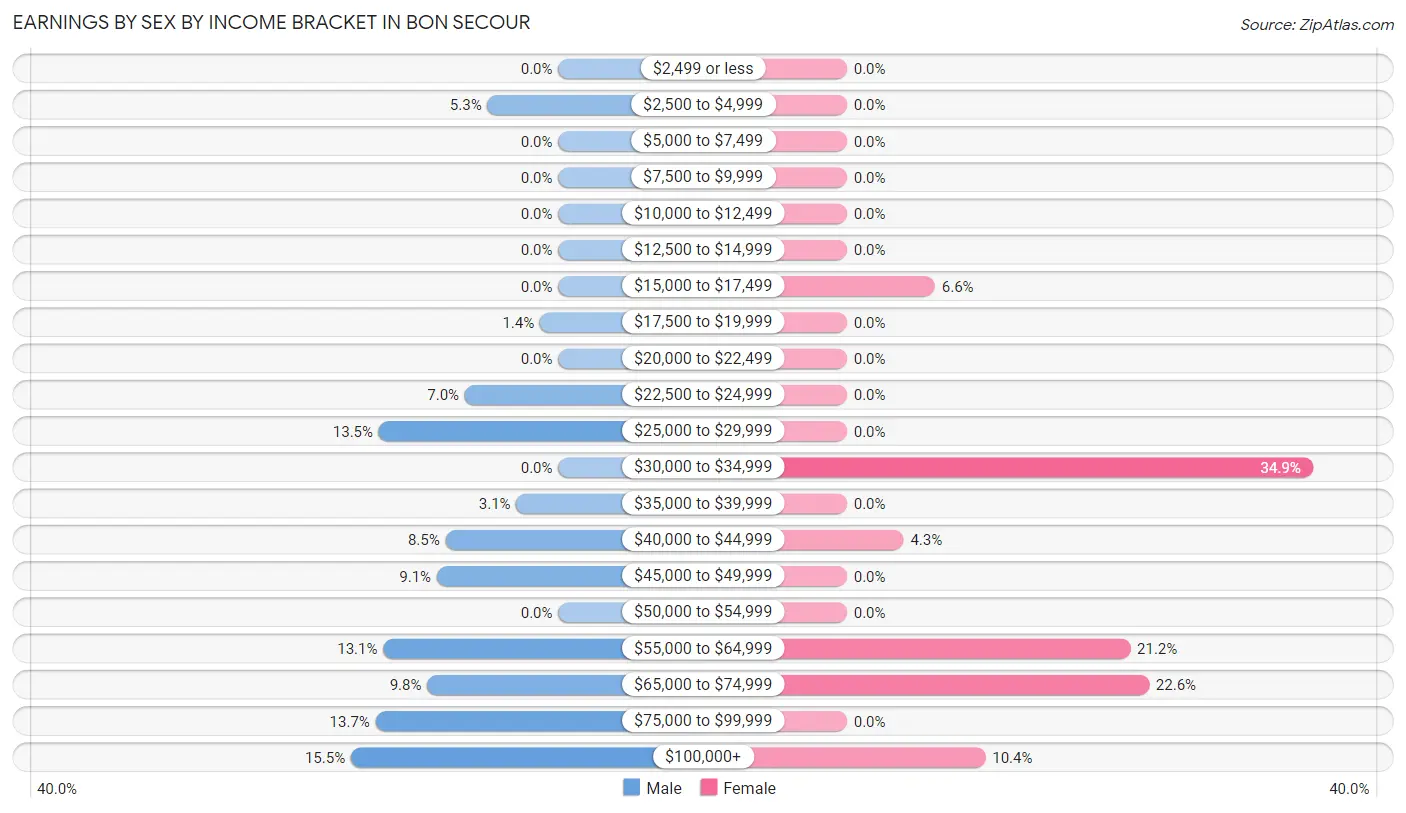
Earnings by Sex by Income Bracket in Bon Secour
The most common earnings brackets in Bon Secour are $100,000+ for men (193 | 15.5%) and $30,000 to $34,999 for women (148 | 34.9%).
| Income | Male | Female |
| $2,499 or less | 0 (0.0%) | 0 (0.0%) |
| $2,500 to $4,999 | 66 (5.3%) | 0 (0.0%) |
| $5,000 to $7,499 | 0 (0.0%) | 0 (0.0%) |
| $7,500 to $9,999 | 0 (0.0%) | 0 (0.0%) |
| $10,000 to $12,499 | 0 (0.0%) | 0 (0.0%) |
| $12,500 to $14,999 | 0 (0.0%) | 0 (0.0%) |
| $15,000 to $17,499 | 0 (0.0%) | 28 (6.6%) |
| $17,500 to $19,999 | 17 (1.4%) | 0 (0.0%) |
| $20,000 to $22,499 | 0 (0.0%) | 0 (0.0%) |
| $22,500 to $24,999 | 87 (7.0%) | 0 (0.0%) |
| $25,000 to $29,999 | 167 (13.5%) | 0 (0.0%) |
| $30,000 to $34,999 | 0 (0.0%) | 148 (34.9%) |
| $35,000 to $39,999 | 39 (3.1%) | 0 (0.0%) |
| $40,000 to $44,999 | 105 (8.5%) | 18 (4.3%) |
| $45,000 to $49,999 | 113 (9.1%) | 0 (0.0%) |
| $50,000 to $54,999 | 0 (0.0%) | 0 (0.0%) |
| $55,000 to $64,999 | 163 (13.1%) | 90 (21.2%) |
| $65,000 to $74,999 | 122 (9.8%) | 96 (22.6%) |
| $75,000 to $99,999 | 170 (13.7%) | 0 (0.0%) |
| $100,000+ | 193 (15.5%) | 44 (10.4%) |
| Total | 1,242 (100.0%) | 424 (100.0%) |
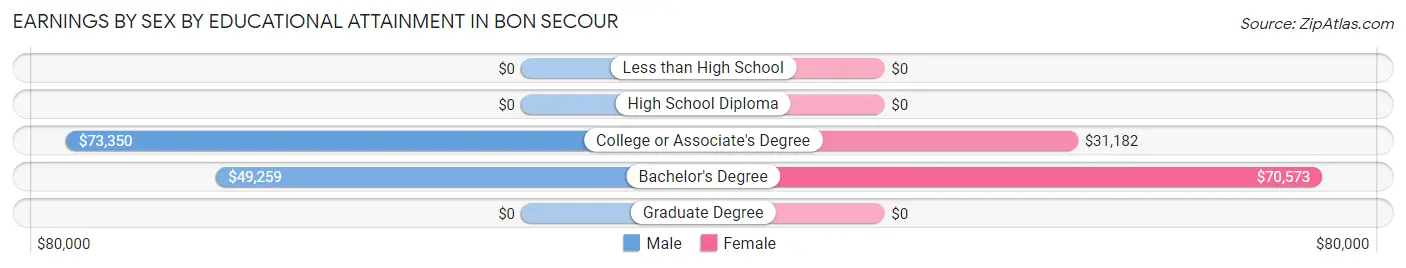
Earnings by Sex by Educational Attainment in Bon Secour
Average earnings in Bon Secour are $60,028 for men and $58,824 for women, a difference of 2.0%. Men with an educational attainment of college or associate's degree enjoy the highest average annual earnings of $73,350, while those with bachelor's degree education earn the least with $49,259. Women with an educational attainment of bachelor's degree earn the most with the average annual earnings of $70,573, while those with college or associate's degree education have the smallest earnings of $31,182.
| Educational Attainment | Male Income | Female Income |
| Less than High School | - | - |
| High School Diploma | - | - |
| College or Associate's Degree | $73,350 | $31,182 |
| Bachelor's Degree | $49,259 | $70,573 |
| Graduate Degree | - | - |
| Total | $60,028 | $58,824 |
Family Income in Bon Secour
Family Income Brackets in Bon Secour
According to the Bon Secour family income data, there are 149 families falling into the $200,000+ income range, which is the most common income bracket and makes up 31.4% of all families.
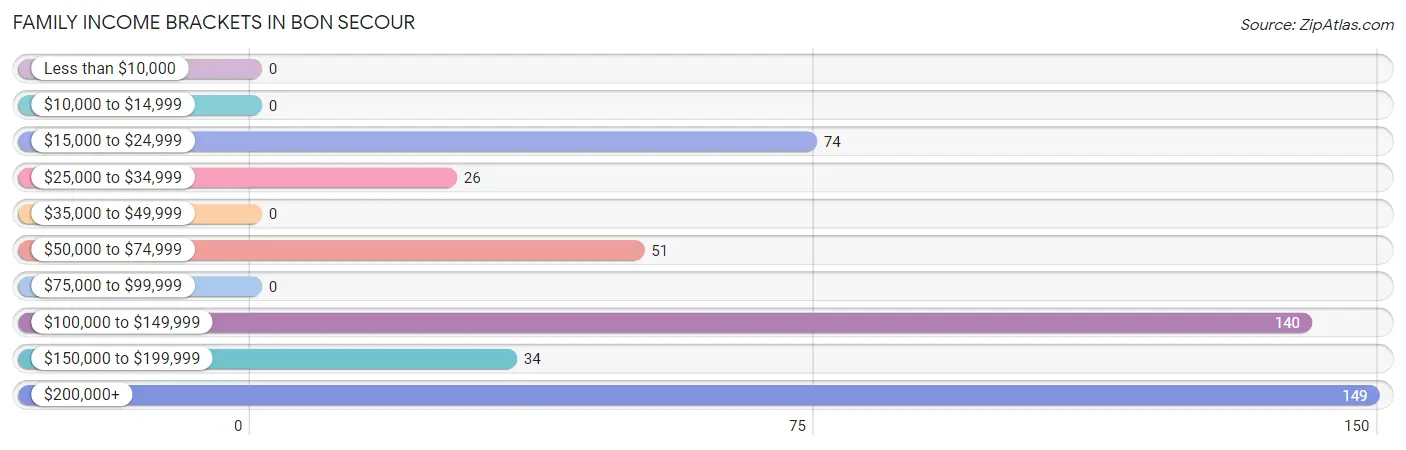
| Income Bracket | # Families | % Families |
| Less than $10,000 | 0 | 0.0% |
| $10,000 to $14,999 | 0 | 0.0% |
| $15,000 to $24,999 | 74 | 15.6% |
| $25,000 to $34,999 | 26 | 5.5% |
| $35,000 to $49,999 | 0 | 0.0% |
| $50,000 to $74,999 | 51 | 10.8% |
| $75,000 to $99,999 | 0 | 0.0% |
| $100,000 to $149,999 | 140 | 29.5% |
| $150,000 to $199,999 | 34 | 7.2% |
| $200,000+ | 149 | 31.4% |
Family Income by Famaliy Size in Bon Secour
2-person families (208 | 43.9%) account for the highest median family income in Bon Secour with $202,528 per family, while 2-person families (208 | 43.9%) have the highest median income of $101,264 per family member.
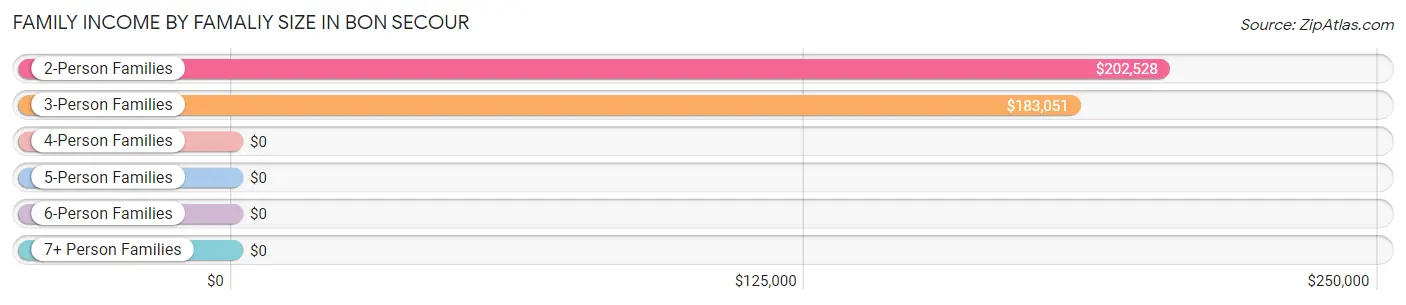
| Income Bracket | # Families | Median Income |
| 2-Person Families | 208 (43.9%) | $202,528 |
| 3-Person Families | 141 (29.7%) | $183,051 |
| 4-Person Families | 51 (10.8%) | $0 |
| 5-Person Families | 74 (15.6%) | $0 |
| 6-Person Families | 0 (0.0%) | $0 |
| 7+ Person Families | 0 (0.0%) | $0 |
| Total | 474 (100.0%) | $116,157 |
Family Income by Number of Earners in Bon Secour
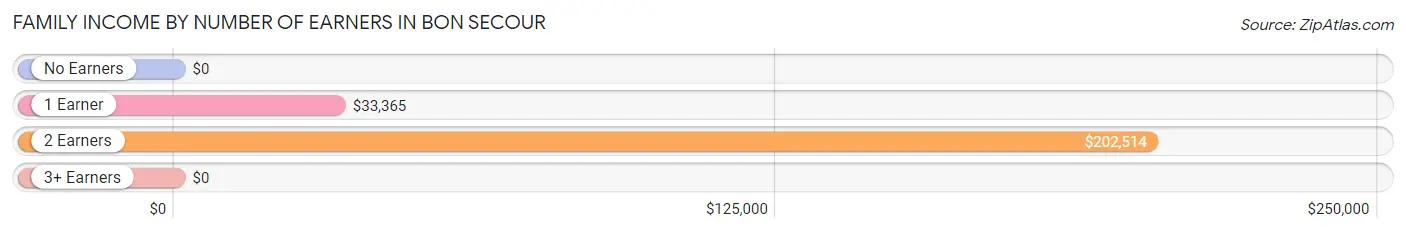
| Number of Earners | # Families | Median Income |
| No Earners | 85 (17.9%) | $0 |
| 1 Earner | 166 (35.0%) | $33,365 |
| 2 Earners | 179 (37.8%) | $202,514 |
| 3+ Earners | 44 (9.3%) | $0 |
| Total | 474 (100.0%) | $116,157 |
Household Income in Bon Secour
Household Income Brackets in Bon Secour
With 193 households falling in the category, the $200,000+ income range is the most frequent in Bon Secour, accounting for 21.3% of all households.
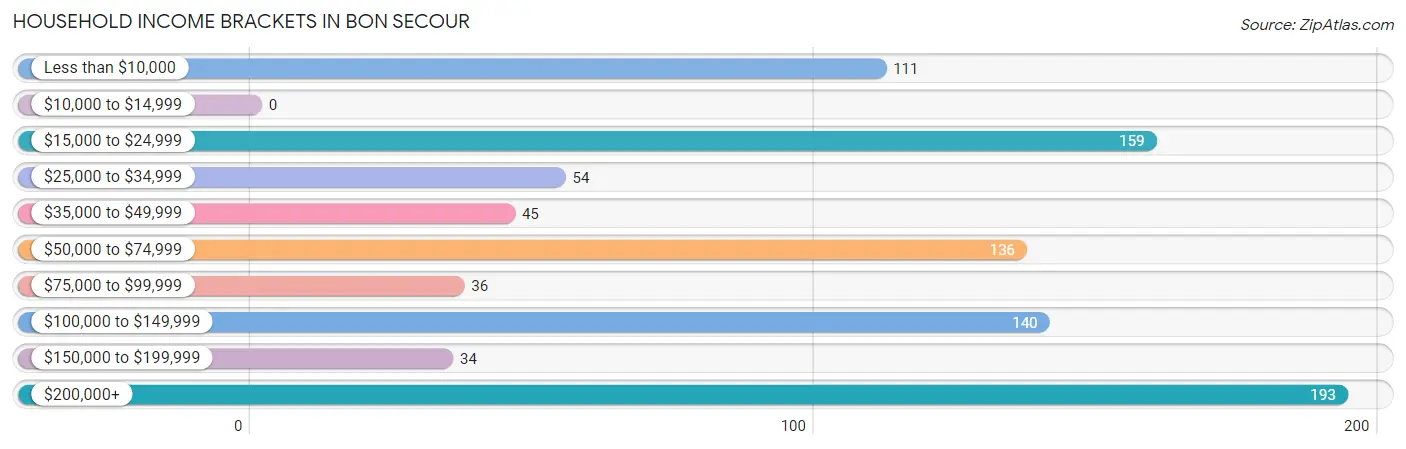
| Income Bracket | # Households | % Households |
| Less than $10,000 | 111 | 12.2% |
| $10,000 to $14,999 | 0 | 0.0% |
| $15,000 to $24,999 | 159 | 17.5% |
| $25,000 to $34,999 | 54 | 5.9% |
| $35,000 to $49,999 | 45 | 5.0% |
| $50,000 to $74,999 | 136 | 15.0% |
| $75,000 to $99,999 | 36 | 4.0% |
| $100,000 to $149,999 | 140 | 15.4% |
| $150,000 to $199,999 | 34 | 3.7% |
| $200,000+ | 193 | 21.3% |
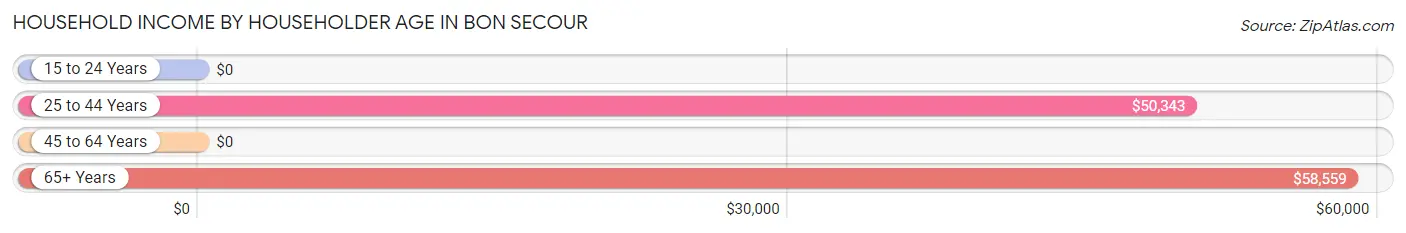
Household Income by Householder Age in Bon Secour
The median household income in Bon Secour is $58,500, with the highest median household income of $58,559 found in the 65+ years age bracket for the primary householder. A total of 332 households (36.6%) fall into this category.
| Income Bracket | # Households | Median Income |
| 15 to 24 Years | 0 (0.0%) | $0 |
| 25 to 44 Years | 214 (23.6%) | $50,343 |
| 45 to 64 Years | 362 (39.9%) | $0 |
| 65+ Years | 332 (36.6%) | $58,559 |
| Total | 908 (100.0%) | $58,500 |
Poverty in Bon Secour
Income Below Poverty by Sex and Age in Bon Secour
With 16.2% poverty level for males and 20.0% for females among the residents of Bon Secour, 6 to 11 year old males and 35 to 44 year old females are the most vulnerable to poverty, with 130 males (77.4%) and 74 females (56.9%) in their respective age groups living below the poverty level.
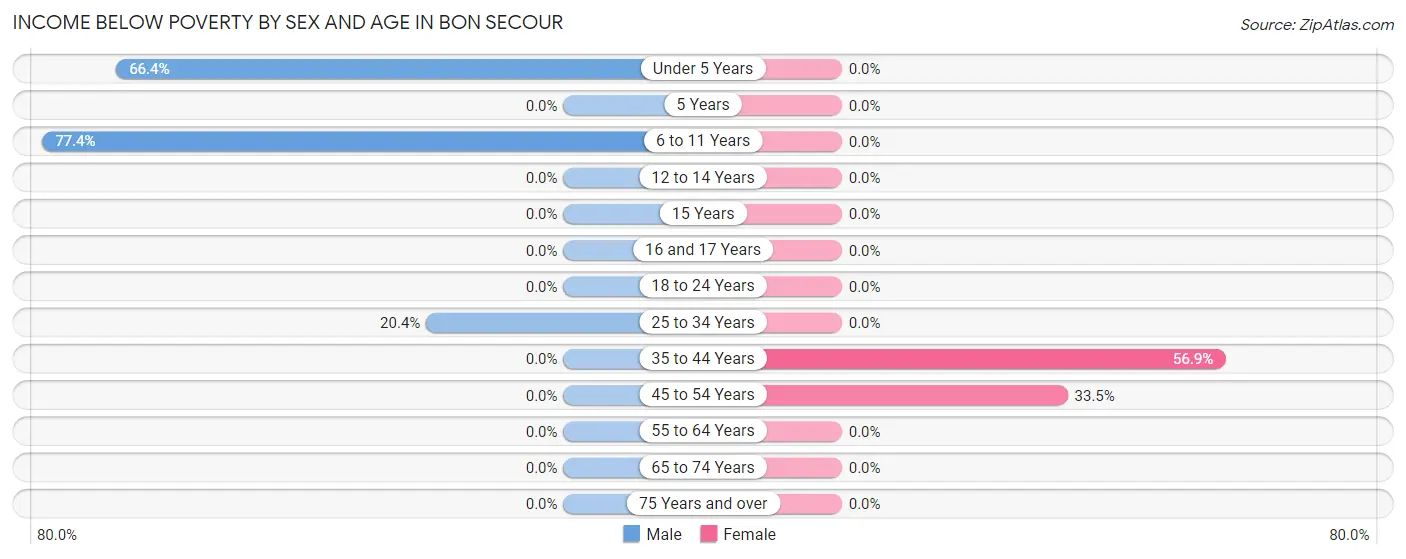
| Age Bracket | Male | Female |
| Under 5 Years | 81 (66.4%) | 0 (0.0%) |
| 5 Years | 0 (0.0%) | 0 (0.0%) |
| 6 to 11 Years | 130 (77.4%) | 0 (0.0%) |
| 12 to 14 Years | 0 (0.0%) | 0 (0.0%) |
| 15 Years | 0 (0.0%) | 0 (0.0%) |
| 16 and 17 Years | 0 (0.0%) | 0 (0.0%) |
| 18 to 24 Years | 0 (0.0%) | 0 (0.0%) |
| 25 to 34 Years | 87 (20.4%) | 0 (0.0%) |
| 35 to 44 Years | 0 (0.0%) | 74 (56.9%) |
| 45 to 54 Years | 0 (0.0%) | 111 (33.5%) |
| 55 to 64 Years | 0 (0.0%) | 0 (0.0%) |
| 65 to 74 Years | 0 (0.0%) | 0 (0.0%) |
| 75 Years and over | 0 (0.0%) | 0 (0.0%) |
| Total | 298 (16.2%) | 185 (20.0%) |
Income Above Poverty by Sex and Age in Bon Secour
According to the poverty statistics in Bon Secour, males aged 12 to 14 years and females aged under 5 years are the age groups that are most secure financially, with 100.0% of males and 100.0% of females in these age groups living above the poverty line.
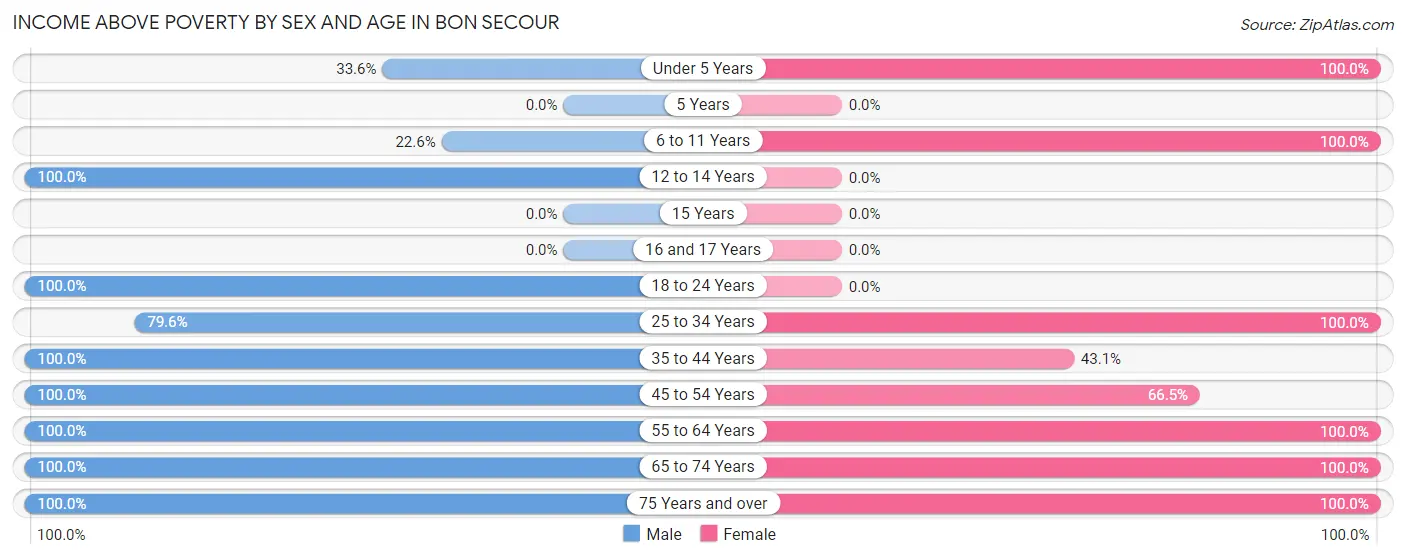
| Age Bracket | Male | Female |
| Under 5 Years | 41 (33.6%) | 39 (100.0%) |
| 5 Years | 0 (0.0%) | 0 (0.0%) |
| 6 to 11 Years | 38 (22.6%) | 49 (100.0%) |
| 12 to 14 Years | 32 (100.0%) | 0 (0.0%) |
| 15 Years | 0 (0.0%) | 0 (0.0%) |
| 16 and 17 Years | 0 (0.0%) | 0 (0.0%) |
| 18 to 24 Years | 185 (100.0%) | 0 (0.0%) |
| 25 to 34 Years | 340 (79.6%) | 77 (100.0%) |
| 35 to 44 Years | 193 (100.0%) | 56 (43.1%) |
| 45 to 54 Years | 229 (100.0%) | 220 (66.5%) |
| 55 to 64 Years | 281 (100.0%) | 64 (100.0%) |
| 65 to 74 Years | 161 (100.0%) | 79 (100.0%) |
| 75 Years and over | 40 (100.0%) | 156 (100.0%) |
| Total | 1,540 (83.8%) | 740 (80.0%) |
Income Below Poverty Among Married-Couple Families in Bon Secour
The poverty statistics for married-couple families in Bon Secour show that 16.5% or 74 of the total 448 families live below the poverty line. Families with 3 or 4 children have the highest poverty rate of 100.0%, comprising of 74 families. On the other hand, families with no children have the lowest poverty rate of 0.0%, which includes 0 families.
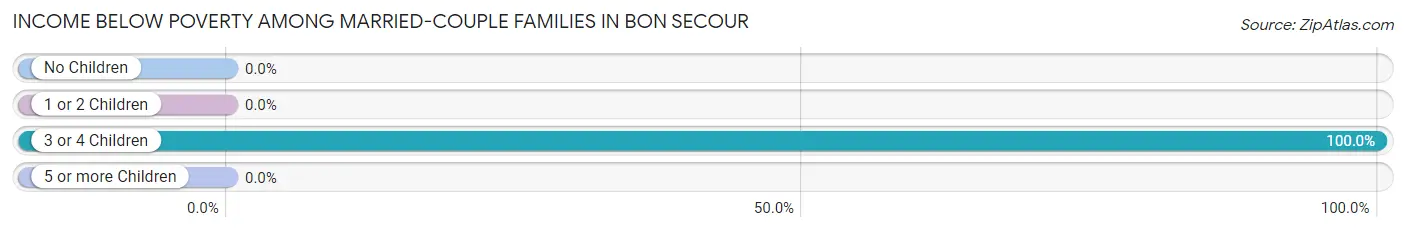
| Children | Above Poverty | Below Poverty |
| No Children | 289 (100.0%) | 0 (0.0%) |
| 1 or 2 Children | 85 (100.0%) | 0 (0.0%) |
| 3 or 4 Children | 0 (0.0%) | 74 (100.0%) |
| 5 or more Children | 0 (0.0%) | 0 (0.0%) |
| Total | 374 (83.5%) | 74 (16.5%) |
Income Below Poverty Among Single-Parent Households in Bon Secour
| Children | Single Father | Single Mother |
| No Children | 0 (0.0%) | 0 (0.0%) |
| 1 or 2 Children | 0 (0.0%) | 0 (0.0%) |
| 3 or 4 Children | 0 (0.0%) | 0 (0.0%) |
| 5 or more Children | 0 (0.0%) | 0 (0.0%) |
| Total | 0 (0.0%) | 0 (0.0%) |
Income Below Poverty Among Married-Couple vs Single-Parent Households in Bon Secour
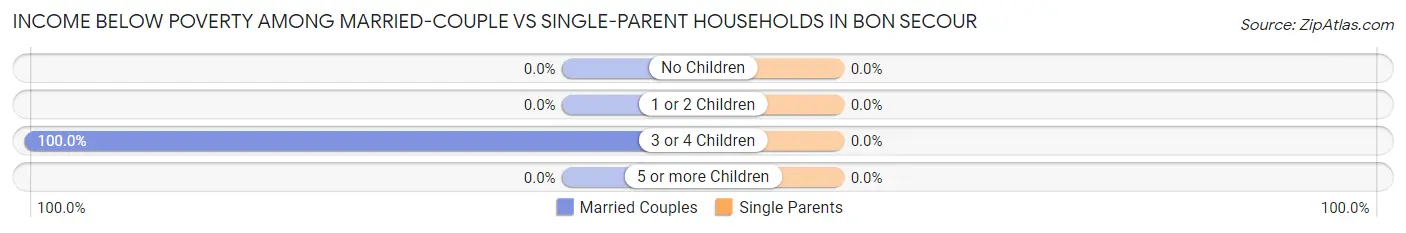
| Children | Married-Couple Families | Single-Parent Households |
| No Children | 0 (0.0%) | 0 (0.0%) |
| 1 or 2 Children | 0 (0.0%) | 0 (0.0%) |
| 3 or 4 Children | 74 (100.0%) | 0 (0.0%) |
| 5 or more Children | 0 (0.0%) | 0 (0.0%) |
| Total | 74 (16.5%) | 0 (0.0%) |
Race in Bon Secour
The most populous races in Bon Secour are White / Caucasian (2,182 | 78.2%), Hispanic or Latino (572 | 20.5%), and Some other Race (483 | 17.3%).
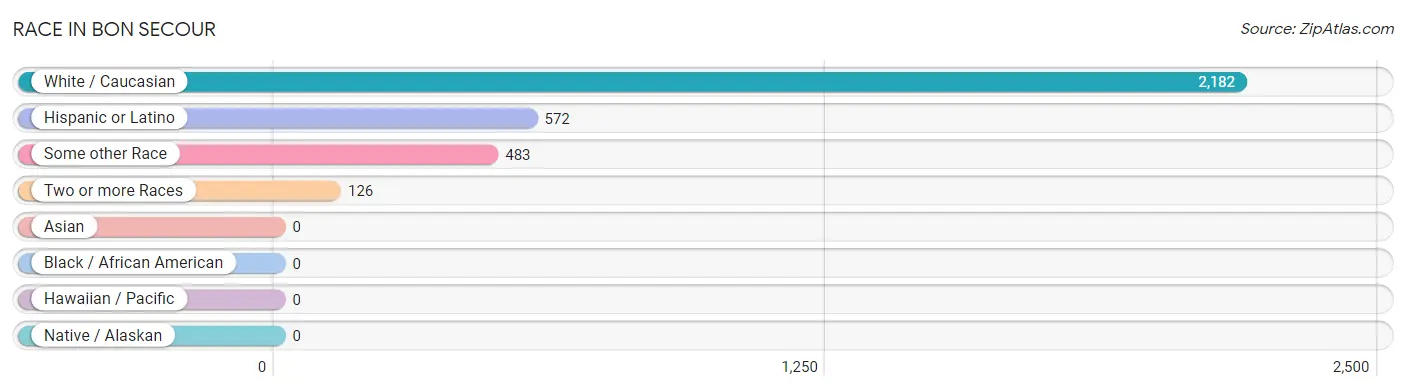
| Race | # Population | % Population |
| Asian | 0 | 0.0% |
| Black / African American | 0 | 0.0% |
| Hawaiian / Pacific | 0 | 0.0% |
| Hispanic or Latino | 572 | 20.5% |
| Native / Alaskan | 0 | 0.0% |
| White / Caucasian | 2,182 | 78.2% |
| Two or more Races | 126 | 4.5% |
| Some other Race | 483 | 17.3% |
| Total | 2,791 | 100.0% |
Ancestry in Bon Secour
The most populous ancestries reported in Bon Secour are Mexican (396 | 14.2%), American (283 | 10.1%), Irish (116 | 4.2%), Italian (107 | 3.8%), and Argentinean (89 | 3.2%), together accounting for 35.5% of all Bon Secour residents.
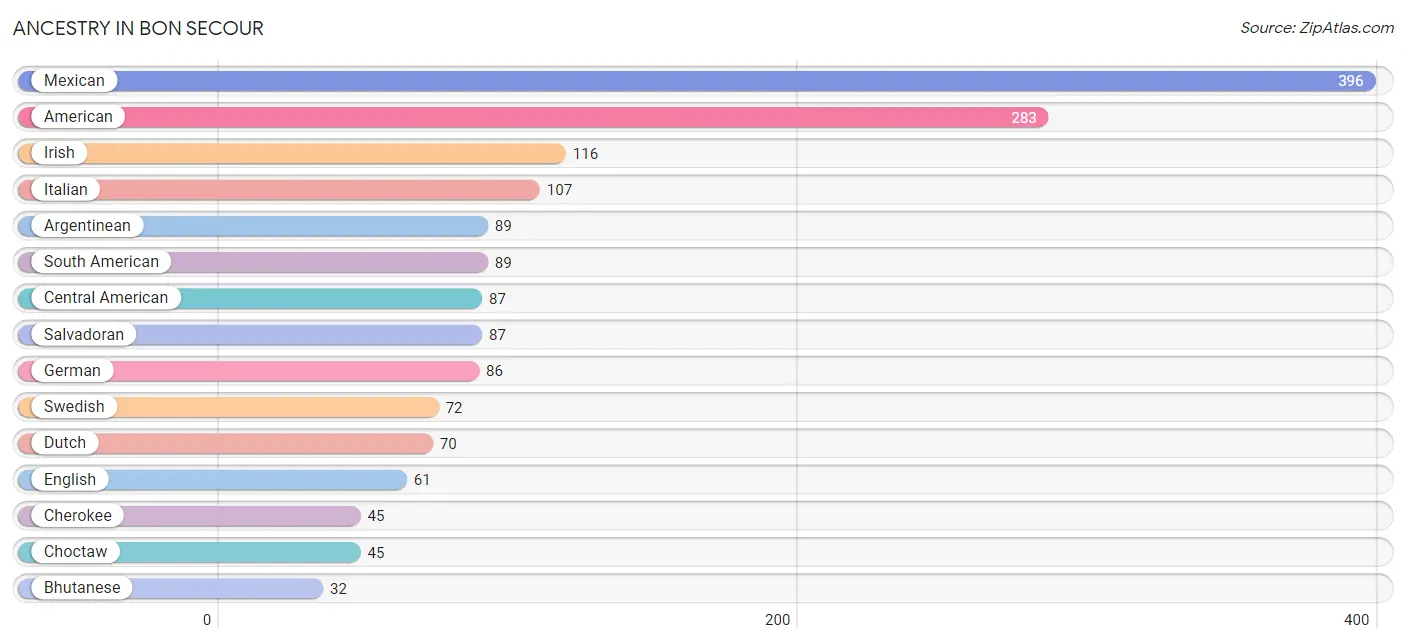
| Ancestry | # Population | % Population |
| American | 283 | 10.1% |
| Argentinean | 89 | 3.2% |
| Bhutanese | 32 | 1.1% |
| Central American | 87 | 3.1% |
| Cherokee | 45 | 1.6% |
| Choctaw | 45 | 1.6% |
| Dutch | 70 | 2.5% |
| English | 61 | 2.2% |
| German | 86 | 3.1% |
| Irish | 116 | 4.2% |
| Italian | 107 | 3.8% |
| Mexican | 396 | 14.2% |
| Polish | 28 | 1.0% |
| Salvadoran | 87 | 3.1% |
| Scottish | 25 | 0.9% |
| South American | 89 | 3.2% |
| Swedish | 72 | 2.6% | View All 17 Rows |
Immigrants in Bon Secour
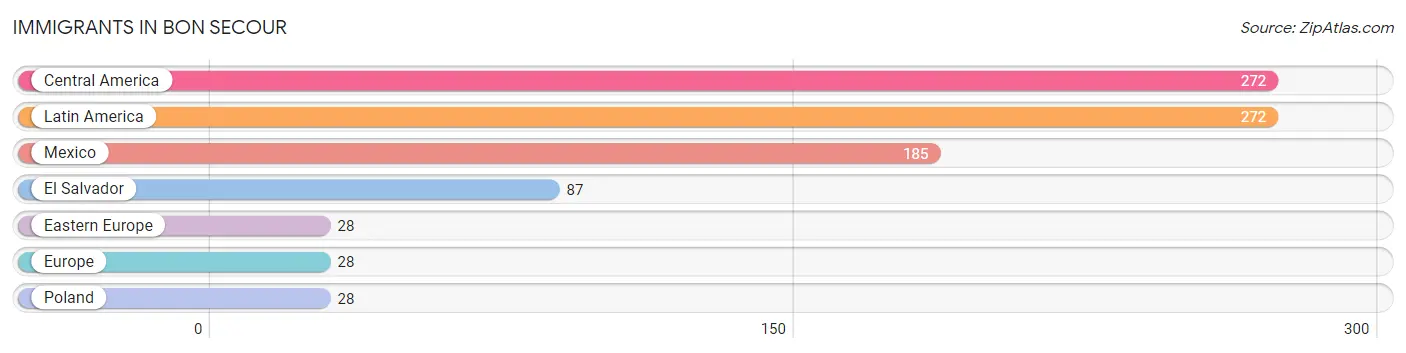
The most numerous immigrant groups reported in Bon Secour came from Central America (272 | 9.8%), Latin America (272 | 9.8%), Mexico (185 | 6.6%), El Salvador (87 | 3.1%), and Eastern Europe (28 | 1.0%), together accounting for 30.2% of all Bon Secour residents.
| Immigration Origin | # Population | % Population |
| Central America | 272 | 9.8% |
| Eastern Europe | 28 | 1.0% |
| El Salvador | 87 | 3.1% |
| Europe | 28 | 1.0% |
| Latin America | 272 | 9.8% |
| Mexico | 185 | 6.6% |
| Poland | 28 | 1.0% | View All 7 Rows |
Sex and Age in Bon Secour
Sex and Age in Bon Secour
The most populous age groups in Bon Secour are 30 to 34 Years (427 | 23.2%) for men and 45 to 49 Years (191 | 20.0%) for women.
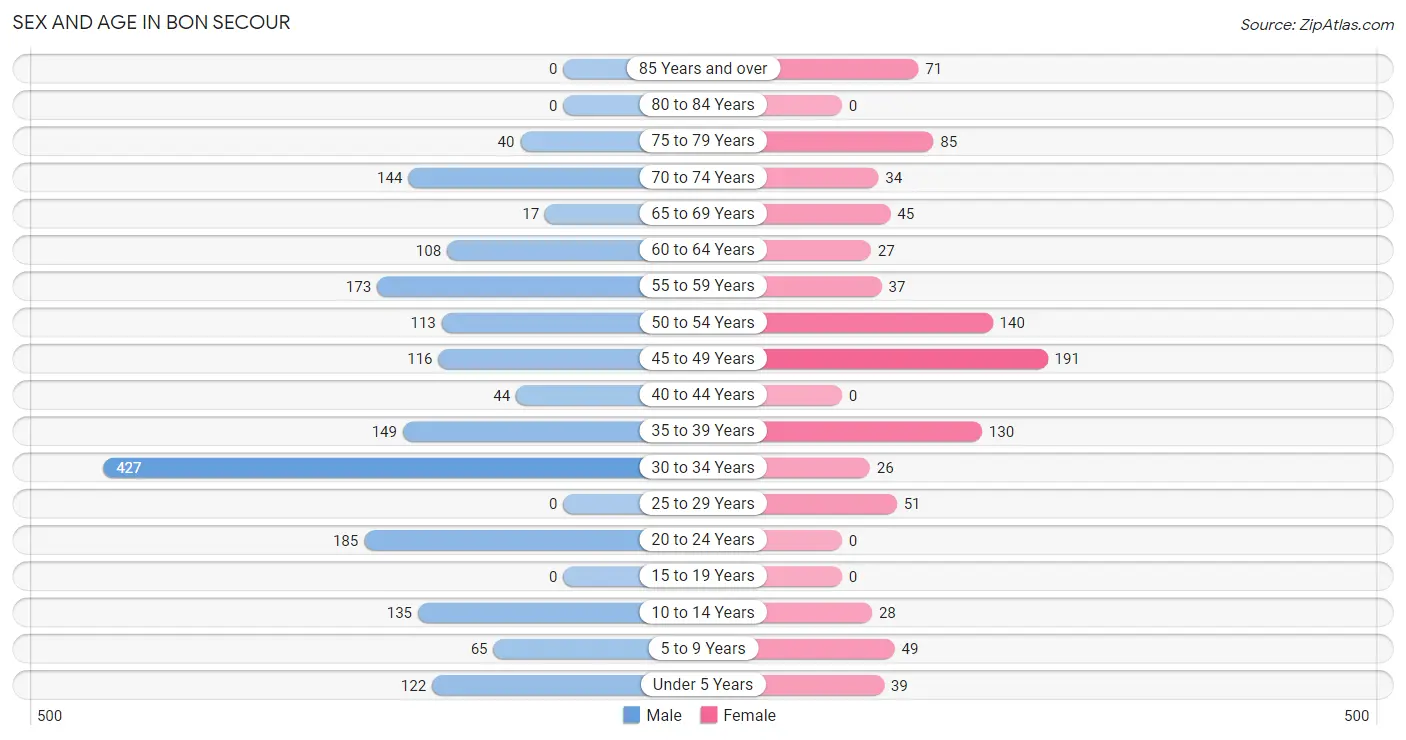
| Age Bracket | Male | Female |
| Under 5 Years | 122 (6.6%) | 39 (4.1%) |
| 5 to 9 Years | 65 (3.5%) | 49 (5.1%) |
| 10 to 14 Years | 135 (7.3%) | 28 (2.9%) |
| 15 to 19 Years | 0 (0.0%) | 0 (0.0%) |
| 20 to 24 Years | 185 (10.1%) | 0 (0.0%) |
| 25 to 29 Years | 0 (0.0%) | 51 (5.3%) |
| 30 to 34 Years | 427 (23.2%) | 26 (2.7%) |
| 35 to 39 Years | 149 (8.1%) | 130 (13.6%) |
| 40 to 44 Years | 44 (2.4%) | 0 (0.0%) |
| 45 to 49 Years | 116 (6.3%) | 191 (20.0%) |
| 50 to 54 Years | 113 (6.1%) | 140 (14.7%) |
| 55 to 59 Years | 173 (9.4%) | 37 (3.9%) |
| 60 to 64 Years | 108 (5.9%) | 27 (2.8%) |
| 65 to 69 Years | 17 (0.9%) | 45 (4.7%) |
| 70 to 74 Years | 144 (7.8%) | 34 (3.6%) |
| 75 to 79 Years | 40 (2.2%) | 85 (8.9%) |
| 80 to 84 Years | 0 (0.0%) | 0 (0.0%) |
| 85 Years and over | 0 (0.0%) | 71 (7.4%) |
| Total | 1,838 (100.0%) | 953 (100.0%) |
Families and Households in Bon Secour
Median Family Size in Bon Secour
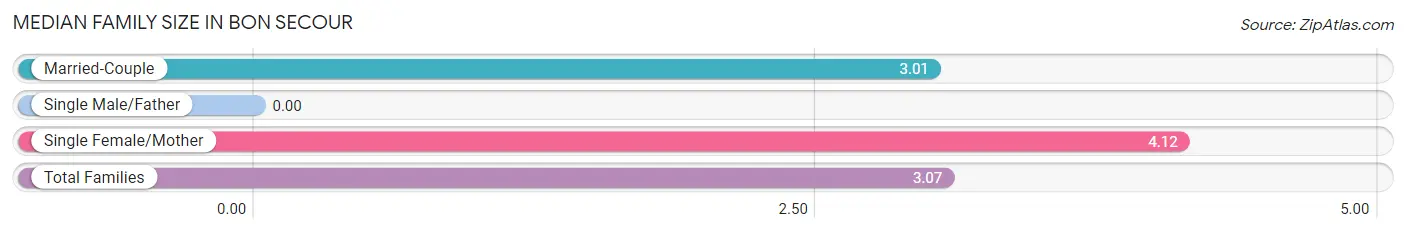
| Family Type | # Families | Family Size |
| Married-Couple | 448 (94.5%) | 3.01 |
| Single Male/Father | 0 (0.0%) | - |
| Single Female/Mother | 26 (5.5%) | 4.12 |
| Total Families | 474 (100.0%) | 3.07 |
Median Household Size in Bon Secour
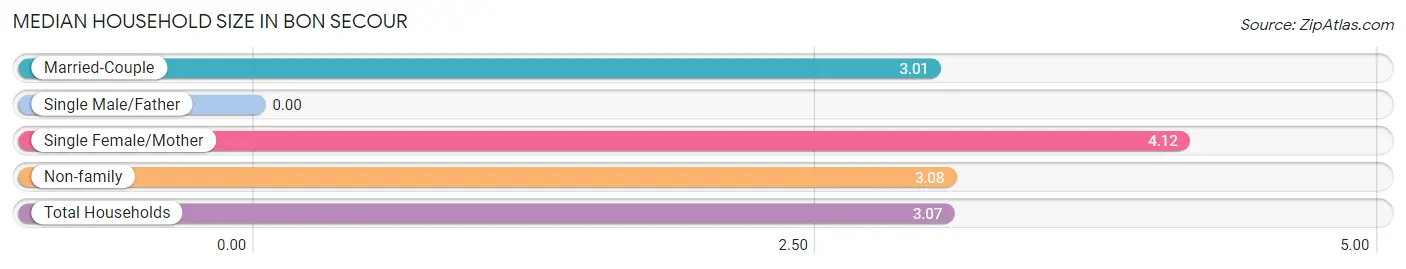
| Household Type | # Households | Household Size |
| Married-Couple | 448 (49.3%) | 3.01 |
| Single Male/Father | 0 (0.0%) | - |
| Single Female/Mother | 26 (2.9%) | 4.12 |
| Non-family | 434 (47.8%) | 3.08 |
| Total Households | 908 (100.0%) | 3.07 |
Household Size by Marriage Status in Bon Secour
Out of a total of 908 households in Bon Secour, 474 (52.2%) are family households, while 434 (47.8%) are nonfamily households. The most numerous type of family households are 2-person households, comprising 208, and the most common type of nonfamily households are 1-person households, comprising 317.
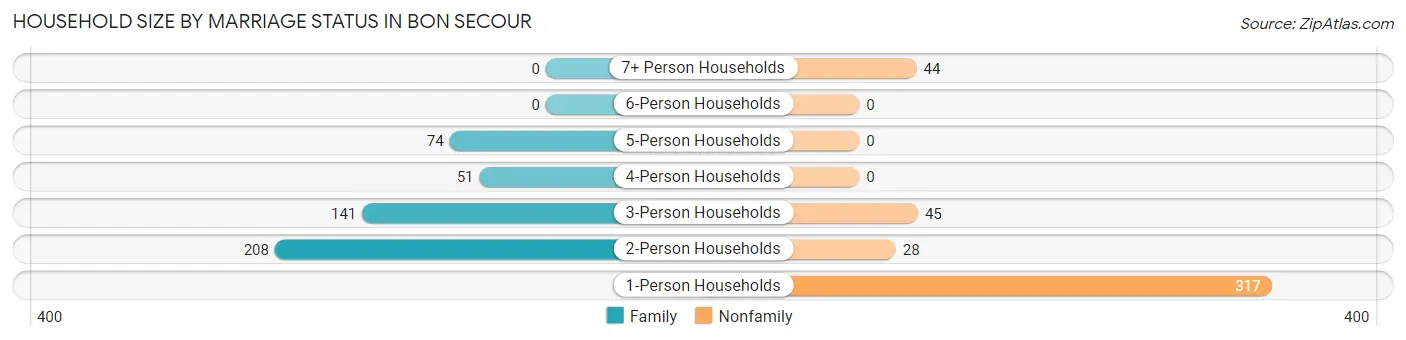
| Household Size | Family Households | Nonfamily Households |
| 1-Person Households | - | 317 (34.9%) |
| 2-Person Households | 208 (22.9%) | 28 (3.1%) |
| 3-Person Households | 141 (15.5%) | 45 (5.0%) |
| 4-Person Households | 51 (5.6%) | 0 (0.0%) |
| 5-Person Households | 74 (8.2%) | 0 (0.0%) |
| 6-Person Households | 0 (0.0%) | 0 (0.0%) |
| 7+ Person Households | 0 (0.0%) | 44 (4.9%) |
| Total | 474 (52.2%) | 434 (47.8%) |
Female Fertility in Bon Secour
Fertility by Age in Bon Secour
| Age Bracket | Women with Births | Births / 1,000 Women |
| 15 to 19 years | 0 (0.0%) | 0.0 |
| 20 to 34 years | 0 (0.0%) | 0.0 |
| 35 to 50 years | 0 (0.0%) | 0.0 |
| Total | 0 (0.0%) | 0.0 |
Fertility by Age by Marriage Status in Bon Secour
| Age Bracket | Married | Unmarried |
| 15 to 19 years | 0 (0.0%) | 0 (0.0%) |
| 20 to 34 years | 0 (0.0%) | 0 (0.0%) |
| 35 to 50 years | 0 (0.0%) | 0 (0.0%) |
| Total | 0 (0.0%) | 0 (0.0%) |
Fertility by Education in Bon Secour
| Educational Attainment | Women with Births | Births / 1,000 Women |
| Less than High School | 0 (0.0%) | 0.0 |
| High School Diploma | 0 (0.0%) | 0.0 |
| College or Associate's Degree | 0 (0.0%) | 0.0 |
| Bachelor's Degree | 0 (0.0%) | 0.0 |
| Graduate Degree | 0 (0.0%) | 0.0 |
| Total | 0 (0.0%) | 0.0 |
Fertility by Education by Marriage Status in Bon Secour
| Educational Attainment | Married | Unmarried |
| Less than High School | 0 (0.0%) | 0 (0.0%) |
| High School Diploma | 0 (0.0%) | 0 (0.0%) |
| College or Associate's Degree | 0 (0.0%) | 0 (0.0%) |
| Bachelor's Degree | 0 (0.0%) | 0 (0.0%) |
| Graduate Degree | 0 (0.0%) | 0 (0.0%) |
| Total | 0 (0.0%) | 0 (0.0%) |
Employment Characteristics in Bon Secour
Employment by Class of Employer in Bon Secour
Among the 1,666 employed individuals in Bon Secour, private company employees (1,207 | 72.5%), self-employed (not incorporated) (163 | 9.8%), and state government employees (113 | 6.8%) make up the most common classes of employment.
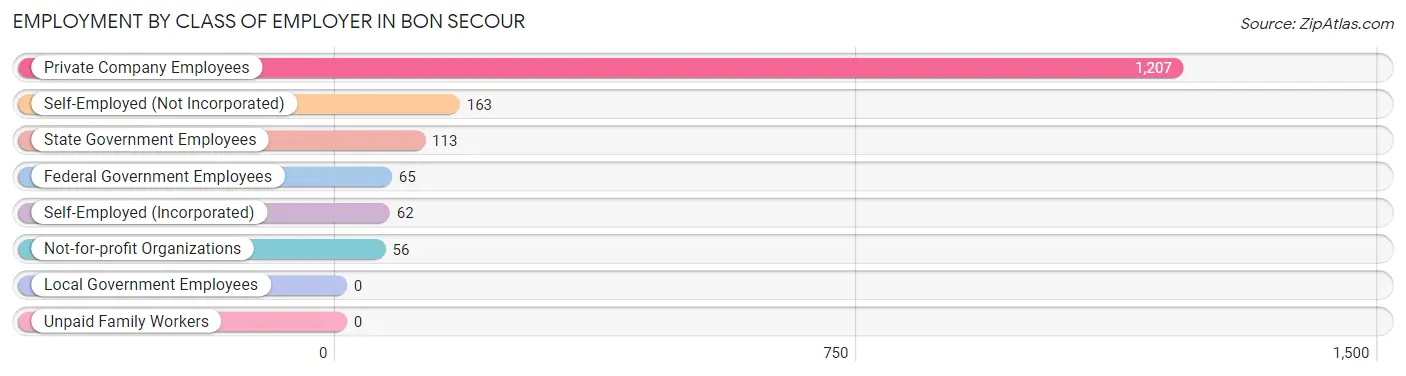
| Employer Class | # Employees | % Employees |
| Private Company Employees | 1,207 | 72.5% |
| Self-Employed (Incorporated) | 62 | 3.7% |
| Self-Employed (Not Incorporated) | 163 | 9.8% |
| Not-for-profit Organizations | 56 | 3.4% |
| Local Government Employees | 0 | 0.0% |
| State Government Employees | 113 | 6.8% |
| Federal Government Employees | 65 | 3.9% |
| Unpaid Family Workers | 0 | 0.0% |
| Total | 1,666 | 100.0% |
Employment Status by Age in Bon Secour
According to the labor force statistics for Bon Secour, out of the total population over 16 years of age (2,353), 75.5% or 1,777 individuals are in the labor force, with 6.2% or 110 of them unemployed. The age group with the highest labor force participation rate is 20 to 24 years, with 100.0% or 185 individuals in the labor force. Within the labor force, the 45 to 54 years age range has the highest percentage of unemployed individuals, with 19.8% or 111 of them being unemployed.
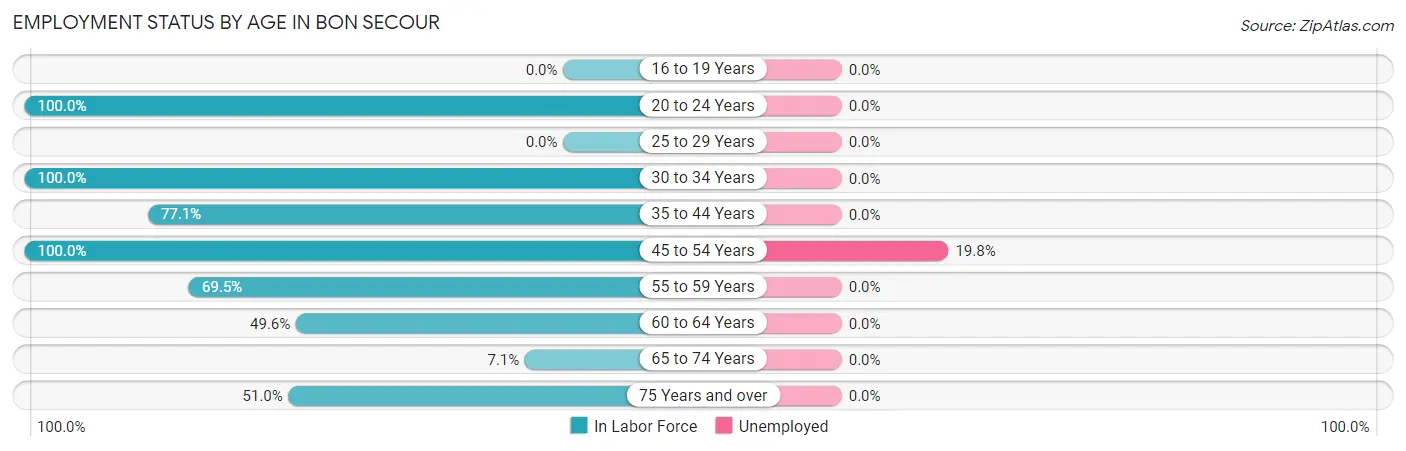
| Age Bracket | In Labor Force | Unemployed |
| 16 to 19 Years | 0 (0.0%) | 0 (0.0%) |
| 20 to 24 Years | 185 (100.0%) | 0 (0.0%) |
| 25 to 29 Years | 0 (0.0%) | 0 (0.0%) |
| 30 to 34 Years | 453 (100.0%) | 0 (0.0%) |
| 35 to 44 Years | 249 (77.1%) | 0 (0.0%) |
| 45 to 54 Years | 560 (100.0%) | 111 (19.8%) |
| 55 to 59 Years | 146 (69.5%) | 0 (0.0%) |
| 60 to 64 Years | 67 (49.6%) | 0 (0.0%) |
| 65 to 74 Years | 17 (7.1%) | 0 (0.0%) |
| 75 Years and over | 100 (51.0%) | 0 (0.0%) |
| Total | 1,777 (75.5%) | 110 (6.2%) |
Employment Status by Educational Attainment in Bon Secour
According to labor force statistics for Bon Secour, 85.2% of individuals (1,476) out of the total population between 25 and 64 years of age (1,732) are in the labor force, with 7.5% or 111 of them being unemployed. The group with the highest labor force participation rate are those with the educational attainment of less than high school, with 100.0% or 111 individuals in the labor force. Within the labor force, individuals with less than high school education have the highest percentage of unemployment, with 100.0% or 111 of them being unemployed.
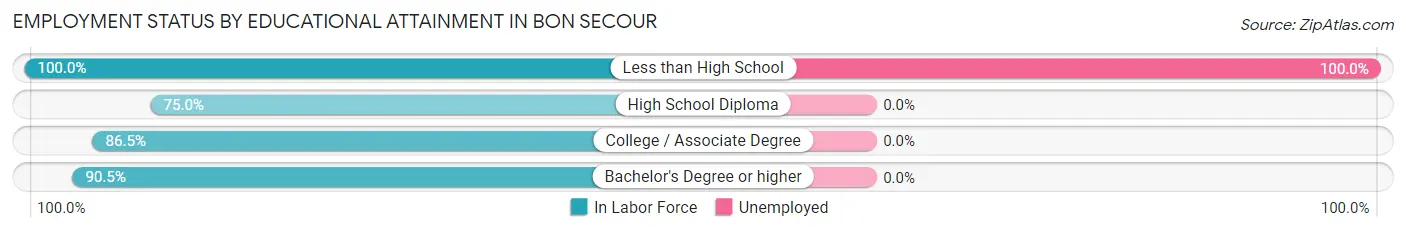
| Educational Attainment | In Labor Force | Unemployed |
| Less than High School | 111 (100.0%) | 111 (100.0%) |
| High School Diploma | 426 (75.0%) | 0 (0.0%) |
| College / Associate Degree | 326 (86.5%) | 0 (0.0%) |
| Bachelor's Degree or higher | 612 (90.5%) | 0 (0.0%) |
| Total | 1,476 (85.2%) | 130 (7.5%) |
Employment Occupations by Sex in Bon Secour
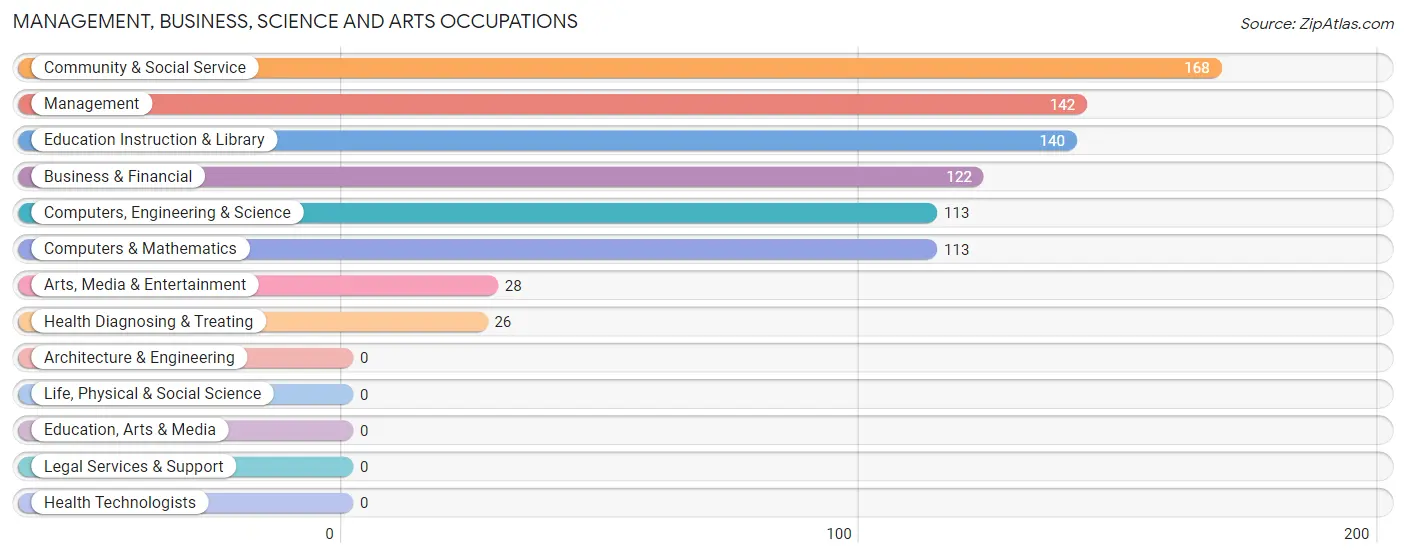
Management, Business, Science and Arts Occupations
The most common Management, Business, Science and Arts occupations in Bon Secour are Community & Social Service (168 | 10.1%), Management (142 | 8.5%), Education Instruction & Library (140 | 8.4%), Business & Financial (122 | 7.3%), and Computers, Engineering & Science (113 | 6.8%).
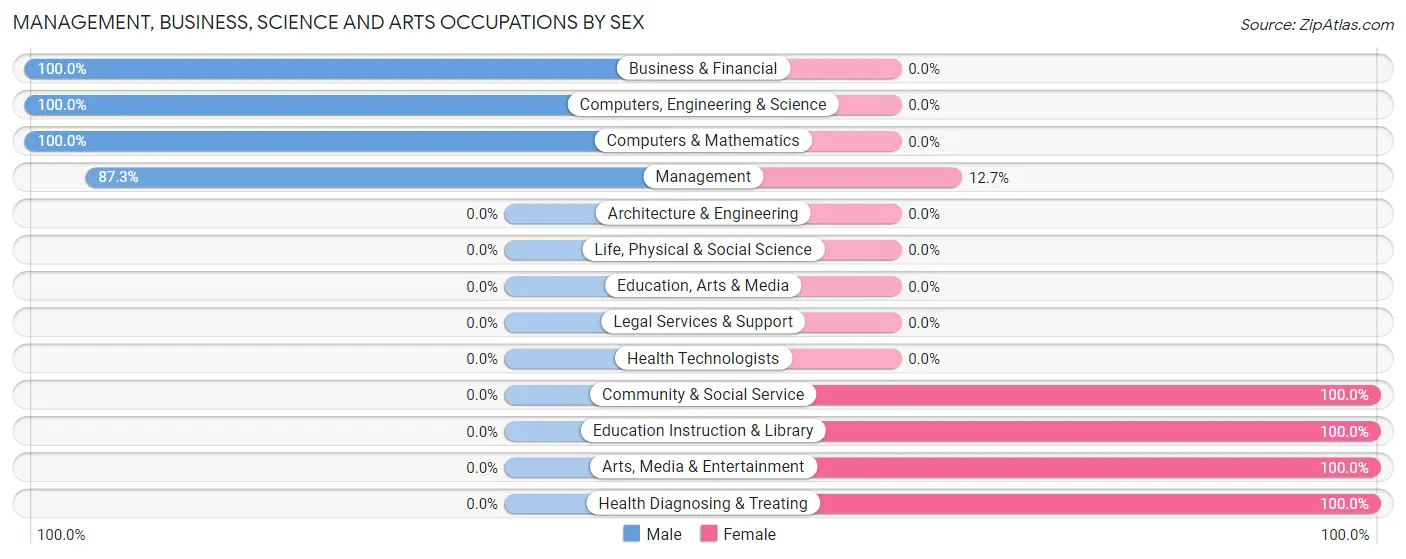
Management, Business, Science and Arts Occupations by Sex
Within the Management, Business, Science and Arts occupations in Bon Secour, the most male-oriented occupations are Business & Financial (100.0%), Computers, Engineering & Science (100.0%), and Computers & Mathematics (100.0%), while the most female-oriented occupations are Community & Social Service (100.0%), Education Instruction & Library (100.0%), and Arts, Media & Entertainment (100.0%).
| Occupation | Male | Female |
| Management | 124 (87.3%) | 18 (12.7%) |
| Business & Financial | 122 (100.0%) | 0 (0.0%) |
| Computers, Engineering & Science | 113 (100.0%) | 0 (0.0%) |
| Computers & Mathematics | 113 (100.0%) | 0 (0.0%) |
| Architecture & Engineering | 0 (0.0%) | 0 (0.0%) |
| Life, Physical & Social Science | 0 (0.0%) | 0 (0.0%) |
| Community & Social Service | 0 (0.0%) | 168 (100.0%) |
| Education, Arts & Media | 0 (0.0%) | 0 (0.0%) |
| Legal Services & Support | 0 (0.0%) | 0 (0.0%) |
| Education Instruction & Library | 0 (0.0%) | 140 (100.0%) |
| Arts, Media & Entertainment | 0 (0.0%) | 28 (100.0%) |
| Health Diagnosing & Treating | 0 (0.0%) | 26 (100.0%) |
| Health Technologists | 0 (0.0%) | 0 (0.0%) |
| Total (Category) | 359 (62.9%) | 212 (37.1%) |
| Total (Overall) | 1,242 (74.6%) | 424 (25.5%) |
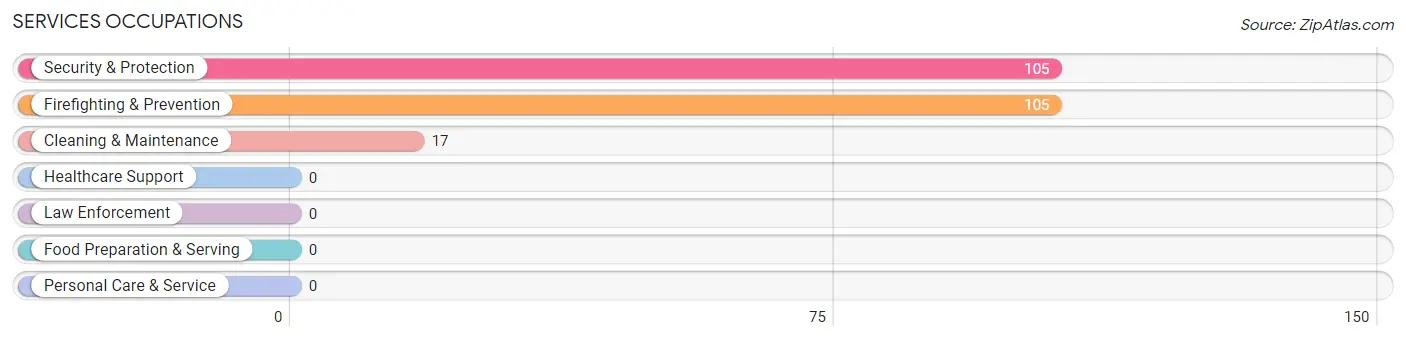
Services Occupations
The most common Services occupations in Bon Secour are Security & Protection (105 | 6.3%), Firefighting & Prevention (105 | 6.3%), and Cleaning & Maintenance (17 | 1.0%).
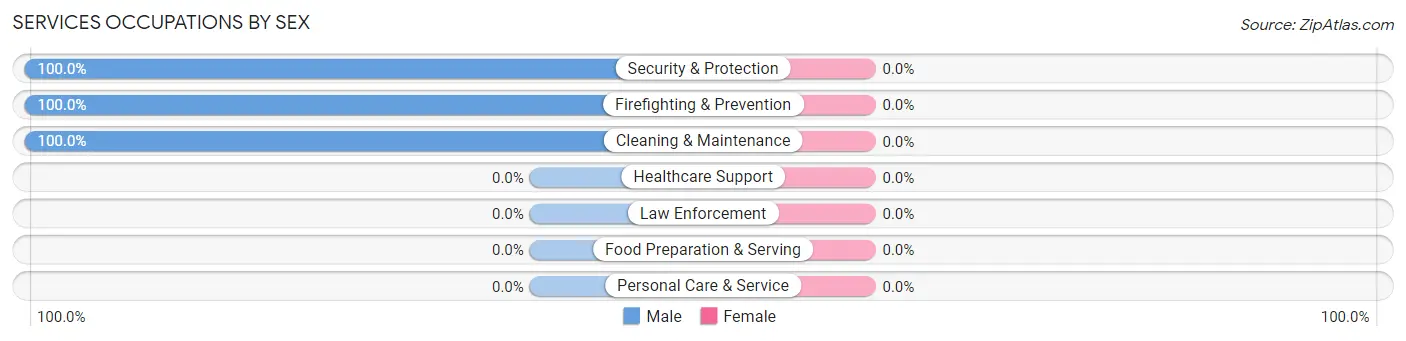
Services Occupations by Sex
| Occupation | Male | Female |
| Healthcare Support | 0 (0.0%) | 0 (0.0%) |
| Security & Protection | 105 (100.0%) | 0 (0.0%) |
| Firefighting & Prevention | 105 (100.0%) | 0 (0.0%) |
| Law Enforcement | 0 (0.0%) | 0 (0.0%) |
| Food Preparation & Serving | 0 (0.0%) | 0 (0.0%) |
| Cleaning & Maintenance | 17 (100.0%) | 0 (0.0%) |
| Personal Care & Service | 0 (0.0%) | 0 (0.0%) |
| Total (Category) | 122 (100.0%) | 0 (0.0%) |
| Total (Overall) | 1,242 (74.6%) | 424 (25.5%) |
Sales and Office Occupations
The most common Sales and Office occupations in Bon Secour are Sales & Related (260 | 15.6%), and Office & Administration (56 | 3.4%).
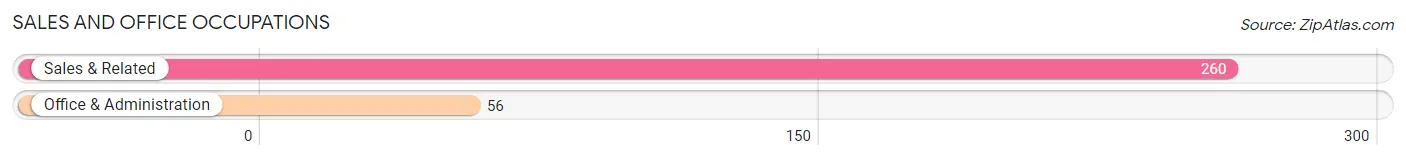
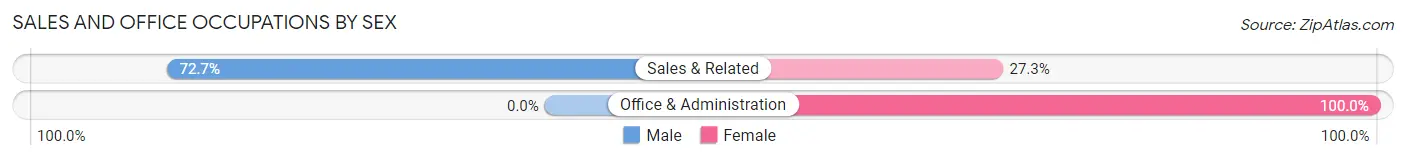
Sales and Office Occupations by Sex
| Occupation | Male | Female |
| Sales & Related | 189 (72.7%) | 71 (27.3%) |
| Office & Administration | 0 (0.0%) | 56 (100.0%) |
| Total (Category) | 189 (59.8%) | 127 (40.2%) |
| Total (Overall) | 1,242 (74.6%) | 424 (25.5%) |
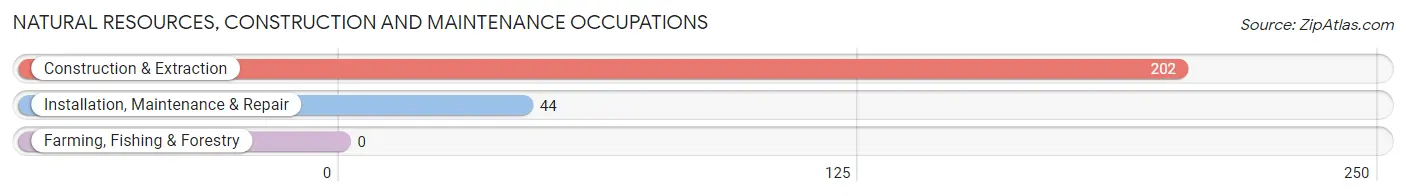
Natural Resources, Construction and Maintenance Occupations
The most common Natural Resources, Construction and Maintenance occupations in Bon Secour are Construction & Extraction (202 | 12.1%), and Installation, Maintenance & Repair (44 | 2.6%).
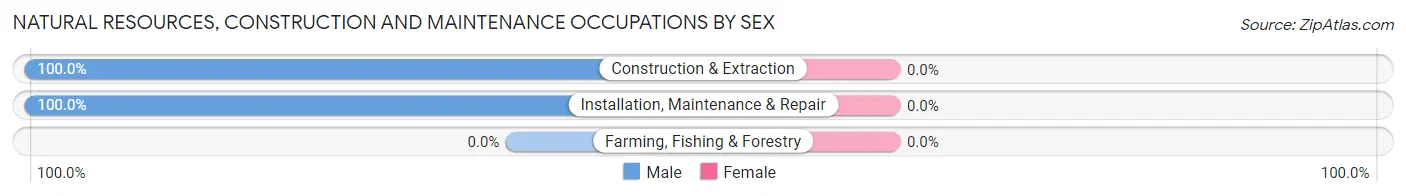
Natural Resources, Construction and Maintenance Occupations by Sex
| Occupation | Male | Female |
| Farming, Fishing & Forestry | 0 (0.0%) | 0 (0.0%) |
| Construction & Extraction | 202 (100.0%) | 0 (0.0%) |
| Installation, Maintenance & Repair | 44 (100.0%) | 0 (0.0%) |
| Total (Category) | 246 (100.0%) | 0 (0.0%) |
| Total (Overall) | 1,242 (74.6%) | 424 (25.5%) |
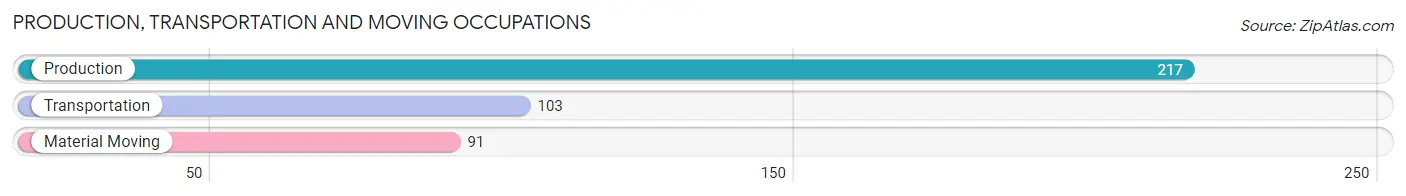
Production, Transportation and Moving Occupations
The most common Production, Transportation and Moving occupations in Bon Secour are Production (217 | 13.0%), Transportation (103 | 6.2%), and Material Moving (91 | 5.5%).
Production, Transportation and Moving Occupations by Sex
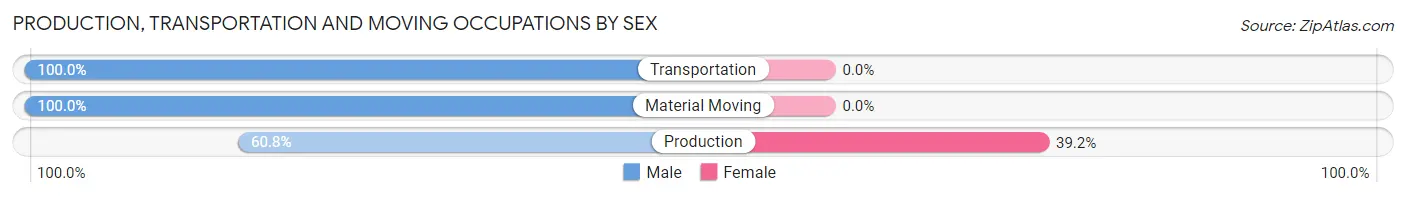
| Occupation | Male | Female |
| Production | 132 (60.8%) | 85 (39.2%) |
| Transportation | 103 (100.0%) | 0 (0.0%) |
| Material Moving | 91 (100.0%) | 0 (0.0%) |
| Total (Category) | 326 (79.3%) | 85 (20.7%) |
| Total (Overall) | 1,242 (74.6%) | 424 (25.5%) |
Employment Industries by Sex in Bon Secour
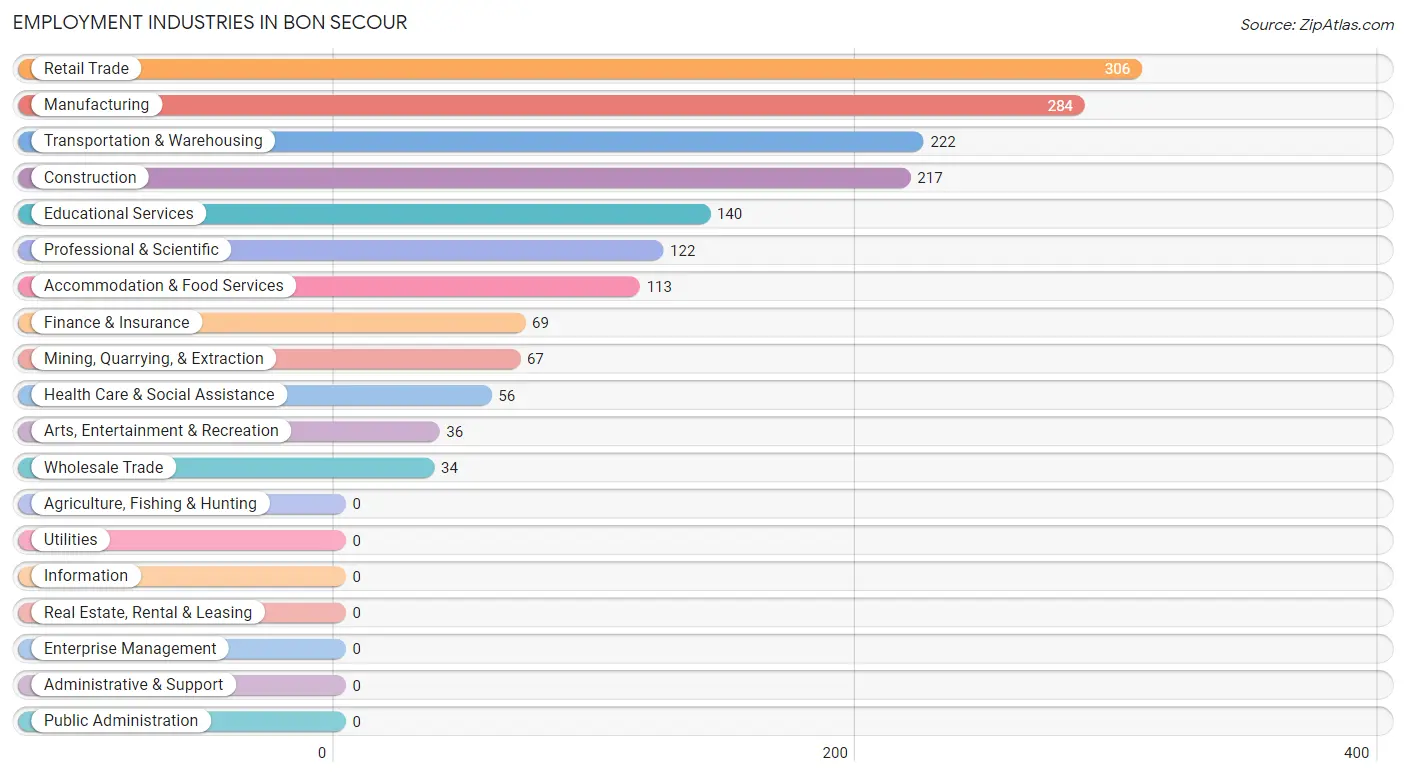
Employment Industries in Bon Secour
The major employment industries in Bon Secour include Retail Trade (306 | 18.4%), Manufacturing (284 | 17.1%), Transportation & Warehousing (222 | 13.3%), Construction (217 | 13.0%), and Educational Services (140 | 8.4%).
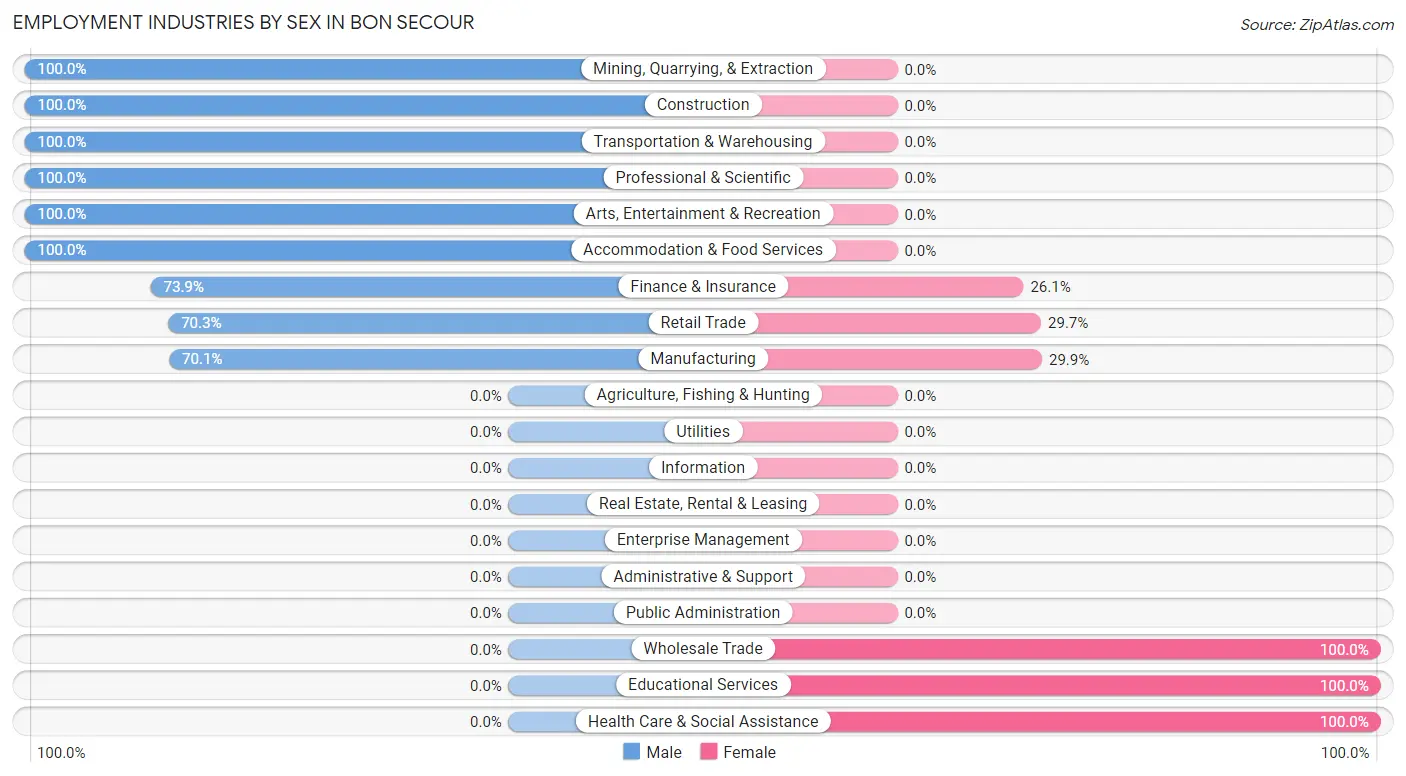
Employment Industries by Sex in Bon Secour
The Bon Secour industries that see more men than women are Mining, Quarrying, & Extraction (100.0%), Construction (100.0%), and Transportation & Warehousing (100.0%), whereas the industries that tend to have a higher number of women are Wholesale Trade (100.0%), Educational Services (100.0%), and Health Care & Social Assistance (100.0%).
| Industry | Male | Female |
| Agriculture, Fishing & Hunting | 0 (0.0%) | 0 (0.0%) |
| Mining, Quarrying, & Extraction | 67 (100.0%) | 0 (0.0%) |
| Construction | 217 (100.0%) | 0 (0.0%) |
| Manufacturing | 199 (70.1%) | 85 (29.9%) |
| Wholesale Trade | 0 (0.0%) | 34 (100.0%) |
| Retail Trade | 215 (70.3%) | 91 (29.7%) |
| Transportation & Warehousing | 222 (100.0%) | 0 (0.0%) |
| Utilities | 0 (0.0%) | 0 (0.0%) |
| Information | 0 (0.0%) | 0 (0.0%) |
| Finance & Insurance | 51 (73.9%) | 18 (26.1%) |
| Real Estate, Rental & Leasing | 0 (0.0%) | 0 (0.0%) |
| Professional & Scientific | 122 (100.0%) | 0 (0.0%) |
| Enterprise Management | 0 (0.0%) | 0 (0.0%) |
| Administrative & Support | 0 (0.0%) | 0 (0.0%) |
| Educational Services | 0 (0.0%) | 140 (100.0%) |
| Health Care & Social Assistance | 0 (0.0%) | 56 (100.0%) |
| Arts, Entertainment & Recreation | 36 (100.0%) | 0 (0.0%) |
| Accommodation & Food Services | 113 (100.0%) | 0 (0.0%) |
| Public Administration | 0 (0.0%) | 0 (0.0%) |
| Total | 1,242 (74.6%) | 424 (25.5%) |
Education in Bon Secour
School Enrollment in Bon Secour
The most common levels of schooling among the 394 students in Bon Secour are elementary school (152 | 38.6%), middle school (125 | 31.7%), and college / undergraduate (117 | 29.7%).
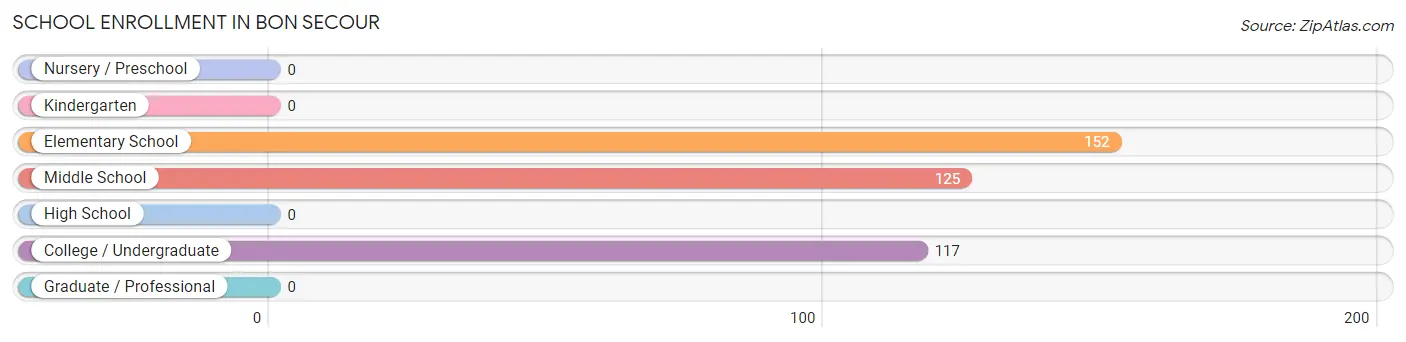
| School Level | # Students | % Students |
| Nursery / Preschool | 0 | 0.0% |
| Kindergarten | 0 | 0.0% |
| Elementary School | 152 | 38.6% |
| Middle School | 125 | 31.7% |
| High School | 0 | 0.0% |
| College / Undergraduate | 117 | 29.7% |
| Graduate / Professional | 0 | 0.0% |
| Total | 394 | 100.0% |
School Enrollment by Age by Funding Source in Bon Secour
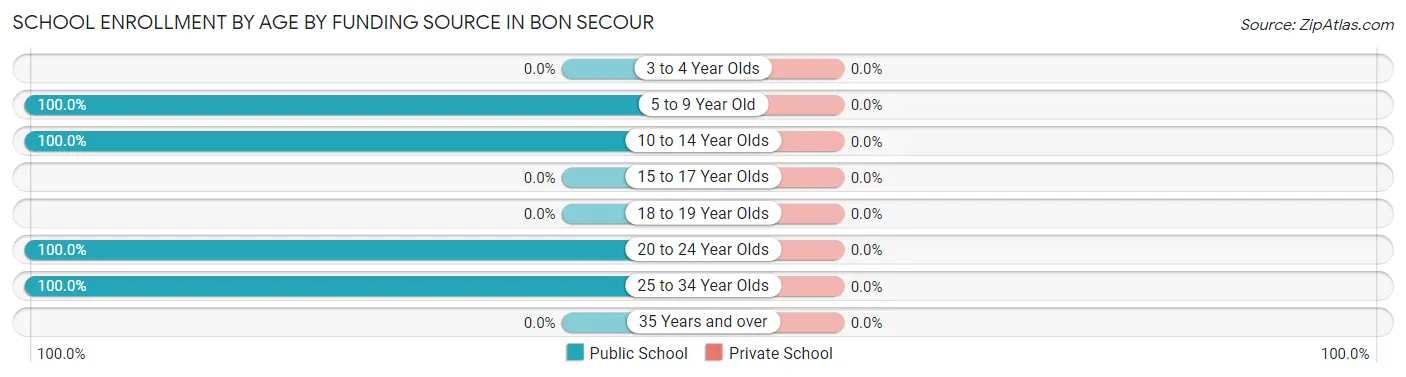
| Age Bracket | Public School | Private School |
| 3 to 4 Year Olds | 0 (0.0%) | 0 (0.0%) |
| 5 to 9 Year Old | 114 (100.0%) | 0 (0.0%) |
| 10 to 14 Year Olds | 163 (100.0%) | 0 (0.0%) |
| 15 to 17 Year Olds | 0 (0.0%) | 0 (0.0%) |
| 18 to 19 Year Olds | 0 (0.0%) | 0 (0.0%) |
| 20 to 24 Year Olds | 66 (100.0%) | 0 (0.0%) |
| 25 to 34 Year Olds | 51 (100.0%) | 0 (0.0%) |
| 35 Years and over | 0 (0.0%) | 0 (0.0%) |
| Total | 394 (100.0%) | 0 (0.0%) |
Educational Attainment by Field of Study in Bon Secour
Business (355 | 44.5%), engineering (131 | 16.4%), social sciences (130 | 16.3%), arts & humanities (70 | 8.8%), and science & technology (44 | 5.5%) are the most common fields of study among 798 individuals in Bon Secour who have obtained a bachelor's degree or higher.
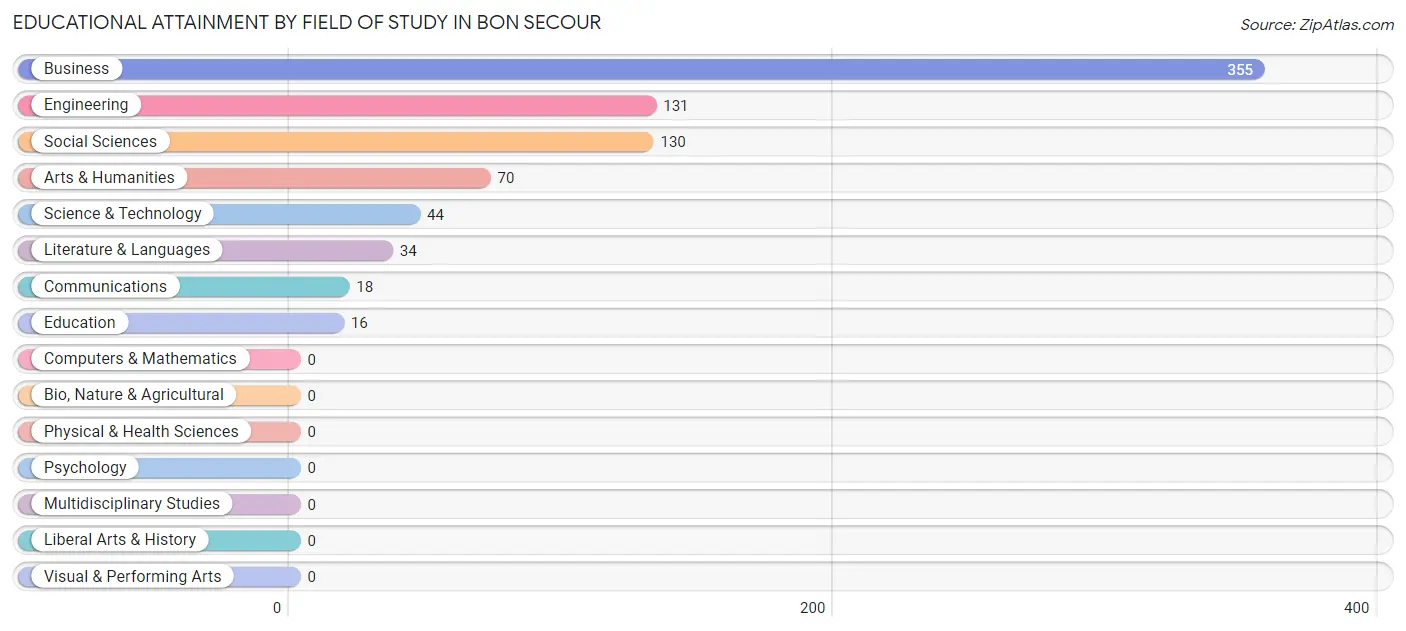
| Field of Study | # Graduates | % Graduates |
| Computers & Mathematics | 0 | 0.0% |
| Bio, Nature & Agricultural | 0 | 0.0% |
| Physical & Health Sciences | 0 | 0.0% |
| Psychology | 0 | 0.0% |
| Social Sciences | 130 | 16.3% |
| Engineering | 131 | 16.4% |
| Multidisciplinary Studies | 0 | 0.0% |
| Science & Technology | 44 | 5.5% |
| Business | 355 | 44.5% |
| Education | 16 | 2.0% |
| Literature & Languages | 34 | 4.3% |
| Liberal Arts & History | 0 | 0.0% |
| Visual & Performing Arts | 0 | 0.0% |
| Communications | 18 | 2.3% |
| Arts & Humanities | 70 | 8.8% |
| Total | 798 | 100.0% |
Transportation & Commute in Bon Secour
Vehicle Availability by Sex in Bon Secour
The most prevalent vehicle ownership categories in Bon Secour are males with 3 vehicles (821, accounting for 66.1%) and females with 3 vehicles (18, making up 193.6%).
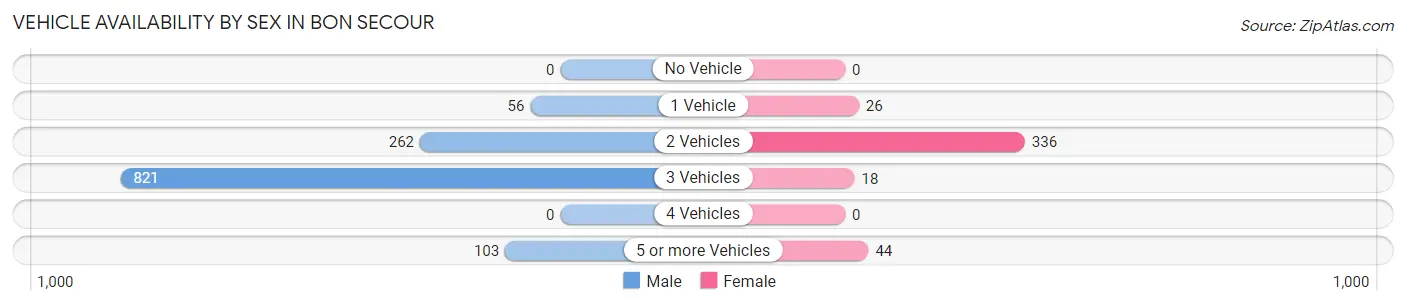
| Vehicles Available | Male | Female |
| No Vehicle | 0 (0.0%) | 0 (0.0%) |
| 1 Vehicle | 56 (4.5%) | 26 (6.1%) |
| 2 Vehicles | 262 (21.1%) | 336 (79.2%) |
| 3 Vehicles | 821 (66.1%) | 18 (4.3%) |
| 4 Vehicles | 0 (0.0%) | 0 (0.0%) |
| 5 or more Vehicles | 103 (8.3%) | 44 (10.4%) |
| Total | 1,242 (100.0%) | 424 (100.0%) |
Commute Time in Bon Secour
The most frequently occuring commute durations in Bon Secour are 15 to 19 minutes (456 commuters, 27.4%), 45 to 59 minutes (419 commuters, 25.2%), and 25 to 29 minutes (212 commuters, 12.7%).
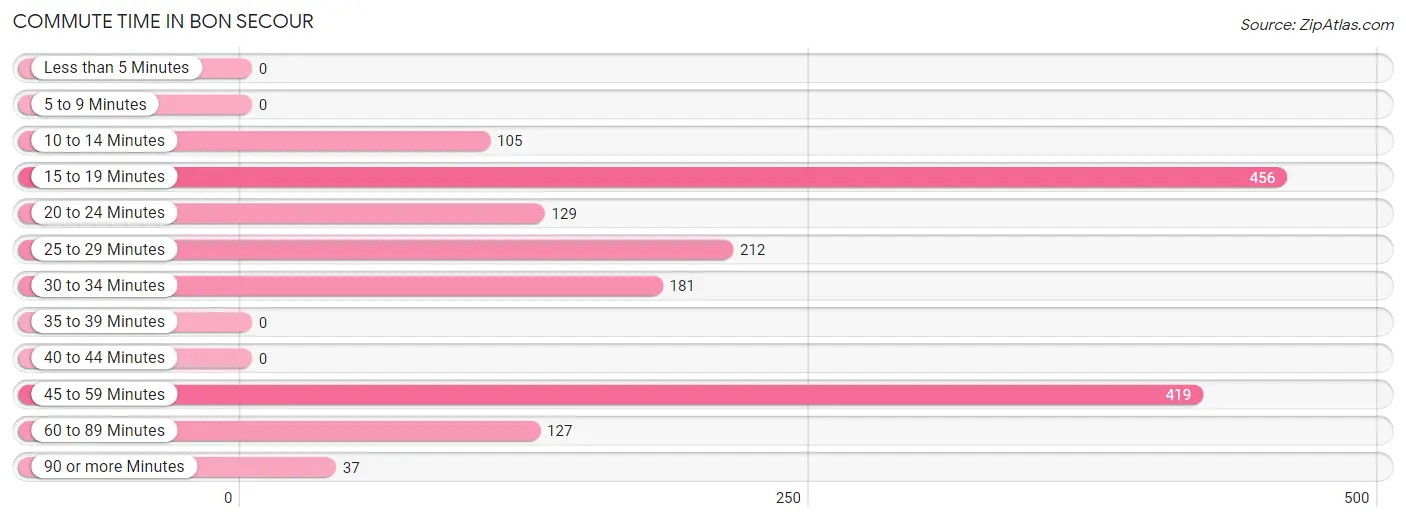
| Commute Time | # Commuters | % Commuters |
| Less than 5 Minutes | 0 | 0.0% |
| 5 to 9 Minutes | 0 | 0.0% |
| 10 to 14 Minutes | 105 | 6.3% |
| 15 to 19 Minutes | 456 | 27.4% |
| 20 to 24 Minutes | 129 | 7.7% |
| 25 to 29 Minutes | 212 | 12.7% |
| 30 to 34 Minutes | 181 | 10.9% |
| 35 to 39 Minutes | 0 | 0.0% |
| 40 to 44 Minutes | 0 | 0.0% |
| 45 to 59 Minutes | 419 | 25.2% |
| 60 to 89 Minutes | 127 | 7.6% |
| 90 or more Minutes | 37 | 2.2% |
Commute Time by Sex in Bon Secour
The most common commute times in Bon Secour are 45 to 59 minutes (419 commuters, 33.7%) for males and 30 to 34 minutes (181 commuters, 42.7%) for females.
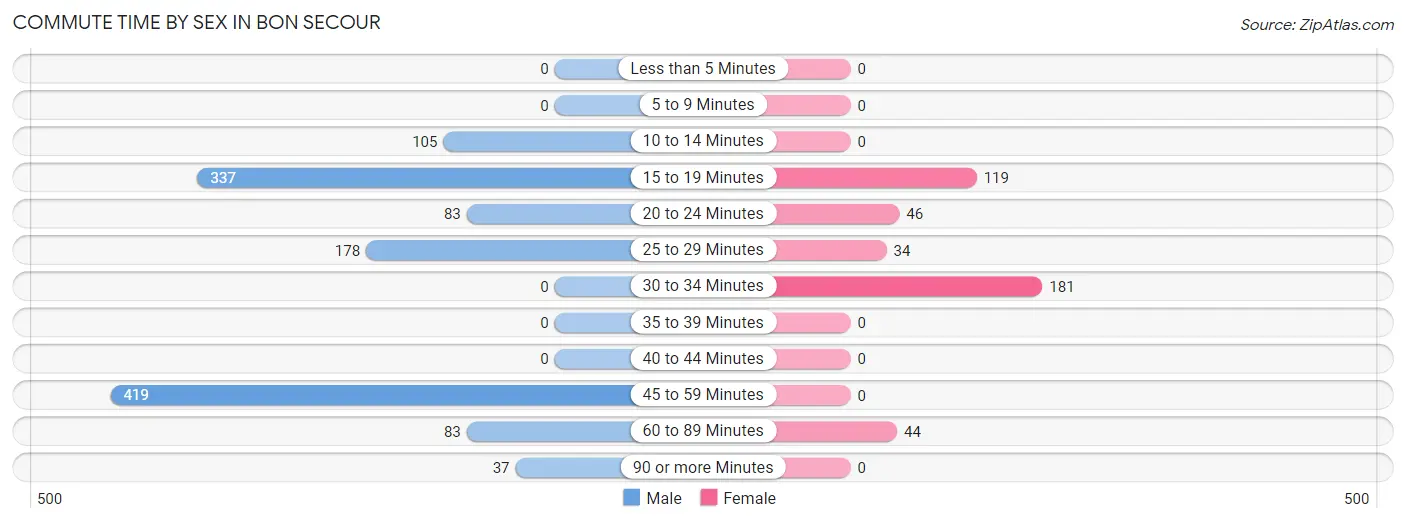
| Commute Time | Male | Female |
| Less than 5 Minutes | 0 (0.0%) | 0 (0.0%) |
| 5 to 9 Minutes | 0 (0.0%) | 0 (0.0%) |
| 10 to 14 Minutes | 105 (8.5%) | 0 (0.0%) |
| 15 to 19 Minutes | 337 (27.1%) | 119 (28.1%) |
| 20 to 24 Minutes | 83 (6.7%) | 46 (10.8%) |
| 25 to 29 Minutes | 178 (14.3%) | 34 (8.0%) |
| 30 to 34 Minutes | 0 (0.0%) | 181 (42.7%) |
| 35 to 39 Minutes | 0 (0.0%) | 0 (0.0%) |
| 40 to 44 Minutes | 0 (0.0%) | 0 (0.0%) |
| 45 to 59 Minutes | 419 (33.7%) | 0 (0.0%) |
| 60 to 89 Minutes | 83 (6.7%) | 44 (10.4%) |
| 90 or more Minutes | 37 (3.0%) | 0 (0.0%) |
Time of Departure to Work by Sex in Bon Secour
The most frequent times of departure to work in Bon Secour are 7:00 AM to 7:29 AM (361, 29.1%) for males and 7:00 AM to 7:29 AM (171, 40.3%) for females.
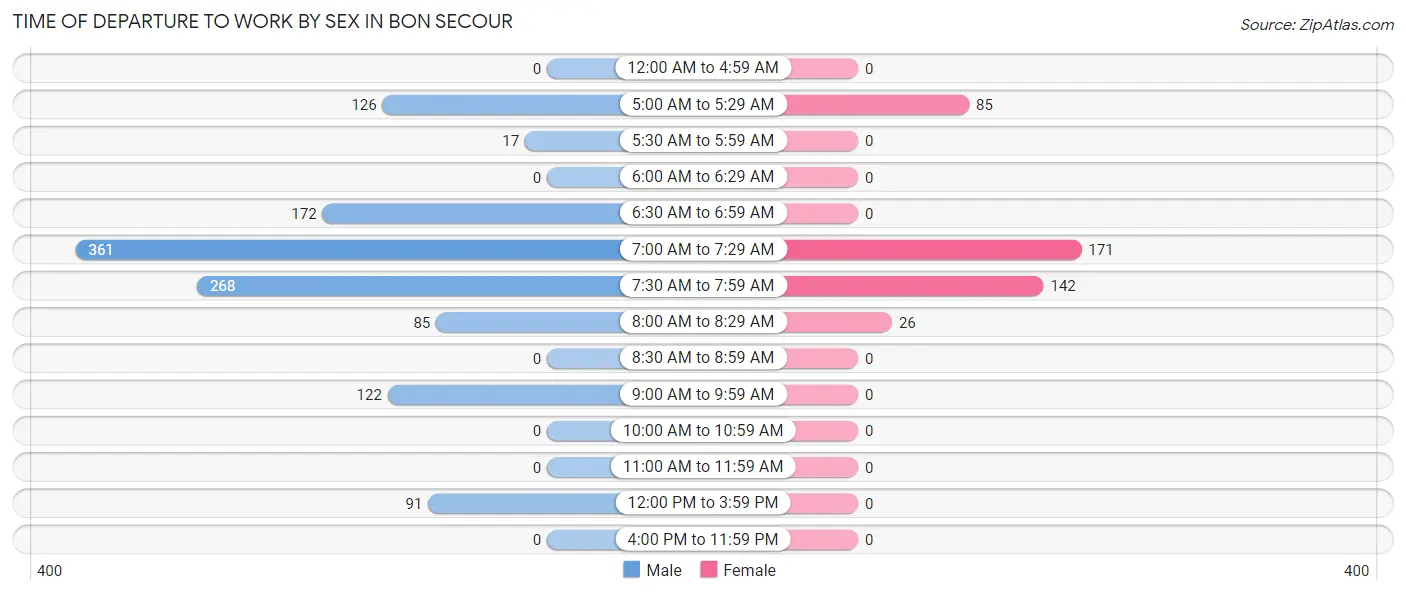
| Time of Departure | Male | Female |
| 12:00 AM to 4:59 AM | 0 (0.0%) | 0 (0.0%) |
| 5:00 AM to 5:29 AM | 126 (10.1%) | 85 (20.1%) |
| 5:30 AM to 5:59 AM | 17 (1.4%) | 0 (0.0%) |
| 6:00 AM to 6:29 AM | 0 (0.0%) | 0 (0.0%) |
| 6:30 AM to 6:59 AM | 172 (13.9%) | 0 (0.0%) |
| 7:00 AM to 7:29 AM | 361 (29.1%) | 171 (40.3%) |
| 7:30 AM to 7:59 AM | 268 (21.6%) | 142 (33.5%) |
| 8:00 AM to 8:29 AM | 85 (6.8%) | 26 (6.1%) |
| 8:30 AM to 8:59 AM | 0 (0.0%) | 0 (0.0%) |
| 9:00 AM to 9:59 AM | 122 (9.8%) | 0 (0.0%) |
| 10:00 AM to 10:59 AM | 0 (0.0%) | 0 (0.0%) |
| 11:00 AM to 11:59 AM | 0 (0.0%) | 0 (0.0%) |
| 12:00 PM to 3:59 PM | 91 (7.3%) | 0 (0.0%) |
| 4:00 PM to 11:59 PM | 0 (0.0%) | 0 (0.0%) |
| Total | 1,242 (100.0%) | 424 (100.0%) |
Housing Occupancy in Bon Secour
Occupancy by Ownership in Bon Secour
Of the total 908 dwellings in Bon Secour, owner-occupied units account for 797 (87.8%), while renter-occupied units make up 111 (12.2%).
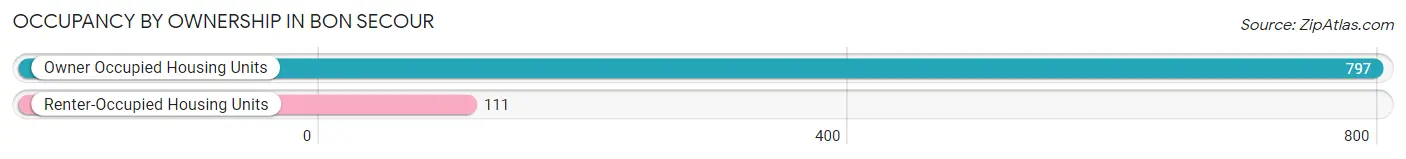
| Occupancy | # Housing Units | % Housing Units |
| Owner Occupied Housing Units | 797 | 87.8% |
| Renter-Occupied Housing Units | 111 | 12.2% |
| Total Occupied Housing Units | 908 | 100.0% |
Occupancy by Household Size in Bon Secour
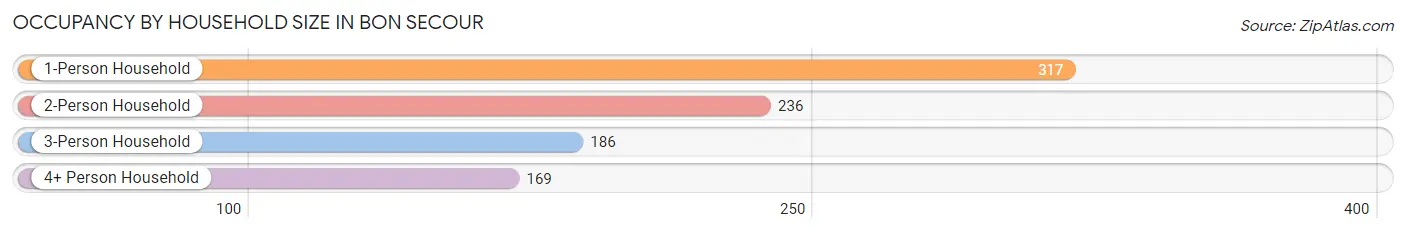
| Household Size | # Housing Units | % Housing Units |
| 1-Person Household | 317 | 34.9% |
| 2-Person Household | 236 | 26.0% |
| 3-Person Household | 186 | 20.5% |
| 4+ Person Household | 169 | 18.6% |
| Total Housing Units | 908 | 100.0% |
Occupancy by Ownership by Household Size in Bon Secour
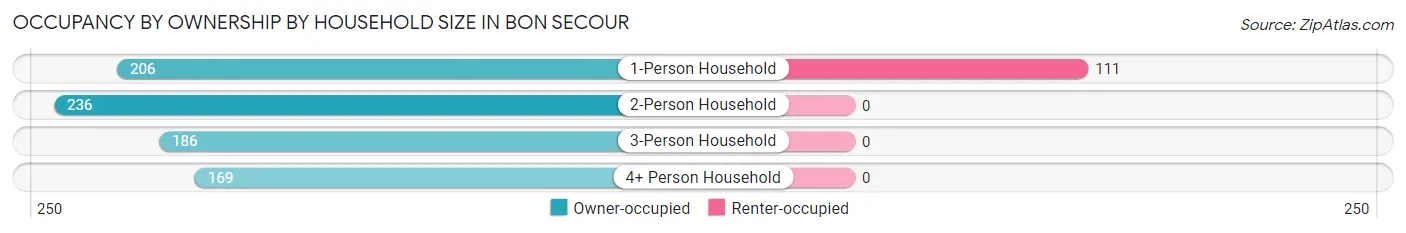
| Household Size | Owner-occupied | Renter-occupied |
| 1-Person Household | 206 (65.0%) | 111 (35.0%) |
| 2-Person Household | 236 (100.0%) | 0 (0.0%) |
| 3-Person Household | 186 (100.0%) | 0 (0.0%) |
| 4+ Person Household | 169 (100.0%) | 0 (0.0%) |
| Total Housing Units | 797 (87.8%) | 111 (12.2%) |
Occupancy by Educational Attainment in Bon Secour
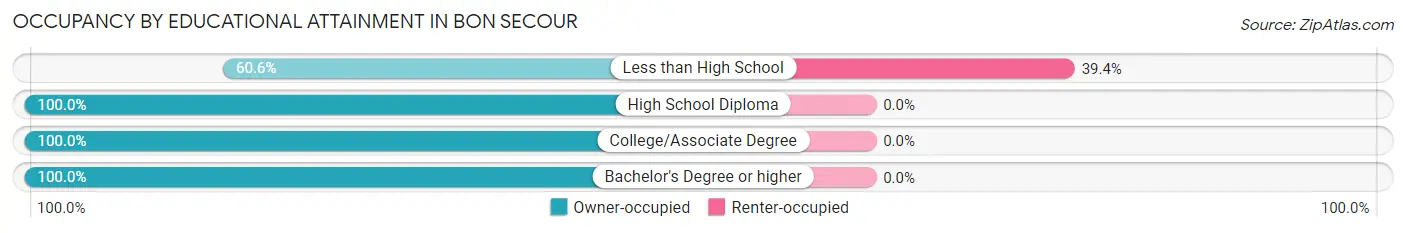
| Household Size | Owner-occupied | Renter-occupied |
| Less than High School | 171 (60.6%) | 111 (39.4%) |
| High School Diploma | 225 (100.0%) | 0 (0.0%) |
| College/Associate Degree | 205 (100.0%) | 0 (0.0%) |
| Bachelor's Degree or higher | 196 (100.0%) | 0 (0.0%) |
Occupancy by Age of Householder in Bon Secour
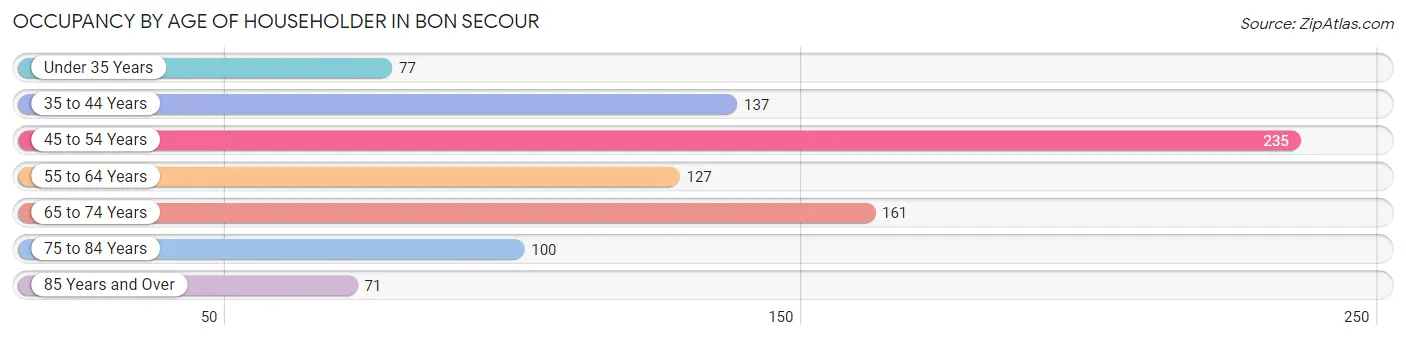
| Age Bracket | # Households | % Households |
| Under 35 Years | 77 | 8.5% |
| 35 to 44 Years | 137 | 15.1% |
| 45 to 54 Years | 235 | 25.9% |
| 55 to 64 Years | 127 | 14.0% |
| 65 to 74 Years | 161 | 17.7% |
| 75 to 84 Years | 100 | 11.0% |
| 85 Years and Over | 71 | 7.8% |
| Total | 908 | 100.0% |
Housing Finances in Bon Secour
Median Income by Occupancy in Bon Secour
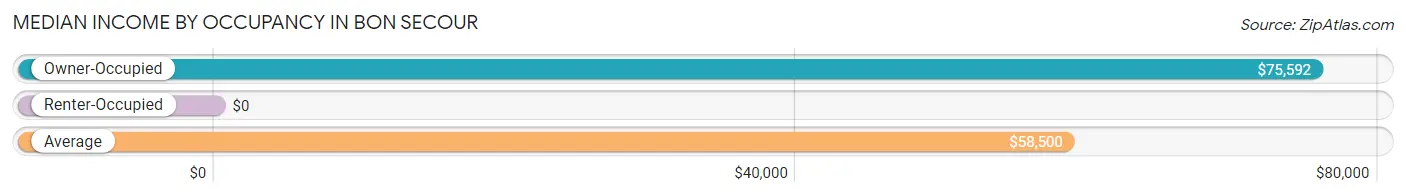
| Occupancy Type | # Households | Median Income |
| Owner-Occupied | 797 (87.8%) | $75,592 |
| Renter-Occupied | 111 (12.2%) | $0 |
| Average | 908 (100.0%) | $58,500 |
Occupancy by Householder Income Bracket in Bon Secour
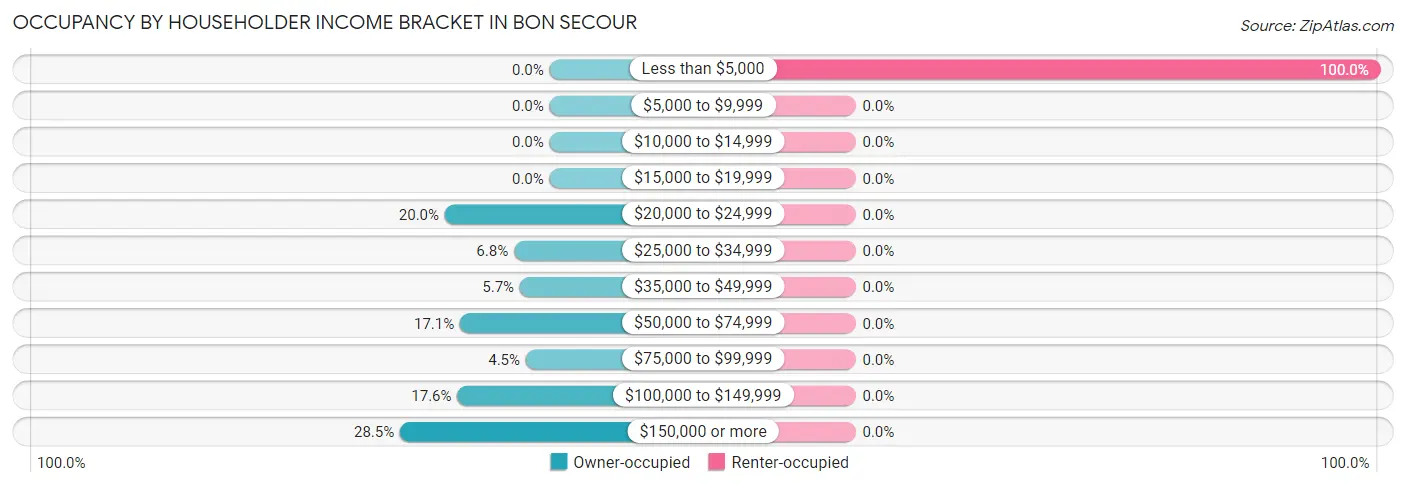
| Income Bracket | Owner-occupied | Renter-occupied |
| Less than $5,000 | 0 (0.0%) | 111 (100.0%) |
| $5,000 to $9,999 | 0 (0.0%) | 0 (0.0%) |
| $10,000 to $14,999 | 0 (0.0%) | 0 (0.0%) |
| $15,000 to $19,999 | 0 (0.0%) | 0 (0.0%) |
| $20,000 to $24,999 | 159 (20.0%) | 0 (0.0%) |
| $25,000 to $34,999 | 54 (6.8%) | 0 (0.0%) |
| $35,000 to $49,999 | 45 (5.7%) | 0 (0.0%) |
| $50,000 to $74,999 | 136 (17.1%) | 0 (0.0%) |
| $75,000 to $99,999 | 36 (4.5%) | 0 (0.0%) |
| $100,000 to $149,999 | 140 (17.6%) | 0 (0.0%) |
| $150,000 or more | 227 (28.5%) | 0 (0.0%) |
| Total | 797 (100.0%) | 111 (100.0%) |
Monthly Housing Cost Tiers in Bon Secour
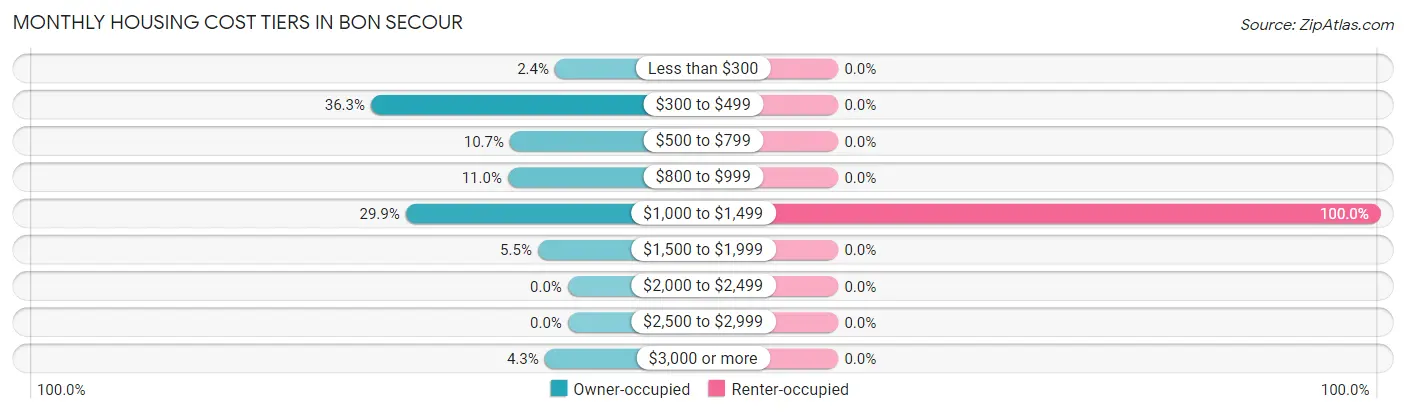
| Monthly Cost | Owner-occupied | Renter-occupied |
| Less than $300 | 19 (2.4%) | 0 (0.0%) |
| $300 to $499 | 289 (36.3%) | 0 (0.0%) |
| $500 to $799 | 85 (10.7%) | 0 (0.0%) |
| $800 to $999 | 88 (11.0%) | 0 (0.0%) |
| $1,000 to $1,499 | 238 (29.9%) | 111 (100.0%) |
| $1,500 to $1,999 | 44 (5.5%) | 0 (0.0%) |
| $2,000 to $2,499 | 0 (0.0%) | 0 (0.0%) |
| $2,500 to $2,999 | 0 (0.0%) | 0 (0.0%) |
| $3,000 or more | 34 (4.3%) | 0 (0.0%) |
| Total | 797 (100.0%) | 111 (100.0%) |
Physical Housing Characteristics in Bon Secour
Housing Structures in Bon Secour
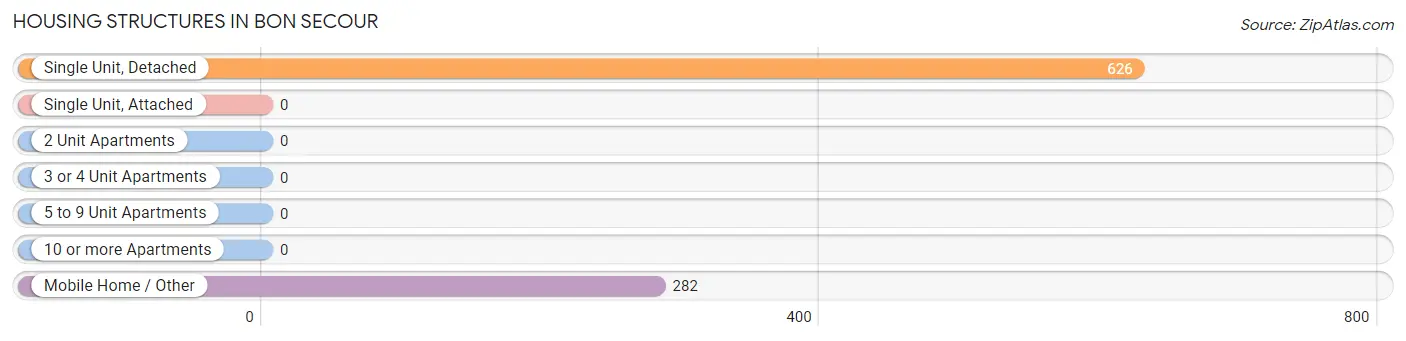
| Structure Type | # Housing Units | % Housing Units |
| Single Unit, Detached | 626 | 68.9% |
| Single Unit, Attached | 0 | 0.0% |
| 2 Unit Apartments | 0 | 0.0% |
| 3 or 4 Unit Apartments | 0 | 0.0% |
| 5 to 9 Unit Apartments | 0 | 0.0% |
| 10 or more Apartments | 0 | 0.0% |
| Mobile Home / Other | 282 | 31.1% |
| Total | 908 | 100.0% |
Housing Structures by Occupancy in Bon Secour
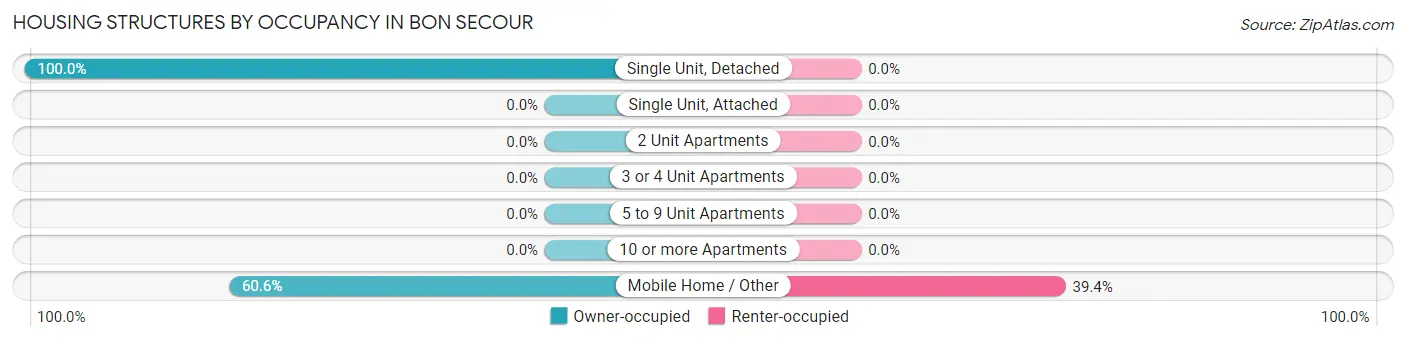
| Structure Type | Owner-occupied | Renter-occupied |
| Single Unit, Detached | 626 (100.0%) | 0 (0.0%) |
| Single Unit, Attached | 0 (0.0%) | 0 (0.0%) |
| 2 Unit Apartments | 0 (0.0%) | 0 (0.0%) |
| 3 or 4 Unit Apartments | 0 (0.0%) | 0 (0.0%) |
| 5 to 9 Unit Apartments | 0 (0.0%) | 0 (0.0%) |
| 10 or more Apartments | 0 (0.0%) | 0 (0.0%) |
| Mobile Home / Other | 171 (60.6%) | 111 (39.4%) |
| Total | 797 (87.8%) | 111 (12.2%) |
Housing Structures by Number of Rooms in Bon Secour
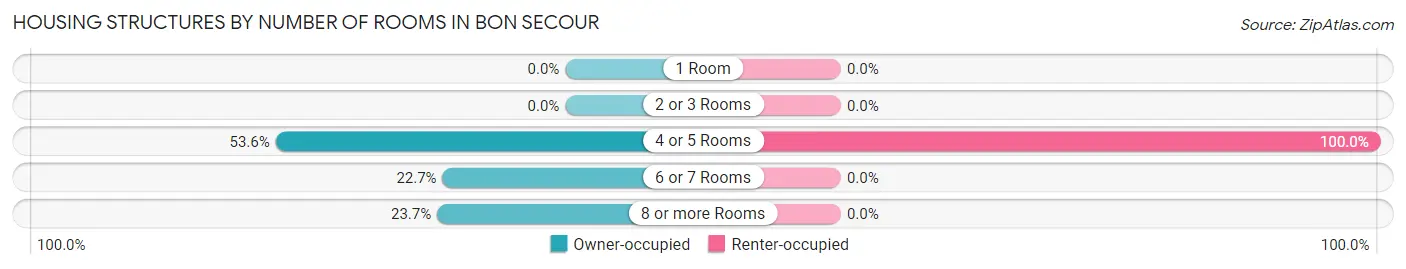
| Number of Rooms | Owner-occupied | Renter-occupied |
| 1 Room | 0 (0.0%) | 0 (0.0%) |
| 2 or 3 Rooms | 0 (0.0%) | 0 (0.0%) |
| 4 or 5 Rooms | 427 (53.6%) | 111 (100.0%) |
| 6 or 7 Rooms | 181 (22.7%) | 0 (0.0%) |
| 8 or more Rooms | 189 (23.7%) | 0 (0.0%) |
| Total | 797 (100.0%) | 111 (100.0%) |
Housing Structure by Heating Type in Bon Secour
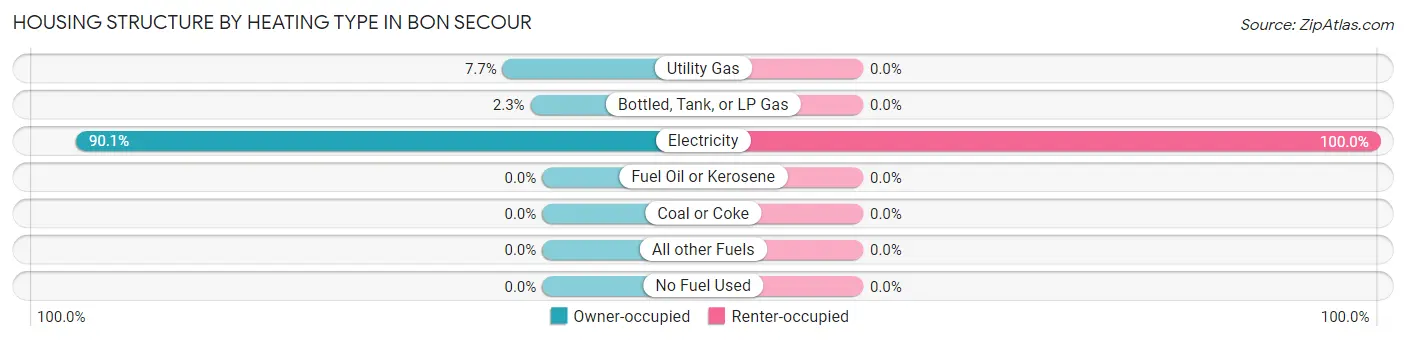
| Heating Type | Owner-occupied | Renter-occupied |
| Utility Gas | 61 (7.6%) | 0 (0.0%) |
| Bottled, Tank, or LP Gas | 18 (2.3%) | 0 (0.0%) |
| Electricity | 718 (90.1%) | 111 (100.0%) |
| Fuel Oil or Kerosene | 0 (0.0%) | 0 (0.0%) |
| Coal or Coke | 0 (0.0%) | 0 (0.0%) |
| All other Fuels | 0 (0.0%) | 0 (0.0%) |
| No Fuel Used | 0 (0.0%) | 0 (0.0%) |
| Total | 797 (100.0%) | 111 (100.0%) |
Household Vehicle Usage in Bon Secour
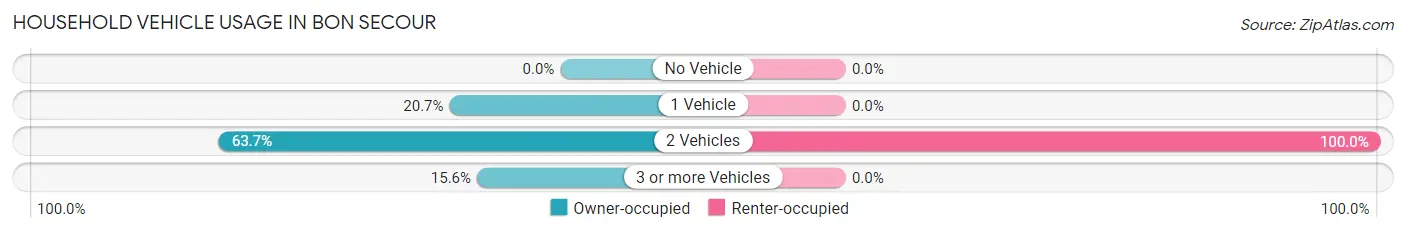
| Vehicles per Household | Owner-occupied | Renter-occupied |
| No Vehicle | 0 (0.0%) | 0 (0.0%) |
| 1 Vehicle | 165 (20.7%) | 0 (0.0%) |
| 2 Vehicles | 508 (63.7%) | 111 (100.0%) |
| 3 or more Vehicles | 124 (15.6%) | 0 (0.0%) |
| Total | 797 (100.0%) | 111 (100.0%) |
Real Estate & Mortgages in Bon Secour
Real Estate and Mortgage Overview in Bon Secour
| Characteristic | Without Mortgage | With Mortgage |
| Housing Units | 482 | 315 |
| Median Property Value | - | - |
| Median Household Income | $59,000 | $124 |
| Monthly Housing Costs | $431 | $34 |
| Real Estate Taxes | $562 | $153 |
Property Value by Mortgage Status in Bon Secour
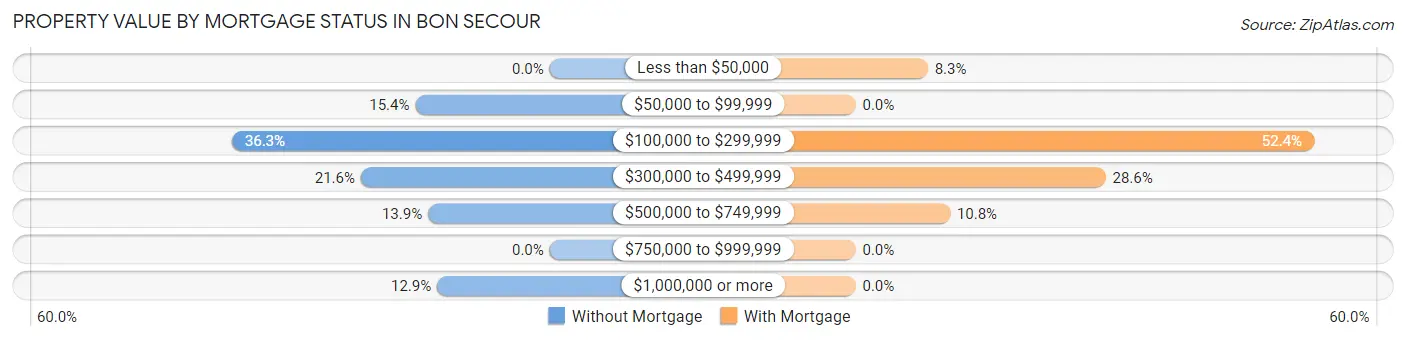
| Property Value | Without Mortgage | With Mortgage |
| Less than $50,000 | 0 (0.0%) | 26 (8.3%) |
| $50,000 to $99,999 | 74 (15.3%) | 0 (0.0%) |
| $100,000 to $299,999 | 175 (36.3%) | 165 (52.4%) |
| $300,000 to $499,999 | 104 (21.6%) | 90 (28.6%) |
| $500,000 to $749,999 | 67 (13.9%) | 34 (10.8%) |
| $750,000 to $999,999 | 0 (0.0%) | 0 (0.0%) |
| $1,000,000 or more | 62 (12.9%) | 0 (0.0%) |
| Total | 482 (100.0%) | 315 (100.0%) |
Household Income by Mortgage Status in Bon Secour
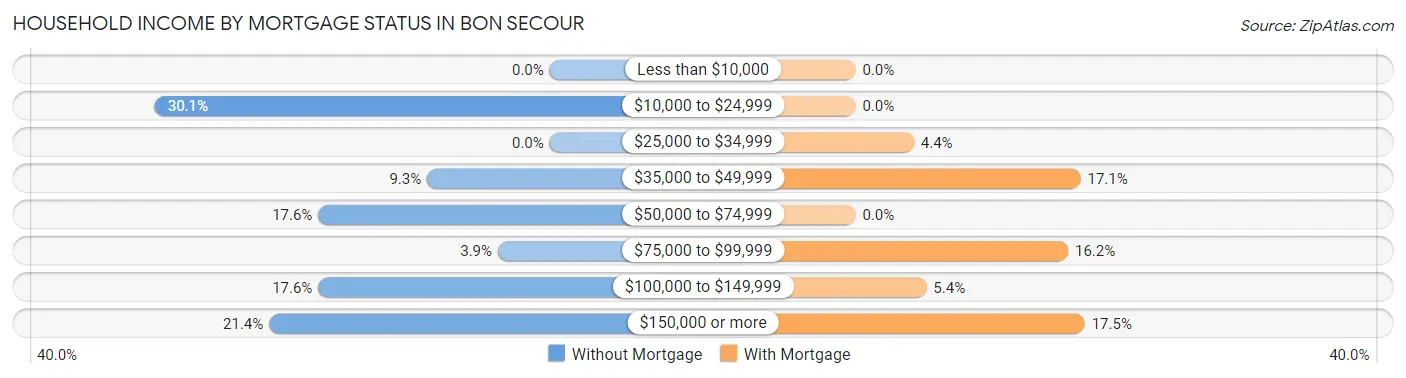
| Household Income | Without Mortgage | With Mortgage |
| Less than $10,000 | 0 (0.0%) | 0 (0.0%) |
| $10,000 to $24,999 | 145 (30.1%) | 0 (0.0%) |
| $25,000 to $34,999 | 0 (0.0%) | 14 (4.4%) |
| $35,000 to $49,999 | 45 (9.3%) | 54 (17.1%) |
| $50,000 to $74,999 | 85 (17.6%) | 0 (0.0%) |
| $75,000 to $99,999 | 19 (3.9%) | 51 (16.2%) |
| $100,000 to $149,999 | 85 (17.6%) | 17 (5.4%) |
| $150,000 or more | 103 (21.4%) | 55 (17.5%) |
| Total | 482 (100.0%) | 315 (100.0%) |
Property Value to Household Income Ratio in Bon Secour
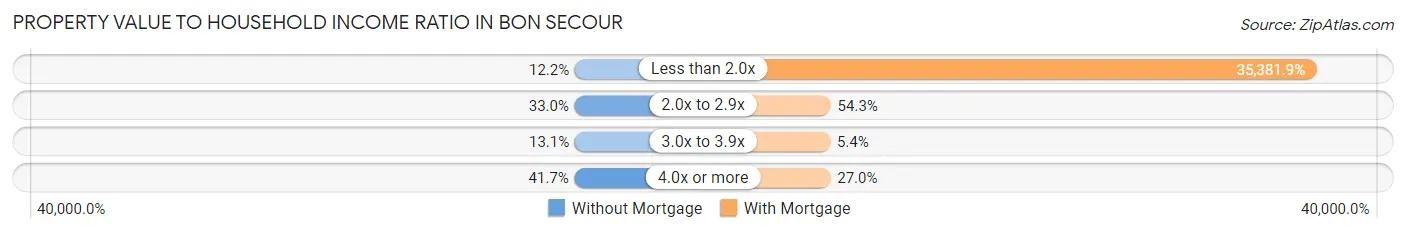
| Value-to-Income Ratio | Without Mortgage | With Mortgage |
| Less than 2.0x | 59 (12.2%) | 111,453 (35,381.9%) |
| 2.0x to 2.9x | 159 (33.0%) | 171 (54.3%) |
| 3.0x to 3.9x | 63 (13.1%) | 17 (5.4%) |
| 4.0x or more | 201 (41.7%) | 85 (27.0%) |
| Total | 482 (100.0%) | 315 (100.0%) |
Real Estate Taxes by Mortgage Status in Bon Secour
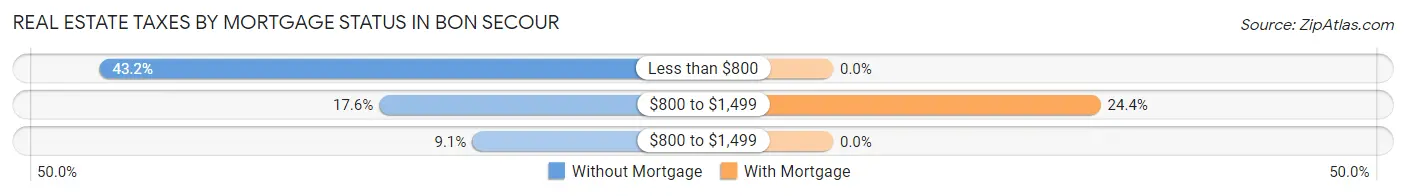
| Property Taxes | Without Mortgage | With Mortgage |
| Less than $800 | 208 (43.1%) | 0 (0.0%) |
| $800 to $1,499 | 85 (17.6%) | 77 (24.4%) |
| $800 to $1,499 | 44 (9.1%) | 0 (0.0%) |
| Total | 482 (100.0%) | 315 (100.0%) |
Health & Disability in Bon Secour
Health Insurance Coverage by Age in Bon Secour
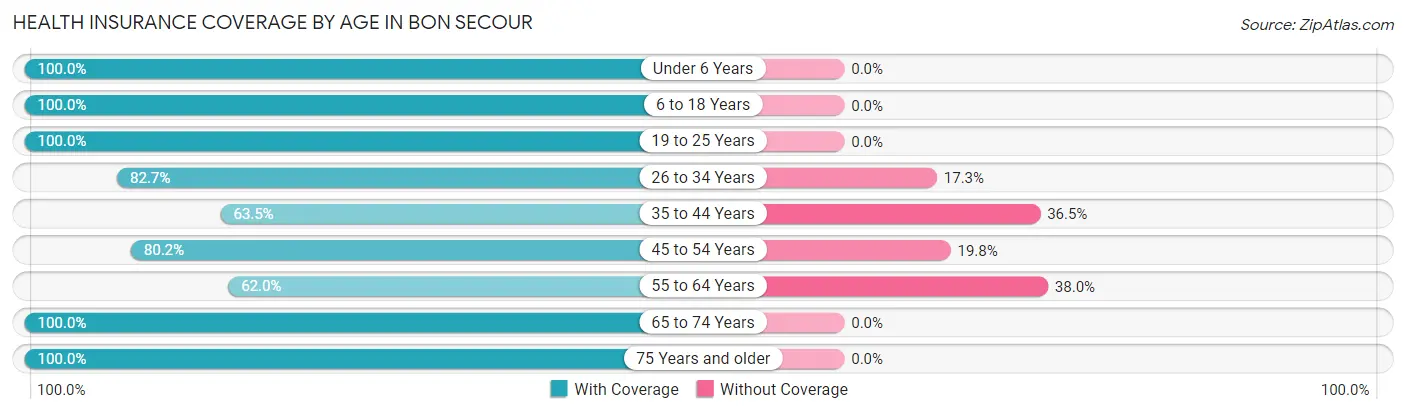
| Age Bracket | With Coverage | Without Coverage |
| Under 6 Years | 161 (100.0%) | 0 (0.0%) |
| 6 to 18 Years | 277 (100.0%) | 0 (0.0%) |
| 19 to 25 Years | 185 (100.0%) | 0 (0.0%) |
| 26 to 34 Years | 417 (82.7%) | 87 (17.3%) |
| 35 to 44 Years | 205 (63.5%) | 118 (36.5%) |
| 45 to 54 Years | 449 (80.2%) | 111 (19.8%) |
| 55 to 64 Years | 214 (62.0%) | 131 (38.0%) |
| 65 to 74 Years | 240 (100.0%) | 0 (0.0%) |
| 75 Years and older | 196 (100.0%) | 0 (0.0%) |
| Total | 2,344 (84.0%) | 447 (16.0%) |
Health Insurance Coverage by Citizenship Status in Bon Secour
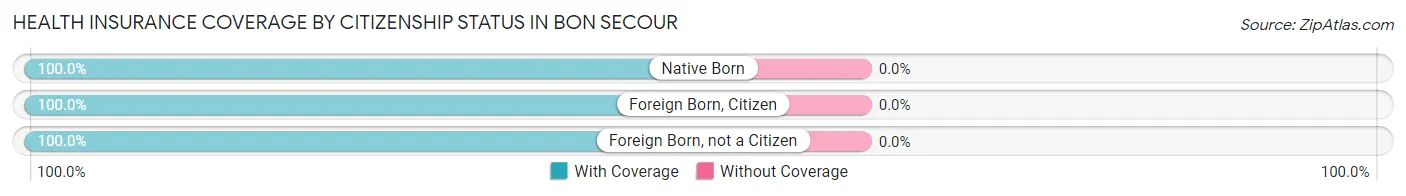
| Citizenship Status | With Coverage | Without Coverage |
| Native Born | 161 (100.0%) | 0 (0.0%) |
| Foreign Born, Citizen | 277 (100.0%) | 0 (0.0%) |
| Foreign Born, not a Citizen | 185 (100.0%) | 0 (0.0%) |
Health Insurance Coverage by Household Income in Bon Secour
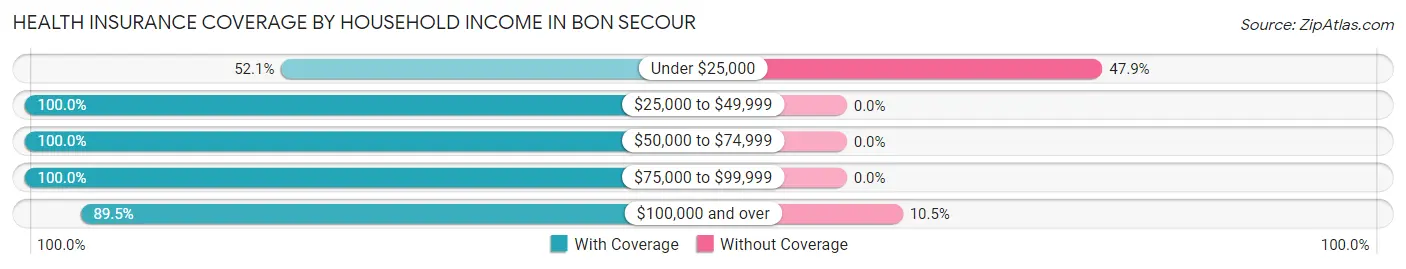
| Household Income | With Coverage | Without Coverage |
| Under $25,000 | 296 (52.1%) | 272 (47.9%) |
| $25,000 to $49,999 | 260 (100.0%) | 0 (0.0%) |
| $50,000 to $74,999 | 255 (100.0%) | 0 (0.0%) |
| $75,000 to $99,999 | 36 (100.0%) | 0 (0.0%) |
| $100,000 and over | 1,497 (89.5%) | 175 (10.5%) |
Public vs Private Health Insurance Coverage by Age in Bon Secour
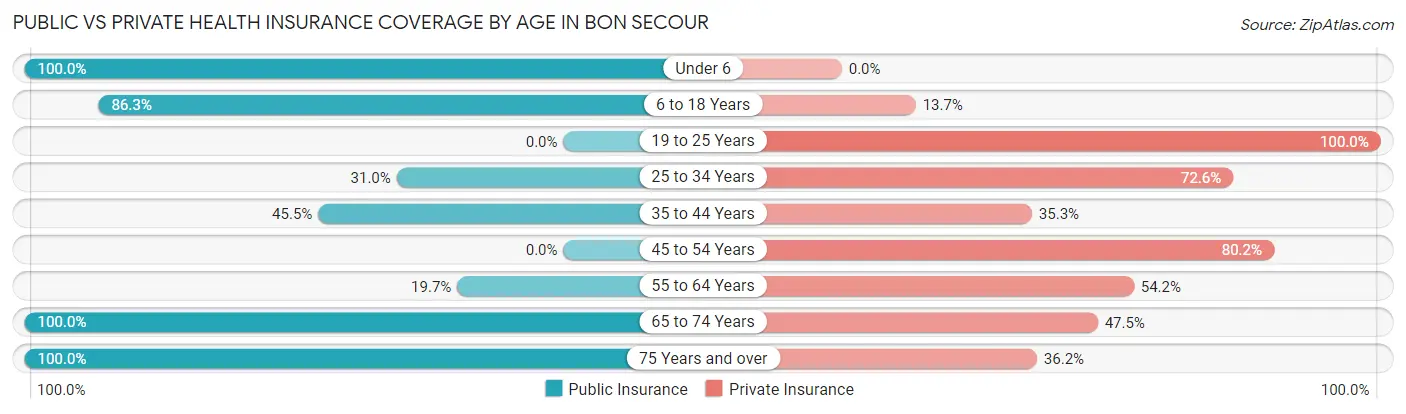
| Age Bracket | Public Insurance | Private Insurance |
| Under 6 | 161 (100.0%) | 0 (0.0%) |
| 6 to 18 Years | 239 (86.3%) | 38 (13.7%) |
| 19 to 25 Years | 0 (0.0%) | 185 (100.0%) |
| 25 to 34 Years | 156 (30.9%) | 366 (72.6%) |
| 35 to 44 Years | 147 (45.5%) | 114 (35.3%) |
| 45 to 54 Years | 0 (0.0%) | 449 (80.2%) |
| 55 to 64 Years | 68 (19.7%) | 187 (54.2%) |
| 65 to 74 Years | 240 (100.0%) | 114 (47.5%) |
| 75 Years and over | 196 (100.0%) | 71 (36.2%) |
| Total | 1,207 (43.2%) | 1,524 (54.6%) |
Disability Status by Sex by Age in Bon Secour
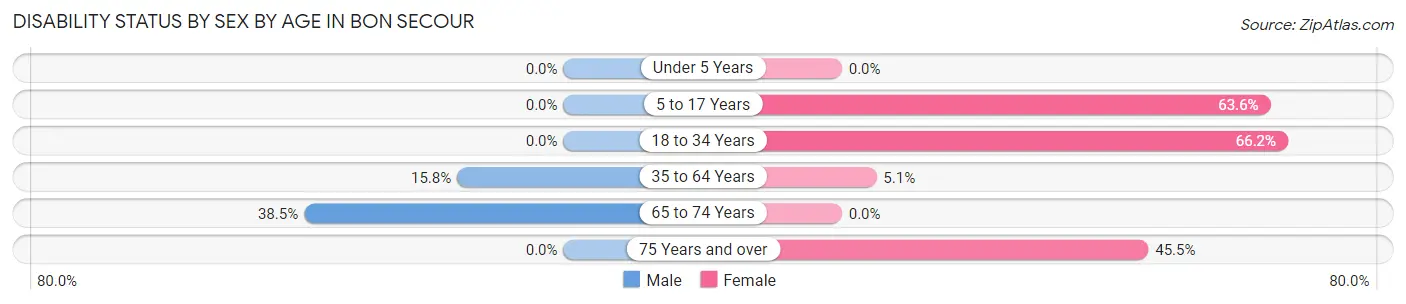
| Age Bracket | Male | Female |
| Under 5 Years | 0 (0.0%) | 0 (0.0%) |
| 5 to 17 Years | 0 (0.0%) | 49 (63.6%) |
| 18 to 34 Years | 0 (0.0%) | 51 (66.2%) |
| 35 to 64 Years | 111 (15.8%) | 27 (5.1%) |
| 65 to 74 Years | 62 (38.5%) | 0 (0.0%) |
| 75 Years and over | 0 (0.0%) | 71 (45.5%) |
Disability Class by Sex by Age in Bon Secour
Disability Class: Hearing Difficulty
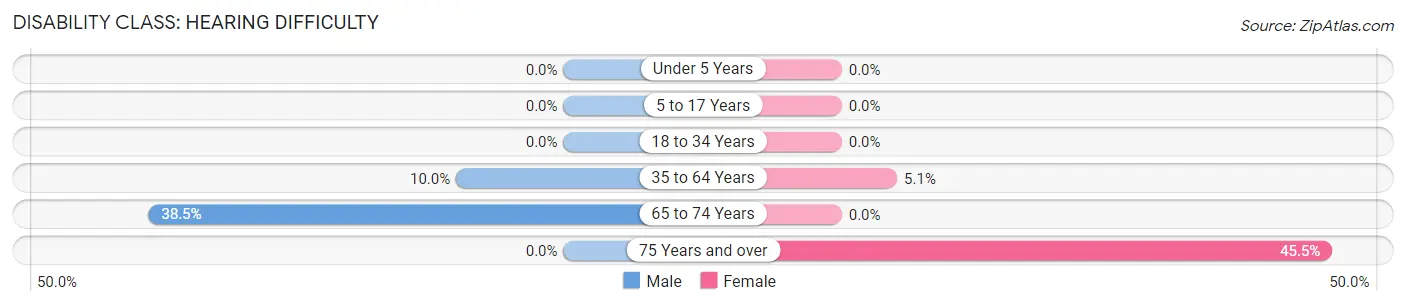
| Age Bracket | Male | Female |
| Under 5 Years | 0 (0.0%) | 0 (0.0%) |
| 5 to 17 Years | 0 (0.0%) | 0 (0.0%) |
| 18 to 34 Years | 0 (0.0%) | 0 (0.0%) |
| 35 to 64 Years | 70 (10.0%) | 27 (5.1%) |
| 65 to 74 Years | 62 (38.5%) | 0 (0.0%) |
| 75 Years and over | 0 (0.0%) | 71 (45.5%) |
Disability Class: Vision Difficulty
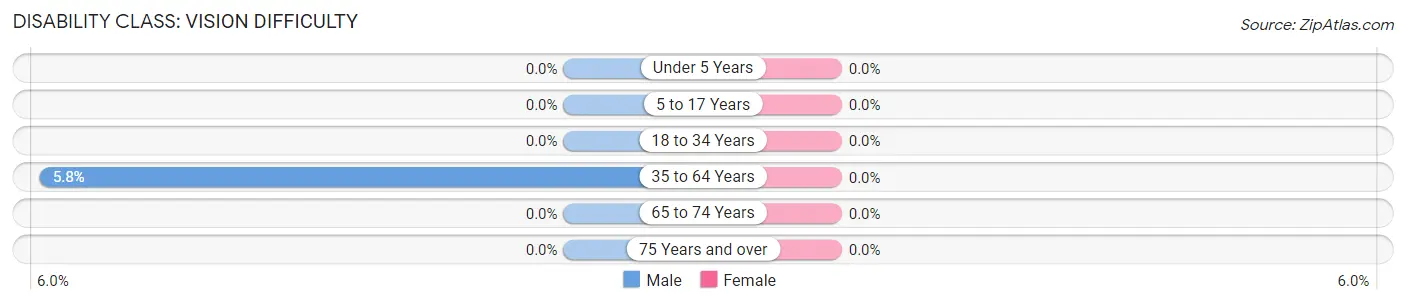
| Age Bracket | Male | Female |
| Under 5 Years | 0 (0.0%) | 0 (0.0%) |
| 5 to 17 Years | 0 (0.0%) | 0 (0.0%) |
| 18 to 34 Years | 0 (0.0%) | 0 (0.0%) |
| 35 to 64 Years | 41 (5.8%) | 0 (0.0%) |
| 65 to 74 Years | 0 (0.0%) | 0 (0.0%) |
| 75 Years and over | 0 (0.0%) | 0 (0.0%) |
Disability Class: Cognitive Difficulty
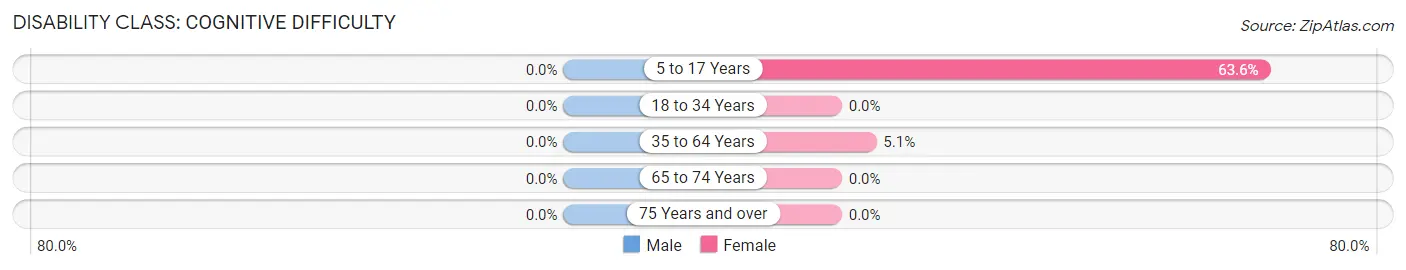
| Age Bracket | Male | Female |
| 5 to 17 Years | 0 (0.0%) | 49 (63.6%) |
| 18 to 34 Years | 0 (0.0%) | 0 (0.0%) |
| 35 to 64 Years | 0 (0.0%) | 27 (5.1%) |
| 65 to 74 Years | 0 (0.0%) | 0 (0.0%) |
| 75 Years and over | 0 (0.0%) | 0 (0.0%) |
Disability Class: Ambulatory Difficulty
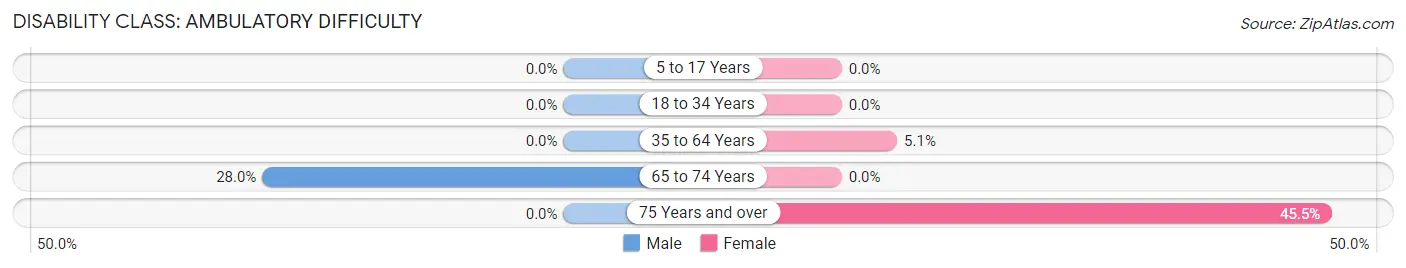
| Age Bracket | Male | Female |
| 5 to 17 Years | 0 (0.0%) | 0 (0.0%) |
| 18 to 34 Years | 0 (0.0%) | 0 (0.0%) |
| 35 to 64 Years | 0 (0.0%) | 27 (5.1%) |
| 65 to 74 Years | 45 (28.0%) | 0 (0.0%) |
| 75 Years and over | 0 (0.0%) | 71 (45.5%) |
Disability Class: Self-Care Difficulty
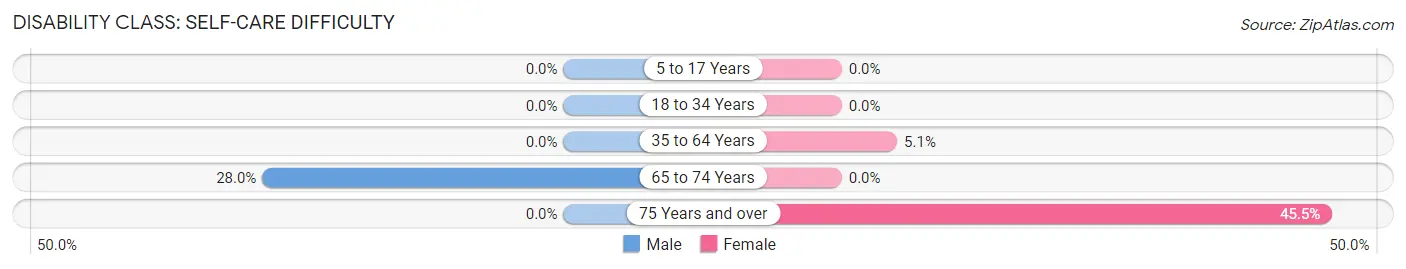
| Age Bracket | Male | Female |
| 5 to 17 Years | 0 (0.0%) | 0 (0.0%) |
| 18 to 34 Years | 0 (0.0%) | 0 (0.0%) |
| 35 to 64 Years | 0 (0.0%) | 27 (5.1%) |
| 65 to 74 Years | 45 (28.0%) | 0 (0.0%) |
| 75 Years and over | 0 (0.0%) | 71 (45.5%) |
Technology Access in Bon Secour
Computing Device Access in Bon Secour
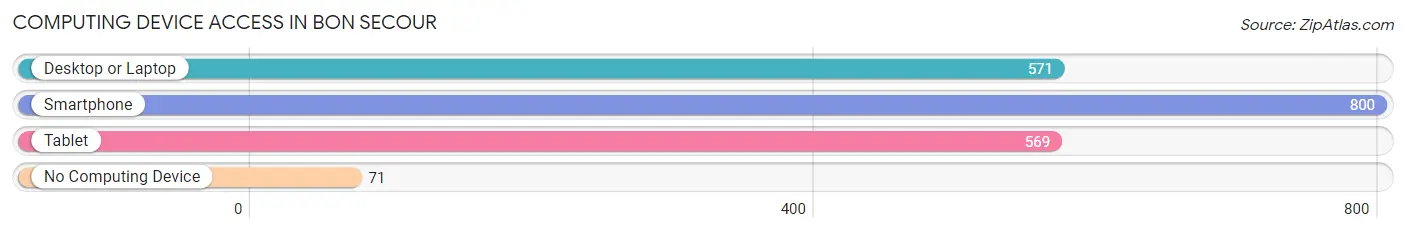
| Device Type | # Households | % Households |
| Desktop or Laptop | 571 | 62.9% |
| Smartphone | 800 | 88.1% |
| Tablet | 569 | 62.7% |
| No Computing Device | 71 | 7.8% |
| Total | 908 | 100.0% |
Internet Access in Bon Secour
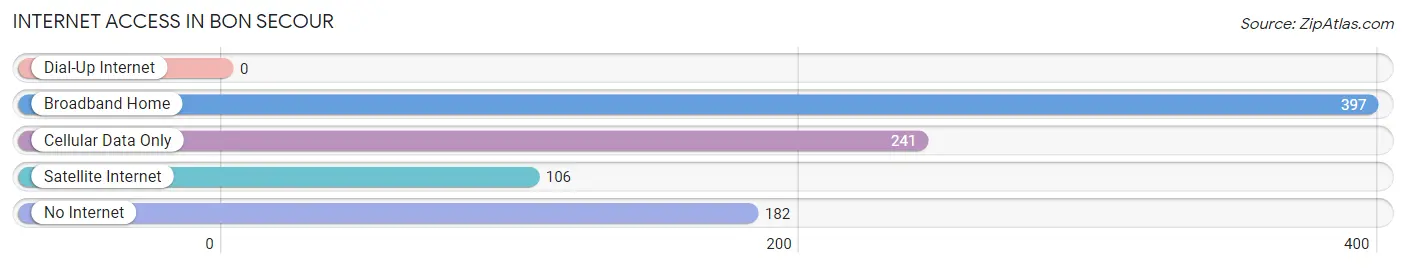
| Internet Type | # Households | % Households |
| Dial-Up Internet | 0 | 0.0% |
| Broadband Home | 397 | 43.7% |
| Cellular Data Only | 241 | 26.5% |
| Satellite Internet | 106 | 11.7% |
| No Internet | 182 | 20.0% |
| Total | 908 | 100.0% |
Bon Secour Summary
Secour, Alabama is a small unincorporated community located in Baldwin County, Alabama. It is situated on the eastern shore of Mobile Bay, approximately 25 miles east of Mobile, Alabama. The community is named after the Bon Secour River, which flows through the area.
History
The area now known as Bon Secour was originally inhabited by Native American tribes, including the Choctaw and Creek. The first European settlers arrived in the area in the early 1800s, and the community was officially established in 1820. The name “Bon Secour” is French for “safe harbor”, and was chosen to reflect the area’s natural harbor.
In the late 1800s, the area became a popular destination for wealthy vacationers from Mobile and New Orleans. The area was known for its beautiful beaches and abundant seafood. In the early 1900s, the area began to attract commercial fishermen, and the seafood industry became an important part of the local economy.
In the 1950s, the area began to attract tourists from all over the country. The area was known for its beautiful beaches, fishing, and seafood. In the 1960s, the area began to attract retirees, and the population began to grow.
Geography
Bon Secour is located in Baldwin County, Alabama, on the eastern shore of Mobile Bay. The community is situated on the Bon Secour River, which flows through the area. The area is known for its beautiful beaches, fishing, and seafood. The area is also home to several state parks, including Bon Secour National Wildlife Refuge, Gulf State Park, and Weeks Bay National Estuarine Research Reserve.
Economy
The economy of Bon Secour is largely based on tourism and the seafood industry. The area is known for its beautiful beaches, fishing, and seafood. The area is also home to several state parks, which attract visitors from all over the country. The seafood industry is an important part of the local economy, and the area is home to several seafood processing plants.
Demographics
As of the 2010 census, the population of Bon Secour was 1,359. The racial makeup of the town was 97.3% White, 0.7% African American, 0.2% Native American, 0.2% Asian, 0.2% from other races, and 1.6% from two or more races. Hispanic or Latino of any race were 1.2% of the population.
The median income for a household in the town was $41,250, and the median income for a family was $50,000. The per capita income for the town was $20,945. About 8.3% of families and 10.2% of the population were below the poverty line, including 14.3% of those under age 18 and 6.3% of those age 65 or over.
Common Questions
What is Per Capita Income in Bon Secour?
Per Capita income in Bon Secour is $45,195.
What is the Median Family Income in Bon Secour?
Median Family Income in Bon Secour is $116,157.
What is the Median Household income in Bon Secour?
Median Household Income in Bon Secour is $58,500.
What is Income or Wage Gap in Bon Secour?
Income or Wage Gap in Bon Secour is 5.5%.
Women in Bon Secour earn 94.5 cents for every dollar earned by a man.
What is Inequality or Gini Index in Bon Secour?
Inequality or Gini Index in Bon Secour is 0.56.
What is the Total Population of Bon Secour?
Total Population of Bon Secour is 2,791.
What is the Total Male Population of Bon Secour?
Total Male Population of Bon Secour is 1,838.
What is the Total Female Population of Bon Secour?
Total Female Population of Bon Secour is 953.
What is the Ratio of Males per 100 Females in Bon Secour?
There are 192.86 Males per 100 Females in Bon Secour.
What is the Ratio of Females per 100 Males in Bon Secour?
There are 51.85 Females per 100 Males in Bon Secour.
What is the Median Population Age in Bon Secour?
Median Population Age in Bon Secour is 39.9 Years.
What is the Average Family Size in Bon Secour
Average Family Size in Bon Secour is 3.1 People.
What is the Average Household Size in Bon Secour
Average Household Size in Bon Secour is 3.1 People.
How Large is the Labor Force in Bon Secour?
There are 1,777 People in the Labor Forcein in Bon Secour.
What is the Percentage of People in the Labor Force in Bon Secour?
75.5% of People are in the Labor Force in Bon Secour.
What is the Unemployment Rate in Bon Secour?
Unemployment Rate in Bon Secour is 6.2%.