Orange Beach, AL Map & Demographics
Orange Beach Map
Orange Beach Overview
$55,485
PER CAPITA INCOME
$117,761
AVG FAMILY INCOME
$90,402
AVG HOUSEHOLD INCOME
48.6%
WAGE / INCOME GAP [ % ]
51.4¢/ $1
WAGE / INCOME GAP [ $ ]
0.45
INEQUALITY / GINI INDEX
8,048
TOTAL POPULATION
3,899
MALE POPULATION
4,149
FEMALE POPULATION
93.97
MALES / 100 FEMALES
106.41
FEMALES / 100 MALES
51.6
MEDIAN AGE
2.8
AVG FAMILY SIZE
2.2
AVG HOUSEHOLD SIZE
4,342
LABOR FORCE [ PEOPLE ]
61.6%
PERCENT IN LABOR FORCE
4.4%
UNEMPLOYMENT RATE
Orange Beach Zip Codes
Orange Beach Area Codes
Income in Orange Beach
Income Overview in Orange Beach
Per Capita Income in Orange Beach is $55,485, while median incomes of families and households are $117,761 and $90,402 respectively.
| Characteristic | Number | Measure |
| Per Capita Income | 8,048 | $55,485 |
| Median Family Income | 2,227 | $117,761 |
| Mean Family Income | 2,227 | $147,850 |
| Median Household Income | 3,719 | $90,402 |
| Mean Household Income | 3,719 | $118,699 |
| Income Deficit | 2,227 | $0 |
| Wage / Income Gap (%) | 8,048 | 48.59% |
| Wage / Income Gap ($) | 8,048 | 51.41¢ per $1 |
| Gini / Inequality Index | 8,048 | 0.45 |
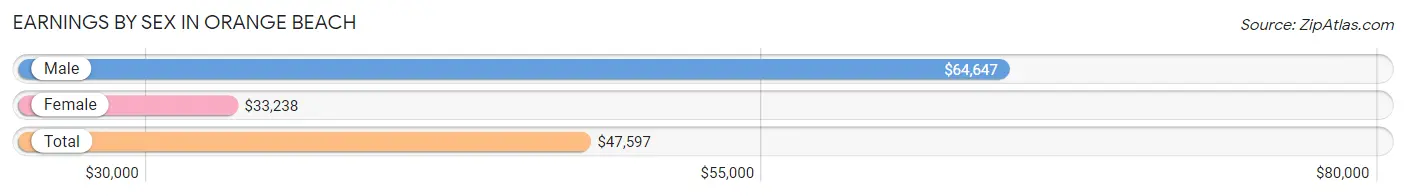
Earnings by Sex in Orange Beach
Average Earnings in Orange Beach are $47,597, $64,647 for men and $33,238 for women, a difference of 48.6%.
| Sex | Number | Average Earnings |
| Male | 2,283 (49.9%) | $64,647 |
| Female | 2,291 (50.1%) | $33,238 |
| Total | 4,574 (100.0%) | $47,597 |
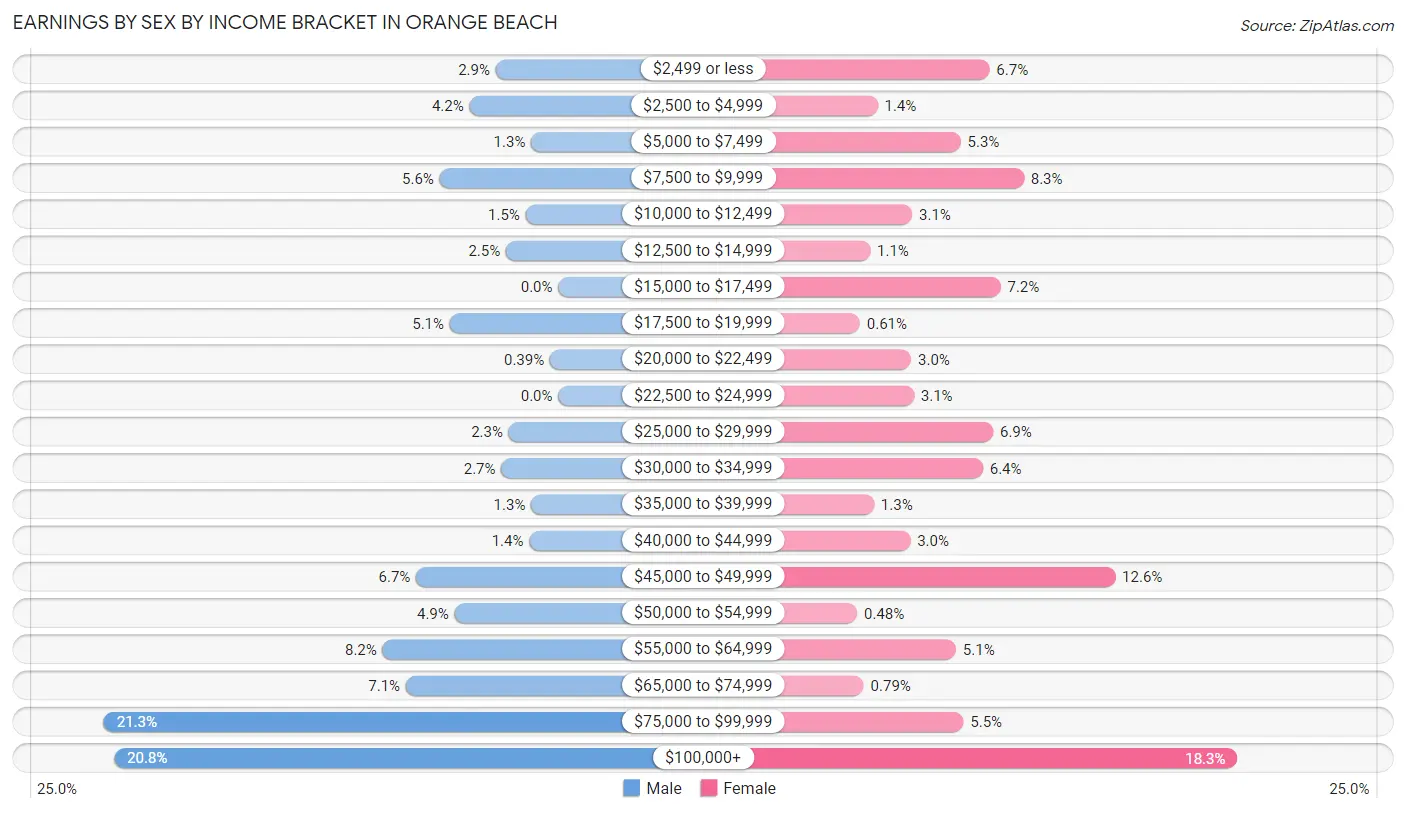
Earnings by Sex by Income Bracket in Orange Beach
The most common earnings brackets in Orange Beach are $75,000 to $99,999 for men (486 | 21.3%) and $100,000+ for women (419 | 18.3%).
| Income | Male | Female |
| $2,499 or less | 67 (2.9%) | 153 (6.7%) |
| $2,500 to $4,999 | 95 (4.2%) | 33 (1.4%) |
| $5,000 to $7,499 | 29 (1.3%) | 122 (5.3%) |
| $7,500 to $9,999 | 127 (5.6%) | 190 (8.3%) |
| $10,000 to $12,499 | 35 (1.5%) | 70 (3.1%) |
| $12,500 to $14,999 | 56 (2.5%) | 25 (1.1%) |
| $15,000 to $17,499 | 0 (0.0%) | 165 (7.2%) |
| $17,500 to $19,999 | 116 (5.1%) | 14 (0.6%) |
| $20,000 to $22,499 | 9 (0.4%) | 69 (3.0%) |
| $22,500 to $24,999 | 0 (0.0%) | 72 (3.1%) |
| $25,000 to $29,999 | 53 (2.3%) | 157 (6.9%) |
| $30,000 to $34,999 | 61 (2.7%) | 146 (6.4%) |
| $35,000 to $39,999 | 29 (1.3%) | 29 (1.3%) |
| $40,000 to $44,999 | 31 (1.4%) | 68 (3.0%) |
| $45,000 to $49,999 | 152 (6.7%) | 288 (12.6%) |
| $50,000 to $54,999 | 111 (4.9%) | 11 (0.5%) |
| $55,000 to $64,999 | 188 (8.2%) | 117 (5.1%) |
| $65,000 to $74,999 | 163 (7.1%) | 18 (0.8%) |
| $75,000 to $99,999 | 486 (21.3%) | 125 (5.5%) |
| $100,000+ | 475 (20.8%) | 419 (18.3%) |
| Total | 2,283 (100.0%) | 2,291 (100.0%) |
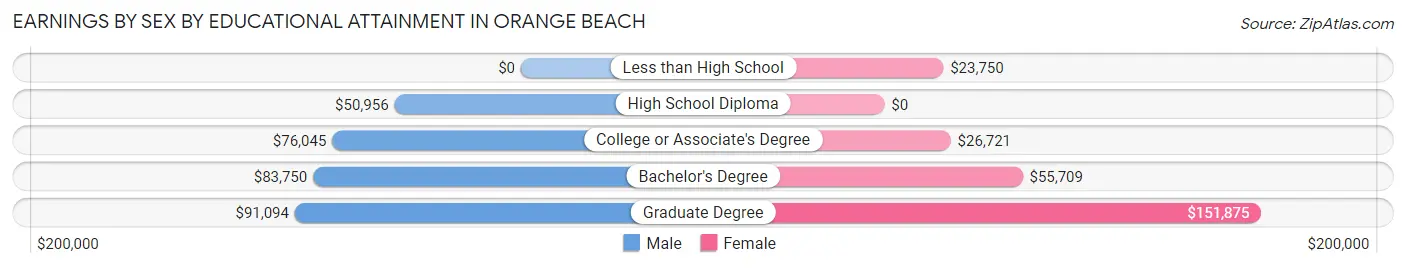
Earnings by Sex by Educational Attainment in Orange Beach
Average earnings in Orange Beach are $71,215 for men and $45,206 for women, a difference of 36.5%. Men with an educational attainment of graduate degree enjoy the highest average annual earnings of $91,094, while those with high school diploma education earn the least with $50,956. Women with an educational attainment of graduate degree earn the most with the average annual earnings of $151,875, while those with less than high school education have the smallest earnings of $23,750.
| Educational Attainment | Male Income | Female Income |
| Less than High School | - | - |
| High School Diploma | $50,956 | $0 |
| College or Associate's Degree | $76,045 | $26,721 |
| Bachelor's Degree | $83,750 | $55,709 |
| Graduate Degree | $91,094 | $151,875 |
| Total | $71,215 | $45,206 |
Family Income in Orange Beach
Family Income Brackets in Orange Beach
According to the Orange Beach family income data, there are 550 families falling into the $100,000 to $149,999 income range, which is the most common income bracket and makes up 24.7% of all families.
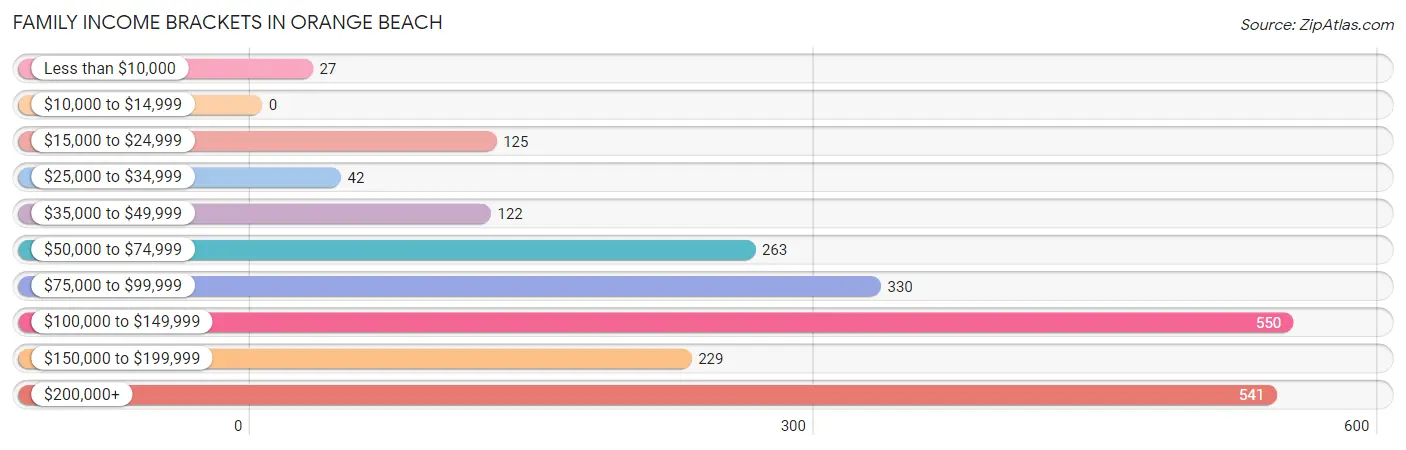
| Income Bracket | # Families | % Families |
| Less than $10,000 | 27 | 1.2% |
| $10,000 to $14,999 | 0 | 0.0% |
| $15,000 to $24,999 | 125 | 5.6% |
| $25,000 to $34,999 | 42 | 1.9% |
| $35,000 to $49,999 | 122 | 5.5% |
| $50,000 to $74,999 | 263 | 11.8% |
| $75,000 to $99,999 | 330 | 14.8% |
| $100,000 to $149,999 | 550 | 24.7% |
| $150,000 to $199,999 | 229 | 10.3% |
| $200,000+ | 541 | 24.3% |
Family Income by Famaliy Size in Orange Beach
4-person families (229 | 10.3%) account for the highest median family income in Orange Beach with $141,875 per family, while 2-person families (1,426 | 64.0%) have the highest median income of $53,334 per family member.
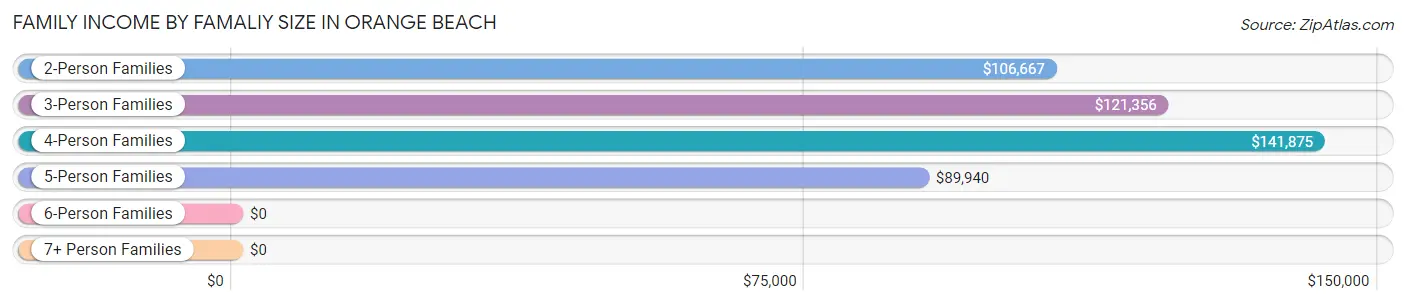
| Income Bracket | # Families | Median Income |
| 2-Person Families | 1,426 (64.0%) | $106,667 |
| 3-Person Families | 392 (17.6%) | $121,356 |
| 4-Person Families | 229 (10.3%) | $141,875 |
| 5-Person Families | 111 (5.0%) | $89,940 |
| 6-Person Families | 69 (3.1%) | $0 |
| 7+ Person Families | 0 (0.0%) | $0 |
| Total | 2,227 (100.0%) | $117,761 |
Family Income by Number of Earners in Orange Beach
The median family income in Orange Beach is $117,761, with families comprising 2 earners (815) having the highest median family income of $161,597, while families with no earners (425) have the lowest median family income of $76,354, accounting for 36.6% and 19.1% of families, respectively.
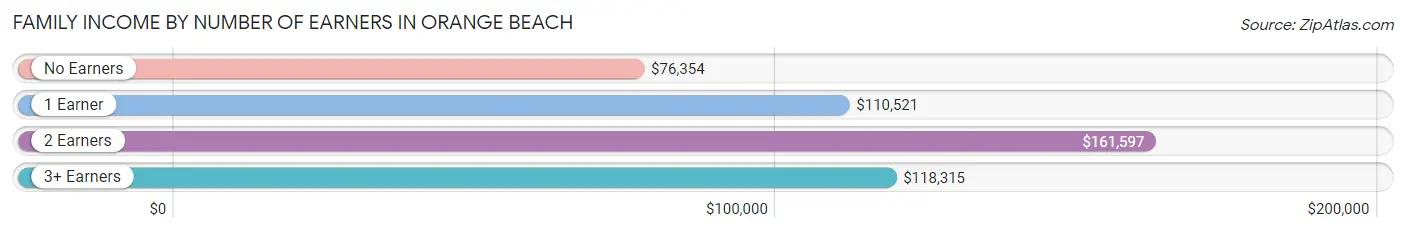
| Number of Earners | # Families | Median Income |
| No Earners | 425 (19.1%) | $76,354 |
| 1 Earner | 634 (28.5%) | $110,521 |
| 2 Earners | 815 (36.6%) | $161,597 |
| 3+ Earners | 353 (15.9%) | $118,315 |
| Total | 2,227 (100.0%) | $117,761 |
Household Income in Orange Beach
Household Income Brackets in Orange Beach
With 692 households falling in the category, the $100,000 to $149,999 income range is the most frequent in Orange Beach, accounting for 18.6% of all households. In contrast, only 19 households (0.5%) fall into the $10,000 to $14,999 income bracket, making it the least populous group.
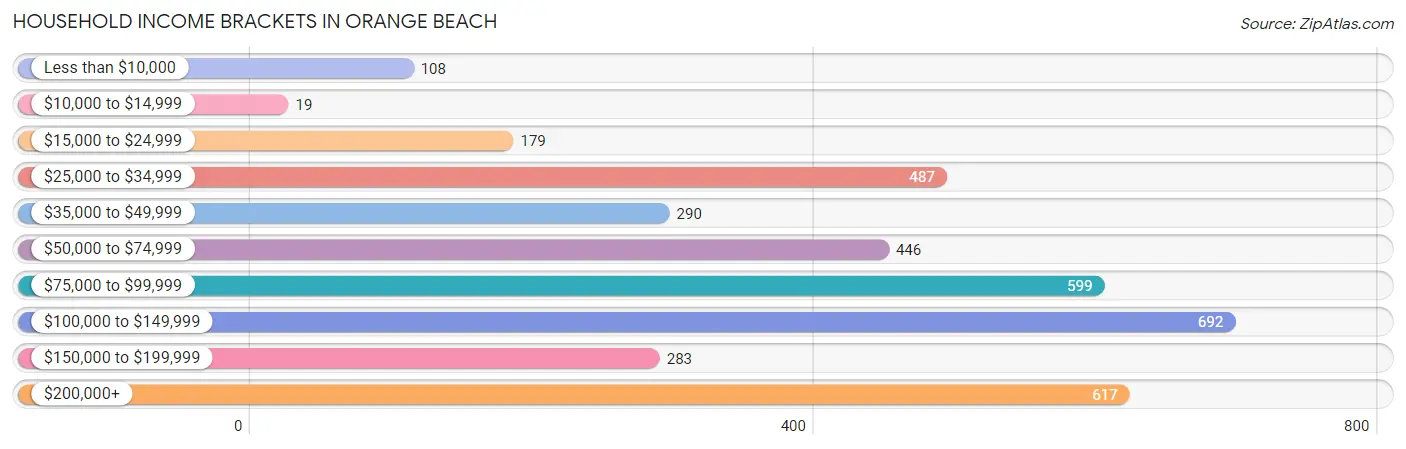
| Income Bracket | # Households | % Households |
| Less than $10,000 | 108 | 2.9% |
| $10,000 to $14,999 | 19 | 0.5% |
| $15,000 to $24,999 | 179 | 4.8% |
| $25,000 to $34,999 | 487 | 13.1% |
| $35,000 to $49,999 | 290 | 7.8% |
| $50,000 to $74,999 | 446 | 12.0% |
| $75,000 to $99,999 | 599 | 16.1% |
| $100,000 to $149,999 | 692 | 18.6% |
| $150,000 to $199,999 | 283 | 7.6% |
| $200,000+ | 617 | 16.6% |
Household Income by Householder Age in Orange Beach
The median household income in Orange Beach is $90,402, with the highest median household income of $112,381 found in the 45 to 64 years age bracket for the primary householder. A total of 1,618 households (43.5%) fall into this category. Meanwhile, the 15 to 24 years age bracket for the primary householder has the lowest median household income of $0, with 92 households (2.5%) in this group.
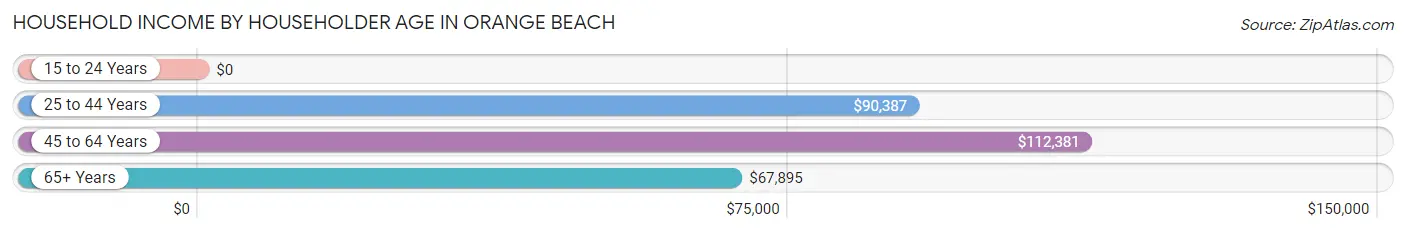
| Income Bracket | # Households | Median Income |
| 15 to 24 Years | 92 (2.5%) | $0 |
| 25 to 44 Years | 517 (13.9%) | $90,387 |
| 45 to 64 Years | 1,618 (43.5%) | $112,381 |
| 65+ Years | 1,492 (40.1%) | $67,895 |
| Total | 3,719 (100.0%) | $90,402 |
Poverty in Orange Beach
Income Below Poverty by Sex and Age in Orange Beach
With 7.5% poverty level for males and 4.9% for females among the residents of Orange Beach, under 5 year old males and 18 to 24 year old females are the most vulnerable to poverty, with 80 males (54.0%) and 68 females (25.8%) in their respective age groups living below the poverty level.
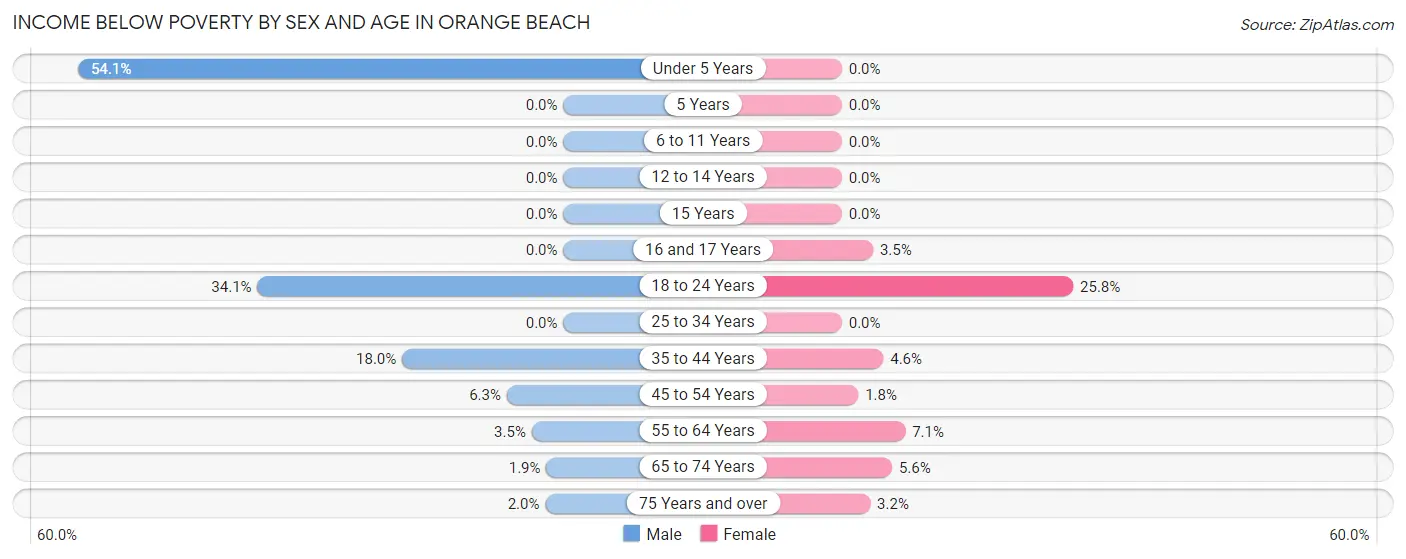
| Age Bracket | Male | Female |
| Under 5 Years | 80 (54.0%) | 0 (0.0%) |
| 5 Years | 0 (0.0%) | 0 (0.0%) |
| 6 to 11 Years | 0 (0.0%) | 0 (0.0%) |
| 12 to 14 Years | 0 (0.0%) | 0 (0.0%) |
| 15 Years | 0 (0.0%) | 0 (0.0%) |
| 16 and 17 Years | 0 (0.0%) | 5 (3.5%) |
| 18 to 24 Years | 77 (34.1%) | 68 (25.8%) |
| 25 to 34 Years | 0 (0.0%) | 0 (0.0%) |
| 35 to 44 Years | 60 (18.0%) | 12 (4.6%) |
| 45 to 54 Years | 32 (6.3%) | 16 (1.8%) |
| 55 to 64 Years | 22 (3.5%) | 51 (7.1%) |
| 65 to 74 Years | 16 (1.9%) | 37 (5.6%) |
| 75 Years and over | 6 (2.0%) | 15 (3.2%) |
| Total | 293 (7.5%) | 204 (4.9%) |
Income Above Poverty by Sex and Age in Orange Beach
According to the poverty statistics in Orange Beach, males aged 5 years and females aged under 5 years are the age groups that are most secure financially, with 100.0% of males and 100.0% of females in these age groups living above the poverty line.
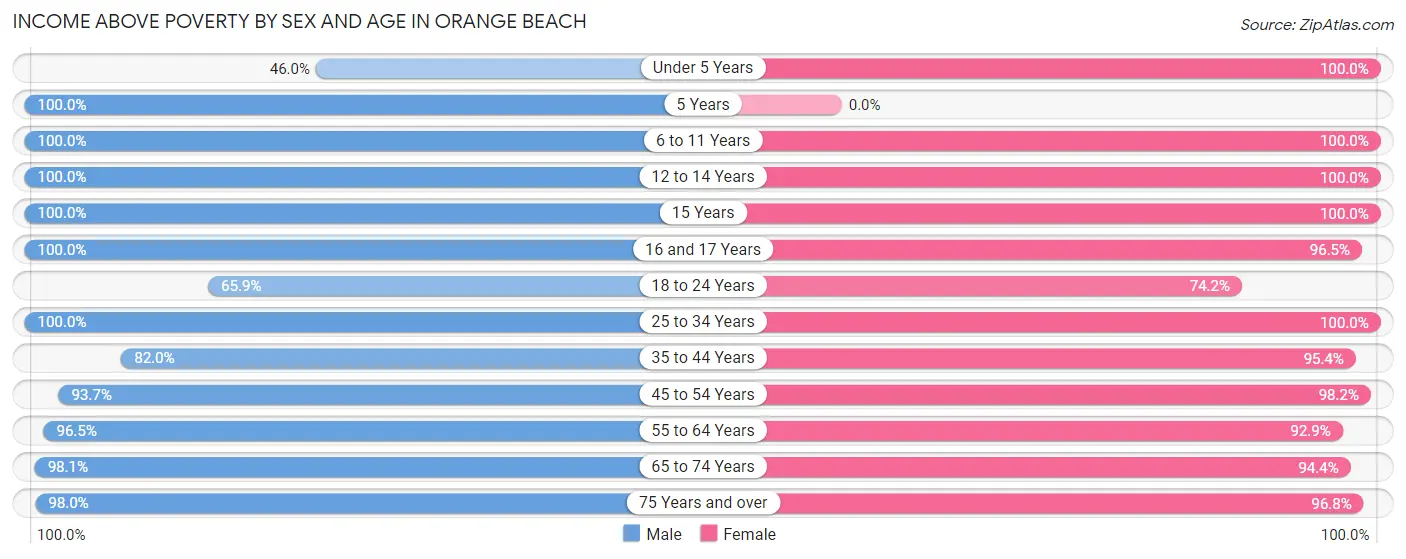
| Age Bracket | Male | Female |
| Under 5 Years | 68 (46.0%) | 10 (100.0%) |
| 5 Years | 8 (100.0%) | 0 (0.0%) |
| 6 to 11 Years | 140 (100.0%) | 245 (100.0%) |
| 12 to 14 Years | 246 (100.0%) | 133 (100.0%) |
| 15 Years | 24 (100.0%) | 36 (100.0%) |
| 16 and 17 Years | 105 (100.0%) | 139 (96.5%) |
| 18 to 24 Years | 149 (65.9%) | 196 (74.2%) |
| 25 to 34 Years | 370 (100.0%) | 314 (100.0%) |
| 35 to 44 Years | 274 (82.0%) | 248 (95.4%) |
| 45 to 54 Years | 476 (93.7%) | 860 (98.2%) |
| 55 to 64 Years | 603 (96.5%) | 671 (92.9%) |
| 65 to 74 Years | 832 (98.1%) | 625 (94.4%) |
| 75 Years and over | 293 (98.0%) | 459 (96.8%) |
| Total | 3,588 (92.4%) | 3,936 (95.1%) |
Income Below Poverty Among Married-Couple Families in Orange Beach
The poverty statistics for married-couple families in Orange Beach show that 1.9% or 39 of the total 1,999 families live below the poverty line. Families with no children have the highest poverty rate of 2.4%, comprising of 37 families. On the other hand, families with 3 or 4 children have the lowest poverty rate of 0.0%, which includes 0 families.
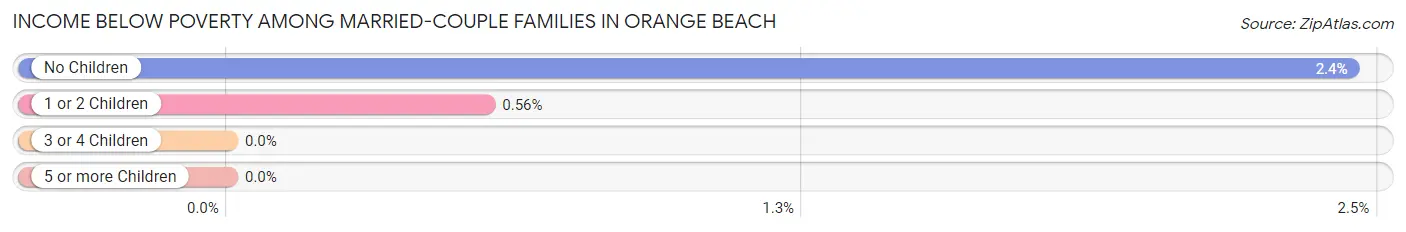
| Children | Above Poverty | Below Poverty |
| No Children | 1,482 (97.6%) | 37 (2.4%) |
| 1 or 2 Children | 352 (99.4%) | 2 (0.6%) |
| 3 or 4 Children | 126 (100.0%) | 0 (0.0%) |
| 5 or more Children | 0 (0.0%) | 0 (0.0%) |
| Total | 1,960 (98.1%) | 39 (1.9%) |
Income Below Poverty Among Single-Parent Households in Orange Beach
According to the poverty data in Orange Beach, 60.6% or 77 single-father households and 9.9% or 10 single-mother households are living below the poverty line. Among single-father households, those with 1 or 2 children have the highest poverty rate, with 77 households (74.8%) experiencing poverty. Likewise, among single-mother households, those with no children have the highest poverty rate, with 10 households (23.3%) falling below the poverty line.
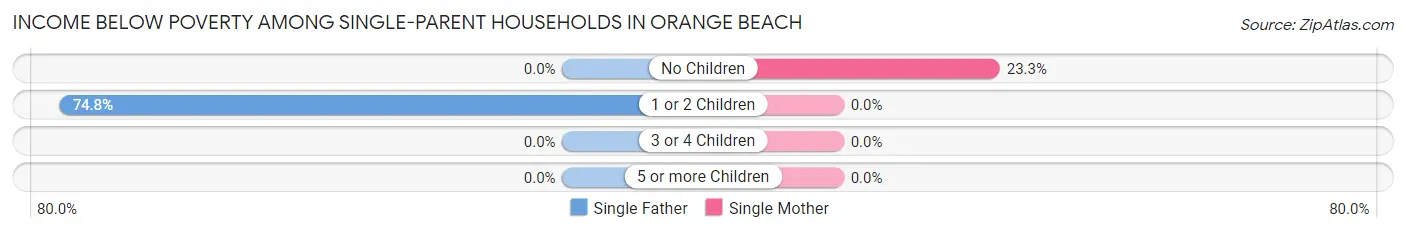
| Children | Single Father | Single Mother |
| No Children | 0 (0.0%) | 10 (23.3%) |
| 1 or 2 Children | 77 (74.8%) | 0 (0.0%) |
| 3 or 4 Children | 0 (0.0%) | 0 (0.0%) |
| 5 or more Children | 0 (0.0%) | 0 (0.0%) |
| Total | 77 (60.6%) | 10 (9.9%) |
Income Below Poverty Among Married-Couple vs Single-Parent Households in Orange Beach
The poverty data for Orange Beach shows that 39 of the married-couple family households (1.9%) and 87 of the single-parent households (38.2%) are living below the poverty level. Within the married-couple family households, those with no children have the highest poverty rate, with 37 households (2.4%) falling below the poverty line. Among the single-parent households, those with 1 or 2 children have the highest poverty rate, with 77 household (51.7%) living below poverty.
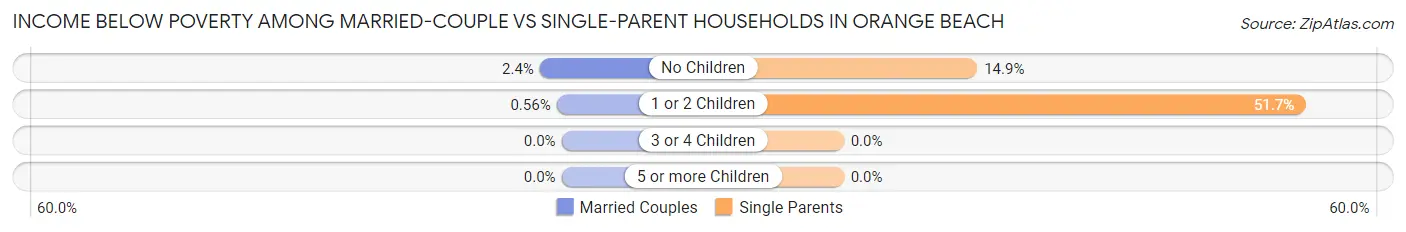
| Children | Married-Couple Families | Single-Parent Households |
| No Children | 37 (2.4%) | 10 (14.9%) |
| 1 or 2 Children | 2 (0.6%) | 77 (51.7%) |
| 3 or 4 Children | 0 (0.0%) | 0 (0.0%) |
| 5 or more Children | 0 (0.0%) | 0 (0.0%) |
| Total | 39 (1.9%) | 87 (38.2%) |
Race in Orange Beach
The most populous races in Orange Beach are White / Caucasian (7,604 | 94.5%), Two or more Races (249 | 3.1%), and Asian (137 | 1.7%).
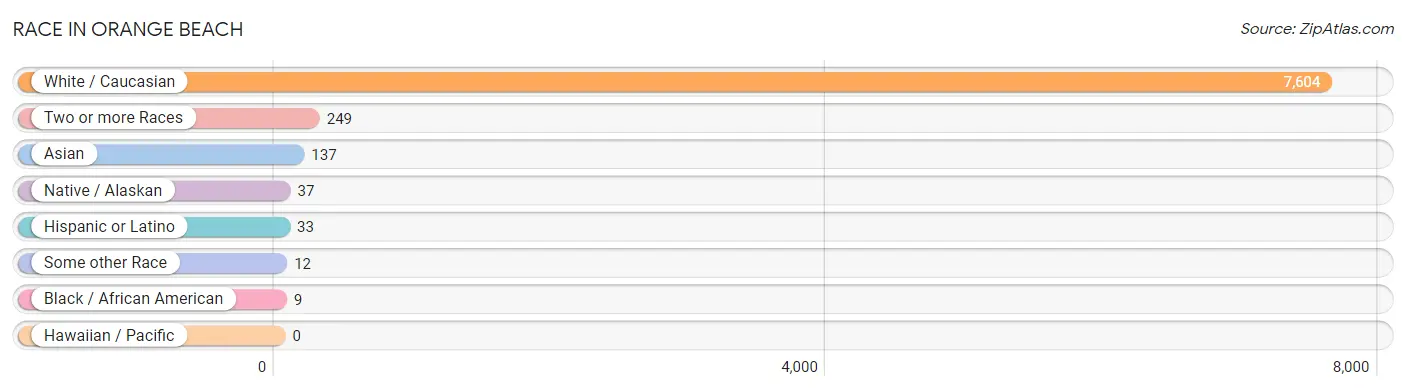
| Race | # Population | % Population |
| Asian | 137 | 1.7% |
| Black / African American | 9 | 0.1% |
| Hawaiian / Pacific | 0 | 0.0% |
| Hispanic or Latino | 33 | 0.4% |
| Native / Alaskan | 37 | 0.5% |
| White / Caucasian | 7,604 | 94.5% |
| Two or more Races | 249 | 3.1% |
| Some other Race | 12 | 0.2% |
| Total | 8,048 | 100.0% |
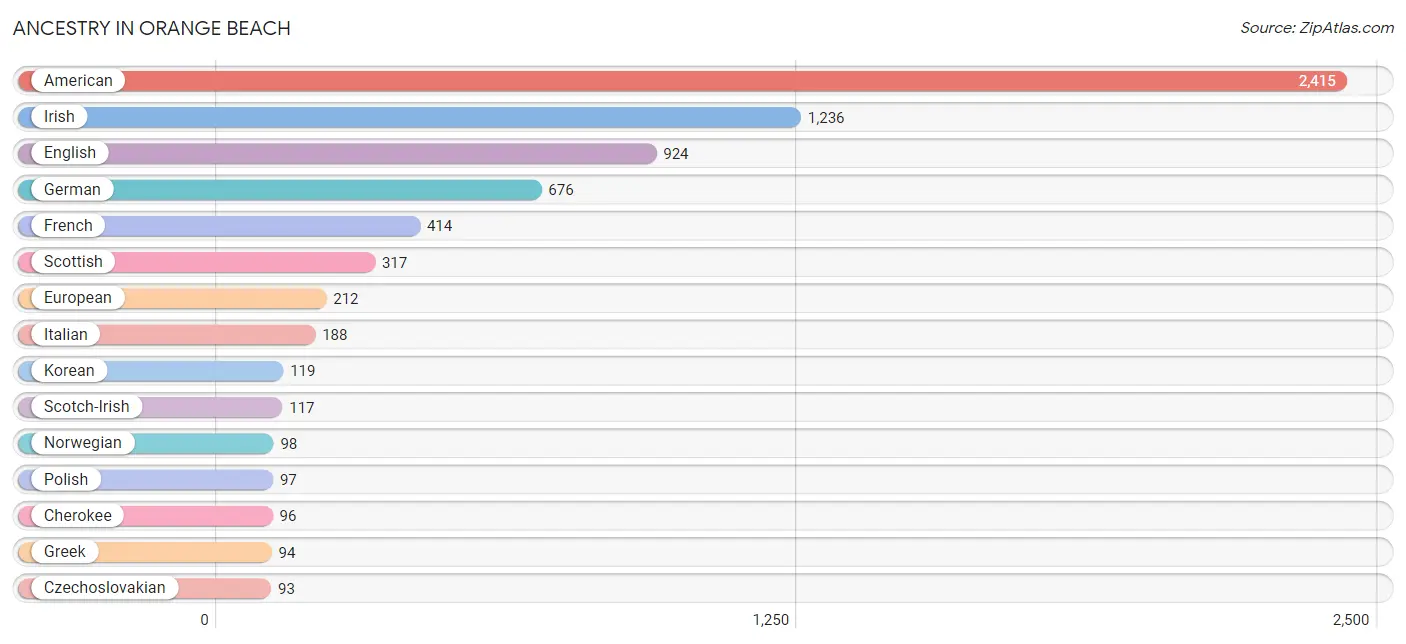
Ancestry in Orange Beach
The most populous ancestries reported in Orange Beach are American (2,415 | 30.0%), Irish (1,236 | 15.4%), English (924 | 11.5%), German (676 | 8.4%), and French (414 | 5.1%), together accounting for 70.4% of all Orange Beach residents.
| Ancestry | # Population | % Population |
| American | 2,415 | 30.0% |
| Bhutanese | 9 | 0.1% |
| Brazilian | 15 | 0.2% |
| British | 81 | 1.0% |
| Canadian | 18 | 0.2% |
| Cherokee | 96 | 1.2% |
| Creek | 10 | 0.1% |
| Czech | 35 | 0.4% |
| Czechoslovakian | 93 | 1.2% |
| Danish | 33 | 0.4% |
| Dutch | 21 | 0.3% |
| Eastern European | 6 | 0.1% |
| English | 924 | 11.5% |
| European | 212 | 2.6% |
| French | 414 | 5.1% |
| French Canadian | 43 | 0.5% |
| German | 676 | 8.4% |
| Greek | 94 | 1.2% |
| Hungarian | 36 | 0.4% |
| Irish | 1,236 | 15.4% |
| Italian | 188 | 2.3% |
| Korean | 119 | 1.5% |
| Northern European | 39 | 0.5% |
| Norwegian | 98 | 1.2% |
| Polish | 97 | 1.2% |
| Portuguese | 8 | 0.1% |
| Puerto Rican | 24 | 0.3% |
| Scandinavian | 6 | 0.1% |
| Scotch-Irish | 117 | 1.5% |
| Scottish | 317 | 3.9% |
| Spaniard | 9 | 0.1% |
| Sri Lankan | 91 | 1.1% |
| Swedish | 29 | 0.4% |
| Swiss | 12 | 0.2% |
| Welsh | 92 | 1.1% | View All 35 Rows |
Immigrants in Orange Beach
The most numerous immigrant groups reported in Orange Beach came from Asia (130 | 1.6%), South Eastern Asia (130 | 1.6%), Vietnam (91 | 1.1%), Canada (59 | 0.7%), and Philippines (39 | 0.5%), together accounting for 5.6% of all Orange Beach residents.
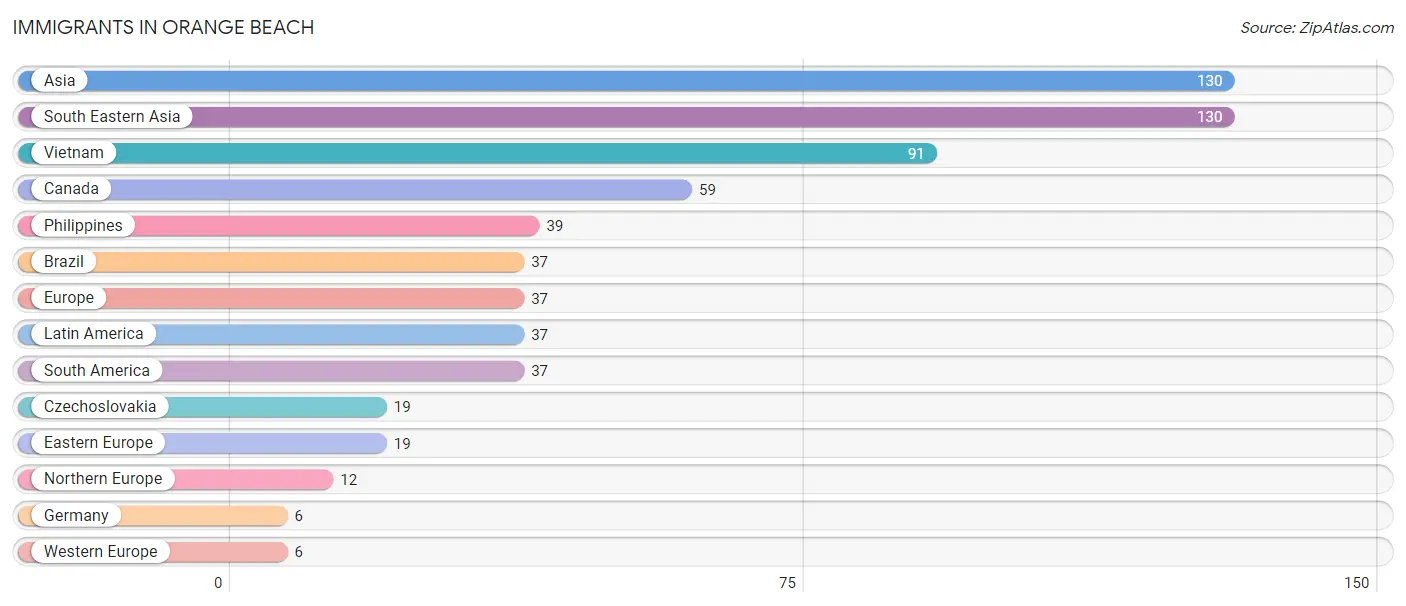
| Immigration Origin | # Population | % Population |
| Asia | 130 | 1.6% |
| Brazil | 37 | 0.5% |
| Canada | 59 | 0.7% |
| Czechoslovakia | 19 | 0.2% |
| Eastern Europe | 19 | 0.2% |
| Europe | 37 | 0.5% |
| Germany | 6 | 0.1% |
| Latin America | 37 | 0.5% |
| Northern Europe | 12 | 0.2% |
| Philippines | 39 | 0.5% |
| South America | 37 | 0.5% |
| South Eastern Asia | 130 | 1.6% |
| Vietnam | 91 | 1.1% |
| Western Europe | 6 | 0.1% | View All 14 Rows |
Sex and Age in Orange Beach
Sex and Age in Orange Beach
The most populous age groups in Orange Beach are 65 to 69 Years (516 | 13.2%) for men and 45 to 49 Years (478 | 11.5%) for women.
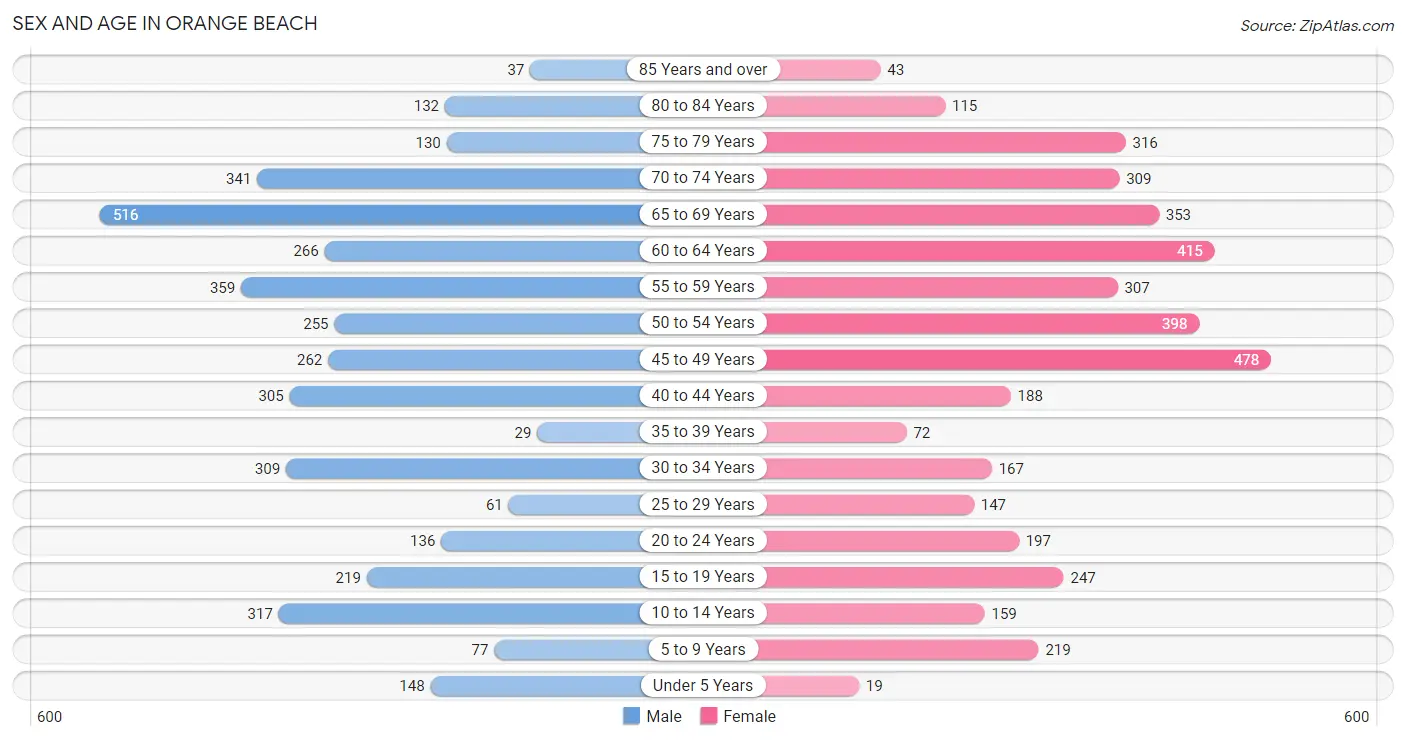
| Age Bracket | Male | Female |
| Under 5 Years | 148 (3.8%) | 19 (0.5%) |
| 5 to 9 Years | 77 (2.0%) | 219 (5.3%) |
| 10 to 14 Years | 317 (8.1%) | 159 (3.8%) |
| 15 to 19 Years | 219 (5.6%) | 247 (5.9%) |
| 20 to 24 Years | 136 (3.5%) | 197 (4.8%) |
| 25 to 29 Years | 61 (1.6%) | 147 (3.5%) |
| 30 to 34 Years | 309 (7.9%) | 167 (4.0%) |
| 35 to 39 Years | 29 (0.7%) | 72 (1.7%) |
| 40 to 44 Years | 305 (7.8%) | 188 (4.5%) |
| 45 to 49 Years | 262 (6.7%) | 478 (11.5%) |
| 50 to 54 Years | 255 (6.5%) | 398 (9.6%) |
| 55 to 59 Years | 359 (9.2%) | 307 (7.4%) |
| 60 to 64 Years | 266 (6.8%) | 415 (10.0%) |
| 65 to 69 Years | 516 (13.2%) | 353 (8.5%) |
| 70 to 74 Years | 341 (8.7%) | 309 (7.4%) |
| 75 to 79 Years | 130 (3.3%) | 316 (7.6%) |
| 80 to 84 Years | 132 (3.4%) | 115 (2.8%) |
| 85 Years and over | 37 (0.9%) | 43 (1.0%) |
| Total | 3,899 (100.0%) | 4,149 (100.0%) |
Families and Households in Orange Beach
Median Family Size in Orange Beach
The median family size in Orange Beach is 2.84 persons per family, with single female/mother families (101 | 4.5%) accounting for the largest median family size of 3.95 persons per family. On the other hand, single male/father families (127 | 5.7%) represent the smallest median family size with 2.46 persons per family.
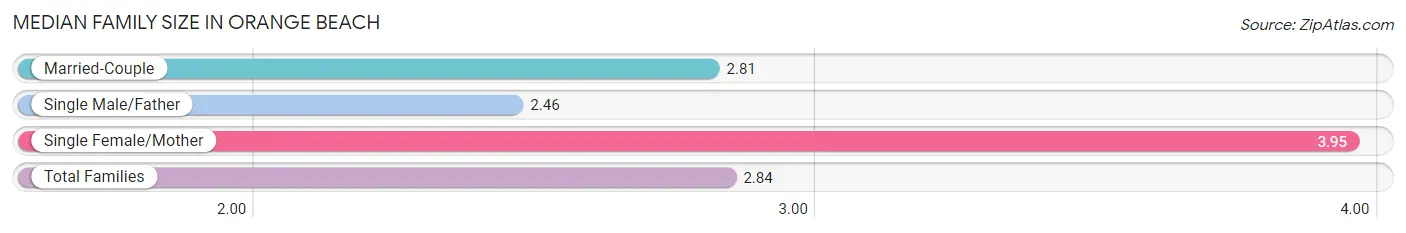
| Family Type | # Families | Family Size |
| Married-Couple | 1,999 (89.8%) | 2.81 |
| Single Male/Father | 127 (5.7%) | 2.46 |
| Single Female/Mother | 101 (4.5%) | 3.95 |
| Total Families | 2,227 (100.0%) | 2.84 |
Median Household Size in Orange Beach
The median household size in Orange Beach is 2.16 persons per household, with single female/mother households (101 | 2.7%) accounting for the largest median household size of 3.95 persons per household. non-family households (1,492 | 40.1%) represent the smallest median household size with 1.06 persons per household.
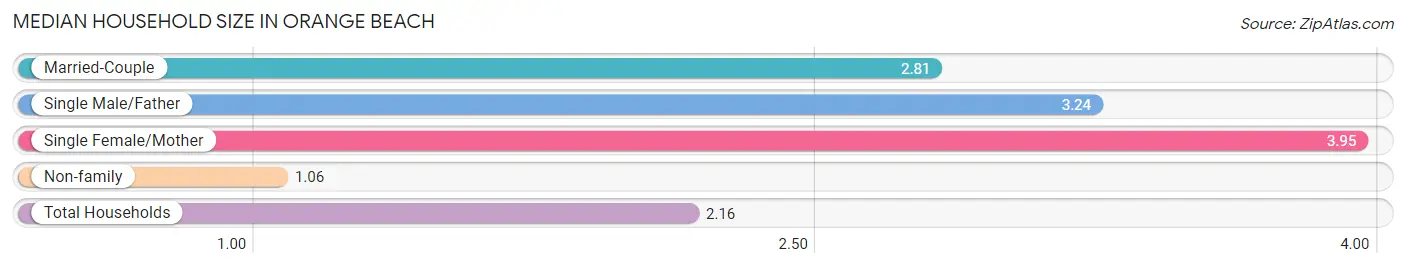
| Household Type | # Households | Household Size |
| Married-Couple | 1,999 (53.7%) | 2.81 |
| Single Male/Father | 127 (3.4%) | 3.24 |
| Single Female/Mother | 101 (2.7%) | 3.95 |
| Non-family | 1,492 (40.1%) | 1.06 |
| Total Households | 3,719 (100.0%) | 2.16 |
Household Size by Marriage Status in Orange Beach
Out of a total of 3,719 households in Orange Beach, 2,227 (59.9%) are family households, while 1,492 (40.1%) are nonfamily households. The most numerous type of family households are 2-person households, comprising 1,325, and the most common type of nonfamily households are 1-person households, comprising 1,419.
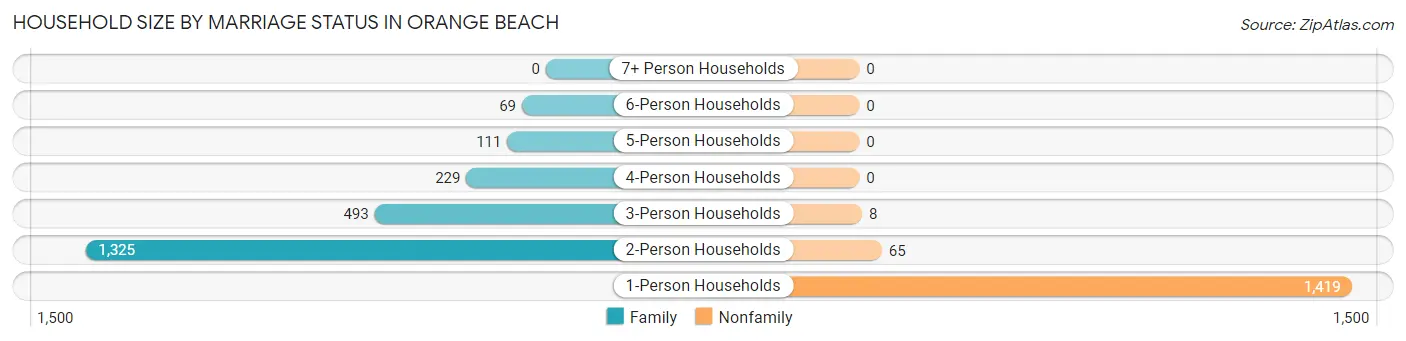
| Household Size | Family Households | Nonfamily Households |
| 1-Person Households | - | 1,419 (38.2%) |
| 2-Person Households | 1,325 (35.6%) | 65 (1.8%) |
| 3-Person Households | 493 (13.3%) | 8 (0.2%) |
| 4-Person Households | 229 (6.2%) | 0 (0.0%) |
| 5-Person Households | 111 (3.0%) | 0 (0.0%) |
| 6-Person Households | 69 (1.9%) | 0 (0.0%) |
| 7+ Person Households | 0 (0.0%) | 0 (0.0%) |
| Total | 2,227 (59.9%) | 1,492 (40.1%) |
Female Fertility in Orange Beach
Fertility by Age in Orange Beach
| Age Bracket | Women with Births | Births / 1,000 Women |
| 15 to 19 years | 0 (0.0%) | 0.0 |
| 20 to 34 years | 0 (0.0%) | 0.0 |
| 35 to 50 years | 0 (0.0%) | 0.0 |
| Total | 0 (0.0%) | 0.0 |
Fertility by Age by Marriage Status in Orange Beach
| Age Bracket | Married | Unmarried |
| 15 to 19 years | 0 (0.0%) | 0 (0.0%) |
| 20 to 34 years | 0 (0.0%) | 0 (0.0%) |
| 35 to 50 years | 0 (0.0%) | 0 (0.0%) |
| Total | 0 (0.0%) | 0 (0.0%) |
Fertility by Education in Orange Beach
| Educational Attainment | Women with Births | Births / 1,000 Women |
| Less than High School | 0 (0.0%) | 0.0 |
| High School Diploma | 0 (0.0%) | 0.0 |
| College or Associate's Degree | 0 (0.0%) | 0.0 |
| Bachelor's Degree | 0 (0.0%) | 0.0 |
| Graduate Degree | 0 (0.0%) | 0.0 |
| Total | 0 (0.0%) | 0.0 |
Fertility by Education by Marriage Status in Orange Beach
| Educational Attainment | Married | Unmarried |
| Less than High School | 0 (0.0%) | 0 (0.0%) |
| High School Diploma | 0 (0.0%) | 0 (0.0%) |
| College or Associate's Degree | 0 (0.0%) | 0 (0.0%) |
| Bachelor's Degree | 0 (0.0%) | 0 (0.0%) |
| Graduate Degree | 0 (0.0%) | 0 (0.0%) |
| Total | 0 (0.0%) | 0 (0.0%) |
Employment Characteristics in Orange Beach
Employment by Class of Employer in Orange Beach
Among the 4,060 employed individuals in Orange Beach, private company employees (2,429 | 59.8%), self-employed (not incorporated) (646 | 15.9%), and self-employed (incorporated) (559 | 13.8%) make up the most common classes of employment.
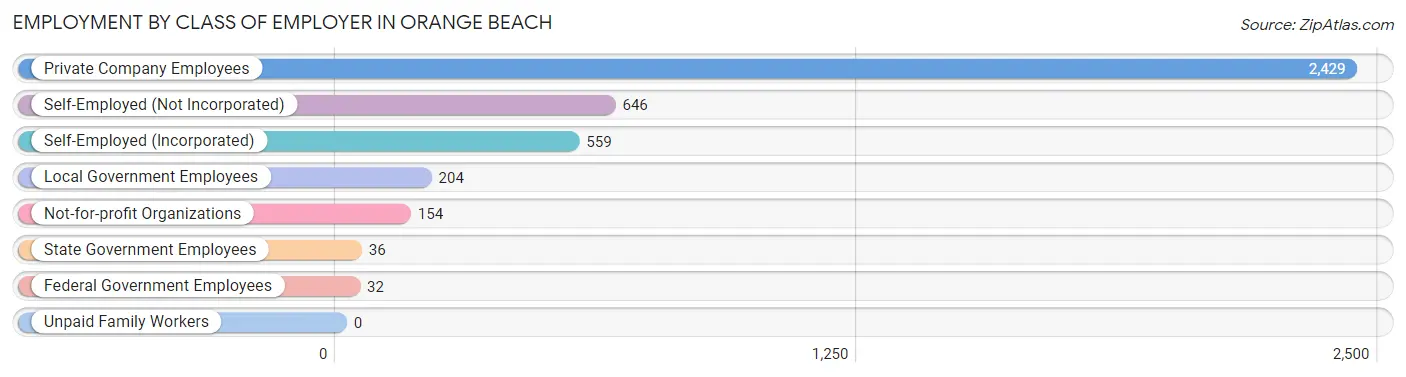
| Employer Class | # Employees | % Employees |
| Private Company Employees | 2,429 | 59.8% |
| Self-Employed (Incorporated) | 559 | 13.8% |
| Self-Employed (Not Incorporated) | 646 | 15.9% |
| Not-for-profit Organizations | 154 | 3.8% |
| Local Government Employees | 204 | 5.0% |
| State Government Employees | 36 | 0.9% |
| Federal Government Employees | 32 | 0.8% |
| Unpaid Family Workers | 0 | 0.0% |
| Total | 4,060 | 100.0% |
Employment Status by Age in Orange Beach
According to the labor force statistics for Orange Beach, out of the total population over 16 years of age (7,049), 61.6% or 4,342 individuals are in the labor force, with 4.4% or 191 of them unemployed. The age group with the highest labor force participation rate is 55 to 59 years, with 95.9% or 639 individuals in the labor force. Within the labor force, the 20 to 24 years age range has the highest percentage of unemployed individuals, with 21.1% or 63 of them being unemployed.
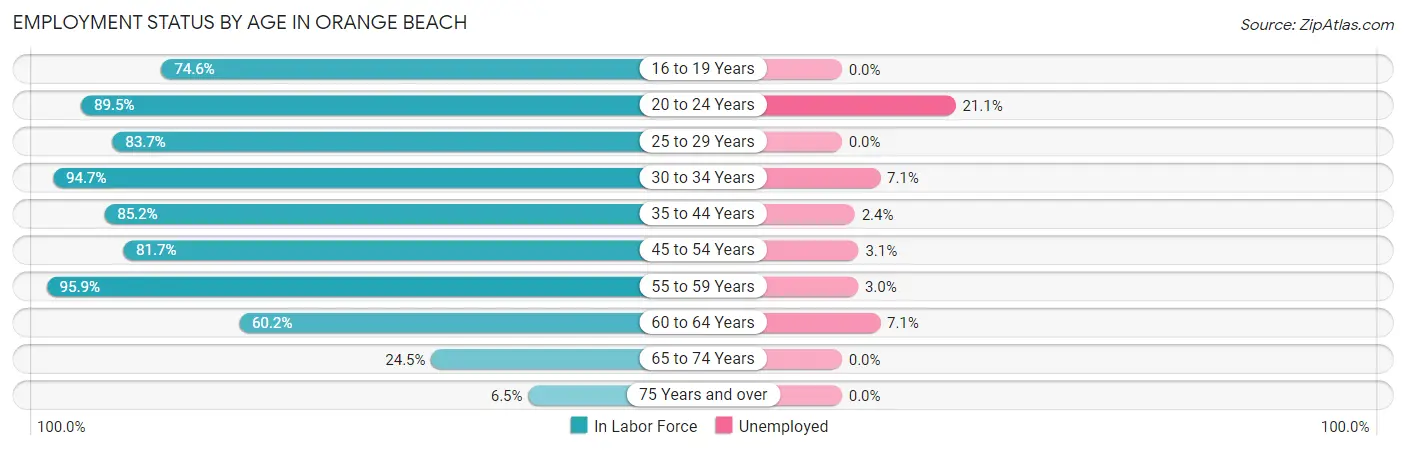
| Age Bracket | In Labor Force | Unemployed |
| 16 to 19 Years | 303 (74.6%) | 0 (0.0%) |
| 20 to 24 Years | 298 (89.5%) | 63 (21.1%) |
| 25 to 29 Years | 174 (83.7%) | 0 (0.0%) |
| 30 to 34 Years | 451 (94.7%) | 32 (7.1%) |
| 35 to 44 Years | 506 (85.2%) | 12 (2.4%) |
| 45 to 54 Years | 1,138 (81.7%) | 35 (3.1%) |
| 55 to 59 Years | 639 (95.9%) | 19 (3.0%) |
| 60 to 64 Years | 410 (60.2%) | 29 (7.1%) |
| 65 to 74 Years | 372 (24.5%) | 0 (0.0%) |
| 75 Years and over | 50 (6.5%) | 0 (0.0%) |
| Total | 4,342 (61.6%) | 191 (4.4%) |
Employment Status by Educational Attainment in Orange Beach
According to labor force statistics for Orange Beach, 82.6% of individuals (3,319) out of the total population between 25 and 64 years of age (4,018) are in the labor force, with 3.8% or 126 of them being unemployed. The group with the highest labor force participation rate are those with the educational attainment of bachelor's degree or higher, with 85.5% or 1,168 individuals in the labor force. Within the labor force, individuals with less than high school education have the highest percentage of unemployment, with 27.9% or 24 of them being unemployed.
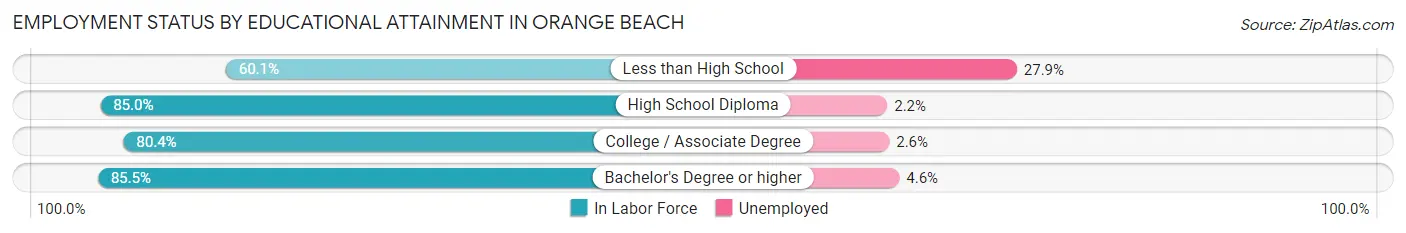
| Educational Attainment | In Labor Force | Unemployed |
| Less than High School | 86 (60.1%) | 40 (27.9%) |
| High School Diploma | 867 (85.0%) | 22 (2.2%) |
| College / Associate Degree | 1,197 (80.4%) | 39 (2.6%) |
| Bachelor's Degree or higher | 1,168 (85.5%) | 63 (4.6%) |
| Total | 3,319 (82.6%) | 153 (3.8%) |
Employment Occupations by Sex in Orange Beach
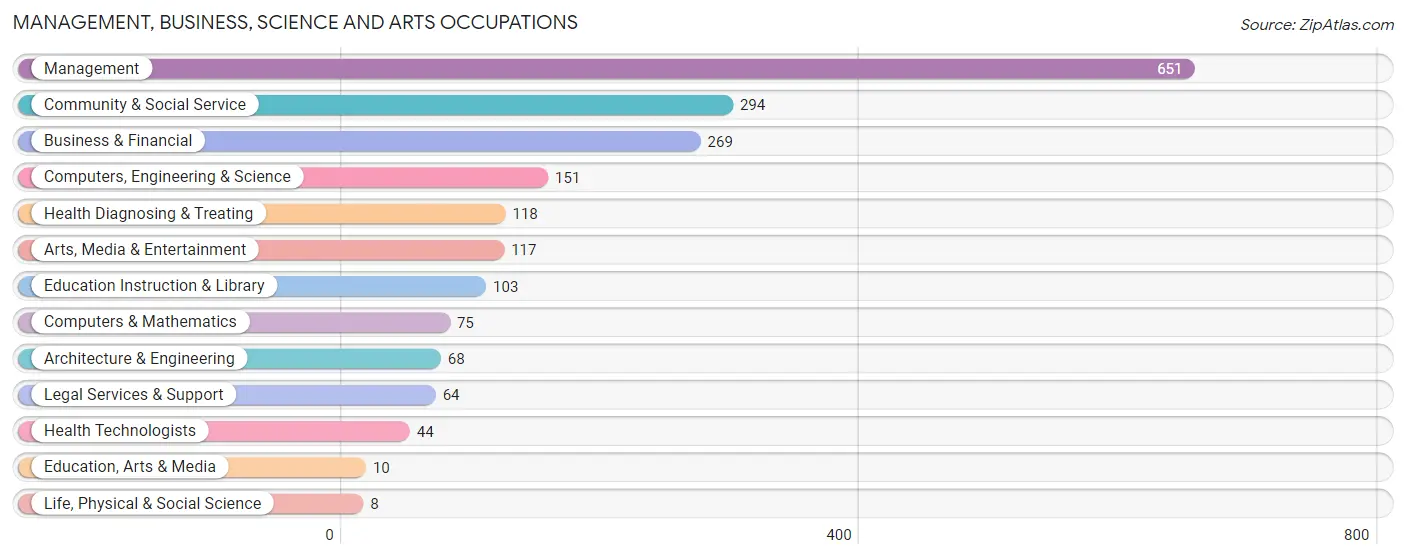
Management, Business, Science and Arts Occupations
The most common Management, Business, Science and Arts occupations in Orange Beach are Management (651 | 15.7%), Community & Social Service (294 | 7.1%), Business & Financial (269 | 6.5%), Computers, Engineering & Science (151 | 3.6%), and Health Diagnosing & Treating (118 | 2.9%).
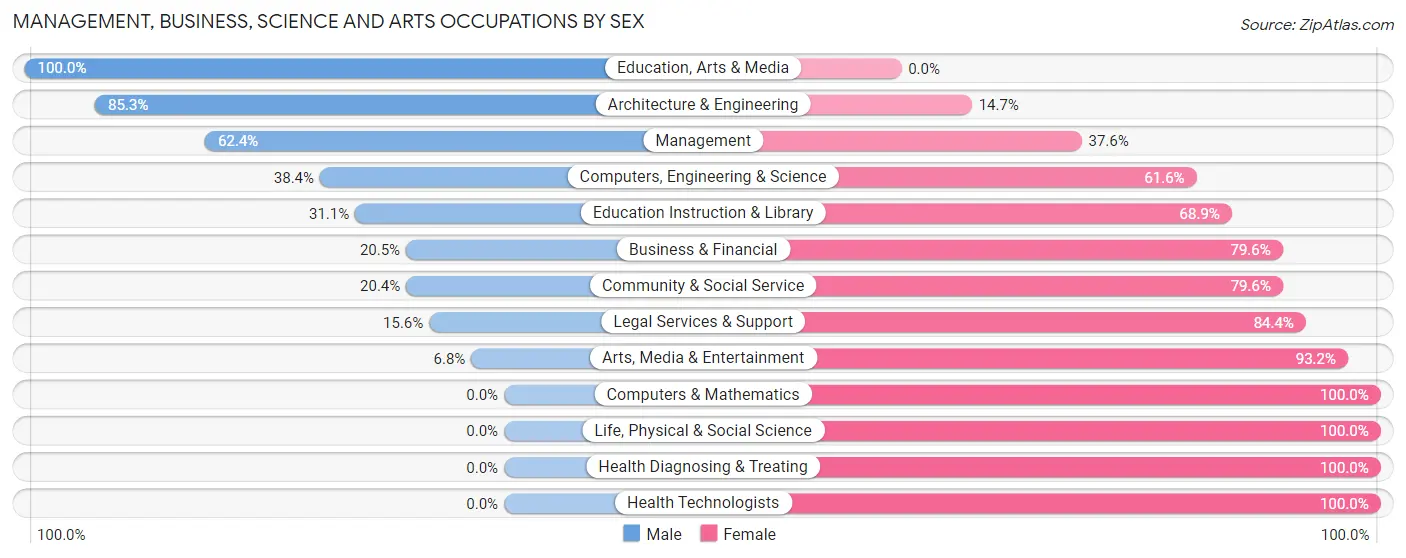
Management, Business, Science and Arts Occupations by Sex
Within the Management, Business, Science and Arts occupations in Orange Beach, the most male-oriented occupations are Education, Arts & Media (100.0%), Architecture & Engineering (85.3%), and Management (62.4%), while the most female-oriented occupations are Computers & Mathematics (100.0%), Life, Physical & Social Science (100.0%), and Health Diagnosing & Treating (100.0%).
| Occupation | Male | Female |
| Management | 406 (62.4%) | 245 (37.6%) |
| Business & Financial | 55 (20.4%) | 214 (79.5%) |
| Computers, Engineering & Science | 58 (38.4%) | 93 (61.6%) |
| Computers & Mathematics | 0 (0.0%) | 75 (100.0%) |
| Architecture & Engineering | 58 (85.3%) | 10 (14.7%) |
| Life, Physical & Social Science | 0 (0.0%) | 8 (100.0%) |
| Community & Social Service | 60 (20.4%) | 234 (79.6%) |
| Education, Arts & Media | 10 (100.0%) | 0 (0.0%) |
| Legal Services & Support | 10 (15.6%) | 54 (84.4%) |
| Education Instruction & Library | 32 (31.1%) | 71 (68.9%) |
| Arts, Media & Entertainment | 8 (6.8%) | 109 (93.2%) |
| Health Diagnosing & Treating | 0 (0.0%) | 118 (100.0%) |
| Health Technologists | 0 (0.0%) | 44 (100.0%) |
| Total (Category) | 579 (39.0%) | 904 (61.0%) |
| Total (Overall) | 2,107 (50.9%) | 2,034 (49.1%) |
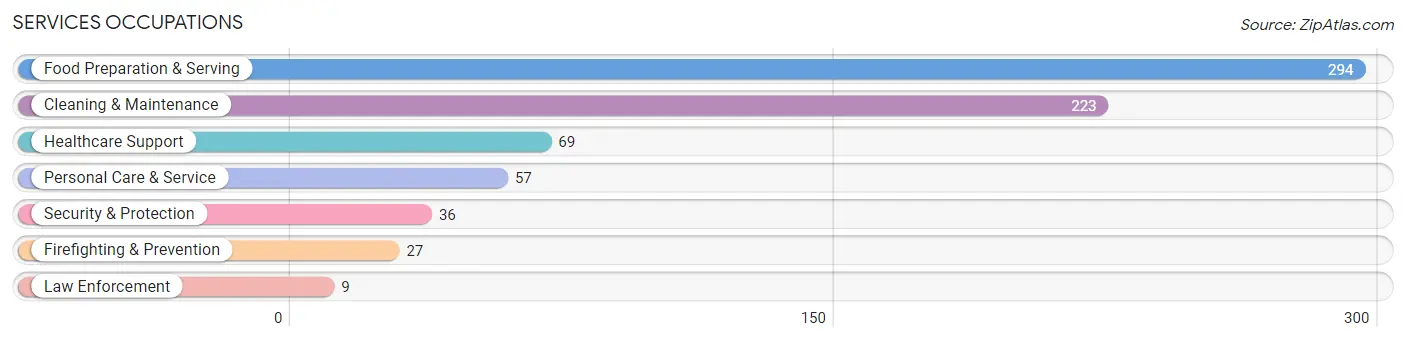
Services Occupations
The most common Services occupations in Orange Beach are Food Preparation & Serving (294 | 7.1%), Cleaning & Maintenance (223 | 5.4%), Healthcare Support (69 | 1.7%), Personal Care & Service (57 | 1.4%), and Security & Protection (36 | 0.9%).
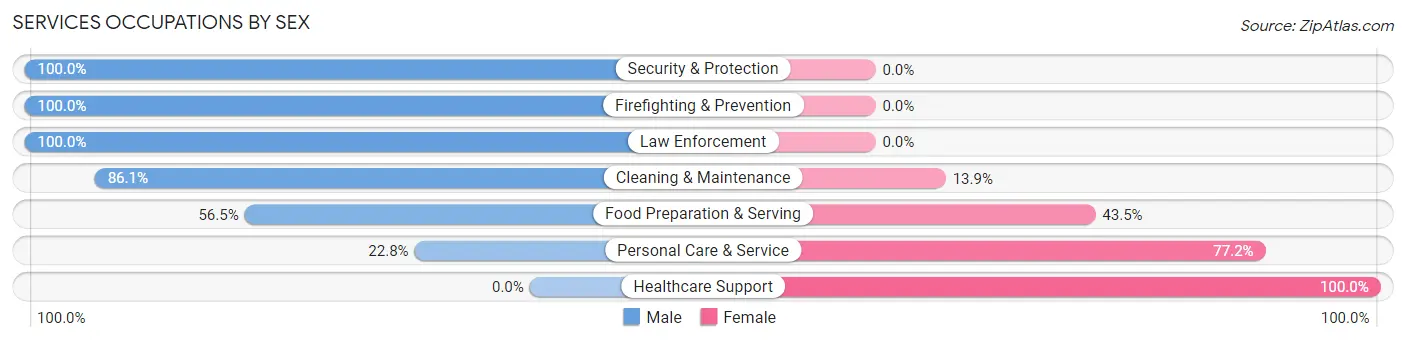
Services Occupations by Sex
Within the Services occupations in Orange Beach, the most male-oriented occupations are Security & Protection (100.0%), Firefighting & Prevention (100.0%), and Law Enforcement (100.0%), while the most female-oriented occupations are Healthcare Support (100.0%), Personal Care & Service (77.2%), and Food Preparation & Serving (43.5%).
| Occupation | Male | Female |
| Healthcare Support | 0 (0.0%) | 69 (100.0%) |
| Security & Protection | 36 (100.0%) | 0 (0.0%) |
| Firefighting & Prevention | 27 (100.0%) | 0 (0.0%) |
| Law Enforcement | 9 (100.0%) | 0 (0.0%) |
| Food Preparation & Serving | 166 (56.5%) | 128 (43.5%) |
| Cleaning & Maintenance | 192 (86.1%) | 31 (13.9%) |
| Personal Care & Service | 13 (22.8%) | 44 (77.2%) |
| Total (Category) | 407 (59.9%) | 272 (40.1%) |
| Total (Overall) | 2,107 (50.9%) | 2,034 (49.1%) |
Sales and Office Occupations
The most common Sales and Office occupations in Orange Beach are Sales & Related (849 | 20.5%), and Office & Administration (324 | 7.8%).
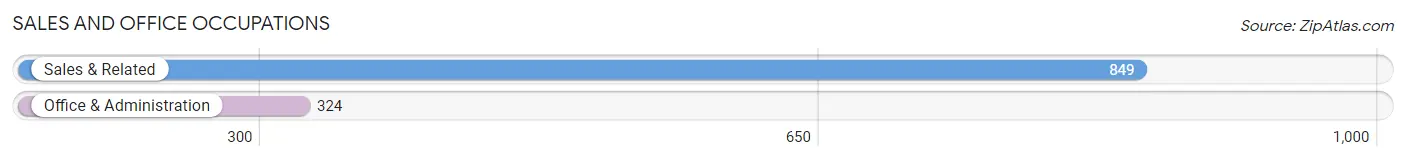
Sales and Office Occupations by Sex
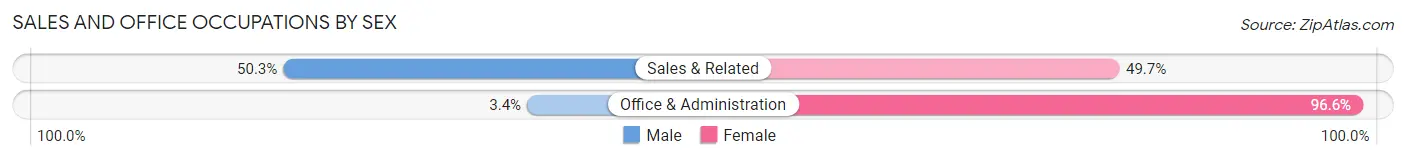
| Occupation | Male | Female |
| Sales & Related | 427 (50.3%) | 422 (49.7%) |
| Office & Administration | 11 (3.4%) | 313 (96.6%) |
| Total (Category) | 438 (37.3%) | 735 (62.7%) |
| Total (Overall) | 2,107 (50.9%) | 2,034 (49.1%) |
Natural Resources, Construction and Maintenance Occupations
The most common Natural Resources, Construction and Maintenance occupations in Orange Beach are Construction & Extraction (301 | 7.3%), Installation, Maintenance & Repair (35 | 0.9%), and Farming, Fishing & Forestry (16 | 0.4%).
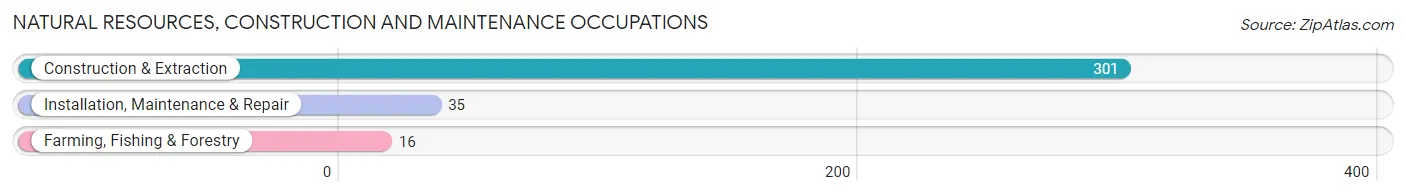
Natural Resources, Construction and Maintenance Occupations by Sex
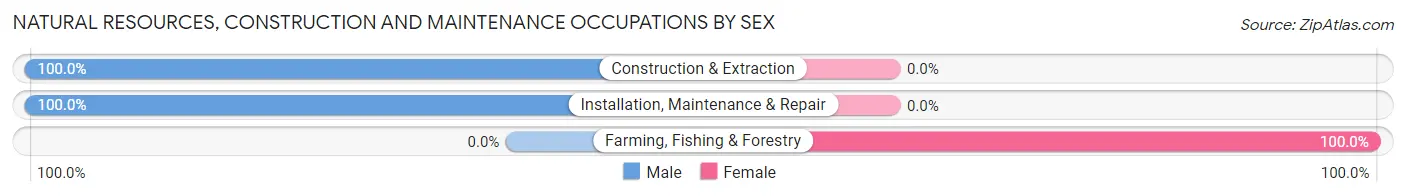
| Occupation | Male | Female |
| Farming, Fishing & Forestry | 0 (0.0%) | 16 (100.0%) |
| Construction & Extraction | 301 (100.0%) | 0 (0.0%) |
| Installation, Maintenance & Repair | 35 (100.0%) | 0 (0.0%) |
| Total (Category) | 336 (95.5%) | 16 (4.5%) |
| Total (Overall) | 2,107 (50.9%) | 2,034 (49.1%) |
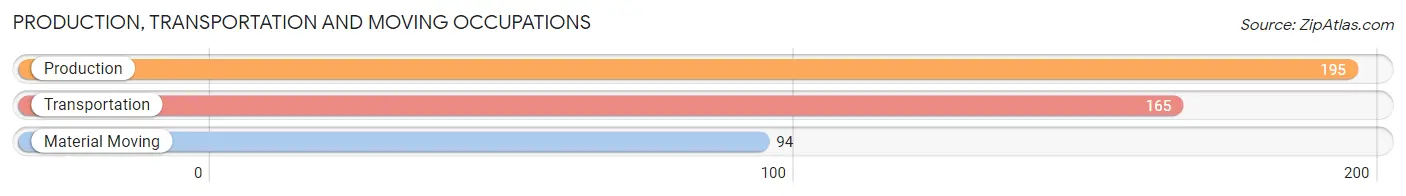
Production, Transportation and Moving Occupations
The most common Production, Transportation and Moving occupations in Orange Beach are Production (195 | 4.7%), Transportation (165 | 4.0%), and Material Moving (94 | 2.3%).
Production, Transportation and Moving Occupations by Sex
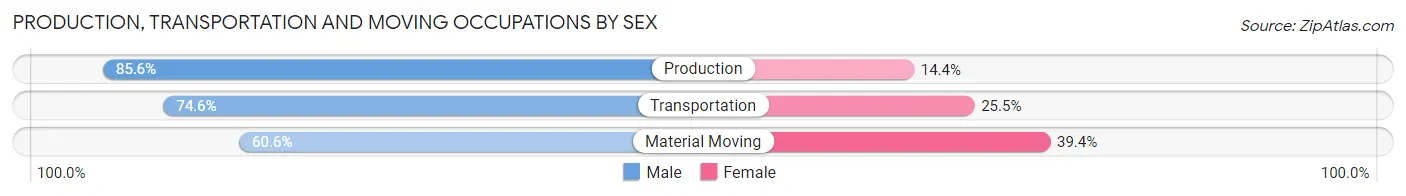
| Occupation | Male | Female |
| Production | 167 (85.6%) | 28 (14.4%) |
| Transportation | 123 (74.6%) | 42 (25.5%) |
| Material Moving | 57 (60.6%) | 37 (39.4%) |
| Total (Category) | 347 (76.4%) | 107 (23.6%) |
| Total (Overall) | 2,107 (50.9%) | 2,034 (49.1%) |
Employment Industries by Sex in Orange Beach
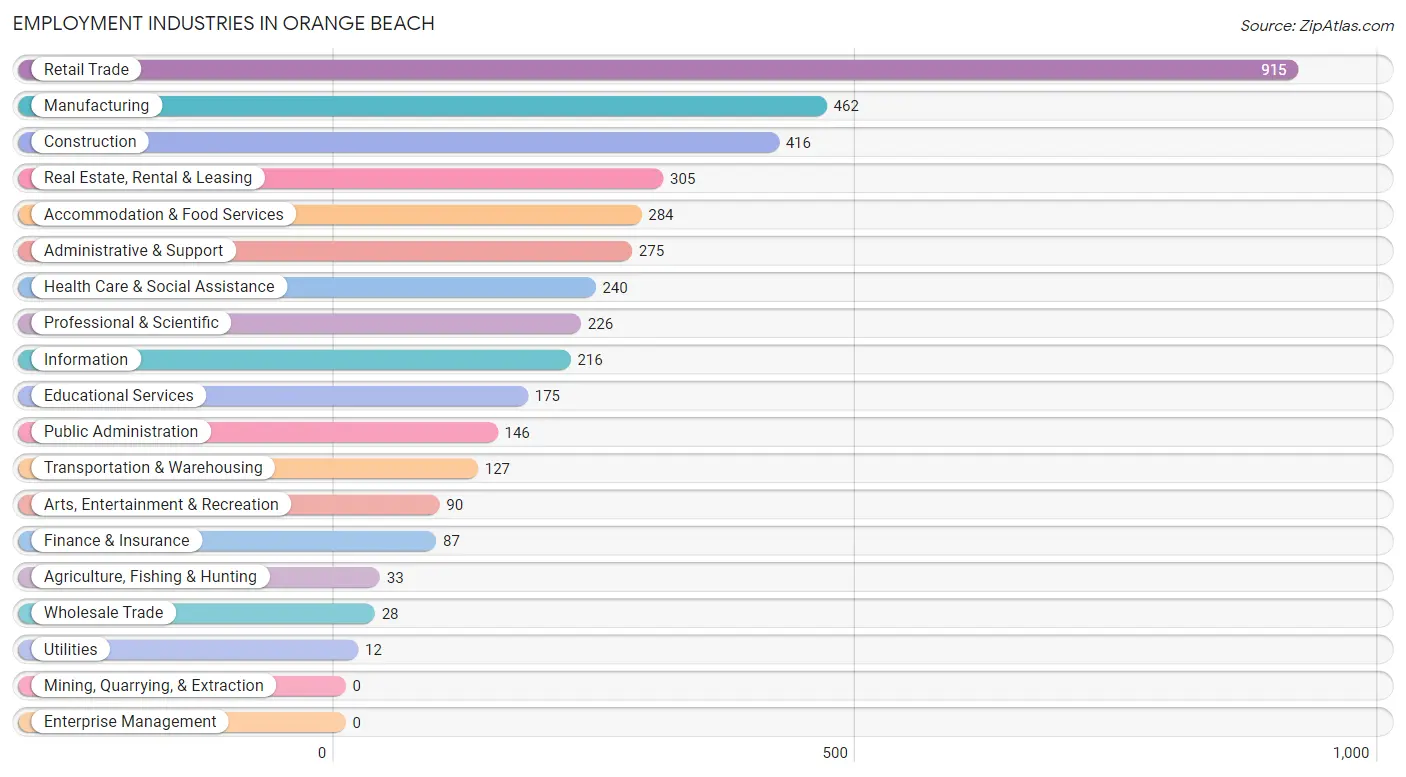
Employment Industries in Orange Beach
The major employment industries in Orange Beach include Retail Trade (915 | 22.1%), Manufacturing (462 | 11.2%), Construction (416 | 10.1%), Real Estate, Rental & Leasing (305 | 7.4%), and Accommodation & Food Services (284 | 6.9%).
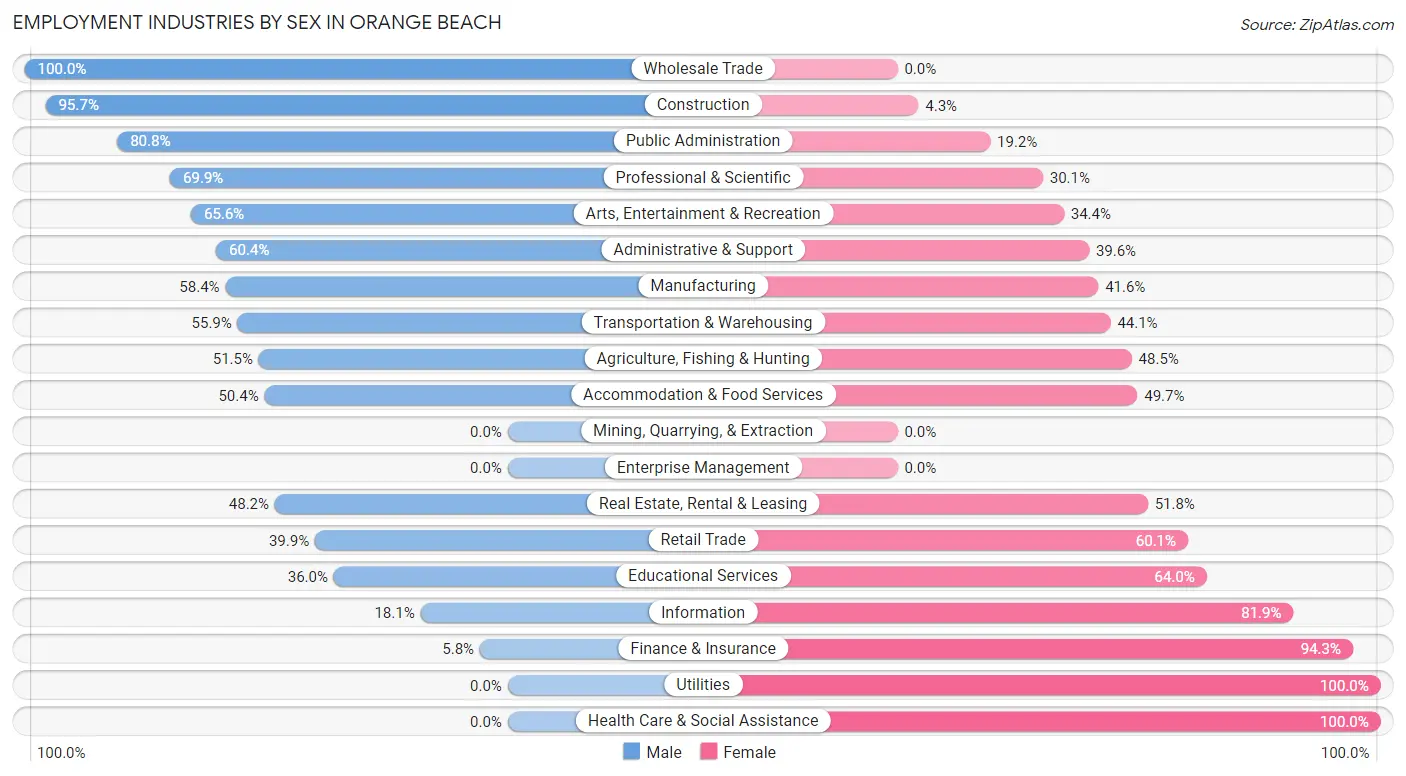
Employment Industries by Sex in Orange Beach
The Orange Beach industries that see more men than women are Wholesale Trade (100.0%), Construction (95.7%), and Public Administration (80.8%), whereas the industries that tend to have a higher number of women are Utilities (100.0%), Health Care & Social Assistance (100.0%), and Finance & Insurance (94.3%).
| Industry | Male | Female |
| Agriculture, Fishing & Hunting | 17 (51.5%) | 16 (48.5%) |
| Mining, Quarrying, & Extraction | 0 (0.0%) | 0 (0.0%) |
| Construction | 398 (95.7%) | 18 (4.3%) |
| Manufacturing | 270 (58.4%) | 192 (41.6%) |
| Wholesale Trade | 28 (100.0%) | 0 (0.0%) |
| Retail Trade | 365 (39.9%) | 550 (60.1%) |
| Transportation & Warehousing | 71 (55.9%) | 56 (44.1%) |
| Utilities | 0 (0.0%) | 12 (100.0%) |
| Information | 39 (18.1%) | 177 (81.9%) |
| Finance & Insurance | 5 (5.8%) | 82 (94.3%) |
| Real Estate, Rental & Leasing | 147 (48.2%) | 158 (51.8%) |
| Professional & Scientific | 158 (69.9%) | 68 (30.1%) |
| Enterprise Management | 0 (0.0%) | 0 (0.0%) |
| Administrative & Support | 166 (60.4%) | 109 (39.6%) |
| Educational Services | 63 (36.0%) | 112 (64.0%) |
| Health Care & Social Assistance | 0 (0.0%) | 240 (100.0%) |
| Arts, Entertainment & Recreation | 59 (65.6%) | 31 (34.4%) |
| Accommodation & Food Services | 143 (50.3%) | 141 (49.6%) |
| Public Administration | 118 (80.8%) | 28 (19.2%) |
| Total | 2,107 (50.9%) | 2,034 (49.1%) |
Education in Orange Beach
School Enrollment in Orange Beach
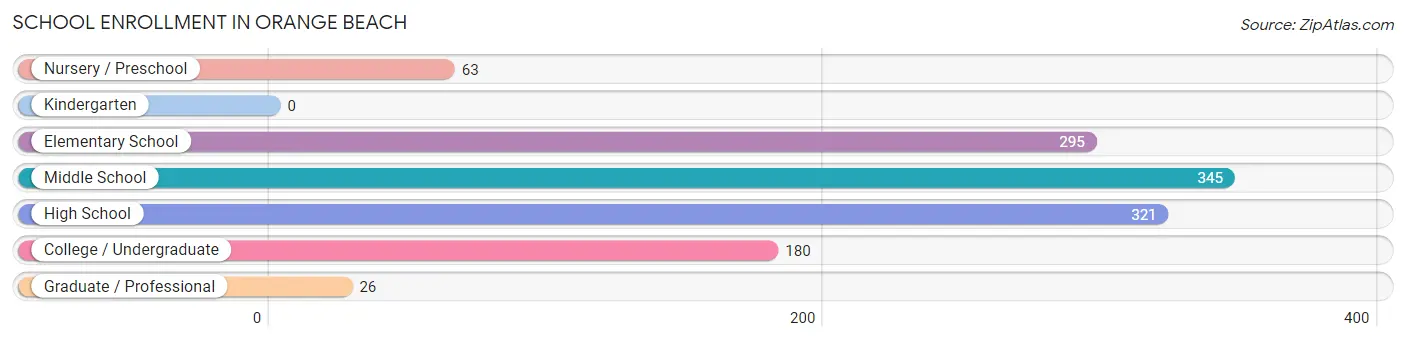
The most common levels of schooling among the 1,230 students in Orange Beach are middle school (345 | 28.1%), high school (321 | 26.1%), and elementary school (295 | 24.0%).
| School Level | # Students | % Students |
| Nursery / Preschool | 63 | 5.1% |
| Kindergarten | 0 | 0.0% |
| Elementary School | 295 | 24.0% |
| Middle School | 345 | 28.1% |
| High School | 321 | 26.1% |
| College / Undergraduate | 180 | 14.6% |
| Graduate / Professional | 26 | 2.1% |
| Total | 1,230 | 100.0% |
School Enrollment by Age by Funding Source in Orange Beach
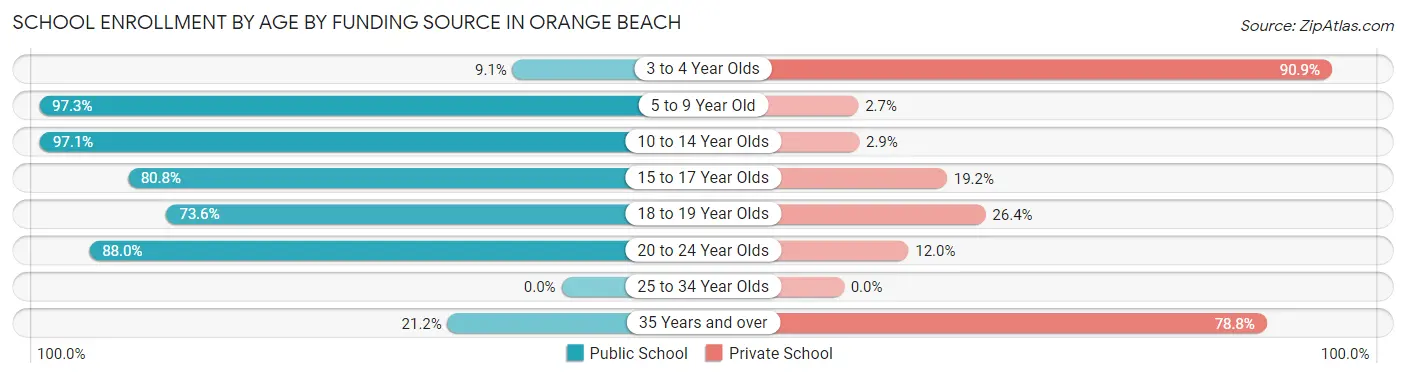
Out of a total of 1,230 students who are enrolled in schools in Orange Beach, 184 (15.0%) attend a private institution, while the remaining 1,046 (85.0%) are enrolled in public schools. The age group of 3 to 4 year olds has the highest likelihood of being enrolled in private schools, with 50 (90.9% in the age bracket) enrolled. Conversely, the age group of 5 to 9 year old has the lowest likelihood of being enrolled in a private school, with 287 (97.3% in the age bracket) attending a public institution.
| Age Bracket | Public School | Private School |
| 3 to 4 Year Olds | 5 (9.1%) | 50 (90.9%) |
| 5 to 9 Year Old | 287 (97.3%) | 8 (2.7%) |
| 10 to 14 Year Olds | 374 (97.1%) | 11 (2.9%) |
| 15 to 17 Year Olds | 185 (80.8%) | 44 (19.2%) |
| 18 to 19 Year Olds | 92 (73.6%) | 33 (26.4%) |
| 20 to 24 Year Olds | 95 (88.0%) | 13 (12.0%) |
| 25 to 34 Year Olds | 0 (0.0%) | 0 (0.0%) |
| 35 Years and over | 7 (21.2%) | 26 (78.8%) |
| Total | 1,046 (85.0%) | 184 (15.0%) |
Educational Attainment by Field of Study in Orange Beach
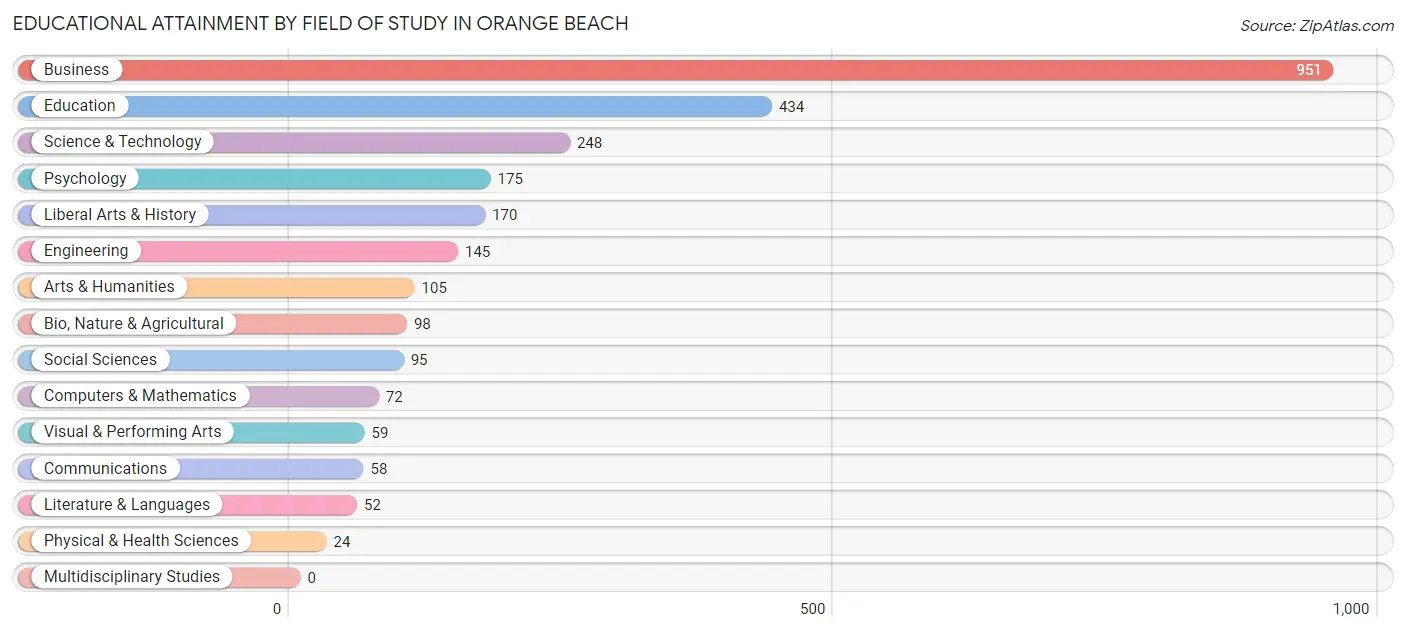
Business (951 | 35.4%), education (434 | 16.2%), science & technology (248 | 9.2%), psychology (175 | 6.5%), and liberal arts & history (170 | 6.3%) are the most common fields of study among 2,686 individuals in Orange Beach who have obtained a bachelor's degree or higher.
| Field of Study | # Graduates | % Graduates |
| Computers & Mathematics | 72 | 2.7% |
| Bio, Nature & Agricultural | 98 | 3.6% |
| Physical & Health Sciences | 24 | 0.9% |
| Psychology | 175 | 6.5% |
| Social Sciences | 95 | 3.5% |
| Engineering | 145 | 5.4% |
| Multidisciplinary Studies | 0 | 0.0% |
| Science & Technology | 248 | 9.2% |
| Business | 951 | 35.4% |
| Education | 434 | 16.2% |
| Literature & Languages | 52 | 1.9% |
| Liberal Arts & History | 170 | 6.3% |
| Visual & Performing Arts | 59 | 2.2% |
| Communications | 58 | 2.2% |
| Arts & Humanities | 105 | 3.9% |
| Total | 2,686 | 100.0% |
Transportation & Commute in Orange Beach
Vehicle Availability by Sex in Orange Beach
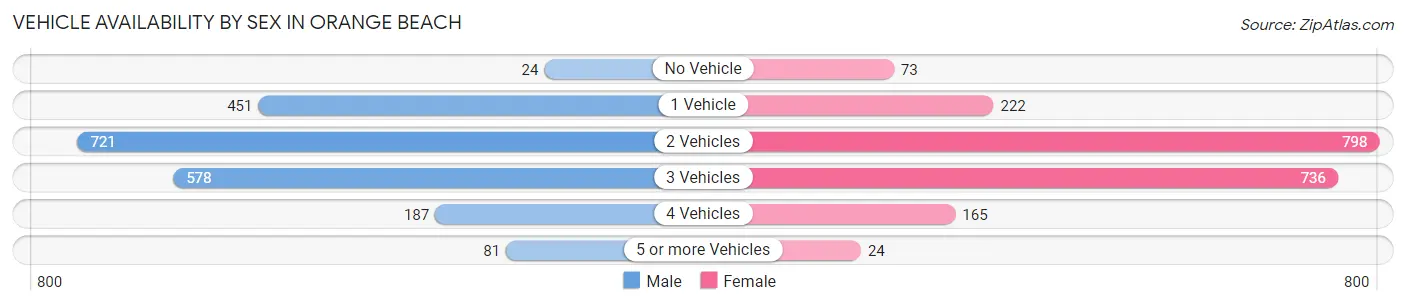
The most prevalent vehicle ownership categories in Orange Beach are males with 2 vehicles (721, accounting for 35.3%) and females with 2 vehicles (798, making up 35.7%).
| Vehicles Available | Male | Female |
| No Vehicle | 24 (1.2%) | 73 (3.6%) |
| 1 Vehicle | 451 (22.1%) | 222 (11.0%) |
| 2 Vehicles | 721 (35.3%) | 798 (39.5%) |
| 3 Vehicles | 578 (28.3%) | 736 (36.5%) |
| 4 Vehicles | 187 (9.2%) | 165 (8.2%) |
| 5 or more Vehicles | 81 (4.0%) | 24 (1.2%) |
| Total | 2,042 (100.0%) | 2,018 (100.0%) |
Commute Time in Orange Beach
The most frequently occuring commute durations in Orange Beach are 10 to 14 minutes (930 commuters, 27.9%), 5 to 9 minutes (510 commuters, 15.3%), and 15 to 19 minutes (445 commuters, 13.4%).
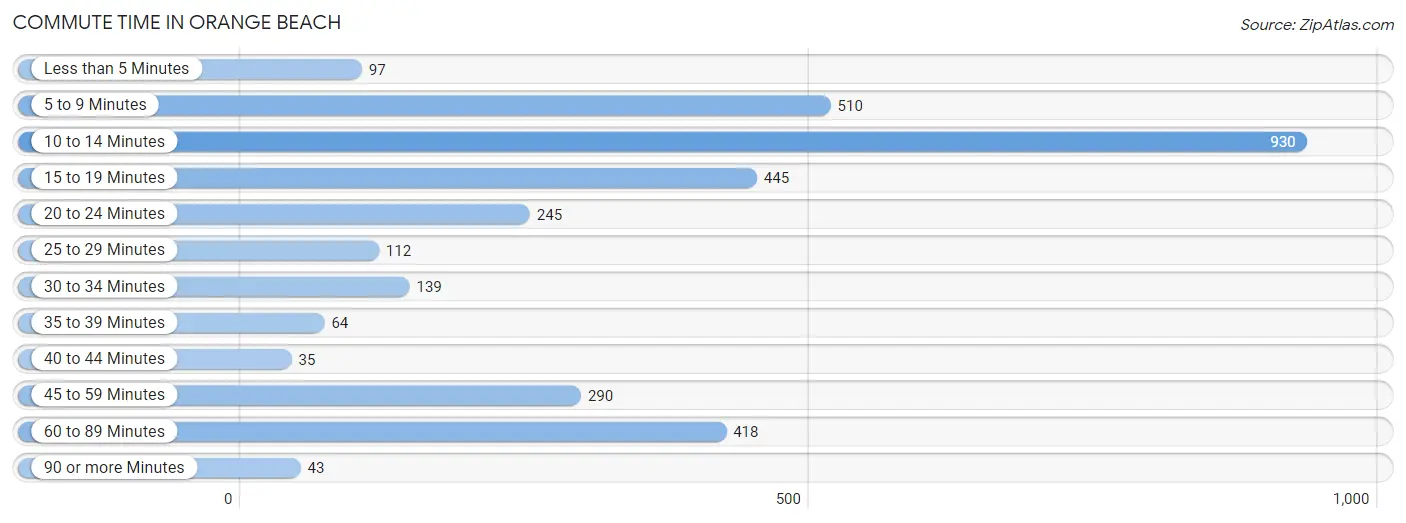
| Commute Time | # Commuters | % Commuters |
| Less than 5 Minutes | 97 | 2.9% |
| 5 to 9 Minutes | 510 | 15.3% |
| 10 to 14 Minutes | 930 | 27.9% |
| 15 to 19 Minutes | 445 | 13.4% |
| 20 to 24 Minutes | 245 | 7.4% |
| 25 to 29 Minutes | 112 | 3.4% |
| 30 to 34 Minutes | 139 | 4.2% |
| 35 to 39 Minutes | 64 | 1.9% |
| 40 to 44 Minutes | 35 | 1.1% |
| 45 to 59 Minutes | 290 | 8.7% |
| 60 to 89 Minutes | 418 | 12.6% |
| 90 or more Minutes | 43 | 1.3% |
Commute Time by Sex in Orange Beach
The most common commute times in Orange Beach are 10 to 14 minutes (487 commuters, 28.6%) for males and 10 to 14 minutes (443 commuters, 27.3%) for females.
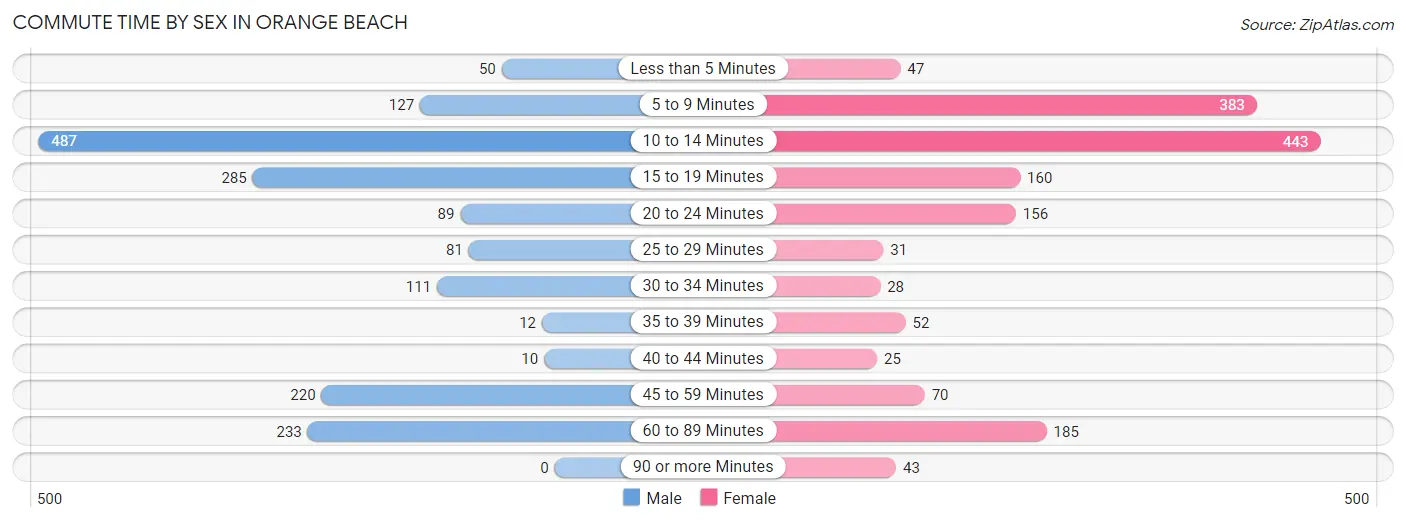
| Commute Time | Male | Female |
| Less than 5 Minutes | 50 (2.9%) | 47 (2.9%) |
| 5 to 9 Minutes | 127 (7.4%) | 383 (23.6%) |
| 10 to 14 Minutes | 487 (28.6%) | 443 (27.3%) |
| 15 to 19 Minutes | 285 (16.7%) | 160 (9.9%) |
| 20 to 24 Minutes | 89 (5.2%) | 156 (9.6%) |
| 25 to 29 Minutes | 81 (4.8%) | 31 (1.9%) |
| 30 to 34 Minutes | 111 (6.5%) | 28 (1.7%) |
| 35 to 39 Minutes | 12 (0.7%) | 52 (3.2%) |
| 40 to 44 Minutes | 10 (0.6%) | 25 (1.5%) |
| 45 to 59 Minutes | 220 (12.9%) | 70 (4.3%) |
| 60 to 89 Minutes | 233 (13.7%) | 185 (11.4%) |
| 90 or more Minutes | 0 (0.0%) | 43 (2.6%) |
Time of Departure to Work by Sex in Orange Beach
The most frequent times of departure to work in Orange Beach are 7:00 AM to 7:29 AM (352, 20.6%) for males and 7:00 AM to 7:29 AM (265, 16.3%) for females.
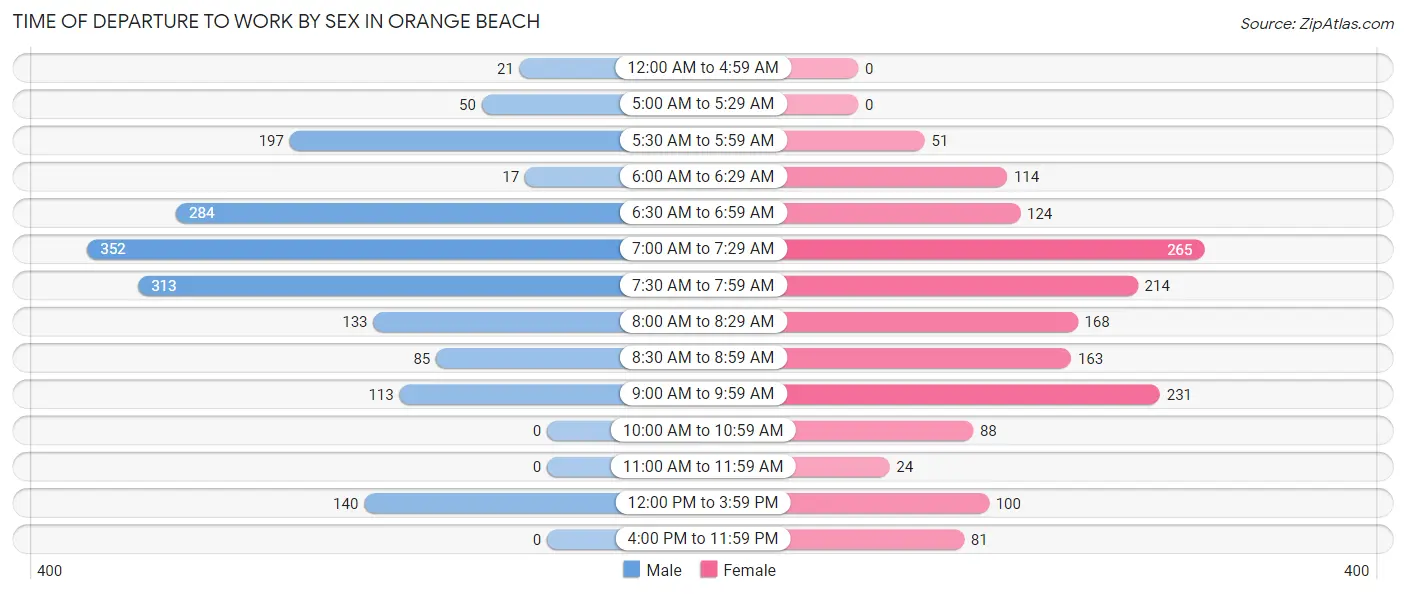
| Time of Departure | Male | Female |
| 12:00 AM to 4:59 AM | 21 (1.2%) | 0 (0.0%) |
| 5:00 AM to 5:29 AM | 50 (2.9%) | 0 (0.0%) |
| 5:30 AM to 5:59 AM | 197 (11.6%) | 51 (3.1%) |
| 6:00 AM to 6:29 AM | 17 (1.0%) | 114 (7.0%) |
| 6:30 AM to 6:59 AM | 284 (16.7%) | 124 (7.6%) |
| 7:00 AM to 7:29 AM | 352 (20.6%) | 265 (16.3%) |
| 7:30 AM to 7:59 AM | 313 (18.4%) | 214 (13.2%) |
| 8:00 AM to 8:29 AM | 133 (7.8%) | 168 (10.3%) |
| 8:30 AM to 8:59 AM | 85 (5.0%) | 163 (10.0%) |
| 9:00 AM to 9:59 AM | 113 (6.6%) | 231 (14.2%) |
| 10:00 AM to 10:59 AM | 0 (0.0%) | 88 (5.4%) |
| 11:00 AM to 11:59 AM | 0 (0.0%) | 24 (1.5%) |
| 12:00 PM to 3:59 PM | 140 (8.2%) | 100 (6.2%) |
| 4:00 PM to 11:59 PM | 0 (0.0%) | 81 (5.0%) |
| Total | 1,705 (100.0%) | 1,623 (100.0%) |
Housing Occupancy in Orange Beach
Occupancy by Ownership in Orange Beach
Of the total 3,719 dwellings in Orange Beach, owner-occupied units account for 2,537 (68.2%), while renter-occupied units make up 1,182 (31.8%).
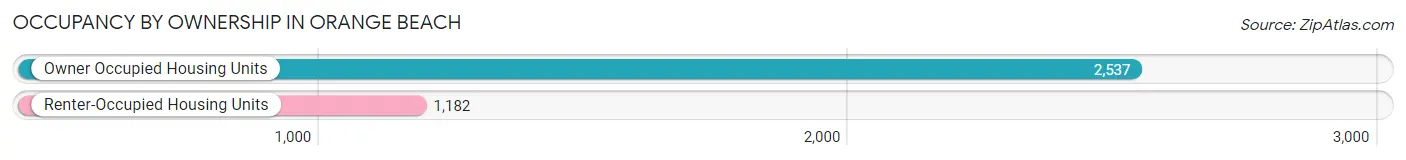
| Occupancy | # Housing Units | % Housing Units |
| Owner Occupied Housing Units | 2,537 | 68.2% |
| Renter-Occupied Housing Units | 1,182 | 31.8% |
| Total Occupied Housing Units | 3,719 | 100.0% |
Occupancy by Household Size in Orange Beach
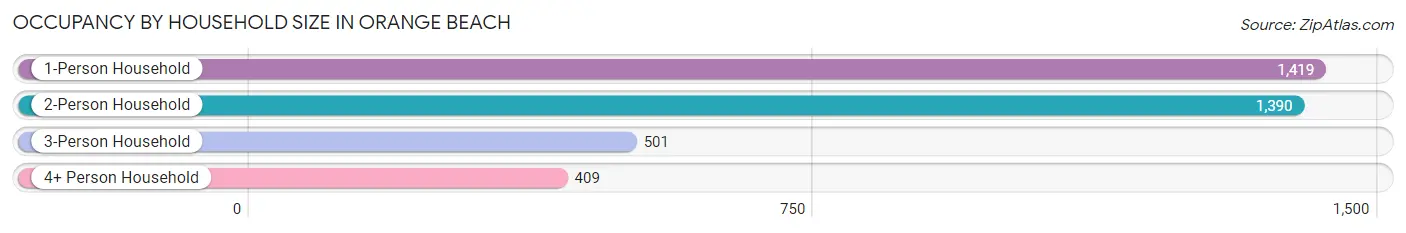
| Household Size | # Housing Units | % Housing Units |
| 1-Person Household | 1,419 | 38.2% |
| 2-Person Household | 1,390 | 37.4% |
| 3-Person Household | 501 | 13.5% |
| 4+ Person Household | 409 | 11.0% |
| Total Housing Units | 3,719 | 100.0% |
Occupancy by Ownership by Household Size in Orange Beach
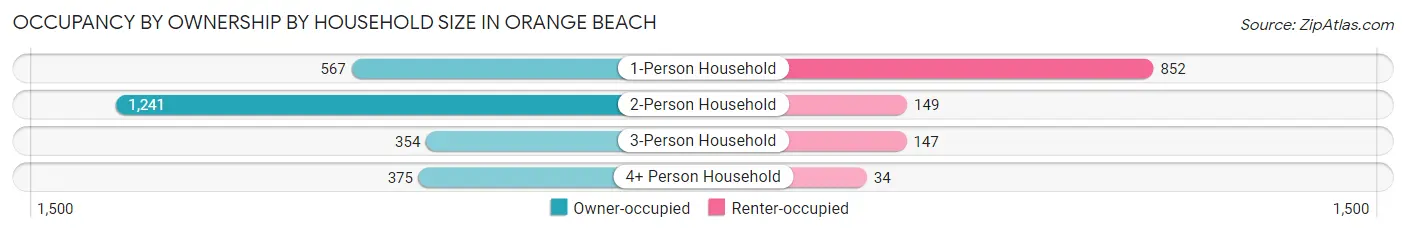
| Household Size | Owner-occupied | Renter-occupied |
| 1-Person Household | 567 (40.0%) | 852 (60.0%) |
| 2-Person Household | 1,241 (89.3%) | 149 (10.7%) |
| 3-Person Household | 354 (70.7%) | 147 (29.3%) |
| 4+ Person Household | 375 (91.7%) | 34 (8.3%) |
| Total Housing Units | 2,537 (68.2%) | 1,182 (31.8%) |
Occupancy by Educational Attainment in Orange Beach
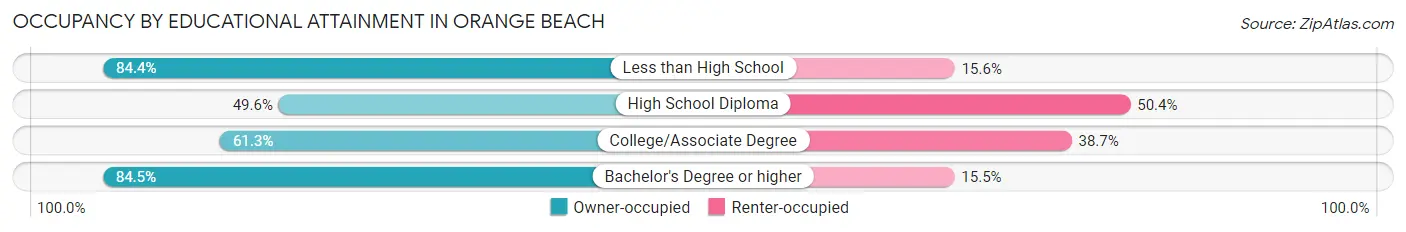
| Household Size | Owner-occupied | Renter-occupied |
| Less than High School | 65 (84.4%) | 12 (15.6%) |
| High School Diploma | 504 (49.6%) | 512 (50.4%) |
| College/Associate Degree | 661 (61.3%) | 418 (38.7%) |
| Bachelor's Degree or higher | 1,307 (84.5%) | 240 (15.5%) |
Occupancy by Age of Householder in Orange Beach
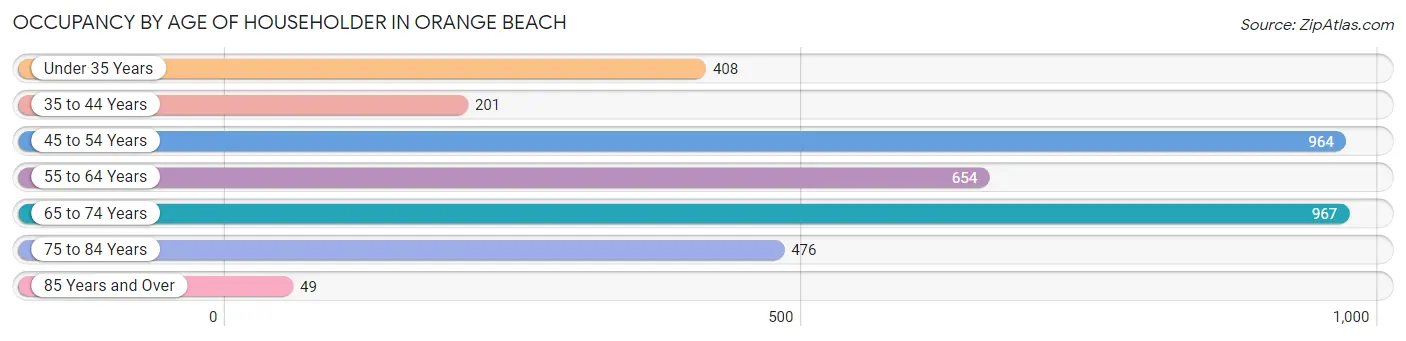
| Age Bracket | # Households | % Households |
| Under 35 Years | 408 | 11.0% |
| 35 to 44 Years | 201 | 5.4% |
| 45 to 54 Years | 964 | 25.9% |
| 55 to 64 Years | 654 | 17.6% |
| 65 to 74 Years | 967 | 26.0% |
| 75 to 84 Years | 476 | 12.8% |
| 85 Years and Over | 49 | 1.3% |
| Total | 3,719 | 100.0% |
Housing Finances in Orange Beach
Median Income by Occupancy in Orange Beach
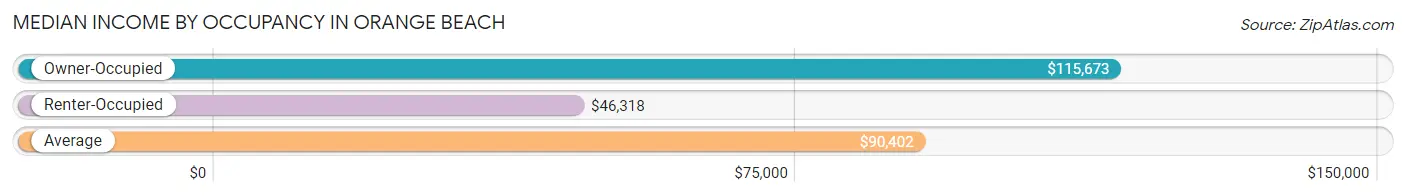
| Occupancy Type | # Households | Median Income |
| Owner-Occupied | 2,537 (68.2%) | $115,673 |
| Renter-Occupied | 1,182 (31.8%) | $46,318 |
| Average | 3,719 (100.0%) | $90,402 |
Occupancy by Householder Income Bracket in Orange Beach
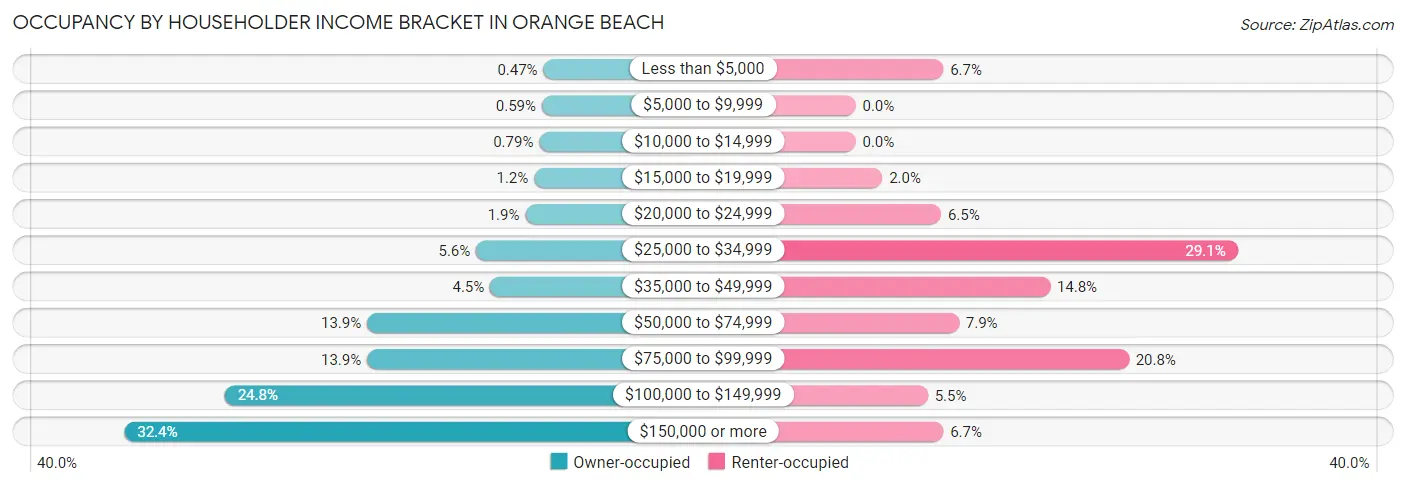
| Income Bracket | Owner-occupied | Renter-occupied |
| Less than $5,000 | 12 (0.5%) | 79 (6.7%) |
| $5,000 to $9,999 | 15 (0.6%) | 0 (0.0%) |
| $10,000 to $14,999 | 20 (0.8%) | 0 (0.0%) |
| $15,000 to $19,999 | 30 (1.2%) | 24 (2.0%) |
| $20,000 to $24,999 | 47 (1.8%) | 77 (6.5%) |
| $25,000 to $34,999 | 142 (5.6%) | 344 (29.1%) |
| $35,000 to $49,999 | 115 (4.5%) | 175 (14.8%) |
| $50,000 to $74,999 | 353 (13.9%) | 93 (7.9%) |
| $75,000 to $99,999 | 353 (13.9%) | 246 (20.8%) |
| $100,000 to $149,999 | 628 (24.7%) | 65 (5.5%) |
| $150,000 or more | 822 (32.4%) | 79 (6.7%) |
| Total | 2,537 (100.0%) | 1,182 (100.0%) |
Monthly Housing Cost Tiers in Orange Beach
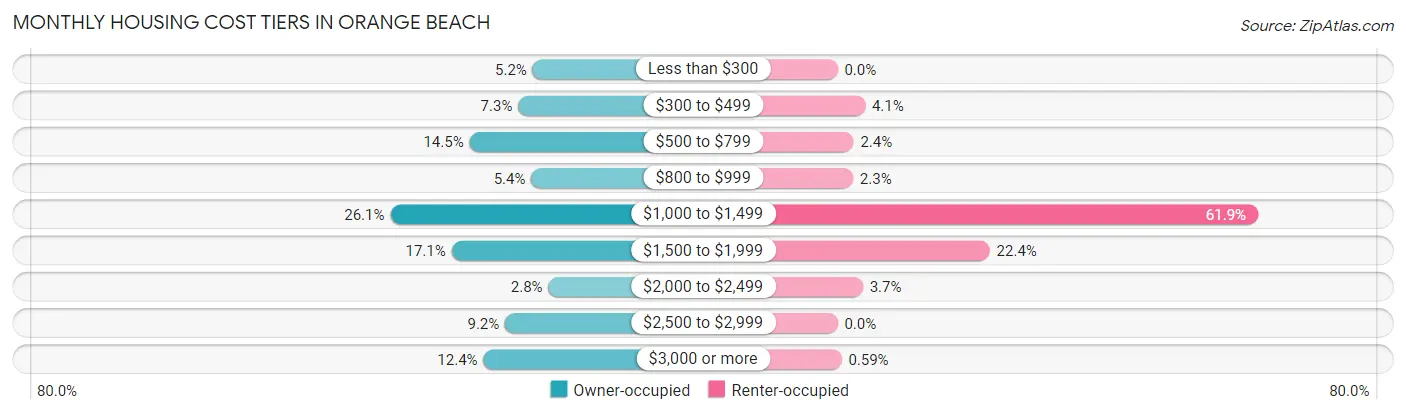
| Monthly Cost | Owner-occupied | Renter-occupied |
| Less than $300 | 131 (5.2%) | 0 (0.0%) |
| $300 to $499 | 185 (7.3%) | 48 (4.1%) |
| $500 to $799 | 367 (14.5%) | 28 (2.4%) |
| $800 to $999 | 136 (5.4%) | 27 (2.3%) |
| $1,000 to $1,499 | 663 (26.1%) | 732 (61.9%) |
| $1,500 to $1,999 | 434 (17.1%) | 265 (22.4%) |
| $2,000 to $2,499 | 72 (2.8%) | 44 (3.7%) |
| $2,500 to $2,999 | 234 (9.2%) | 0 (0.0%) |
| $3,000 or more | 315 (12.4%) | 7 (0.6%) |
| Total | 2,537 (100.0%) | 1,182 (100.0%) |
Physical Housing Characteristics in Orange Beach
Housing Structures in Orange Beach
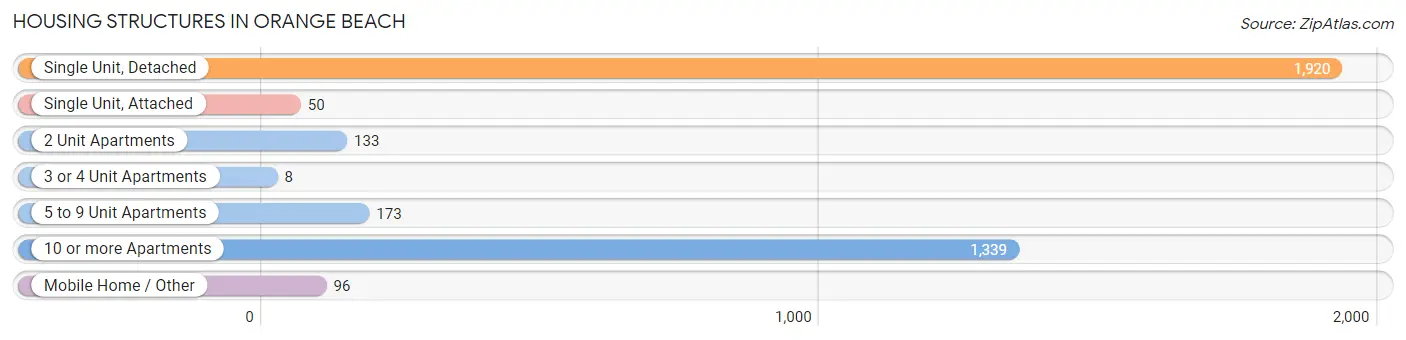
| Structure Type | # Housing Units | % Housing Units |
| Single Unit, Detached | 1,920 | 51.6% |
| Single Unit, Attached | 50 | 1.3% |
| 2 Unit Apartments | 133 | 3.6% |
| 3 or 4 Unit Apartments | 8 | 0.2% |
| 5 to 9 Unit Apartments | 173 | 4.6% |
| 10 or more Apartments | 1,339 | 36.0% |
| Mobile Home / Other | 96 | 2.6% |
| Total | 3,719 | 100.0% |
Housing Structures by Occupancy in Orange Beach
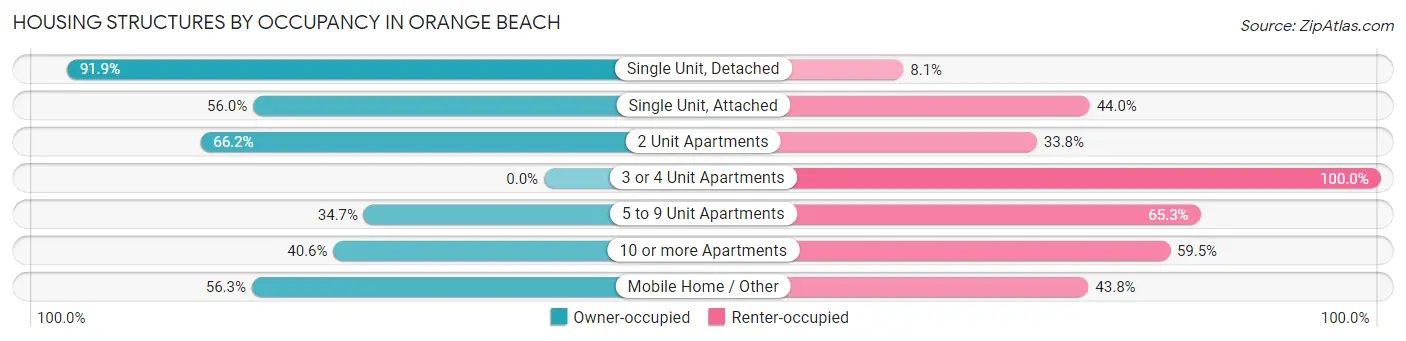
| Structure Type | Owner-occupied | Renter-occupied |
| Single Unit, Detached | 1,764 (91.9%) | 156 (8.1%) |
| Single Unit, Attached | 28 (56.0%) | 22 (44.0%) |
| 2 Unit Apartments | 88 (66.2%) | 45 (33.8%) |
| 3 or 4 Unit Apartments | 0 (0.0%) | 8 (100.0%) |
| 5 to 9 Unit Apartments | 60 (34.7%) | 113 (65.3%) |
| 10 or more Apartments | 543 (40.6%) | 796 (59.5%) |
| Mobile Home / Other | 54 (56.2%) | 42 (43.8%) |
| Total | 2,537 (68.2%) | 1,182 (31.8%) |
Housing Structures by Number of Rooms in Orange Beach
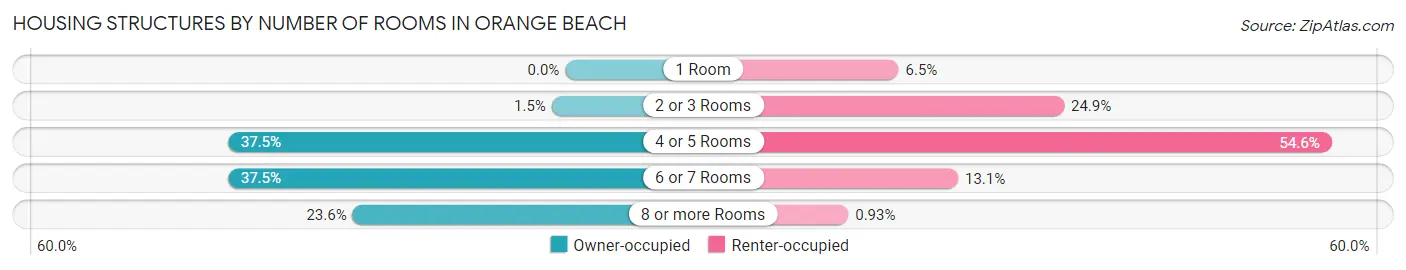
| Number of Rooms | Owner-occupied | Renter-occupied |
| 1 Room | 0 (0.0%) | 77 (6.5%) |
| 2 or 3 Rooms | 38 (1.5%) | 294 (24.9%) |
| 4 or 5 Rooms | 950 (37.4%) | 645 (54.6%) |
| 6 or 7 Rooms | 950 (37.4%) | 155 (13.1%) |
| 8 or more Rooms | 599 (23.6%) | 11 (0.9%) |
| Total | 2,537 (100.0%) | 1,182 (100.0%) |
Housing Structure by Heating Type in Orange Beach
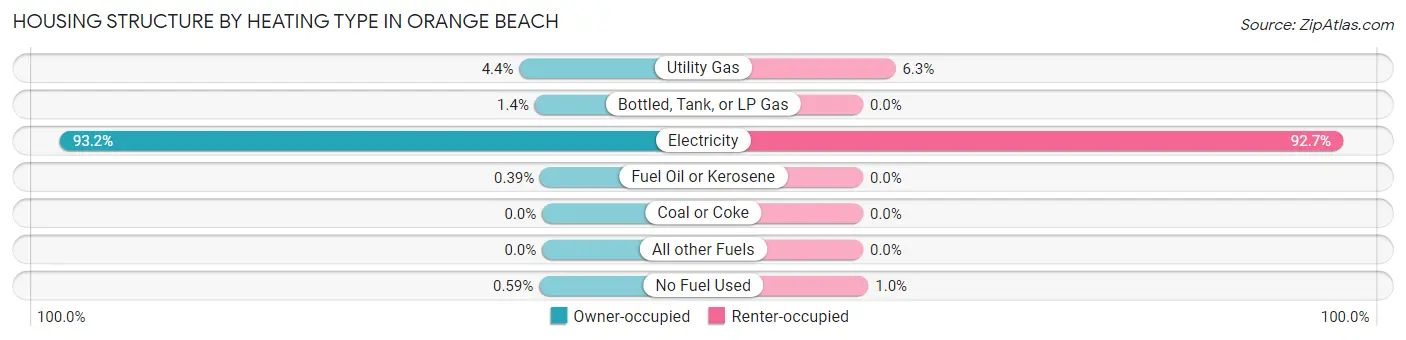
| Heating Type | Owner-occupied | Renter-occupied |
| Utility Gas | 112 (4.4%) | 74 (6.3%) |
| Bottled, Tank, or LP Gas | 36 (1.4%) | 0 (0.0%) |
| Electricity | 2,364 (93.2%) | 1,096 (92.7%) |
| Fuel Oil or Kerosene | 10 (0.4%) | 0 (0.0%) |
| Coal or Coke | 0 (0.0%) | 0 (0.0%) |
| All other Fuels | 0 (0.0%) | 0 (0.0%) |
| No Fuel Used | 15 (0.6%) | 12 (1.0%) |
| Total | 2,537 (100.0%) | 1,182 (100.0%) |
Household Vehicle Usage in Orange Beach
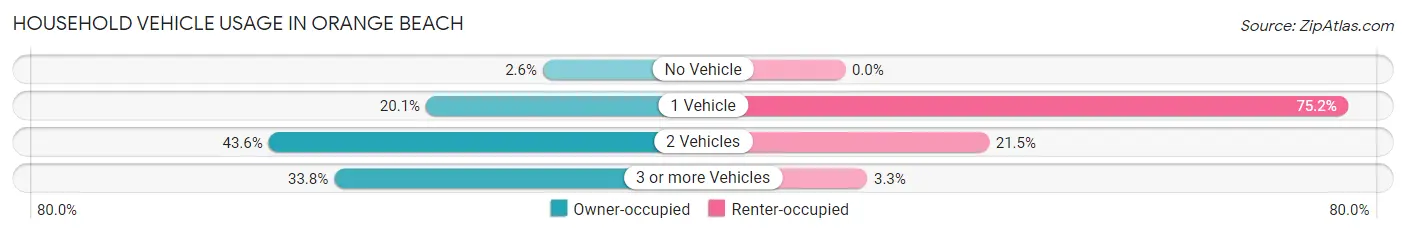
| Vehicles per Household | Owner-occupied | Renter-occupied |
| No Vehicle | 66 (2.6%) | 0 (0.0%) |
| 1 Vehicle | 509 (20.1%) | 889 (75.2%) |
| 2 Vehicles | 1,105 (43.6%) | 254 (21.5%) |
| 3 or more Vehicles | 857 (33.8%) | 39 (3.3%) |
| Total | 2,537 (100.0%) | 1,182 (100.0%) |
Real Estate & Mortgages in Orange Beach
Real Estate and Mortgage Overview in Orange Beach
| Characteristic | Without Mortgage | With Mortgage |
| Housing Units | 1,135 | 1,402 |
| Median Property Value | $474,300 | $450,500 |
| Median Household Income | $85,378 | $616 |
| Monthly Housing Costs | $663 | $315 |
| Real Estate Taxes | $1,096 | $66 |
Property Value by Mortgage Status in Orange Beach
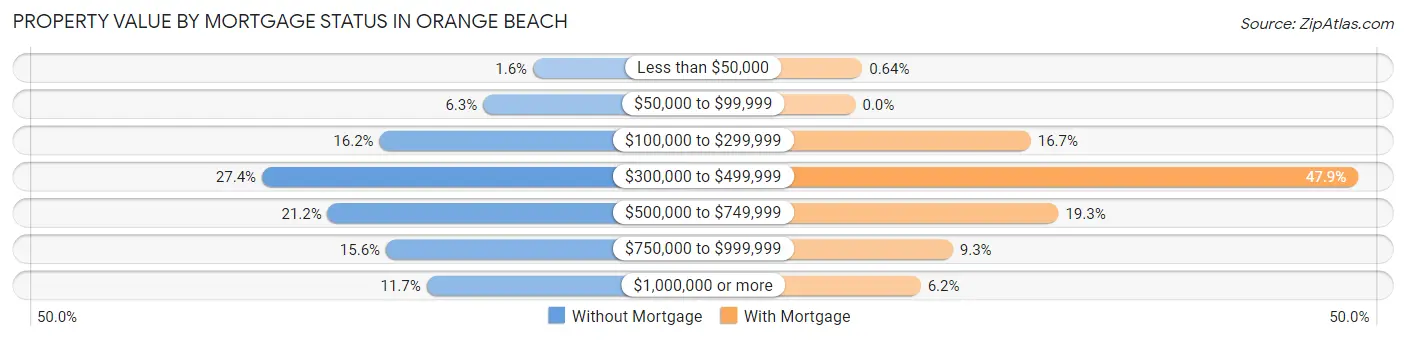
| Property Value | Without Mortgage | With Mortgage |
| Less than $50,000 | 18 (1.6%) | 9 (0.6%) |
| $50,000 to $99,999 | 72 (6.3%) | 0 (0.0%) |
| $100,000 to $299,999 | 184 (16.2%) | 234 (16.7%) |
| $300,000 to $499,999 | 311 (27.4%) | 671 (47.9%) |
| $500,000 to $749,999 | 240 (21.1%) | 271 (19.3%) |
| $750,000 to $999,999 | 177 (15.6%) | 130 (9.3%) |
| $1,000,000 or more | 133 (11.7%) | 87 (6.2%) |
| Total | 1,135 (100.0%) | 1,402 (100.0%) |
Household Income by Mortgage Status in Orange Beach
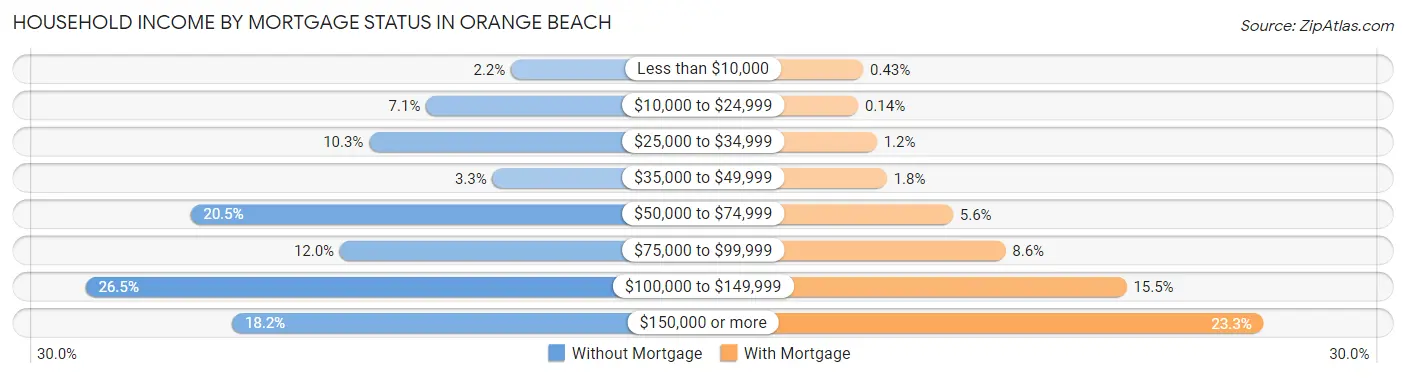
| Household Income | Without Mortgage | With Mortgage |
| Less than $10,000 | 25 (2.2%) | 6 (0.4%) |
| $10,000 to $24,999 | 80 (7.0%) | 2 (0.1%) |
| $25,000 to $34,999 | 117 (10.3%) | 17 (1.2%) |
| $35,000 to $49,999 | 37 (3.3%) | 25 (1.8%) |
| $50,000 to $74,999 | 233 (20.5%) | 78 (5.6%) |
| $75,000 to $99,999 | 136 (12.0%) | 120 (8.6%) |
| $100,000 to $149,999 | 301 (26.5%) | 217 (15.5%) |
| $150,000 or more | 206 (18.1%) | 327 (23.3%) |
| Total | 1,135 (100.0%) | 1,402 (100.0%) |
Property Value to Household Income Ratio in Orange Beach
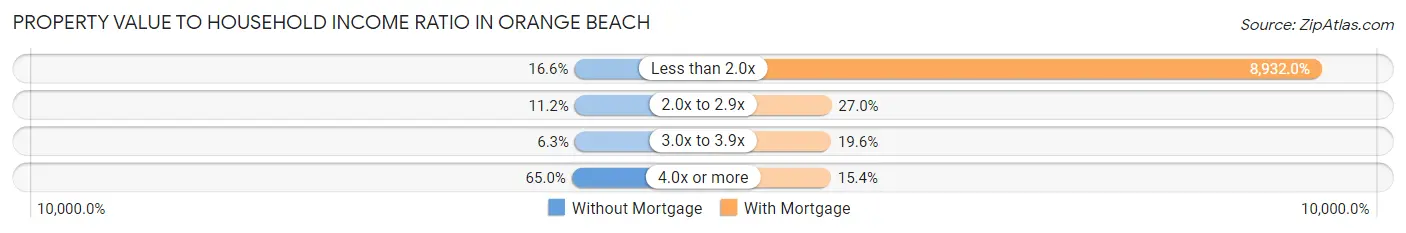
| Value-to-Income Ratio | Without Mortgage | With Mortgage |
| Less than 2.0x | 188 (16.6%) | 125,227 (8,932.0%) |
| 2.0x to 2.9x | 127 (11.2%) | 379 (27.0%) |
| 3.0x to 3.9x | 72 (6.3%) | 275 (19.6%) |
| 4.0x or more | 738 (65.0%) | 216 (15.4%) |
| Total | 1,135 (100.0%) | 1,402 (100.0%) |
Real Estate Taxes by Mortgage Status in Orange Beach
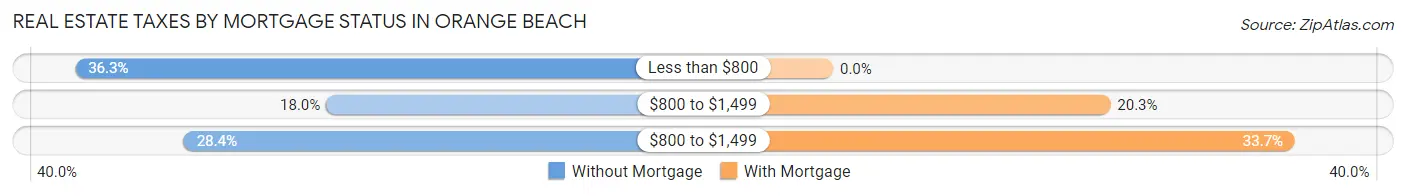
| Property Taxes | Without Mortgage | With Mortgage |
| Less than $800 | 412 (36.3%) | 0 (0.0%) |
| $800 to $1,499 | 204 (18.0%) | 284 (20.3%) |
| $800 to $1,499 | 322 (28.4%) | 473 (33.7%) |
| Total | 1,135 (100.0%) | 1,402 (100.0%) |
Health & Disability in Orange Beach
Health Insurance Coverage by Age in Orange Beach
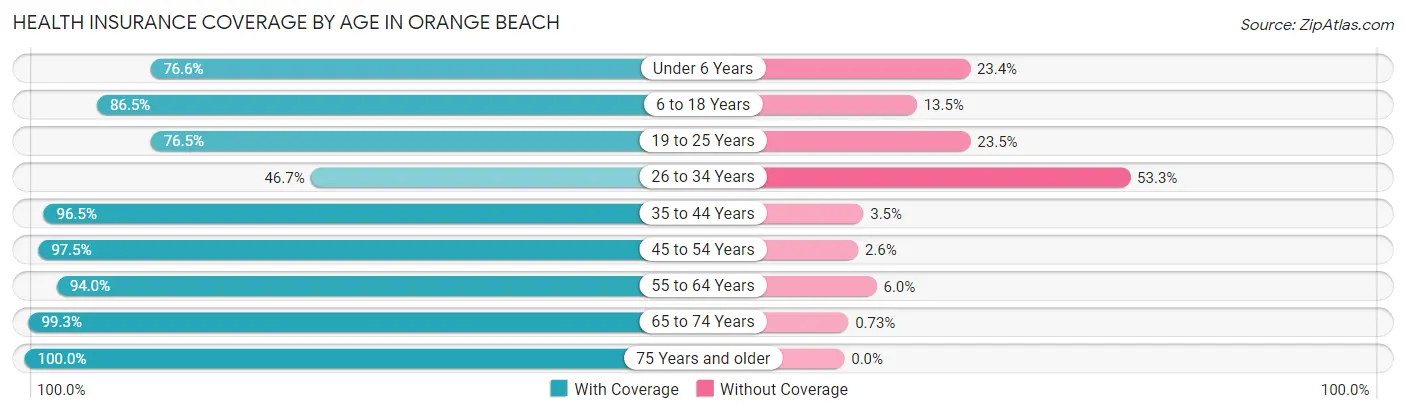
| Age Bracket | With Coverage | Without Coverage |
| Under 6 Years | 134 (76.6%) | 41 (23.4%) |
| 6 to 18 Years | 980 (86.5%) | 153 (13.5%) |
| 19 to 25 Years | 413 (76.5%) | 127 (23.5%) |
| 26 to 34 Years | 268 (46.7%) | 306 (53.3%) |
| 35 to 44 Years | 573 (96.5%) | 21 (3.5%) |
| 45 to 54 Years | 1,339 (97.5%) | 35 (2.5%) |
| 55 to 64 Years | 1,266 (94.0%) | 81 (6.0%) |
| 65 to 74 Years | 1,499 (99.3%) | 11 (0.7%) |
| 75 Years and older | 773 (100.0%) | 0 (0.0%) |
| Total | 7,245 (90.3%) | 775 (9.7%) |
Health Insurance Coverage by Citizenship Status in Orange Beach
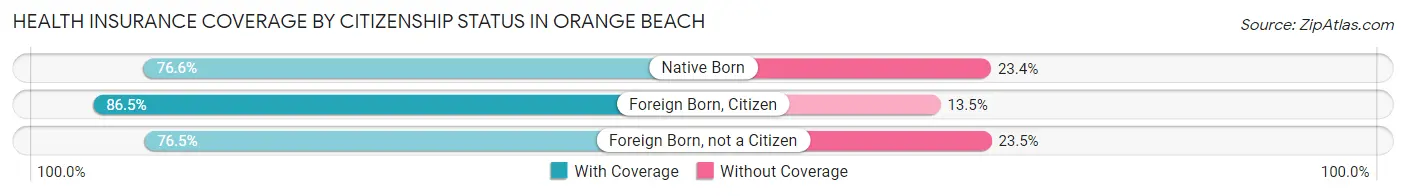
| Citizenship Status | With Coverage | Without Coverage |
| Native Born | 134 (76.6%) | 41 (23.4%) |
| Foreign Born, Citizen | 980 (86.5%) | 153 (13.5%) |
| Foreign Born, not a Citizen | 413 (76.5%) | 127 (23.5%) |
Health Insurance Coverage by Household Income in Orange Beach
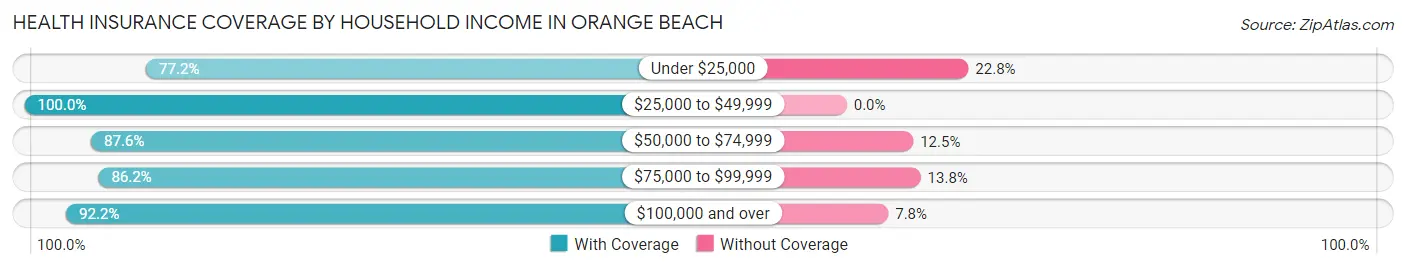
| Household Income | With Coverage | Without Coverage |
| Under $25,000 | 427 (77.2%) | 126 (22.8%) |
| $25,000 to $49,999 | 956 (100.0%) | 0 (0.0%) |
| $50,000 to $74,999 | 949 (87.5%) | 135 (12.4%) |
| $75,000 to $99,999 | 1,251 (86.2%) | 201 (13.8%) |
| $100,000 and over | 3,657 (92.2%) | 308 (7.8%) |
Public vs Private Health Insurance Coverage by Age in Orange Beach
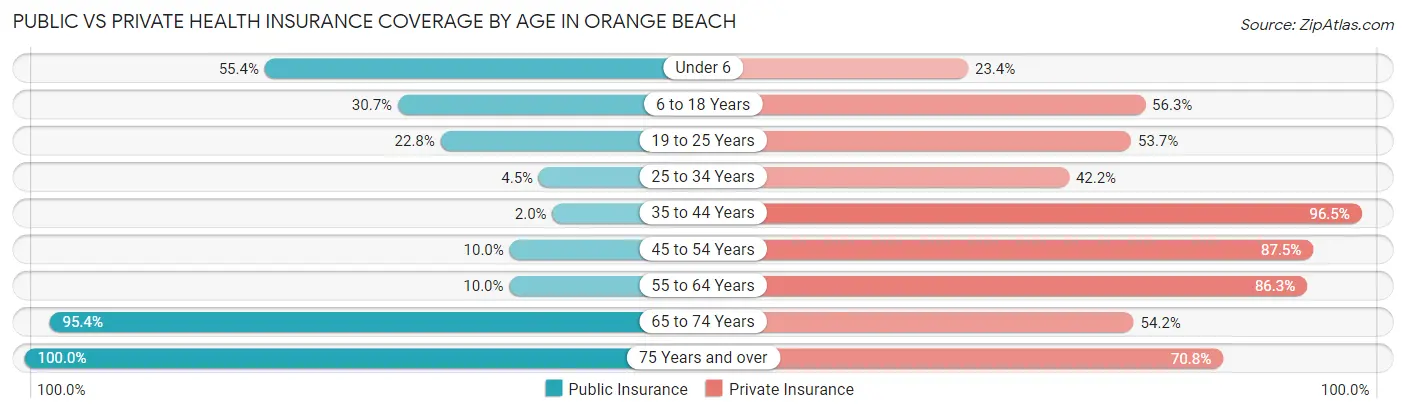
| Age Bracket | Public Insurance | Private Insurance |
| Under 6 | 97 (55.4%) | 41 (23.4%) |
| 6 to 18 Years | 348 (30.7%) | 638 (56.3%) |
| 19 to 25 Years | 123 (22.8%) | 290 (53.7%) |
| 25 to 34 Years | 26 (4.5%) | 242 (42.2%) |
| 35 to 44 Years | 12 (2.0%) | 573 (96.5%) |
| 45 to 54 Years | 137 (10.0%) | 1,202 (87.5%) |
| 55 to 64 Years | 135 (10.0%) | 1,163 (86.3%) |
| 65 to 74 Years | 1,440 (95.4%) | 818 (54.2%) |
| 75 Years and over | 773 (100.0%) | 547 (70.8%) |
| Total | 3,091 (38.5%) | 5,514 (68.8%) |
Disability Status by Sex by Age in Orange Beach
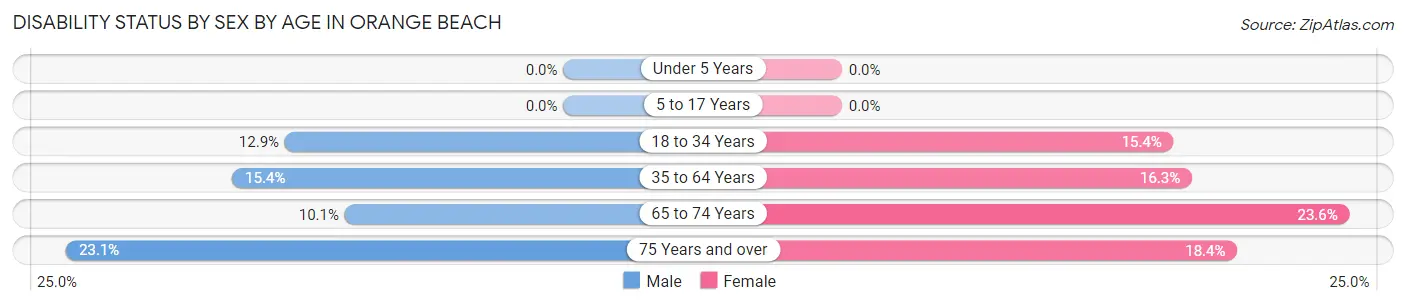
| Age Bracket | Male | Female |
| Under 5 Years | 0 (0.0%) | 0 (0.0%) |
| 5 to 17 Years | 0 (0.0%) | 0 (0.0%) |
| 18 to 34 Years | 77 (12.9%) | 89 (15.4%) |
| 35 to 64 Years | 224 (15.4%) | 302 (16.3%) |
| 65 to 74 Years | 86 (10.1%) | 156 (23.6%) |
| 75 Years and over | 69 (23.1%) | 87 (18.3%) |
Disability Class by Sex by Age in Orange Beach
Disability Class: Hearing Difficulty
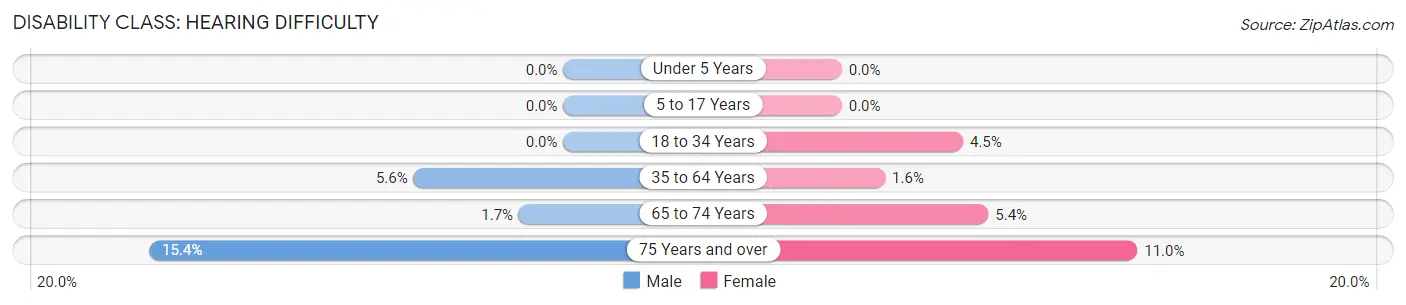
| Age Bracket | Male | Female |
| Under 5 Years | 0 (0.0%) | 0 (0.0%) |
| 5 to 17 Years | 0 (0.0%) | 0 (0.0%) |
| 18 to 34 Years | 0 (0.0%) | 26 (4.5%) |
| 35 to 64 Years | 81 (5.6%) | 30 (1.6%) |
| 65 to 74 Years | 14 (1.7%) | 36 (5.4%) |
| 75 Years and over | 46 (15.4%) | 52 (11.0%) |
Disability Class: Vision Difficulty
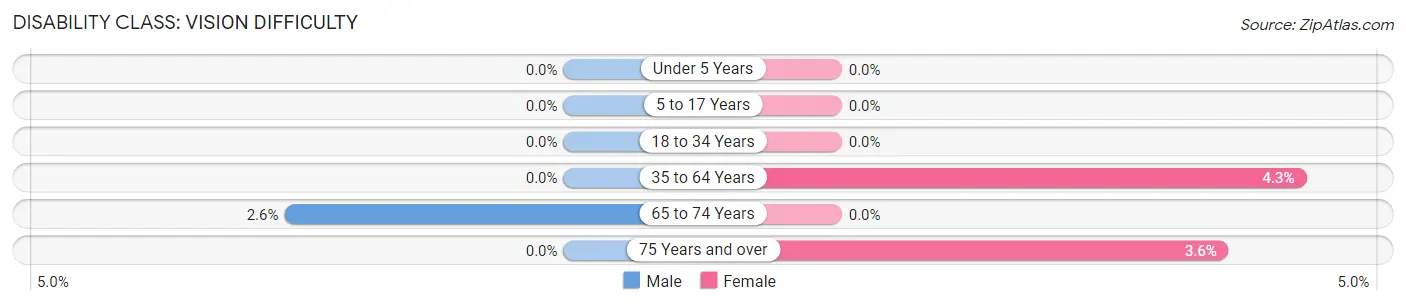
| Age Bracket | Male | Female |
| Under 5 Years | 0 (0.0%) | 0 (0.0%) |
| 5 to 17 Years | 0 (0.0%) | 0 (0.0%) |
| 18 to 34 Years | 0 (0.0%) | 0 (0.0%) |
| 35 to 64 Years | 0 (0.0%) | 80 (4.3%) |
| 65 to 74 Years | 22 (2.6%) | 0 (0.0%) |
| 75 Years and over | 0 (0.0%) | 17 (3.6%) |
Disability Class: Cognitive Difficulty
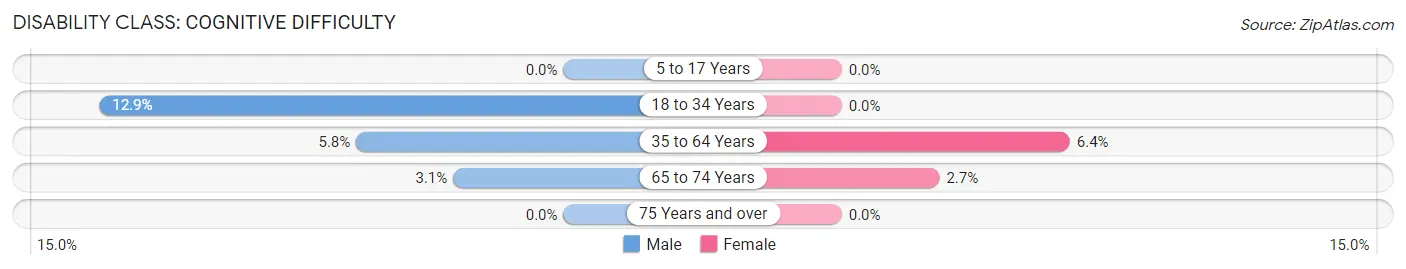
| Age Bracket | Male | Female |
| 5 to 17 Years | 0 (0.0%) | 0 (0.0%) |
| 18 to 34 Years | 77 (12.9%) | 0 (0.0%) |
| 35 to 64 Years | 84 (5.8%) | 118 (6.4%) |
| 65 to 74 Years | 26 (3.1%) | 18 (2.7%) |
| 75 Years and over | 0 (0.0%) | 0 (0.0%) |
Disability Class: Ambulatory Difficulty
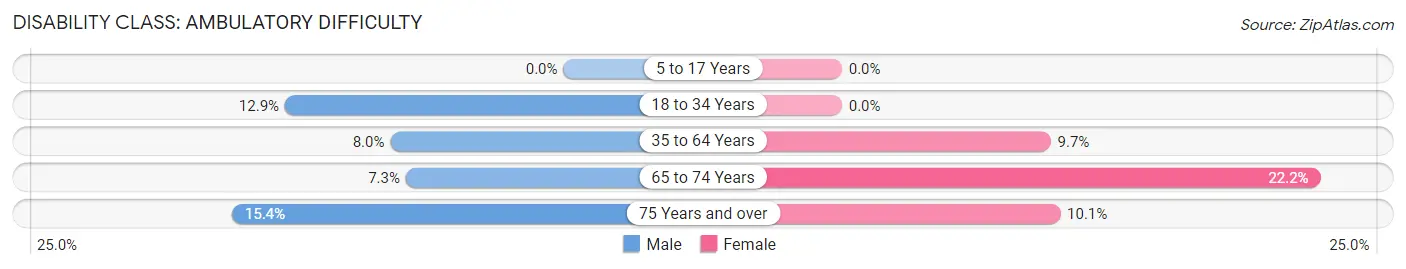
| Age Bracket | Male | Female |
| 5 to 17 Years | 0 (0.0%) | 0 (0.0%) |
| 18 to 34 Years | 77 (12.9%) | 0 (0.0%) |
| 35 to 64 Years | 117 (8.0%) | 180 (9.7%) |
| 65 to 74 Years | 62 (7.3%) | 147 (22.2%) |
| 75 Years and over | 46 (15.4%) | 48 (10.1%) |
Disability Class: Self-Care Difficulty
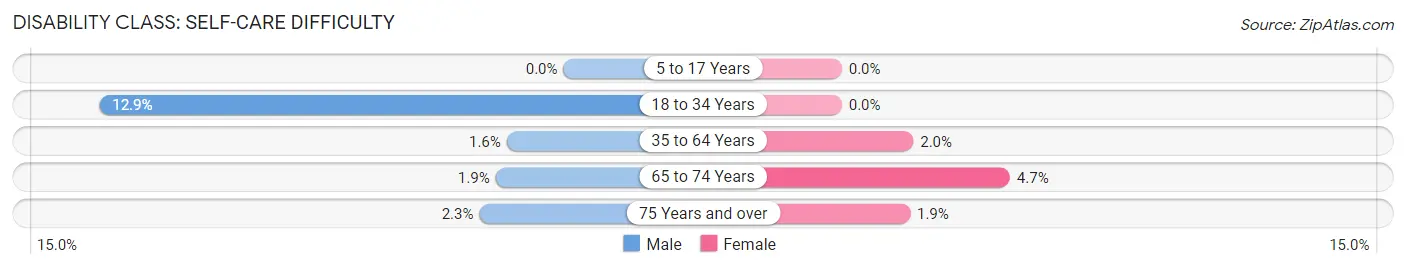
| Age Bracket | Male | Female |
| 5 to 17 Years | 0 (0.0%) | 0 (0.0%) |
| 18 to 34 Years | 77 (12.9%) | 0 (0.0%) |
| 35 to 64 Years | 23 (1.6%) | 37 (2.0%) |
| 65 to 74 Years | 16 (1.9%) | 31 (4.7%) |
| 75 Years and over | 7 (2.3%) | 9 (1.9%) |
Technology Access in Orange Beach
Computing Device Access in Orange Beach
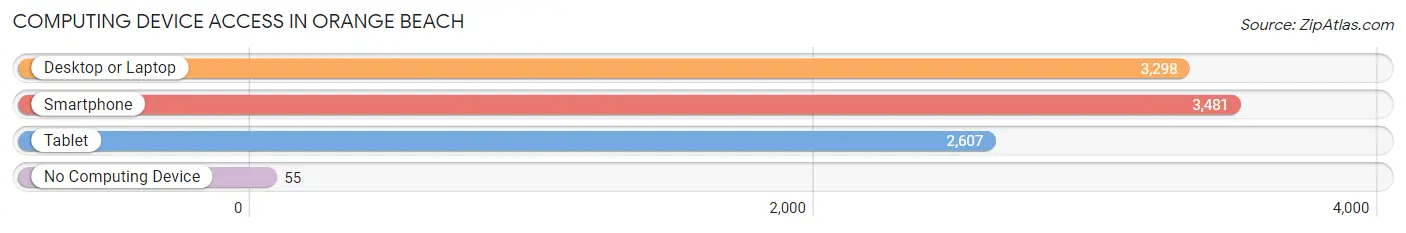
| Device Type | # Households | % Households |
| Desktop or Laptop | 3,298 | 88.7% |
| Smartphone | 3,481 | 93.6% |
| Tablet | 2,607 | 70.1% |
| No Computing Device | 55 | 1.5% |
| Total | 3,719 | 100.0% |
Internet Access in Orange Beach
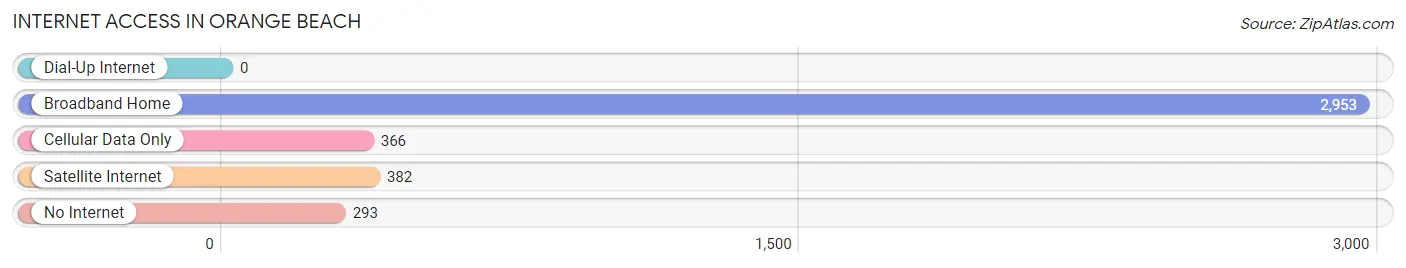
| Internet Type | # Households | % Households |
| Dial-Up Internet | 0 | 0.0% |
| Broadband Home | 2,953 | 79.4% |
| Cellular Data Only | 366 | 9.8% |
| Satellite Internet | 382 | 10.3% |
| No Internet | 293 | 7.9% |
| Total | 3,719 | 100.0% |
Orange Beach Summary
Orange Beach, AL is a city located in Baldwin County, Alabama, United States. It is situated on the Gulf of Mexico, just east of Gulf Shores. The city is part of the Daphne-Fairhope-Foley metropolitan area. As of the 2010 census, the population of Orange Beach was 5,441.
History
The area that is now Orange Beach was originally inhabited by Native American tribes, including the Choctaw and Creek. The first European settlers arrived in the area in the early 1800s. The area was originally known as "Old Florida" and was part of the Spanish colony of West Florida.
In 1819, the area was ceded to the United States as part of the Adams-Onis Treaty. The area was then part of the Mississippi Territory until 1821, when it became part of the Alabama Territory. In 1868, the area was incorporated as the town of Orange Beach.
The town was named after the orange groves that grew in the area. The town was a popular tourist destination in the late 19th and early 20th centuries. The town was also home to a number of fishing camps and resorts.
In the 1950s, the town began to experience a population boom as people moved to the area for its beaches and fishing opportunities. In 1984, the town was officially incorporated as the City of Orange Beach.
Geography
Orange Beach is located at 30°19'N 87°37'W (30.3167, -87.6167). It is situated on the Gulf of Mexico, just east of Gulf Shores. The city has a total area of 11.2 square miles, of which 10.7 square miles is land and 0.5 square miles is water.
The city is bordered by the Gulf of Mexico to the south, Perdido Bay to the west, and Wolf Bay to the east. The city is located on a barrier island, and is connected to the mainland by the Perdido Pass Bridge.
Economy
Orange Beach is a popular tourist destination, and tourism is the main driver of the local economy. The city is home to a number of resorts, hotels, restaurants, and other tourist attractions. The city is also home to a number of marinas, which provide access to the Gulf of Mexico for fishing and other recreational activities.
The city is also home to a number of manufacturing and service-based businesses. The city is home to a number of boat and RV dealerships, as well as a number of retail stores.
Demographics
As of the 2010 census, there were 5,441 people, 2,521 households, and 1,541 families residing in the city. The population density was 505.3 people per square mile. There were 4,845 housing units at an average density of 451.3 per square mile.
The racial makeup of the city was 94.2% White, 1.3% African American, 0.4% Native American, 0.7% Asian, 0.1% Pacific Islander, 1.3% from other races, and 2.1% from two or more races. Hispanic or Latino of any race were 4.2% of the population.
There were 2,521 households, out of which 17.2% had children under the age of 18 living with them, 51.2% were married couples living together, 8.2% had a female householder with no husband present, and 37.2% were non-families. 32.2% of all households were made up of individuals, and 14.2% had someone living alone who was 65 years of age or older. The average household size was 2.14 and the average family size was 2.67.
In the city, the population was spread out, with 16.2% under the age of 18, 5.2% from 18 to 24, 20.2% from 25 to 44, 33.2% from 45 to 64, and 25.2% who were 65 years of age or older. The median age was 50 years. For every 100 females, there were 93.2 males. For every 100 females age 18 and over, there were 91.2 males.
The median income for a household in the city was $45,938, and the median income for a family was $54,821. Males had a median income of $41,964 versus $30,917 for females. The per capita income for the city was $27,945. About 6.2% of families and 8.7% of the population were below the poverty line, including 11.2% of those under age 18 and 6.2% of those age 65 or over.
Common Questions
What is Per Capita Income in Orange Beach?
Per Capita income in Orange Beach is $55,485.
What is the Median Family Income in Orange Beach?
Median Family Income in Orange Beach is $117,761.
What is the Median Household income in Orange Beach?
Median Household Income in Orange Beach is $90,402.
What is Income or Wage Gap in Orange Beach?
Income or Wage Gap in Orange Beach is 48.6%.
Women in Orange Beach earn 51.4 cents for every dollar earned by a man.
What is Inequality or Gini Index in Orange Beach?
Inequality or Gini Index in Orange Beach is 0.45.
What is the Total Population of Orange Beach?
Total Population of Orange Beach is 8,048.
What is the Total Male Population of Orange Beach?
Total Male Population of Orange Beach is 3,899.
What is the Total Female Population of Orange Beach?
Total Female Population of Orange Beach is 4,149.
What is the Ratio of Males per 100 Females in Orange Beach?
There are 93.97 Males per 100 Females in Orange Beach.
What is the Ratio of Females per 100 Males in Orange Beach?
There are 106.41 Females per 100 Males in Orange Beach.
What is the Median Population Age in Orange Beach?
Median Population Age in Orange Beach is 51.6 Years.
What is the Average Family Size in Orange Beach
Average Family Size in Orange Beach is 2.8 People.
What is the Average Household Size in Orange Beach
Average Household Size in Orange Beach is 2.2 People.
How Large is the Labor Force in Orange Beach?
There are 4,342 People in the Labor Forcein in Orange Beach.
What is the Percentage of People in the Labor Force in Orange Beach?
61.6% of People are in the Labor Force in Orange Beach.
What is the Unemployment Rate in Orange Beach?
Unemployment Rate in Orange Beach is 4.4%.