Brantleyville, AL Map & Demographics
Brantleyville Map
Brantleyville Overview
$21,717
PER CAPITA INCOME
$59,722
AVG FAMILY INCOME
$37,857
AVG HOUSEHOLD INCOME
0.40
INEQUALITY / GINI INDEX
716
TOTAL POPULATION
228
MALE POPULATION
488
FEMALE POPULATION
46.72
MALES / 100 FEMALES
214.04
FEMALES / 100 MALES
34.7
MEDIAN AGE
3.0
AVG FAMILY SIZE
2.3
AVG HOUSEHOLD SIZE
317
LABOR FORCE [ PEOPLE ]
55.9%
PERCENT IN LABOR FORCE
12.6%
UNEMPLOYMENT RATE
Income in Brantleyville
Income Overview in Brantleyville
Per Capita Income in Brantleyville is $21,717, while median incomes of families and households are $59,722 and $37,857 respectively.
| Characteristic | Number | Measure |
| Per Capita Income | 716 | $21,717 |
| Median Family Income | 188 | $59,722 |
| Mean Family Income | 188 | $64,316 |
| Median Household Income | 316 | $37,857 |
| Mean Household Income | 316 | $46,437 |
| Income Deficit | 188 | $0 |
| Wage / Income Gap (%) | 716 | 0.00% |
| Wage / Income Gap ($) | 716 | 100.00¢ per $1 |
| Gini / Inequality Index | 716 | 0.40 |
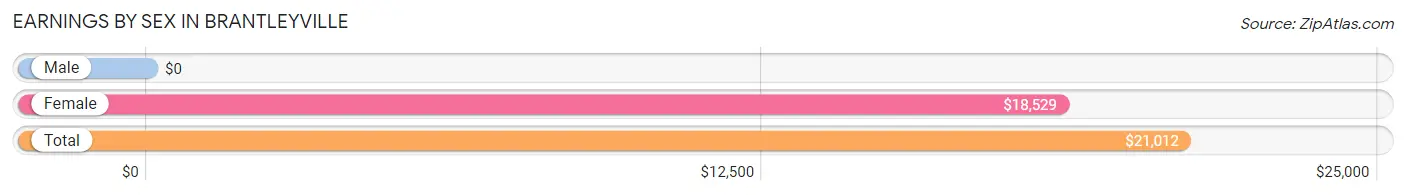
Earnings by Sex in Brantleyville
| Sex | Number | Average Earnings |
| Male | 97 (29.8%) | $0 |
| Female | 228 (70.2%) | $18,529 |
| Total | 325 (100.0%) | $21,012 |
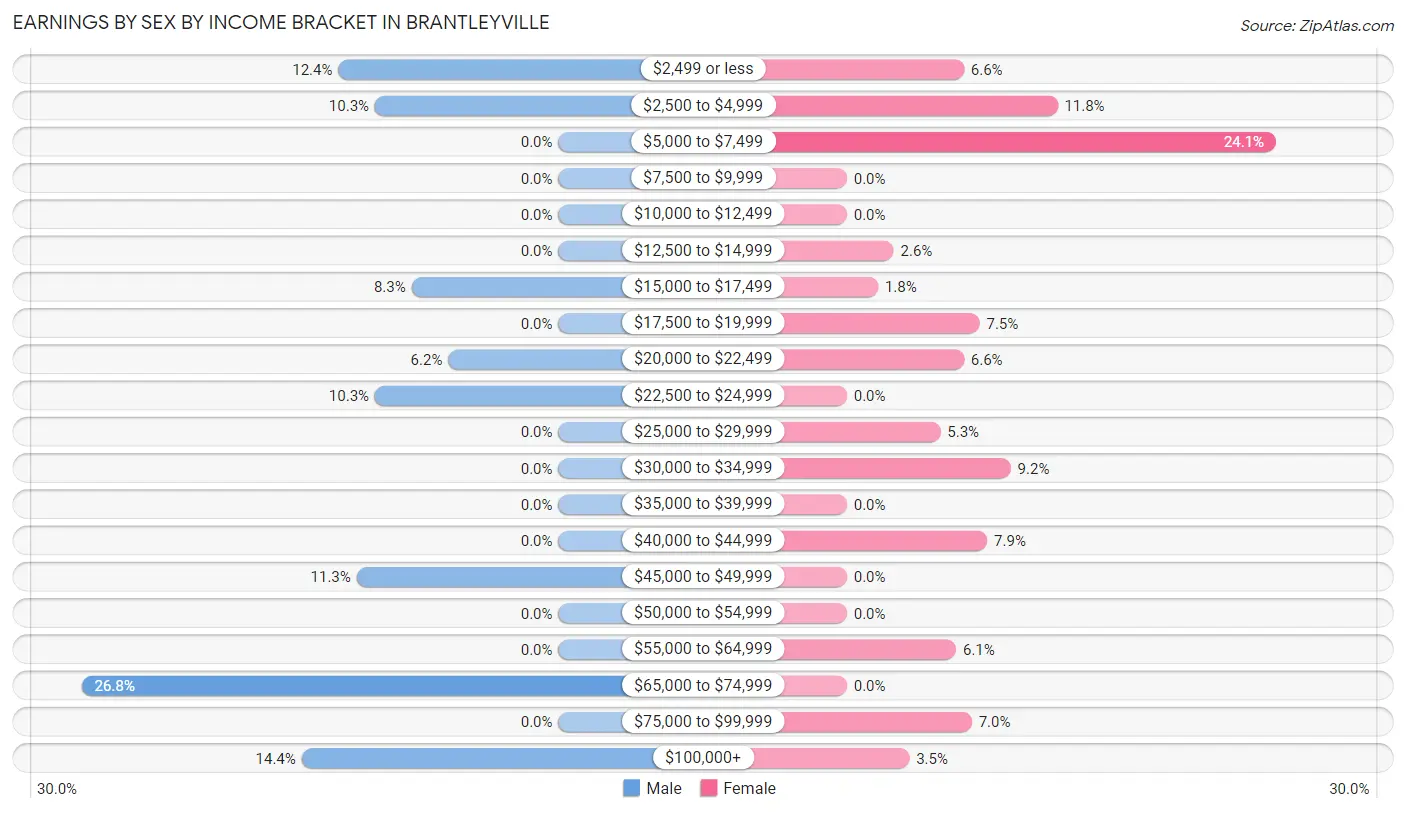
Earnings by Sex by Income Bracket in Brantleyville
The most common earnings brackets in Brantleyville are $65,000 to $74,999 for men (26 | 26.8%) and $5,000 to $7,499 for women (55 | 24.1%).
| Income | Male | Female |
| $2,499 or less | 12 (12.4%) | 15 (6.6%) |
| $2,500 to $4,999 | 10 (10.3%) | 27 (11.8%) |
| $5,000 to $7,499 | 0 (0.0%) | 55 (24.1%) |
| $7,500 to $9,999 | 0 (0.0%) | 0 (0.0%) |
| $10,000 to $12,499 | 0 (0.0%) | 0 (0.0%) |
| $12,500 to $14,999 | 0 (0.0%) | 6 (2.6%) |
| $15,000 to $17,499 | 8 (8.3%) | 4 (1.8%) |
| $17,500 to $19,999 | 0 (0.0%) | 17 (7.5%) |
| $20,000 to $22,499 | 6 (6.2%) | 15 (6.6%) |
| $22,500 to $24,999 | 10 (10.3%) | 0 (0.0%) |
| $25,000 to $29,999 | 0 (0.0%) | 12 (5.3%) |
| $30,000 to $34,999 | 0 (0.0%) | 21 (9.2%) |
| $35,000 to $39,999 | 0 (0.0%) | 0 (0.0%) |
| $40,000 to $44,999 | 0 (0.0%) | 18 (7.9%) |
| $45,000 to $49,999 | 11 (11.3%) | 0 (0.0%) |
| $50,000 to $54,999 | 0 (0.0%) | 0 (0.0%) |
| $55,000 to $64,999 | 0 (0.0%) | 14 (6.1%) |
| $65,000 to $74,999 | 26 (26.8%) | 0 (0.0%) |
| $75,000 to $99,999 | 0 (0.0%) | 16 (7.0%) |
| $100,000+ | 14 (14.4%) | 8 (3.5%) |
| Total | 97 (100.0%) | 228 (100.0%) |
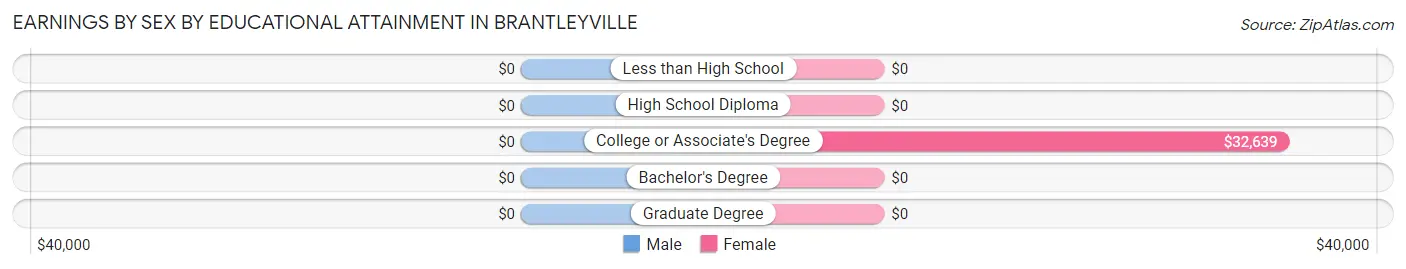
Earnings by Sex by Educational Attainment in Brantleyville
| Educational Attainment | Male Income | Female Income |
| Less than High School | - | - |
| High School Diploma | - | - |
| College or Associate's Degree | - | - |
| Bachelor's Degree | - | - |
| Graduate Degree | - | - |
| Total | - | - |
Family Income in Brantleyville
Family Income Brackets in Brantleyville
According to the Brantleyville family income data, there are 45 families falling into the $35,000 to $49,999 income range, which is the most common income bracket and makes up 23.9% of all families.
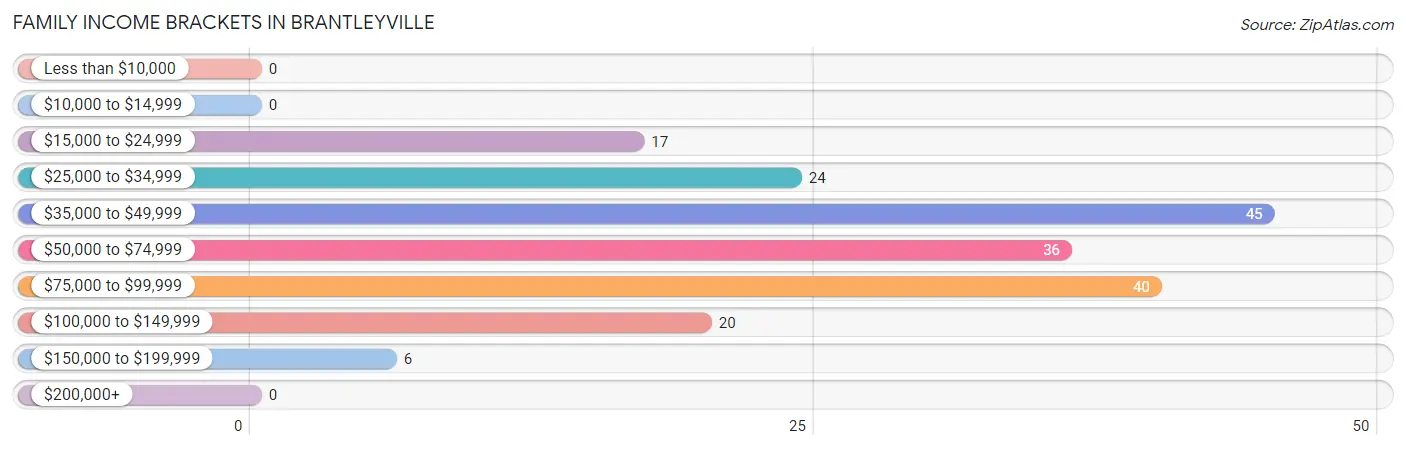
| Income Bracket | # Families | % Families |
| Less than $10,000 | 0 | 0.0% |
| $10,000 to $14,999 | 0 | 0.0% |
| $15,000 to $24,999 | 17 | 9.0% |
| $25,000 to $34,999 | 24 | 12.8% |
| $35,000 to $49,999 | 45 | 23.9% |
| $50,000 to $74,999 | 36 | 19.1% |
| $75,000 to $99,999 | 40 | 21.3% |
| $100,000 to $149,999 | 20 | 10.6% |
| $150,000 to $199,999 | 6 | 3.2% |
| $200,000+ | 0 | 0.0% |
Family Income by Famaliy Size in Brantleyville
2-person families (110 | 58.5%) account for the highest median family income in Brantleyville with $68,750 per family, while 2-person families (110 | 58.5%) have the highest median income of $34,375 per family member.
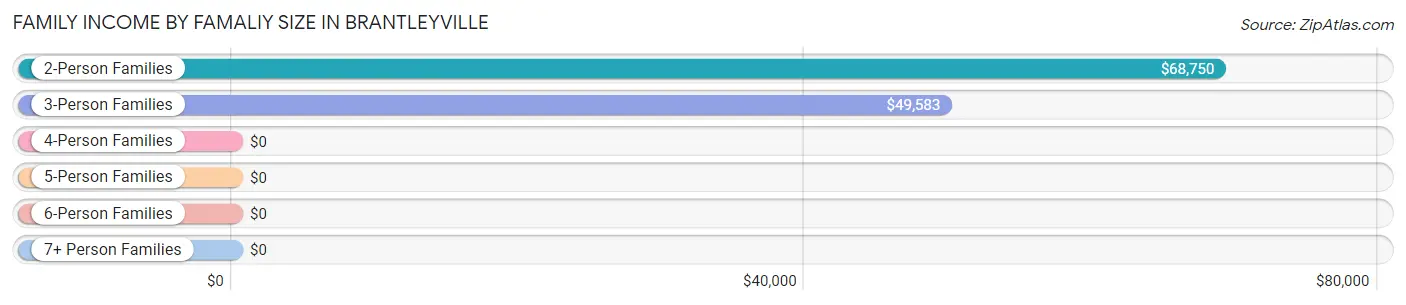
| Income Bracket | # Families | Median Income |
| 2-Person Families | 110 (58.5%) | $68,750 |
| 3-Person Families | 45 (23.9%) | $49,583 |
| 4-Person Families | 26 (13.8%) | $0 |
| 5-Person Families | 0 (0.0%) | $0 |
| 6-Person Families | 0 (0.0%) | $0 |
| 7+ Person Families | 7 (3.7%) | $0 |
| Total | 188 (100.0%) | $59,722 |
Family Income by Number of Earners in Brantleyville
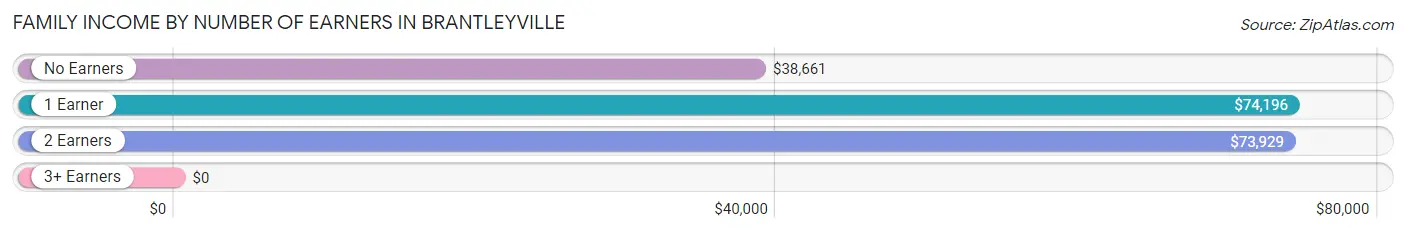
| Number of Earners | # Families | Median Income |
| No Earners | 39 (20.7%) | $38,661 |
| 1 Earner | 71 (37.8%) | $74,196 |
| 2 Earners | 62 (33.0%) | $73,929 |
| 3+ Earners | 16 (8.5%) | $0 |
| Total | 188 (100.0%) | $59,722 |
Household Income in Brantleyville
Household Income Brackets in Brantleyville
With 83 households falling in the category, the $15,000 to $24,999 income range is the most frequent in Brantleyville, accounting for 26.3% of all households.
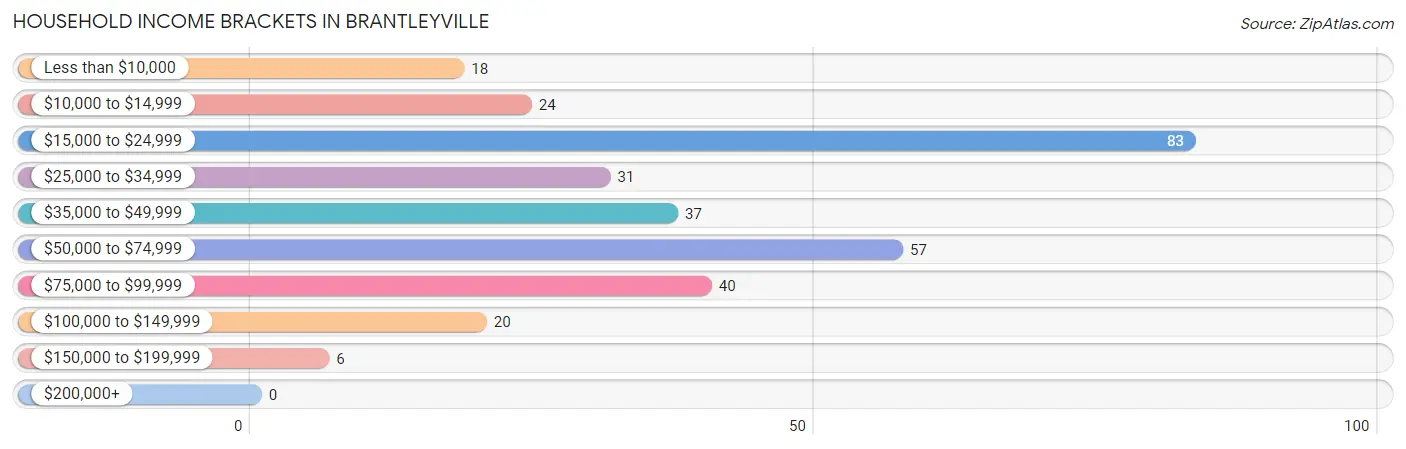
| Income Bracket | # Households | % Households |
| Less than $10,000 | 18 | 5.7% |
| $10,000 to $14,999 | 24 | 7.6% |
| $15,000 to $24,999 | 83 | 26.3% |
| $25,000 to $34,999 | 31 | 9.8% |
| $35,000 to $49,999 | 37 | 11.7% |
| $50,000 to $74,999 | 57 | 18.0% |
| $75,000 to $99,999 | 40 | 12.7% |
| $100,000 to $149,999 | 20 | 6.3% |
| $150,000 to $199,999 | 6 | 1.9% |
| $200,000+ | 0 | 0.0% |
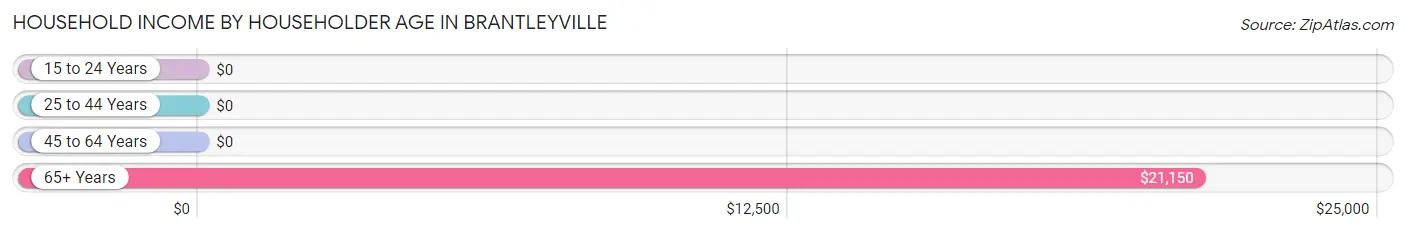
Household Income by Householder Age in Brantleyville
The median household income in Brantleyville is $37,857, with the highest median household income of $21,150 found in the 65+ years age bracket for the primary householder. A total of 105 households (33.2%) fall into this category. Meanwhile, the 15 to 24 years age bracket for the primary householder has the lowest median household income of $0, with 7 households (2.2%) in this group.
| Income Bracket | # Households | Median Income |
| 15 to 24 Years | 7 (2.2%) | $0 |
| 25 to 44 Years | 95 (30.1%) | $0 |
| 45 to 64 Years | 109 (34.5%) | $0 |
| 65+ Years | 105 (33.2%) | $21,150 |
| Total | 316 (100.0%) | $37,857 |
Poverty in Brantleyville
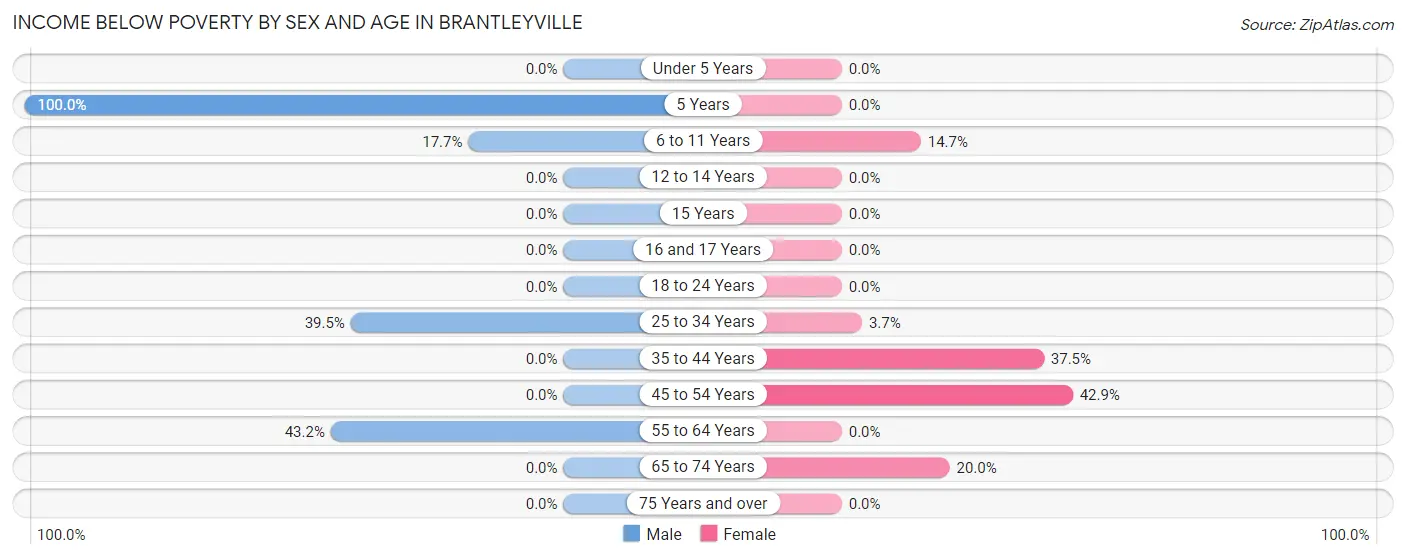
Income Below Poverty by Sex and Age in Brantleyville
With 19.7% poverty level for males and 12.3% for females among the residents of Brantleyville, 5 year old males and 45 to 54 year old females are the most vulnerable to poverty, with 5 males (100.0%) and 18 females (42.9%) in their respective age groups living below the poverty level.
| Age Bracket | Male | Female |
| Under 5 Years | 0 (0.0%) | 0 (0.0%) |
| 5 Years | 5 (100.0%) | 0 (0.0%) |
| 6 to 11 Years | 6 (17.6%) | 11 (14.7%) |
| 12 to 14 Years | 0 (0.0%) | 0 (0.0%) |
| 15 Years | 0 (0.0%) | 0 (0.0%) |
| 16 and 17 Years | 0 (0.0%) | 0 (0.0%) |
| 18 to 24 Years | 0 (0.0%) | 0 (0.0%) |
| 25 to 34 Years | 15 (39.5%) | 4 (3.7%) |
| 35 to 44 Years | 0 (0.0%) | 21 (37.5%) |
| 45 to 54 Years | 0 (0.0%) | 18 (42.9%) |
| 55 to 64 Years | 19 (43.2%) | 0 (0.0%) |
| 65 to 74 Years | 0 (0.0%) | 6 (20.0%) |
| 75 Years and over | 0 (0.0%) | 0 (0.0%) |
| Total | 45 (19.7%) | 60 (12.3%) |
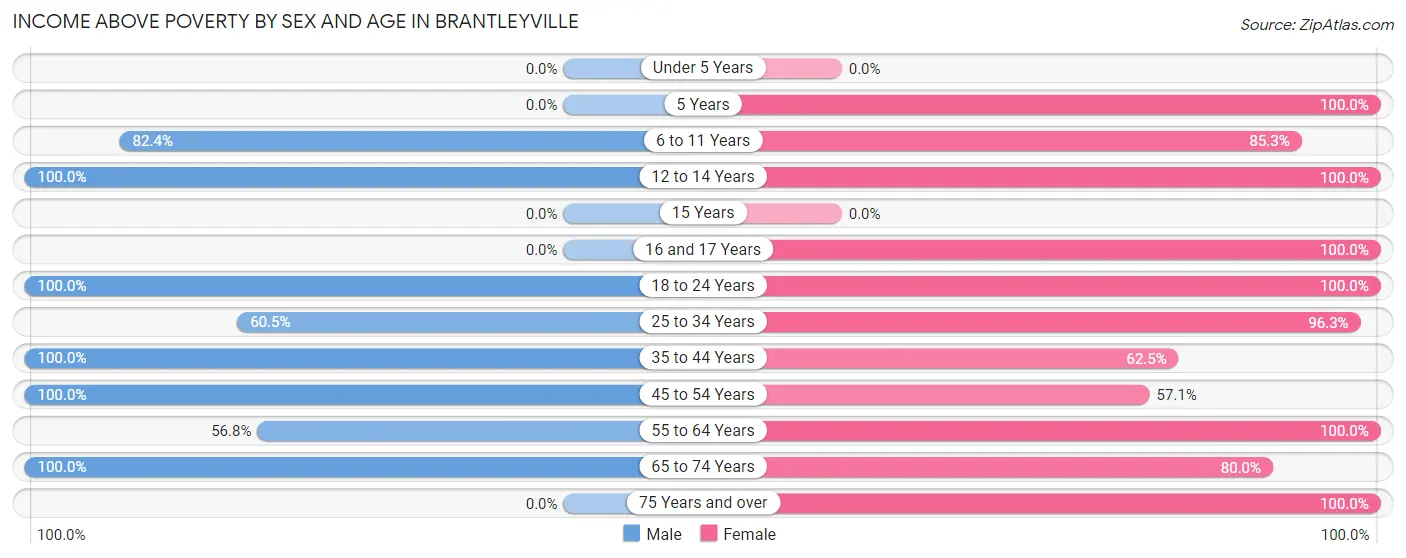
Income Above Poverty by Sex and Age in Brantleyville
According to the poverty statistics in Brantleyville, males aged 12 to 14 years and females aged 5 years are the age groups that are most secure financially, with 100.0% of males and 100.0% of females in these age groups living above the poverty line.
| Age Bracket | Male | Female |
| Under 5 Years | 0 (0.0%) | 0 (0.0%) |
| 5 Years | 0 (0.0%) | 8 (100.0%) |
| 6 to 11 Years | 28 (82.4%) | 64 (85.3%) |
| 12 to 14 Years | 12 (100.0%) | 15 (100.0%) |
| 15 Years | 0 (0.0%) | 0 (0.0%) |
| 16 and 17 Years | 0 (0.0%) | 9 (100.0%) |
| 18 to 24 Years | 38 (100.0%) | 32 (100.0%) |
| 25 to 34 Years | 23 (60.5%) | 103 (96.3%) |
| 35 to 44 Years | 19 (100.0%) | 35 (62.5%) |
| 45 to 54 Years | 9 (100.0%) | 24 (57.1%) |
| 55 to 64 Years | 25 (56.8%) | 41 (100.0%) |
| 65 to 74 Years | 29 (100.0%) | 24 (80.0%) |
| 75 Years and over | 0 (0.0%) | 73 (100.0%) |
| Total | 183 (80.3%) | 428 (87.7%) |
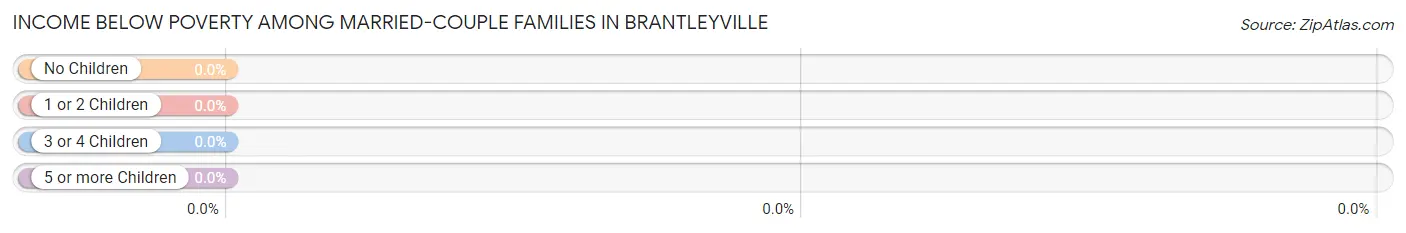
Income Below Poverty Among Married-Couple Families in Brantleyville
| Children | Above Poverty | Below Poverty |
| No Children | 52 (100.0%) | 0 (0.0%) |
| 1 or 2 Children | 26 (100.0%) | 0 (0.0%) |
| 3 or 4 Children | 0 (0.0%) | 0 (0.0%) |
| 5 or more Children | 0 (0.0%) | 0 (0.0%) |
| Total | 78 (100.0%) | 0 (0.0%) |
Income Below Poverty Among Single-Parent Households in Brantleyville
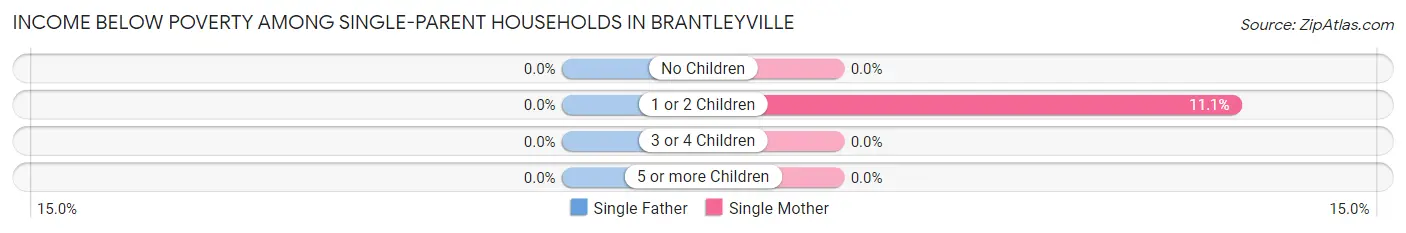
| Children | Single Father | Single Mother |
| No Children | 0 (0.0%) | 0 (0.0%) |
| 1 or 2 Children | 0 (0.0%) | 10 (11.1%) |
| 3 or 4 Children | 0 (0.0%) | 0 (0.0%) |
| 5 or more Children | 0 (0.0%) | 0 (0.0%) |
| Total | 0 (0.0%) | 10 (10.4%) |
Income Below Poverty Among Married-Couple vs Single-Parent Households in Brantleyville
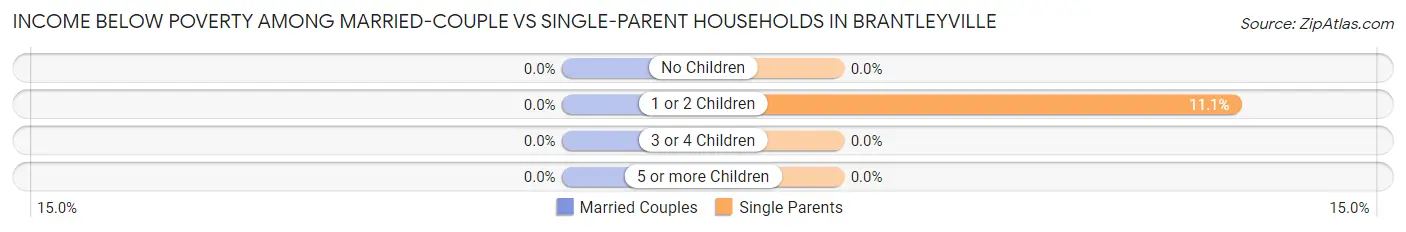
| Children | Married-Couple Families | Single-Parent Households |
| No Children | 0 (0.0%) | 0 (0.0%) |
| 1 or 2 Children | 0 (0.0%) | 10 (11.1%) |
| 3 or 4 Children | 0 (0.0%) | 0 (0.0%) |
| 5 or more Children | 0 (0.0%) | 0 (0.0%) |
| Total | 0 (0.0%) | 10 (9.1%) |
Race in Brantleyville
The most populous races in Brantleyville are White / Caucasian (678 | 94.7%), Hispanic or Latino (26 | 3.6%), and Black / African American (22 | 3.1%).
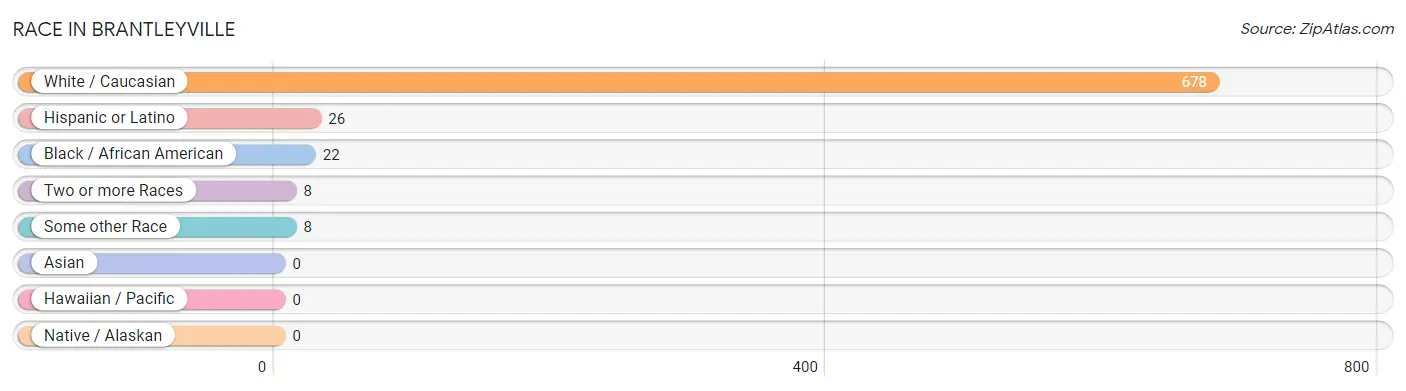
| Race | # Population | % Population |
| Asian | 0 | 0.0% |
| Black / African American | 22 | 3.1% |
| Hawaiian / Pacific | 0 | 0.0% |
| Hispanic or Latino | 26 | 3.6% |
| Native / Alaskan | 0 | 0.0% |
| White / Caucasian | 678 | 94.7% |
| Two or more Races | 8 | 1.1% |
| Some other Race | 8 | 1.1% |
| Total | 716 | 100.0% |
Ancestry in Brantleyville
The most populous ancestries reported in Brantleyville are Irish (74 | 10.3%), American (73 | 10.2%), English (42 | 5.9%), Scottish (41 | 5.7%), and German (35 | 4.9%), together accounting for 37.0% of all Brantleyville residents.
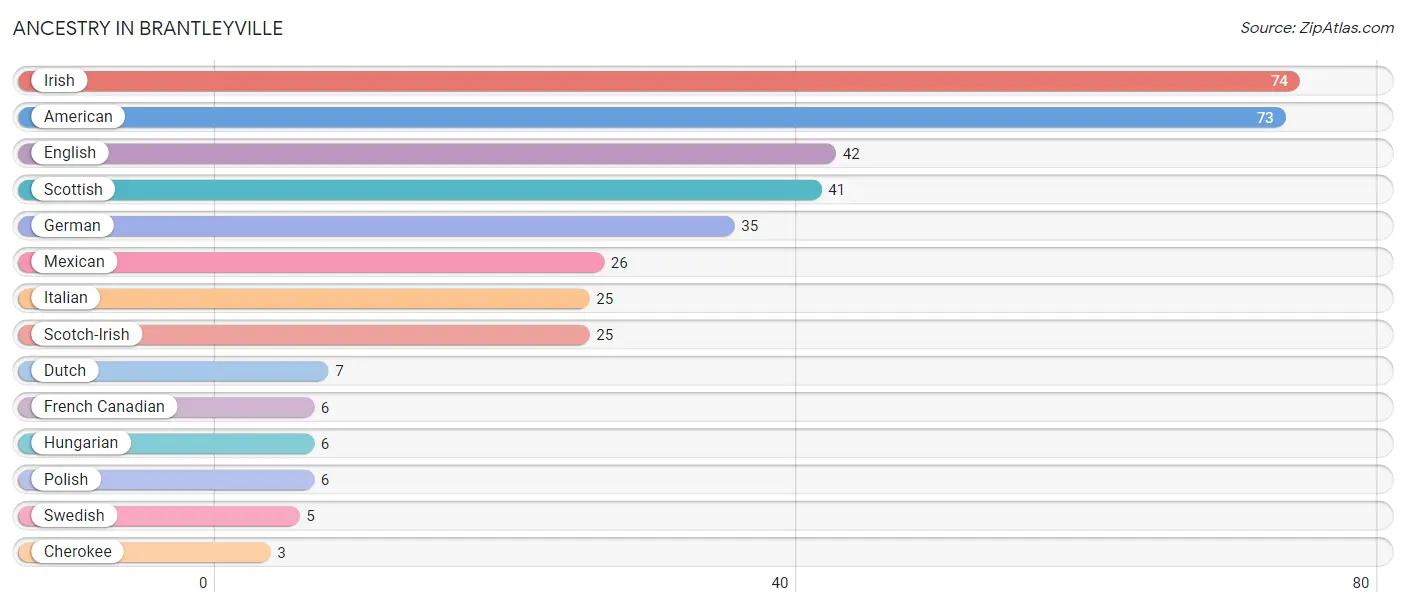
| Ancestry | # Population | % Population |
| American | 73 | 10.2% |
| Cherokee | 3 | 0.4% |
| Dutch | 7 | 1.0% |
| English | 42 | 5.9% |
| French Canadian | 6 | 0.8% |
| German | 35 | 4.9% |
| Hungarian | 6 | 0.8% |
| Irish | 74 | 10.3% |
| Italian | 25 | 3.5% |
| Mexican | 26 | 3.6% |
| Polish | 6 | 0.8% |
| Scotch-Irish | 25 | 3.5% |
| Scottish | 41 | 5.7% |
| Swedish | 5 | 0.7% | View All 14 Rows |
Immigrants in Brantleyville
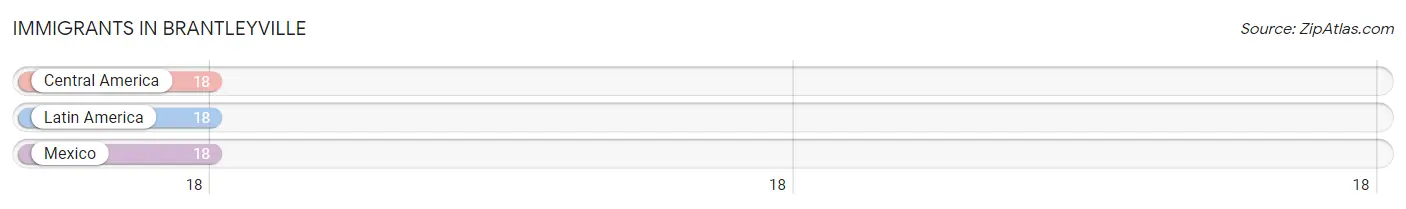
The most numerous immigrant groups reported in Brantleyville came from Central America (18 | 2.5%), Latin America (18 | 2.5%), and Mexico (18 | 2.5%), together accounting for 7.5% of all Brantleyville residents.
| Immigration Origin | # Population | % Population |
| Central America | 18 | 2.5% |
| Latin America | 18 | 2.5% |
| Mexico | 18 | 2.5% | View All 3 Rows |
Sex and Age in Brantleyville
Sex and Age in Brantleyville
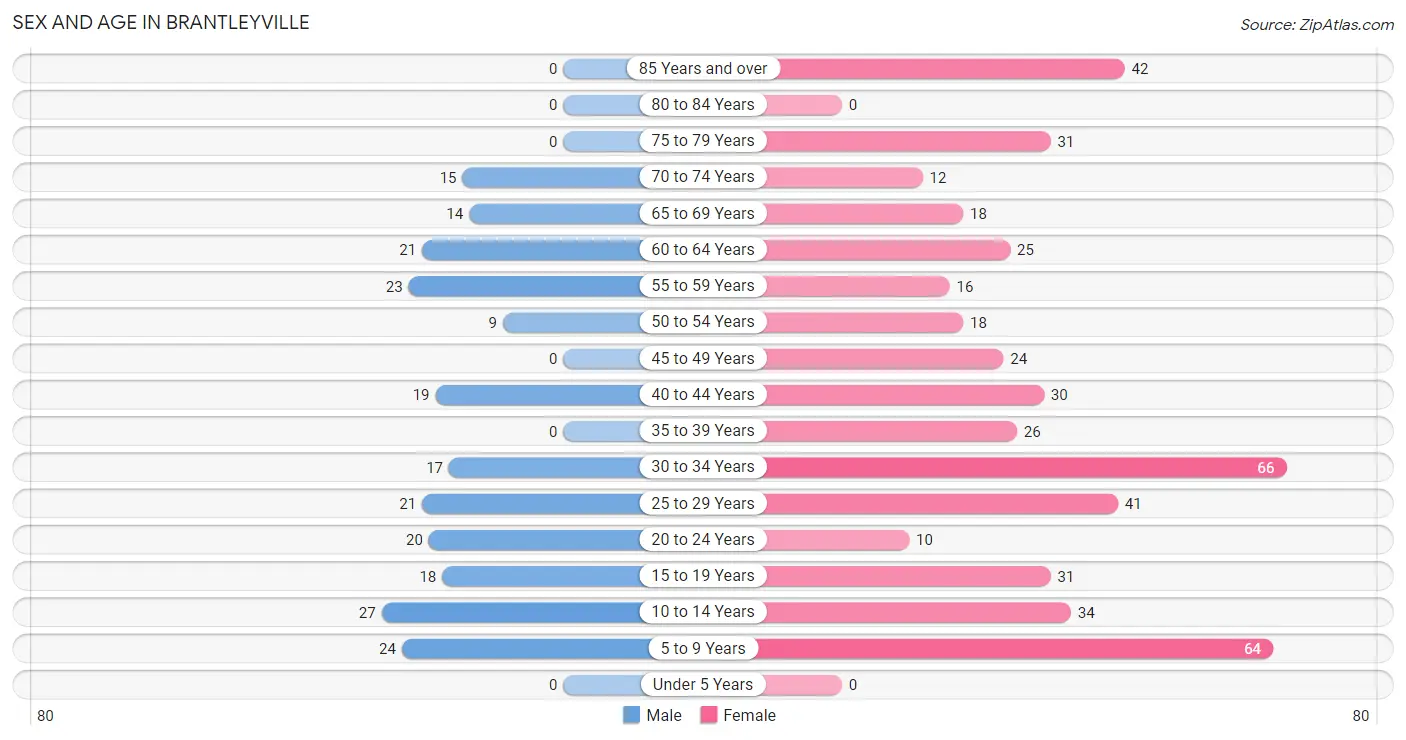
The most populous age groups in Brantleyville are 10 to 14 Years (27 | 11.8%) for men and 30 to 34 Years (66 | 13.5%) for women.
| Age Bracket | Male | Female |
| Under 5 Years | 0 (0.0%) | 0 (0.0%) |
| 5 to 9 Years | 24 (10.5%) | 64 (13.1%) |
| 10 to 14 Years | 27 (11.8%) | 34 (7.0%) |
| 15 to 19 Years | 18 (7.9%) | 31 (6.4%) |
| 20 to 24 Years | 20 (8.8%) | 10 (2.1%) |
| 25 to 29 Years | 21 (9.2%) | 41 (8.4%) |
| 30 to 34 Years | 17 (7.5%) | 66 (13.5%) |
| 35 to 39 Years | 0 (0.0%) | 26 (5.3%) |
| 40 to 44 Years | 19 (8.3%) | 30 (6.1%) |
| 45 to 49 Years | 0 (0.0%) | 24 (4.9%) |
| 50 to 54 Years | 9 (4.0%) | 18 (3.7%) |
| 55 to 59 Years | 23 (10.1%) | 16 (3.3%) |
| 60 to 64 Years | 21 (9.2%) | 25 (5.1%) |
| 65 to 69 Years | 14 (6.1%) | 18 (3.7%) |
| 70 to 74 Years | 15 (6.6%) | 12 (2.5%) |
| 75 to 79 Years | 0 (0.0%) | 31 (6.4%) |
| 80 to 84 Years | 0 (0.0%) | 0 (0.0%) |
| 85 Years and over | 0 (0.0%) | 42 (8.6%) |
| Total | 228 (100.0%) | 488 (100.0%) |
Families and Households in Brantleyville
Median Family Size in Brantleyville
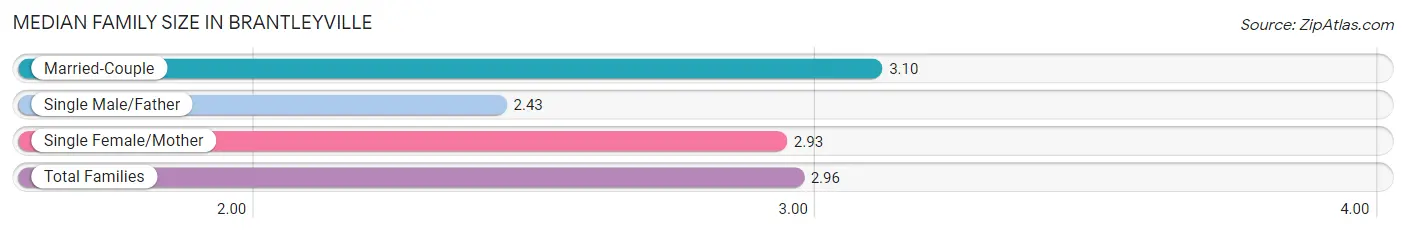
The median family size in Brantleyville is 2.96 persons per family, with married-couple families (78 | 41.5%) accounting for the largest median family size of 3.1 persons per family. On the other hand, single male/father families (14 | 7.4%) represent the smallest median family size with 2.43 persons per family.
| Family Type | # Families | Family Size |
| Married-Couple | 78 (41.5%) | 3.10 |
| Single Male/Father | 14 (7.4%) | 2.43 |
| Single Female/Mother | 96 (51.1%) | 2.93 |
| Total Families | 188 (100.0%) | 2.96 |
Median Household Size in Brantleyville
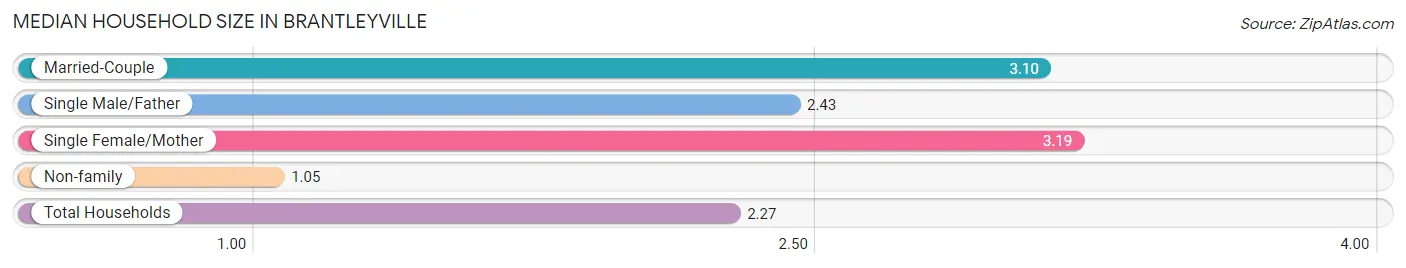
The median household size in Brantleyville is 2.27 persons per household, with single female/mother households (96 | 30.4%) accounting for the largest median household size of 3.19 persons per household. non-family households (128 | 40.5%) represent the smallest median household size with 1.05 persons per household.
| Household Type | # Households | Household Size |
| Married-Couple | 78 (24.7%) | 3.10 |
| Single Male/Father | 14 (4.4%) | 2.43 |
| Single Female/Mother | 96 (30.4%) | 3.19 |
| Non-family | 128 (40.5%) | 1.05 |
| Total Households | 316 (100.0%) | 2.27 |
Household Size by Marriage Status in Brantleyville
Out of a total of 316 households in Brantleyville, 188 (59.5%) are family households, while 128 (40.5%) are nonfamily households. The most numerous type of family households are 2-person households, comprising 100, and the most common type of nonfamily households are 1-person households, comprising 122.
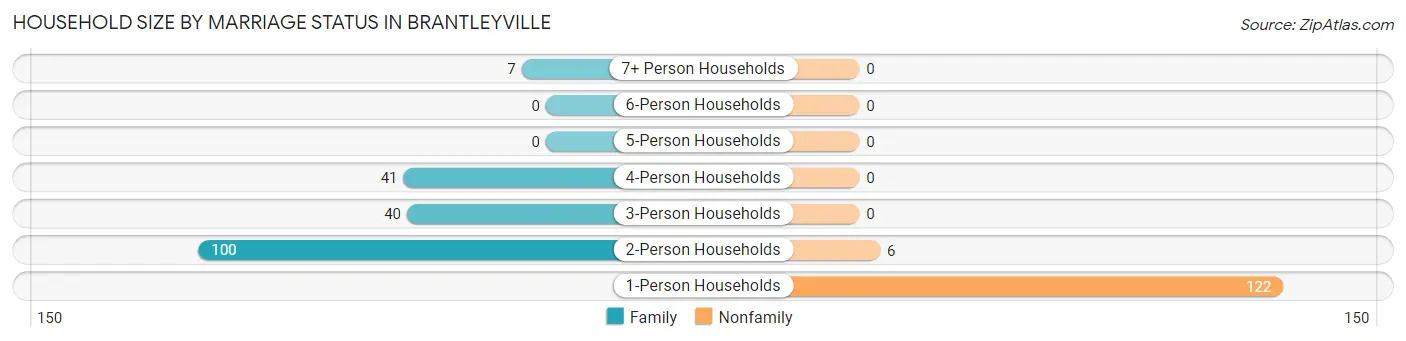
| Household Size | Family Households | Nonfamily Households |
| 1-Person Households | - | 122 (38.6%) |
| 2-Person Households | 100 (31.7%) | 6 (1.9%) |
| 3-Person Households | 40 (12.7%) | 0 (0.0%) |
| 4-Person Households | 41 (13.0%) | 0 (0.0%) |
| 5-Person Households | 0 (0.0%) | 0 (0.0%) |
| 6-Person Households | 0 (0.0%) | 0 (0.0%) |
| 7+ Person Households | 7 (2.2%) | 0 (0.0%) |
| Total | 188 (59.5%) | 128 (40.5%) |
Female Fertility in Brantleyville
Fertility by Age in Brantleyville
| Age Bracket | Women with Births | Births / 1,000 Women |
| 15 to 19 years | 0 (0.0%) | 0.0 |
| 20 to 34 years | 0 (0.0%) | 0.0 |
| 35 to 50 years | 0 (0.0%) | 0.0 |
| Total | 0 (0.0%) | 0.0 |
Fertility by Age by Marriage Status in Brantleyville
| Age Bracket | Married | Unmarried |
| 15 to 19 years | 0 (0.0%) | 0 (0.0%) |
| 20 to 34 years | 0 (0.0%) | 0 (0.0%) |
| 35 to 50 years | 0 (0.0%) | 0 (0.0%) |
| Total | 0 (0.0%) | 0 (0.0%) |
Fertility by Education in Brantleyville
| Educational Attainment | Women with Births | Births / 1,000 Women |
| Less than High School | 0 (0.0%) | 0.0 |
| High School Diploma | 0 (0.0%) | 0.0 |
| College or Associate's Degree | 0 (0.0%) | 0.0 |
| Bachelor's Degree | 0 (0.0%) | 0.0 |
| Graduate Degree | 0 (0.0%) | 0.0 |
| Total | 0 (0.0%) | 0.0 |
Fertility by Education by Marriage Status in Brantleyville
| Educational Attainment | Married | Unmarried |
| Less than High School | 0 (0.0%) | 0 (0.0%) |
| High School Diploma | 0 (0.0%) | 0 (0.0%) |
| College or Associate's Degree | 0 (0.0%) | 0 (0.0%) |
| Bachelor's Degree | 0 (0.0%) | 0 (0.0%) |
| Graduate Degree | 0 (0.0%) | 0 (0.0%) |
| Total | 0 (0.0%) | 0 (0.0%) |
Employment Characteristics in Brantleyville
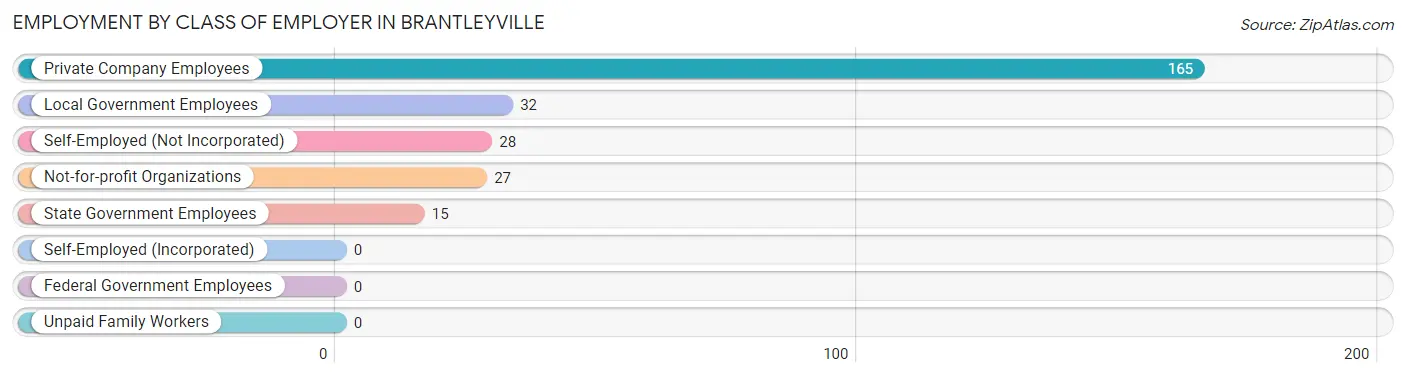
Employment by Class of Employer in Brantleyville
Among the 267 employed individuals in Brantleyville, private company employees (165 | 61.8%), local government employees (32 | 12.0%), and self-employed (not incorporated) (28 | 10.5%) make up the most common classes of employment.
| Employer Class | # Employees | % Employees |
| Private Company Employees | 165 | 61.8% |
| Self-Employed (Incorporated) | 0 | 0.0% |
| Self-Employed (Not Incorporated) | 28 | 10.5% |
| Not-for-profit Organizations | 27 | 10.1% |
| Local Government Employees | 32 | 12.0% |
| State Government Employees | 15 | 5.6% |
| Federal Government Employees | 0 | 0.0% |
| Unpaid Family Workers | 0 | 0.0% |
| Total | 267 | 100.0% |
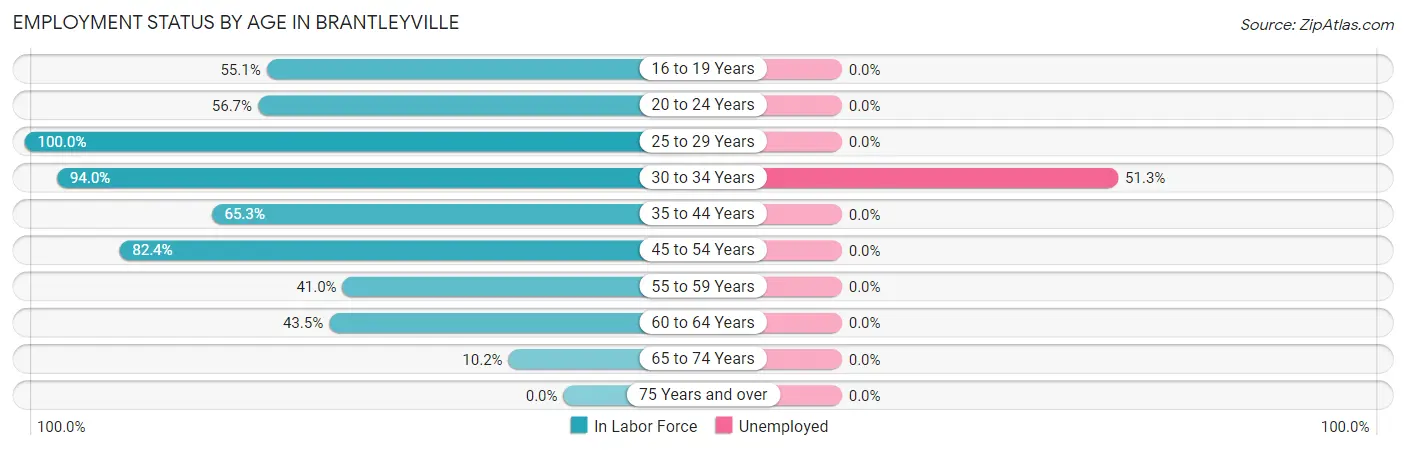
Employment Status by Age in Brantleyville
According to the labor force statistics for Brantleyville, out of the total population over 16 years of age (567), 55.9% or 317 individuals are in the labor force, with 12.6% or 40 of them unemployed. The age group with the highest labor force participation rate is 25 to 29 years, with 100.0% or 62 individuals in the labor force. Within the labor force, the 30 to 34 years age range has the highest percentage of unemployed individuals, with 51.3% or 40 of them being unemployed.
| Age Bracket | In Labor Force | Unemployed |
| 16 to 19 Years | 27 (55.1%) | 0 (0.0%) |
| 20 to 24 Years | 17 (56.7%) | 0 (0.0%) |
| 25 to 29 Years | 62 (100.0%) | 0 (0.0%) |
| 30 to 34 Years | 78 (94.0%) | 40 (51.3%) |
| 35 to 44 Years | 49 (65.3%) | 0 (0.0%) |
| 45 to 54 Years | 42 (82.4%) | 0 (0.0%) |
| 55 to 59 Years | 16 (41.0%) | 0 (0.0%) |
| 60 to 64 Years | 20 (43.5%) | 0 (0.0%) |
| 65 to 74 Years | 6 (10.2%) | 0 (0.0%) |
| 75 Years and over | 0 (0.0%) | 0 (0.0%) |
| Total | 317 (55.9%) | 40 (12.6%) |
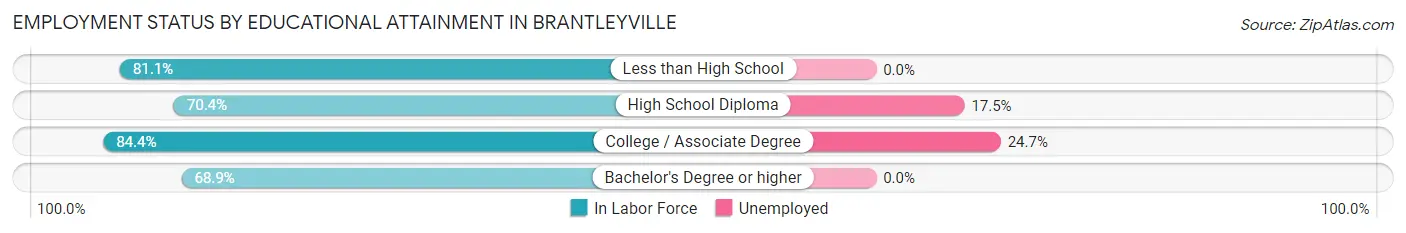
Employment Status by Educational Attainment in Brantleyville
According to labor force statistics for Brantleyville, 75.0% of individuals (267) out of the total population between 25 and 64 years of age (356) are in the labor force, with 15.0% or 40 of them being unemployed. The group with the highest labor force participation rate are those with the educational attainment of college / associate degree, with 84.4% or 81 individuals in the labor force. Within the labor force, individuals with college / associate degree education have the highest percentage of unemployment, with 24.7% or 20 of them being unemployed.
| Educational Attainment | In Labor Force | Unemployed |
| Less than High School | 30 (81.1%) | 0 (0.0%) |
| High School Diploma | 114 (70.4%) | 28 (17.5%) |
| College / Associate Degree | 81 (84.4%) | 24 (24.7%) |
| Bachelor's Degree or higher | 42 (68.9%) | 0 (0.0%) |
| Total | 267 (75.0%) | 53 (15.0%) |
Employment Occupations by Sex in Brantleyville
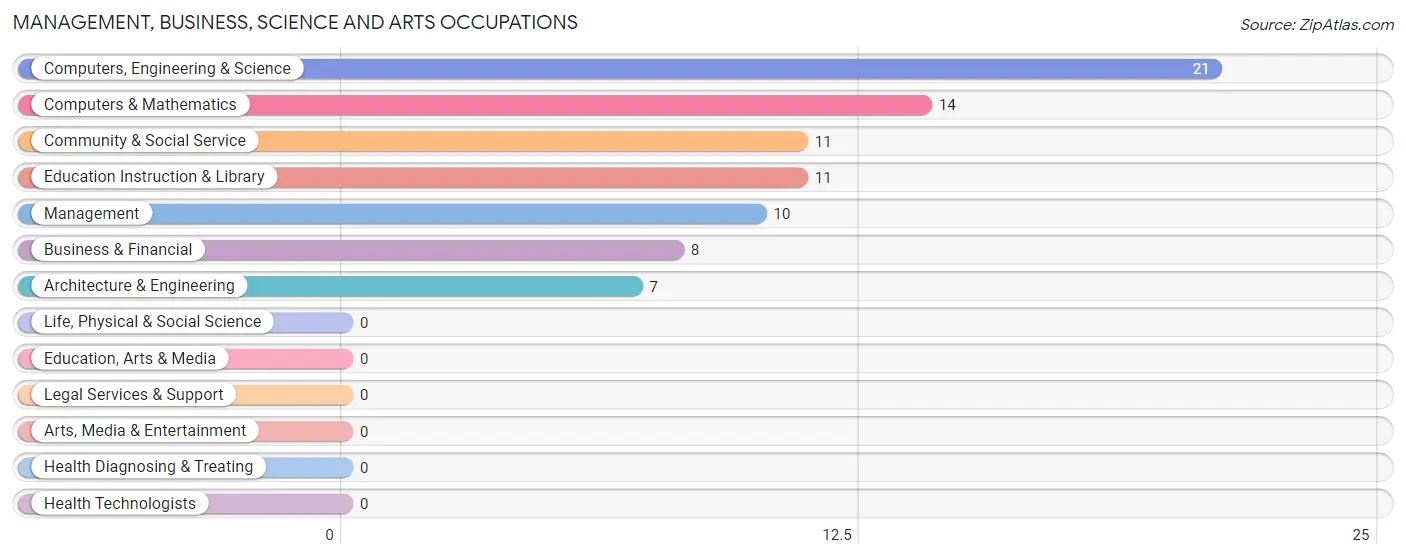
Management, Business, Science and Arts Occupations
The most common Management, Business, Science and Arts occupations in Brantleyville are Computers, Engineering & Science (21 | 7.6%), Computers & Mathematics (14 | 5.1%), Community & Social Service (11 | 4.0%), Education Instruction & Library (11 | 4.0%), and Management (10 | 3.6%).
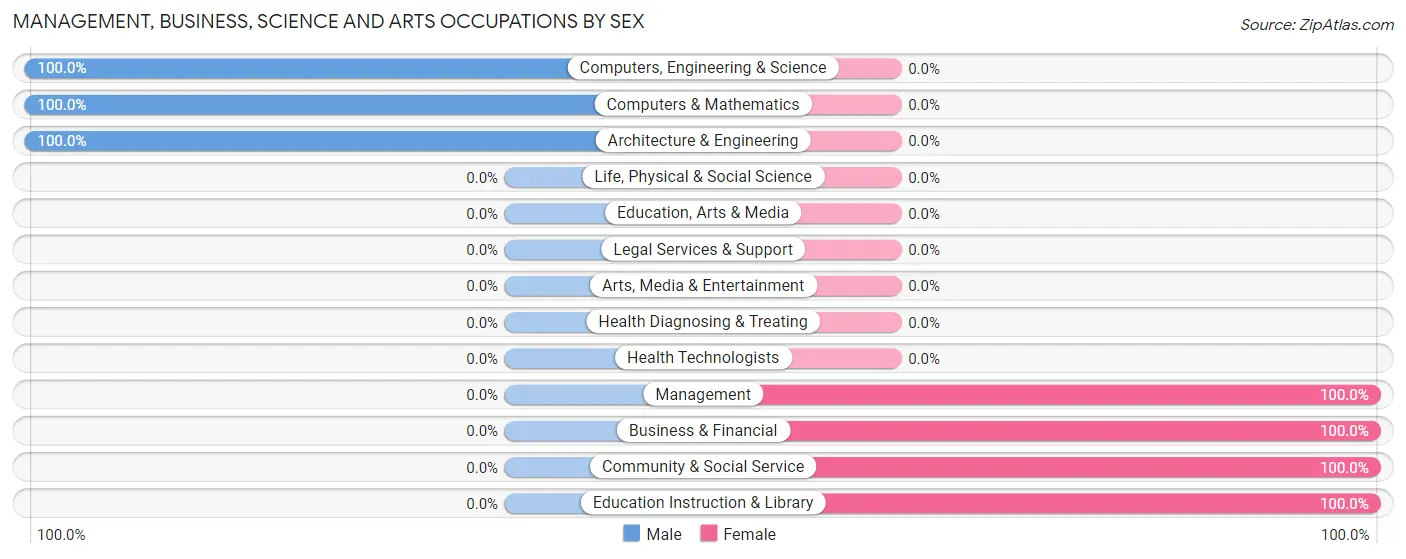
Management, Business, Science and Arts Occupations by Sex
Within the Management, Business, Science and Arts occupations in Brantleyville, the most male-oriented occupations are Computers, Engineering & Science (100.0%), Computers & Mathematics (100.0%), and Architecture & Engineering (100.0%), while the most female-oriented occupations are Management (100.0%), Business & Financial (100.0%), and Community & Social Service (100.0%).
| Occupation | Male | Female |
| Management | 0 (0.0%) | 10 (100.0%) |
| Business & Financial | 0 (0.0%) | 8 (100.0%) |
| Computers, Engineering & Science | 21 (100.0%) | 0 (0.0%) |
| Computers & Mathematics | 14 (100.0%) | 0 (0.0%) |
| Architecture & Engineering | 7 (100.0%) | 0 (0.0%) |
| Life, Physical & Social Science | 0 (0.0%) | 0 (0.0%) |
| Community & Social Service | 0 (0.0%) | 11 (100.0%) |
| Education, Arts & Media | 0 (0.0%) | 0 (0.0%) |
| Legal Services & Support | 0 (0.0%) | 0 (0.0%) |
| Education Instruction & Library | 0 (0.0%) | 11 (100.0%) |
| Arts, Media & Entertainment | 0 (0.0%) | 0 (0.0%) |
| Health Diagnosing & Treating | 0 (0.0%) | 0 (0.0%) |
| Health Technologists | 0 (0.0%) | 0 (0.0%) |
| Total (Category) | 21 (42.0%) | 29 (58.0%) |
| Total (Overall) | 97 (35.0%) | 180 (65.0%) |
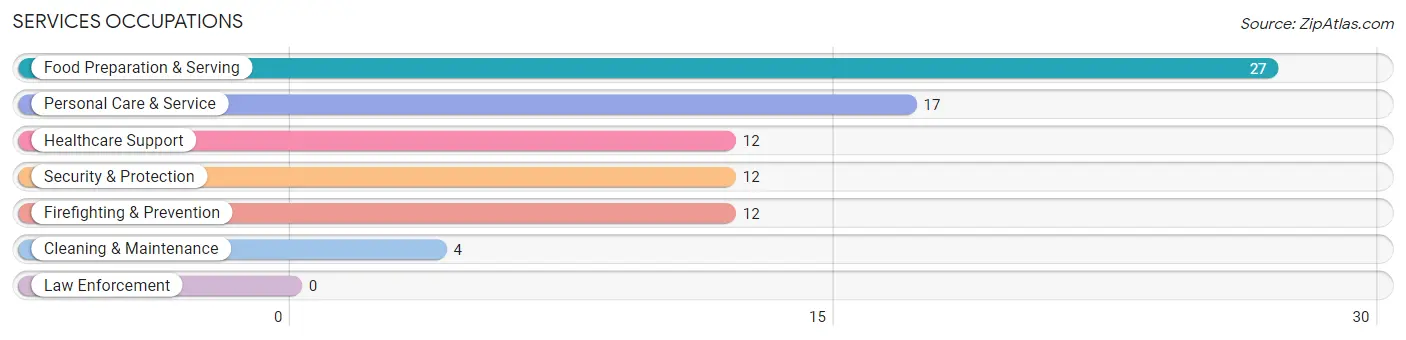
Services Occupations
The most common Services occupations in Brantleyville are Food Preparation & Serving (27 | 9.8%), Personal Care & Service (17 | 6.1%), Healthcare Support (12 | 4.3%), Security & Protection (12 | 4.3%), and Firefighting & Prevention (12 | 4.3%).
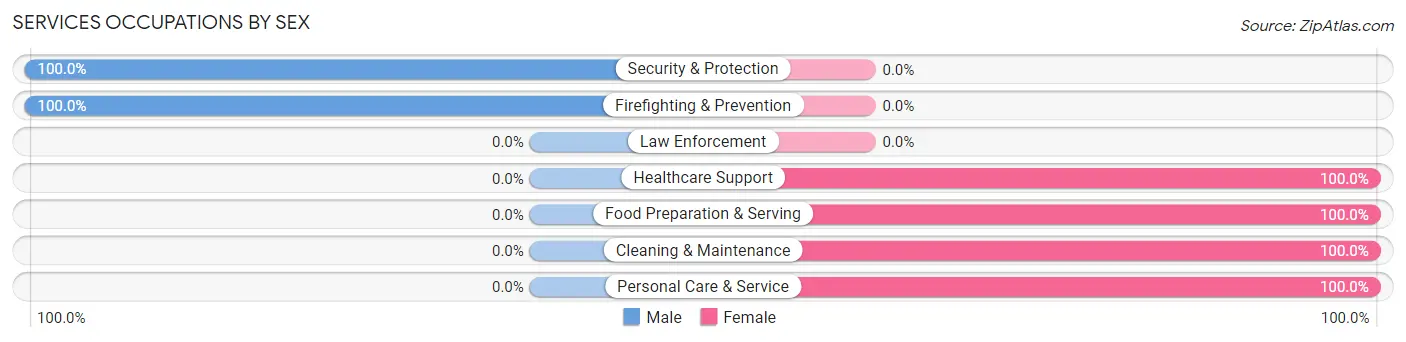
Services Occupations by Sex
Within the Services occupations in Brantleyville, the most male-oriented occupations are Security & Protection (100.0%), and Firefighting & Prevention (100.0%), while the most female-oriented occupations are Healthcare Support (100.0%), Food Preparation & Serving (100.0%), and Cleaning & Maintenance (100.0%).
| Occupation | Male | Female |
| Healthcare Support | 0 (0.0%) | 12 (100.0%) |
| Security & Protection | 12 (100.0%) | 0 (0.0%) |
| Firefighting & Prevention | 12 (100.0%) | 0 (0.0%) |
| Law Enforcement | 0 (0.0%) | 0 (0.0%) |
| Food Preparation & Serving | 0 (0.0%) | 27 (100.0%) |
| Cleaning & Maintenance | 0 (0.0%) | 4 (100.0%) |
| Personal Care & Service | 0 (0.0%) | 17 (100.0%) |
| Total (Category) | 12 (16.7%) | 60 (83.3%) |
| Total (Overall) | 97 (35.0%) | 180 (65.0%) |
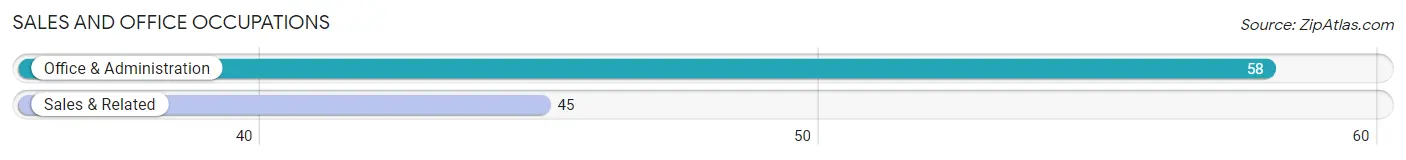
Sales and Office Occupations
The most common Sales and Office occupations in Brantleyville are Office & Administration (58 | 20.9%), and Sales & Related (45 | 16.3%).
Sales and Office Occupations by Sex
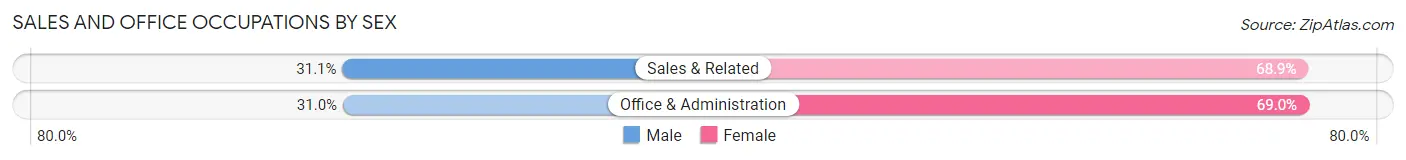
| Occupation | Male | Female |
| Sales & Related | 14 (31.1%) | 31 (68.9%) |
| Office & Administration | 18 (31.0%) | 40 (69.0%) |
| Total (Category) | 32 (31.1%) | 71 (68.9%) |
| Total (Overall) | 97 (35.0%) | 180 (65.0%) |
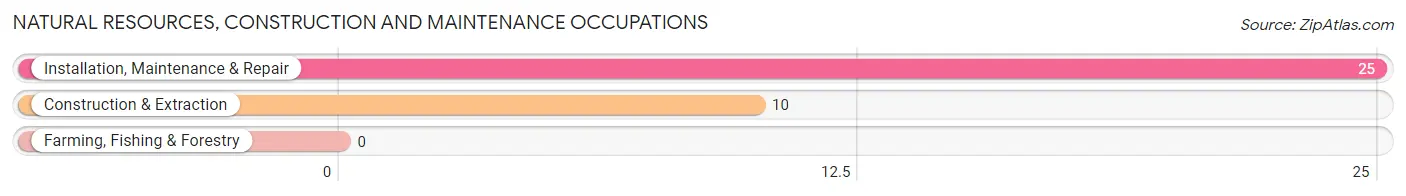
Natural Resources, Construction and Maintenance Occupations
The most common Natural Resources, Construction and Maintenance occupations in Brantleyville are Installation, Maintenance & Repair (25 | 9.0%), and Construction & Extraction (10 | 3.6%).
Natural Resources, Construction and Maintenance Occupations by Sex
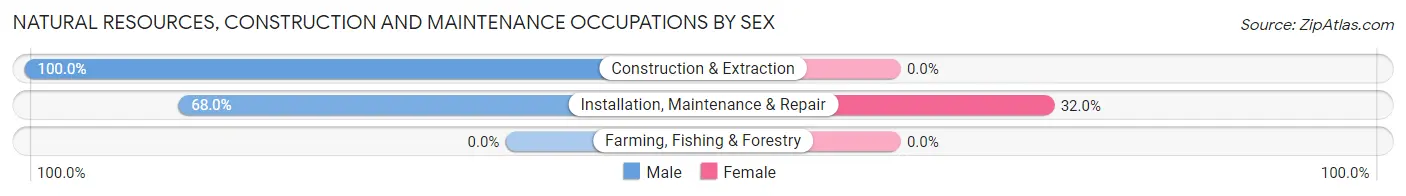
| Occupation | Male | Female |
| Farming, Fishing & Forestry | 0 (0.0%) | 0 (0.0%) |
| Construction & Extraction | 10 (100.0%) | 0 (0.0%) |
| Installation, Maintenance & Repair | 17 (68.0%) | 8 (32.0%) |
| Total (Category) | 27 (77.1%) | 8 (22.9%) |
| Total (Overall) | 97 (35.0%) | 180 (65.0%) |
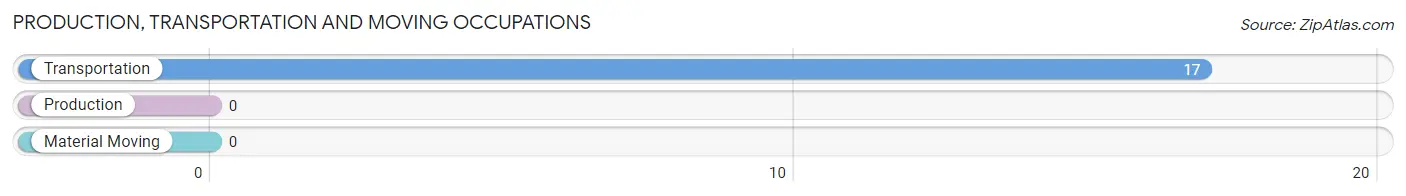
Production, Transportation and Moving Occupations
The most common Production, Transportation and Moving occupations in Brantleyville are , and Transportation (17 | 6.1%).
Production, Transportation and Moving Occupations by Sex
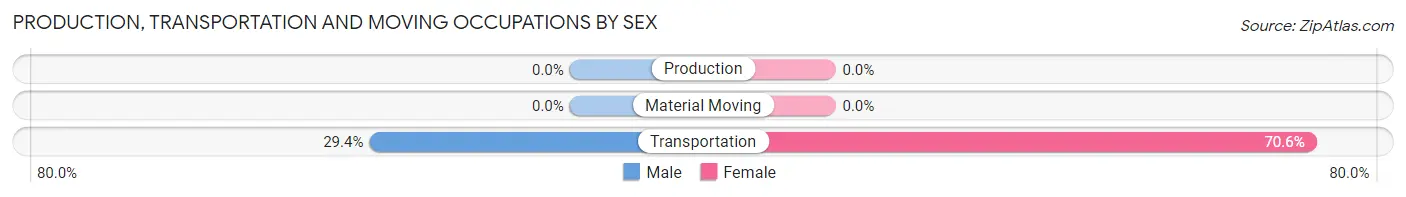
| Occupation | Male | Female |
| Production | 0 (0.0%) | 0 (0.0%) |
| Transportation | 5 (29.4%) | 12 (70.6%) |
| Material Moving | 0 (0.0%) | 0 (0.0%) |
| Total (Category) | 5 (29.4%) | 12 (70.6%) |
| Total (Overall) | 97 (35.0%) | 180 (65.0%) |
Employment Industries by Sex in Brantleyville
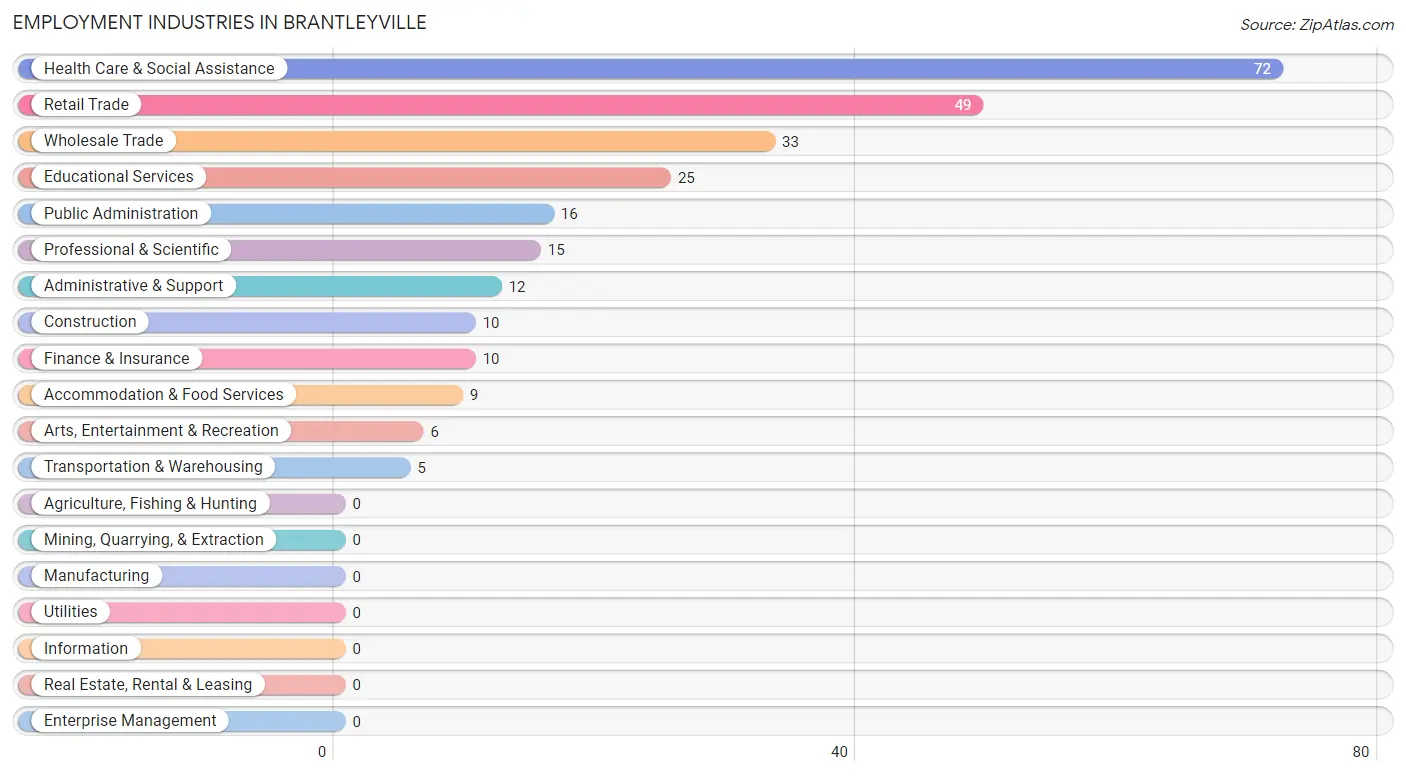
Employment Industries in Brantleyville
The major employment industries in Brantleyville include Health Care & Social Assistance (72 | 26.0%), Retail Trade (49 | 17.7%), Wholesale Trade (33 | 11.9%), Educational Services (25 | 9.0%), and Public Administration (16 | 5.8%).
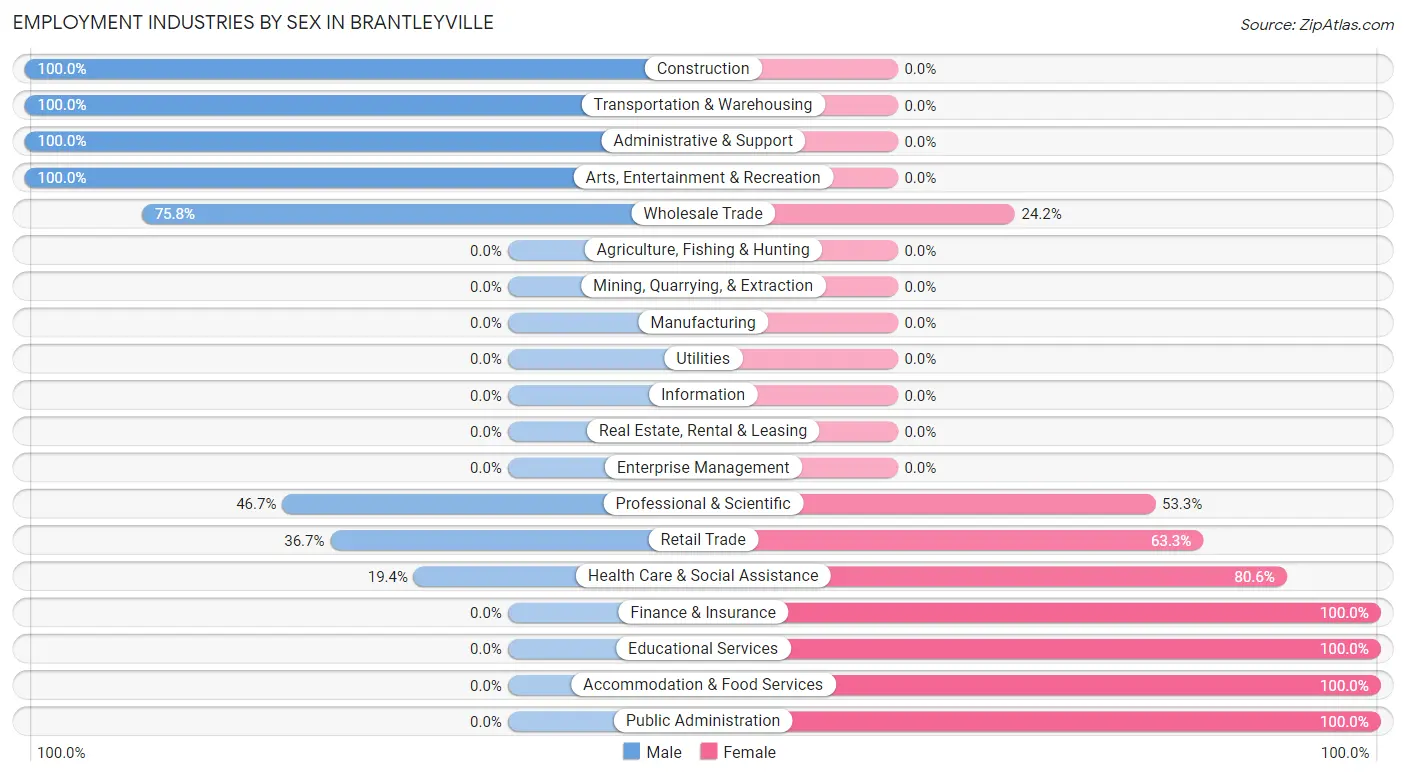
Employment Industries by Sex in Brantleyville
The Brantleyville industries that see more men than women are Construction (100.0%), Transportation & Warehousing (100.0%), and Administrative & Support (100.0%), whereas the industries that tend to have a higher number of women are Finance & Insurance (100.0%), Educational Services (100.0%), and Accommodation & Food Services (100.0%).
| Industry | Male | Female |
| Agriculture, Fishing & Hunting | 0 (0.0%) | 0 (0.0%) |
| Mining, Quarrying, & Extraction | 0 (0.0%) | 0 (0.0%) |
| Construction | 10 (100.0%) | 0 (0.0%) |
| Manufacturing | 0 (0.0%) | 0 (0.0%) |
| Wholesale Trade | 25 (75.8%) | 8 (24.2%) |
| Retail Trade | 18 (36.7%) | 31 (63.3%) |
| Transportation & Warehousing | 5 (100.0%) | 0 (0.0%) |
| Utilities | 0 (0.0%) | 0 (0.0%) |
| Information | 0 (0.0%) | 0 (0.0%) |
| Finance & Insurance | 0 (0.0%) | 10 (100.0%) |
| Real Estate, Rental & Leasing | 0 (0.0%) | 0 (0.0%) |
| Professional & Scientific | 7 (46.7%) | 8 (53.3%) |
| Enterprise Management | 0 (0.0%) | 0 (0.0%) |
| Administrative & Support | 12 (100.0%) | 0 (0.0%) |
| Educational Services | 0 (0.0%) | 25 (100.0%) |
| Health Care & Social Assistance | 14 (19.4%) | 58 (80.6%) |
| Arts, Entertainment & Recreation | 6 (100.0%) | 0 (0.0%) |
| Accommodation & Food Services | 0 (0.0%) | 9 (100.0%) |
| Public Administration | 0 (0.0%) | 16 (100.0%) |
| Total | 97 (35.0%) | 180 (65.0%) |
Education in Brantleyville
School Enrollment in Brantleyville
The most common levels of schooling among the 225 students in Brantleyville are middle school (46 | 20.4%), high school (46 | 20.4%), and elementary school (45 | 20.0%).
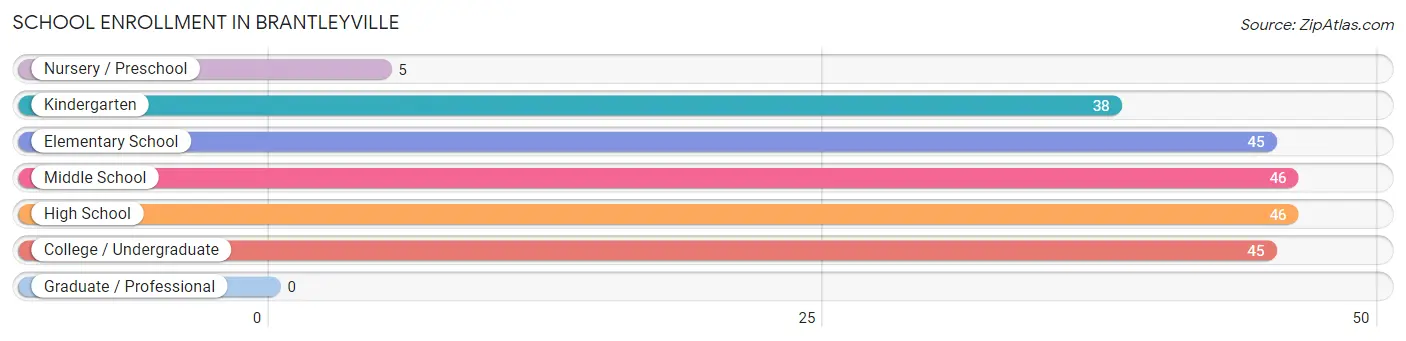
| School Level | # Students | % Students |
| Nursery / Preschool | 5 | 2.2% |
| Kindergarten | 38 | 16.9% |
| Elementary School | 45 | 20.0% |
| Middle School | 46 | 20.4% |
| High School | 46 | 20.4% |
| College / Undergraduate | 45 | 20.0% |
| Graduate / Professional | 0 | 0.0% |
| Total | 225 | 100.0% |
School Enrollment by Age by Funding Source in Brantleyville
Out of a total of 225 students who are enrolled in schools in Brantleyville, 42 (18.7%) attend a private institution, while the remaining 183 (81.3%) are enrolled in public schools. The age group of 5 to 9 year old has the highest likelihood of being enrolled in private schools, with 27 (30.7% in the age bracket) enrolled. Conversely, the age group of 15 to 17 year olds has the lowest likelihood of being enrolled in a private school, with 9 (100.0% in the age bracket) attending a public institution.
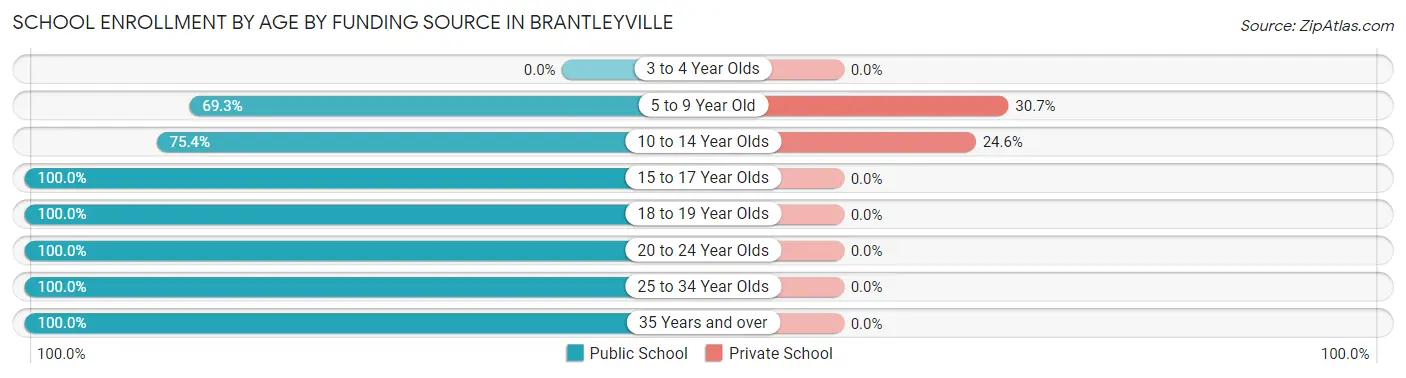
| Age Bracket | Public School | Private School |
| 3 to 4 Year Olds | 0 (0.0%) | 0 (0.0%) |
| 5 to 9 Year Old | 61 (69.3%) | 27 (30.7%) |
| 10 to 14 Year Olds | 46 (75.4%) | 15 (24.6%) |
| 15 to 17 Year Olds | 9 (100.0%) | 0 (0.0%) |
| 18 to 19 Year Olds | 30 (100.0%) | 0 (0.0%) |
| 20 to 24 Year Olds | 10 (100.0%) | 0 (0.0%) |
| 25 to 34 Year Olds | 20 (100.0%) | 0 (0.0%) |
| 35 Years and over | 7 (100.0%) | 0 (0.0%) |
| Total | 183 (81.3%) | 42 (18.7%) |
Educational Attainment by Field of Study in Brantleyville
Business (51 | 75.0%), arts & humanities (8 | 11.8%), engineering (5 | 7.3%), and education (4 | 5.9%) are the most common fields of study among 68 individuals in Brantleyville who have obtained a bachelor's degree or higher.
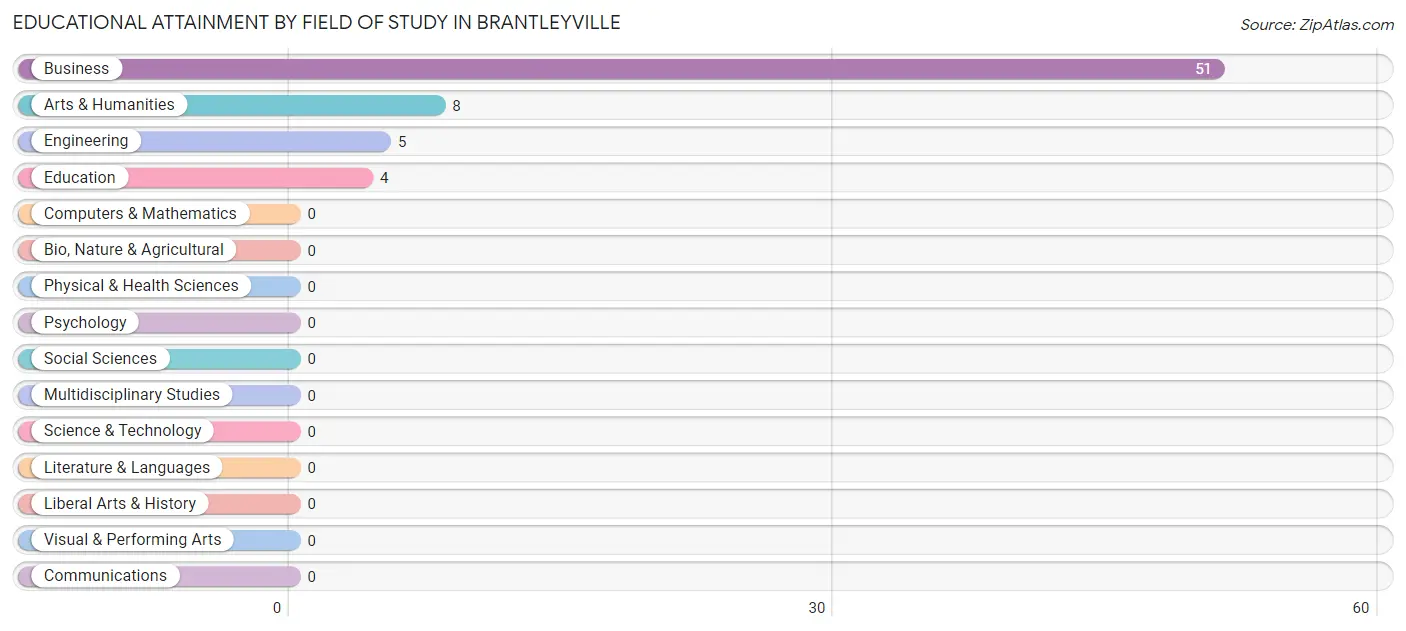
| Field of Study | # Graduates | % Graduates |
| Computers & Mathematics | 0 | 0.0% |
| Bio, Nature & Agricultural | 0 | 0.0% |
| Physical & Health Sciences | 0 | 0.0% |
| Psychology | 0 | 0.0% |
| Social Sciences | 0 | 0.0% |
| Engineering | 5 | 7.3% |
| Multidisciplinary Studies | 0 | 0.0% |
| Science & Technology | 0 | 0.0% |
| Business | 51 | 75.0% |
| Education | 4 | 5.9% |
| Literature & Languages | 0 | 0.0% |
| Liberal Arts & History | 0 | 0.0% |
| Visual & Performing Arts | 0 | 0.0% |
| Communications | 0 | 0.0% |
| Arts & Humanities | 8 | 11.8% |
| Total | 68 | 100.0% |
Transportation & Commute in Brantleyville
Vehicle Availability by Sex in Brantleyville
The most prevalent vehicle ownership categories in Brantleyville are males with 2 vehicles (52, accounting for 59.8%) and females with 2 vehicles (64, making up 28.9%).
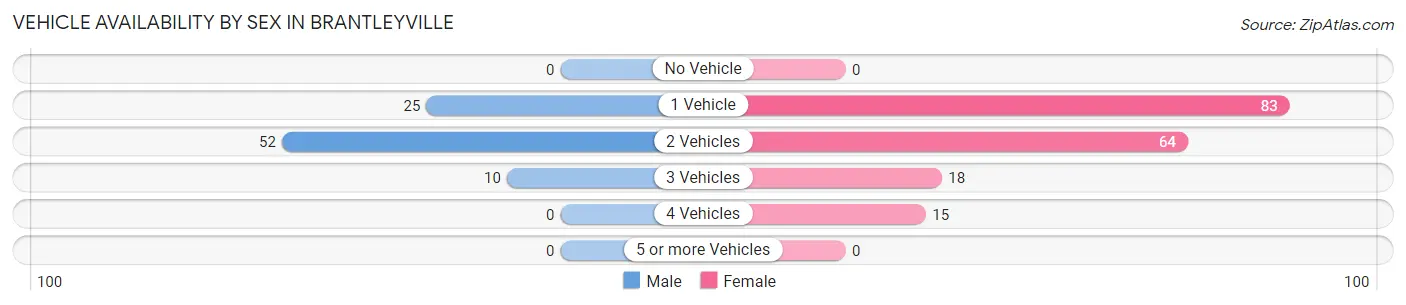
| Vehicles Available | Male | Female |
| No Vehicle | 0 (0.0%) | 0 (0.0%) |
| 1 Vehicle | 25 (28.7%) | 83 (46.1%) |
| 2 Vehicles | 52 (59.8%) | 64 (35.6%) |
| 3 Vehicles | 10 (11.5%) | 18 (10.0%) |
| 4 Vehicles | 0 (0.0%) | 15 (8.3%) |
| 5 or more Vehicles | 0 (0.0%) | 0 (0.0%) |
| Total | 87 (100.0%) | 180 (100.0%) |
Commute Time in Brantleyville
The most frequently occuring commute durations in Brantleyville are 20 to 24 minutes (59 commuters, 26.5%), 30 to 34 minutes (34 commuters, 15.2%), and 45 to 59 minutes (26 commuters, 11.7%).
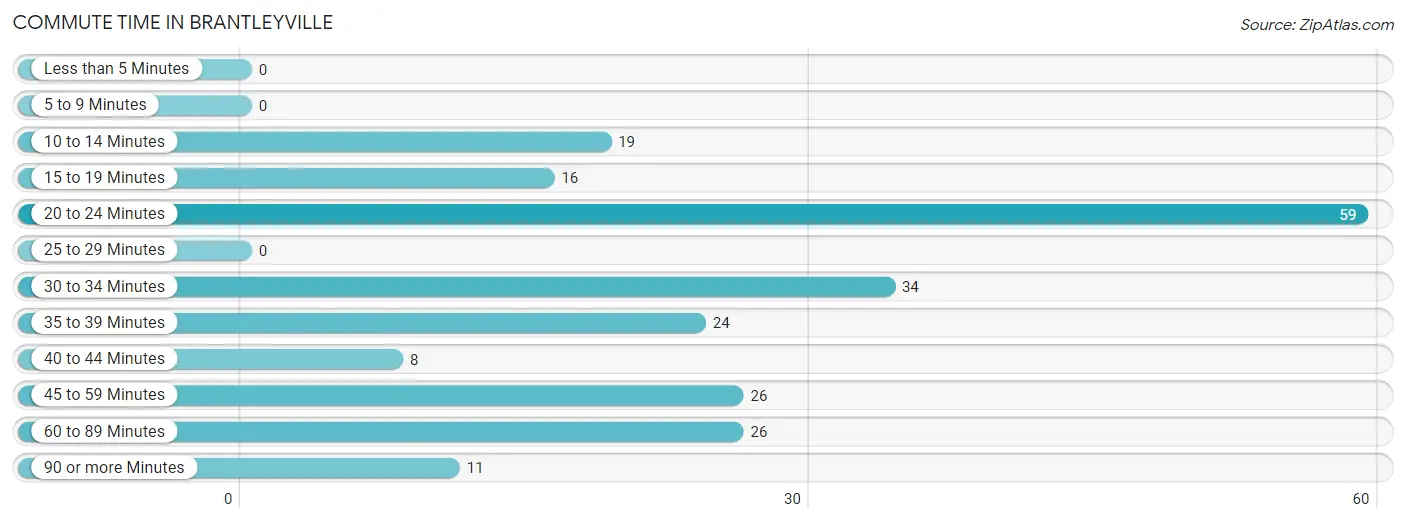
| Commute Time | # Commuters | % Commuters |
| Less than 5 Minutes | 0 | 0.0% |
| 5 to 9 Minutes | 0 | 0.0% |
| 10 to 14 Minutes | 19 | 8.5% |
| 15 to 19 Minutes | 16 | 7.2% |
| 20 to 24 Minutes | 59 | 26.5% |
| 25 to 29 Minutes | 0 | 0.0% |
| 30 to 34 Minutes | 34 | 15.2% |
| 35 to 39 Minutes | 24 | 10.8% |
| 40 to 44 Minutes | 8 | 3.6% |
| 45 to 59 Minutes | 26 | 11.7% |
| 60 to 89 Minutes | 26 | 11.7% |
| 90 or more Minutes | 11 | 4.9% |
Commute Time by Sex in Brantleyville
The most common commute times in Brantleyville are 30 to 34 minutes (17 commuters, 23.3%) for males and 20 to 24 minutes (45 commuters, 30.0%) for females.
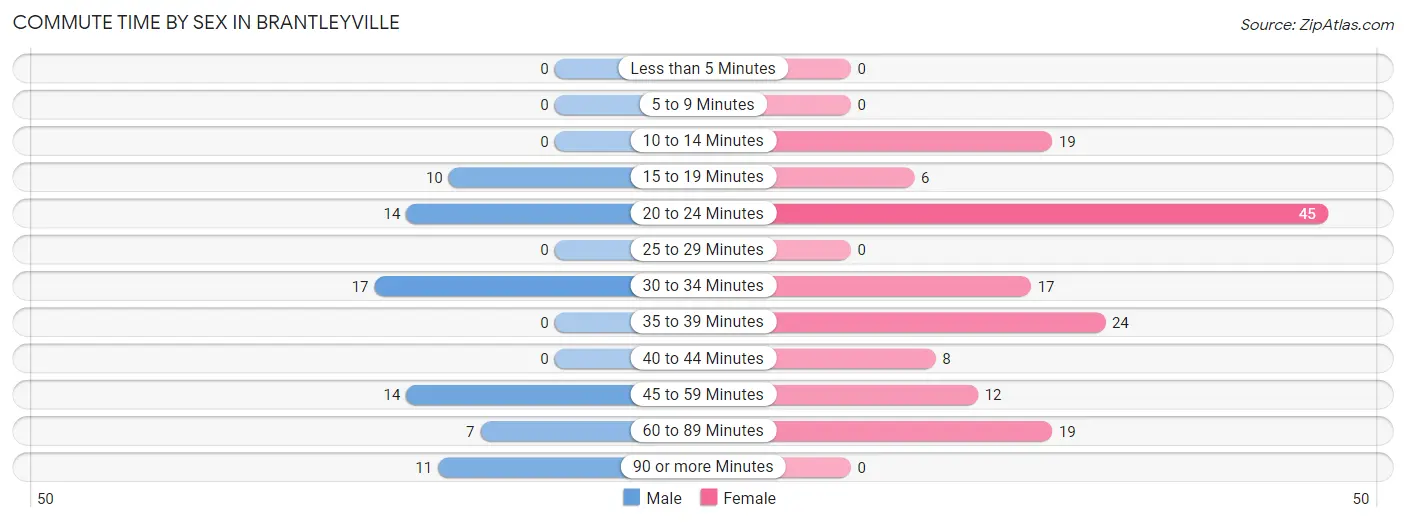
| Commute Time | Male | Female |
| Less than 5 Minutes | 0 (0.0%) | 0 (0.0%) |
| 5 to 9 Minutes | 0 (0.0%) | 0 (0.0%) |
| 10 to 14 Minutes | 0 (0.0%) | 19 (12.7%) |
| 15 to 19 Minutes | 10 (13.7%) | 6 (4.0%) |
| 20 to 24 Minutes | 14 (19.2%) | 45 (30.0%) |
| 25 to 29 Minutes | 0 (0.0%) | 0 (0.0%) |
| 30 to 34 Minutes | 17 (23.3%) | 17 (11.3%) |
| 35 to 39 Minutes | 0 (0.0%) | 24 (16.0%) |
| 40 to 44 Minutes | 0 (0.0%) | 8 (5.3%) |
| 45 to 59 Minutes | 14 (19.2%) | 12 (8.0%) |
| 60 to 89 Minutes | 7 (9.6%) | 19 (12.7%) |
| 90 or more Minutes | 11 (15.1%) | 0 (0.0%) |
Time of Departure to Work by Sex in Brantleyville
The most frequent times of departure to work in Brantleyville are 6:00 AM to 6:29 AM (20, 27.4%) for males and 6:00 AM to 6:29 AM (40, 26.7%) for females.
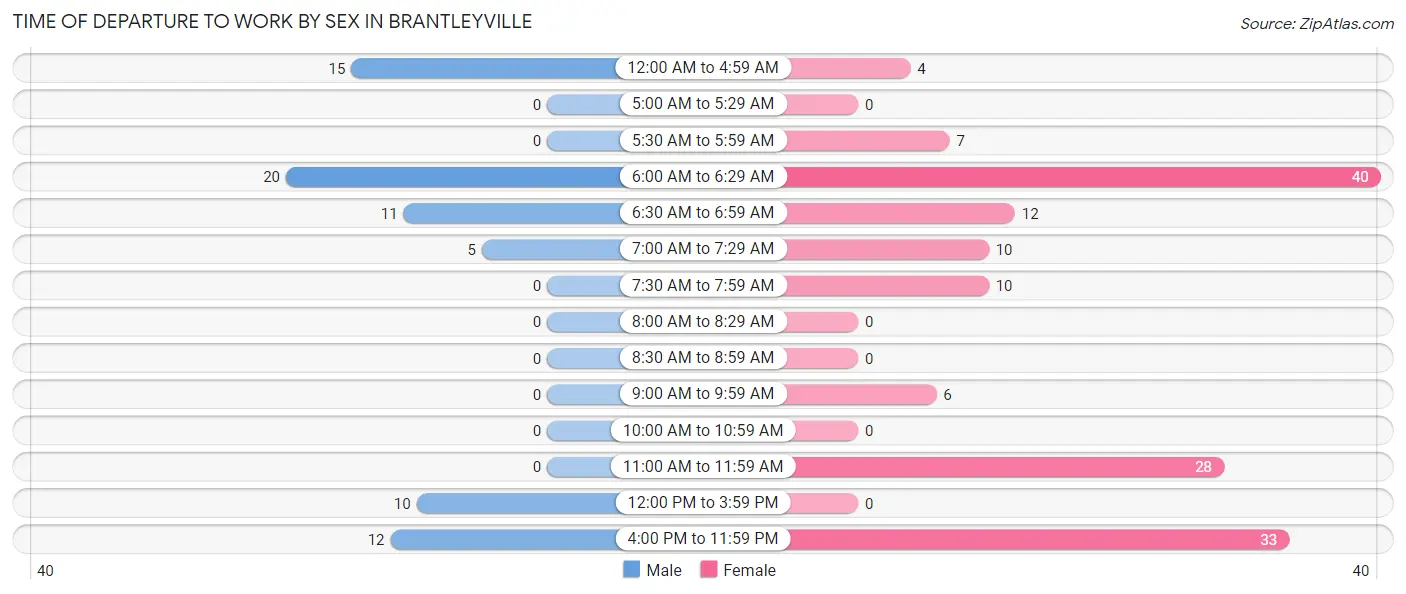
| Time of Departure | Male | Female |
| 12:00 AM to 4:59 AM | 15 (20.5%) | 4 (2.7%) |
| 5:00 AM to 5:29 AM | 0 (0.0%) | 0 (0.0%) |
| 5:30 AM to 5:59 AM | 0 (0.0%) | 7 (4.7%) |
| 6:00 AM to 6:29 AM | 20 (27.4%) | 40 (26.7%) |
| 6:30 AM to 6:59 AM | 11 (15.1%) | 12 (8.0%) |
| 7:00 AM to 7:29 AM | 5 (6.9%) | 10 (6.7%) |
| 7:30 AM to 7:59 AM | 0 (0.0%) | 10 (6.7%) |
| 8:00 AM to 8:29 AM | 0 (0.0%) | 0 (0.0%) |
| 8:30 AM to 8:59 AM | 0 (0.0%) | 0 (0.0%) |
| 9:00 AM to 9:59 AM | 0 (0.0%) | 6 (4.0%) |
| 10:00 AM to 10:59 AM | 0 (0.0%) | 0 (0.0%) |
| 11:00 AM to 11:59 AM | 0 (0.0%) | 28 (18.7%) |
| 12:00 PM to 3:59 PM | 10 (13.7%) | 0 (0.0%) |
| 4:00 PM to 11:59 PM | 12 (16.4%) | 33 (22.0%) |
| Total | 73 (100.0%) | 150 (100.0%) |
Housing Occupancy in Brantleyville
Occupancy by Ownership in Brantleyville
Of the total 316 dwellings in Brantleyville, owner-occupied units account for 232 (73.4%), while renter-occupied units make up 84 (26.6%).
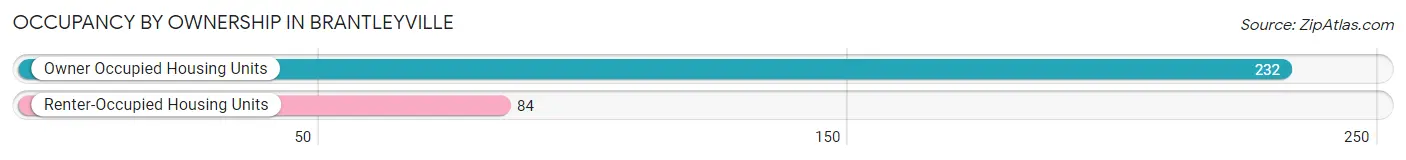
| Occupancy | # Housing Units | % Housing Units |
| Owner Occupied Housing Units | 232 | 73.4% |
| Renter-Occupied Housing Units | 84 | 26.6% |
| Total Occupied Housing Units | 316 | 100.0% |
Occupancy by Household Size in Brantleyville
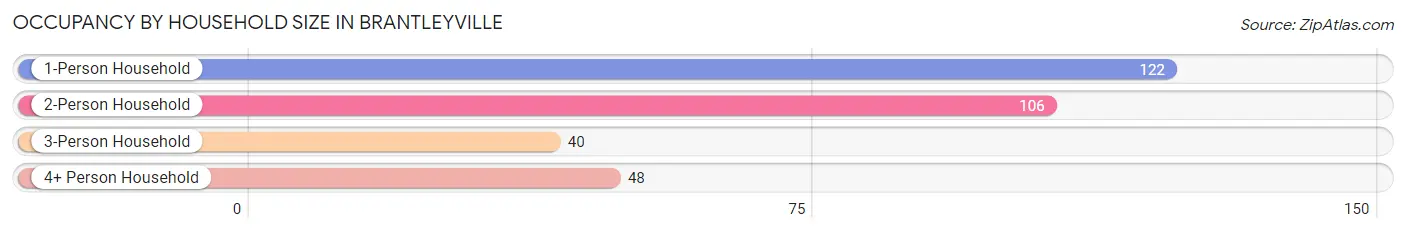
| Household Size | # Housing Units | % Housing Units |
| 1-Person Household | 122 | 38.6% |
| 2-Person Household | 106 | 33.5% |
| 3-Person Household | 40 | 12.7% |
| 4+ Person Household | 48 | 15.2% |
| Total Housing Units | 316 | 100.0% |
Occupancy by Ownership by Household Size in Brantleyville
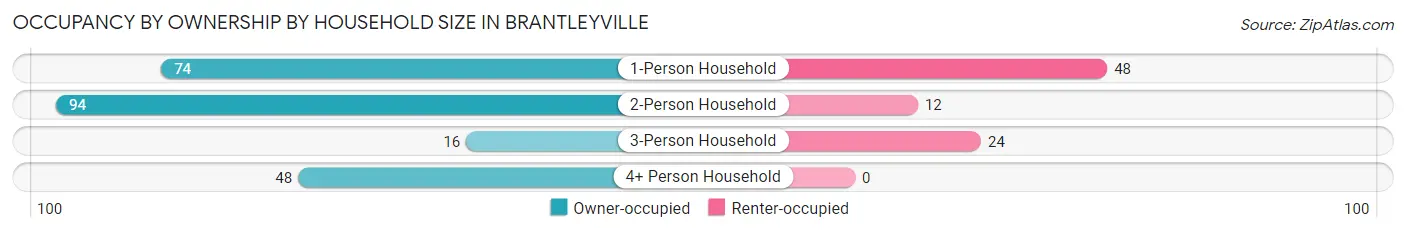
| Household Size | Owner-occupied | Renter-occupied |
| 1-Person Household | 74 (60.7%) | 48 (39.3%) |
| 2-Person Household | 94 (88.7%) | 12 (11.3%) |
| 3-Person Household | 16 (40.0%) | 24 (60.0%) |
| 4+ Person Household | 48 (100.0%) | 0 (0.0%) |
| Total Housing Units | 232 (73.4%) | 84 (26.6%) |
Occupancy by Educational Attainment in Brantleyville
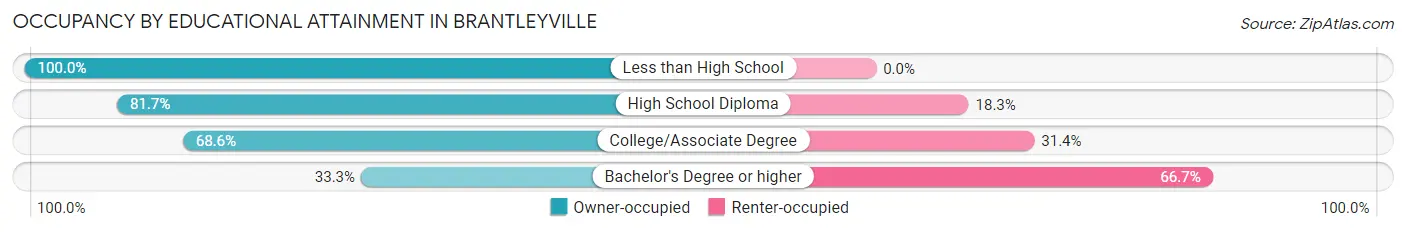
| Household Size | Owner-occupied | Renter-occupied |
| Less than High School | 49 (100.0%) | 0 (0.0%) |
| High School Diploma | 98 (81.7%) | 22 (18.3%) |
| College/Associate Degree | 70 (68.6%) | 32 (31.4%) |
| Bachelor's Degree or higher | 15 (33.3%) | 30 (66.7%) |
Occupancy by Age of Householder in Brantleyville
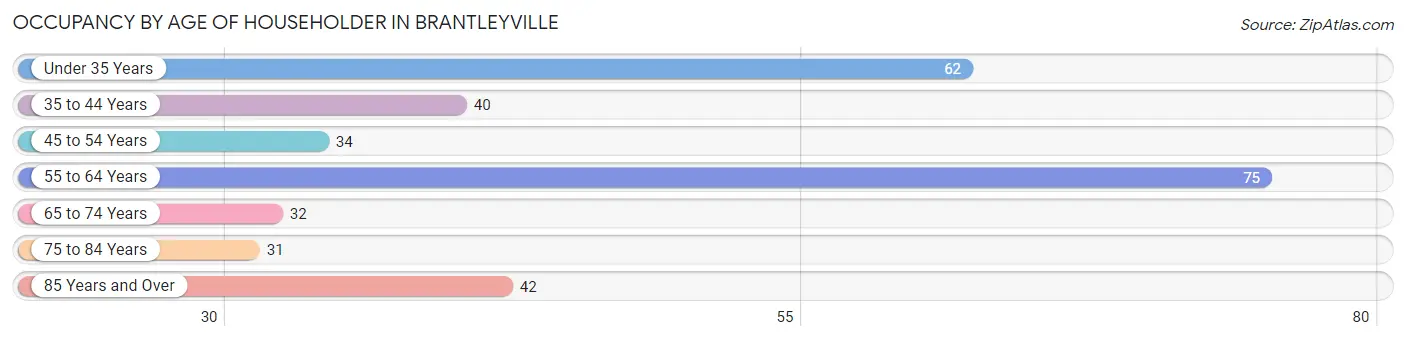
| Age Bracket | # Households | % Households |
| Under 35 Years | 62 | 19.6% |
| 35 to 44 Years | 40 | 12.7% |
| 45 to 54 Years | 34 | 10.8% |
| 55 to 64 Years | 75 | 23.7% |
| 65 to 74 Years | 32 | 10.1% |
| 75 to 84 Years | 31 | 9.8% |
| 85 Years and Over | 42 | 13.3% |
| Total | 316 | 100.0% |
Housing Finances in Brantleyville
Median Income by Occupancy in Brantleyville
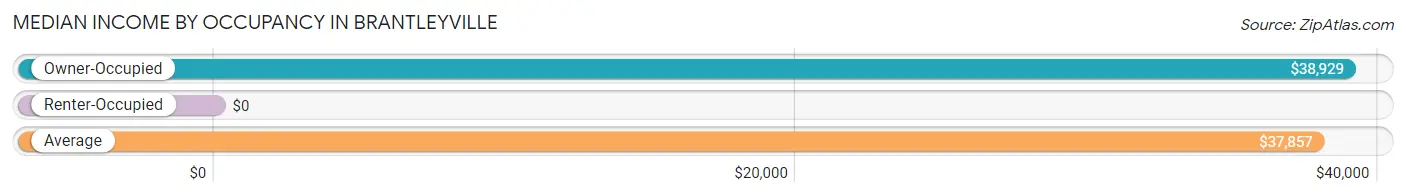
| Occupancy Type | # Households | Median Income |
| Owner-Occupied | 232 (73.4%) | $38,929 |
| Renter-Occupied | 84 (26.6%) | $0 |
| Average | 316 (100.0%) | $37,857 |
Occupancy by Householder Income Bracket in Brantleyville
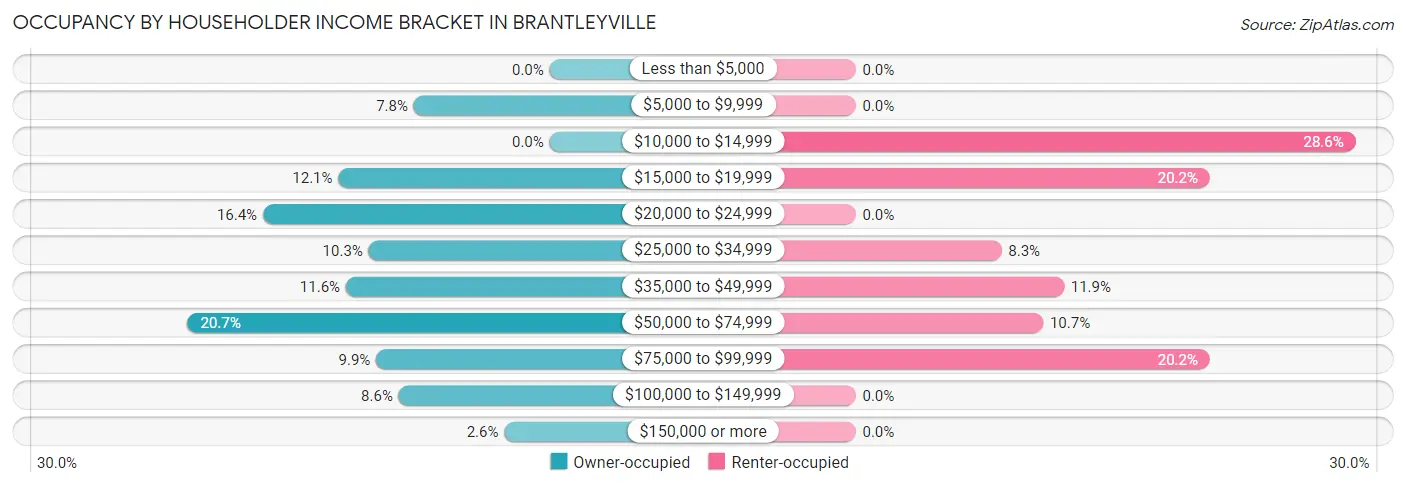
| Income Bracket | Owner-occupied | Renter-occupied |
| Less than $5,000 | 0 (0.0%) | 0 (0.0%) |
| $5,000 to $9,999 | 18 (7.8%) | 0 (0.0%) |
| $10,000 to $14,999 | 0 (0.0%) | 24 (28.6%) |
| $15,000 to $19,999 | 28 (12.1%) | 17 (20.2%) |
| $20,000 to $24,999 | 38 (16.4%) | 0 (0.0%) |
| $25,000 to $34,999 | 24 (10.3%) | 7 (8.3%) |
| $35,000 to $49,999 | 27 (11.6%) | 10 (11.9%) |
| $50,000 to $74,999 | 48 (20.7%) | 9 (10.7%) |
| $75,000 to $99,999 | 23 (9.9%) | 17 (20.2%) |
| $100,000 to $149,999 | 20 (8.6%) | 0 (0.0%) |
| $150,000 or more | 6 (2.6%) | 0 (0.0%) |
| Total | 232 (100.0%) | 84 (100.0%) |
Monthly Housing Cost Tiers in Brantleyville
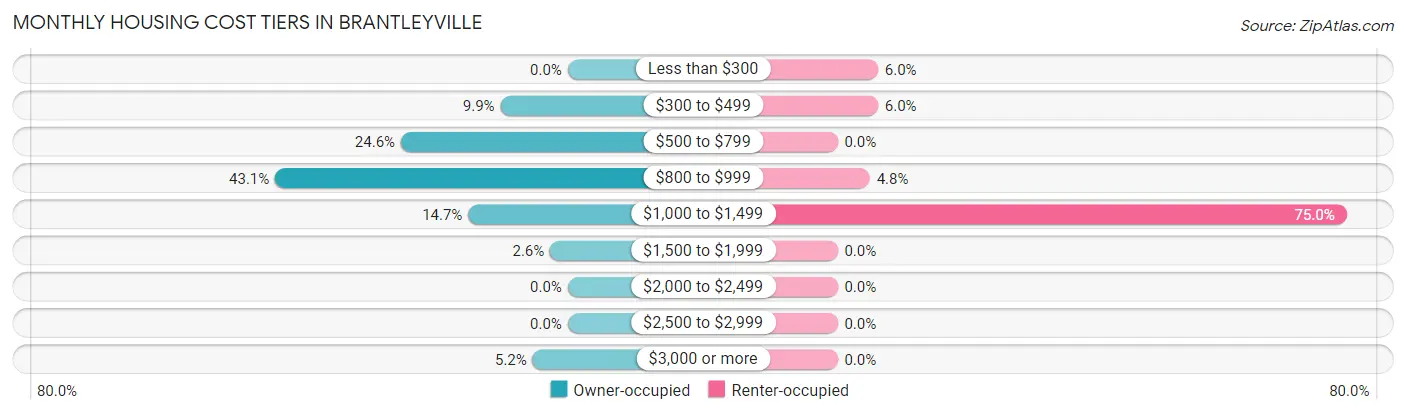
| Monthly Cost | Owner-occupied | Renter-occupied |
| Less than $300 | 0 (0.0%) | 5 (5.9%) |
| $300 to $499 | 23 (9.9%) | 5 (5.9%) |
| $500 to $799 | 57 (24.6%) | 0 (0.0%) |
| $800 to $999 | 100 (43.1%) | 4 (4.8%) |
| $1,000 to $1,499 | 34 (14.7%) | 63 (75.0%) |
| $1,500 to $1,999 | 6 (2.6%) | 0 (0.0%) |
| $2,000 to $2,499 | 0 (0.0%) | 0 (0.0%) |
| $2,500 to $2,999 | 0 (0.0%) | 0 (0.0%) |
| $3,000 or more | 12 (5.2%) | 0 (0.0%) |
| Total | 232 (100.0%) | 84 (100.0%) |
Physical Housing Characteristics in Brantleyville
Housing Structures in Brantleyville
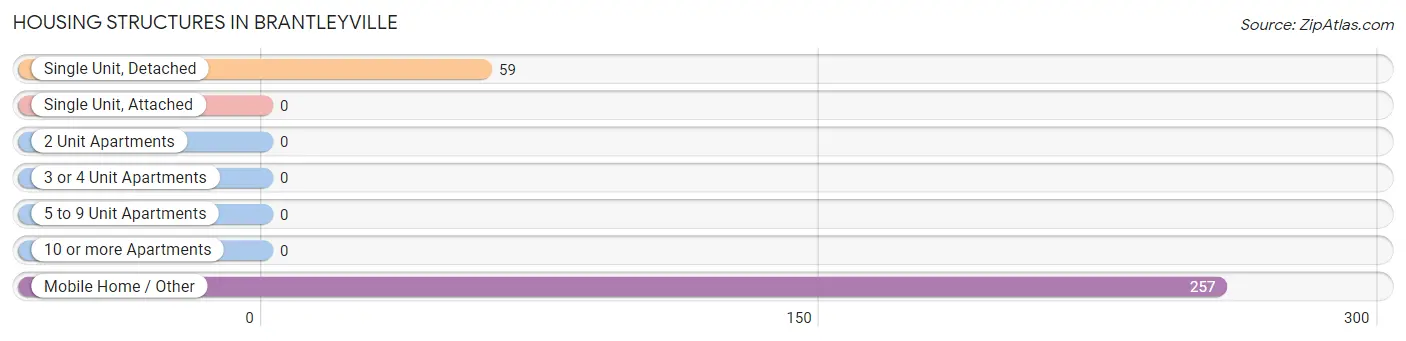
| Structure Type | # Housing Units | % Housing Units |
| Single Unit, Detached | 59 | 18.7% |
| Single Unit, Attached | 0 | 0.0% |
| 2 Unit Apartments | 0 | 0.0% |
| 3 or 4 Unit Apartments | 0 | 0.0% |
| 5 to 9 Unit Apartments | 0 | 0.0% |
| 10 or more Apartments | 0 | 0.0% |
| Mobile Home / Other | 257 | 81.3% |
| Total | 316 | 100.0% |
Housing Structures by Occupancy in Brantleyville
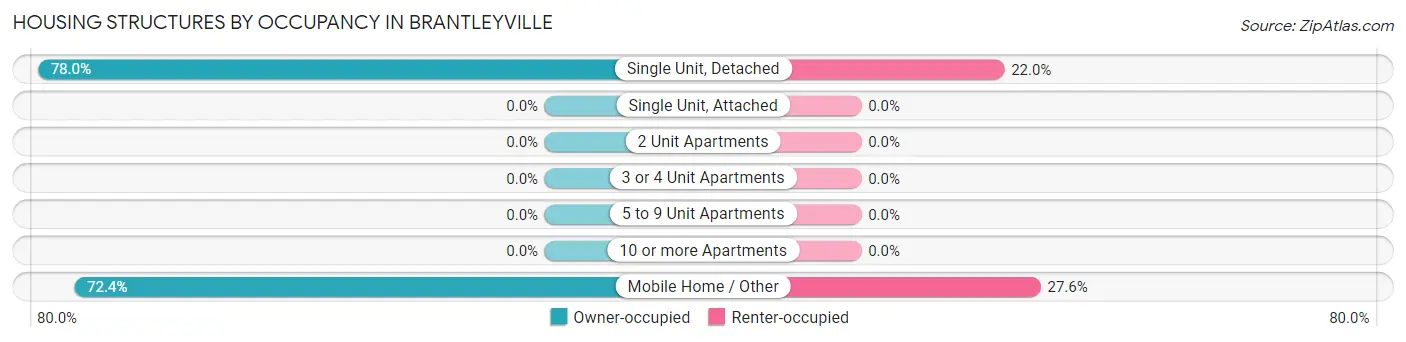
| Structure Type | Owner-occupied | Renter-occupied |
| Single Unit, Detached | 46 (78.0%) | 13 (22.0%) |
| Single Unit, Attached | 0 (0.0%) | 0 (0.0%) |
| 2 Unit Apartments | 0 (0.0%) | 0 (0.0%) |
| 3 or 4 Unit Apartments | 0 (0.0%) | 0 (0.0%) |
| 5 to 9 Unit Apartments | 0 (0.0%) | 0 (0.0%) |
| 10 or more Apartments | 0 (0.0%) | 0 (0.0%) |
| Mobile Home / Other | 186 (72.4%) | 71 (27.6%) |
| Total | 232 (73.4%) | 84 (26.6%) |
Housing Structures by Number of Rooms in Brantleyville
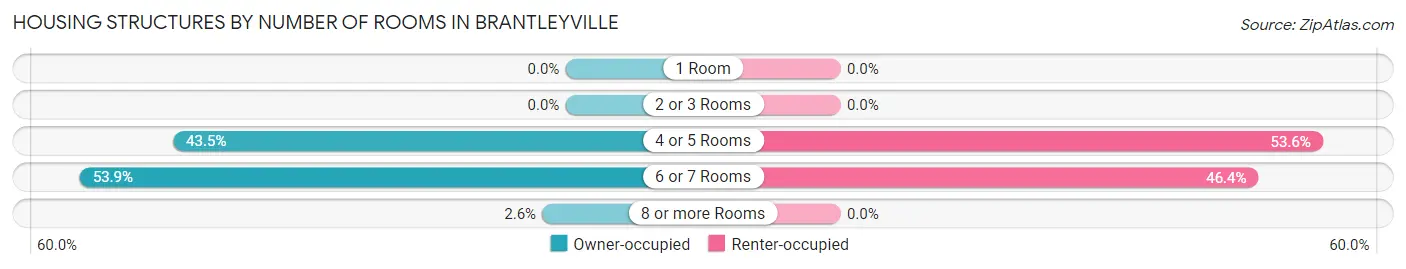
| Number of Rooms | Owner-occupied | Renter-occupied |
| 1 Room | 0 (0.0%) | 0 (0.0%) |
| 2 or 3 Rooms | 0 (0.0%) | 0 (0.0%) |
| 4 or 5 Rooms | 101 (43.5%) | 45 (53.6%) |
| 6 or 7 Rooms | 125 (53.9%) | 39 (46.4%) |
| 8 or more Rooms | 6 (2.6%) | 0 (0.0%) |
| Total | 232 (100.0%) | 84 (100.0%) |
Housing Structure by Heating Type in Brantleyville
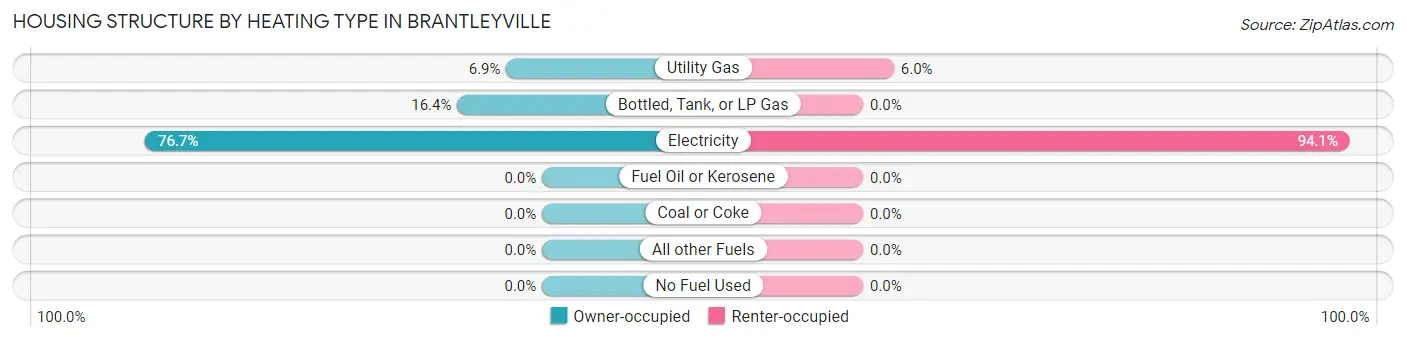
| Heating Type | Owner-occupied | Renter-occupied |
| Utility Gas | 16 (6.9%) | 5 (5.9%) |
| Bottled, Tank, or LP Gas | 38 (16.4%) | 0 (0.0%) |
| Electricity | 178 (76.7%) | 79 (94.1%) |
| Fuel Oil or Kerosene | 0 (0.0%) | 0 (0.0%) |
| Coal or Coke | 0 (0.0%) | 0 (0.0%) |
| All other Fuels | 0 (0.0%) | 0 (0.0%) |
| No Fuel Used | 0 (0.0%) | 0 (0.0%) |
| Total | 232 (100.0%) | 84 (100.0%) |
Household Vehicle Usage in Brantleyville
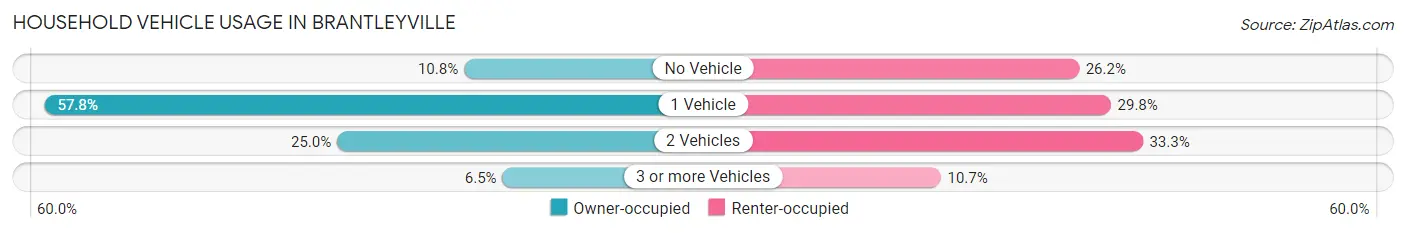
| Vehicles per Household | Owner-occupied | Renter-occupied |
| No Vehicle | 25 (10.8%) | 22 (26.2%) |
| 1 Vehicle | 134 (57.8%) | 25 (29.8%) |
| 2 Vehicles | 58 (25.0%) | 28 (33.3%) |
| 3 or more Vehicles | 15 (6.5%) | 9 (10.7%) |
| Total | 232 (100.0%) | 84 (100.0%) |
Real Estate & Mortgages in Brantleyville
Real Estate and Mortgage Overview in Brantleyville
| Characteristic | Without Mortgage | With Mortgage |
| Housing Units | 110 | 122 |
| Median Property Value | - | - |
| Median Household Income | $31,250 | $6 |
| Monthly Housing Costs | $640 | $0 |
| Real Estate Taxes | - | - |
Property Value by Mortgage Status in Brantleyville
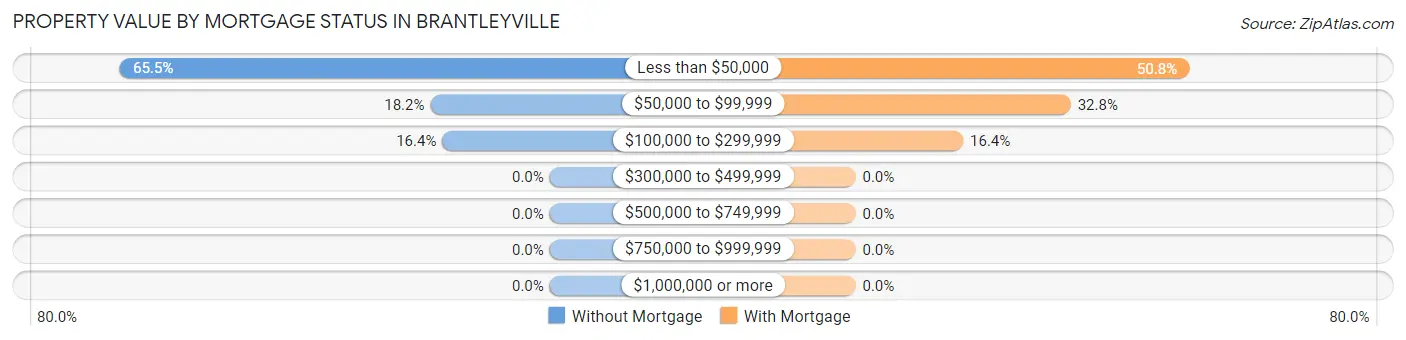
| Property Value | Without Mortgage | With Mortgage |
| Less than $50,000 | 72 (65.4%) | 62 (50.8%) |
| $50,000 to $99,999 | 20 (18.2%) | 40 (32.8%) |
| $100,000 to $299,999 | 18 (16.4%) | 20 (16.4%) |
| $300,000 to $499,999 | 0 (0.0%) | 0 (0.0%) |
| $500,000 to $749,999 | 0 (0.0%) | 0 (0.0%) |
| $750,000 to $999,999 | 0 (0.0%) | 0 (0.0%) |
| $1,000,000 or more | 0 (0.0%) | 0 (0.0%) |
| Total | 110 (100.0%) | 122 (100.0%) |
Household Income by Mortgage Status in Brantleyville
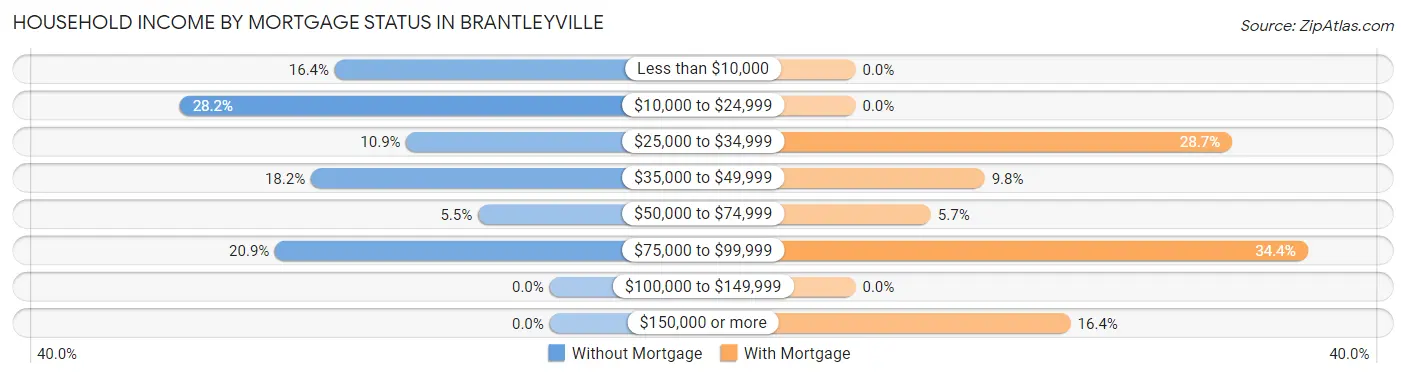
| Household Income | Without Mortgage | With Mortgage |
| Less than $10,000 | 18 (16.4%) | 0 (0.0%) |
| $10,000 to $24,999 | 31 (28.2%) | 0 (0.0%) |
| $25,000 to $34,999 | 12 (10.9%) | 35 (28.7%) |
| $35,000 to $49,999 | 20 (18.2%) | 12 (9.8%) |
| $50,000 to $74,999 | 6 (5.4%) | 7 (5.7%) |
| $75,000 to $99,999 | 23 (20.9%) | 42 (34.4%) |
| $100,000 to $149,999 | 0 (0.0%) | 0 (0.0%) |
| $150,000 or more | 0 (0.0%) | 20 (16.4%) |
| Total | 110 (100.0%) | 122 (100.0%) |
Property Value to Household Income Ratio in Brantleyville
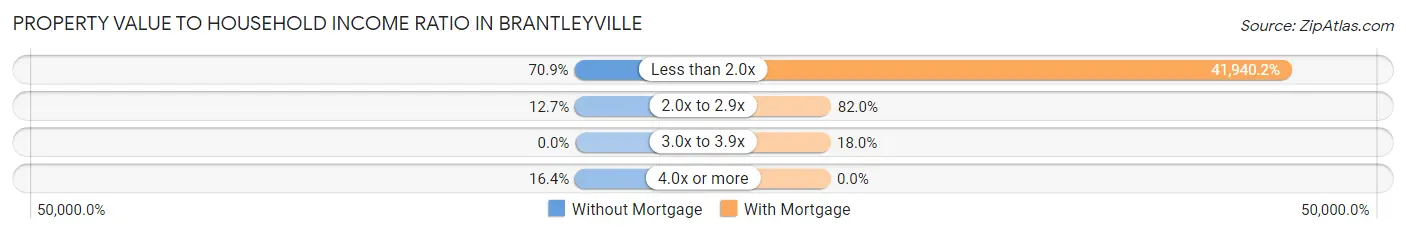
| Value-to-Income Ratio | Without Mortgage | With Mortgage |
| Less than 2.0x | 78 (70.9%) | 51,167 (41,940.2%) |
| 2.0x to 2.9x | 14 (12.7%) | 100 (82.0%) |
| 3.0x to 3.9x | 0 (0.0%) | 22 (18.0%) |
| 4.0x or more | 18 (16.4%) | 0 (0.0%) |
| Total | 110 (100.0%) | 122 (100.0%) |
Real Estate Taxes by Mortgage Status in Brantleyville
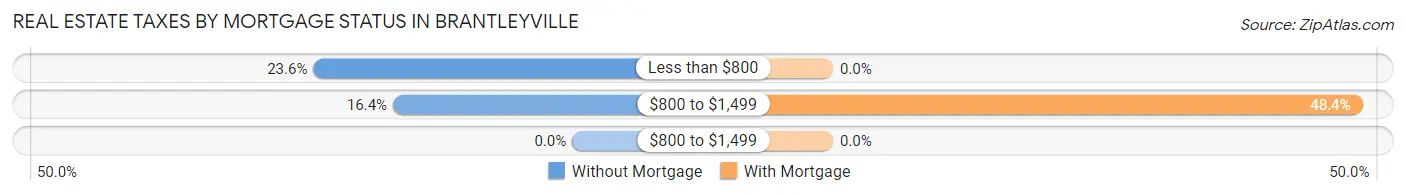
| Property Taxes | Without Mortgage | With Mortgage |
| Less than $800 | 26 (23.6%) | 0 (0.0%) |
| $800 to $1,499 | 18 (16.4%) | 59 (48.4%) |
| $800 to $1,499 | 0 (0.0%) | 0 (0.0%) |
| Total | 110 (100.0%) | 122 (100.0%) |
Health & Disability in Brantleyville
Health Insurance Coverage by Age in Brantleyville
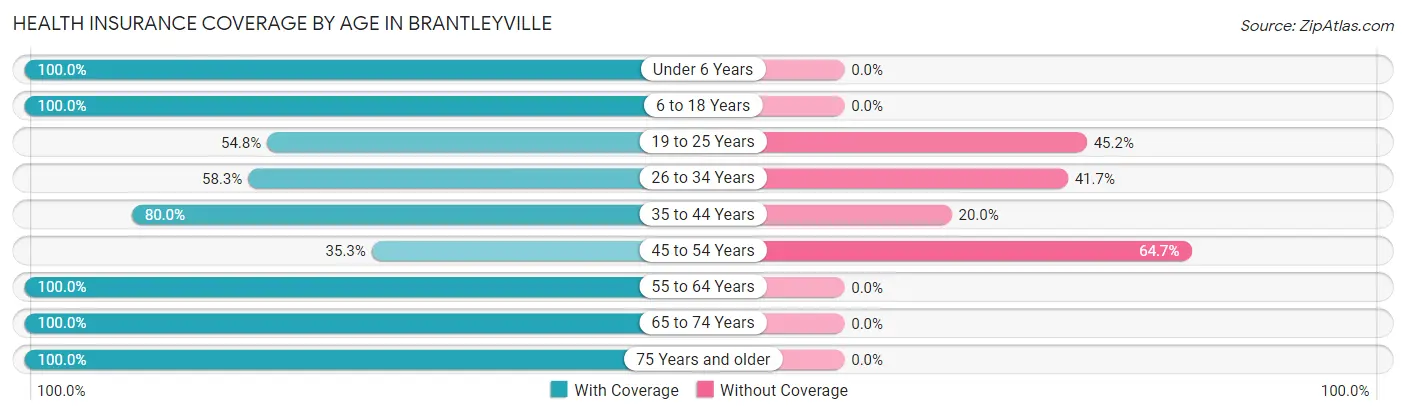
| Age Bracket | With Coverage | Without Coverage |
| Under 6 Years | 13 (100.0%) | 0 (0.0%) |
| 6 to 18 Years | 167 (100.0%) | 0 (0.0%) |
| 19 to 25 Years | 40 (54.8%) | 33 (45.2%) |
| 26 to 34 Years | 70 (58.3%) | 50 (41.7%) |
| 35 to 44 Years | 60 (80.0%) | 15 (20.0%) |
| 45 to 54 Years | 18 (35.3%) | 33 (64.7%) |
| 55 to 64 Years | 85 (100.0%) | 0 (0.0%) |
| 65 to 74 Years | 59 (100.0%) | 0 (0.0%) |
| 75 Years and older | 73 (100.0%) | 0 (0.0%) |
| Total | 585 (81.7%) | 131 (18.3%) |
Health Insurance Coverage by Citizenship Status in Brantleyville
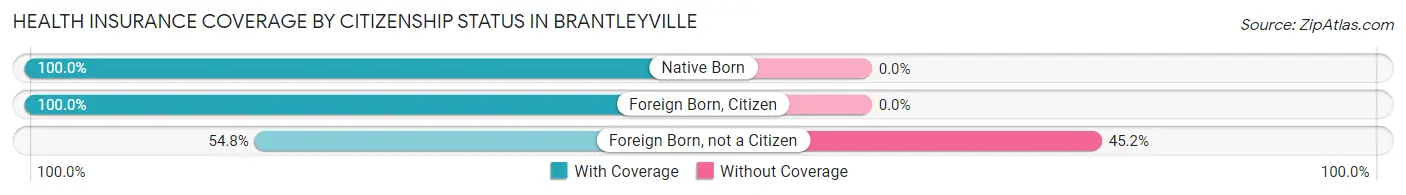
| Citizenship Status | With Coverage | Without Coverage |
| Native Born | 13 (100.0%) | 0 (0.0%) |
| Foreign Born, Citizen | 167 (100.0%) | 0 (0.0%) |
| Foreign Born, not a Citizen | 40 (54.8%) | 33 (45.2%) |
Health Insurance Coverage by Household Income in Brantleyville
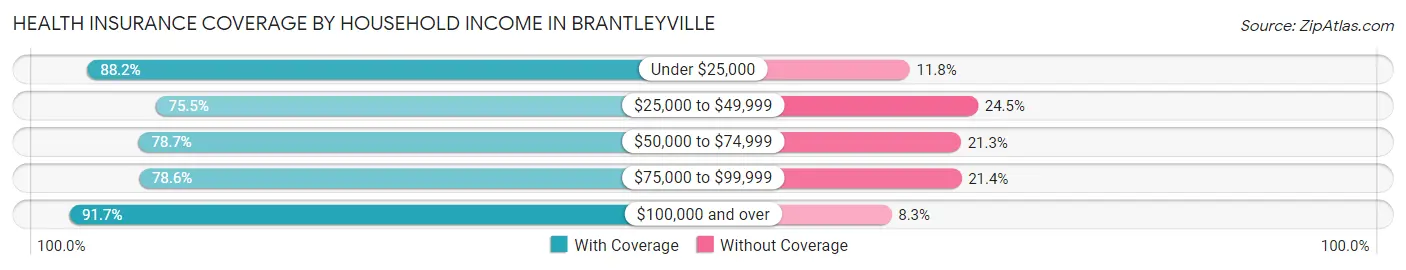
| Household Income | With Coverage | Without Coverage |
| Under $25,000 | 135 (88.2%) | 18 (11.8%) |
| $25,000 to $49,999 | 123 (75.5%) | 40 (24.5%) |
| $50,000 to $74,999 | 129 (78.7%) | 35 (21.3%) |
| $75,000 to $99,999 | 110 (78.6%) | 30 (21.4%) |
| $100,000 and over | 88 (91.7%) | 8 (8.3%) |
Public vs Private Health Insurance Coverage by Age in Brantleyville
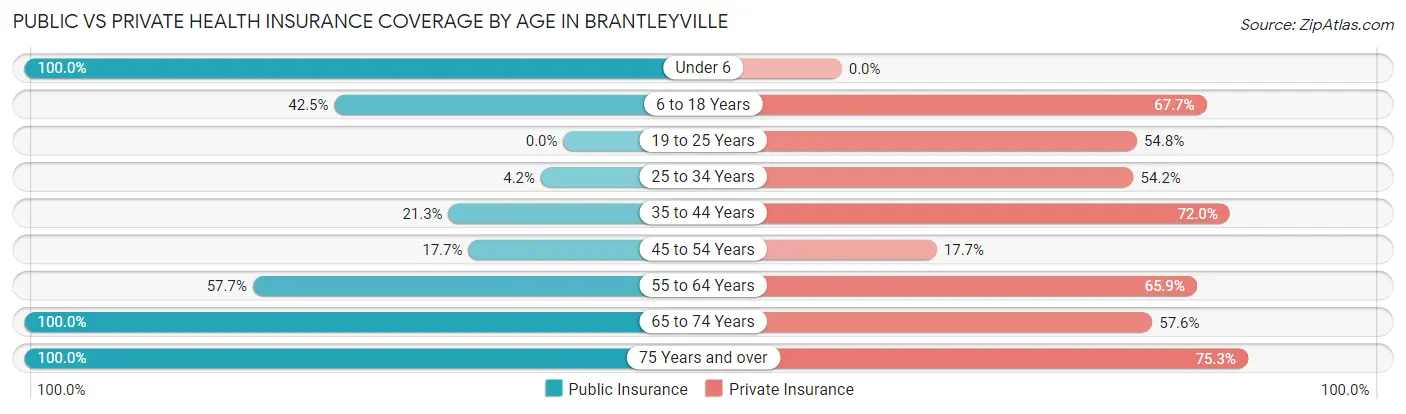
| Age Bracket | Public Insurance | Private Insurance |
| Under 6 | 13 (100.0%) | 0 (0.0%) |
| 6 to 18 Years | 71 (42.5%) | 113 (67.7%) |
| 19 to 25 Years | 0 (0.0%) | 40 (54.8%) |
| 25 to 34 Years | 5 (4.2%) | 65 (54.2%) |
| 35 to 44 Years | 16 (21.3%) | 54 (72.0%) |
| 45 to 54 Years | 9 (17.6%) | 9 (17.6%) |
| 55 to 64 Years | 49 (57.7%) | 56 (65.9%) |
| 65 to 74 Years | 59 (100.0%) | 34 (57.6%) |
| 75 Years and over | 73 (100.0%) | 55 (75.3%) |
| Total | 295 (41.2%) | 426 (59.5%) |
Disability Status by Sex by Age in Brantleyville
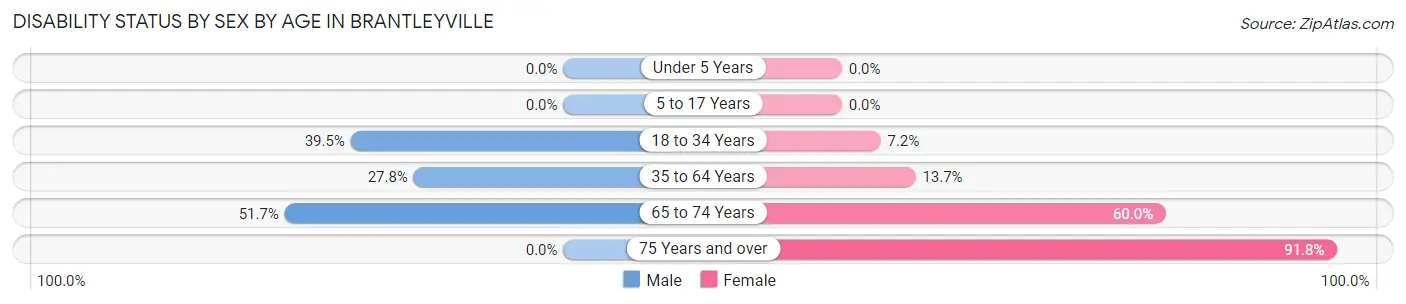
| Age Bracket | Male | Female |
| Under 5 Years | 0 (0.0%) | 0 (0.0%) |
| 5 to 17 Years | 0 (0.0%) | 0 (0.0%) |
| 18 to 34 Years | 30 (39.5%) | 10 (7.2%) |
| 35 to 64 Years | 20 (27.8%) | 19 (13.7%) |
| 65 to 74 Years | 15 (51.7%) | 18 (60.0%) |
| 75 Years and over | 0 (0.0%) | 67 (91.8%) |
Disability Class by Sex by Age in Brantleyville
Disability Class: Hearing Difficulty
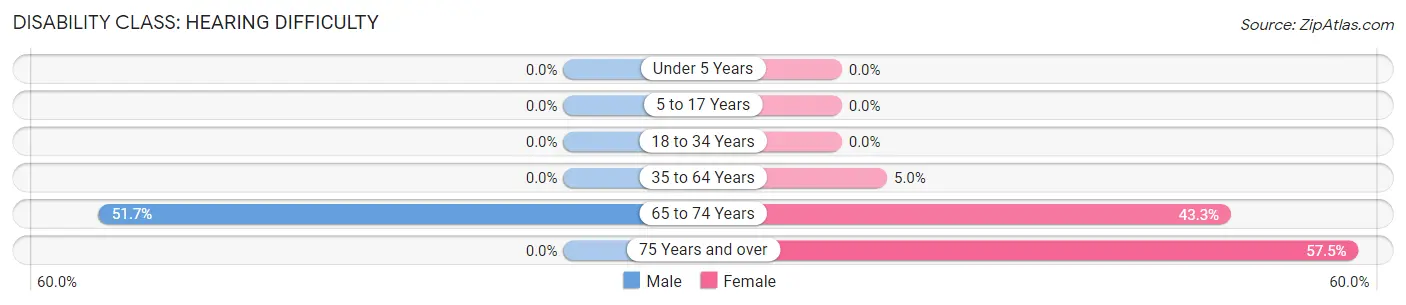
| Age Bracket | Male | Female |
| Under 5 Years | 0 (0.0%) | 0 (0.0%) |
| 5 to 17 Years | 0 (0.0%) | 0 (0.0%) |
| 18 to 34 Years | 0 (0.0%) | 0 (0.0%) |
| 35 to 64 Years | 0 (0.0%) | 7 (5.0%) |
| 65 to 74 Years | 15 (51.7%) | 13 (43.3%) |
| 75 Years and over | 0 (0.0%) | 42 (57.5%) |
Disability Class: Vision Difficulty
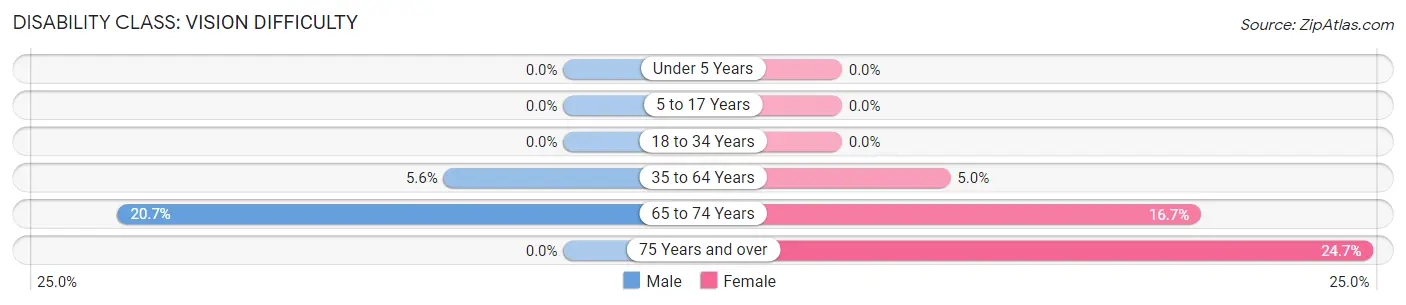
| Age Bracket | Male | Female |
| Under 5 Years | 0 (0.0%) | 0 (0.0%) |
| 5 to 17 Years | 0 (0.0%) | 0 (0.0%) |
| 18 to 34 Years | 0 (0.0%) | 0 (0.0%) |
| 35 to 64 Years | 4 (5.6%) | 7 (5.0%) |
| 65 to 74 Years | 6 (20.7%) | 5 (16.7%) |
| 75 Years and over | 0 (0.0%) | 18 (24.7%) |
Disability Class: Cognitive Difficulty
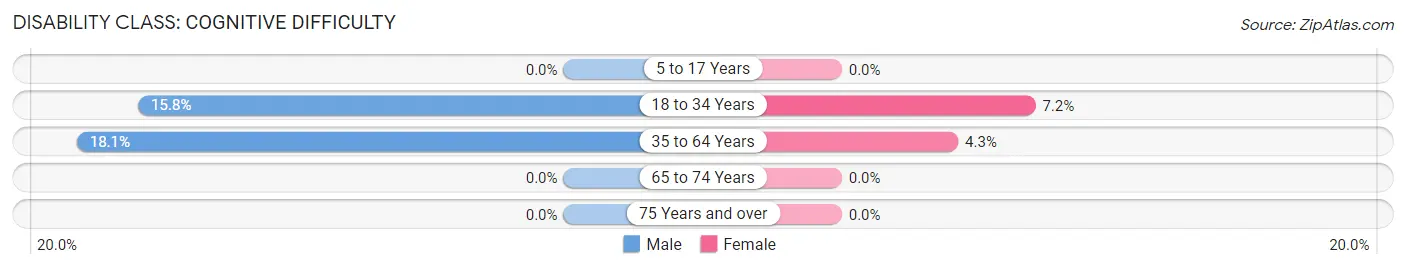
| Age Bracket | Male | Female |
| 5 to 17 Years | 0 (0.0%) | 0 (0.0%) |
| 18 to 34 Years | 12 (15.8%) | 10 (7.2%) |
| 35 to 64 Years | 13 (18.1%) | 6 (4.3%) |
| 65 to 74 Years | 0 (0.0%) | 0 (0.0%) |
| 75 Years and over | 0 (0.0%) | 0 (0.0%) |
Disability Class: Ambulatory Difficulty
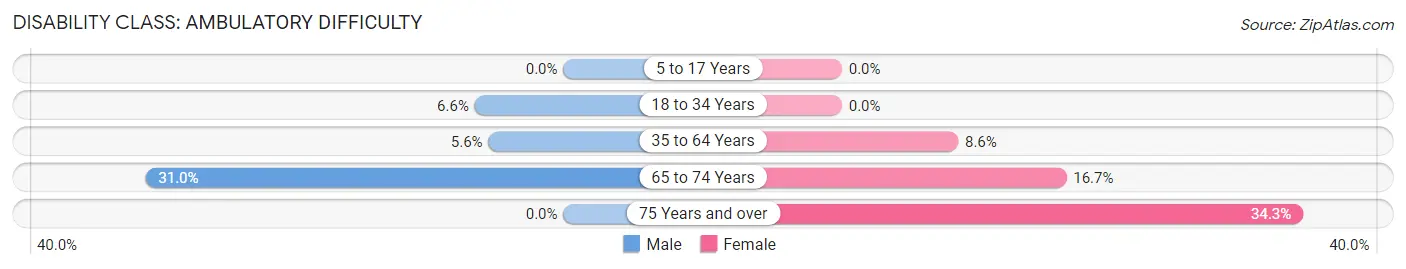
| Age Bracket | Male | Female |
| 5 to 17 Years | 0 (0.0%) | 0 (0.0%) |
| 18 to 34 Years | 5 (6.6%) | 0 (0.0%) |
| 35 to 64 Years | 4 (5.6%) | 12 (8.6%) |
| 65 to 74 Years | 9 (31.0%) | 5 (16.7%) |
| 75 Years and over | 0 (0.0%) | 25 (34.3%) |
Disability Class: Self-Care Difficulty
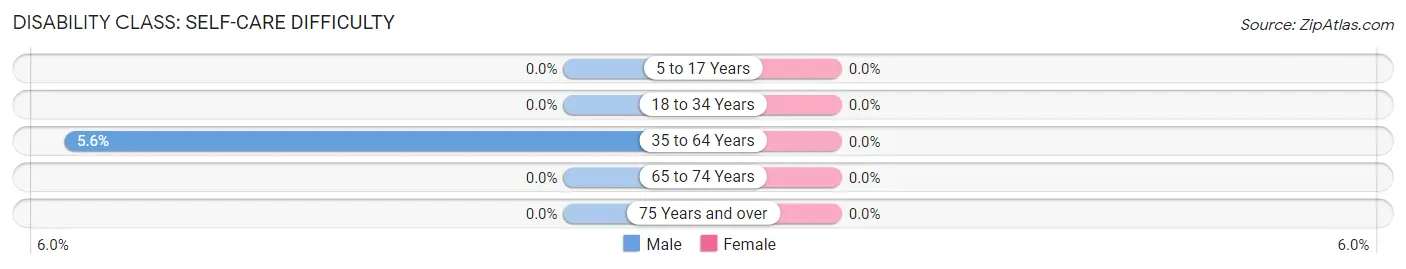
| Age Bracket | Male | Female |
| 5 to 17 Years | 0 (0.0%) | 0 (0.0%) |
| 18 to 34 Years | 0 (0.0%) | 0 (0.0%) |
| 35 to 64 Years | 4 (5.6%) | 0 (0.0%) |
| 65 to 74 Years | 0 (0.0%) | 0 (0.0%) |
| 75 Years and over | 0 (0.0%) | 0 (0.0%) |
Technology Access in Brantleyville
Computing Device Access in Brantleyville
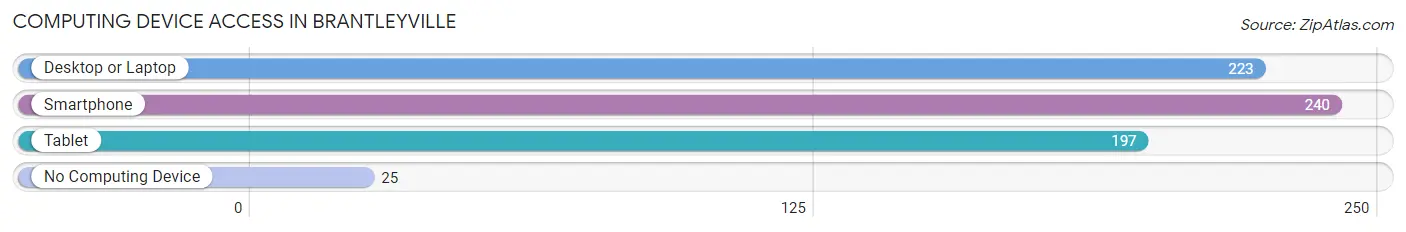
| Device Type | # Households | % Households |
| Desktop or Laptop | 223 | 70.6% |
| Smartphone | 240 | 75.9% |
| Tablet | 197 | 62.3% |
| No Computing Device | 25 | 7.9% |
| Total | 316 | 100.0% |
Internet Access in Brantleyville
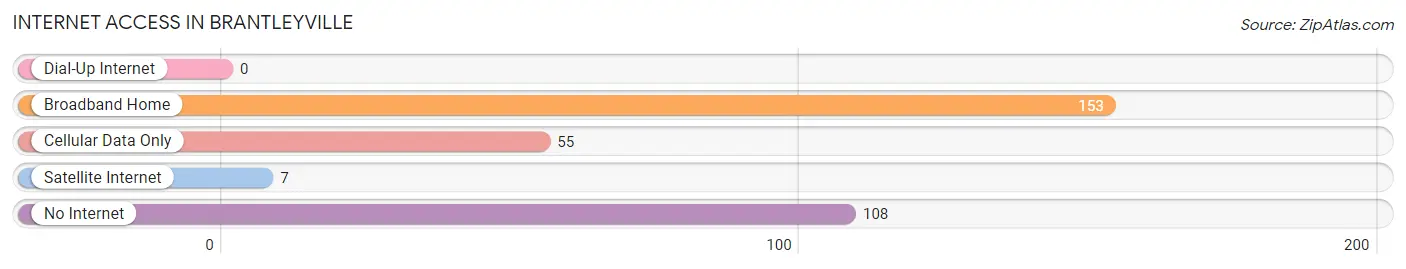
| Internet Type | # Households | % Households |
| Dial-Up Internet | 0 | 0.0% |
| Broadband Home | 153 | 48.4% |
| Cellular Data Only | 55 | 17.4% |
| Satellite Internet | 7 | 2.2% |
| No Internet | 108 | 34.2% |
| Total | 316 | 100.0% |
Brantleyville Summary
Brantleyville is a small town located in the state of Alabama, in the United States of America. It is situated in the northwest corner of the state, in the foothills of the Appalachian Mountains. The town is located in the county of Blount, and is part of the Birmingham-Hoover Metropolitan Statistical Area.
History
Brantleyville was founded in 1820 by a group of settlers from North Carolina. The town was named after the Brantley family, who were among the first settlers. The town was originally a farming community, and the main crops grown were cotton, corn, and tobacco. The town grew slowly over the years, and by the late 19th century, it had become a small but prosperous community.
In the early 20th century, the town began to experience a period of growth and development. The railroad arrived in the town in the 1920s, and this helped to spur economic growth. The town also became a popular tourist destination, as it was located near several popular attractions, such as the Little River Canyon National Preserve and the DeSoto State Park.
Geography
Brantleyville is located in the northwest corner of Alabama, in the foothills of the Appalachian Mountains. The town is situated in the county of Blount, and is part of the Birmingham-Hoover Metropolitan Statistical Area. The town is located at an elevation of 890 feet above sea level.
The town is located in a hilly region, and the terrain is mostly forested. The town is located near several rivers, including the Little River, the Locust Fork, and the Mulberry Fork. The town is also located near several lakes, including the Lake Guntersville, the Lake Tuscaloosa, and the Lake Wheeler.
Economy
The economy of Brantleyville is largely based on agriculture and tourism. The town is home to several farms, which produce a variety of crops, including cotton, corn, and tobacco. The town is also home to several tourist attractions, such as the Little River Canyon National Preserve and the DeSoto State Park.
The town is also home to several small businesses, including restaurants, shops, and other services. The town is also home to several manufacturing companies, which produce a variety of products, including furniture, clothing, and electronics.
Demographics
As of the 2010 census, the population of Brantleyville was 1,845. The town has a population density of 545 people per square mile. The median age of the population is 44.7 years, and the median household income is $37,941.
The town is predominantly white, with a population that is 97.3% white. The town also has a small African American population, which makes up 1.3% of the population. The town also has a small Hispanic population, which makes up 0.7% of the population.
Conclusion
Brantleyville is a small town located in the northwest corner of Alabama, in the foothills of the Appalachian Mountains. The town was founded in 1820 by a group of settlers from North Carolina, and it has since grown into a small but prosperous community. The town is largely based on agriculture and tourism, and it is home to several farms, tourist attractions, and small businesses. The population of Brantleyville is predominantly white, with a small African American and Hispanic population.
Common Questions
What is Per Capita Income in Brantleyville?
Per Capita income in Brantleyville is $21,717.
What is the Median Family Income in Brantleyville?
Median Family Income in Brantleyville is $59,722.
What is the Median Household income in Brantleyville?
Median Household Income in Brantleyville is $37,857.
What is Inequality or Gini Index in Brantleyville?
Inequality or Gini Index in Brantleyville is 0.40.
What is the Total Population of Brantleyville?
Total Population of Brantleyville is 716.
What is the Total Male Population of Brantleyville?
Total Male Population of Brantleyville is 228.
What is the Total Female Population of Brantleyville?
Total Female Population of Brantleyville is 488.
What is the Ratio of Males per 100 Females in Brantleyville?
There are 46.72 Males per 100 Females in Brantleyville.
What is the Ratio of Females per 100 Males in Brantleyville?
There are 214.04 Females per 100 Males in Brantleyville.
What is the Median Population Age in Brantleyville?
Median Population Age in Brantleyville is 34.7 Years.
What is the Average Family Size in Brantleyville
Average Family Size in Brantleyville is 3.0 People.
What is the Average Household Size in Brantleyville
Average Household Size in Brantleyville is 2.3 People.
How Large is the Labor Force in Brantleyville?
There are 317 People in the Labor Forcein in Brantleyville.
What is the Percentage of People in the Labor Force in Brantleyville?
55.9% of People are in the Labor Force in Brantleyville.
What is the Unemployment Rate in Brantleyville?
Unemployment Rate in Brantleyville is 12.6%.