Enterprise, AL Map & Demographics
Enterprise Map
Enterprise Overview
$31,358
PER CAPITA INCOME
$75,106
AVG FAMILY INCOME
$64,888
AVG HOUSEHOLD INCOME
52.8%
WAGE / INCOME GAP [ % ]
47.2¢/ $1
WAGE / INCOME GAP [ $ ]
$10,331
FAMILY INCOME DEFICIT
0.42
INEQUALITY / GINI INDEX
28,513
TOTAL POPULATION
14,048
MALE POPULATION
14,465
FEMALE POPULATION
97.12
MALES / 100 FEMALES
102.97
FEMALES / 100 MALES
36.0
MEDIAN AGE
3.2
AVG FAMILY SIZE
2.6
AVG HOUSEHOLD SIZE
12,782
LABOR FORCE [ PEOPLE ]
58.0%
PERCENT IN LABOR FORCE
4.1%
UNEMPLOYMENT RATE
Enterprise Zip Codes
Enterprise Area Codes
Income in Enterprise
Income Overview in Enterprise
Per Capita Income in Enterprise is $31,358, while median incomes of families and households are $75,106 and $64,888 respectively.
| Characteristic | Number | Measure |
| Per Capita Income | 28,513 | $31,358 |
| Median Family Income | 7,224 | $75,106 |
| Mean Family Income | 7,224 | $88,471 |
| Median Household Income | 10,898 | $64,888 |
| Mean Household Income | 10,898 | $78,651 |
| Income Deficit | 7,224 | $10,331 |
| Wage / Income Gap (%) | 28,513 | 52.79% |
| Wage / Income Gap ($) | 28,513 | 47.21¢ per $1 |
| Gini / Inequality Index | 28,513 | 0.42 |
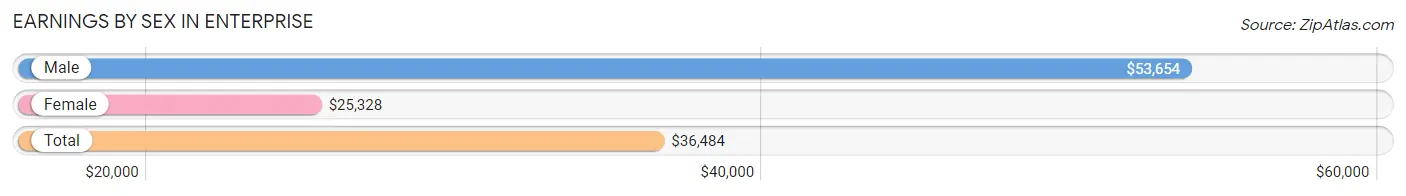
Earnings by Sex in Enterprise
Average Earnings in Enterprise are $36,484, $53,654 for men and $25,328 for women, a difference of 52.8%.
| Sex | Number | Average Earnings |
| Male | 7,336 (54.0%) | $53,654 |
| Female | 6,240 (46.0%) | $25,328 |
| Total | 13,576 (100.0%) | $36,484 |
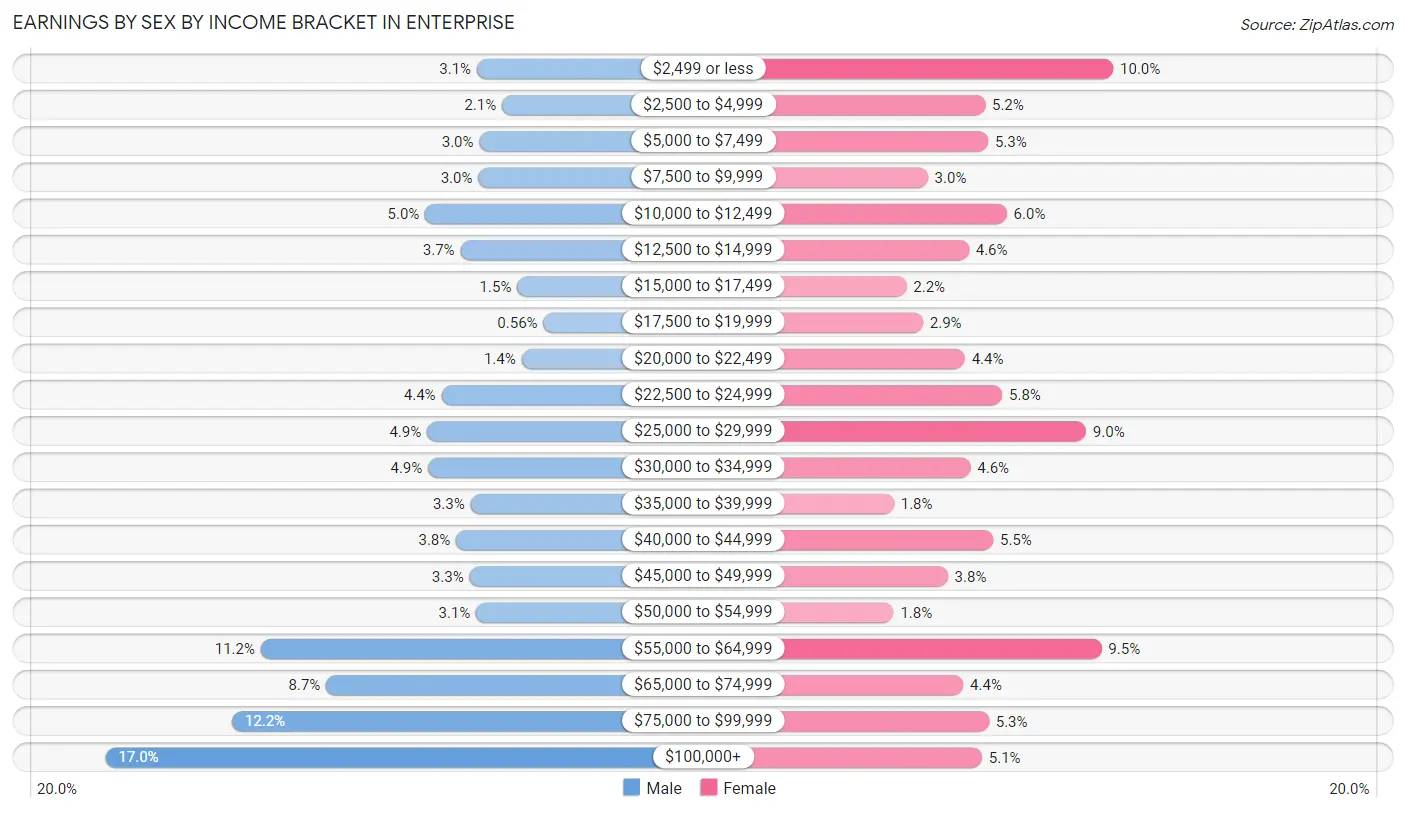
Earnings by Sex by Income Bracket in Enterprise
The most common earnings brackets in Enterprise are $100,000+ for men (1,245 | 17.0%) and $2,499 or less for women (623 | 10.0%).
| Income | Male | Female |
| $2,499 or less | 224 (3.0%) | 623 (10.0%) |
| $2,500 to $4,999 | 155 (2.1%) | 323 (5.2%) |
| $5,000 to $7,499 | 217 (3.0%) | 330 (5.3%) |
| $7,500 to $9,999 | 220 (3.0%) | 189 (3.0%) |
| $10,000 to $12,499 | 366 (5.0%) | 374 (6.0%) |
| $12,500 to $14,999 | 269 (3.7%) | 285 (4.6%) |
| $15,000 to $17,499 | 113 (1.5%) | 139 (2.2%) |
| $17,500 to $19,999 | 41 (0.6%) | 178 (2.9%) |
| $20,000 to $22,499 | 101 (1.4%) | 276 (4.4%) |
| $22,500 to $24,999 | 321 (4.4%) | 363 (5.8%) |
| $25,000 to $29,999 | 361 (4.9%) | 559 (9.0%) |
| $30,000 to $34,999 | 358 (4.9%) | 289 (4.6%) |
| $35,000 to $39,999 | 241 (3.3%) | 110 (1.8%) |
| $40,000 to $44,999 | 281 (3.8%) | 342 (5.5%) |
| $45,000 to $49,999 | 244 (3.3%) | 236 (3.8%) |
| $50,000 to $54,999 | 226 (3.1%) | 109 (1.8%) |
| $55,000 to $64,999 | 818 (11.2%) | 595 (9.5%) |
| $65,000 to $74,999 | 638 (8.7%) | 272 (4.4%) |
| $75,000 to $99,999 | 897 (12.2%) | 332 (5.3%) |
| $100,000+ | 1,245 (17.0%) | 316 (5.1%) |
| Total | 7,336 (100.0%) | 6,240 (100.0%) |
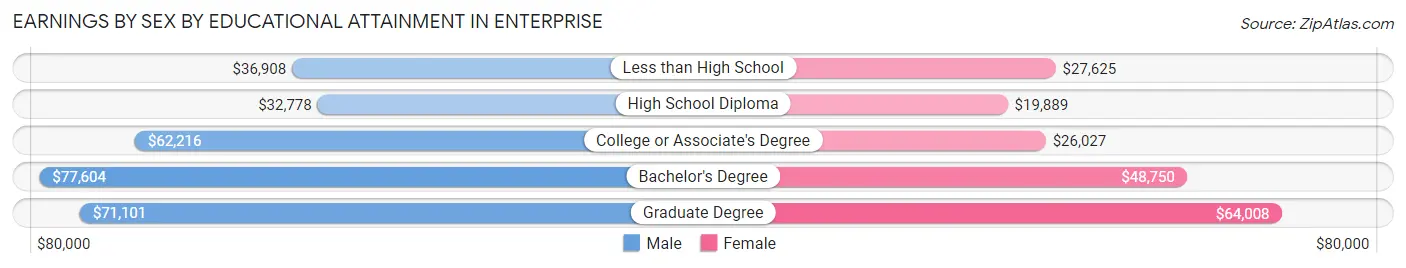
Earnings by Sex by Educational Attainment in Enterprise
Average earnings in Enterprise are $59,200 for men and $28,992 for women, a difference of 51.0%. Men with an educational attainment of bachelor's degree enjoy the highest average annual earnings of $77,604, while those with high school diploma education earn the least with $32,778. Women with an educational attainment of graduate degree earn the most with the average annual earnings of $64,008, while those with high school diploma education have the smallest earnings of $19,889.
| Educational Attainment | Male Income | Female Income |
| Less than High School | $36,908 | $27,625 |
| High School Diploma | $32,778 | $19,889 |
| College or Associate's Degree | $62,216 | $26,027 |
| Bachelor's Degree | $77,604 | $48,750 |
| Graduate Degree | $71,101 | $64,008 |
| Total | $59,200 | $28,992 |
Family Income in Enterprise
Family Income Brackets in Enterprise
According to the Enterprise family income data, there are 1,553 families falling into the $100,000 to $149,999 income range, which is the most common income bracket and makes up 21.5% of all families. Conversely, the less than $10,000 income bracket is the least frequent group with only 289 families (4.0%) belonging to this category.
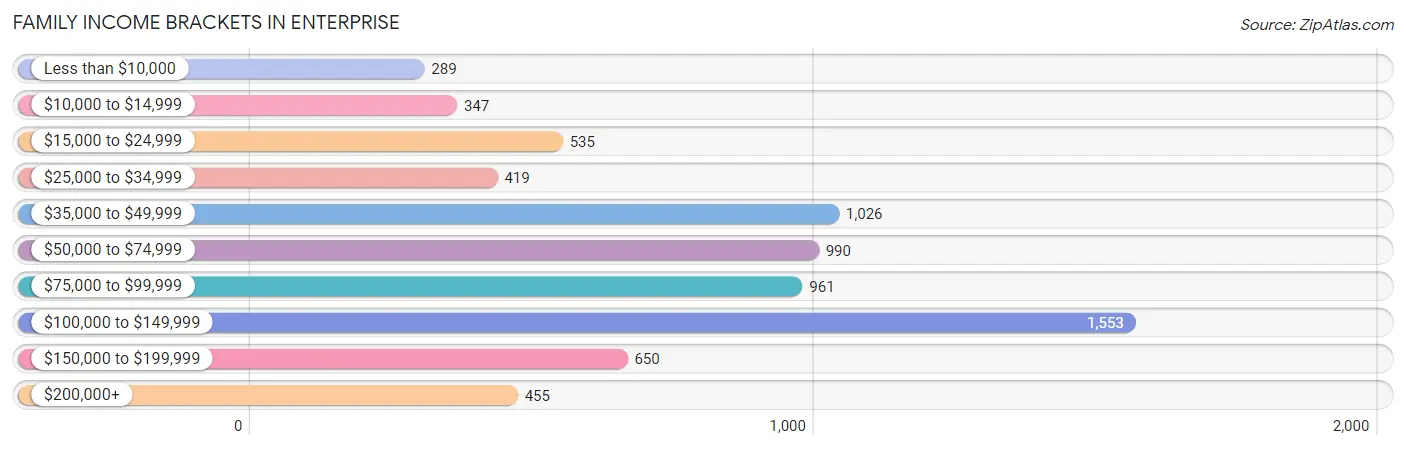
| Income Bracket | # Families | % Families |
| Less than $10,000 | 289 | 4.0% |
| $10,000 to $14,999 | 347 | 4.8% |
| $15,000 to $24,999 | 535 | 7.4% |
| $25,000 to $34,999 | 419 | 5.8% |
| $35,000 to $49,999 | 1,026 | 14.2% |
| $50,000 to $74,999 | 990 | 13.7% |
| $75,000 to $99,999 | 961 | 13.3% |
| $100,000 to $149,999 | 1,553 | 21.5% |
| $150,000 to $199,999 | 650 | 9.0% |
| $200,000+ | 455 | 6.3% |
Family Income by Famaliy Size in Enterprise
7+ person families (105 | 1.5%) account for the highest median family income in Enterprise with $168,304 per family, while 2-person families (3,552 | 49.2%) have the highest median income of $32,648 per family member.
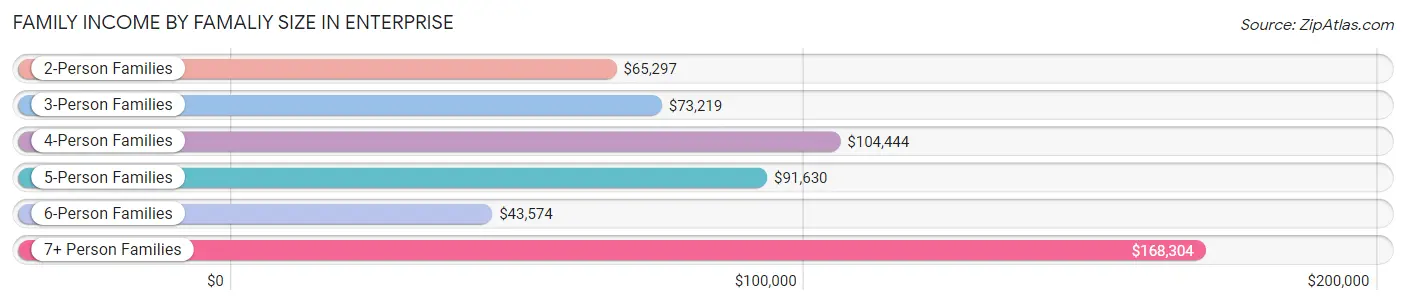
| Income Bracket | # Families | Median Income |
| 2-Person Families | 3,552 (49.2%) | $65,297 |
| 3-Person Families | 1,692 (23.4%) | $73,219 |
| 4-Person Families | 1,228 (17.0%) | $104,444 |
| 5-Person Families | 342 (4.7%) | $91,630 |
| 6-Person Families | 305 (4.2%) | $43,574 |
| 7+ Person Families | 105 (1.5%) | $168,304 |
| Total | 7,224 (100.0%) | $75,106 |
Family Income by Number of Earners in Enterprise
The median family income in Enterprise is $75,106, with families comprising 2 earners (2,867) having the highest median family income of $111,875, while families with no earners (1,244) have the lowest median family income of $45,822, accounting for 39.7% and 17.2% of families, respectively.
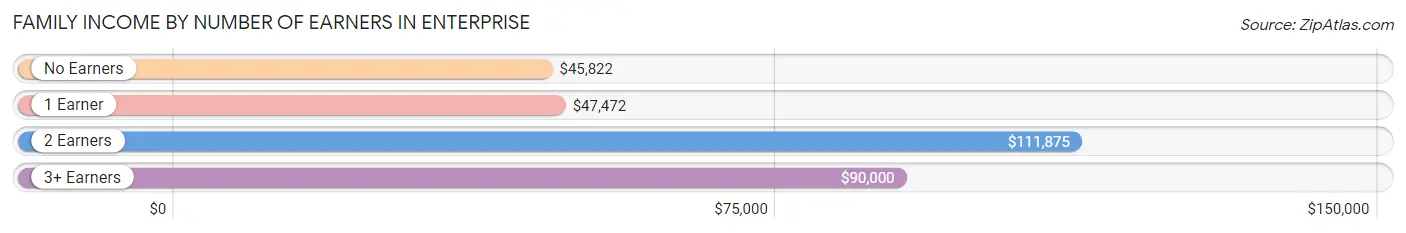
| Number of Earners | # Families | Median Income |
| No Earners | 1,244 (17.2%) | $45,822 |
| 1 Earner | 2,729 (37.8%) | $47,472 |
| 2 Earners | 2,867 (39.7%) | $111,875 |
| 3+ Earners | 384 (5.3%) | $90,000 |
| Total | 7,224 (100.0%) | $75,106 |
Household Income in Enterprise
Household Income Brackets in Enterprise
With 2,082 households falling in the category, the $100,000 to $149,999 income range is the most frequent in Enterprise, accounting for 19.1% of all households. In contrast, only 469 households (4.3%) fall into the $200,000+ income bracket, making it the least populous group.
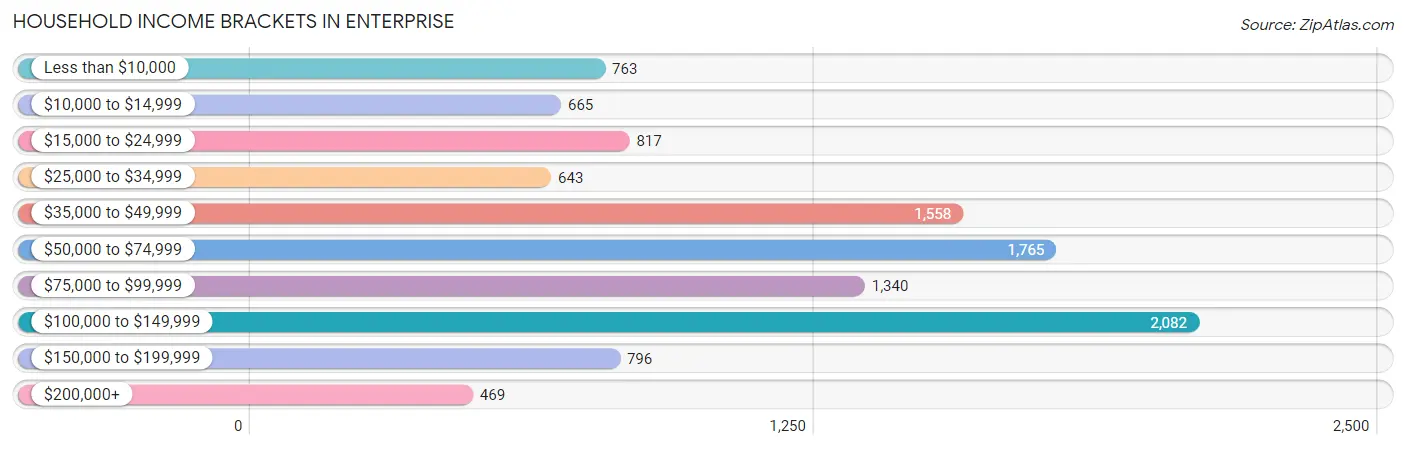
| Income Bracket | # Households | % Households |
| Less than $10,000 | 763 | 7.0% |
| $10,000 to $14,999 | 665 | 6.1% |
| $15,000 to $24,999 | 817 | 7.5% |
| $25,000 to $34,999 | 643 | 5.9% |
| $35,000 to $49,999 | 1,558 | 14.3% |
| $50,000 to $74,999 | 1,765 | 16.2% |
| $75,000 to $99,999 | 1,340 | 12.3% |
| $100,000 to $149,999 | 2,082 | 19.1% |
| $150,000 to $199,999 | 796 | 7.3% |
| $200,000+ | 469 | 4.3% |
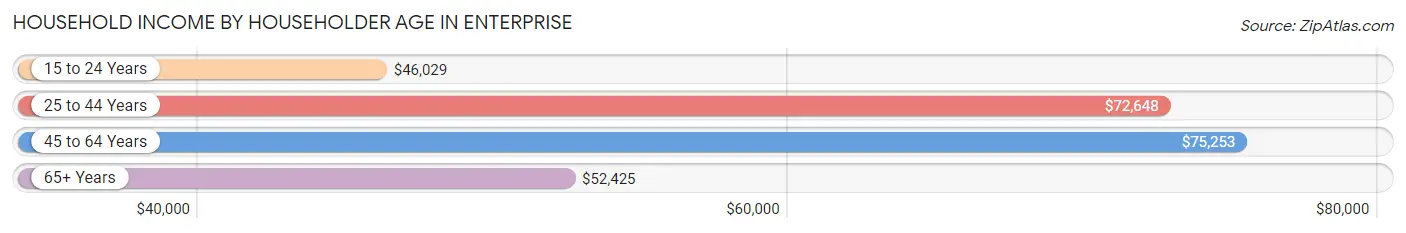
Household Income by Householder Age in Enterprise
The median household income in Enterprise is $64,888, with the highest median household income of $75,253 found in the 45 to 64 years age bracket for the primary householder. A total of 3,762 households (34.5%) fall into this category. Meanwhile, the 15 to 24 years age bracket for the primary householder has the lowest median household income of $46,029, with 516 households (4.7%) in this group.
| Income Bracket | # Households | Median Income |
| 15 to 24 Years | 516 (4.7%) | $46,029 |
| 25 to 44 Years | 4,043 (37.1%) | $72,648 |
| 45 to 64 Years | 3,762 (34.5%) | $75,253 |
| 65+ Years | 2,577 (23.6%) | $52,425 |
| Total | 10,898 (100.0%) | $64,888 |
Poverty in Enterprise
Income Below Poverty by Sex and Age in Enterprise
With 12.7% poverty level for males and 20.4% for females among the residents of Enterprise, 5 year old males and 12 to 14 year old females are the most vulnerable to poverty, with 88 males (74.6%) and 225 females (37.5%) in their respective age groups living below the poverty level.
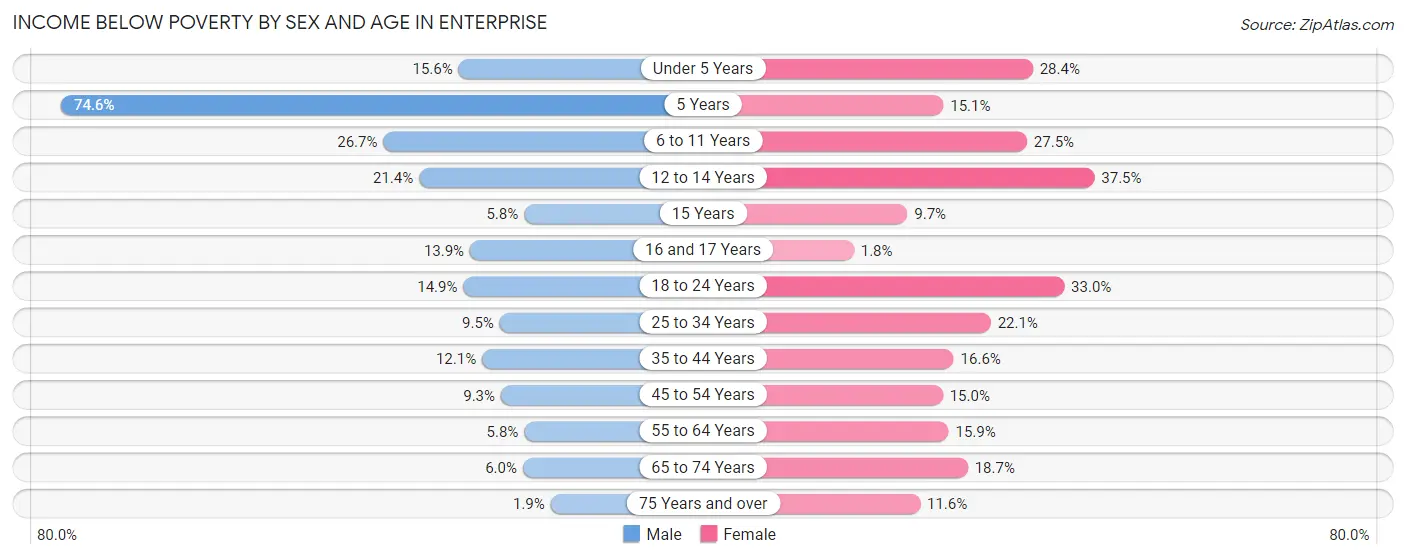
| Age Bracket | Male | Female |
| Under 5 Years | 169 (15.6%) | 262 (28.3%) |
| 5 Years | 88 (74.6%) | 11 (15.1%) |
| 6 to 11 Years | 380 (26.7%) | 350 (27.5%) |
| 12 to 14 Years | 129 (21.4%) | 225 (37.5%) |
| 15 Years | 7 (5.8%) | 18 (9.7%) |
| 16 and 17 Years | 57 (13.9%) | 6 (1.8%) |
| 18 to 24 Years | 198 (14.9%) | 382 (33.0%) |
| 25 to 34 Years | 192 (9.5%) | 421 (22.1%) |
| 35 to 44 Years | 244 (12.1%) | 341 (16.6%) |
| 45 to 54 Years | 124 (9.3%) | 264 (15.0%) |
| 55 to 64 Years | 82 (5.8%) | 270 (15.9%) |
| 65 to 74 Years | 79 (6.0%) | 256 (18.7%) |
| 75 Years and over | 12 (1.9%) | 112 (11.6%) |
| Total | 1,761 (12.7%) | 2,918 (20.4%) |
Income Above Poverty by Sex and Age in Enterprise
According to the poverty statistics in Enterprise, males aged 75 years and over and females aged 16 and 17 years are the age groups that are most secure financially, with 98.1% of males and 98.2% of females in these age groups living above the poverty line.
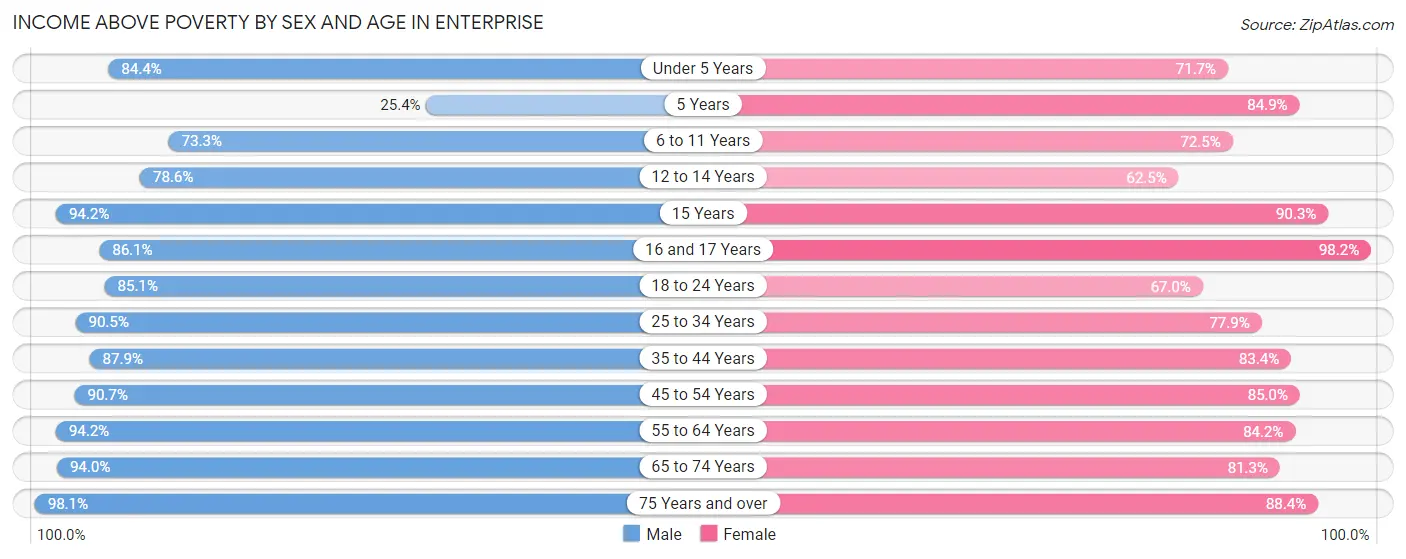
| Age Bracket | Male | Female |
| Under 5 Years | 917 (84.4%) | 662 (71.7%) |
| 5 Years | 30 (25.4%) | 62 (84.9%) |
| 6 to 11 Years | 1,041 (73.3%) | 923 (72.5%) |
| 12 to 14 Years | 473 (78.6%) | 375 (62.5%) |
| 15 Years | 113 (94.2%) | 167 (90.3%) |
| 16 and 17 Years | 354 (86.1%) | 331 (98.2%) |
| 18 to 24 Years | 1,134 (85.1%) | 775 (67.0%) |
| 25 to 34 Years | 1,838 (90.5%) | 1,483 (77.9%) |
| 35 to 44 Years | 1,776 (87.9%) | 1,712 (83.4%) |
| 45 to 54 Years | 1,212 (90.7%) | 1,497 (85.0%) |
| 55 to 64 Years | 1,327 (94.2%) | 1,434 (84.2%) |
| 65 to 74 Years | 1,233 (94.0%) | 1,113 (81.3%) |
| 75 Years and over | 621 (98.1%) | 852 (88.4%) |
| Total | 12,069 (87.3%) | 11,386 (79.6%) |
Income Below Poverty Among Married-Couple Families in Enterprise
The poverty statistics for married-couple families in Enterprise show that 5.0% or 237 of the total 4,763 families live below the poverty line. Families with 3 or 4 children have the highest poverty rate of 26.7%, comprising of 98 families. On the other hand, families with 1 or 2 children have the lowest poverty rate of 0.0%, which includes 0 families.
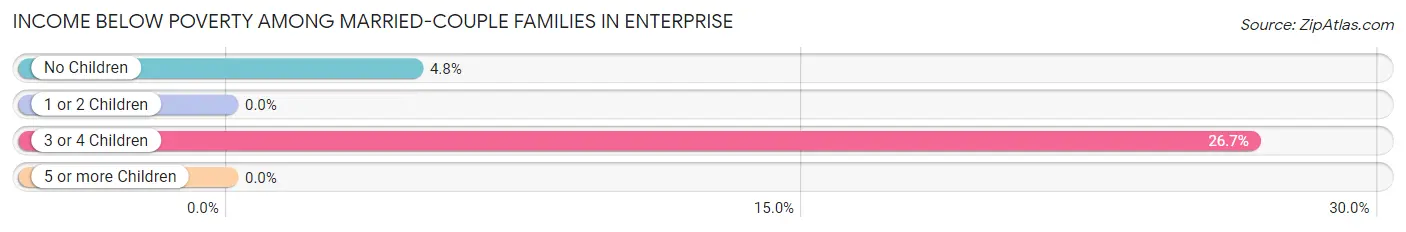
| Children | Above Poverty | Below Poverty |
| No Children | 2,738 (95.2%) | 139 (4.8%) |
| 1 or 2 Children | 1,481 (100.0%) | 0 (0.0%) |
| 3 or 4 Children | 269 (73.3%) | 98 (26.7%) |
| 5 or more Children | 38 (100.0%) | 0 (0.0%) |
| Total | 4,526 (95.0%) | 237 (5.0%) |
Income Below Poverty Among Single-Parent Households in Enterprise
According to the poverty data in Enterprise, 20.8% or 115 single-father households and 29.9% or 571 single-mother households are living below the poverty line. Among single-father households, those with 1 or 2 children have the highest poverty rate, with 110 households (32.2%) experiencing poverty. Likewise, among single-mother households, those with 5 or more children have the highest poverty rate, with 43 households (100.0%) falling below the poverty line.
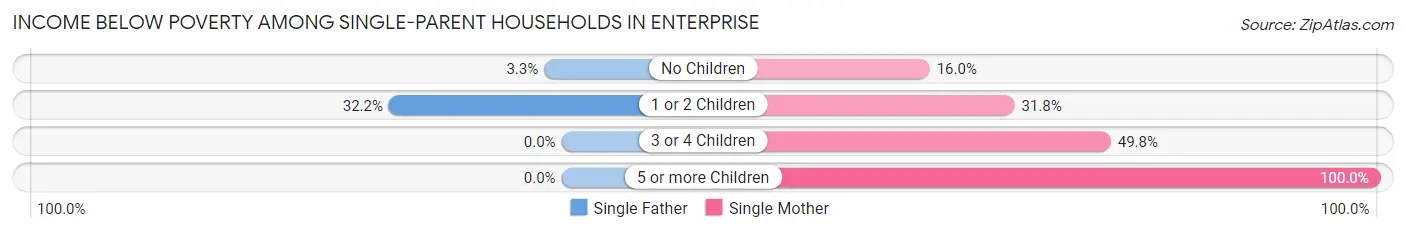
| Children | Single Father | Single Mother |
| No Children | 5 (3.3%) | 105 (16.0%) |
| 1 or 2 Children | 110 (32.2%) | 319 (31.8%) |
| 3 or 4 Children | 0 (0.0%) | 104 (49.8%) |
| 5 or more Children | 0 (0.0%) | 43 (100.0%) |
| Total | 115 (20.8%) | 571 (29.9%) |
Income Below Poverty Among Married-Couple vs Single-Parent Households in Enterprise
The poverty data for Enterprise shows that 237 of the married-couple family households (5.0%) and 686 of the single-parent households (27.9%) are living below the poverty level. Within the married-couple family households, those with 3 or 4 children have the highest poverty rate, with 98 households (26.7%) falling below the poverty line. Among the single-parent households, those with 5 or more children have the highest poverty rate, with 43 household (100.0%) living below poverty.
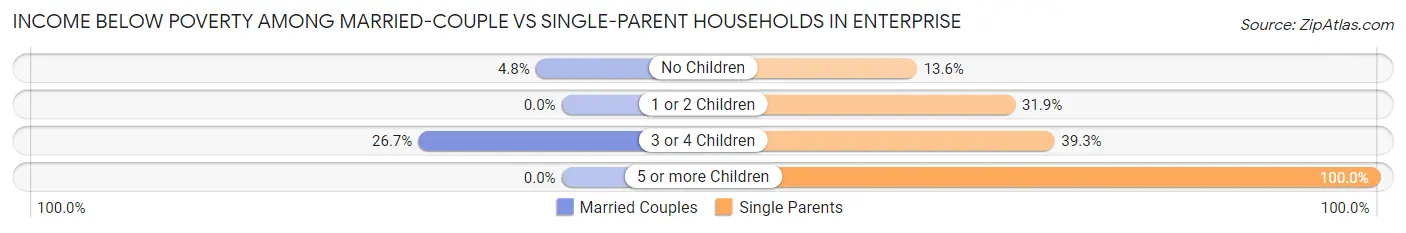
| Children | Married-Couple Families | Single-Parent Households |
| No Children | 139 (4.8%) | 110 (13.6%) |
| 1 or 2 Children | 0 (0.0%) | 429 (31.9%) |
| 3 or 4 Children | 98 (26.7%) | 104 (39.3%) |
| 5 or more Children | 0 (0.0%) | 43 (100.0%) |
| Total | 237 (5.0%) | 686 (27.9%) |
Race in Enterprise
The most populous races in Enterprise are White / Caucasian (18,608 | 65.3%), Black / African American (6,498 | 22.8%), and Hispanic or Latino (2,761 | 9.7%).
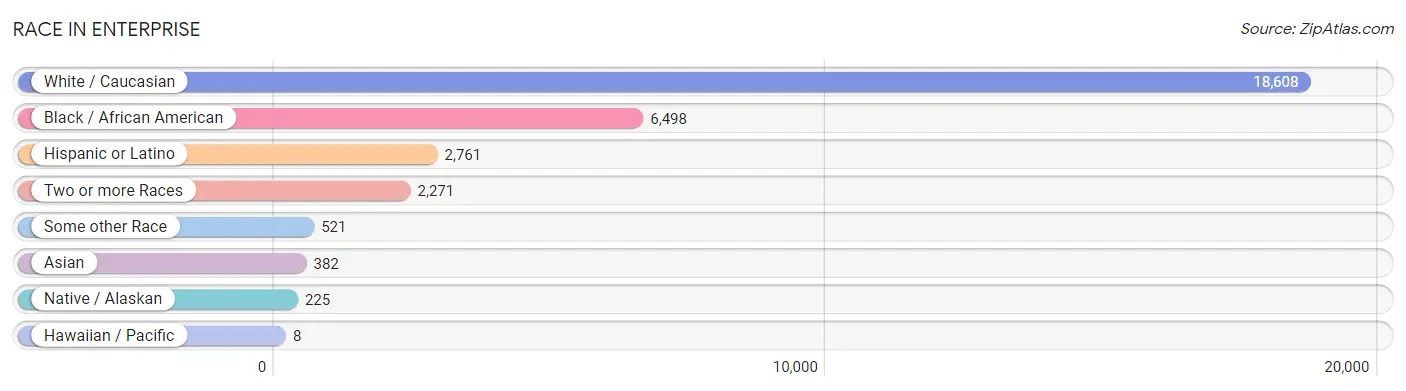
| Race | # Population | % Population |
| Asian | 382 | 1.3% |
| Black / African American | 6,498 | 22.8% |
| Hawaiian / Pacific | 8 | 0.0% |
| Hispanic or Latino | 2,761 | 9.7% |
| Native / Alaskan | 225 | 0.8% |
| White / Caucasian | 18,608 | 65.3% |
| Two or more Races | 2,271 | 8.0% |
| Some other Race | 521 | 1.8% |
| Total | 28,513 | 100.0% |
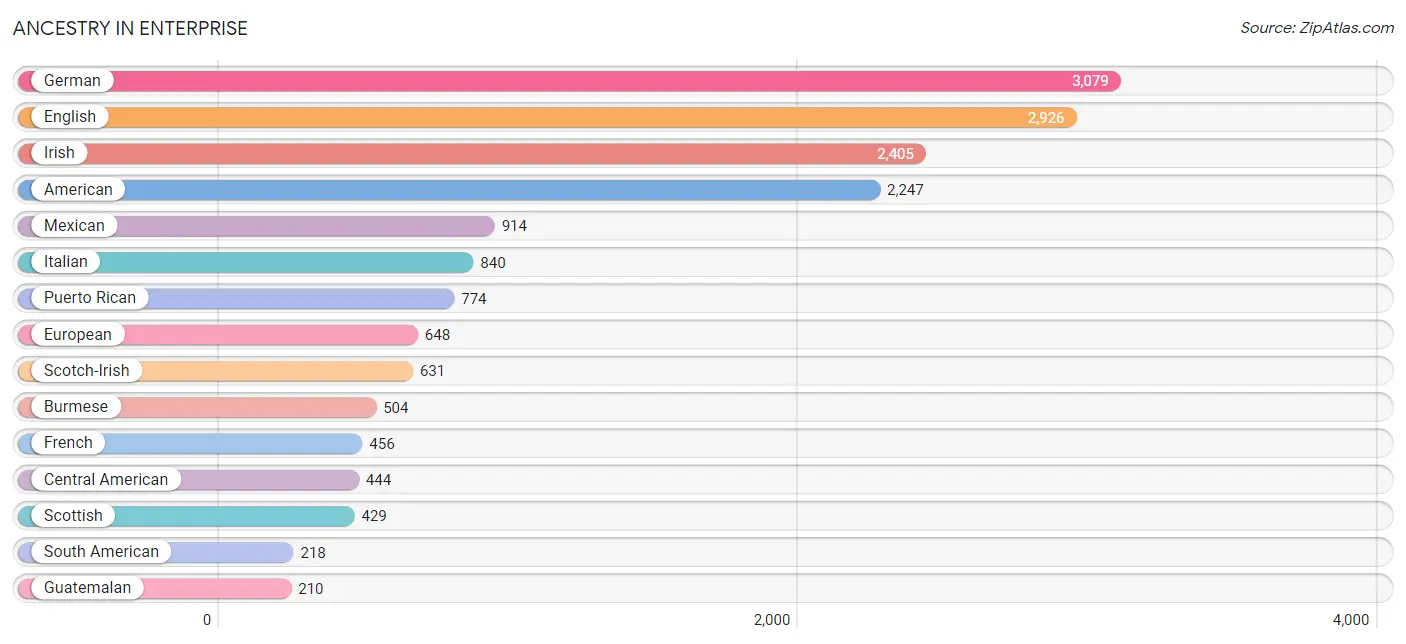
Ancestry in Enterprise
The most populous ancestries reported in Enterprise are German (3,079 | 10.8%), English (2,926 | 10.3%), Irish (2,405 | 8.4%), American (2,247 | 7.9%), and Mexican (914 | 3.2%), together accounting for 40.6% of all Enterprise residents.
| Ancestry | # Population | % Population |
| African | 126 | 0.4% |
| American | 2,247 | 7.9% |
| Arab | 12 | 0.0% |
| Austrian | 20 | 0.1% |
| Bhutanese | 188 | 0.7% |
| Blackfeet | 83 | 0.3% |
| British | 159 | 0.6% |
| Burmese | 504 | 1.8% |
| Cajun | 103 | 0.4% |
| Canadian | 19 | 0.1% |
| Central American | 444 | 1.6% |
| Central American Indian | 25 | 0.1% |
| Cherokee | 194 | 0.7% |
| Chilean | 31 | 0.1% |
| Colombian | 64 | 0.2% |
| Creek | 178 | 0.6% |
| Cuban | 192 | 0.7% |
| Czech | 98 | 0.3% |
| Czechoslovakian | 9 | 0.0% |
| Danish | 9 | 0.0% |
| Dutch | 98 | 0.3% |
| Ecuadorian | 10 | 0.0% |
| English | 2,926 | 10.3% |
| European | 648 | 2.3% |
| Fijian | 27 | 0.1% |
| Finnish | 20 | 0.1% |
| French | 456 | 1.6% |
| French Canadian | 45 | 0.2% |
| German | 3,079 | 10.8% |
| German Russian | 11 | 0.0% |
| Greek | 30 | 0.1% |
| Guatemalan | 210 | 0.7% |
| Haitian | 10 | 0.0% |
| Honduran | 58 | 0.2% |
| Houma | 7 | 0.0% |
| Hungarian | 78 | 0.3% |
| Indian (Asian) | 163 | 0.6% |
| Irish | 2,405 | 8.4% |
| Italian | 840 | 2.9% |
| Jamaican | 14 | 0.1% |
| Korean | 76 | 0.3% |
| Lithuanian | 29 | 0.1% |
| Mexican | 914 | 3.2% |
| Mexican American Indian | 25 | 0.1% |
| Native Hawaiian | 45 | 0.2% |
| New Zealander | 43 | 0.2% |
| Norwegian | 195 | 0.7% |
| Pakistani | 9 | 0.0% |
| Panamanian | 39 | 0.1% |
| Peruvian | 100 | 0.4% |
| Polish | 158 | 0.5% |
| Puerto Rican | 774 | 2.7% |
| Salvadoran | 137 | 0.5% |
| Scandinavian | 61 | 0.2% |
| Scotch-Irish | 631 | 2.2% |
| Scottish | 429 | 1.5% |
| Serbian | 7 | 0.0% |
| Slavic | 8 | 0.0% |
| South African | 11 | 0.0% |
| South American | 218 | 0.8% |
| Spaniard | 184 | 0.6% |
| Spanish | 3 | 0.0% |
| Sri Lankan | 107 | 0.4% |
| Subsaharan African | 137 | 0.5% |
| Swedish | 131 | 0.5% |
| Swiss | 14 | 0.1% |
| Thai | 22 | 0.1% |
| Turkish | 11 | 0.0% |
| Venezuelan | 13 | 0.1% |
| Welsh | 193 | 0.7% | View All 70 Rows |
Immigrants in Enterprise
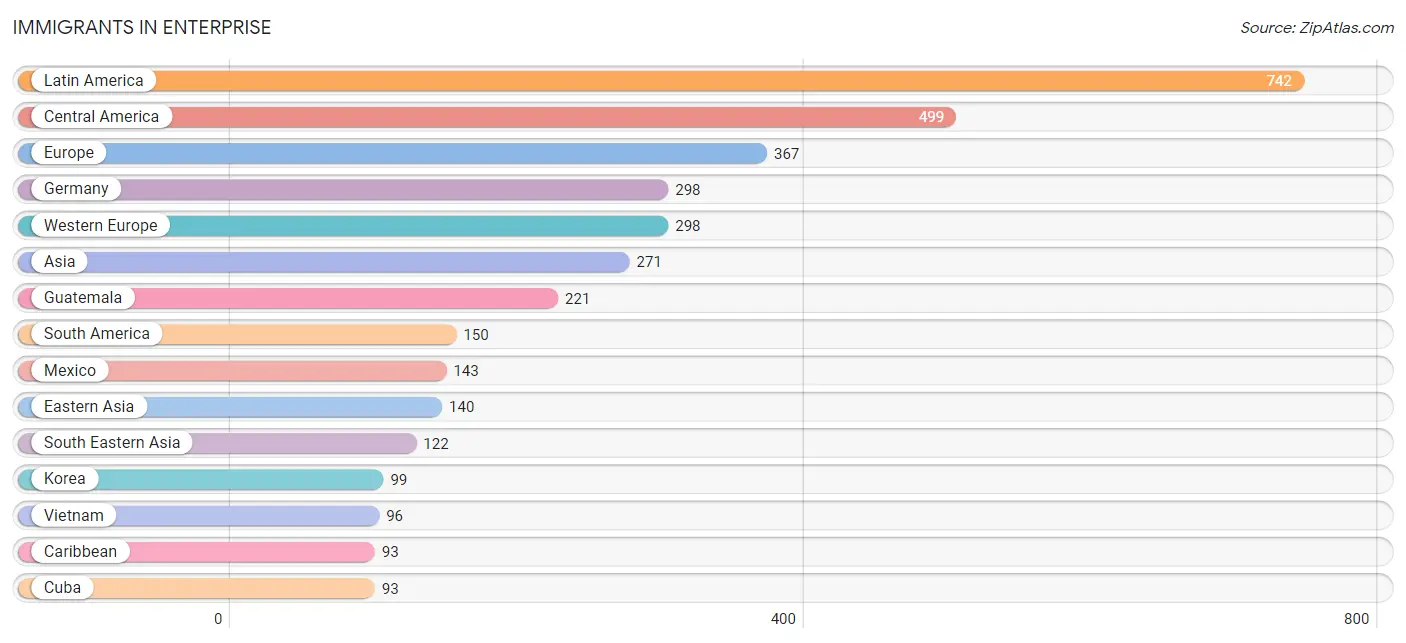
The most numerous immigrant groups reported in Enterprise came from Latin America (742 | 2.6%), Central America (499 | 1.8%), Europe (367 | 1.3%), Germany (298 | 1.1%), and Western Europe (298 | 1.1%), together accounting for 7.7% of all Enterprise residents.
| Immigration Origin | # Population | % Population |
| Africa | 11 | 0.0% |
| Asia | 271 | 0.9% |
| Canada | 7 | 0.0% |
| Caribbean | 93 | 0.3% |
| Central America | 499 | 1.8% |
| China | 30 | 0.1% |
| Colombia | 4 | 0.0% |
| Costa Rica | 25 | 0.1% |
| Cuba | 93 | 0.3% |
| Eastern Asia | 140 | 0.5% |
| Eastern Europe | 12 | 0.0% |
| Ecuador | 10 | 0.0% |
| El Salvador | 71 | 0.3% |
| Europe | 367 | 1.3% |
| Germany | 298 | 1.1% |
| Guatemala | 221 | 0.8% |
| Hungary | 7 | 0.0% |
| Italy | 5 | 0.0% |
| Japan | 11 | 0.0% |
| Korea | 99 | 0.4% |
| Latin America | 742 | 2.6% |
| Lithuania | 5 | 0.0% |
| Mexico | 143 | 0.5% |
| Northern Europe | 30 | 0.1% |
| Oceania | 12 | 0.0% |
| Pakistan | 9 | 0.0% |
| Panama | 39 | 0.1% |
| Peru | 53 | 0.2% |
| Philippines | 17 | 0.1% |
| South Africa | 11 | 0.0% |
| South America | 150 | 0.5% |
| South Central Asia | 9 | 0.0% |
| South Eastern Asia | 122 | 0.4% |
| Southern Europe | 27 | 0.1% |
| Spain | 22 | 0.1% |
| Thailand | 9 | 0.0% |
| Venezuela | 83 | 0.3% |
| Vietnam | 96 | 0.3% |
| Western Europe | 298 | 1.1% | View All 39 Rows |
Sex and Age in Enterprise
Sex and Age in Enterprise
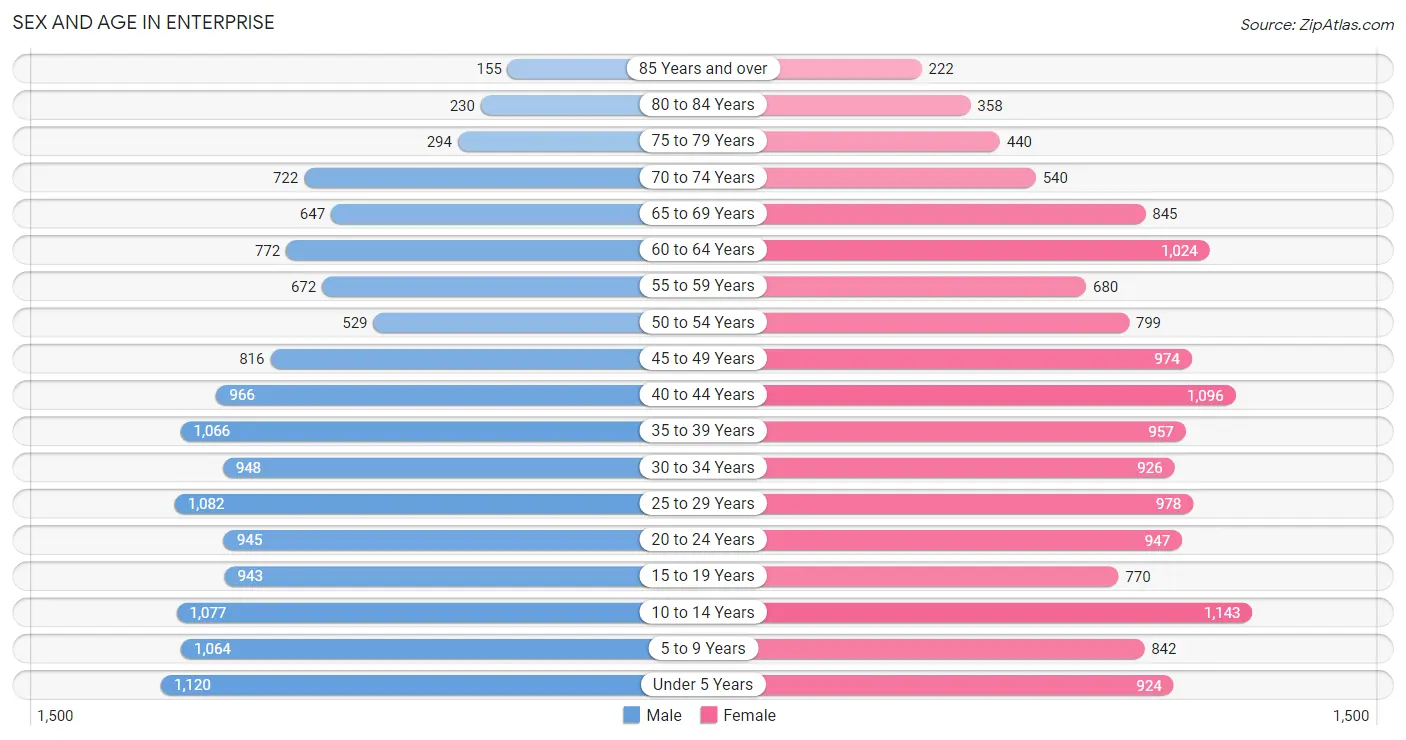
The most populous age groups in Enterprise are Under 5 Years (1,120 | 8.0%) for men and 10 to 14 Years (1,143 | 7.9%) for women.
| Age Bracket | Male | Female |
| Under 5 Years | 1,120 (8.0%) | 924 (6.4%) |
| 5 to 9 Years | 1,064 (7.6%) | 842 (5.8%) |
| 10 to 14 Years | 1,077 (7.7%) | 1,143 (7.9%) |
| 15 to 19 Years | 943 (6.7%) | 770 (5.3%) |
| 20 to 24 Years | 945 (6.7%) | 947 (6.6%) |
| 25 to 29 Years | 1,082 (7.7%) | 978 (6.8%) |
| 30 to 34 Years | 948 (6.8%) | 926 (6.4%) |
| 35 to 39 Years | 1,066 (7.6%) | 957 (6.6%) |
| 40 to 44 Years | 966 (6.9%) | 1,096 (7.6%) |
| 45 to 49 Years | 816 (5.8%) | 974 (6.7%) |
| 50 to 54 Years | 529 (3.8%) | 799 (5.5%) |
| 55 to 59 Years | 672 (4.8%) | 680 (4.7%) |
| 60 to 64 Years | 772 (5.5%) | 1,024 (7.1%) |
| 65 to 69 Years | 647 (4.6%) | 845 (5.8%) |
| 70 to 74 Years | 722 (5.1%) | 540 (3.7%) |
| 75 to 79 Years | 294 (2.1%) | 440 (3.0%) |
| 80 to 84 Years | 230 (1.6%) | 358 (2.5%) |
| 85 Years and over | 155 (1.1%) | 222 (1.5%) |
| Total | 14,048 (100.0%) | 14,465 (100.0%) |
Families and Households in Enterprise
Median Family Size in Enterprise
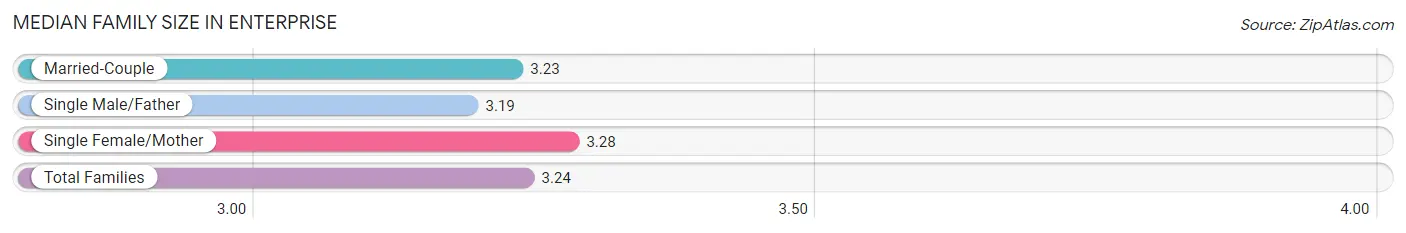
The median family size in Enterprise is 3.24 persons per family, with single female/mother families (1,909 | 26.4%) accounting for the largest median family size of 3.28 persons per family. On the other hand, single male/father families (552 | 7.6%) represent the smallest median family size with 3.19 persons per family.
| Family Type | # Families | Family Size |
| Married-Couple | 4,763 (65.9%) | 3.23 |
| Single Male/Father | 552 (7.6%) | 3.19 |
| Single Female/Mother | 1,909 (26.4%) | 3.28 |
| Total Families | 7,224 (100.0%) | 3.24 |
Median Household Size in Enterprise
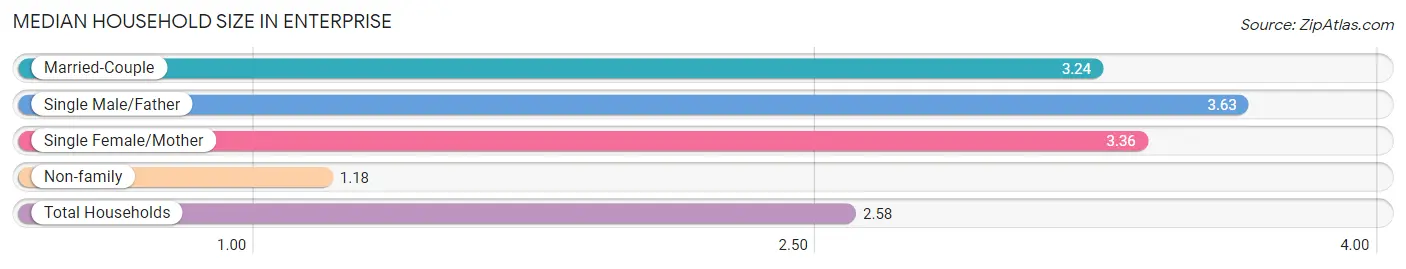
The median household size in Enterprise is 2.58 persons per household, with single male/father households (552 | 5.1%) accounting for the largest median household size of 3.63 persons per household. non-family households (3,674 | 33.7%) represent the smallest median household size with 1.18 persons per household.
| Household Type | # Households | Household Size |
| Married-Couple | 4,763 (43.7%) | 3.24 |
| Single Male/Father | 552 (5.1%) | 3.63 |
| Single Female/Mother | 1,909 (17.5%) | 3.36 |
| Non-family | 3,674 (33.7%) | 1.18 |
| Total Households | 10,898 (100.0%) | 2.58 |
Household Size by Marriage Status in Enterprise
Out of a total of 10,898 households in Enterprise, 7,224 (66.3%) are family households, while 3,674 (33.7%) are nonfamily households. The most numerous type of family households are 2-person households, comprising 3,343, and the most common type of nonfamily households are 1-person households, comprising 3,095.
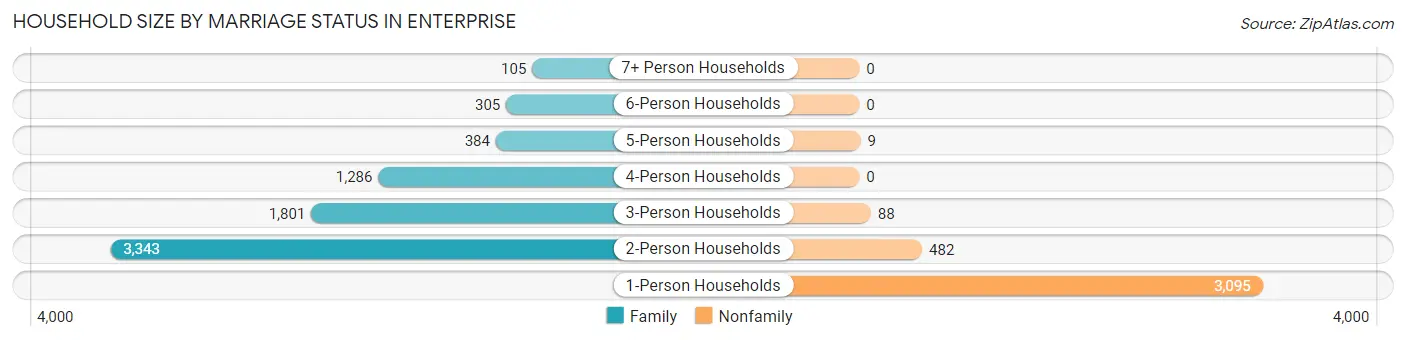
| Household Size | Family Households | Nonfamily Households |
| 1-Person Households | - | 3,095 (28.4%) |
| 2-Person Households | 3,343 (30.7%) | 482 (4.4%) |
| 3-Person Households | 1,801 (16.5%) | 88 (0.8%) |
| 4-Person Households | 1,286 (11.8%) | 0 (0.0%) |
| 5-Person Households | 384 (3.5%) | 9 (0.1%) |
| 6-Person Households | 305 (2.8%) | 0 (0.0%) |
| 7+ Person Households | 105 (1.0%) | 0 (0.0%) |
| Total | 7,224 (66.3%) | 3,674 (33.7%) |
Female Fertility in Enterprise
Fertility by Age in Enterprise
Average fertility rate in Enterprise is 72.0 births per 1,000 women. Women in the age bracket of 20 to 34 years have the highest fertility rate with 159.0 births per 1,000 women. Women in the age bracket of 20 to 34 years acount for 93.0% of all women with births.
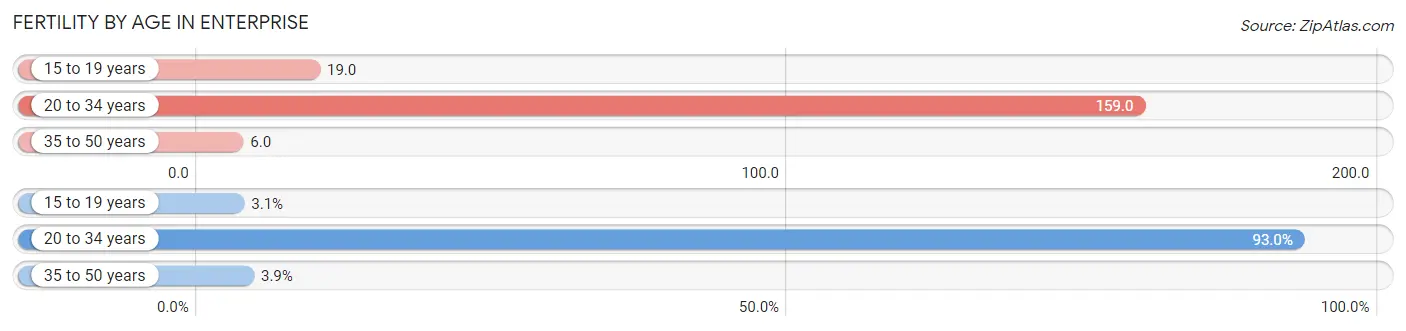
| Age Bracket | Women with Births | Births / 1,000 Women |
| 15 to 19 years | 15 (3.1%) | 19.0 |
| 20 to 34 years | 453 (93.0%) | 159.0 |
| 35 to 50 years | 19 (3.9%) | 6.0 |
| Total | 487 (100.0%) | 72.0 |
Fertility by Age by Marriage Status in Enterprise
70.0% of women with births (487) in Enterprise are married. The highest percentage of unmarried women with births falls into 15 to 19 years age bracket with 100.0% of them unmarried at the time of birth, while the lowest percentage of unmarried women with births belong to 35 to 50 years age bracket with 0.0% of them unmarried.
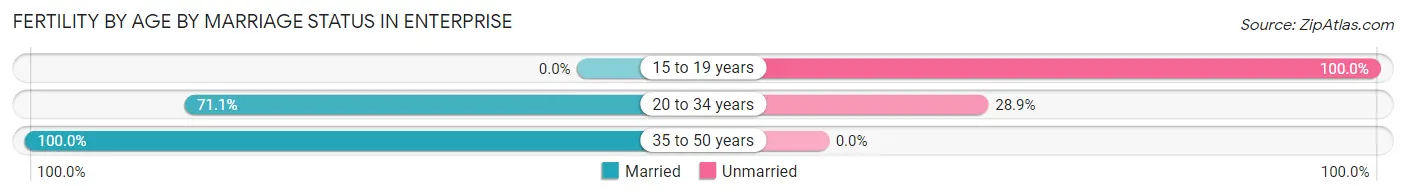
| Age Bracket | Married | Unmarried |
| 15 to 19 years | 0 (0.0%) | 15 (100.0%) |
| 20 to 34 years | 322 (71.1%) | 131 (28.9%) |
| 35 to 50 years | 19 (100.0%) | 0 (0.0%) |
| Total | 341 (70.0%) | 146 (30.0%) |
Fertility by Education in Enterprise
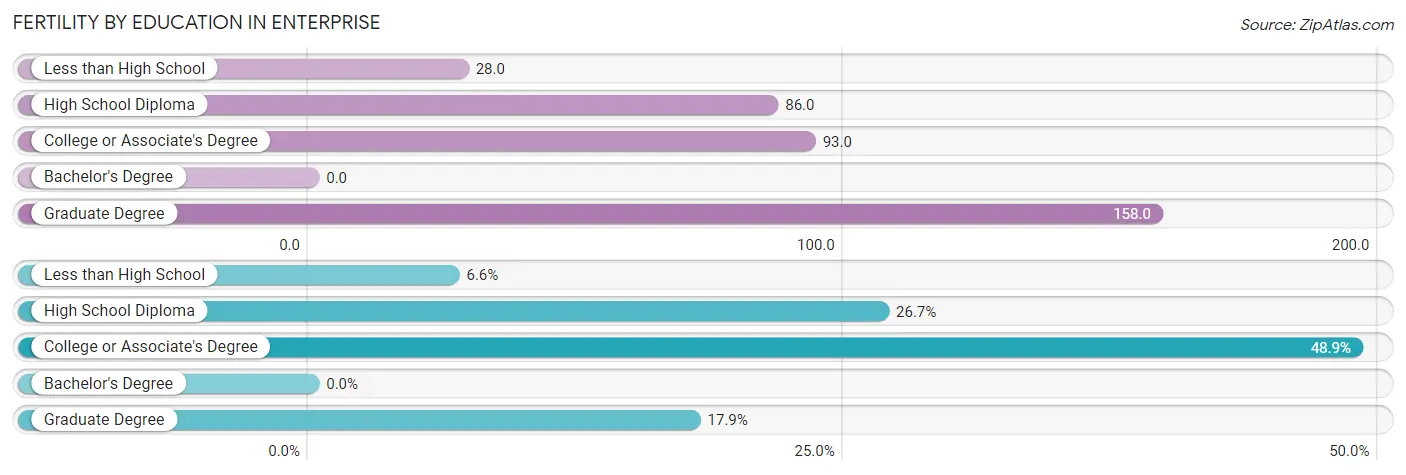
| Educational Attainment | Women with Births | Births / 1,000 Women |
| Less than High School | 32 (6.6%) | 28.0 |
| High School Diploma | 130 (26.7%) | 86.0 |
| College or Associate's Degree | 238 (48.9%) | 93.0 |
| Bachelor's Degree | 0 (0.0%) | 0.0 |
| Graduate Degree | 87 (17.9%) | 158.0 |
| Total | 487 (100.0%) | 72.0 |
Fertility by Education by Marriage Status in Enterprise
30.0% of women with births in Enterprise are unmarried. Women with the educational attainment of less than high school are most likely to be married with 100.0% of them married at childbirth, while women with the educational attainment of college or associate's degree are least likely to be married with 47.9% of them unmarried at childbirth.
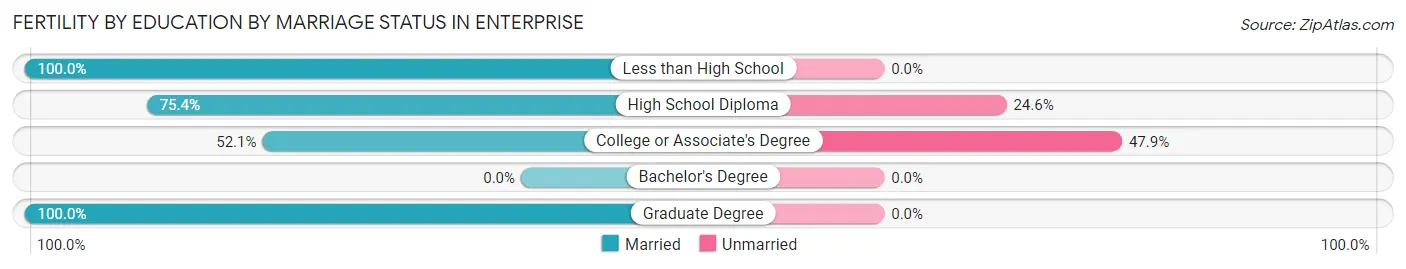
| Educational Attainment | Married | Unmarried |
| Less than High School | 32 (100.0%) | 0 (0.0%) |
| High School Diploma | 98 (75.4%) | 32 (24.6%) |
| College or Associate's Degree | 124 (52.1%) | 114 (47.9%) |
| Bachelor's Degree | 0 (0.0%) | 0 (0.0%) |
| Graduate Degree | 87 (100.0%) | 0 (0.0%) |
| Total | 341 (70.0%) | 146 (30.0%) |
Employment Characteristics in Enterprise
Employment by Class of Employer in Enterprise
Among the 11,950 employed individuals in Enterprise, private company employees (5,787 | 48.4%), federal government employees (2,880 | 24.1%), and local government employees (987 | 8.3%) make up the most common classes of employment.
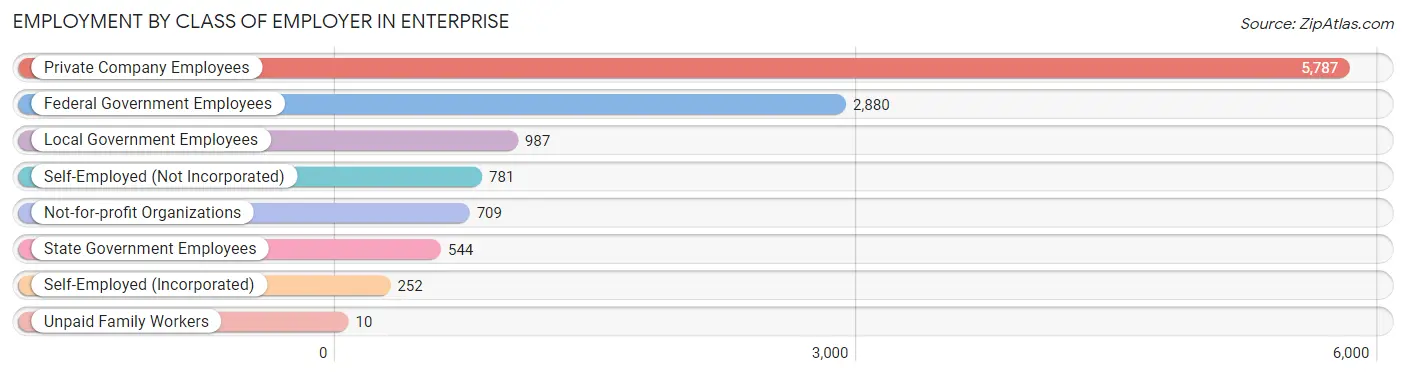
| Employer Class | # Employees | % Employees |
| Private Company Employees | 5,787 | 48.4% |
| Self-Employed (Incorporated) | 252 | 2.1% |
| Self-Employed (Not Incorporated) | 781 | 6.5% |
| Not-for-profit Organizations | 709 | 5.9% |
| Local Government Employees | 987 | 8.3% |
| State Government Employees | 544 | 4.5% |
| Federal Government Employees | 2,880 | 24.1% |
| Unpaid Family Workers | 10 | 0.1% |
| Total | 11,950 | 100.0% |
Employment Status by Age in Enterprise
According to the labor force statistics for Enterprise, out of the total population over 16 years of age (22,038), 58.0% or 12,782 individuals are in the labor force, with 4.1% or 524 of them unemployed. The age group with the highest labor force participation rate is 25 to 29 years, with 89.1% or 1,835 individuals in the labor force. Within the labor force, the 20 to 24 years age range has the highest percentage of unemployed individuals, with 9.6% or 121 of them being unemployed.
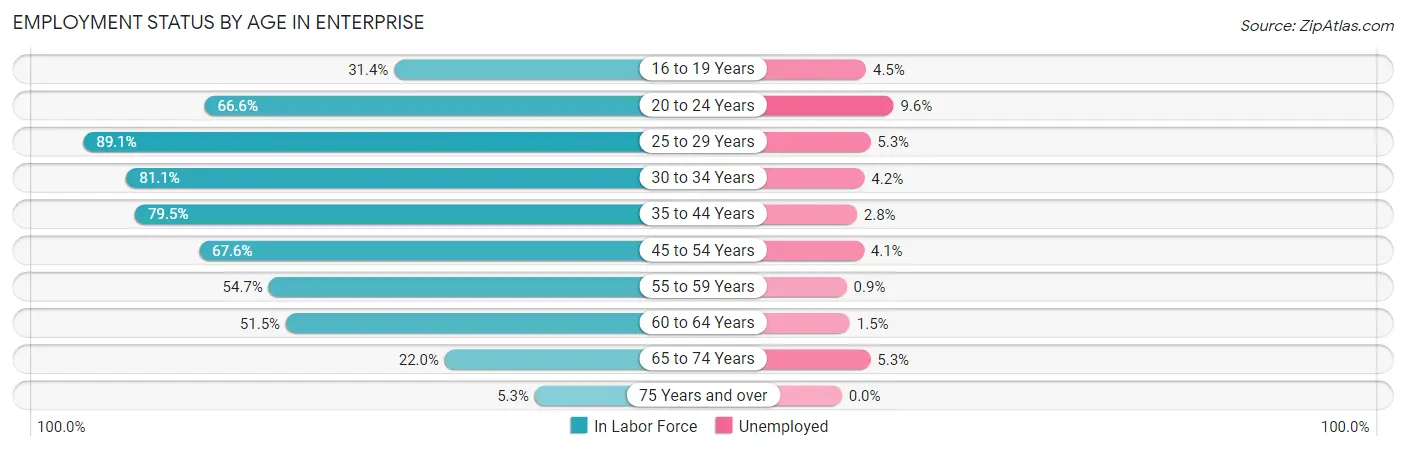
| Age Bracket | In Labor Force | Unemployed |
| 16 to 19 Years | 442 (31.4%) | 20 (4.5%) |
| 20 to 24 Years | 1,260 (66.6%) | 121 (9.6%) |
| 25 to 29 Years | 1,835 (89.1%) | 97 (5.3%) |
| 30 to 34 Years | 1,520 (81.1%) | 64 (4.2%) |
| 35 to 44 Years | 3,248 (79.5%) | 91 (2.8%) |
| 45 to 54 Years | 2,108 (67.6%) | 86 (4.1%) |
| 55 to 59 Years | 740 (54.7%) | 7 (0.9%) |
| 60 to 64 Years | 925 (51.5%) | 14 (1.5%) |
| 65 to 74 Years | 606 (22.0%) | 32 (5.3%) |
| 75 Years and over | 90 (5.3%) | 0 (0.0%) |
| Total | 12,782 (58.0%) | 524 (4.1%) |
Employment Status by Educational Attainment in Enterprise
According to labor force statistics for Enterprise, 72.6% of individuals (10,371) out of the total population between 25 and 64 years of age (14,285) are in the labor force, with 3.4% or 353 of them being unemployed. The group with the highest labor force participation rate are those with the educational attainment of bachelor's degree or higher, with 83.2% or 2,871 individuals in the labor force. Within the labor force, individuals with high school diploma education have the highest percentage of unemployment, with 5.2% or 119 of them being unemployed.
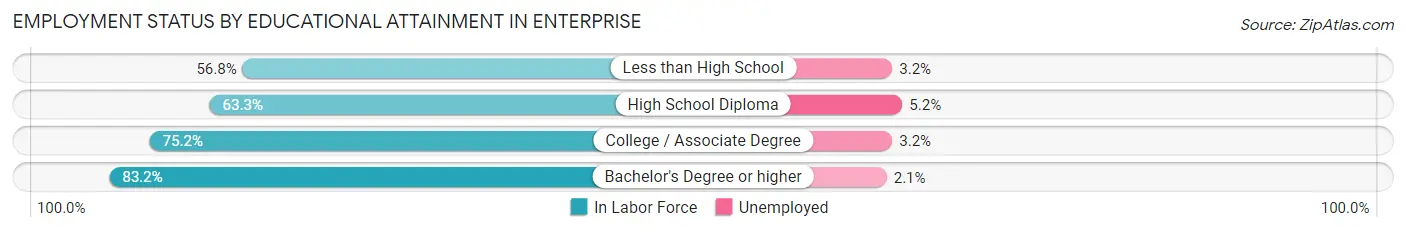
| Educational Attainment | In Labor Force | Unemployed |
| Less than High School | 674 (56.8%) | 38 (3.2%) |
| High School Diploma | 2,283 (63.3%) | 188 (5.2%) |
| College / Associate Degree | 4,543 (75.2%) | 193 (3.2%) |
| Bachelor's Degree or higher | 2,871 (83.2%) | 72 (2.1%) |
| Total | 10,371 (72.6%) | 486 (3.4%) |
Employment Occupations by Sex in Enterprise
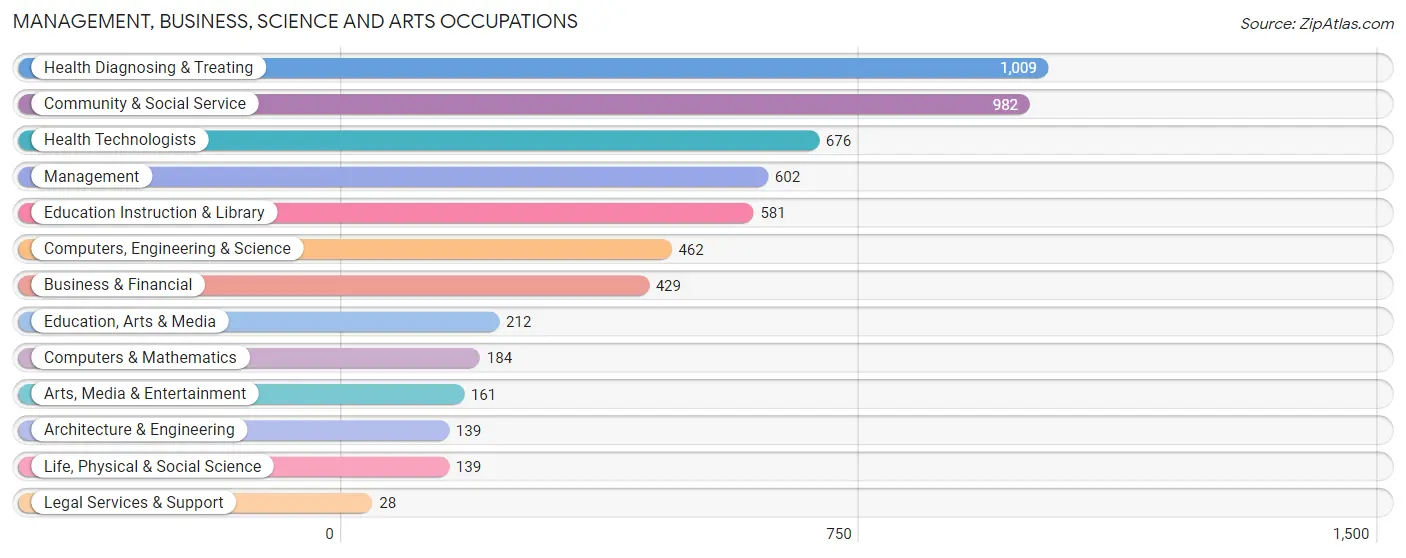
Management, Business, Science and Arts Occupations
The most common Management, Business, Science and Arts occupations in Enterprise are Health Diagnosing & Treating (1,009 | 9.2%), Community & Social Service (982 | 9.0%), Health Technologists (676 | 6.2%), Management (602 | 5.5%), and Education Instruction & Library (581 | 5.3%).
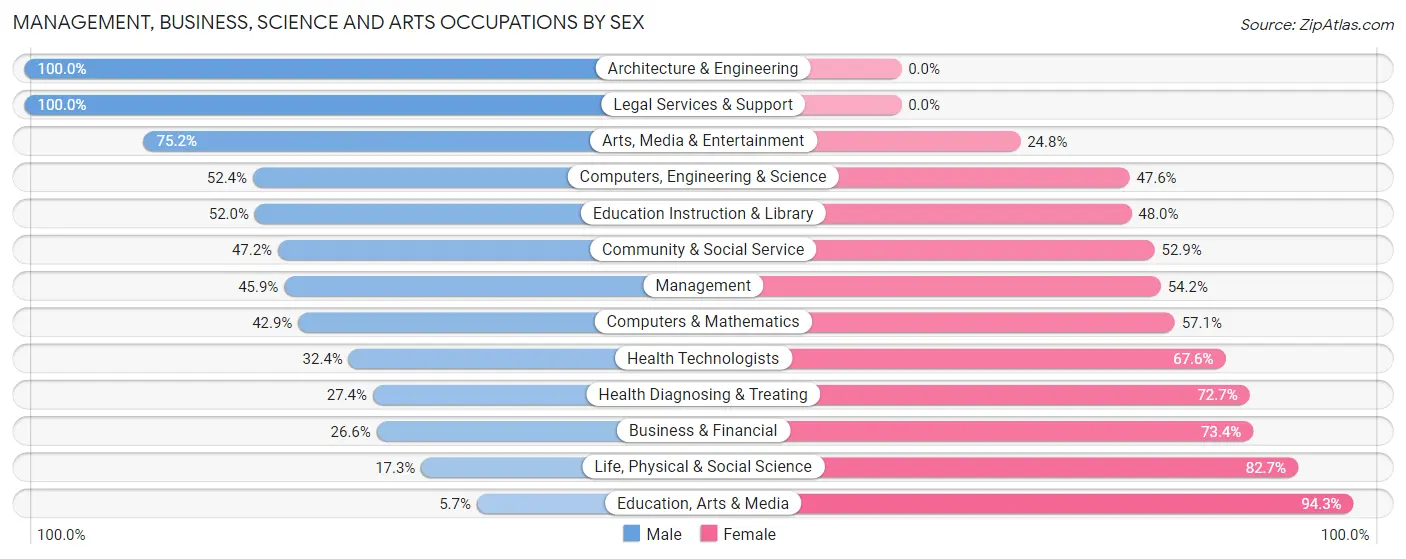
Management, Business, Science and Arts Occupations by Sex
Within the Management, Business, Science and Arts occupations in Enterprise, the most male-oriented occupations are Architecture & Engineering (100.0%), Legal Services & Support (100.0%), and Arts, Media & Entertainment (75.2%), while the most female-oriented occupations are Education, Arts & Media (94.3%), Life, Physical & Social Science (82.7%), and Business & Financial (73.4%).
| Occupation | Male | Female |
| Management | 276 (45.9%) | 326 (54.1%) |
| Business & Financial | 114 (26.6%) | 315 (73.4%) |
| Computers, Engineering & Science | 242 (52.4%) | 220 (47.6%) |
| Computers & Mathematics | 79 (42.9%) | 105 (57.1%) |
| Architecture & Engineering | 139 (100.0%) | 0 (0.0%) |
| Life, Physical & Social Science | 24 (17.3%) | 115 (82.7%) |
| Community & Social Service | 463 (47.1%) | 519 (52.8%) |
| Education, Arts & Media | 12 (5.7%) | 200 (94.3%) |
| Legal Services & Support | 28 (100.0%) | 0 (0.0%) |
| Education Instruction & Library | 302 (52.0%) | 279 (48.0%) |
| Arts, Media & Entertainment | 121 (75.2%) | 40 (24.8%) |
| Health Diagnosing & Treating | 276 (27.4%) | 733 (72.7%) |
| Health Technologists | 219 (32.4%) | 457 (67.6%) |
| Total (Category) | 1,371 (39.4%) | 2,113 (60.7%) |
| Total (Overall) | 5,569 (50.8%) | 5,392 (49.2%) |
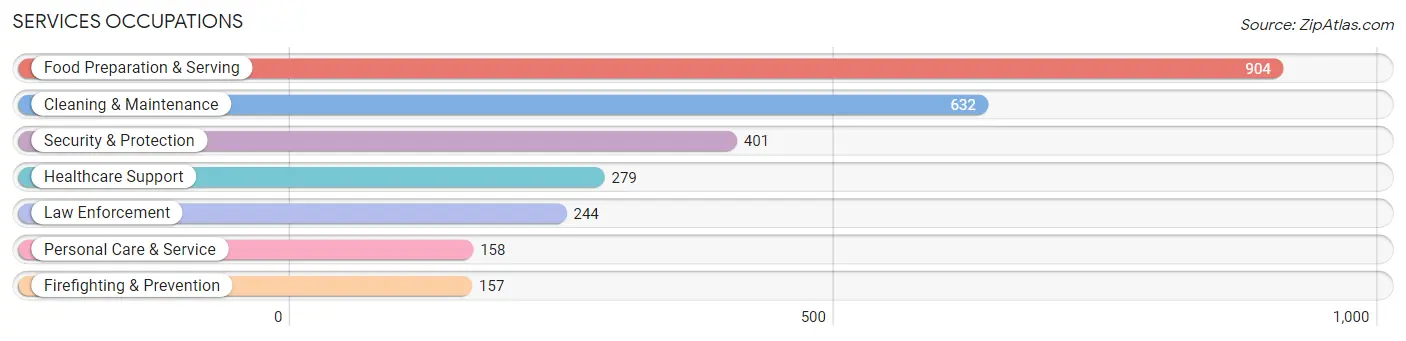
Services Occupations
The most common Services occupations in Enterprise are Food Preparation & Serving (904 | 8.3%), Cleaning & Maintenance (632 | 5.8%), Security & Protection (401 | 3.7%), Healthcare Support (279 | 2.5%), and Law Enforcement (244 | 2.2%).
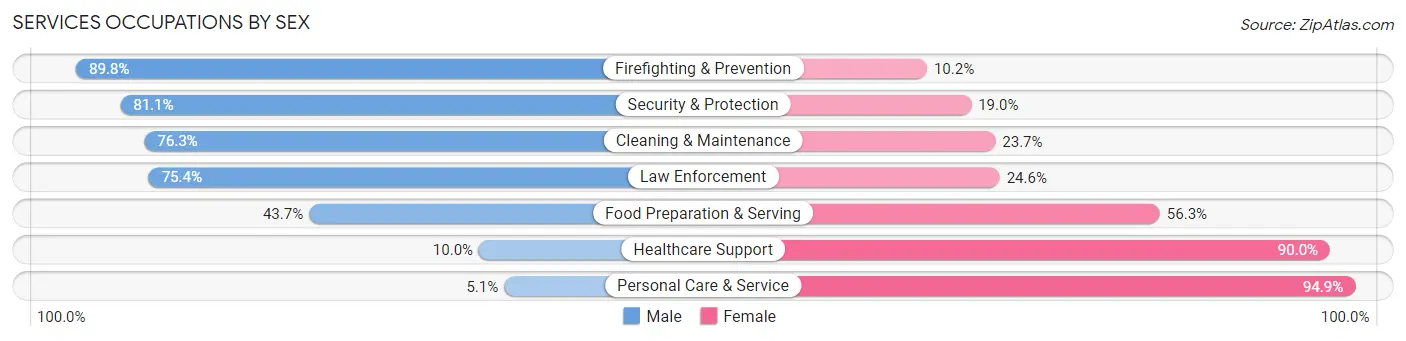
Services Occupations by Sex
Within the Services occupations in Enterprise, the most male-oriented occupations are Firefighting & Prevention (89.8%), Security & Protection (81.0%), and Cleaning & Maintenance (76.3%), while the most female-oriented occupations are Personal Care & Service (94.9%), Healthcare Support (90.0%), and Food Preparation & Serving (56.3%).
| Occupation | Male | Female |
| Healthcare Support | 28 (10.0%) | 251 (90.0%) |
| Security & Protection | 325 (81.0%) | 76 (19.0%) |
| Firefighting & Prevention | 141 (89.8%) | 16 (10.2%) |
| Law Enforcement | 184 (75.4%) | 60 (24.6%) |
| Food Preparation & Serving | 395 (43.7%) | 509 (56.3%) |
| Cleaning & Maintenance | 482 (76.3%) | 150 (23.7%) |
| Personal Care & Service | 8 (5.1%) | 150 (94.9%) |
| Total (Category) | 1,238 (52.1%) | 1,136 (47.8%) |
| Total (Overall) | 5,569 (50.8%) | 5,392 (49.2%) |
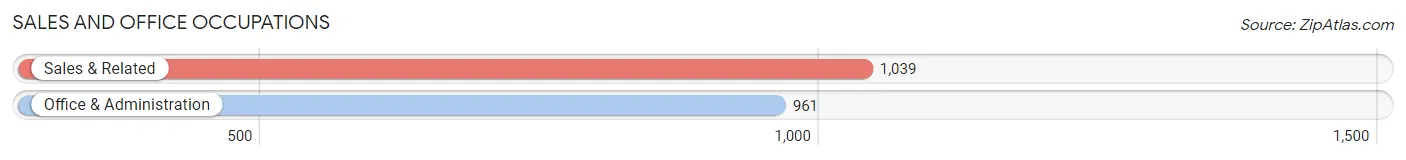
Sales and Office Occupations
The most common Sales and Office occupations in Enterprise are Sales & Related (1,039 | 9.5%), and Office & Administration (961 | 8.8%).
Sales and Office Occupations by Sex
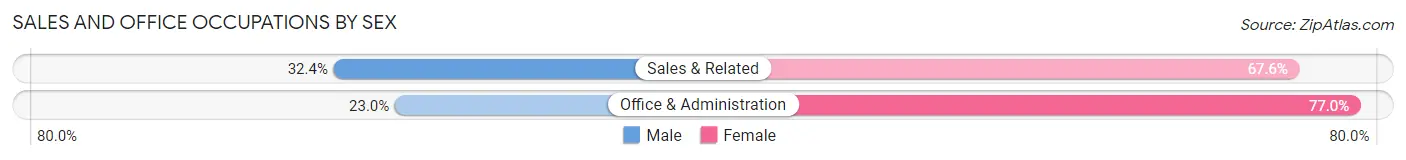
| Occupation | Male | Female |
| Sales & Related | 337 (32.4%) | 702 (67.6%) |
| Office & Administration | 221 (23.0%) | 740 (77.0%) |
| Total (Category) | 558 (27.9%) | 1,442 (72.1%) |
| Total (Overall) | 5,569 (50.8%) | 5,392 (49.2%) |
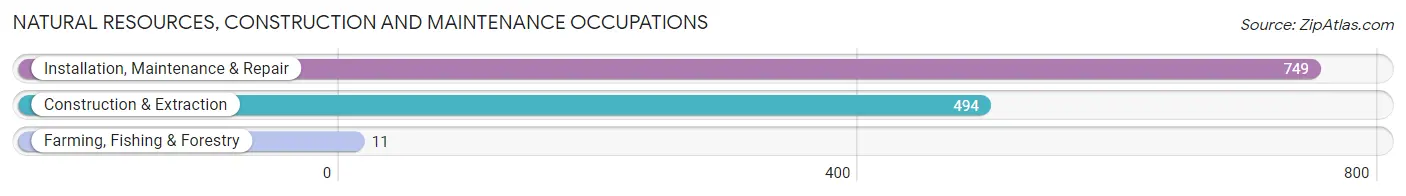
Natural Resources, Construction and Maintenance Occupations
The most common Natural Resources, Construction and Maintenance occupations in Enterprise are Installation, Maintenance & Repair (749 | 6.8%), Construction & Extraction (494 | 4.5%), and Farming, Fishing & Forestry (11 | 0.1%).
Natural Resources, Construction and Maintenance Occupations by Sex
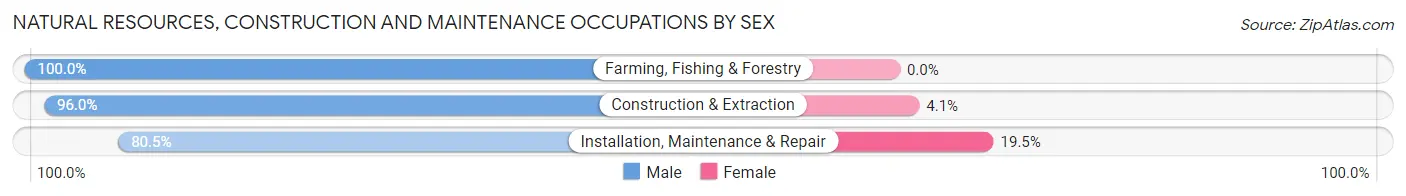
| Occupation | Male | Female |
| Farming, Fishing & Forestry | 11 (100.0%) | 0 (0.0%) |
| Construction & Extraction | 474 (96.0%) | 20 (4.1%) |
| Installation, Maintenance & Repair | 603 (80.5%) | 146 (19.5%) |
| Total (Category) | 1,088 (86.8%) | 166 (13.2%) |
| Total (Overall) | 5,569 (50.8%) | 5,392 (49.2%) |
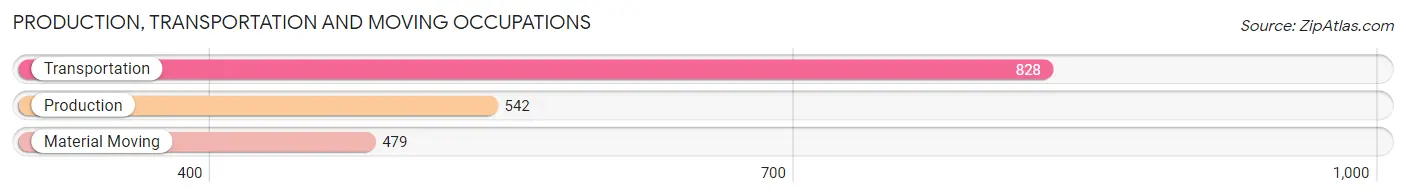
Production, Transportation and Moving Occupations
The most common Production, Transportation and Moving occupations in Enterprise are Transportation (828 | 7.5%), Production (542 | 4.9%), and Material Moving (479 | 4.4%).
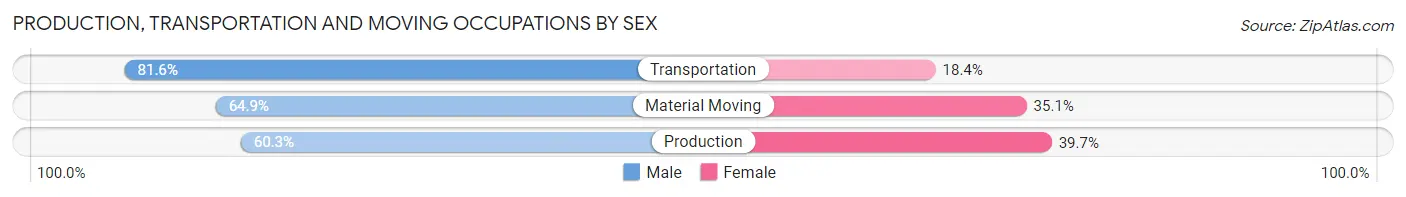
Production, Transportation and Moving Occupations by Sex
| Occupation | Male | Female |
| Production | 327 (60.3%) | 215 (39.7%) |
| Transportation | 676 (81.6%) | 152 (18.4%) |
| Material Moving | 311 (64.9%) | 168 (35.1%) |
| Total (Category) | 1,314 (71.1%) | 535 (28.9%) |
| Total (Overall) | 5,569 (50.8%) | 5,392 (49.2%) |
Employment Industries by Sex in Enterprise
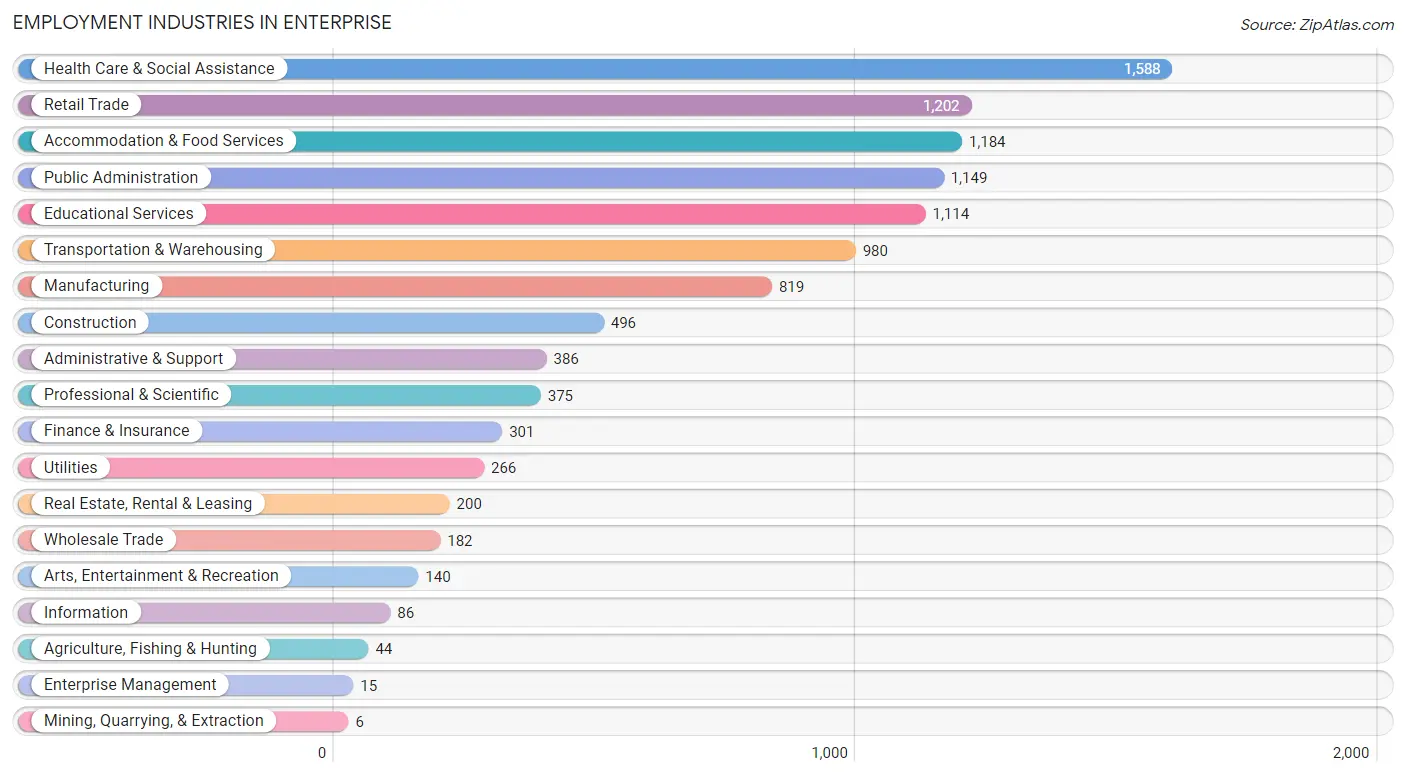
Employment Industries in Enterprise
The major employment industries in Enterprise include Health Care & Social Assistance (1,588 | 14.5%), Retail Trade (1,202 | 11.0%), Accommodation & Food Services (1,184 | 10.8%), Public Administration (1,149 | 10.5%), and Educational Services (1,114 | 10.2%).
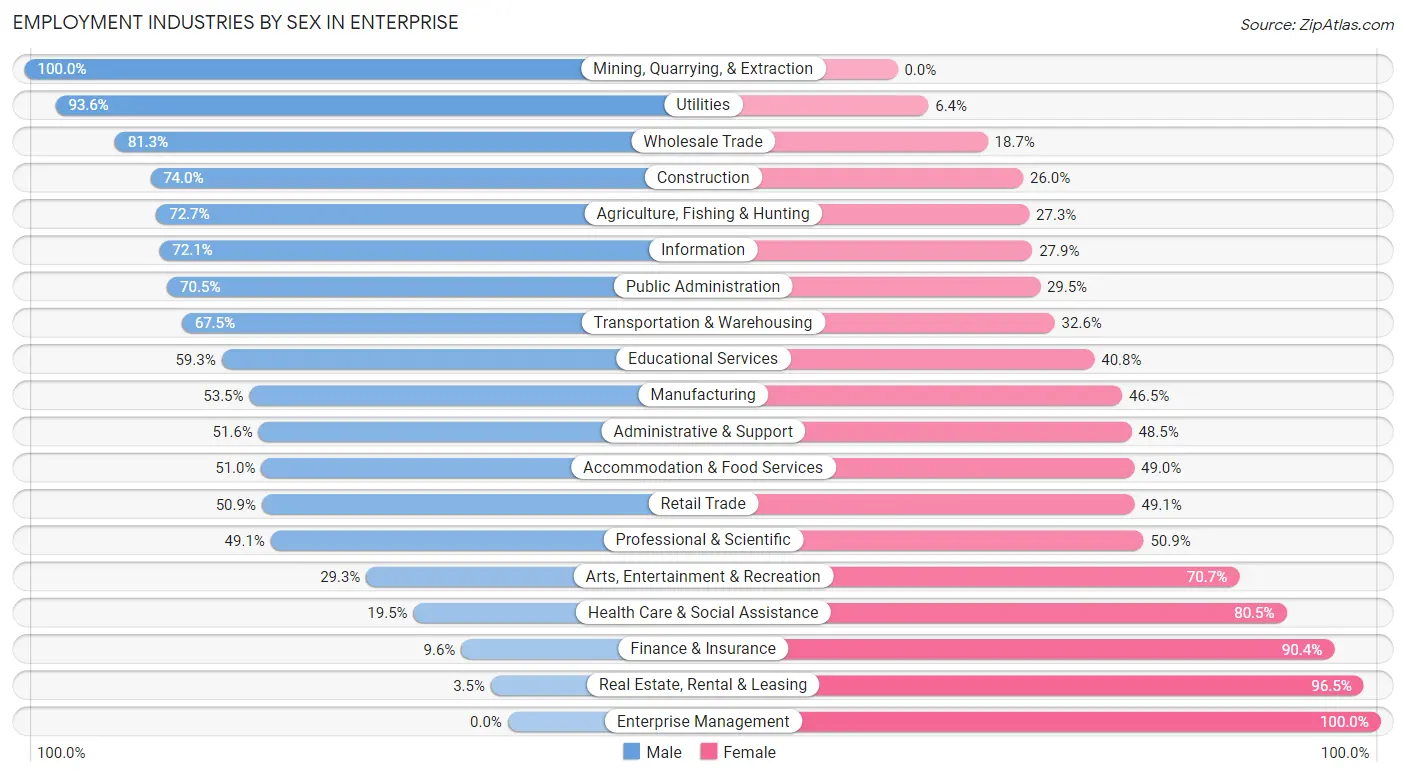
Employment Industries by Sex in Enterprise
The Enterprise industries that see more men than women are Mining, Quarrying, & Extraction (100.0%), Utilities (93.6%), and Wholesale Trade (81.3%), whereas the industries that tend to have a higher number of women are Enterprise Management (100.0%), Real Estate, Rental & Leasing (96.5%), and Finance & Insurance (90.4%).
| Industry | Male | Female |
| Agriculture, Fishing & Hunting | 32 (72.7%) | 12 (27.3%) |
| Mining, Quarrying, & Extraction | 6 (100.0%) | 0 (0.0%) |
| Construction | 367 (74.0%) | 129 (26.0%) |
| Manufacturing | 438 (53.5%) | 381 (46.5%) |
| Wholesale Trade | 148 (81.3%) | 34 (18.7%) |
| Retail Trade | 612 (50.9%) | 590 (49.1%) |
| Transportation & Warehousing | 661 (67.4%) | 319 (32.6%) |
| Utilities | 249 (93.6%) | 17 (6.4%) |
| Information | 62 (72.1%) | 24 (27.9%) |
| Finance & Insurance | 29 (9.6%) | 272 (90.4%) |
| Real Estate, Rental & Leasing | 7 (3.5%) | 193 (96.5%) |
| Professional & Scientific | 184 (49.1%) | 191 (50.9%) |
| Enterprise Management | 0 (0.0%) | 15 (100.0%) |
| Administrative & Support | 199 (51.5%) | 187 (48.4%) |
| Educational Services | 660 (59.3%) | 454 (40.7%) |
| Health Care & Social Assistance | 310 (19.5%) | 1,278 (80.5%) |
| Arts, Entertainment & Recreation | 41 (29.3%) | 99 (70.7%) |
| Accommodation & Food Services | 604 (51.0%) | 580 (49.0%) |
| Public Administration | 810 (70.5%) | 339 (29.5%) |
| Total | 5,569 (50.8%) | 5,392 (49.2%) |
Education in Enterprise
School Enrollment in Enterprise
The most common levels of schooling among the 7,359 students in Enterprise are middle school (1,757 | 23.9%), elementary school (1,505 | 20.4%), and college / undergraduate (1,456 | 19.8%).
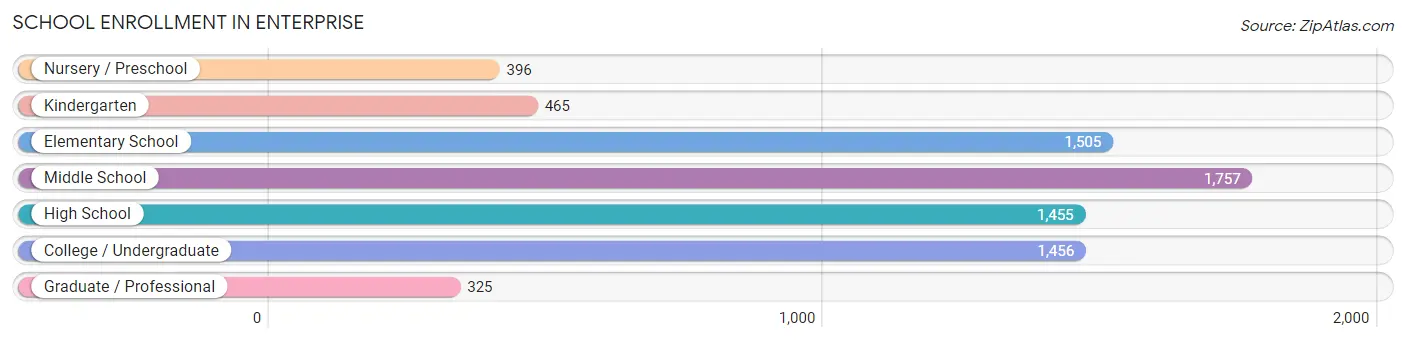
| School Level | # Students | % Students |
| Nursery / Preschool | 396 | 5.4% |
| Kindergarten | 465 | 6.3% |
| Elementary School | 1,505 | 20.4% |
| Middle School | 1,757 | 23.9% |
| High School | 1,455 | 19.8% |
| College / Undergraduate | 1,456 | 19.8% |
| Graduate / Professional | 325 | 4.4% |
| Total | 7,359 | 100.0% |
School Enrollment by Age by Funding Source in Enterprise
Out of a total of 7,359 students who are enrolled in schools in Enterprise, 736 (10.0%) attend a private institution, while the remaining 6,623 (90.0%) are enrolled in public schools. The age group of 3 to 4 year olds has the highest likelihood of being enrolled in private schools, with 165 (42.9% in the age bracket) enrolled. Conversely, the age group of 5 to 9 year old has the lowest likelihood of being enrolled in a private school, with 1,705 (95.2% in the age bracket) attending a public institution.
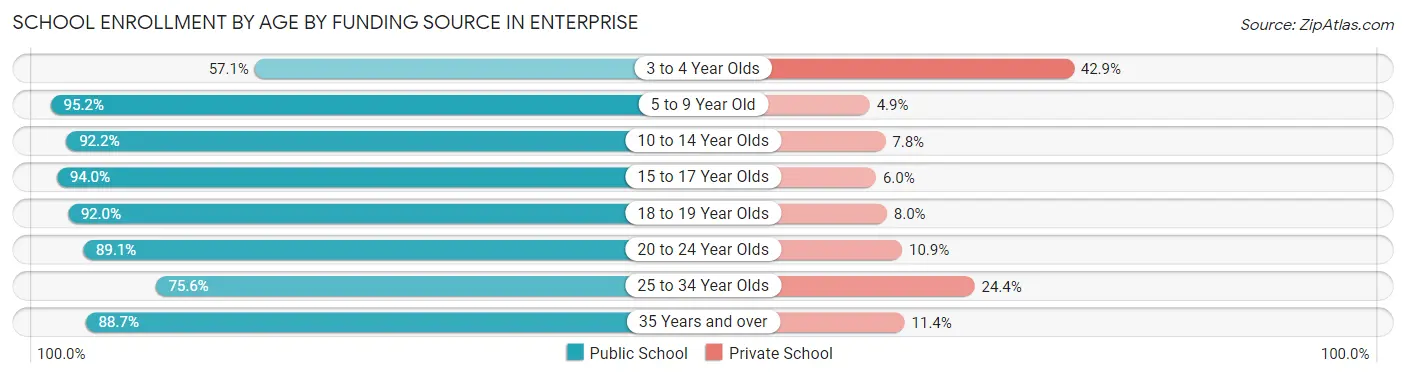
| Age Bracket | Public School | Private School |
| 3 to 4 Year Olds | 220 (57.1%) | 165 (42.9%) |
| 5 to 9 Year Old | 1,705 (95.2%) | 87 (4.9%) |
| 10 to 14 Year Olds | 1,997 (92.2%) | 168 (7.8%) |
| 15 to 17 Year Olds | 968 (94.0%) | 62 (6.0%) |
| 18 to 19 Year Olds | 309 (92.0%) | 27 (8.0%) |
| 20 to 24 Year Olds | 484 (89.1%) | 59 (10.9%) |
| 25 to 34 Year Olds | 245 (75.6%) | 79 (24.4%) |
| 35 Years and over | 695 (88.6%) | 89 (11.4%) |
| Total | 6,623 (90.0%) | 736 (10.0%) |
Educational Attainment by Field of Study in Enterprise
Business (905 | 17.7%), arts & humanities (735 | 14.4%), education (732 | 14.3%), science & technology (535 | 10.4%), and psychology (378 | 7.4%) are the most common fields of study among 5,118 individuals in Enterprise who have obtained a bachelor's degree or higher.
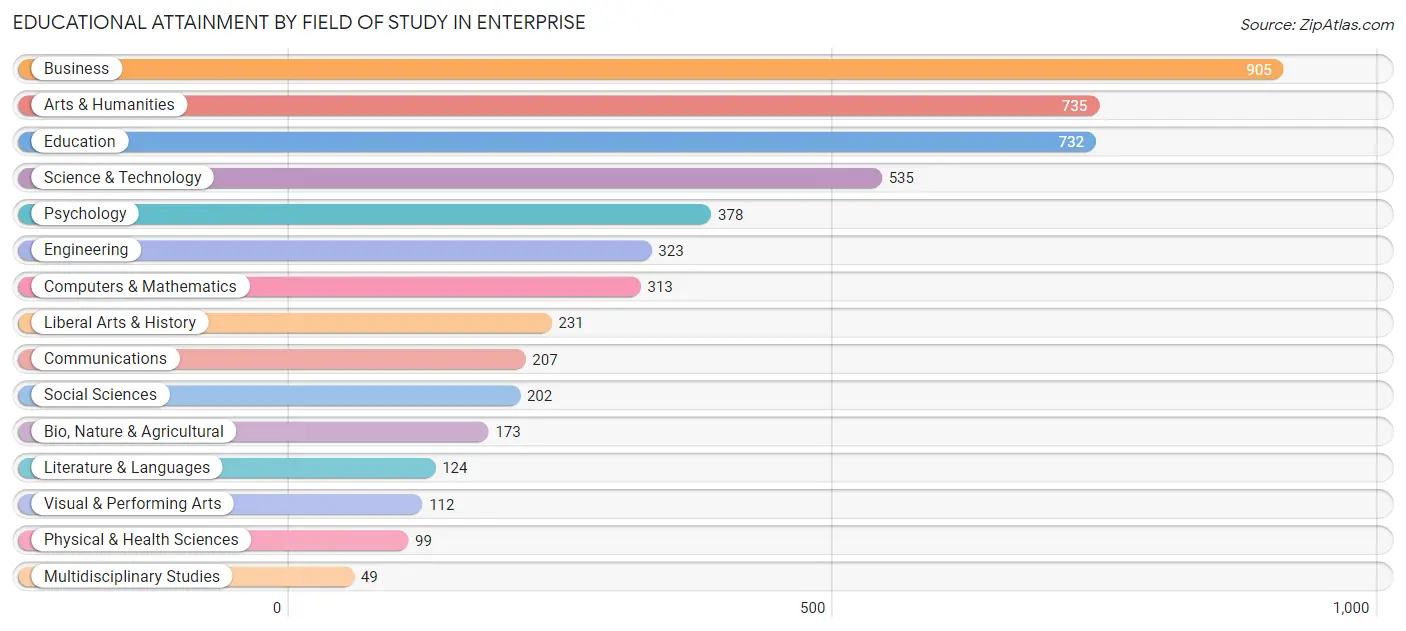
| Field of Study | # Graduates | % Graduates |
| Computers & Mathematics | 313 | 6.1% |
| Bio, Nature & Agricultural | 173 | 3.4% |
| Physical & Health Sciences | 99 | 1.9% |
| Psychology | 378 | 7.4% |
| Social Sciences | 202 | 4.0% |
| Engineering | 323 | 6.3% |
| Multidisciplinary Studies | 49 | 1.0% |
| Science & Technology | 535 | 10.4% |
| Business | 905 | 17.7% |
| Education | 732 | 14.3% |
| Literature & Languages | 124 | 2.4% |
| Liberal Arts & History | 231 | 4.5% |
| Visual & Performing Arts | 112 | 2.2% |
| Communications | 207 | 4.0% |
| Arts & Humanities | 735 | 14.4% |
| Total | 5,118 | 100.0% |
Transportation & Commute in Enterprise
Vehicle Availability by Sex in Enterprise
The most prevalent vehicle ownership categories in Enterprise are males with 2 vehicles (3,156, accounting for 47.7%) and females with 2 vehicles (2,403, making up 59.4%).
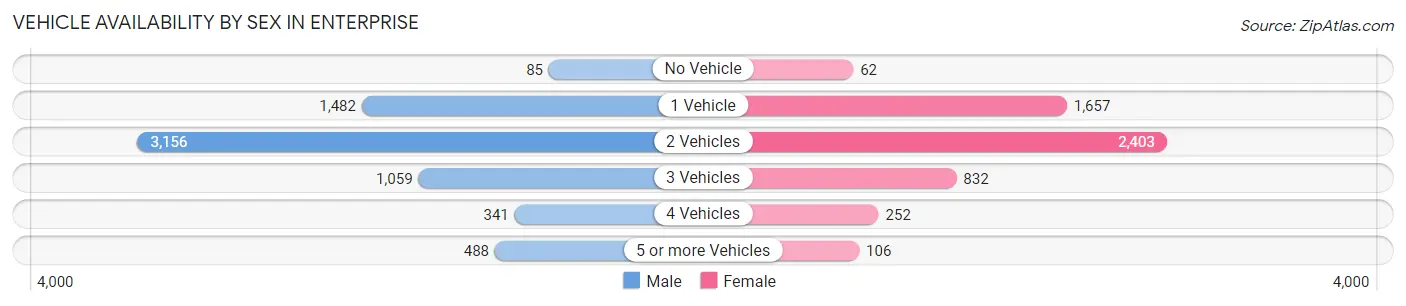
| Vehicles Available | Male | Female |
| No Vehicle | 85 (1.3%) | 62 (1.2%) |
| 1 Vehicle | 1,482 (22.4%) | 1,657 (31.2%) |
| 2 Vehicles | 3,156 (47.7%) | 2,403 (45.2%) |
| 3 Vehicles | 1,059 (16.0%) | 832 (15.7%) |
| 4 Vehicles | 341 (5.2%) | 252 (4.7%) |
| 5 or more Vehicles | 488 (7.4%) | 106 (2.0%) |
| Total | 6,611 (100.0%) | 5,312 (100.0%) |
Commute Time in Enterprise
The most frequently occuring commute durations in Enterprise are 10 to 14 minutes (3,158 commuters, 27.1%), 5 to 9 minutes (1,721 commuters, 14.8%), and 15 to 19 minutes (1,708 commuters, 14.7%).
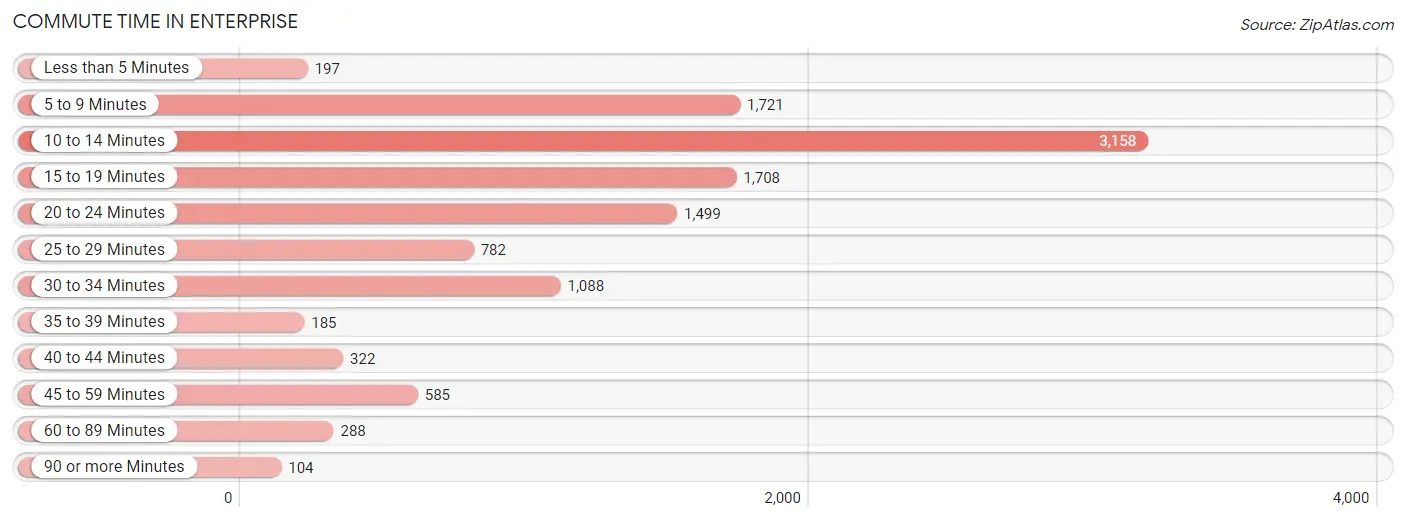
| Commute Time | # Commuters | % Commuters |
| Less than 5 Minutes | 197 | 1.7% |
| 5 to 9 Minutes | 1,721 | 14.8% |
| 10 to 14 Minutes | 3,158 | 27.1% |
| 15 to 19 Minutes | 1,708 | 14.7% |
| 20 to 24 Minutes | 1,499 | 12.9% |
| 25 to 29 Minutes | 782 | 6.7% |
| 30 to 34 Minutes | 1,088 | 9.3% |
| 35 to 39 Minutes | 185 | 1.6% |
| 40 to 44 Minutes | 322 | 2.8% |
| 45 to 59 Minutes | 585 | 5.0% |
| 60 to 89 Minutes | 288 | 2.5% |
| 90 or more Minutes | 104 | 0.9% |
Commute Time by Sex in Enterprise
The most common commute times in Enterprise are 10 to 14 minutes (1,454 commuters, 22.5%) for males and 10 to 14 minutes (1,704 commuters, 33.0%) for females.
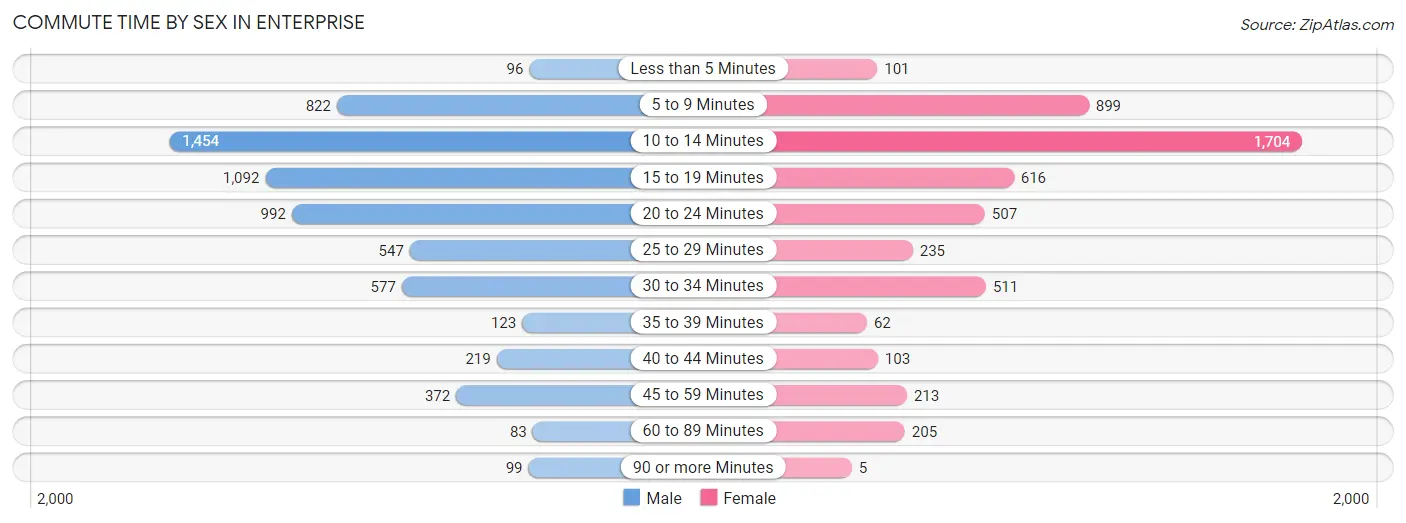
| Commute Time | Male | Female |
| Less than 5 Minutes | 96 (1.5%) | 101 (2.0%) |
| 5 to 9 Minutes | 822 (12.7%) | 899 (17.4%) |
| 10 to 14 Minutes | 1,454 (22.5%) | 1,704 (33.0%) |
| 15 to 19 Minutes | 1,092 (16.9%) | 616 (11.9%) |
| 20 to 24 Minutes | 992 (15.3%) | 507 (9.8%) |
| 25 to 29 Minutes | 547 (8.5%) | 235 (4.5%) |
| 30 to 34 Minutes | 577 (8.9%) | 511 (9.9%) |
| 35 to 39 Minutes | 123 (1.9%) | 62 (1.2%) |
| 40 to 44 Minutes | 219 (3.4%) | 103 (2.0%) |
| 45 to 59 Minutes | 372 (5.7%) | 213 (4.1%) |
| 60 to 89 Minutes | 83 (1.3%) | 205 (4.0%) |
| 90 or more Minutes | 99 (1.5%) | 5 (0.1%) |
Time of Departure to Work by Sex in Enterprise
The most frequent times of departure to work in Enterprise are 7:00 AM to 7:29 AM (874, 13.5%) for males and 7:00 AM to 7:29 AM (839, 16.3%) for females.
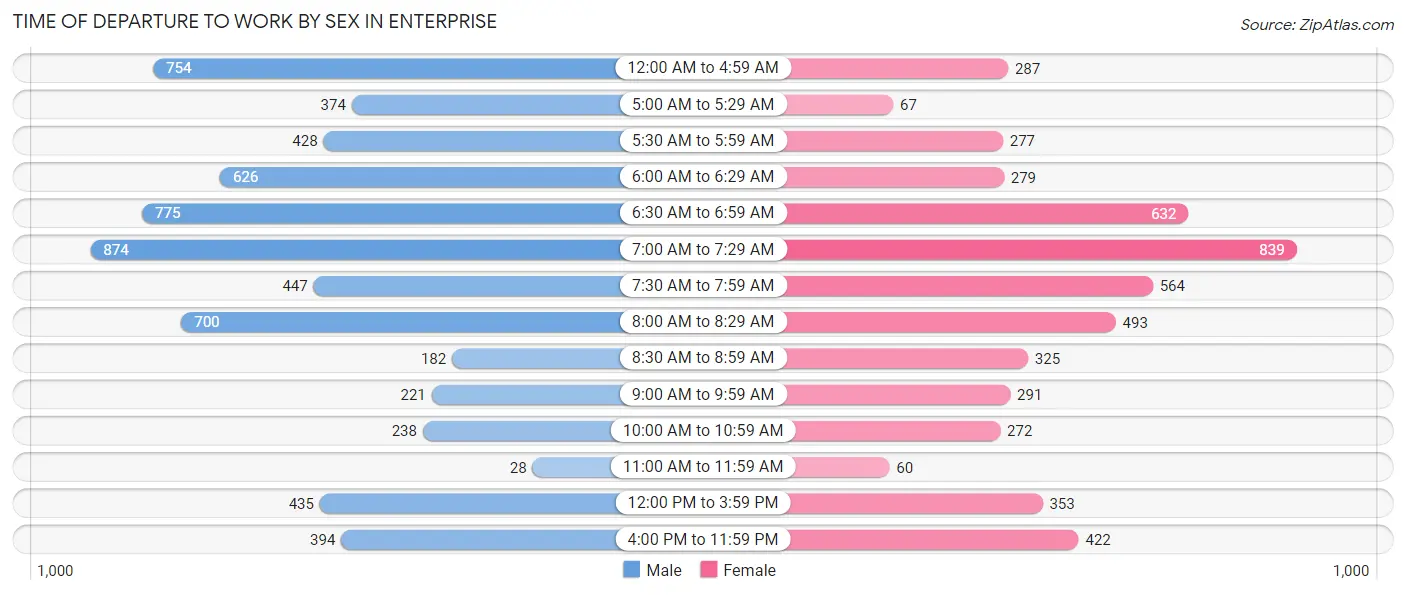
| Time of Departure | Male | Female |
| 12:00 AM to 4:59 AM | 754 (11.6%) | 287 (5.6%) |
| 5:00 AM to 5:29 AM | 374 (5.8%) | 67 (1.3%) |
| 5:30 AM to 5:59 AM | 428 (6.6%) | 277 (5.4%) |
| 6:00 AM to 6:29 AM | 626 (9.7%) | 279 (5.4%) |
| 6:30 AM to 6:59 AM | 775 (12.0%) | 632 (12.2%) |
| 7:00 AM to 7:29 AM | 874 (13.5%) | 839 (16.3%) |
| 7:30 AM to 7:59 AM | 447 (6.9%) | 564 (10.9%) |
| 8:00 AM to 8:29 AM | 700 (10.8%) | 493 (9.6%) |
| 8:30 AM to 8:59 AM | 182 (2.8%) | 325 (6.3%) |
| 9:00 AM to 9:59 AM | 221 (3.4%) | 291 (5.6%) |
| 10:00 AM to 10:59 AM | 238 (3.7%) | 272 (5.3%) |
| 11:00 AM to 11:59 AM | 28 (0.4%) | 60 (1.2%) |
| 12:00 PM to 3:59 PM | 435 (6.7%) | 353 (6.8%) |
| 4:00 PM to 11:59 PM | 394 (6.1%) | 422 (8.2%) |
| Total | 6,476 (100.0%) | 5,161 (100.0%) |
Housing Occupancy in Enterprise
Occupancy by Ownership in Enterprise
Of the total 10,898 dwellings in Enterprise, owner-occupied units account for 6,310 (57.9%), while renter-occupied units make up 4,588 (42.1%).
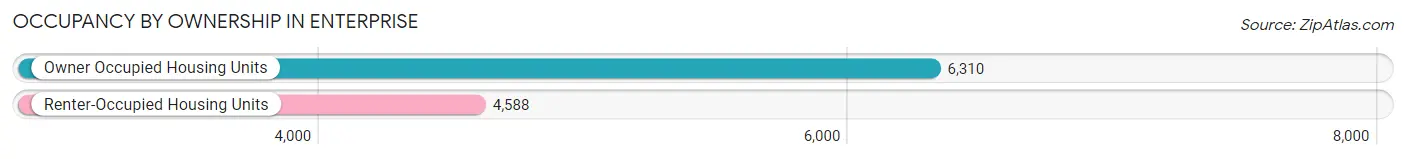
| Occupancy | # Housing Units | % Housing Units |
| Owner Occupied Housing Units | 6,310 | 57.9% |
| Renter-Occupied Housing Units | 4,588 | 42.1% |
| Total Occupied Housing Units | 10,898 | 100.0% |
Occupancy by Household Size in Enterprise
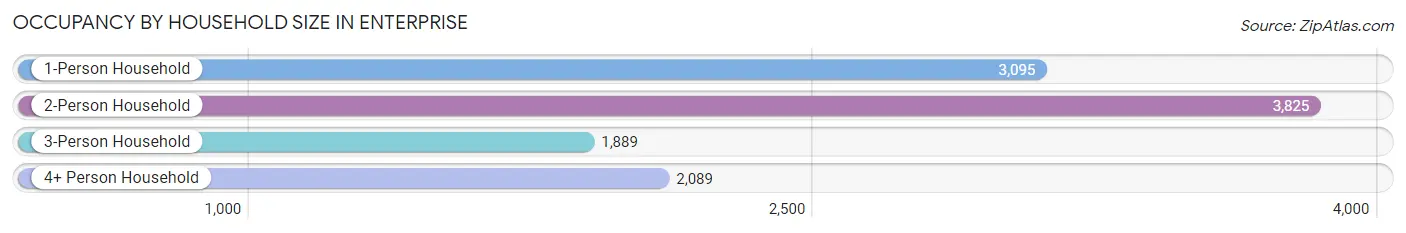
| Household Size | # Housing Units | % Housing Units |
| 1-Person Household | 3,095 | 28.4% |
| 2-Person Household | 3,825 | 35.1% |
| 3-Person Household | 1,889 | 17.3% |
| 4+ Person Household | 2,089 | 19.2% |
| Total Housing Units | 10,898 | 100.0% |
Occupancy by Ownership by Household Size in Enterprise
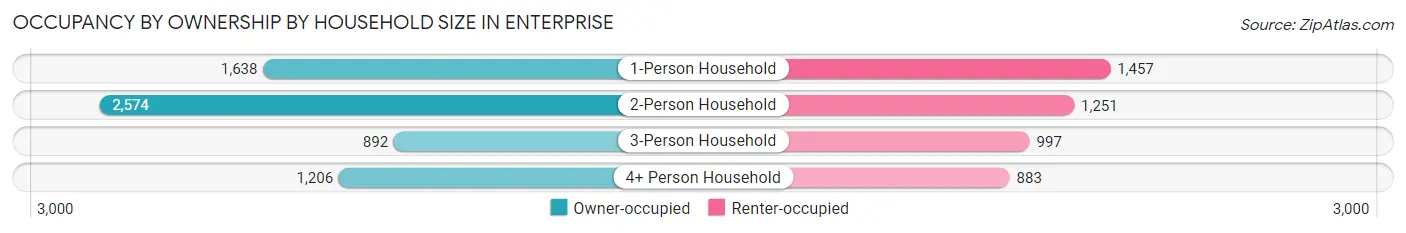
| Household Size | Owner-occupied | Renter-occupied |
| 1-Person Household | 1,638 (52.9%) | 1,457 (47.1%) |
| 2-Person Household | 2,574 (67.3%) | 1,251 (32.7%) |
| 3-Person Household | 892 (47.2%) | 997 (52.8%) |
| 4+ Person Household | 1,206 (57.7%) | 883 (42.3%) |
| Total Housing Units | 6,310 (57.9%) | 4,588 (42.1%) |
Occupancy by Educational Attainment in Enterprise
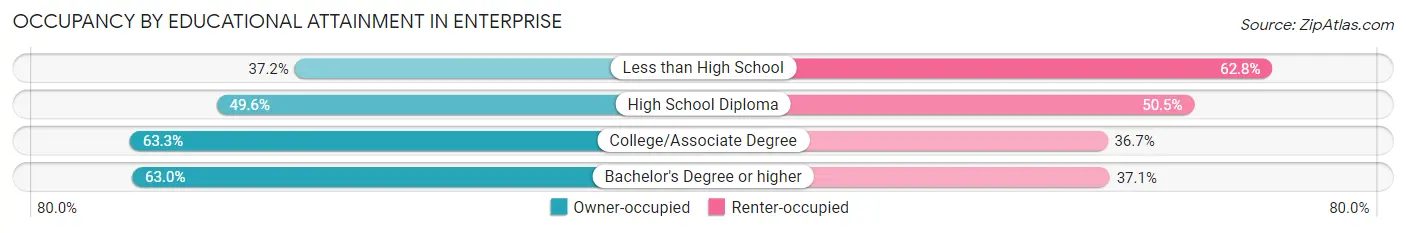
| Household Size | Owner-occupied | Renter-occupied |
| Less than High School | 384 (37.2%) | 649 (62.8%) |
| High School Diploma | 1,108 (49.5%) | 1,128 (50.4%) |
| College/Associate Degree | 2,769 (63.3%) | 1,605 (36.7%) |
| Bachelor's Degree or higher | 2,049 (62.9%) | 1,206 (37.0%) |
Occupancy by Age of Householder in Enterprise
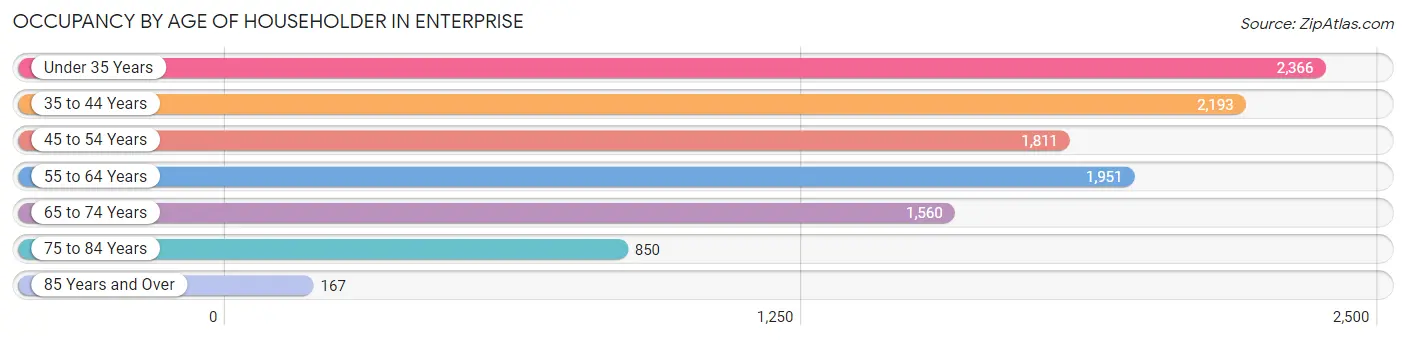
| Age Bracket | # Households | % Households |
| Under 35 Years | 2,366 | 21.7% |
| 35 to 44 Years | 2,193 | 20.1% |
| 45 to 54 Years | 1,811 | 16.6% |
| 55 to 64 Years | 1,951 | 17.9% |
| 65 to 74 Years | 1,560 | 14.3% |
| 75 to 84 Years | 850 | 7.8% |
| 85 Years and Over | 167 | 1.5% |
| Total | 10,898 | 100.0% |
Housing Finances in Enterprise
Median Income by Occupancy in Enterprise
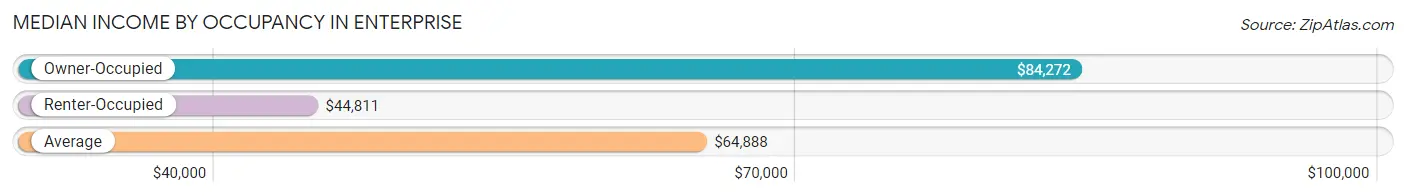
| Occupancy Type | # Households | Median Income |
| Owner-Occupied | 6,310 (57.9%) | $84,272 |
| Renter-Occupied | 4,588 (42.1%) | $44,811 |
| Average | 10,898 (100.0%) | $64,888 |
Occupancy by Householder Income Bracket in Enterprise
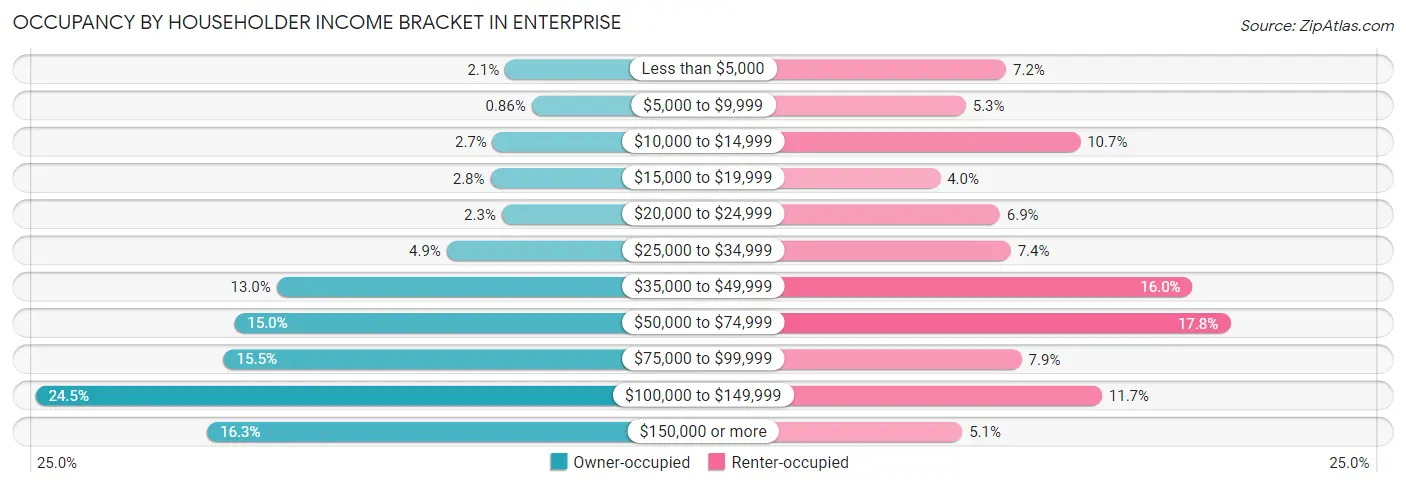
| Income Bracket | Owner-occupied | Renter-occupied |
| Less than $5,000 | 134 (2.1%) | 329 (7.2%) |
| $5,000 to $9,999 | 54 (0.9%) | 241 (5.2%) |
| $10,000 to $14,999 | 171 (2.7%) | 491 (10.7%) |
| $15,000 to $19,999 | 178 (2.8%) | 185 (4.0%) |
| $20,000 to $24,999 | 144 (2.3%) | 315 (6.9%) |
| $25,000 to $34,999 | 309 (4.9%) | 339 (7.4%) |
| $35,000 to $49,999 | 820 (13.0%) | 736 (16.0%) |
| $50,000 to $74,999 | 947 (15.0%) | 818 (17.8%) |
| $75,000 to $99,999 | 979 (15.5%) | 363 (7.9%) |
| $100,000 to $149,999 | 1,545 (24.5%) | 538 (11.7%) |
| $150,000 or more | 1,029 (16.3%) | 233 (5.1%) |
| Total | 6,310 (100.0%) | 4,588 (100.0%) |
Monthly Housing Cost Tiers in Enterprise
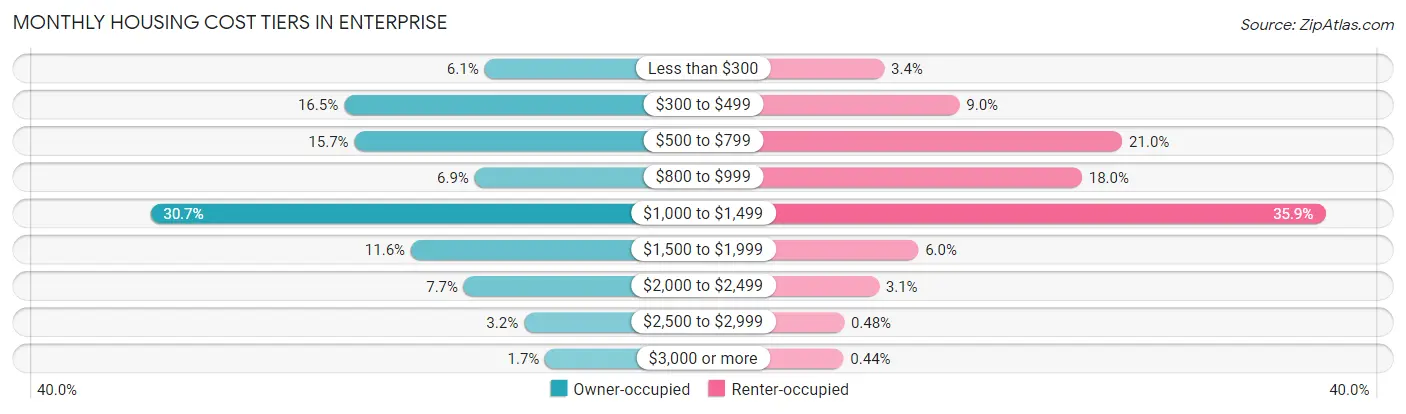
| Monthly Cost | Owner-occupied | Renter-occupied |
| Less than $300 | 387 (6.1%) | 158 (3.4%) |
| $300 to $499 | 1,040 (16.5%) | 412 (9.0%) |
| $500 to $799 | 991 (15.7%) | 962 (21.0%) |
| $800 to $999 | 432 (6.9%) | 826 (18.0%) |
| $1,000 to $1,499 | 1,940 (30.7%) | 1,648 (35.9%) |
| $1,500 to $1,999 | 729 (11.6%) | 273 (5.9%) |
| $2,000 to $2,499 | 483 (7.6%) | 140 (3.0%) |
| $2,500 to $2,999 | 203 (3.2%) | 22 (0.5%) |
| $3,000 or more | 105 (1.7%) | 20 (0.4%) |
| Total | 6,310 (100.0%) | 4,588 (100.0%) |
Physical Housing Characteristics in Enterprise
Housing Structures in Enterprise
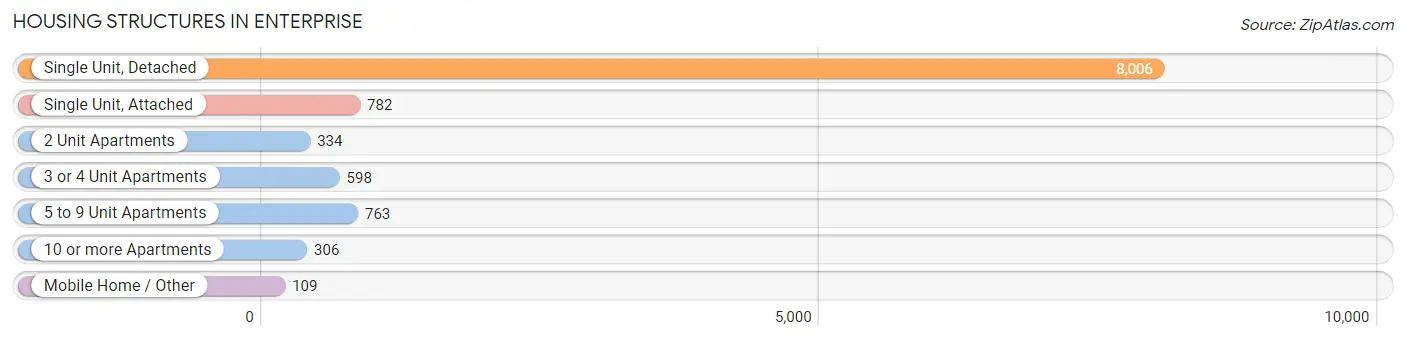
| Structure Type | # Housing Units | % Housing Units |
| Single Unit, Detached | 8,006 | 73.5% |
| Single Unit, Attached | 782 | 7.2% |
| 2 Unit Apartments | 334 | 3.1% |
| 3 or 4 Unit Apartments | 598 | 5.5% |
| 5 to 9 Unit Apartments | 763 | 7.0% |
| 10 or more Apartments | 306 | 2.8% |
| Mobile Home / Other | 109 | 1.0% |
| Total | 10,898 | 100.0% |
Housing Structures by Occupancy in Enterprise
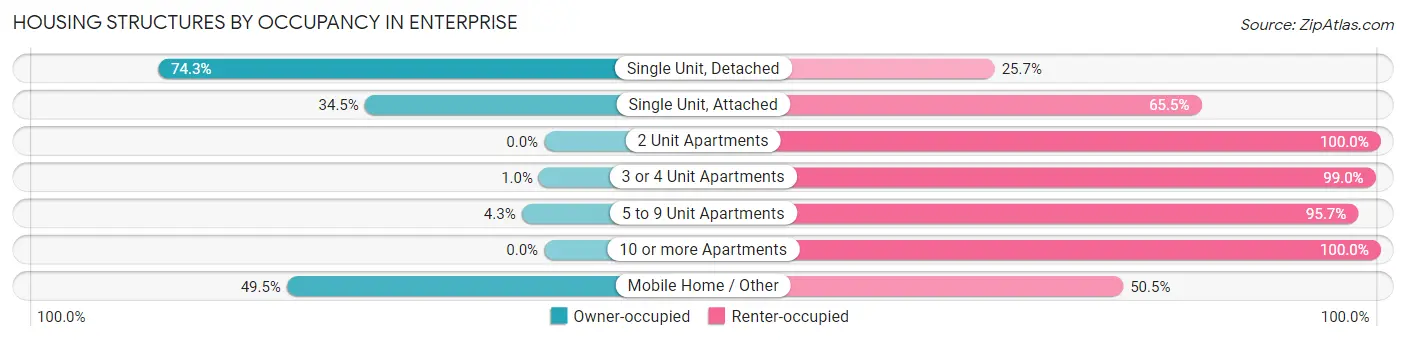
| Structure Type | Owner-occupied | Renter-occupied |
| Single Unit, Detached | 5,947 (74.3%) | 2,059 (25.7%) |
| Single Unit, Attached | 270 (34.5%) | 512 (65.5%) |
| 2 Unit Apartments | 0 (0.0%) | 334 (100.0%) |
| 3 or 4 Unit Apartments | 6 (1.0%) | 592 (99.0%) |
| 5 to 9 Unit Apartments | 33 (4.3%) | 730 (95.7%) |
| 10 or more Apartments | 0 (0.0%) | 306 (100.0%) |
| Mobile Home / Other | 54 (49.5%) | 55 (50.5%) |
| Total | 6,310 (57.9%) | 4,588 (42.1%) |
Housing Structures by Number of Rooms in Enterprise
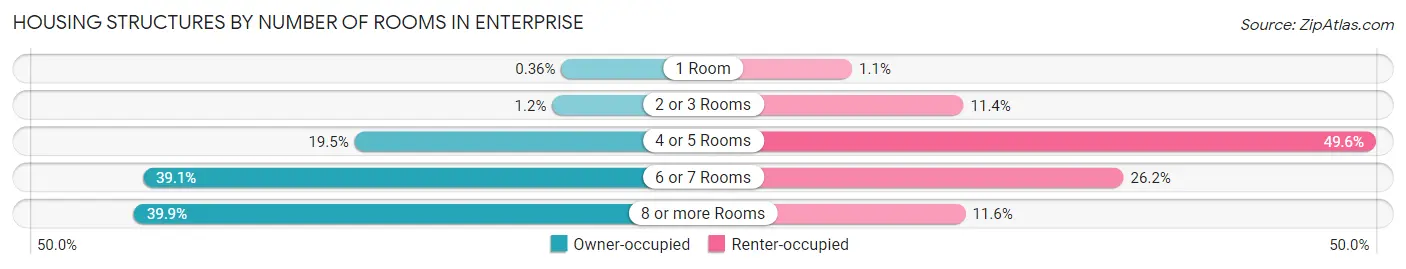
| Number of Rooms | Owner-occupied | Renter-occupied |
| 1 Room | 23 (0.4%) | 52 (1.1%) |
| 2 or 3 Rooms | 76 (1.2%) | 525 (11.4%) |
| 4 or 5 Rooms | 1,230 (19.5%) | 2,274 (49.6%) |
| 6 or 7 Rooms | 2,464 (39.1%) | 1,204 (26.2%) |
| 8 or more Rooms | 2,517 (39.9%) | 533 (11.6%) |
| Total | 6,310 (100.0%) | 4,588 (100.0%) |
Housing Structure by Heating Type in Enterprise
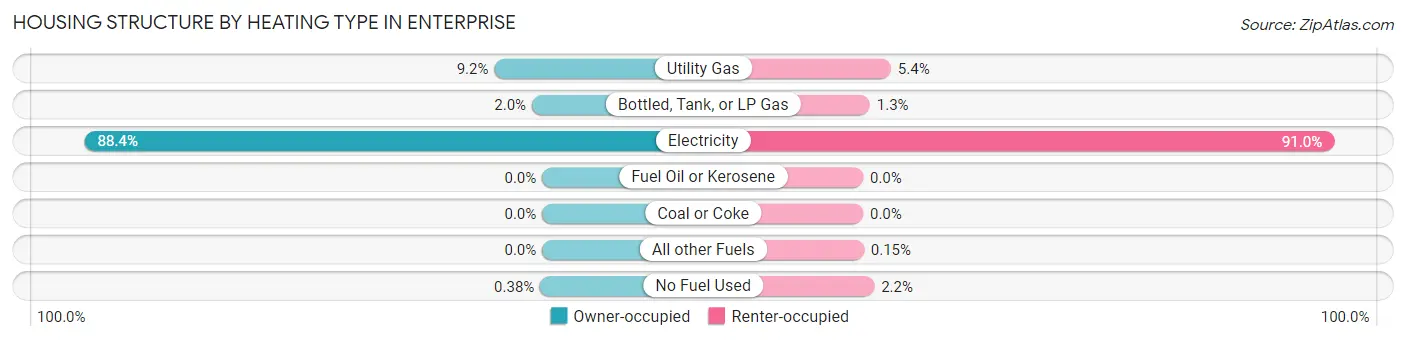
| Heating Type | Owner-occupied | Renter-occupied |
| Utility Gas | 583 (9.2%) | 247 (5.4%) |
| Bottled, Tank, or LP Gas | 124 (2.0%) | 60 (1.3%) |
| Electricity | 5,579 (88.4%) | 4,175 (91.0%) |
| Fuel Oil or Kerosene | 0 (0.0%) | 0 (0.0%) |
| Coal or Coke | 0 (0.0%) | 0 (0.0%) |
| All other Fuels | 0 (0.0%) | 7 (0.2%) |
| No Fuel Used | 24 (0.4%) | 99 (2.2%) |
| Total | 6,310 (100.0%) | 4,588 (100.0%) |
Household Vehicle Usage in Enterprise
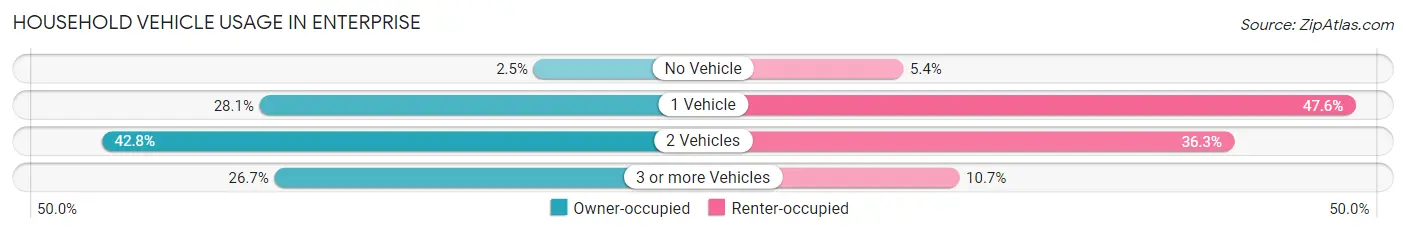
| Vehicles per Household | Owner-occupied | Renter-occupied |
| No Vehicle | 156 (2.5%) | 249 (5.4%) |
| 1 Vehicle | 1,770 (28.1%) | 2,185 (47.6%) |
| 2 Vehicles | 2,701 (42.8%) | 1,665 (36.3%) |
| 3 or more Vehicles | 1,683 (26.7%) | 489 (10.7%) |
| Total | 6,310 (100.0%) | 4,588 (100.0%) |
Real Estate & Mortgages in Enterprise
Real Estate and Mortgage Overview in Enterprise
| Characteristic | Without Mortgage | With Mortgage |
| Housing Units | 2,246 | 4,064 |
| Median Property Value | $180,100 | $194,900 |
| Median Household Income | $71,167 | $801 |
| Monthly Housing Costs | $426 | $105 |
| Real Estate Taxes | $667 | $742 |
Property Value by Mortgage Status in Enterprise
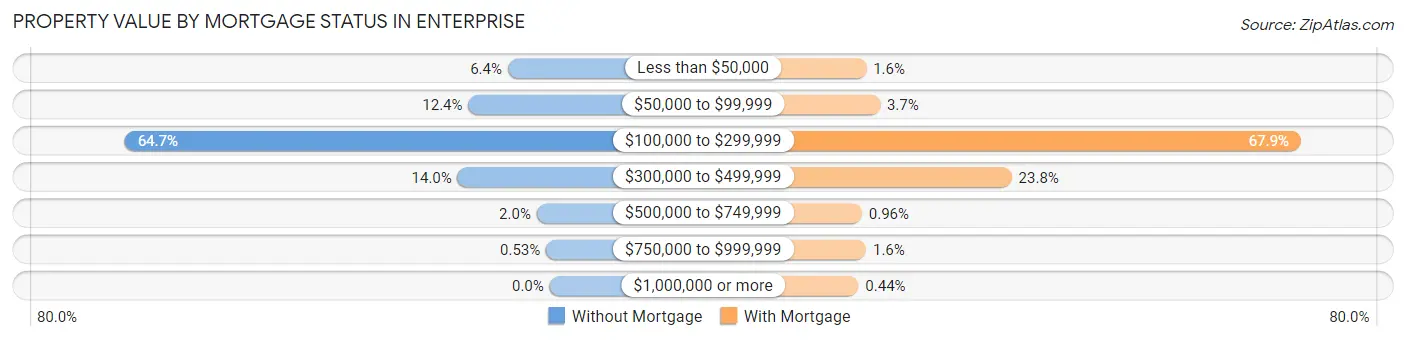
| Property Value | Without Mortgage | With Mortgage |
| Less than $50,000 | 143 (6.4%) | 66 (1.6%) |
| $50,000 to $99,999 | 278 (12.4%) | 151 (3.7%) |
| $100,000 to $299,999 | 1,454 (64.7%) | 2,758 (67.9%) |
| $300,000 to $499,999 | 315 (14.0%) | 967 (23.8%) |
| $500,000 to $749,999 | 44 (2.0%) | 39 (1.0%) |
| $750,000 to $999,999 | 12 (0.5%) | 65 (1.6%) |
| $1,000,000 or more | 0 (0.0%) | 18 (0.4%) |
| Total | 2,246 (100.0%) | 4,064 (100.0%) |
Household Income by Mortgage Status in Enterprise
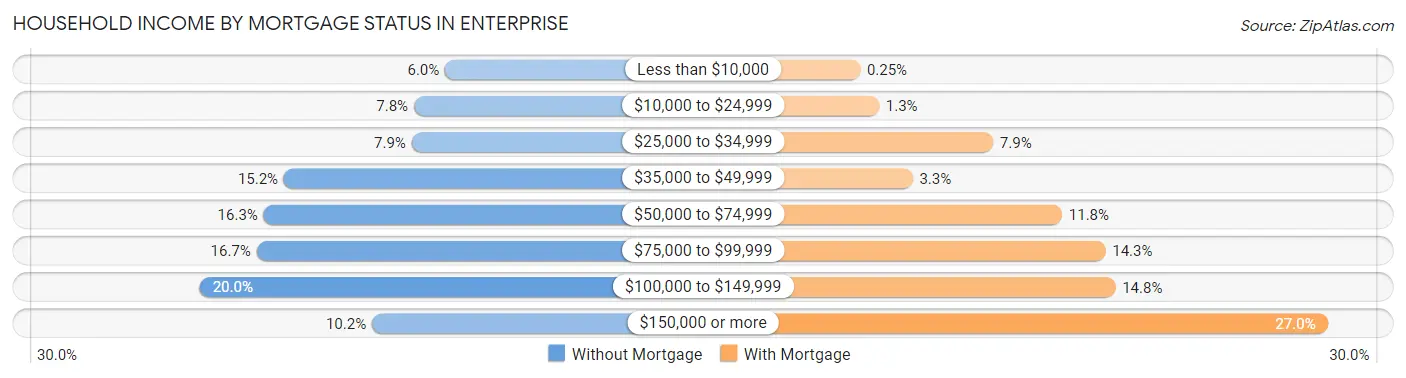
| Household Income | Without Mortgage | With Mortgage |
| Less than $10,000 | 134 (6.0%) | 10 (0.3%) |
| $10,000 to $24,999 | 174 (7.7%) | 54 (1.3%) |
| $25,000 to $34,999 | 177 (7.9%) | 319 (7.9%) |
| $35,000 to $49,999 | 341 (15.2%) | 132 (3.3%) |
| $50,000 to $74,999 | 367 (16.3%) | 479 (11.8%) |
| $75,000 to $99,999 | 376 (16.7%) | 580 (14.3%) |
| $100,000 to $149,999 | 449 (20.0%) | 603 (14.8%) |
| $150,000 or more | 228 (10.2%) | 1,096 (27.0%) |
| Total | 2,246 (100.0%) | 4,064 (100.0%) |
Property Value to Household Income Ratio in Enterprise
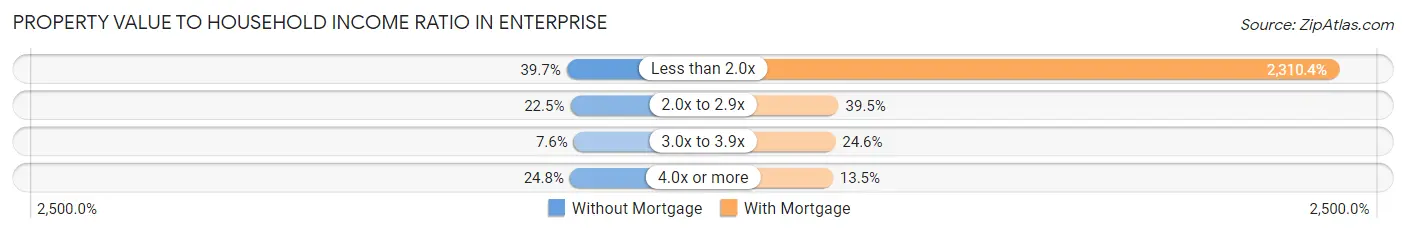
| Value-to-Income Ratio | Without Mortgage | With Mortgage |
| Less than 2.0x | 891 (39.7%) | 93,893 (2,310.4%) |
| 2.0x to 2.9x | 506 (22.5%) | 1,606 (39.5%) |
| 3.0x to 3.9x | 170 (7.6%) | 999 (24.6%) |
| 4.0x or more | 558 (24.8%) | 547 (13.5%) |
| Total | 2,246 (100.0%) | 4,064 (100.0%) |
Real Estate Taxes by Mortgage Status in Enterprise
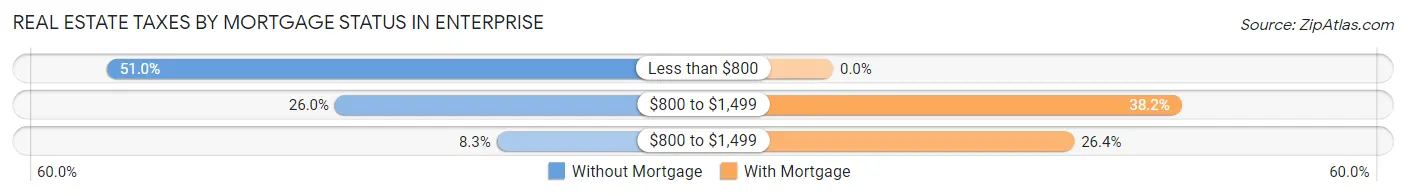
| Property Taxes | Without Mortgage | With Mortgage |
| Less than $800 | 1,145 (51.0%) | 0 (0.0%) |
| $800 to $1,499 | 584 (26.0%) | 1,552 (38.2%) |
| $800 to $1,499 | 186 (8.3%) | 1,074 (26.4%) |
| Total | 2,246 (100.0%) | 4,064 (100.0%) |
Health & Disability in Enterprise
Health Insurance Coverage by Age in Enterprise
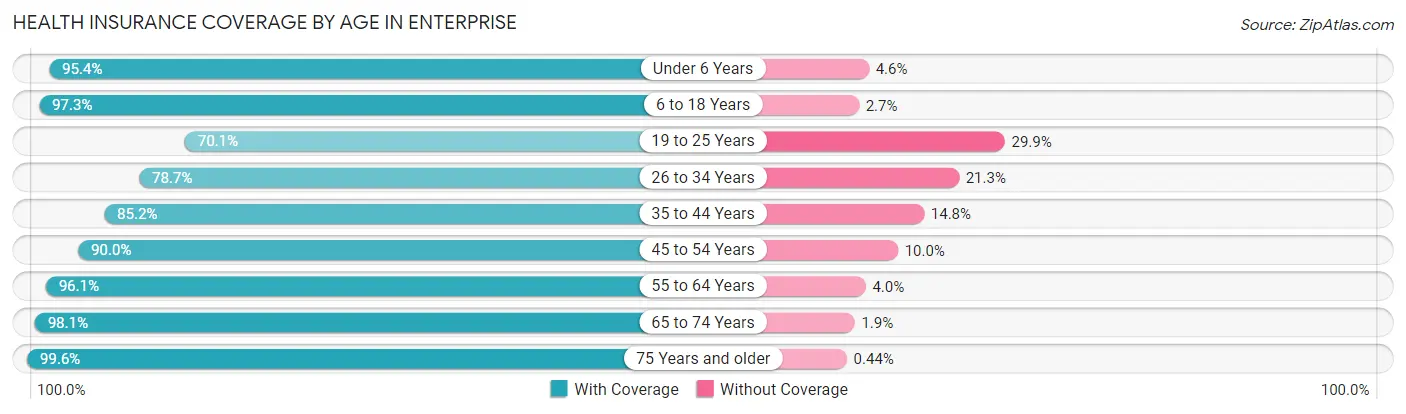
| Age Bracket | With Coverage | Without Coverage |
| Under 6 Years | 2,133 (95.4%) | 102 (4.6%) |
| 6 to 18 Years | 5,181 (97.3%) | 143 (2.7%) |
| 19 to 25 Years | 1,551 (70.1%) | 661 (29.9%) |
| 26 to 34 Years | 2,463 (78.7%) | 668 (21.3%) |
| 35 to 44 Years | 3,081 (85.2%) | 537 (14.8%) |
| 45 to 54 Years | 2,713 (90.0%) | 300 (10.0%) |
| 55 to 64 Years | 2,990 (96.1%) | 123 (4.0%) |
| 65 to 74 Years | 2,630 (98.1%) | 51 (1.9%) |
| 75 Years and older | 1,590 (99.6%) | 7 (0.4%) |
| Total | 24,332 (90.4%) | 2,592 (9.6%) |
Health Insurance Coverage by Citizenship Status in Enterprise
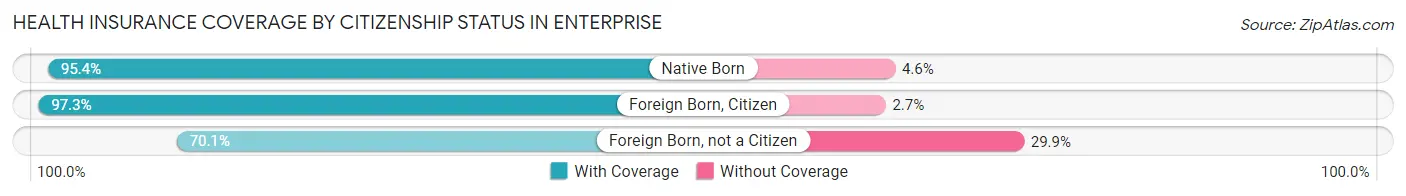
| Citizenship Status | With Coverage | Without Coverage |
| Native Born | 2,133 (95.4%) | 102 (4.6%) |
| Foreign Born, Citizen | 5,181 (97.3%) | 143 (2.7%) |
| Foreign Born, not a Citizen | 1,551 (70.1%) | 661 (29.9%) |
Health Insurance Coverage by Household Income in Enterprise
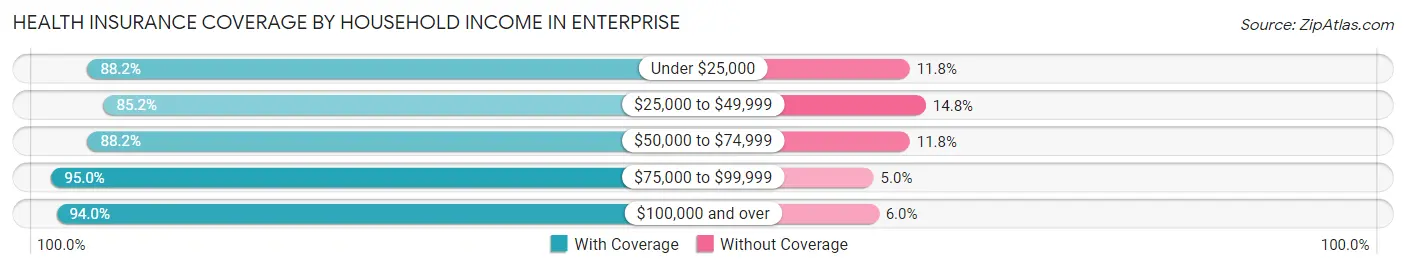
| Household Income | With Coverage | Without Coverage |
| Under $25,000 | 3,859 (88.2%) | 516 (11.8%) |
| $25,000 to $49,999 | 4,838 (85.2%) | 842 (14.8%) |
| $50,000 to $74,999 | 3,544 (88.2%) | 474 (11.8%) |
| $75,000 to $99,999 | 3,190 (95.0%) | 169 (5.0%) |
| $100,000 and over | 8,829 (94.0%) | 562 (6.0%) |
Public vs Private Health Insurance Coverage by Age in Enterprise
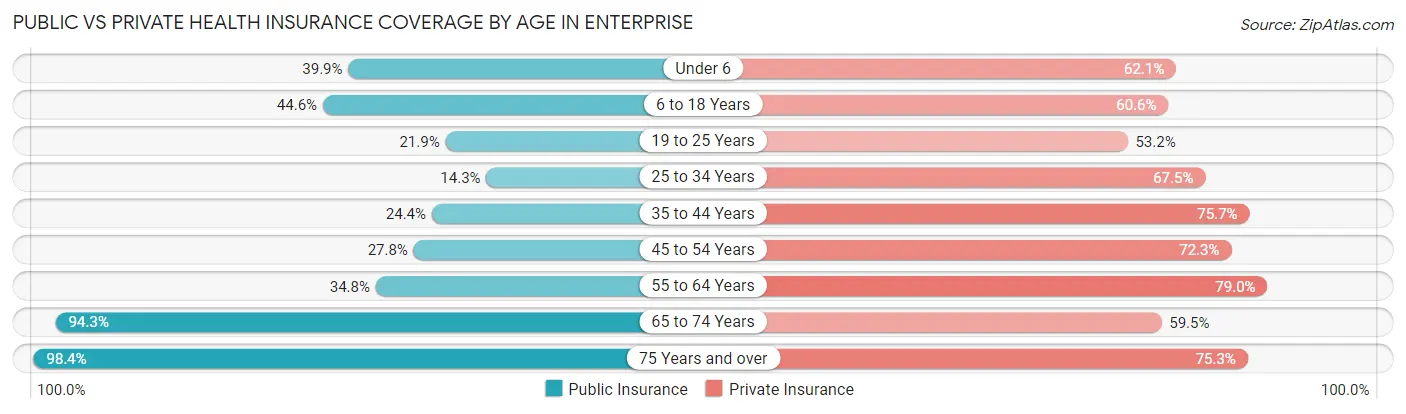
| Age Bracket | Public Insurance | Private Insurance |
| Under 6 | 892 (39.9%) | 1,387 (62.1%) |
| 6 to 18 Years | 2,376 (44.6%) | 3,227 (60.6%) |
| 19 to 25 Years | 484 (21.9%) | 1,177 (53.2%) |
| 25 to 34 Years | 447 (14.3%) | 2,112 (67.4%) |
| 35 to 44 Years | 883 (24.4%) | 2,737 (75.6%) |
| 45 to 54 Years | 837 (27.8%) | 2,178 (72.3%) |
| 55 to 64 Years | 1,084 (34.8%) | 2,459 (79.0%) |
| 65 to 74 Years | 2,527 (94.3%) | 1,595 (59.5%) |
| 75 Years and over | 1,571 (98.4%) | 1,203 (75.3%) |
| Total | 11,101 (41.2%) | 18,075 (67.1%) |
Disability Status by Sex by Age in Enterprise
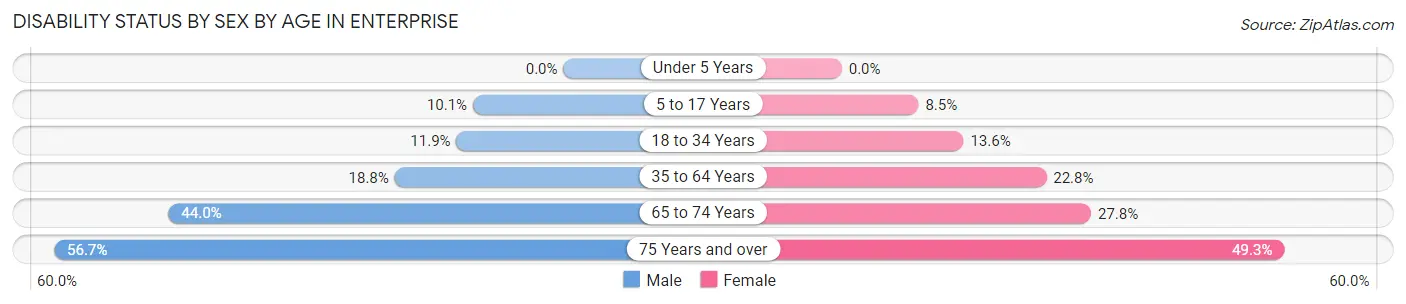
| Age Bracket | Male | Female |
| Under 5 Years | 0 (0.0%) | 0 (0.0%) |
| 5 to 17 Years | 269 (10.1%) | 214 (8.5%) |
| 18 to 34 Years | 318 (11.9%) | 408 (13.6%) |
| 35 to 64 Years | 797 (18.8%) | 1,253 (22.8%) |
| 65 to 74 Years | 577 (44.0%) | 380 (27.8%) |
| 75 Years and over | 359 (56.7%) | 475 (49.3%) |
Disability Class by Sex by Age in Enterprise
Disability Class: Hearing Difficulty
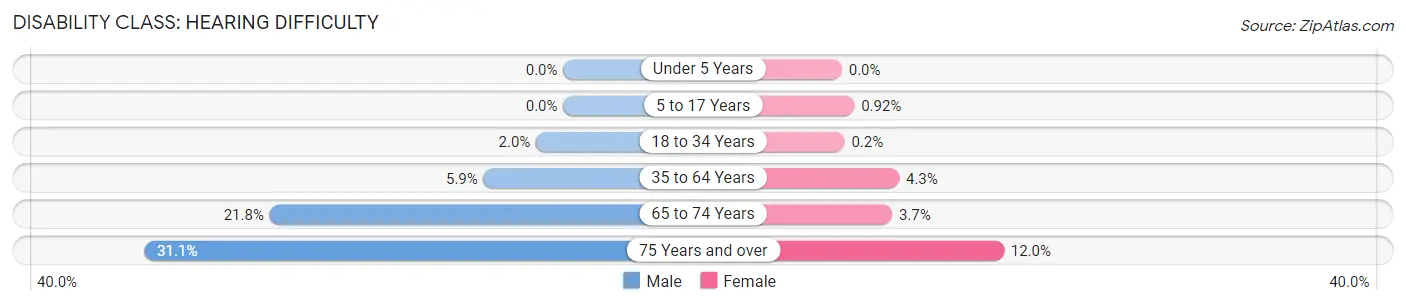
| Age Bracket | Male | Female |
| Under 5 Years | 0 (0.0%) | 0 (0.0%) |
| 5 to 17 Years | 0 (0.0%) | 23 (0.9%) |
| 18 to 34 Years | 54 (2.0%) | 6 (0.2%) |
| 35 to 64 Years | 251 (5.9%) | 234 (4.3%) |
| 65 to 74 Years | 286 (21.8%) | 51 (3.7%) |
| 75 Years and over | 197 (31.1%) | 116 (12.0%) |
Disability Class: Vision Difficulty
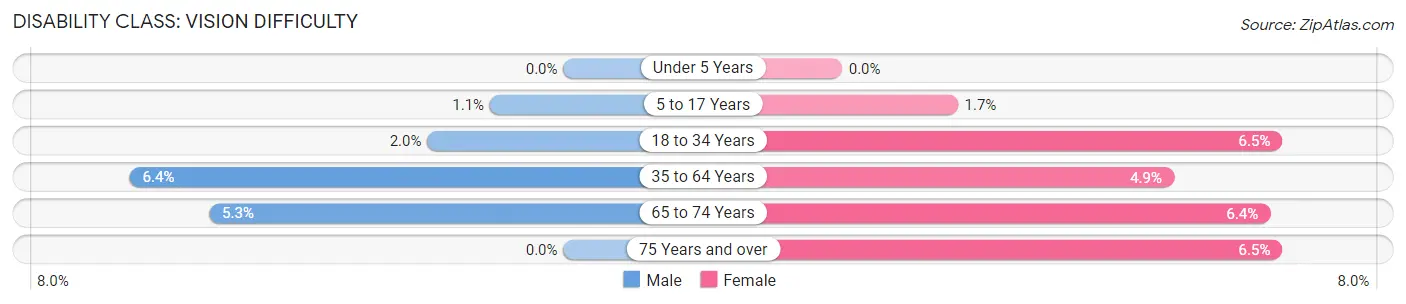
| Age Bracket | Male | Female |
| Under 5 Years | 0 (0.0%) | 0 (0.0%) |
| 5 to 17 Years | 29 (1.1%) | 43 (1.7%) |
| 18 to 34 Years | 54 (2.0%) | 197 (6.5%) |
| 35 to 64 Years | 273 (6.4%) | 271 (4.9%) |
| 65 to 74 Years | 69 (5.3%) | 87 (6.4%) |
| 75 Years and over | 0 (0.0%) | 63 (6.5%) |
Disability Class: Cognitive Difficulty
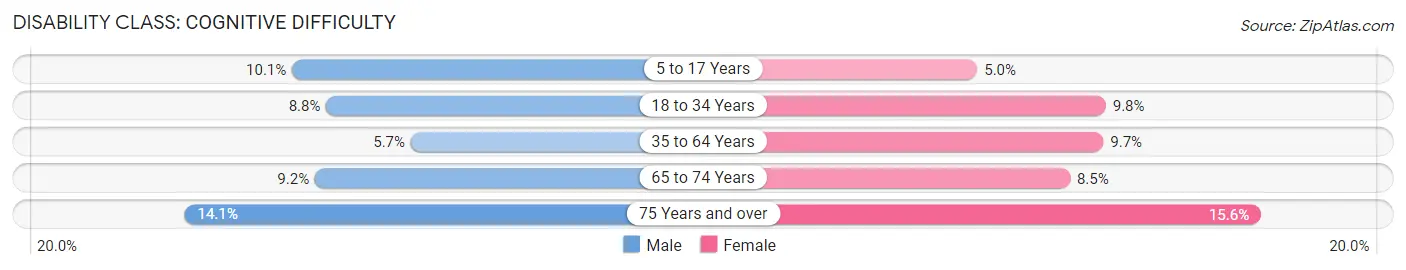
| Age Bracket | Male | Female |
| 5 to 17 Years | 269 (10.1%) | 126 (5.0%) |
| 18 to 34 Years | 235 (8.8%) | 295 (9.8%) |
| 35 to 64 Years | 240 (5.7%) | 534 (9.7%) |
| 65 to 74 Years | 121 (9.2%) | 116 (8.5%) |
| 75 Years and over | 89 (14.1%) | 150 (15.6%) |
Disability Class: Ambulatory Difficulty
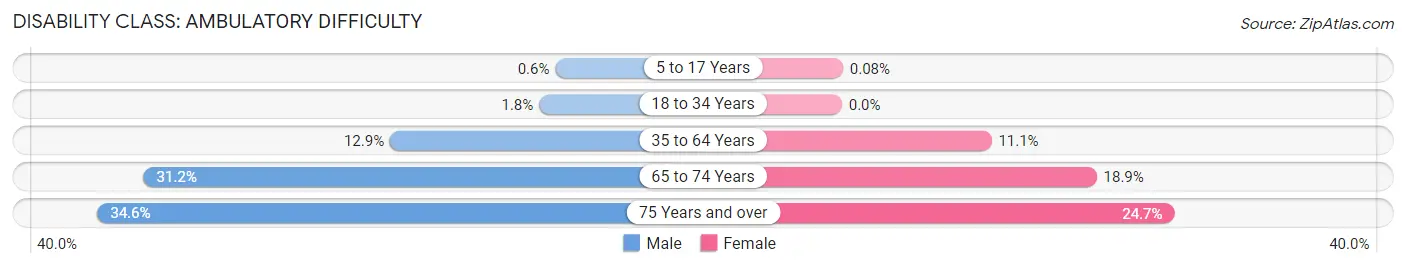
| Age Bracket | Male | Female |
| 5 to 17 Years | 16 (0.6%) | 2 (0.1%) |
| 18 to 34 Years | 48 (1.8%) | 0 (0.0%) |
| 35 to 64 Years | 546 (12.9%) | 611 (11.1%) |
| 65 to 74 Years | 409 (31.2%) | 259 (18.9%) |
| 75 Years and over | 219 (34.6%) | 238 (24.7%) |
Disability Class: Self-Care Difficulty
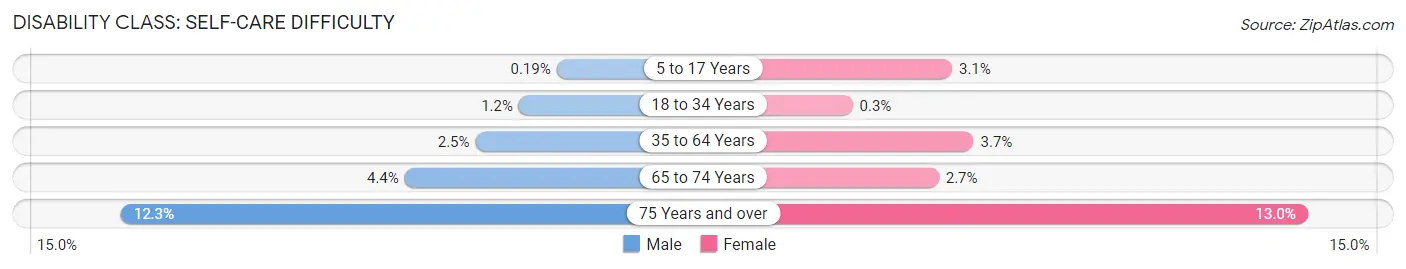
| Age Bracket | Male | Female |
| 5 to 17 Years | 5 (0.2%) | 77 (3.1%) |
| 18 to 34 Years | 33 (1.2%) | 9 (0.3%) |
| 35 to 64 Years | 104 (2.5%) | 202 (3.7%) |
| 65 to 74 Years | 58 (4.4%) | 37 (2.7%) |
| 75 Years and over | 78 (12.3%) | 125 (13.0%) |
Technology Access in Enterprise
Computing Device Access in Enterprise
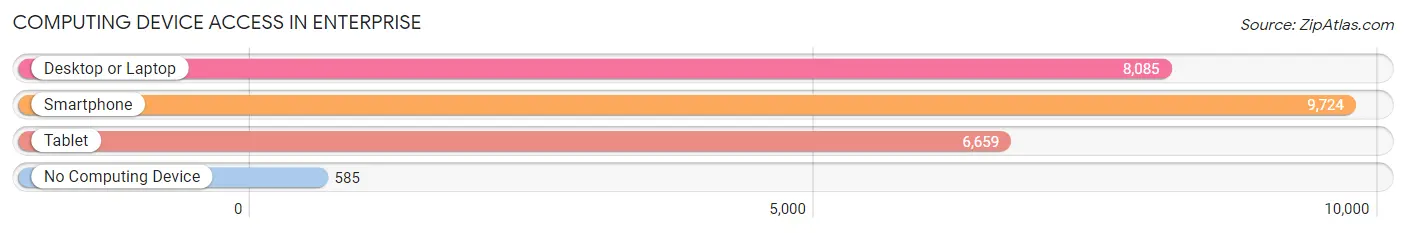
| Device Type | # Households | % Households |
| Desktop or Laptop | 8,085 | 74.2% |
| Smartphone | 9,724 | 89.2% |
| Tablet | 6,659 | 61.1% |
| No Computing Device | 585 | 5.4% |
| Total | 10,898 | 100.0% |
Internet Access in Enterprise
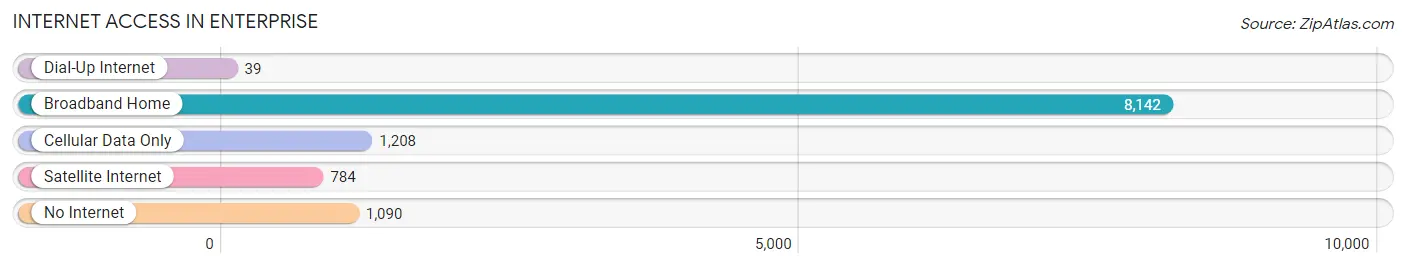
| Internet Type | # Households | % Households |
| Dial-Up Internet | 39 | 0.4% |
| Broadband Home | 8,142 | 74.7% |
| Cellular Data Only | 1,208 | 11.1% |
| Satellite Internet | 784 | 7.2% |
| No Internet | 1,090 | 10.0% |
| Total | 10,898 | 100.0% |
Enterprise Summary
Enterprise, Alabama is a city located in Coffee County, Alabama, United States. It is the county seat of Coffee County and is located in the southeastern part of the state. The city is situated along the banks of the Choctawhatchee River and is home to approximately 26,562 people as of the 2010 census.
History
The area that is now Enterprise was first settled in the early 1800s by settlers from Georgia and the Carolinas. The city was originally known as Taylor’s Crossroads, named after the local postmaster, John Taylor. In 1881, the town was renamed Enterprise after the nearby Enterprise Cotton Mill. The mill was built in 1881 and was the first cotton mill in the area.
The city was officially incorporated in 1882 and quickly became a major center for the cotton industry. The city was also home to several other industries, including lumber, turpentine, and brick manufacturing.
In the early 1900s, the city experienced a period of growth and development. The city was home to several schools, churches, and businesses. The city also had a railroad line that connected it to other cities in the region.
In the late 1950s, the city experienced a period of decline as the cotton industry began to decline. The city’s population decreased and many businesses closed. However, in the late 1970s, the city began to experience a period of revitalization. The city was home to several new businesses and industries, including a paper mill and a furniture factory.
Geography
Enterprise is located in southeastern Alabama, approximately 30 miles west of Dothan and 60 miles south of Montgomery. The city is situated along the banks of the Choctawhatchee River and is surrounded by rolling hills and forests. The city has a total area of 16.2 square miles, of which 16.1 square miles is land and 0.1 square miles is water.
Economy
The economy of Enterprise is largely based on manufacturing and agriculture. The city is home to several manufacturing companies, including a paper mill, a furniture factory, and a plastics factory. The city is also home to several agricultural businesses, including cotton farms, poultry farms, and cattle farms.
The city is also home to several retail stores, restaurants, and other businesses. The city is also home to several educational institutions, including Enterprise State Community College and Troy University.
Demographics
As of the 2010 census, the population of Enterprise was 26,562. The racial makeup of the city was 73.3% White, 22.2% African American, 0.4% Native American, 0.7% Asian, 0.1% Pacific Islander, 1.7% from other races, and 1.6% from two or more races. Hispanic or Latino of any race were 3.3% of the population.
The median income for a household in the city was $35,945 and the median income for a family was $44,945. The per capita income for the city was $19,945. About 17.2% of the population was below the poverty line.
Enterprise is a city with a rich history and a bright future. The city is home to several businesses and industries and is a great place to live and work. The city is also home to several educational institutions and is a great place to raise a family.
Common Questions
What is Per Capita Income in Enterprise?
Per Capita income in Enterprise is $31,358.
What is the Median Family Income in Enterprise?
Median Family Income in Enterprise is $75,106.
What is the Median Household income in Enterprise?
Median Household Income in Enterprise is $64,888.
What is Income or Wage Gap in Enterprise?
Income or Wage Gap in Enterprise is 52.8%.
Women in Enterprise earn 47.2 cents for every dollar earned by a man.
What is Family Income Deficit in Enterprise?
Family Income Deficit in Enterprise is $10,331.
Families that are below poverty line in Enterprise earn $10,331 less on average than the poverty threshold level.
What is Inequality or Gini Index in Enterprise?
Inequality or Gini Index in Enterprise is 0.42.
What is the Total Population of Enterprise?
Total Population of Enterprise is 28,513.
What is the Total Male Population of Enterprise?
Total Male Population of Enterprise is 14,048.
What is the Total Female Population of Enterprise?
Total Female Population of Enterprise is 14,465.
What is the Ratio of Males per 100 Females in Enterprise?
There are 97.12 Males per 100 Females in Enterprise.
What is the Ratio of Females per 100 Males in Enterprise?
There are 102.97 Females per 100 Males in Enterprise.
What is the Median Population Age in Enterprise?
Median Population Age in Enterprise is 36.0 Years.
What is the Average Family Size in Enterprise
Average Family Size in Enterprise is 3.2 People.
What is the Average Household Size in Enterprise
Average Household Size in Enterprise is 2.6 People.
How Large is the Labor Force in Enterprise?
There are 12,782 People in the Labor Forcein in Enterprise.
What is the Percentage of People in the Labor Force in Enterprise?
58.0% of People are in the Labor Force in Enterprise.
What is the Unemployment Rate in Enterprise?
Unemployment Rate in Enterprise is 4.1%.