Rainbow City, AL Map & Demographics
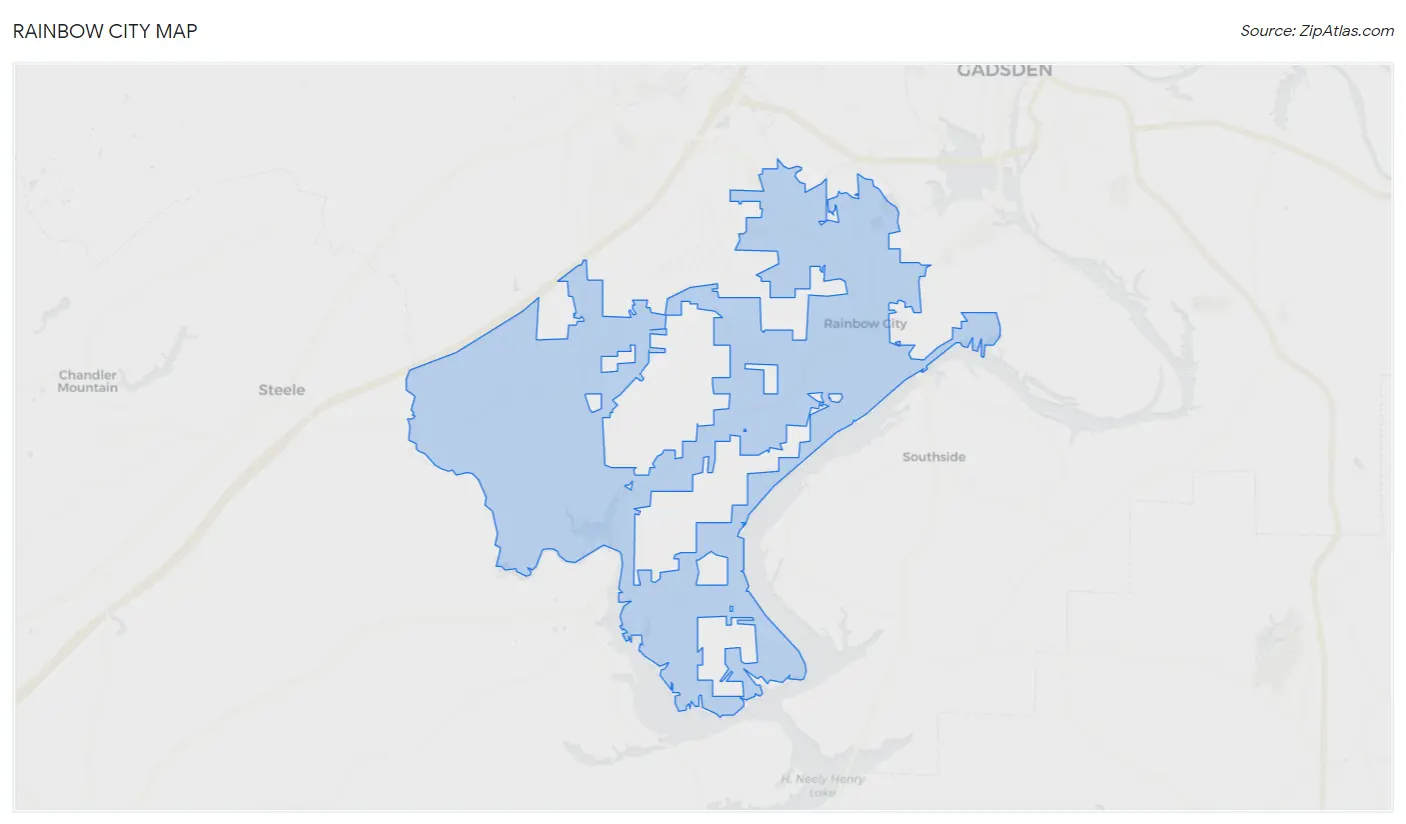
Rainbow City Map
Rainbow City Overview
$34,622
PER CAPITA INCOME
$86,037
AVG FAMILY INCOME
$60,260
AVG HOUSEHOLD INCOME
31.5%
WAGE / INCOME GAP [ % ]
68.5¢/ $1
WAGE / INCOME GAP [ $ ]
$10,744
FAMILY INCOME DEFICIT
0.45
INEQUALITY / GINI INDEX
10,184
TOTAL POPULATION
4,304
MALE POPULATION
5,880
FEMALE POPULATION
73.20
MALES / 100 FEMALES
136.62
FEMALES / 100 MALES
41.0
MEDIAN AGE
3.2
AVG FAMILY SIZE
2.6
AVG HOUSEHOLD SIZE
4,773
LABOR FORCE [ PEOPLE ]
58.8%
PERCENT IN LABOR FORCE
8.3%
UNEMPLOYMENT RATE
Rainbow City Zip Codes
Rainbow City Area Codes
Income in Rainbow City
Income Overview in Rainbow City
Per Capita Income in Rainbow City is $34,622, while median incomes of families and households are $86,037 and $60,260 respectively.
| Characteristic | Number | Measure |
| Per Capita Income | 10,184 | $34,622 |
| Median Family Income | 2,738 | $86,037 |
| Mean Family Income | 2,738 | $103,147 |
| Median Household Income | 3,908 | $60,260 |
| Mean Household Income | 3,908 | $85,378 |
| Income Deficit | 2,738 | $10,744 |
| Wage / Income Gap (%) | 10,184 | 31.54% |
| Wage / Income Gap ($) | 10,184 | 68.46¢ per $1 |
| Gini / Inequality Index | 10,184 | 0.45 |
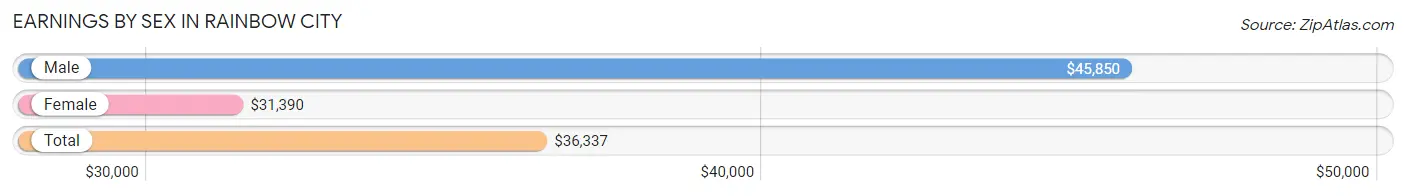
Earnings by Sex in Rainbow City
Average Earnings in Rainbow City are $36,337, $45,850 for men and $31,390 for women, a difference of 31.5%.
| Sex | Number | Average Earnings |
| Male | 2,418 (48.3%) | $45,850 |
| Female | 2,591 (51.7%) | $31,390 |
| Total | 5,009 (100.0%) | $36,337 |
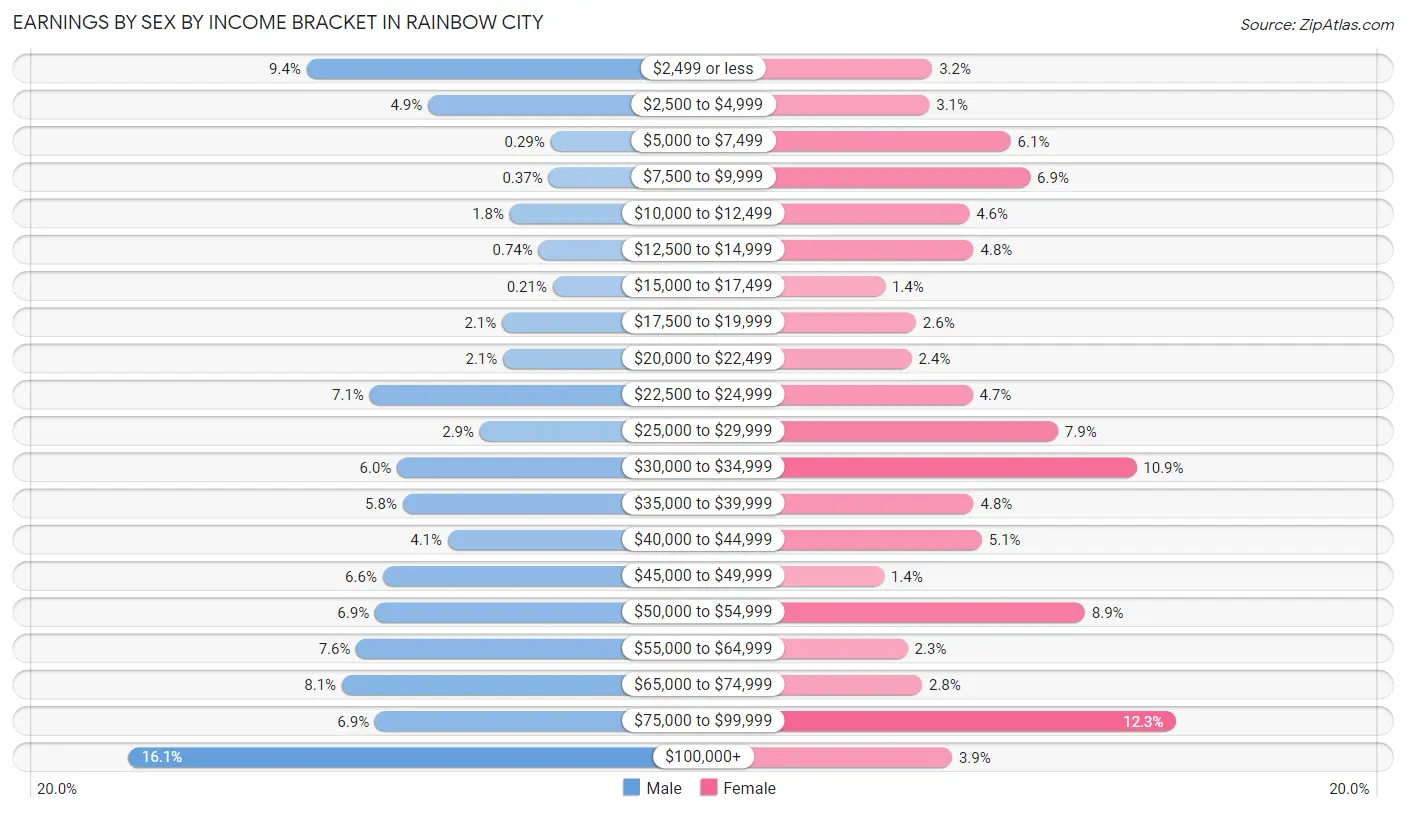
Earnings by Sex by Income Bracket in Rainbow City
The most common earnings brackets in Rainbow City are $100,000+ for men (389 | 16.1%) and $75,000 to $99,999 for women (319 | 12.3%).
| Income | Male | Female |
| $2,499 or less | 228 (9.4%) | 83 (3.2%) |
| $2,500 to $4,999 | 118 (4.9%) | 80 (3.1%) |
| $5,000 to $7,499 | 7 (0.3%) | 159 (6.1%) |
| $7,500 to $9,999 | 9 (0.4%) | 178 (6.9%) |
| $10,000 to $12,499 | 44 (1.8%) | 119 (4.6%) |
| $12,500 to $14,999 | 18 (0.7%) | 123 (4.8%) |
| $15,000 to $17,499 | 5 (0.2%) | 37 (1.4%) |
| $17,500 to $19,999 | 51 (2.1%) | 67 (2.6%) |
| $20,000 to $22,499 | 50 (2.1%) | 63 (2.4%) |
| $22,500 to $24,999 | 171 (7.1%) | 122 (4.7%) |
| $25,000 to $29,999 | 71 (2.9%) | 205 (7.9%) |
| $30,000 to $34,999 | 146 (6.0%) | 281 (10.8%) |
| $35,000 to $39,999 | 141 (5.8%) | 123 (4.8%) |
| $40,000 to $44,999 | 100 (4.1%) | 131 (5.1%) |
| $45,000 to $49,999 | 159 (6.6%) | 36 (1.4%) |
| $50,000 to $54,999 | 166 (6.9%) | 231 (8.9%) |
| $55,000 to $64,999 | 183 (7.6%) | 59 (2.3%) |
| $65,000 to $74,999 | 196 (8.1%) | 73 (2.8%) |
| $75,000 to $99,999 | 166 (6.9%) | 319 (12.3%) |
| $100,000+ | 389 (16.1%) | 102 (3.9%) |
| Total | 2,418 (100.0%) | 2,591 (100.0%) |
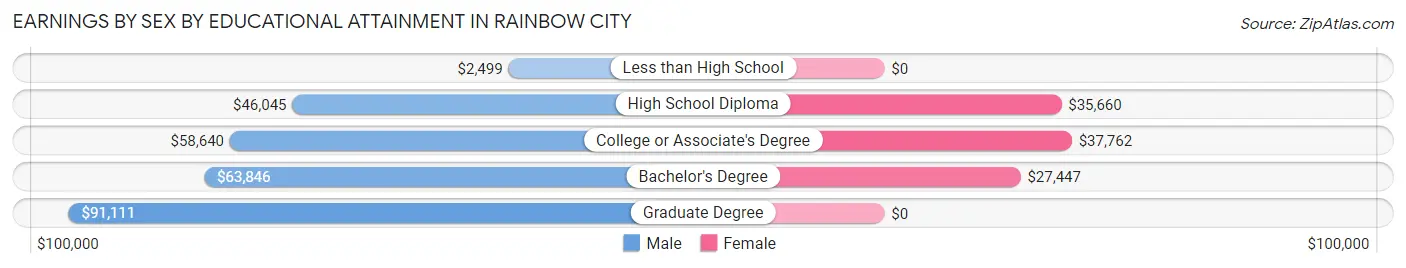
Earnings by Sex by Educational Attainment in Rainbow City
Average earnings in Rainbow City are $50,777 for men and $34,059 for women, a difference of 32.9%. Men with an educational attainment of graduate degree enjoy the highest average annual earnings of $91,111, while those with less than high school education earn the least with $2,499. Women with an educational attainment of college or associate's degree earn the most with the average annual earnings of $37,762, while those with bachelor's degree education have the smallest earnings of $27,447.
| Educational Attainment | Male Income | Female Income |
| Less than High School | $2,499 | $0 |
| High School Diploma | $46,045 | $35,660 |
| College or Associate's Degree | $58,640 | $37,762 |
| Bachelor's Degree | $63,846 | $27,447 |
| Graduate Degree | $91,111 | $0 |
| Total | $50,777 | $34,059 |
Family Income in Rainbow City
Family Income Brackets in Rainbow City
According to the Rainbow City family income data, there are 731 families falling into the $100,000 to $149,999 income range, which is the most common income bracket and makes up 26.7% of all families. Conversely, the less than $10,000 income bracket is the least frequent group with only 27 families (1.0%) belonging to this category.
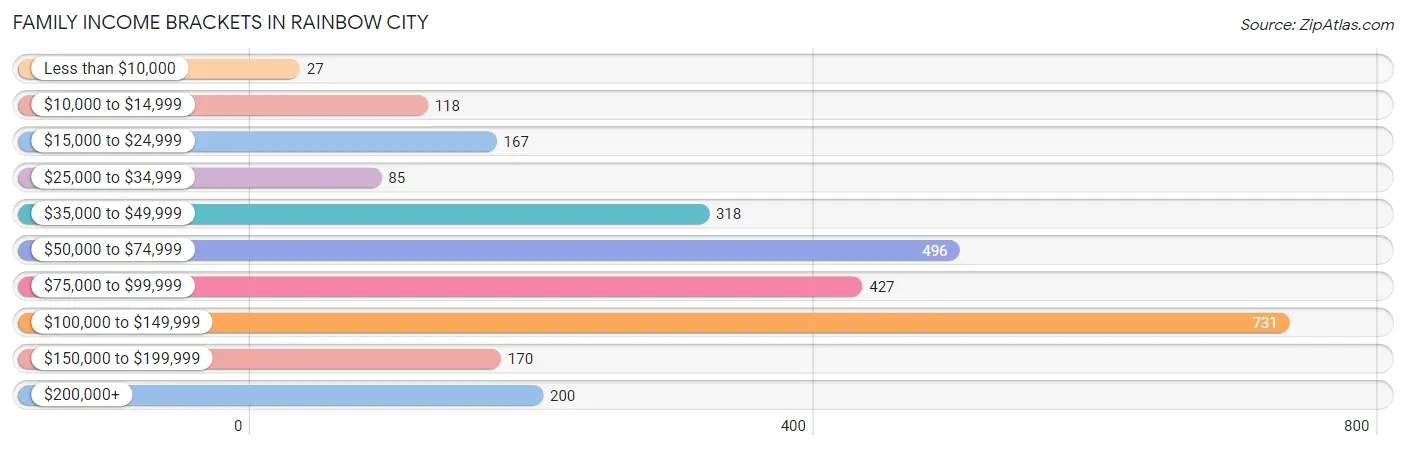
| Income Bracket | # Families | % Families |
| Less than $10,000 | 27 | 1.0% |
| $10,000 to $14,999 | 118 | 4.3% |
| $15,000 to $24,999 | 167 | 6.1% |
| $25,000 to $34,999 | 85 | 3.1% |
| $35,000 to $49,999 | 318 | 11.6% |
| $50,000 to $74,999 | 496 | 18.1% |
| $75,000 to $99,999 | 427 | 15.6% |
| $100,000 to $149,999 | 731 | 26.7% |
| $150,000 to $199,999 | 170 | 6.2% |
| $200,000+ | 200 | 7.3% |
Family Income by Famaliy Size in Rainbow City
3-person families (440 | 16.1%) account for the highest median family income in Rainbow City with $104,375 per family, while 2-person families (1,490 | 54.4%) have the highest median income of $37,467 per family member.
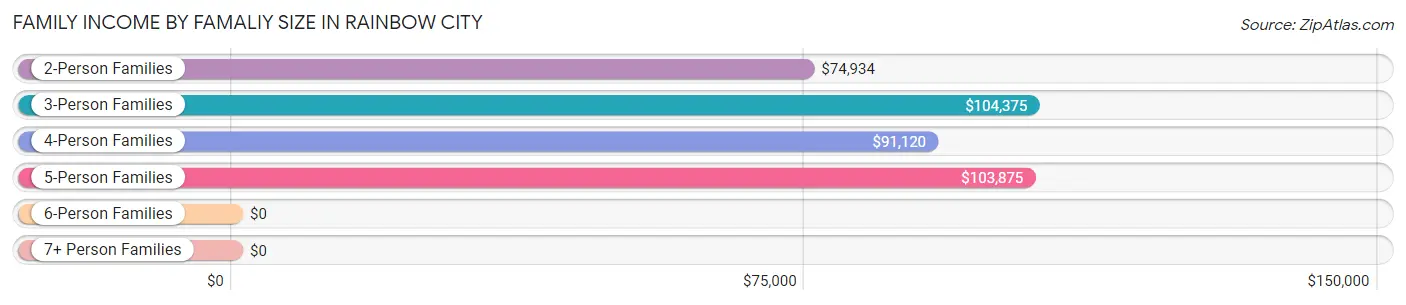
| Income Bracket | # Families | Median Income |
| 2-Person Families | 1,490 (54.4%) | $74,934 |
| 3-Person Families | 440 (16.1%) | $104,375 |
| 4-Person Families | 549 (20.1%) | $91,120 |
| 5-Person Families | 218 (8.0%) | $103,875 |
| 6-Person Families | 41 (1.5%) | $0 |
| 7+ Person Families | 0 (0.0%) | $0 |
| Total | 2,738 (100.0%) | $86,037 |
Family Income by Number of Earners in Rainbow City
The median family income in Rainbow City is $86,037, with families comprising 3+ earners (205) having the highest median family income of $118,455, while families with 1 earner (741) have the lowest median family income of $51,210, accounting for 7.5% and 27.1% of families, respectively.
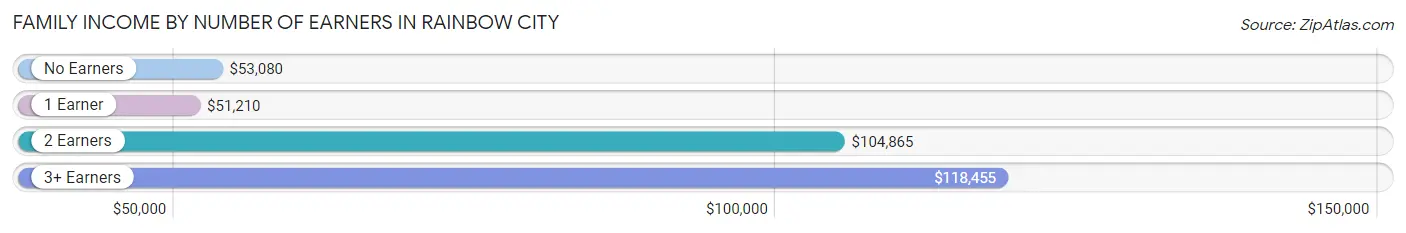
| Number of Earners | # Families | Median Income |
| No Earners | 573 (20.9%) | $53,080 |
| 1 Earner | 741 (27.1%) | $51,210 |
| 2 Earners | 1,219 (44.5%) | $104,865 |
| 3+ Earners | 205 (7.5%) | $118,455 |
| Total | 2,738 (100.0%) | $86,037 |
Household Income in Rainbow City
Household Income Brackets in Rainbow City
With 766 households falling in the category, the $100,000 to $149,999 income range is the most frequent in Rainbow City, accounting for 19.6% of all households. In contrast, only 74 households (1.9%) fall into the less than $10,000 income bracket, making it the least populous group.
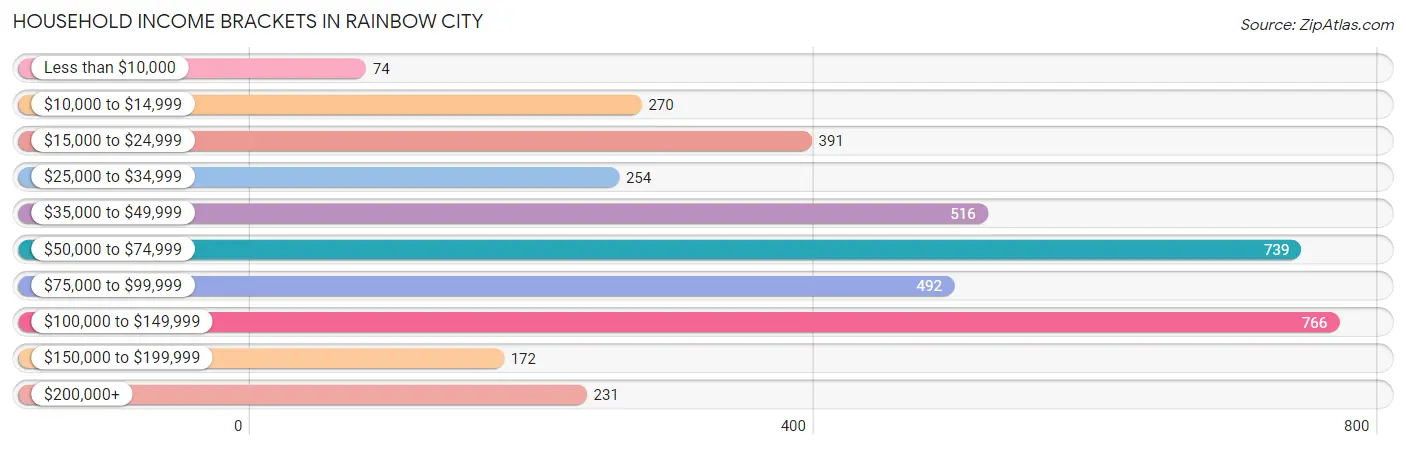
| Income Bracket | # Households | % Households |
| Less than $10,000 | 74 | 1.9% |
| $10,000 to $14,999 | 270 | 6.9% |
| $15,000 to $24,999 | 391 | 10.0% |
| $25,000 to $34,999 | 254 | 6.5% |
| $35,000 to $49,999 | 516 | 13.2% |
| $50,000 to $74,999 | 739 | 18.9% |
| $75,000 to $99,999 | 492 | 12.6% |
| $100,000 to $149,999 | 766 | 19.6% |
| $150,000 to $199,999 | 172 | 4.4% |
| $200,000+ | 231 | 5.9% |
Household Income by Householder Age in Rainbow City
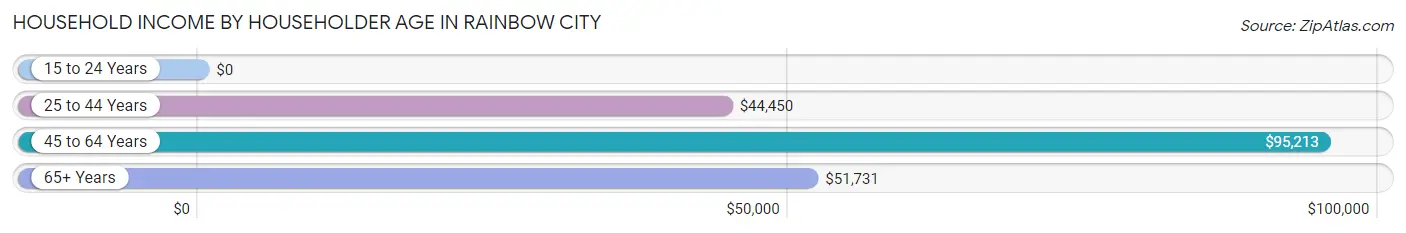
The median household income in Rainbow City is $60,260, with the highest median household income of $95,213 found in the 45 to 64 years age bracket for the primary householder. A total of 1,480 households (37.9%) fall into this category. Meanwhile, the 15 to 24 years age bracket for the primary householder has the lowest median household income of $0, with 194 households (5.0%) in this group.
| Income Bracket | # Households | Median Income |
| 15 to 24 Years | 194 (5.0%) | $0 |
| 25 to 44 Years | 924 (23.6%) | $44,450 |
| 45 to 64 Years | 1,480 (37.9%) | $95,213 |
| 65+ Years | 1,310 (33.5%) | $51,731 |
| Total | 3,908 (100.0%) | $60,260 |
Poverty in Rainbow City
Income Below Poverty by Sex and Age in Rainbow City
With 5.3% poverty level for males and 11.3% for females among the residents of Rainbow City, 16 and 17 year old males and under 5 year old females are the most vulnerable to poverty, with 17 males (100.0%) and 114 females (34.4%) in their respective age groups living below the poverty level.
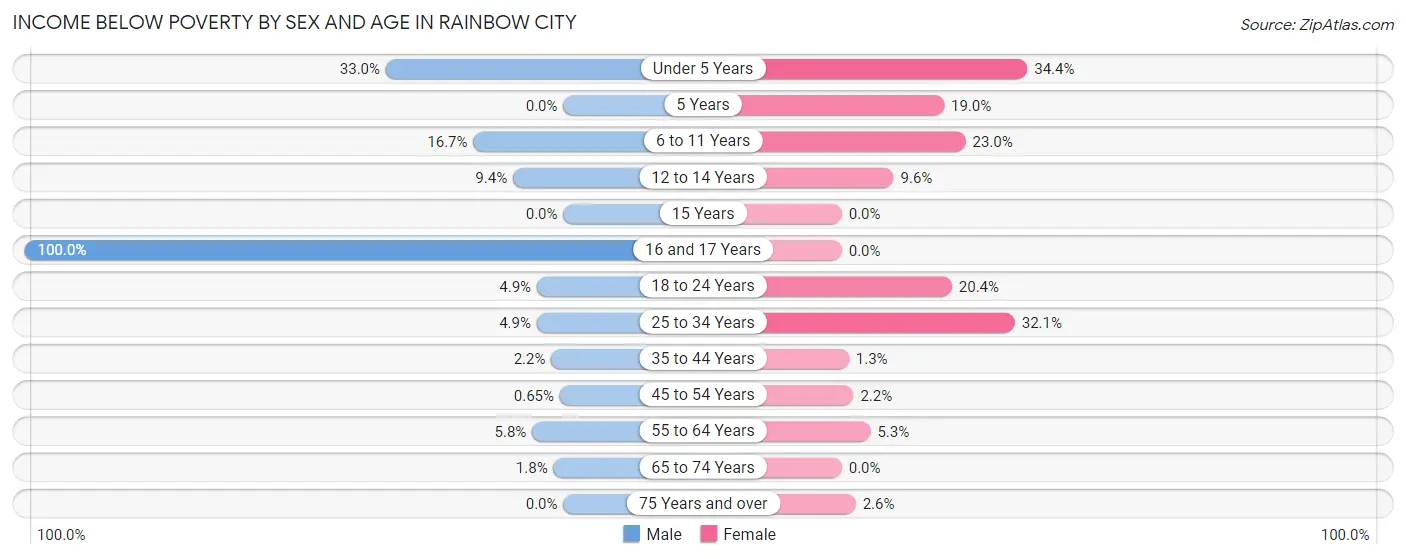
| Age Bracket | Male | Female |
| Under 5 Years | 29 (33.0%) | 114 (34.4%) |
| 5 Years | 0 (0.0%) | 15 (19.0%) |
| 6 to 11 Years | 77 (16.7%) | 85 (23.0%) |
| 12 to 14 Years | 10 (9.3%) | 46 (9.6%) |
| 15 Years | 0 (0.0%) | 0 (0.0%) |
| 16 and 17 Years | 17 (100.0%) | 0 (0.0%) |
| 18 to 24 Years | 17 (4.9%) | 85 (20.4%) |
| 25 to 34 Years | 34 (4.9%) | 244 (32.1%) |
| 35 to 44 Years | 10 (2.2%) | 7 (1.3%) |
| 45 to 54 Years | 6 (0.6%) | 17 (2.2%) |
| 55 to 64 Years | 19 (5.8%) | 39 (5.3%) |
| 65 to 74 Years | 8 (1.8%) | 0 (0.0%) |
| 75 Years and over | 0 (0.0%) | 14 (2.6%) |
| Total | 227 (5.3%) | 666 (11.3%) |
Income Above Poverty by Sex and Age in Rainbow City
According to the poverty statistics in Rainbow City, males aged 15 years and females aged 15 years are the age groups that are most secure financially, with 100.0% of males and 100.0% of females in these age groups living above the poverty line.
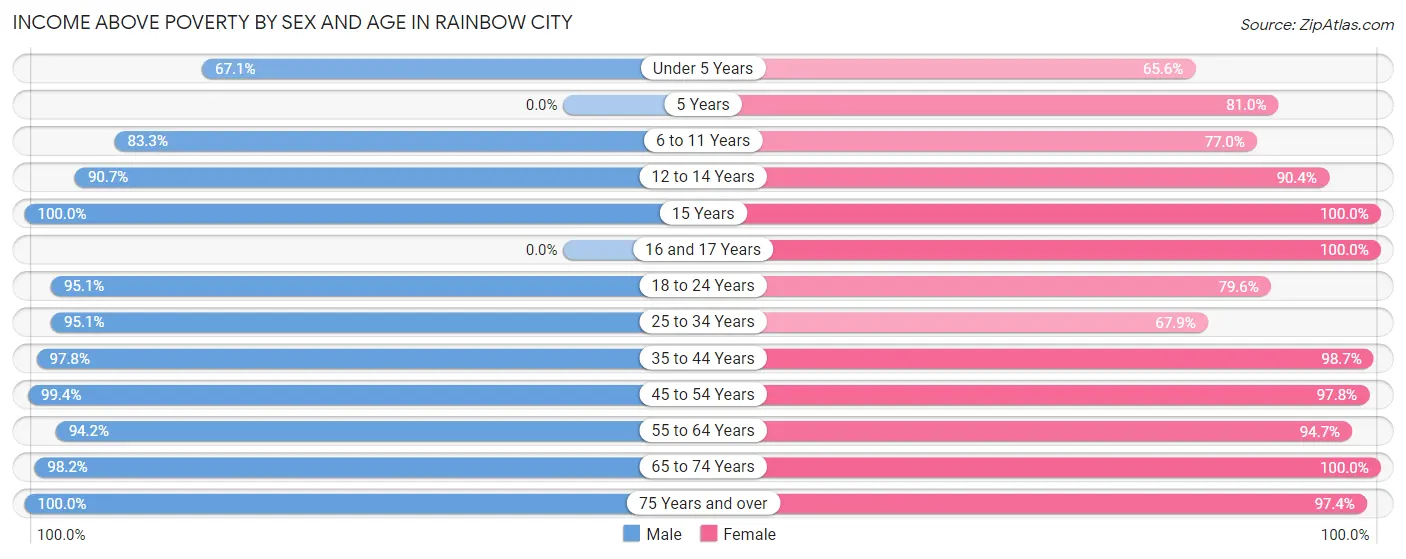
| Age Bracket | Male | Female |
| Under 5 Years | 59 (67.0%) | 217 (65.6%) |
| 5 Years | 0 (0.0%) | 64 (81.0%) |
| 6 to 11 Years | 384 (83.3%) | 285 (77.0%) |
| 12 to 14 Years | 97 (90.6%) | 432 (90.4%) |
| 15 Years | 66 (100.0%) | 86 (100.0%) |
| 16 and 17 Years | 0 (0.0%) | 209 (100.0%) |
| 18 to 24 Years | 330 (95.1%) | 331 (79.6%) |
| 25 to 34 Years | 656 (95.1%) | 516 (67.9%) |
| 35 to 44 Years | 437 (97.8%) | 528 (98.7%) |
| 45 to 54 Years | 920 (99.4%) | 768 (97.8%) |
| 55 to 64 Years | 310 (94.2%) | 694 (94.7%) |
| 65 to 74 Years | 428 (98.2%) | 556 (100.0%) |
| 75 Years and over | 365 (100.0%) | 528 (97.4%) |
| Total | 4,052 (94.7%) | 5,214 (88.7%) |
Income Below Poverty Among Married-Couple Families in Rainbow City
The poverty statistics for married-couple families in Rainbow City show that 1.8% or 37 of the total 2,005 families live below the poverty line. Families with 1 or 2 children have the highest poverty rate of 2.0%, comprising of 10 families. On the other hand, families with 3 or 4 children have the lowest poverty rate of 0.0%, which includes 0 families.
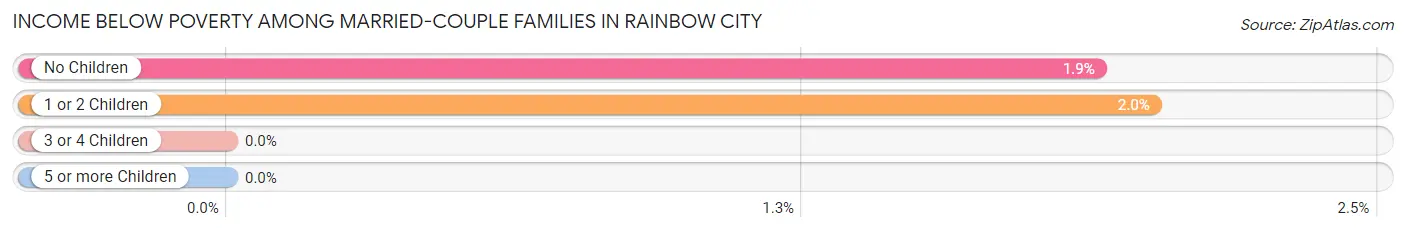
| Children | Above Poverty | Below Poverty |
| No Children | 1,403 (98.1%) | 27 (1.9%) |
| 1 or 2 Children | 488 (98.0%) | 10 (2.0%) |
| 3 or 4 Children | 77 (100.0%) | 0 (0.0%) |
| 5 or more Children | 0 (0.0%) | 0 (0.0%) |
| Total | 1,968 (98.2%) | 37 (1.8%) |
Income Below Poverty Among Single-Parent Households in Rainbow City
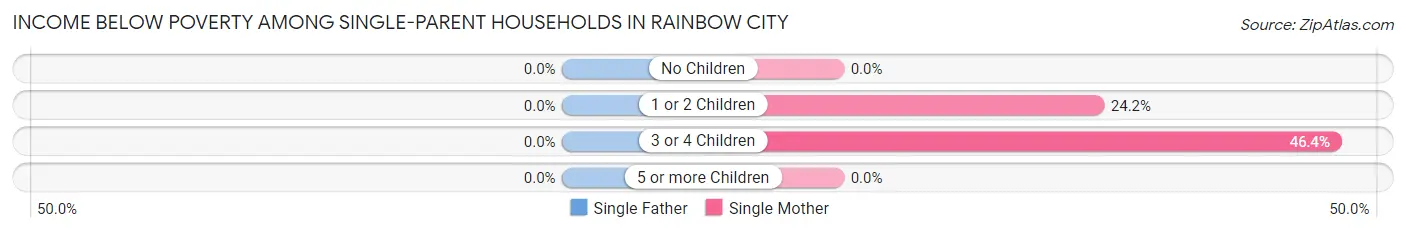
| Children | Single Father | Single Mother |
| No Children | 0 (0.0%) | 0 (0.0%) |
| 1 or 2 Children | 0 (0.0%) | 110 (24.2%) |
| 3 or 4 Children | 0 (0.0%) | 45 (46.4%) |
| 5 or more Children | 0 (0.0%) | 0 (0.0%) |
| Total | 0 (0.0%) | 155 (24.1%) |
Income Below Poverty Among Married-Couple vs Single-Parent Households in Rainbow City
The poverty data for Rainbow City shows that 37 of the married-couple family households (1.8%) and 155 of the single-parent households (21.1%) are living below the poverty level. Within the married-couple family households, those with 1 or 2 children have the highest poverty rate, with 10 households (2.0%) falling below the poverty line. Among the single-parent households, those with 3 or 4 children have the highest poverty rate, with 45 household (46.4%) living below poverty.
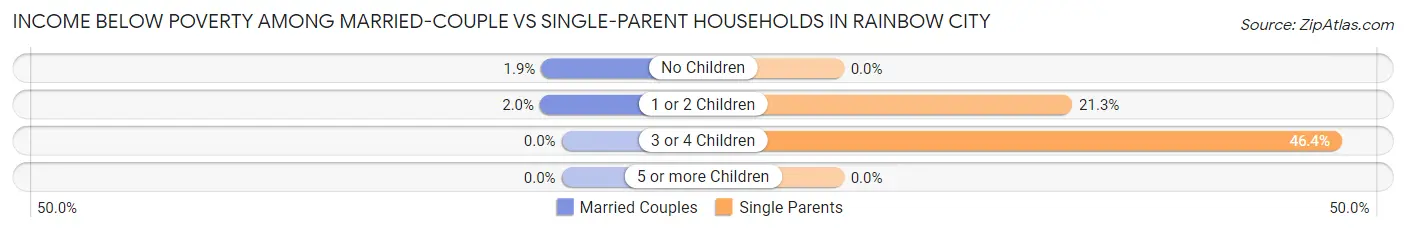
| Children | Married-Couple Families | Single-Parent Households |
| No Children | 27 (1.9%) | 0 (0.0%) |
| 1 or 2 Children | 10 (2.0%) | 110 (21.3%) |
| 3 or 4 Children | 0 (0.0%) | 45 (46.4%) |
| 5 or more Children | 0 (0.0%) | 0 (0.0%) |
| Total | 37 (1.8%) | 155 (21.1%) |
Race in Rainbow City
The most populous races in Rainbow City are White / Caucasian (8,071 | 79.2%), Black / African American (993 | 9.8%), and Hispanic or Latino (546 | 5.4%).
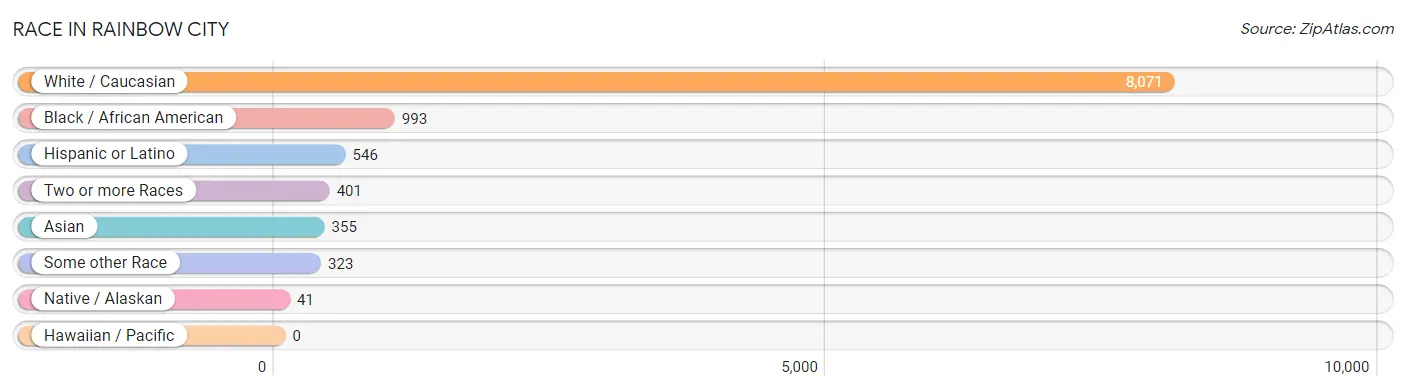
| Race | # Population | % Population |
| Asian | 355 | 3.5% |
| Black / African American | 993 | 9.8% |
| Hawaiian / Pacific | 0 | 0.0% |
| Hispanic or Latino | 546 | 5.4% |
| Native / Alaskan | 41 | 0.4% |
| White / Caucasian | 8,071 | 79.2% |
| Two or more Races | 401 | 3.9% |
| Some other Race | 323 | 3.2% |
| Total | 10,184 | 100.0% |
Ancestry in Rainbow City
The most populous ancestries reported in Rainbow City are American (2,082 | 20.4%), English (1,117 | 11.0%), Irish (953 | 9.4%), Mexican (307 | 3.0%), and German (300 | 2.9%), together accounting for 46.7% of all Rainbow City residents.
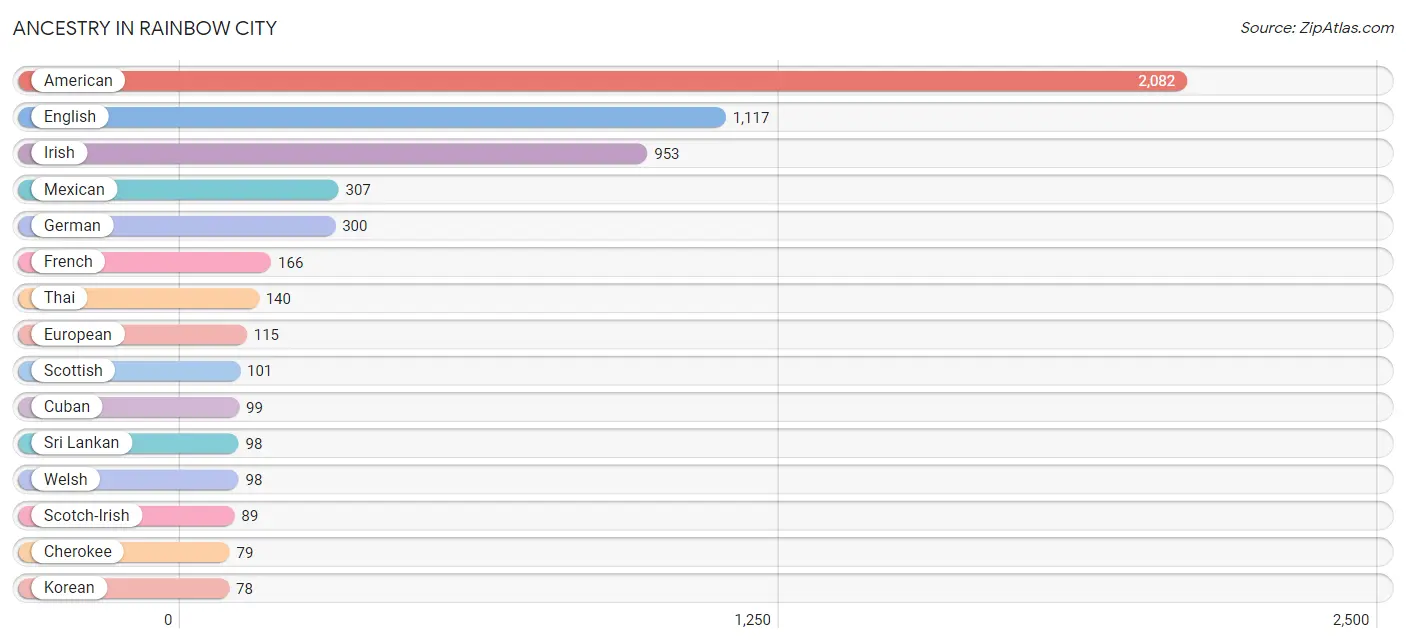
| Ancestry | # Population | % Population |
| American | 2,082 | 20.4% |
| Arab | 30 | 0.3% |
| British | 73 | 0.7% |
| Central American | 54 | 0.5% |
| Central American Indian | 37 | 0.4% |
| Cherokee | 79 | 0.8% |
| Colombian | 38 | 0.4% |
| Costa Rican | 17 | 0.2% |
| Cuban | 99 | 1.0% |
| Dominican | 23 | 0.2% |
| Dutch | 39 | 0.4% |
| Eastern European | 13 | 0.1% |
| English | 1,117 | 11.0% |
| European | 115 | 1.1% |
| Finnish | 19 | 0.2% |
| French | 166 | 1.6% |
| German | 300 | 2.9% |
| Guatemalan | 20 | 0.2% |
| Indian (Asian) | 39 | 0.4% |
| Irish | 953 | 9.4% |
| Italian | 9 | 0.1% |
| Korean | 78 | 0.8% |
| Lebanese | 30 | 0.3% |
| Mexican | 307 | 3.0% |
| Nigerian | 14 | 0.1% |
| Norwegian | 17 | 0.2% |
| Osage | 22 | 0.2% |
| Puerto Rican | 25 | 0.3% |
| Salvadoran | 17 | 0.2% |
| Scotch-Irish | 89 | 0.9% |
| Scottish | 101 | 1.0% |
| South American | 38 | 0.4% |
| Sri Lankan | 98 | 1.0% |
| Subsaharan African | 14 | 0.1% |
| Swedish | 40 | 0.4% |
| Thai | 140 | 1.4% |
| Welsh | 98 | 1.0% | View All 37 Rows |
Immigrants in Rainbow City
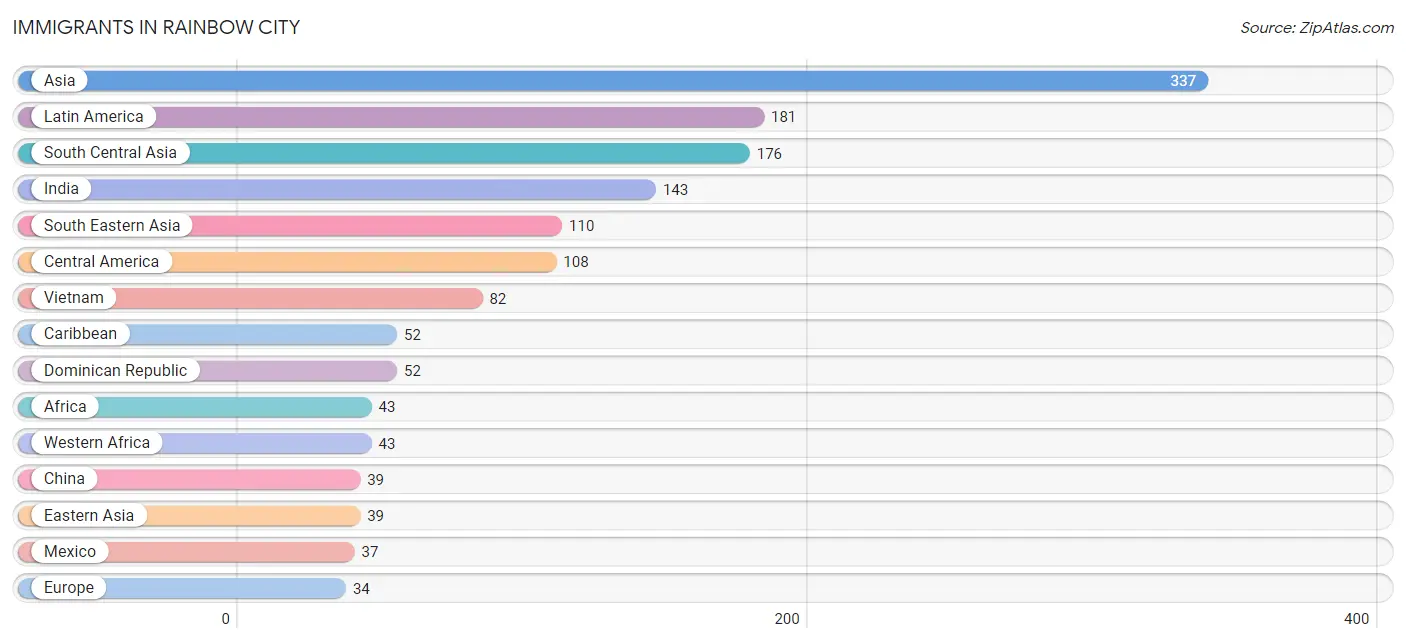
The most numerous immigrant groups reported in Rainbow City came from Asia (337 | 3.3%), Latin America (181 | 1.8%), South Central Asia (176 | 1.7%), India (143 | 1.4%), and South Eastern Asia (110 | 1.1%), together accounting for 9.3% of all Rainbow City residents.
| Immigration Origin | # Population | % Population |
| Africa | 43 | 0.4% |
| Asia | 337 | 3.3% |
| Canada | 25 | 0.3% |
| Caribbean | 52 | 0.5% |
| Central America | 108 | 1.1% |
| China | 39 | 0.4% |
| Colombia | 21 | 0.2% |
| Costa Rica | 17 | 0.2% |
| Dominican Republic | 52 | 0.5% |
| Eastern Asia | 39 | 0.4% |
| El Salvador | 17 | 0.2% |
| Europe | 34 | 0.3% |
| Guatemala | 20 | 0.2% |
| Honduras | 17 | 0.2% |
| India | 143 | 1.4% |
| Latin America | 181 | 1.8% |
| Lebanon | 12 | 0.1% |
| Mexico | 37 | 0.4% |
| Nepal | 33 | 0.3% |
| Netherlands | 17 | 0.2% |
| Nigeria | 22 | 0.2% |
| Northern Europe | 17 | 0.2% |
| Norway | 17 | 0.2% |
| Philippines | 28 | 0.3% |
| Senegal | 21 | 0.2% |
| South America | 21 | 0.2% |
| South Central Asia | 176 | 1.7% |
| South Eastern Asia | 110 | 1.1% |
| Vietnam | 82 | 0.8% |
| Western Africa | 43 | 0.4% |
| Western Asia | 12 | 0.1% |
| Western Europe | 17 | 0.2% | View All 32 Rows |
Sex and Age in Rainbow City
Sex and Age in Rainbow City
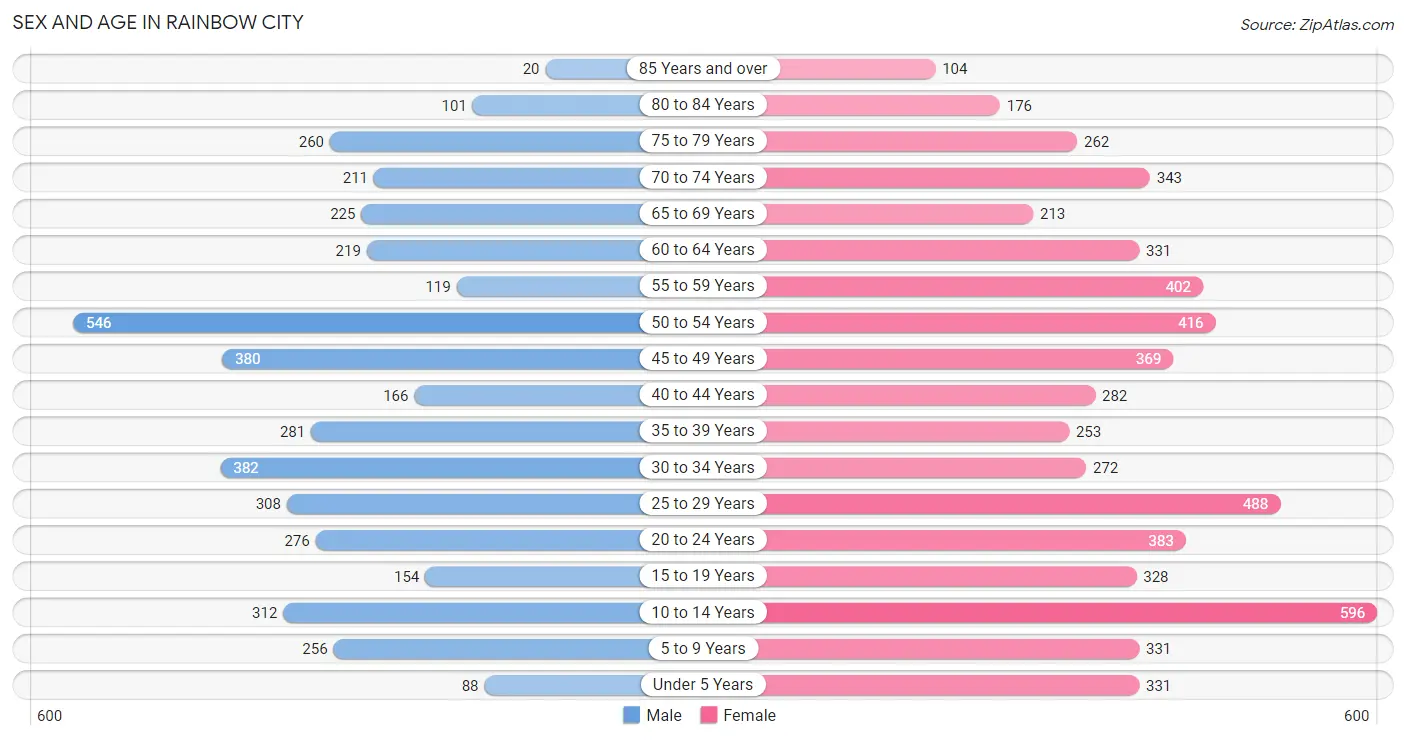
The most populous age groups in Rainbow City are 50 to 54 Years (546 | 12.7%) for men and 10 to 14 Years (596 | 10.1%) for women.
| Age Bracket | Male | Female |
| Under 5 Years | 88 (2.0%) | 331 (5.6%) |
| 5 to 9 Years | 256 (5.9%) | 331 (5.6%) |
| 10 to 14 Years | 312 (7.2%) | 596 (10.1%) |
| 15 to 19 Years | 154 (3.6%) | 328 (5.6%) |
| 20 to 24 Years | 276 (6.4%) | 383 (6.5%) |
| 25 to 29 Years | 308 (7.2%) | 488 (8.3%) |
| 30 to 34 Years | 382 (8.9%) | 272 (4.6%) |
| 35 to 39 Years | 281 (6.5%) | 253 (4.3%) |
| 40 to 44 Years | 166 (3.9%) | 282 (4.8%) |
| 45 to 49 Years | 380 (8.8%) | 369 (6.3%) |
| 50 to 54 Years | 546 (12.7%) | 416 (7.1%) |
| 55 to 59 Years | 119 (2.8%) | 402 (6.8%) |
| 60 to 64 Years | 219 (5.1%) | 331 (5.6%) |
| 65 to 69 Years | 225 (5.2%) | 213 (3.6%) |
| 70 to 74 Years | 211 (4.9%) | 343 (5.8%) |
| 75 to 79 Years | 260 (6.0%) | 262 (4.5%) |
| 80 to 84 Years | 101 (2.4%) | 176 (3.0%) |
| 85 Years and over | 20 (0.5%) | 104 (1.8%) |
| Total | 4,304 (100.0%) | 5,880 (100.0%) |
Families and Households in Rainbow City
Median Family Size in Rainbow City
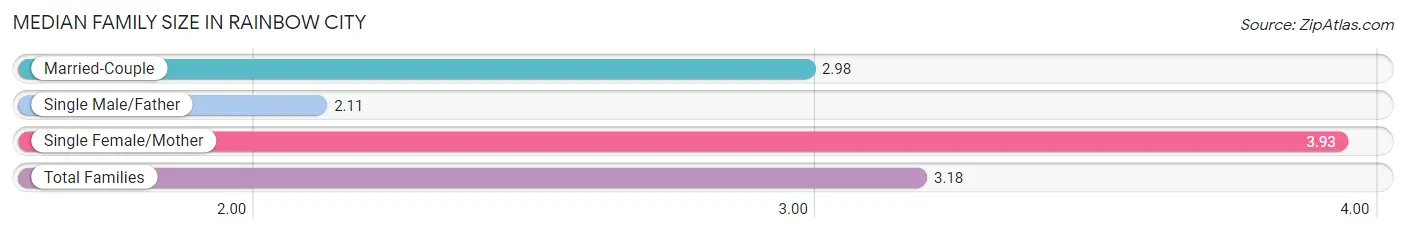
The median family size in Rainbow City is 3.18 persons per family, with single female/mother families (644 | 23.5%) accounting for the largest median family size of 3.93 persons per family. On the other hand, single male/father families (89 | 3.3%) represent the smallest median family size with 2.11 persons per family.
| Family Type | # Families | Family Size |
| Married-Couple | 2,005 (73.2%) | 2.98 |
| Single Male/Father | 89 (3.3%) | 2.11 |
| Single Female/Mother | 644 (23.5%) | 3.93 |
| Total Families | 2,738 (100.0%) | 3.18 |
Median Household Size in Rainbow City
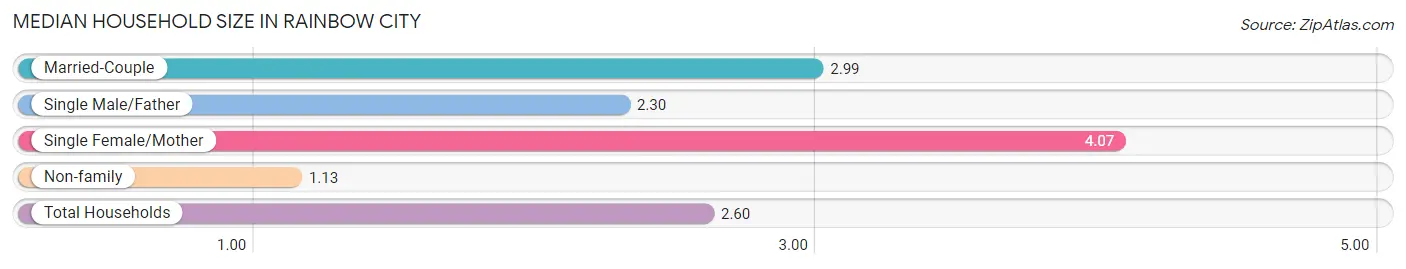
The median household size in Rainbow City is 2.60 persons per household, with single female/mother households (644 | 16.5%) accounting for the largest median household size of 4.07 persons per household. non-family households (1,170 | 29.9%) represent the smallest median household size with 1.13 persons per household.
| Household Type | # Households | Household Size |
| Married-Couple | 2,005 (51.3%) | 2.99 |
| Single Male/Father | 89 (2.3%) | 2.30 |
| Single Female/Mother | 644 (16.5%) | 4.07 |
| Non-family | 1,170 (29.9%) | 1.13 |
| Total Households | 3,908 (100.0%) | 2.60 |
Household Size by Marriage Status in Rainbow City
Out of a total of 3,908 households in Rainbow City, 2,738 (70.1%) are family households, while 1,170 (29.9%) are nonfamily households. The most numerous type of family households are 2-person households, comprising 1,468, and the most common type of nonfamily households are 1-person households, comprising 1,036.
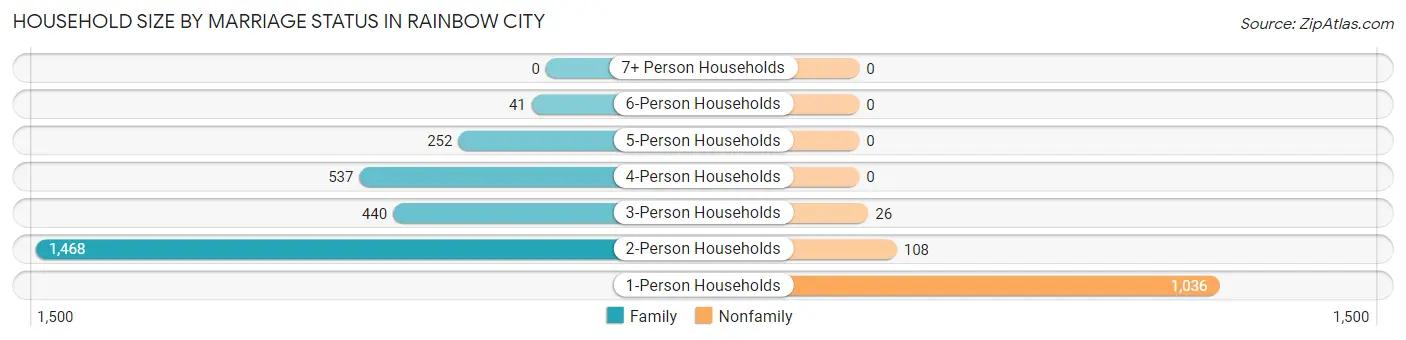
| Household Size | Family Households | Nonfamily Households |
| 1-Person Households | - | 1,036 (26.5%) |
| 2-Person Households | 1,468 (37.6%) | 108 (2.8%) |
| 3-Person Households | 440 (11.3%) | 26 (0.7%) |
| 4-Person Households | 537 (13.7%) | 0 (0.0%) |
| 5-Person Households | 252 (6.5%) | 0 (0.0%) |
| 6-Person Households | 41 (1.1%) | 0 (0.0%) |
| 7+ Person Households | 0 (0.0%) | 0 (0.0%) |
| Total | 2,738 (70.1%) | 1,170 (29.9%) |
Female Fertility in Rainbow City
Fertility by Age in Rainbow City
Average fertility rate in Rainbow City is 45.0 births per 1,000 women. Women in the age bracket of 20 to 34 years have the highest fertility rate with 100.0 births per 1,000 women. Women in the age bracket of 20 to 34 years acount for 100.0% of all women with births.
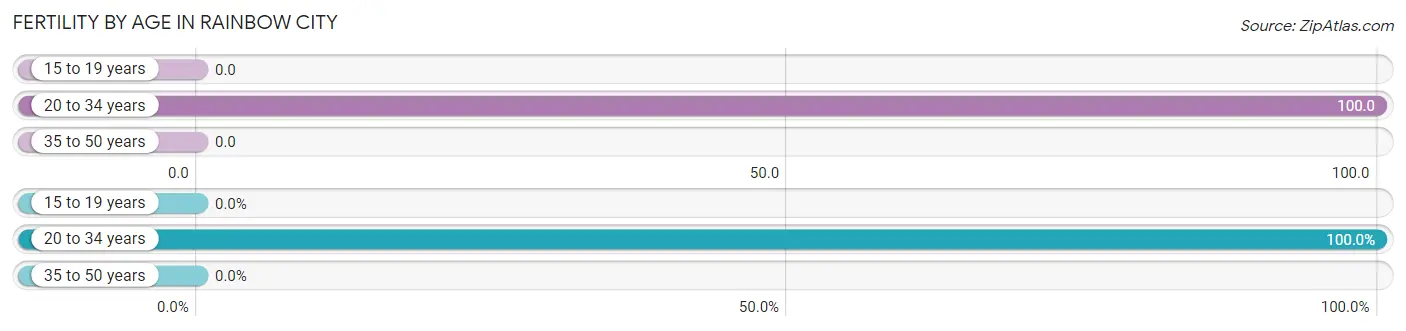
| Age Bracket | Women with Births | Births / 1,000 Women |
| 15 to 19 years | 0 (0.0%) | 0.0 |
| 20 to 34 years | 114 (100.0%) | 100.0 |
| 35 to 50 years | 0 (0.0%) | 0.0 |
| Total | 114 (100.0%) | 45.0 |
Fertility by Age by Marriage Status in Rainbow City
45.6% of women with births (114) in Rainbow City are married. The highest percentage of unmarried women with births falls into 20 to 34 years age bracket with 54.4% of them unmarried at the time of birth, while the lowest percentage of unmarried women with births belong to 20 to 34 years age bracket with 54.4% of them unmarried.
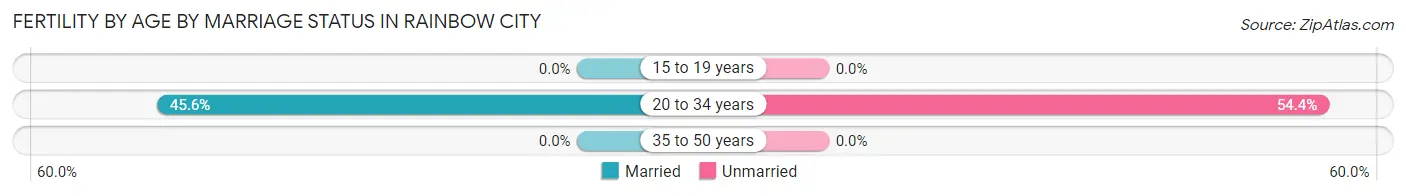
| Age Bracket | Married | Unmarried |
| 15 to 19 years | 0 (0.0%) | 0 (0.0%) |
| 20 to 34 years | 52 (45.6%) | 62 (54.4%) |
| 35 to 50 years | 0 (0.0%) | 0 (0.0%) |
| Total | 52 (45.6%) | 62 (54.4%) |
Fertility by Education in Rainbow City
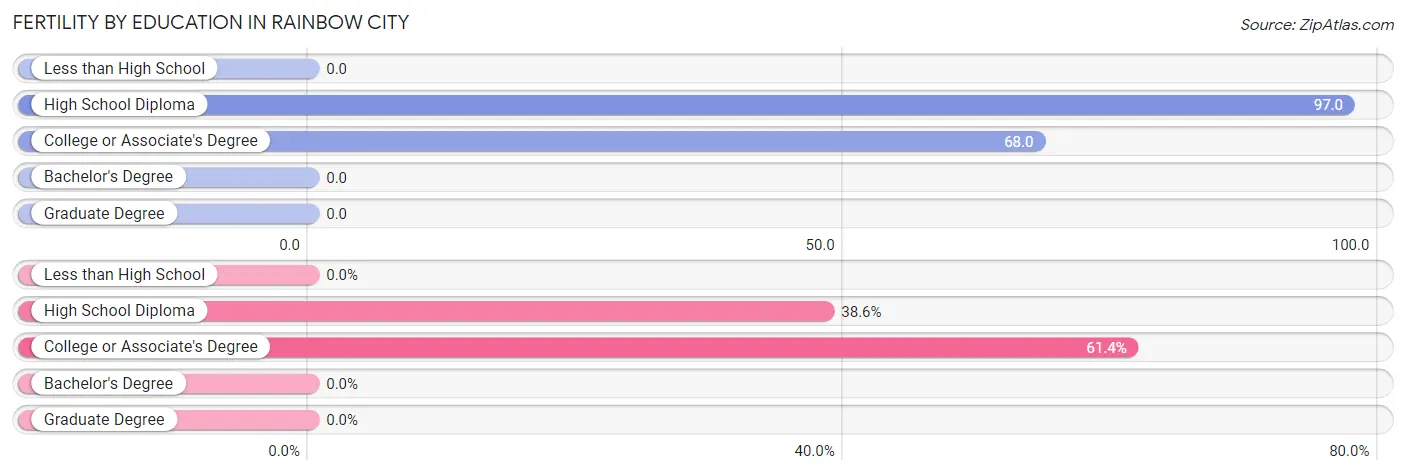
| Educational Attainment | Women with Births | Births / 1,000 Women |
| Less than High School | 0 (0.0%) | 0.0 |
| High School Diploma | 44 (38.6%) | 97.0 |
| College or Associate's Degree | 70 (61.4%) | 68.0 |
| Bachelor's Degree | 0 (0.0%) | 0.0 |
| Graduate Degree | 0 (0.0%) | 0.0 |
| Total | 114 (100.0%) | 45.0 |
Fertility by Education by Marriage Status in Rainbow City
54.4% of women with births in Rainbow City are unmarried. Women with the educational attainment of high school diploma are most likely to be married with 100.0% of them married at childbirth, while women with the educational attainment of college or associate's degree are least likely to be married with 88.6% of them unmarried at childbirth.
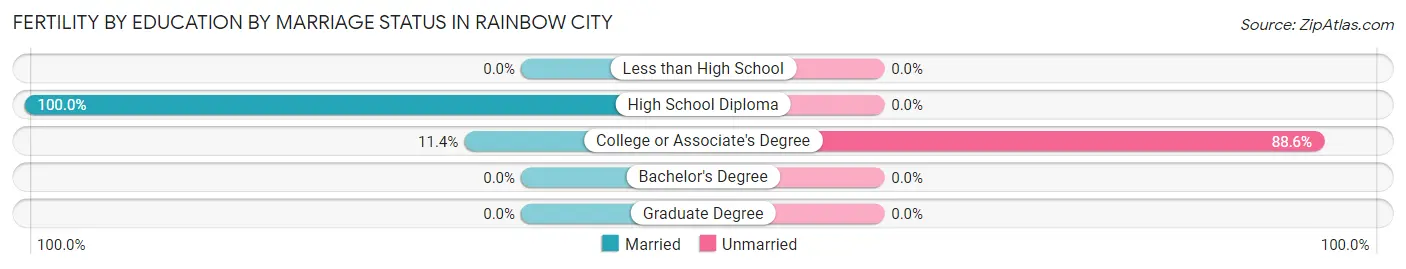
| Educational Attainment | Married | Unmarried |
| Less than High School | 0 (0.0%) | 0 (0.0%) |
| High School Diploma | 44 (100.0%) | 0 (0.0%) |
| College or Associate's Degree | 8 (11.4%) | 62 (88.6%) |
| Bachelor's Degree | 0 (0.0%) | 0 (0.0%) |
| Graduate Degree | 0 (0.0%) | 0 (0.0%) |
| Total | 52 (45.6%) | 62 (54.4%) |
Employment Characteristics in Rainbow City
Employment by Class of Employer in Rainbow City
Among the 4,285 employed individuals in Rainbow City, private company employees (3,332 | 77.8%), self-employed (not incorporated) (273 | 6.4%), and local government employees (256 | 6.0%) make up the most common classes of employment.
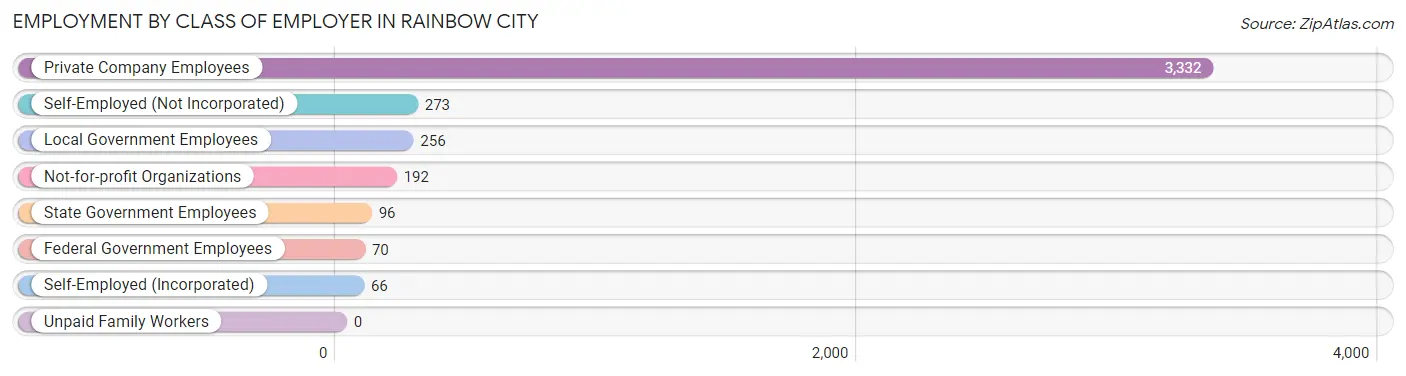
| Employer Class | # Employees | % Employees |
| Private Company Employees | 3,332 | 77.8% |
| Self-Employed (Incorporated) | 66 | 1.5% |
| Self-Employed (Not Incorporated) | 273 | 6.4% |
| Not-for-profit Organizations | 192 | 4.5% |
| Local Government Employees | 256 | 6.0% |
| State Government Employees | 96 | 2.2% |
| Federal Government Employees | 70 | 1.6% |
| Unpaid Family Workers | 0 | 0.0% |
| Total | 4,285 | 100.0% |
Employment Status by Age in Rainbow City
According to the labor force statistics for Rainbow City, out of the total population over 16 years of age (8,118), 58.8% or 4,773 individuals are in the labor force, with 8.3% or 396 of them unemployed. The age group with the highest labor force participation rate is 30 to 34 years, with 96.8% or 633 individuals in the labor force. Within the labor force, the 30 to 34 years age range has the highest percentage of unemployed individuals, with 38.5% or 244 of them being unemployed.
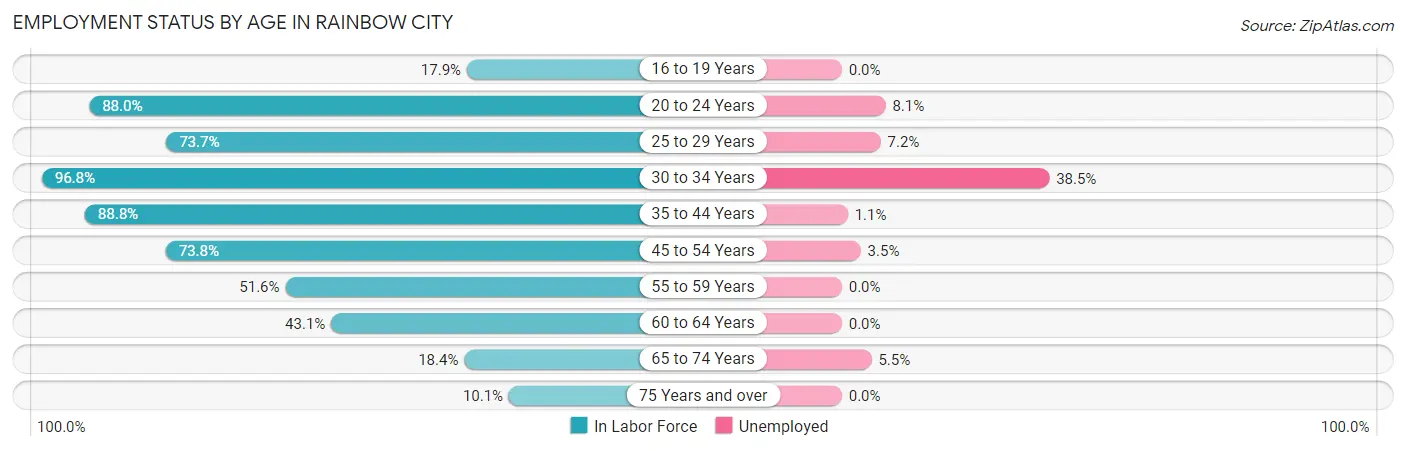
| Age Bracket | In Labor Force | Unemployed |
| 16 to 19 Years | 59 (17.9%) | 0 (0.0%) |
| 20 to 24 Years | 580 (88.0%) | 47 (8.1%) |
| 25 to 29 Years | 587 (73.7%) | 42 (7.2%) |
| 30 to 34 Years | 633 (96.8%) | 244 (38.5%) |
| 35 to 44 Years | 872 (88.8%) | 10 (1.1%) |
| 45 to 54 Years | 1,263 (73.8%) | 44 (3.5%) |
| 55 to 59 Years | 269 (51.6%) | 0 (0.0%) |
| 60 to 64 Years | 237 (43.1%) | 0 (0.0%) |
| 65 to 74 Years | 183 (18.4%) | 10 (5.5%) |
| 75 Years and over | 93 (10.1%) | 0 (0.0%) |
| Total | 4,773 (58.8%) | 396 (8.3%) |
Employment Status by Educational Attainment in Rainbow City
According to labor force statistics for Rainbow City, 74.1% of individuals (3,864) out of the total population between 25 and 64 years of age (5,214) are in the labor force, with 8.8% or 340 of them being unemployed. The group with the highest labor force participation rate are those with the educational attainment of bachelor's degree or higher, with 93.1% or 1,227 individuals in the labor force. Within the labor force, individuals with high school diploma education have the highest percentage of unemployment, with 25.3% or 304 of them being unemployed.
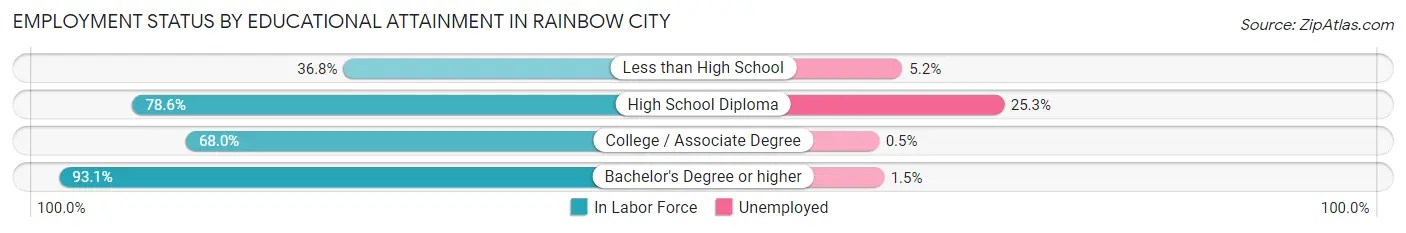
| Educational Attainment | In Labor Force | Unemployed |
| Less than High School | 210 (36.8%) | 30 (5.2%) |
| High School Diploma | 1,203 (78.6%) | 387 (25.3%) |
| College / Associate Degree | 1,221 (68.0%) | 9 (0.5%) |
| Bachelor's Degree or higher | 1,227 (93.1%) | 20 (1.5%) |
| Total | 3,864 (74.1%) | 459 (8.8%) |
Employment Occupations by Sex in Rainbow City
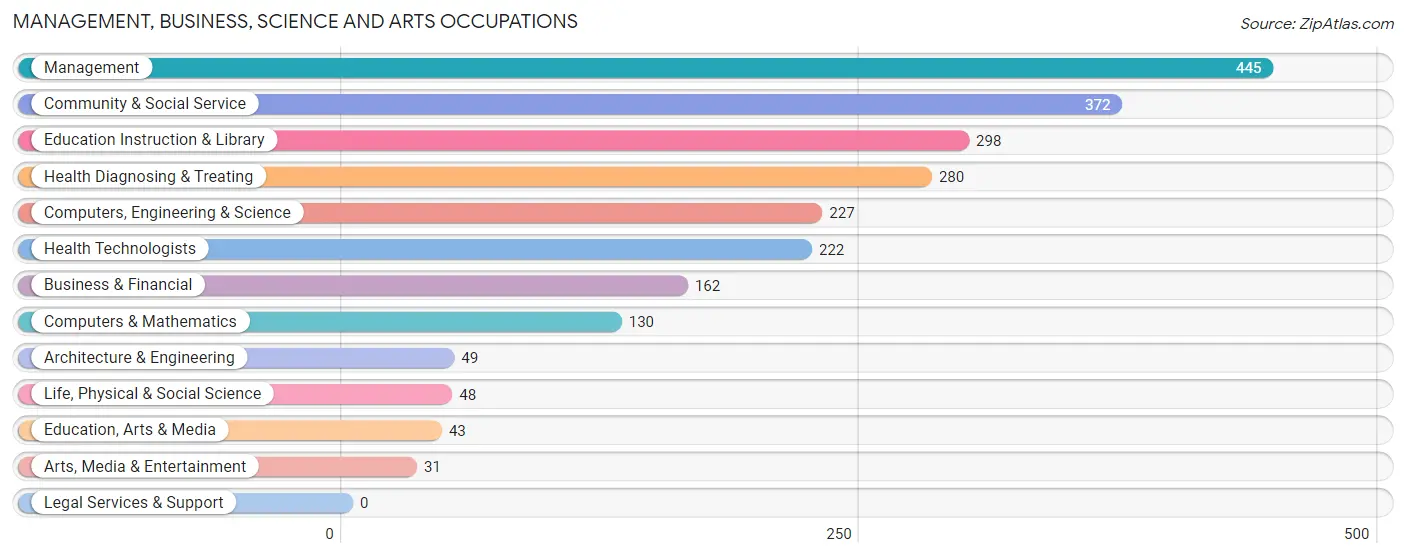
Management, Business, Science and Arts Occupations
The most common Management, Business, Science and Arts occupations in Rainbow City are Management (445 | 10.2%), Community & Social Service (372 | 8.5%), Education Instruction & Library (298 | 6.8%), Health Diagnosing & Treating (280 | 6.4%), and Computers, Engineering & Science (227 | 5.2%).
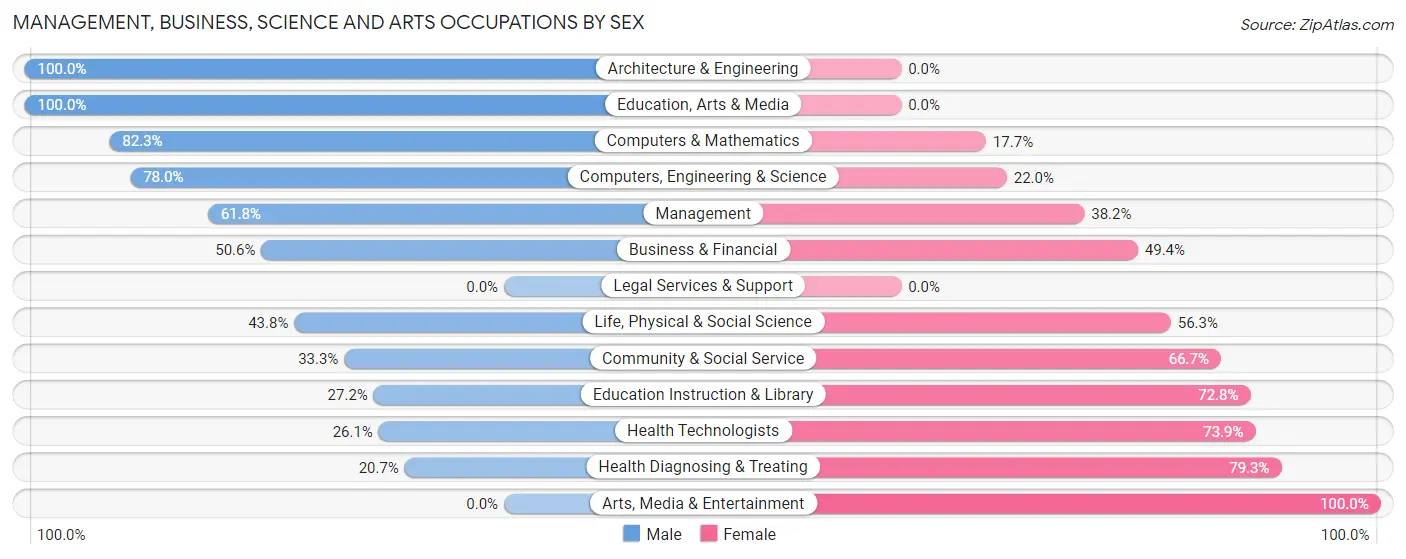
Management, Business, Science and Arts Occupations by Sex
Within the Management, Business, Science and Arts occupations in Rainbow City, the most male-oriented occupations are Architecture & Engineering (100.0%), Education, Arts & Media (100.0%), and Computers & Mathematics (82.3%), while the most female-oriented occupations are Arts, Media & Entertainment (100.0%), Health Diagnosing & Treating (79.3%), and Health Technologists (73.9%).
| Occupation | Male | Female |
| Management | 275 (61.8%) | 170 (38.2%) |
| Business & Financial | 82 (50.6%) | 80 (49.4%) |
| Computers, Engineering & Science | 177 (78.0%) | 50 (22.0%) |
| Computers & Mathematics | 107 (82.3%) | 23 (17.7%) |
| Architecture & Engineering | 49 (100.0%) | 0 (0.0%) |
| Life, Physical & Social Science | 21 (43.8%) | 27 (56.2%) |
| Community & Social Service | 124 (33.3%) | 248 (66.7%) |
| Education, Arts & Media | 43 (100.0%) | 0 (0.0%) |
| Legal Services & Support | 0 (0.0%) | 0 (0.0%) |
| Education Instruction & Library | 81 (27.2%) | 217 (72.8%) |
| Arts, Media & Entertainment | 0 (0.0%) | 31 (100.0%) |
| Health Diagnosing & Treating | 58 (20.7%) | 222 (79.3%) |
| Health Technologists | 58 (26.1%) | 164 (73.9%) |
| Total (Category) | 716 (48.2%) | 770 (51.8%) |
| Total (Overall) | 2,075 (47.4%) | 2,304 (52.6%) |
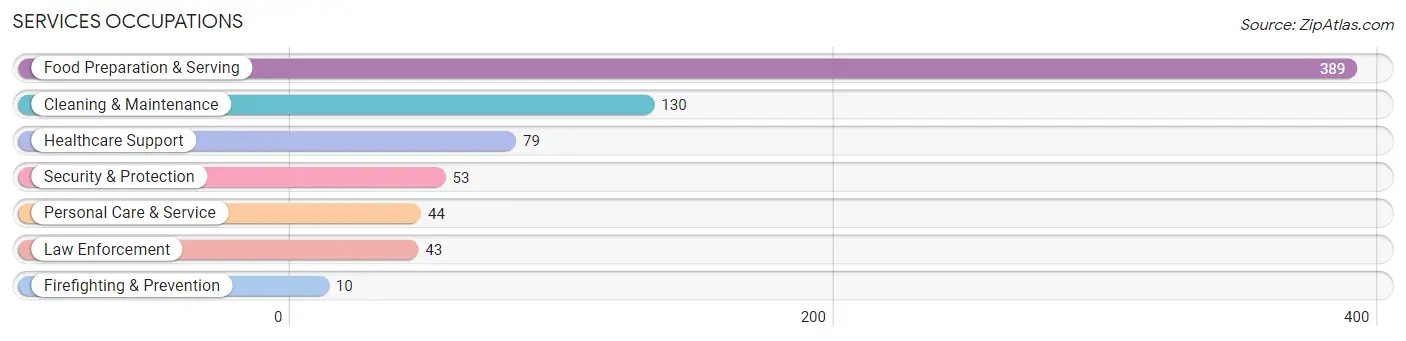
Services Occupations
The most common Services occupations in Rainbow City are Food Preparation & Serving (389 | 8.9%), Cleaning & Maintenance (130 | 3.0%), Healthcare Support (79 | 1.8%), Security & Protection (53 | 1.2%), and Personal Care & Service (44 | 1.0%).
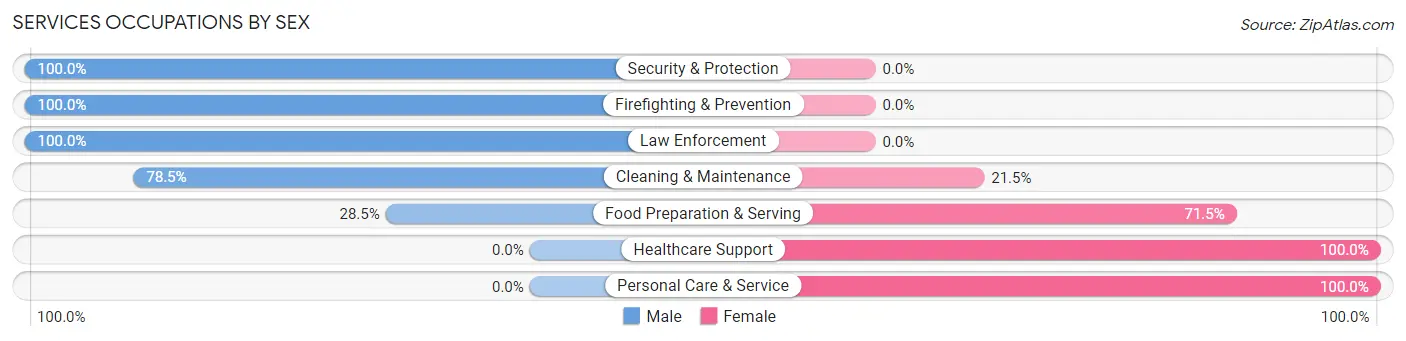
Services Occupations by Sex
Within the Services occupations in Rainbow City, the most male-oriented occupations are Security & Protection (100.0%), Firefighting & Prevention (100.0%), and Law Enforcement (100.0%), while the most female-oriented occupations are Healthcare Support (100.0%), Personal Care & Service (100.0%), and Food Preparation & Serving (71.5%).
| Occupation | Male | Female |
| Healthcare Support | 0 (0.0%) | 79 (100.0%) |
| Security & Protection | 53 (100.0%) | 0 (0.0%) |
| Firefighting & Prevention | 10 (100.0%) | 0 (0.0%) |
| Law Enforcement | 43 (100.0%) | 0 (0.0%) |
| Food Preparation & Serving | 111 (28.5%) | 278 (71.5%) |
| Cleaning & Maintenance | 102 (78.5%) | 28 (21.5%) |
| Personal Care & Service | 0 (0.0%) | 44 (100.0%) |
| Total (Category) | 266 (38.3%) | 429 (61.7%) |
| Total (Overall) | 2,075 (47.4%) | 2,304 (52.6%) |
Sales and Office Occupations
The most common Sales and Office occupations in Rainbow City are Sales & Related (679 | 15.5%), and Office & Administration (618 | 14.1%).
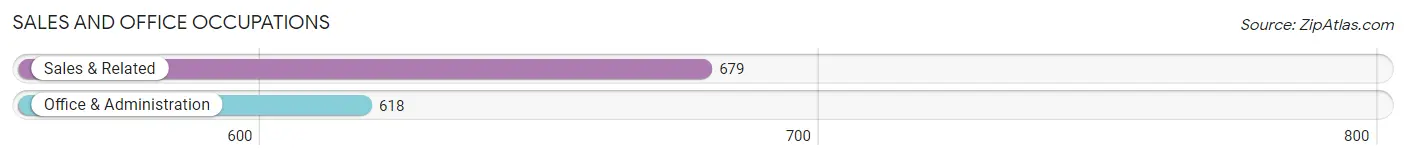
Sales and Office Occupations by Sex
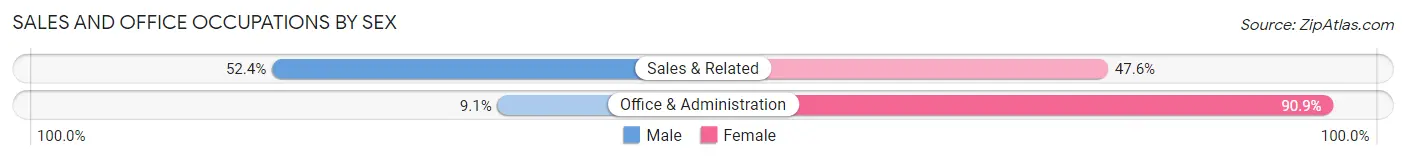
| Occupation | Male | Female |
| Sales & Related | 356 (52.4%) | 323 (47.6%) |
| Office & Administration | 56 (9.1%) | 562 (90.9%) |
| Total (Category) | 412 (31.8%) | 885 (68.2%) |
| Total (Overall) | 2,075 (47.4%) | 2,304 (52.6%) |
Natural Resources, Construction and Maintenance Occupations
The most common Natural Resources, Construction and Maintenance occupations in Rainbow City are Construction & Extraction (231 | 5.3%), and Installation, Maintenance & Repair (59 | 1.3%).
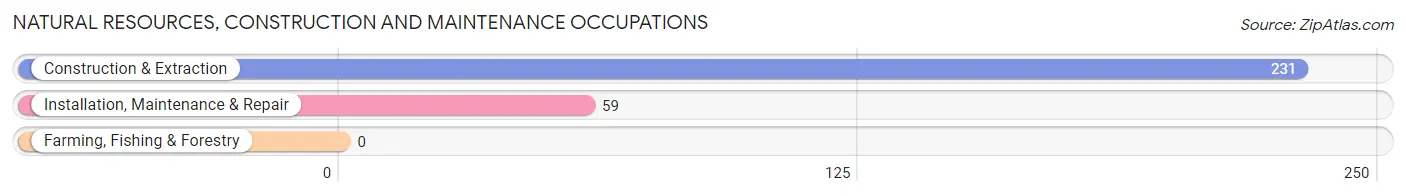
Natural Resources, Construction and Maintenance Occupations by Sex
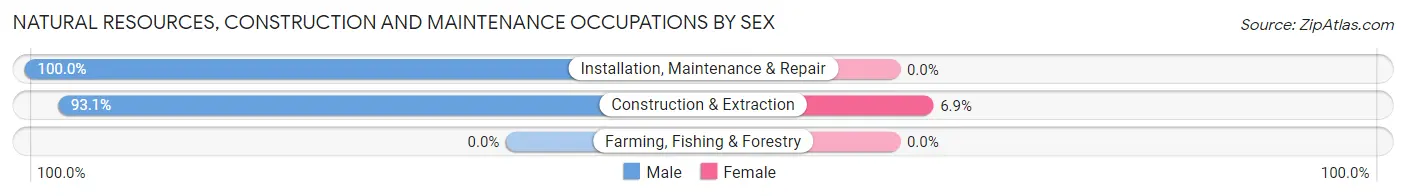
| Occupation | Male | Female |
| Farming, Fishing & Forestry | 0 (0.0%) | 0 (0.0%) |
| Construction & Extraction | 215 (93.1%) | 16 (6.9%) |
| Installation, Maintenance & Repair | 59 (100.0%) | 0 (0.0%) |
| Total (Category) | 274 (94.5%) | 16 (5.5%) |
| Total (Overall) | 2,075 (47.4%) | 2,304 (52.6%) |
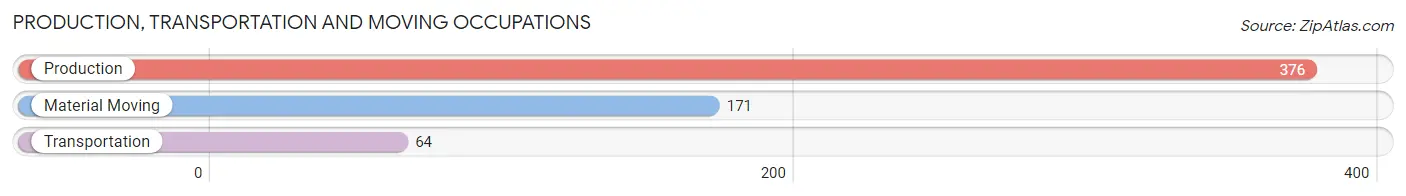
Production, Transportation and Moving Occupations
The most common Production, Transportation and Moving occupations in Rainbow City are Production (376 | 8.6%), Material Moving (171 | 3.9%), and Transportation (64 | 1.5%).
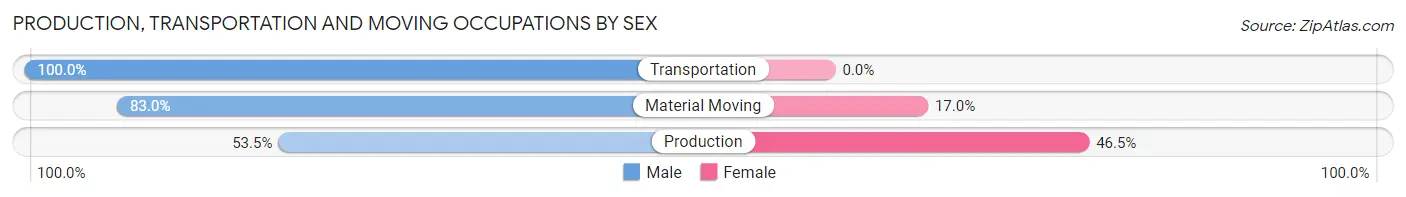
Production, Transportation and Moving Occupations by Sex
| Occupation | Male | Female |
| Production | 201 (53.5%) | 175 (46.5%) |
| Transportation | 64 (100.0%) | 0 (0.0%) |
| Material Moving | 142 (83.0%) | 29 (17.0%) |
| Total (Category) | 407 (66.6%) | 204 (33.4%) |
| Total (Overall) | 2,075 (47.4%) | 2,304 (52.6%) |
Employment Industries by Sex in Rainbow City
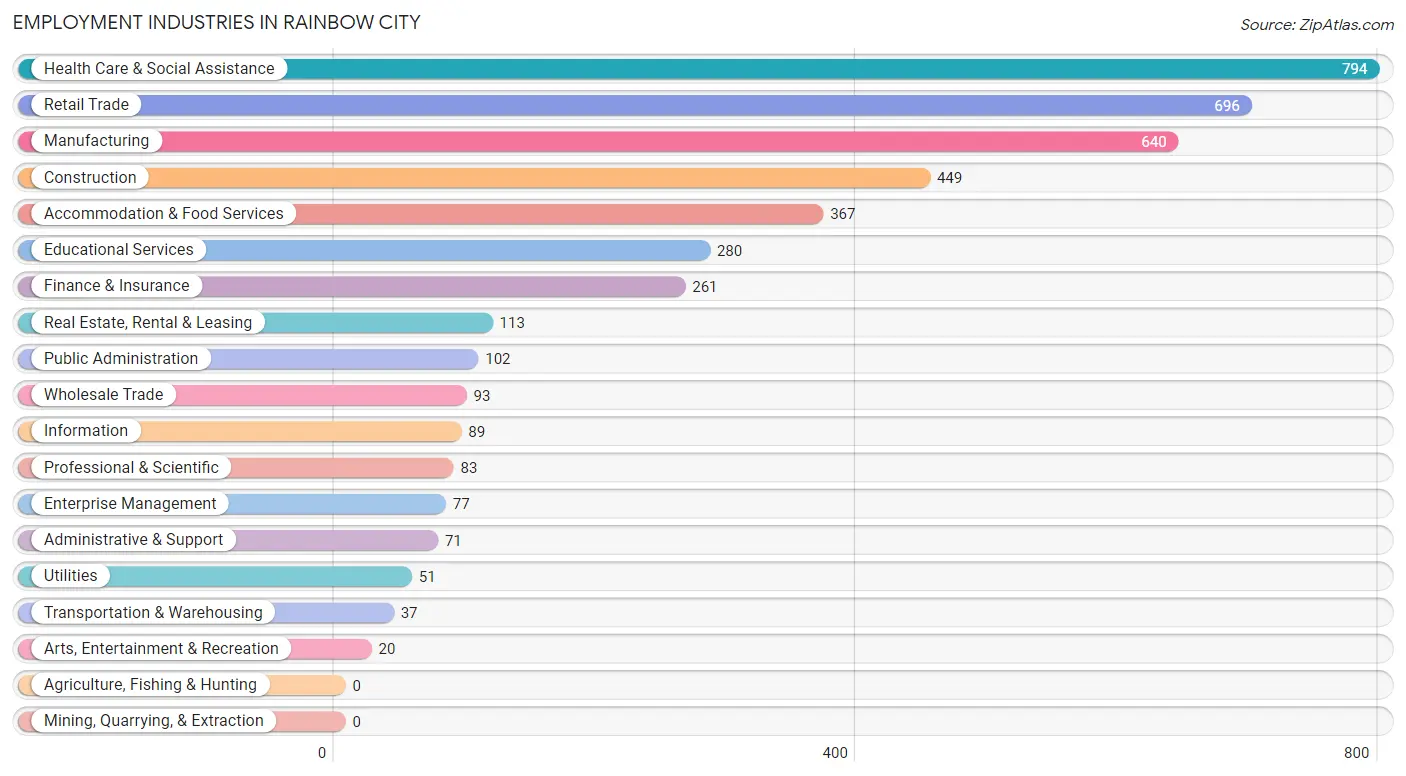
Employment Industries in Rainbow City
The major employment industries in Rainbow City include Health Care & Social Assistance (794 | 18.1%), Retail Trade (696 | 15.9%), Manufacturing (640 | 14.6%), Construction (449 | 10.2%), and Accommodation & Food Services (367 | 8.4%).
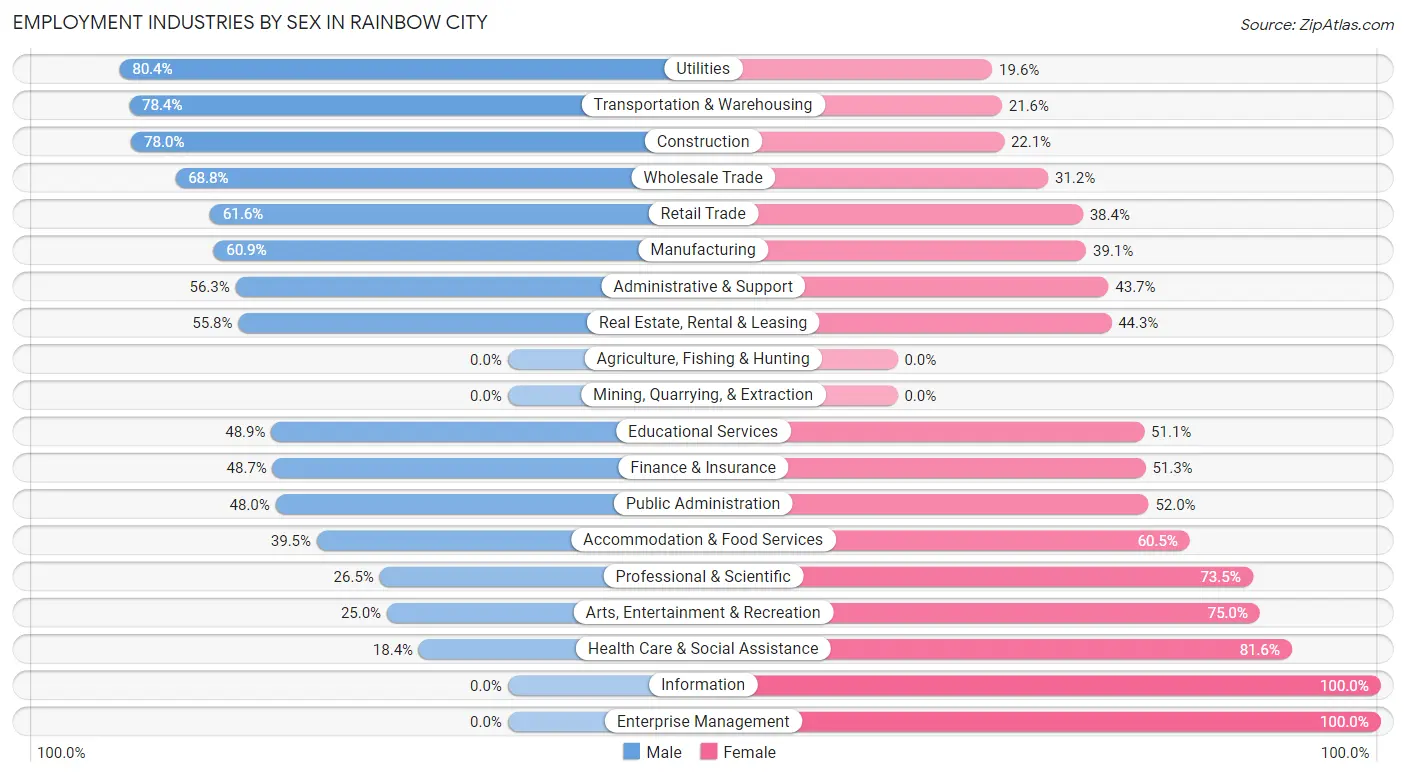
Employment Industries by Sex in Rainbow City
The Rainbow City industries that see more men than women are Utilities (80.4%), Transportation & Warehousing (78.4%), and Construction (77.9%), whereas the industries that tend to have a higher number of women are Information (100.0%), Enterprise Management (100.0%), and Health Care & Social Assistance (81.6%).
| Industry | Male | Female |
| Agriculture, Fishing & Hunting | 0 (0.0%) | 0 (0.0%) |
| Mining, Quarrying, & Extraction | 0 (0.0%) | 0 (0.0%) |
| Construction | 350 (77.9%) | 99 (22.1%) |
| Manufacturing | 390 (60.9%) | 250 (39.1%) |
| Wholesale Trade | 64 (68.8%) | 29 (31.2%) |
| Retail Trade | 429 (61.6%) | 267 (38.4%) |
| Transportation & Warehousing | 29 (78.4%) | 8 (21.6%) |
| Utilities | 41 (80.4%) | 10 (19.6%) |
| Information | 0 (0.0%) | 89 (100.0%) |
| Finance & Insurance | 127 (48.7%) | 134 (51.3%) |
| Real Estate, Rental & Leasing | 63 (55.7%) | 50 (44.3%) |
| Professional & Scientific | 22 (26.5%) | 61 (73.5%) |
| Enterprise Management | 0 (0.0%) | 77 (100.0%) |
| Administrative & Support | 40 (56.3%) | 31 (43.7%) |
| Educational Services | 137 (48.9%) | 143 (51.1%) |
| Health Care & Social Assistance | 146 (18.4%) | 648 (81.6%) |
| Arts, Entertainment & Recreation | 5 (25.0%) | 15 (75.0%) |
| Accommodation & Food Services | 145 (39.5%) | 222 (60.5%) |
| Public Administration | 49 (48.0%) | 53 (52.0%) |
| Total | 2,075 (47.4%) | 2,304 (52.6%) |
Education in Rainbow City
School Enrollment in Rainbow City
The most common levels of schooling among the 2,521 students in Rainbow City are middle school (669 | 26.5%), high school (630 | 25.0%), and college / undergraduate (538 | 21.3%).
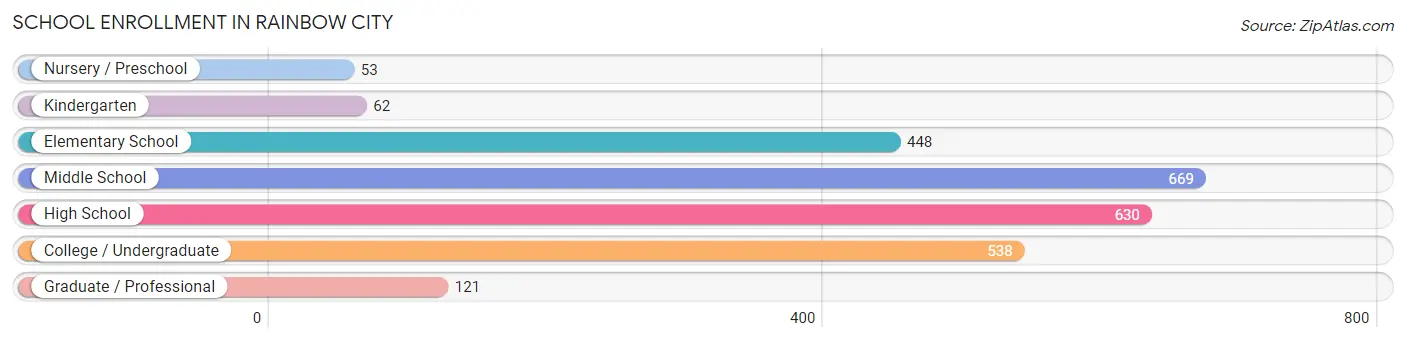
| School Level | # Students | % Students |
| Nursery / Preschool | 53 | 2.1% |
| Kindergarten | 62 | 2.5% |
| Elementary School | 448 | 17.8% |
| Middle School | 669 | 26.5% |
| High School | 630 | 25.0% |
| College / Undergraduate | 538 | 21.3% |
| Graduate / Professional | 121 | 4.8% |
| Total | 2,521 | 100.0% |
School Enrollment by Age by Funding Source in Rainbow City
Out of a total of 2,521 students who are enrolled in schools in Rainbow City, 474 (18.8%) attend a private institution, while the remaining 2,047 (81.2%) are enrolled in public schools. The age group of 3 to 4 year olds has the highest likelihood of being enrolled in private schools, with 53 (81.5% in the age bracket) enrolled. Conversely, the age group of 18 to 19 year olds has the lowest likelihood of being enrolled in a private school, with 99 (100.0% in the age bracket) attending a public institution.
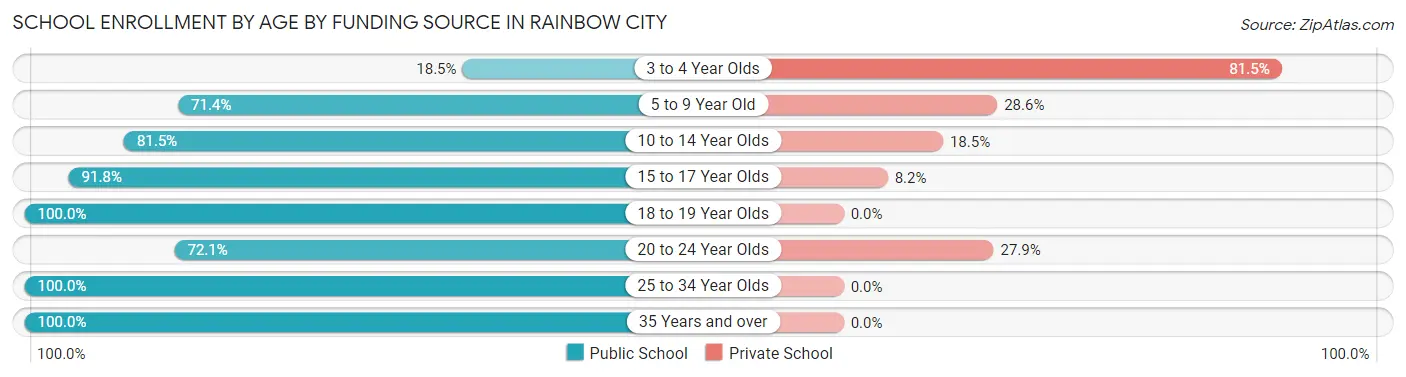
| Age Bracket | Public School | Private School |
| 3 to 4 Year Olds | 12 (18.5%) | 53 (81.5%) |
| 5 to 9 Year Old | 372 (71.4%) | 149 (28.6%) |
| 10 to 14 Year Olds | 718 (81.5%) | 163 (18.5%) |
| 15 to 17 Year Olds | 347 (91.8%) | 31 (8.2%) |
| 18 to 19 Year Olds | 99 (100.0%) | 0 (0.0%) |
| 20 to 24 Year Olds | 204 (72.1%) | 79 (27.9%) |
| 25 to 34 Year Olds | 240 (100.0%) | 0 (0.0%) |
| 35 Years and over | 54 (100.0%) | 0 (0.0%) |
| Total | 2,047 (81.2%) | 474 (18.8%) |
Educational Attainment by Field of Study in Rainbow City
Education (520 | 24.4%), science & technology (357 | 16.8%), business (345 | 16.2%), engineering (183 | 8.6%), and arts & humanities (163 | 7.7%) are the most common fields of study among 2,127 individuals in Rainbow City who have obtained a bachelor's degree or higher.
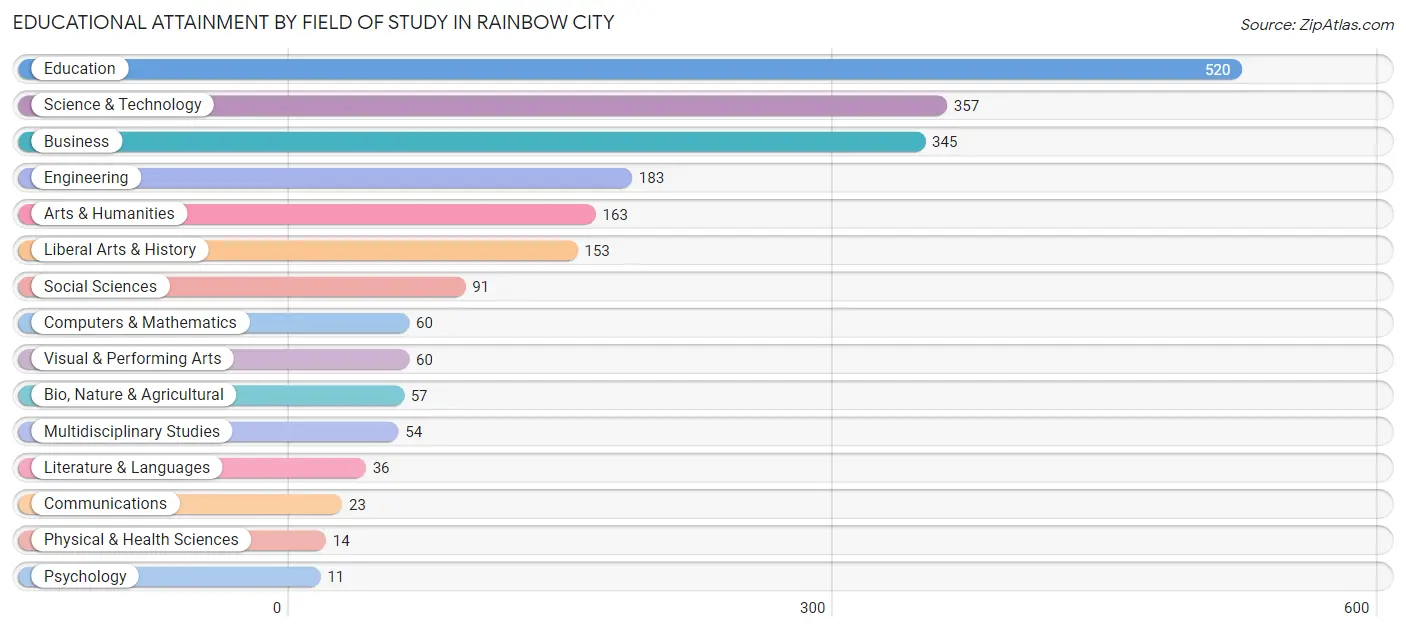
| Field of Study | # Graduates | % Graduates |
| Computers & Mathematics | 60 | 2.8% |
| Bio, Nature & Agricultural | 57 | 2.7% |
| Physical & Health Sciences | 14 | 0.7% |
| Psychology | 11 | 0.5% |
| Social Sciences | 91 | 4.3% |
| Engineering | 183 | 8.6% |
| Multidisciplinary Studies | 54 | 2.5% |
| Science & Technology | 357 | 16.8% |
| Business | 345 | 16.2% |
| Education | 520 | 24.4% |
| Literature & Languages | 36 | 1.7% |
| Liberal Arts & History | 153 | 7.2% |
| Visual & Performing Arts | 60 | 2.8% |
| Communications | 23 | 1.1% |
| Arts & Humanities | 163 | 7.7% |
| Total | 2,127 | 100.0% |
Transportation & Commute in Rainbow City
Vehicle Availability by Sex in Rainbow City
The most prevalent vehicle ownership categories in Rainbow City are males with 2 vehicles (926, accounting for 45.0%) and females with 2 vehicles (748, making up 41.6%).
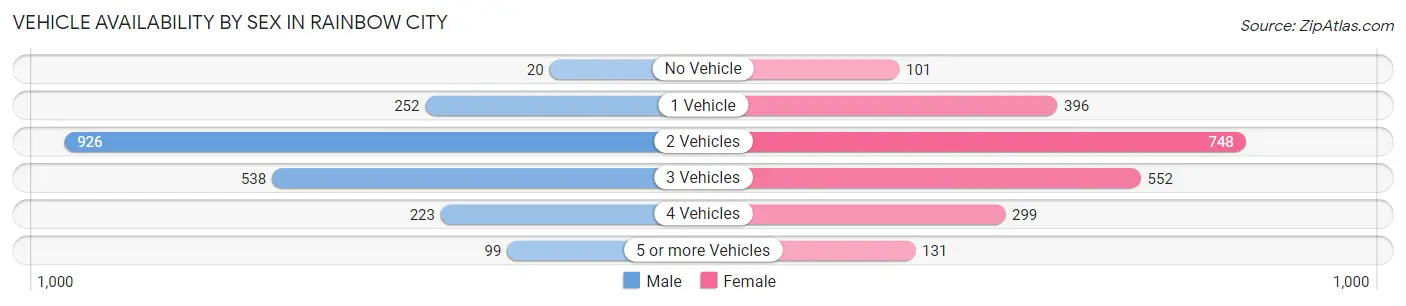
| Vehicles Available | Male | Female |
| No Vehicle | 20 (1.0%) | 101 (4.5%) |
| 1 Vehicle | 252 (12.2%) | 396 (17.8%) |
| 2 Vehicles | 926 (45.0%) | 748 (33.6%) |
| 3 Vehicles | 538 (26.1%) | 552 (24.8%) |
| 4 Vehicles | 223 (10.8%) | 299 (13.4%) |
| 5 or more Vehicles | 99 (4.8%) | 131 (5.9%) |
| Total | 2,058 (100.0%) | 2,227 (100.0%) |
Commute Time in Rainbow City
The most frequently occuring commute durations in Rainbow City are 10 to 14 minutes (835 commuters, 21.0%), 15 to 19 minutes (771 commuters, 19.4%), and 20 to 24 minutes (537 commuters, 13.5%).
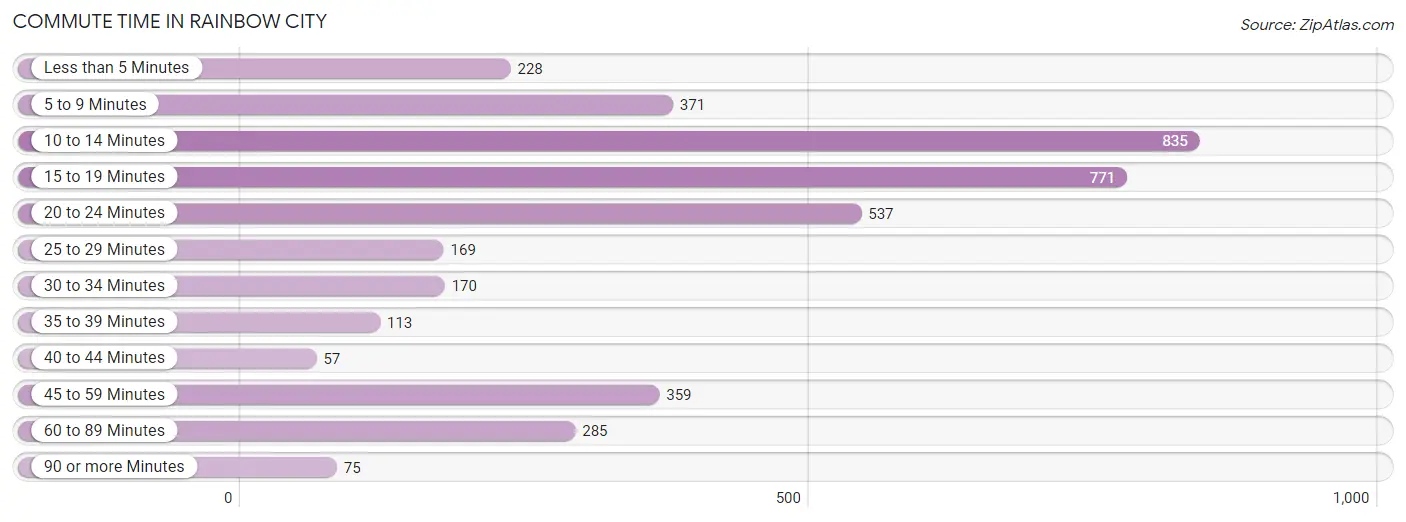
| Commute Time | # Commuters | % Commuters |
| Less than 5 Minutes | 228 | 5.7% |
| 5 to 9 Minutes | 371 | 9.3% |
| 10 to 14 Minutes | 835 | 21.0% |
| 15 to 19 Minutes | 771 | 19.4% |
| 20 to 24 Minutes | 537 | 13.5% |
| 25 to 29 Minutes | 169 | 4.3% |
| 30 to 34 Minutes | 170 | 4.3% |
| 35 to 39 Minutes | 113 | 2.9% |
| 40 to 44 Minutes | 57 | 1.4% |
| 45 to 59 Minutes | 359 | 9.0% |
| 60 to 89 Minutes | 285 | 7.2% |
| 90 or more Minutes | 75 | 1.9% |
Commute Time by Sex in Rainbow City
The most common commute times in Rainbow City are 15 to 19 minutes (405 commuters, 20.3%) for males and 10 to 14 minutes (560 commuters, 28.3%) for females.
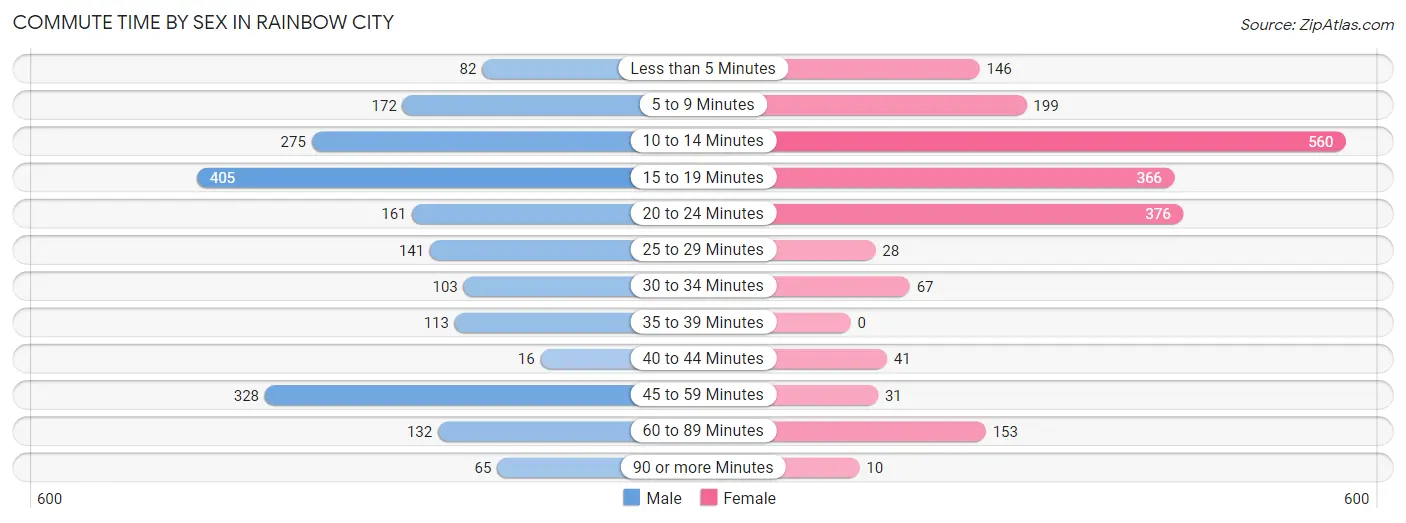
| Commute Time | Male | Female |
| Less than 5 Minutes | 82 (4.1%) | 146 (7.4%) |
| 5 to 9 Minutes | 172 (8.6%) | 199 (10.1%) |
| 10 to 14 Minutes | 275 (13.8%) | 560 (28.3%) |
| 15 to 19 Minutes | 405 (20.3%) | 366 (18.5%) |
| 20 to 24 Minutes | 161 (8.1%) | 376 (19.0%) |
| 25 to 29 Minutes | 141 (7.1%) | 28 (1.4%) |
| 30 to 34 Minutes | 103 (5.2%) | 67 (3.4%) |
| 35 to 39 Minutes | 113 (5.7%) | 0 (0.0%) |
| 40 to 44 Minutes | 16 (0.8%) | 41 (2.1%) |
| 45 to 59 Minutes | 328 (16.5%) | 31 (1.6%) |
| 60 to 89 Minutes | 132 (6.6%) | 153 (7.7%) |
| 90 or more Minutes | 65 (3.3%) | 10 (0.5%) |
Time of Departure to Work by Sex in Rainbow City
The most frequent times of departure to work in Rainbow City are 7:30 AM to 7:59 AM (283, 14.2%) for males and 7:30 AM to 7:59 AM (441, 22.3%) for females.
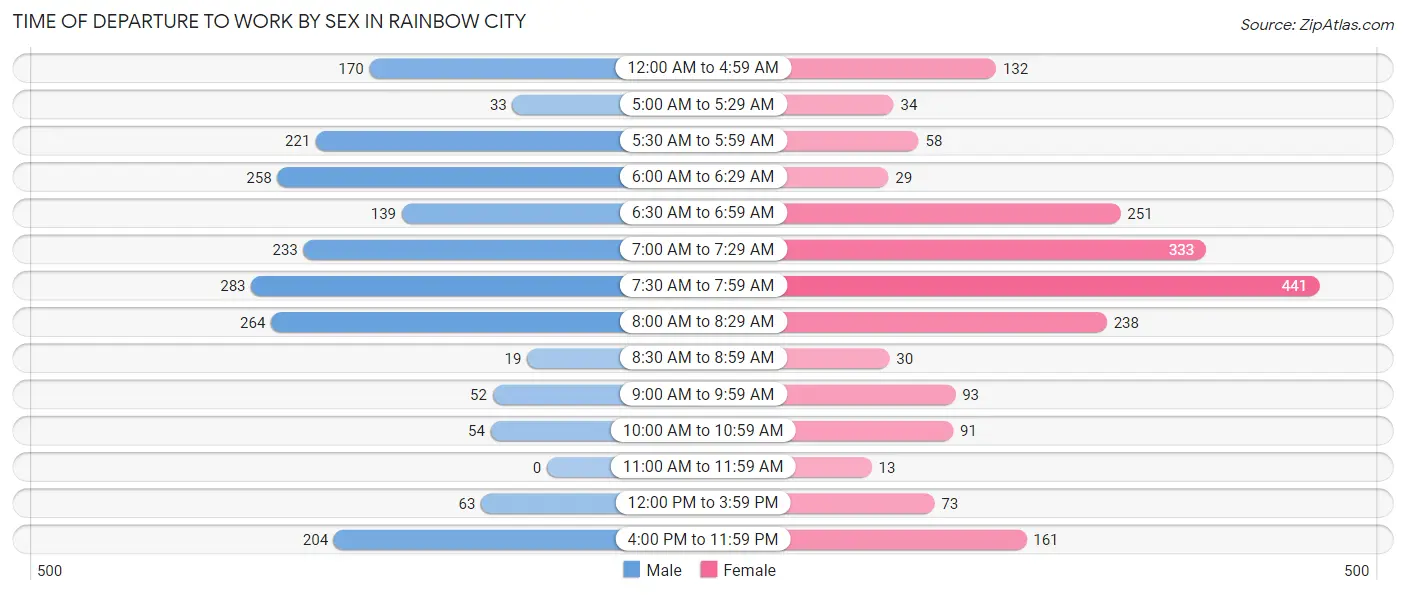
| Time of Departure | Male | Female |
| 12:00 AM to 4:59 AM | 170 (8.5%) | 132 (6.7%) |
| 5:00 AM to 5:29 AM | 33 (1.7%) | 34 (1.7%) |
| 5:30 AM to 5:59 AM | 221 (11.1%) | 58 (2.9%) |
| 6:00 AM to 6:29 AM | 258 (13.0%) | 29 (1.5%) |
| 6:30 AM to 6:59 AM | 139 (7.0%) | 251 (12.7%) |
| 7:00 AM to 7:29 AM | 233 (11.7%) | 333 (16.8%) |
| 7:30 AM to 7:59 AM | 283 (14.2%) | 441 (22.3%) |
| 8:00 AM to 8:29 AM | 264 (13.3%) | 238 (12.0%) |
| 8:30 AM to 8:59 AM | 19 (0.9%) | 30 (1.5%) |
| 9:00 AM to 9:59 AM | 52 (2.6%) | 93 (4.7%) |
| 10:00 AM to 10:59 AM | 54 (2.7%) | 91 (4.6%) |
| 11:00 AM to 11:59 AM | 0 (0.0%) | 13 (0.7%) |
| 12:00 PM to 3:59 PM | 63 (3.2%) | 73 (3.7%) |
| 4:00 PM to 11:59 PM | 204 (10.2%) | 161 (8.1%) |
| Total | 1,993 (100.0%) | 1,977 (100.0%) |
Housing Occupancy in Rainbow City
Occupancy by Ownership in Rainbow City
Of the total 3,908 dwellings in Rainbow City, owner-occupied units account for 2,485 (63.6%), while renter-occupied units make up 1,423 (36.4%).
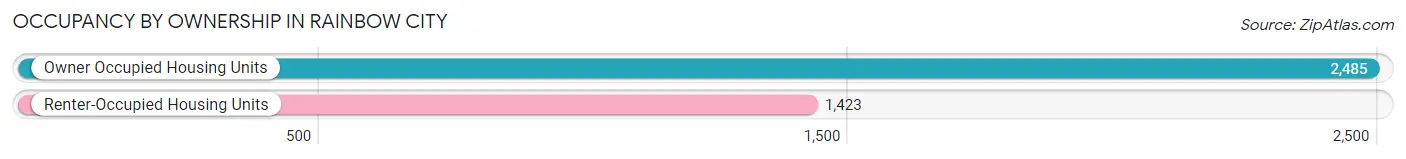
| Occupancy | # Housing Units | % Housing Units |
| Owner Occupied Housing Units | 2,485 | 63.6% |
| Renter-Occupied Housing Units | 1,423 | 36.4% |
| Total Occupied Housing Units | 3,908 | 100.0% |
Occupancy by Household Size in Rainbow City
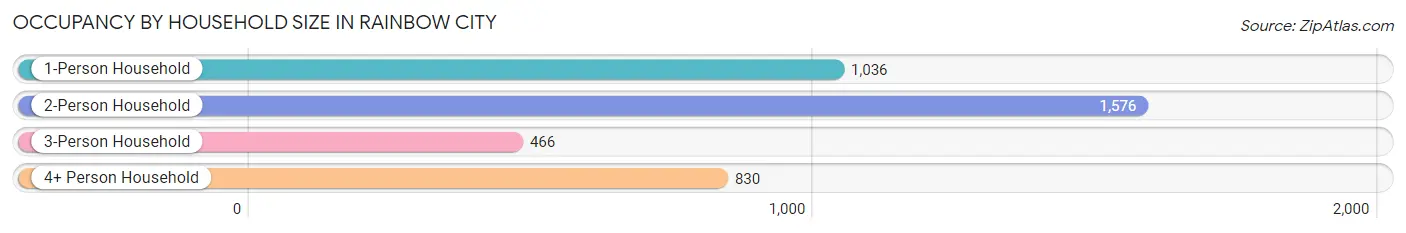
| Household Size | # Housing Units | % Housing Units |
| 1-Person Household | 1,036 | 26.5% |
| 2-Person Household | 1,576 | 40.3% |
| 3-Person Household | 466 | 11.9% |
| 4+ Person Household | 830 | 21.2% |
| Total Housing Units | 3,908 | 100.0% |
Occupancy by Ownership by Household Size in Rainbow City
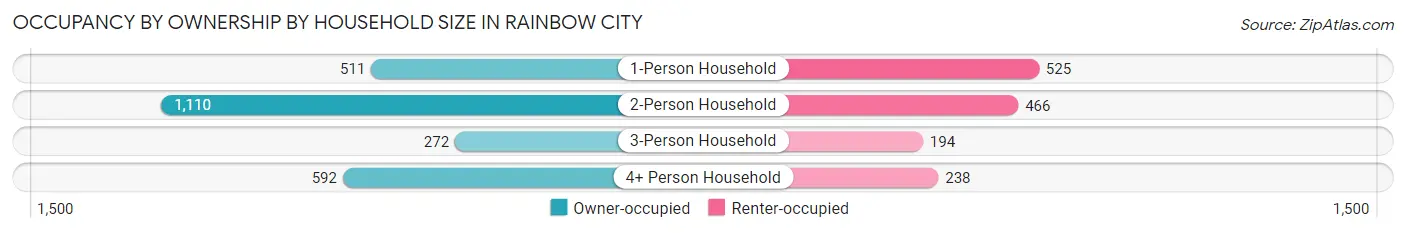
| Household Size | Owner-occupied | Renter-occupied |
| 1-Person Household | 511 (49.3%) | 525 (50.7%) |
| 2-Person Household | 1,110 (70.4%) | 466 (29.6%) |
| 3-Person Household | 272 (58.4%) | 194 (41.6%) |
| 4+ Person Household | 592 (71.3%) | 238 (28.7%) |
| Total Housing Units | 2,485 (63.6%) | 1,423 (36.4%) |
Occupancy by Educational Attainment in Rainbow City
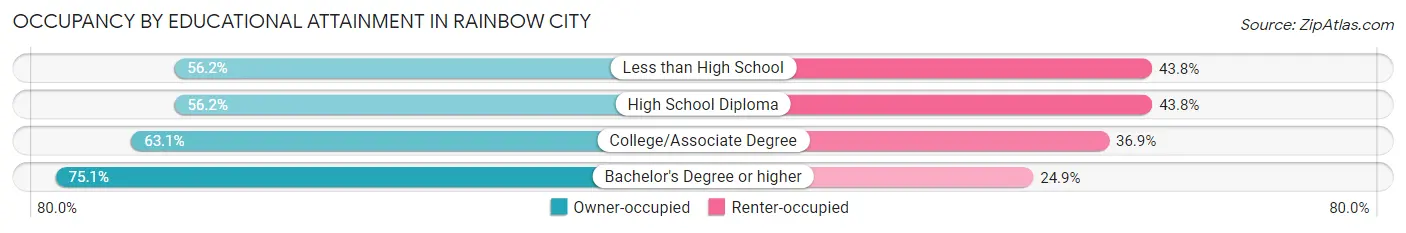
| Household Size | Owner-occupied | Renter-occupied |
| Less than High School | 158 (56.2%) | 123 (43.8%) |
| High School Diploma | 660 (56.2%) | 514 (43.8%) |
| College/Associate Degree | 917 (63.1%) | 537 (36.9%) |
| Bachelor's Degree or higher | 750 (75.1%) | 249 (24.9%) |
Occupancy by Age of Householder in Rainbow City
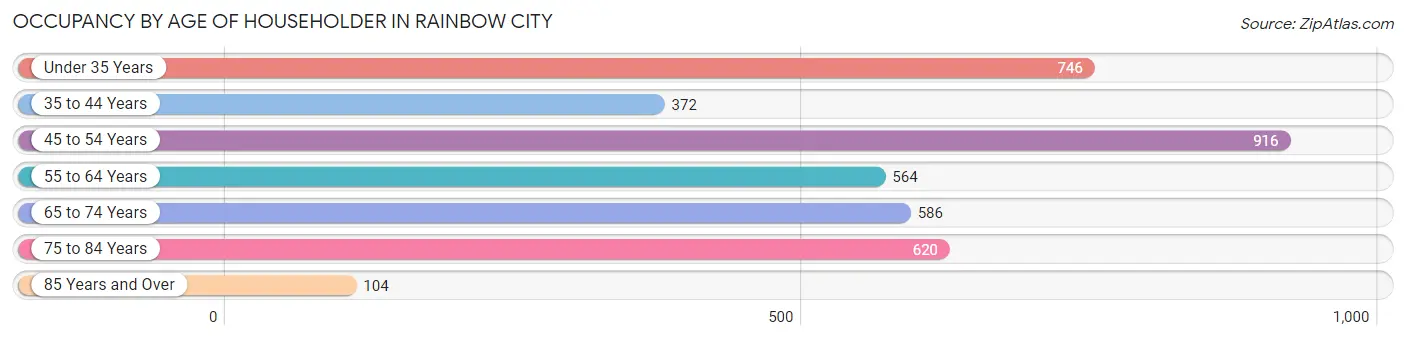
| Age Bracket | # Households | % Households |
| Under 35 Years | 746 | 19.1% |
| 35 to 44 Years | 372 | 9.5% |
| 45 to 54 Years | 916 | 23.4% |
| 55 to 64 Years | 564 | 14.4% |
| 65 to 74 Years | 586 | 15.0% |
| 75 to 84 Years | 620 | 15.9% |
| 85 Years and Over | 104 | 2.7% |
| Total | 3,908 | 100.0% |
Housing Finances in Rainbow City
Median Income by Occupancy in Rainbow City

| Occupancy Type | # Households | Median Income |
| Owner-Occupied | 2,485 (63.6%) | $88,425 |
| Renter-Occupied | 1,423 (36.4%) | $35,990 |
| Average | 3,908 (100.0%) | $60,260 |
Occupancy by Householder Income Bracket in Rainbow City
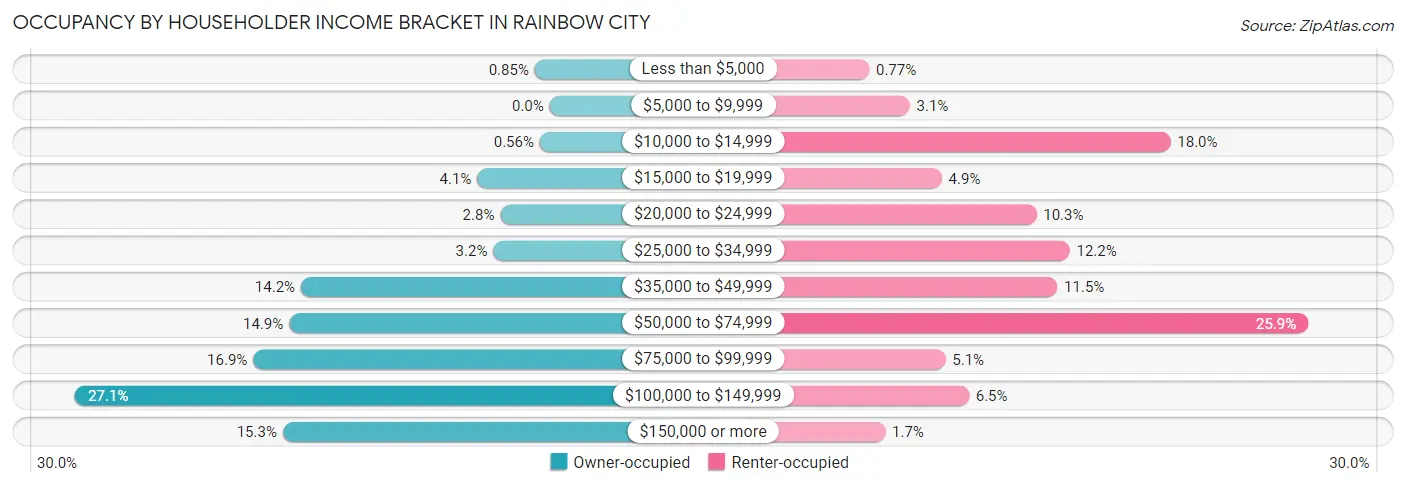
| Income Bracket | Owner-occupied | Renter-occupied |
| Less than $5,000 | 21 (0.9%) | 11 (0.8%) |
| $5,000 to $9,999 | 0 (0.0%) | 44 (3.1%) |
| $10,000 to $14,999 | 14 (0.6%) | 256 (18.0%) |
| $15,000 to $19,999 | 103 (4.1%) | 70 (4.9%) |
| $20,000 to $24,999 | 70 (2.8%) | 147 (10.3%) |
| $25,000 to $34,999 | 80 (3.2%) | 174 (12.2%) |
| $35,000 to $49,999 | 353 (14.2%) | 164 (11.5%) |
| $50,000 to $74,999 | 370 (14.9%) | 368 (25.9%) |
| $75,000 to $99,999 | 421 (16.9%) | 73 (5.1%) |
| $100,000 to $149,999 | 674 (27.1%) | 92 (6.5%) |
| $150,000 or more | 379 (15.2%) | 24 (1.7%) |
| Total | 2,485 (100.0%) | 1,423 (100.0%) |
Monthly Housing Cost Tiers in Rainbow City
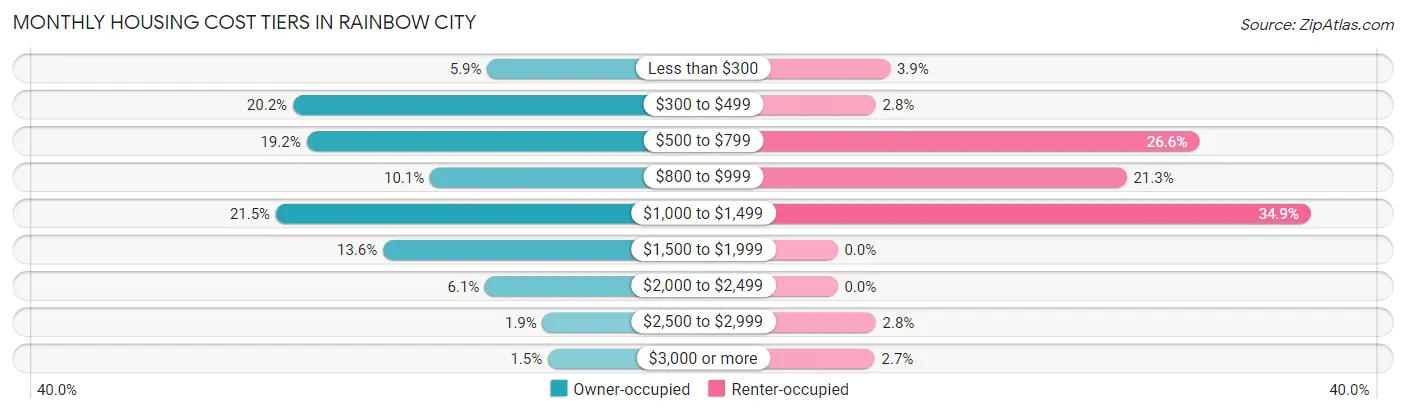
| Monthly Cost | Owner-occupied | Renter-occupied |
| Less than $300 | 147 (5.9%) | 55 (3.9%) |
| $300 to $499 | 503 (20.2%) | 40 (2.8%) |
| $500 to $799 | 478 (19.2%) | 379 (26.6%) |
| $800 to $999 | 252 (10.1%) | 303 (21.3%) |
| $1,000 to $1,499 | 534 (21.5%) | 496 (34.9%) |
| $1,500 to $1,999 | 338 (13.6%) | 0 (0.0%) |
| $2,000 to $2,499 | 151 (6.1%) | 0 (0.0%) |
| $2,500 to $2,999 | 46 (1.8%) | 40 (2.8%) |
| $3,000 or more | 36 (1.5%) | 39 (2.7%) |
| Total | 2,485 (100.0%) | 1,423 (100.0%) |
Physical Housing Characteristics in Rainbow City
Housing Structures in Rainbow City
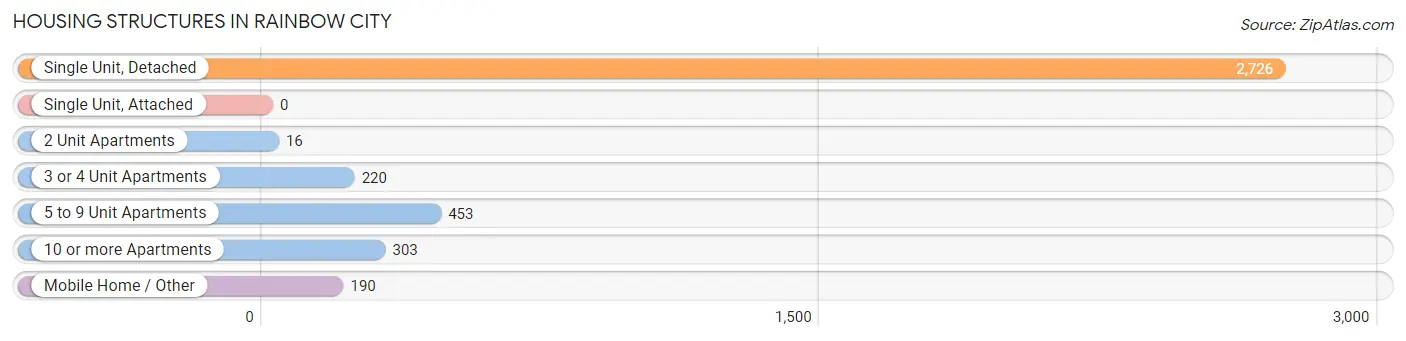
| Structure Type | # Housing Units | % Housing Units |
| Single Unit, Detached | 2,726 | 69.8% |
| Single Unit, Attached | 0 | 0.0% |
| 2 Unit Apartments | 16 | 0.4% |
| 3 or 4 Unit Apartments | 220 | 5.6% |
| 5 to 9 Unit Apartments | 453 | 11.6% |
| 10 or more Apartments | 303 | 7.7% |
| Mobile Home / Other | 190 | 4.9% |
| Total | 3,908 | 100.0% |
Housing Structures by Occupancy in Rainbow City
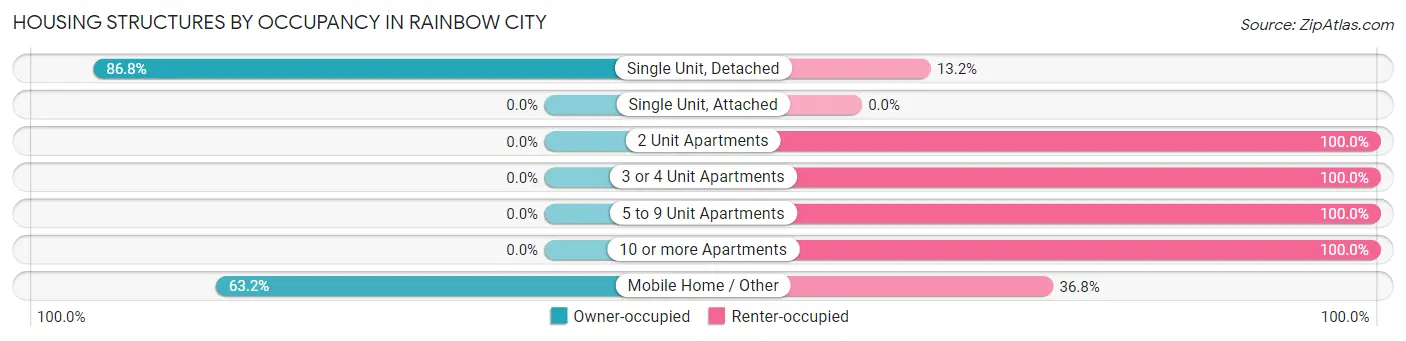
| Structure Type | Owner-occupied | Renter-occupied |
| Single Unit, Detached | 2,365 (86.8%) | 361 (13.2%) |
| Single Unit, Attached | 0 (0.0%) | 0 (0.0%) |
| 2 Unit Apartments | 0 (0.0%) | 16 (100.0%) |
| 3 or 4 Unit Apartments | 0 (0.0%) | 220 (100.0%) |
| 5 to 9 Unit Apartments | 0 (0.0%) | 453 (100.0%) |
| 10 or more Apartments | 0 (0.0%) | 303 (100.0%) |
| Mobile Home / Other | 120 (63.2%) | 70 (36.8%) |
| Total | 2,485 (63.6%) | 1,423 (36.4%) |
Housing Structures by Number of Rooms in Rainbow City
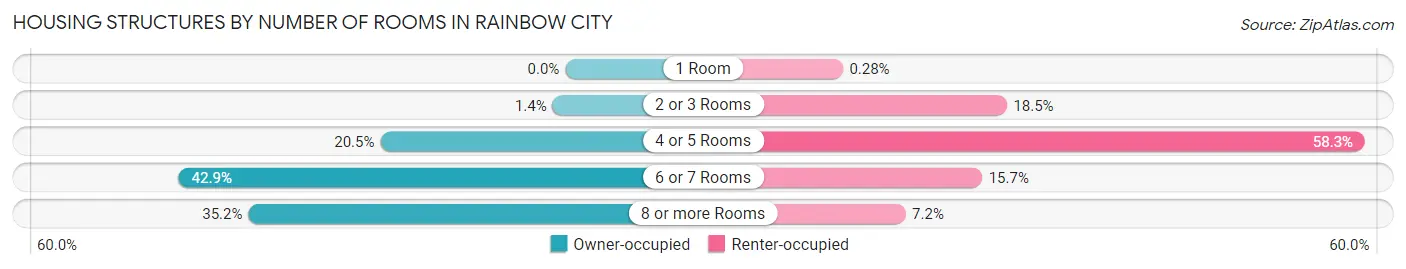
| Number of Rooms | Owner-occupied | Renter-occupied |
| 1 Room | 0 (0.0%) | 4 (0.3%) |
| 2 or 3 Rooms | 35 (1.4%) | 263 (18.5%) |
| 4 or 5 Rooms | 510 (20.5%) | 829 (58.3%) |
| 6 or 7 Rooms | 1,066 (42.9%) | 224 (15.7%) |
| 8 or more Rooms | 874 (35.2%) | 103 (7.2%) |
| Total | 2,485 (100.0%) | 1,423 (100.0%) |
Housing Structure by Heating Type in Rainbow City
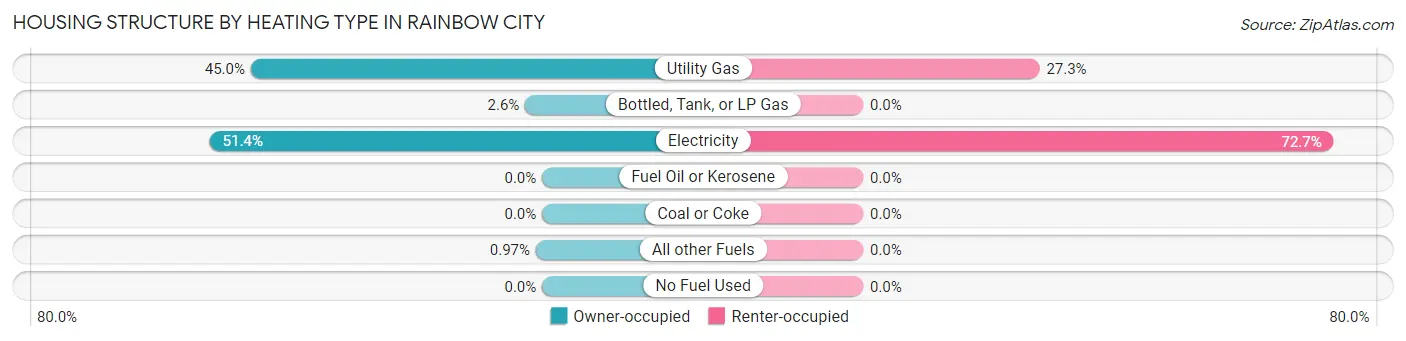
| Heating Type | Owner-occupied | Renter-occupied |
| Utility Gas | 1,119 (45.0%) | 388 (27.3%) |
| Bottled, Tank, or LP Gas | 65 (2.6%) | 0 (0.0%) |
| Electricity | 1,277 (51.4%) | 1,035 (72.7%) |
| Fuel Oil or Kerosene | 0 (0.0%) | 0 (0.0%) |
| Coal or Coke | 0 (0.0%) | 0 (0.0%) |
| All other Fuels | 24 (1.0%) | 0 (0.0%) |
| No Fuel Used | 0 (0.0%) | 0 (0.0%) |
| Total | 2,485 (100.0%) | 1,423 (100.0%) |
Household Vehicle Usage in Rainbow City
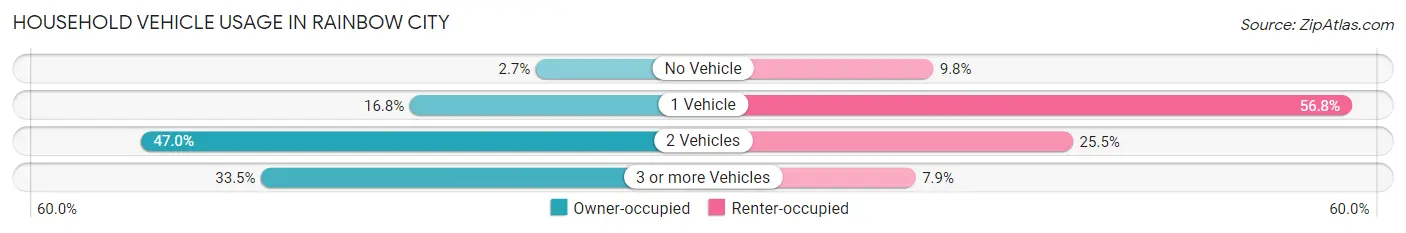
| Vehicles per Household | Owner-occupied | Renter-occupied |
| No Vehicle | 67 (2.7%) | 140 (9.8%) |
| 1 Vehicle | 418 (16.8%) | 808 (56.8%) |
| 2 Vehicles | 1,168 (47.0%) | 363 (25.5%) |
| 3 or more Vehicles | 832 (33.5%) | 112 (7.9%) |
| Total | 2,485 (100.0%) | 1,423 (100.0%) |
Real Estate & Mortgages in Rainbow City
Real Estate and Mortgage Overview in Rainbow City
| Characteristic | Without Mortgage | With Mortgage |
| Housing Units | 1,166 | 1,319 |
| Median Property Value | $220,400 | $168,400 |
| Median Household Income | $61,442 | $288 |
| Monthly Housing Costs | $476 | $36 |
| Real Estate Taxes | $666 | $50 |
Property Value by Mortgage Status in Rainbow City
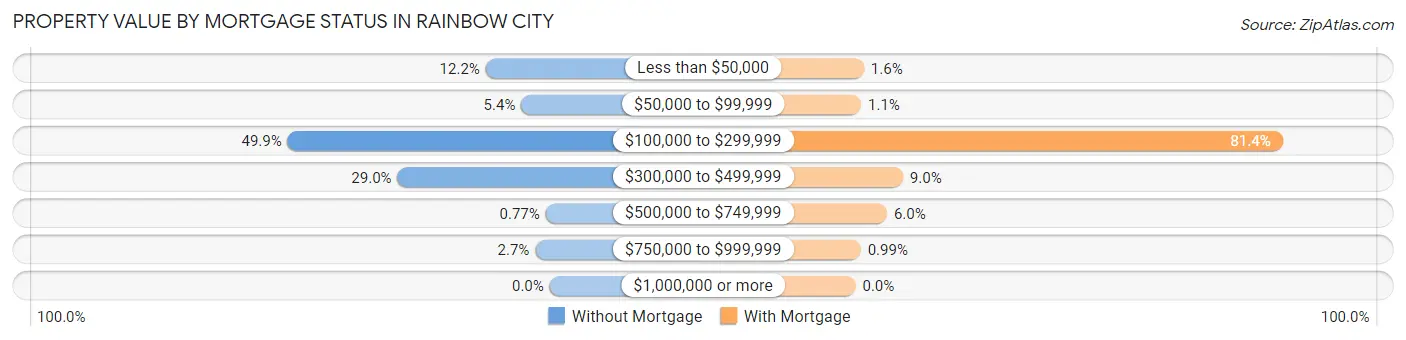
| Property Value | Without Mortgage | With Mortgage |
| Less than $50,000 | 142 (12.2%) | 21 (1.6%) |
| $50,000 to $99,999 | 63 (5.4%) | 14 (1.1%) |
| $100,000 to $299,999 | 582 (49.9%) | 1,073 (81.4%) |
| $300,000 to $499,999 | 338 (29.0%) | 119 (9.0%) |
| $500,000 to $749,999 | 9 (0.8%) | 79 (6.0%) |
| $750,000 to $999,999 | 32 (2.7%) | 13 (1.0%) |
| $1,000,000 or more | 0 (0.0%) | 0 (0.0%) |
| Total | 1,166 (100.0%) | 1,319 (100.0%) |
Household Income by Mortgage Status in Rainbow City
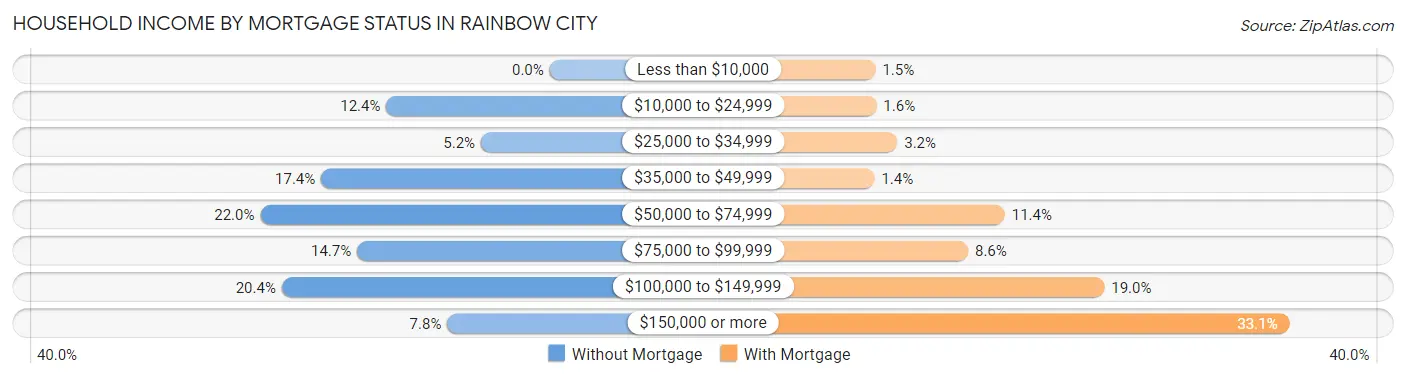
| Household Income | Without Mortgage | With Mortgage |
| Less than $10,000 | 0 (0.0%) | 20 (1.5%) |
| $10,000 to $24,999 | 145 (12.4%) | 21 (1.6%) |
| $25,000 to $34,999 | 61 (5.2%) | 42 (3.2%) |
| $35,000 to $49,999 | 203 (17.4%) | 19 (1.4%) |
| $50,000 to $74,999 | 257 (22.0%) | 150 (11.4%) |
| $75,000 to $99,999 | 171 (14.7%) | 113 (8.6%) |
| $100,000 to $149,999 | 238 (20.4%) | 250 (19.0%) |
| $150,000 or more | 91 (7.8%) | 436 (33.1%) |
| Total | 1,166 (100.0%) | 1,319 (100.0%) |
Property Value to Household Income Ratio in Rainbow City
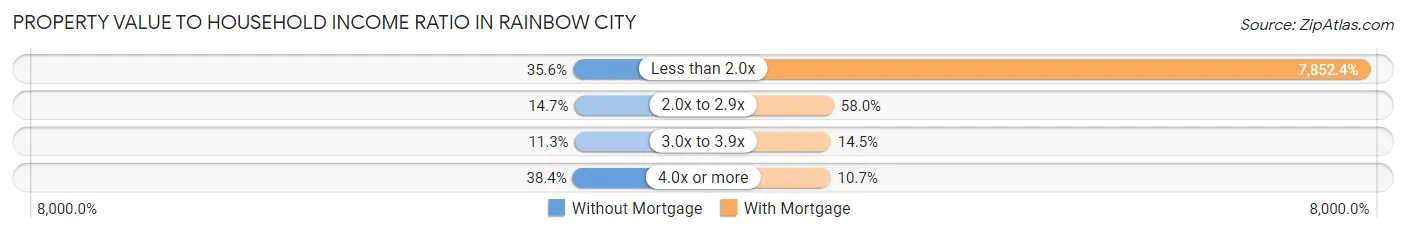
| Value-to-Income Ratio | Without Mortgage | With Mortgage |
| Less than 2.0x | 415 (35.6%) | 103,573 (7,852.4%) |
| 2.0x to 2.9x | 171 (14.7%) | 765 (58.0%) |
| 3.0x to 3.9x | 132 (11.3%) | 191 (14.5%) |
| 4.0x or more | 448 (38.4%) | 141 (10.7%) |
| Total | 1,166 (100.0%) | 1,319 (100.0%) |
Real Estate Taxes by Mortgage Status in Rainbow City
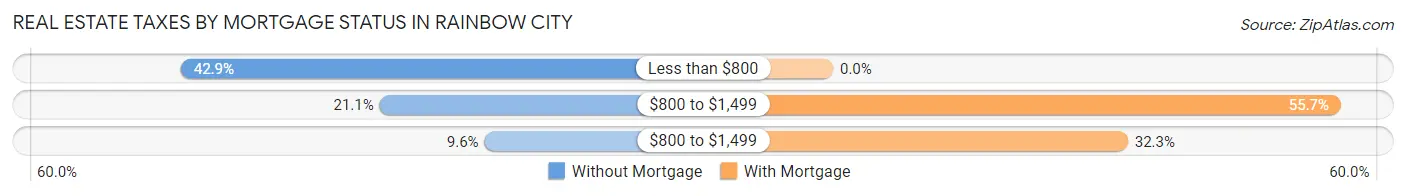
| Property Taxes | Without Mortgage | With Mortgage |
| Less than $800 | 500 (42.9%) | 0 (0.0%) |
| $800 to $1,499 | 246 (21.1%) | 734 (55.6%) |
| $800 to $1,499 | 112 (9.6%) | 426 (32.3%) |
| Total | 1,166 (100.0%) | 1,319 (100.0%) |
Health & Disability in Rainbow City
Health Insurance Coverage by Age in Rainbow City
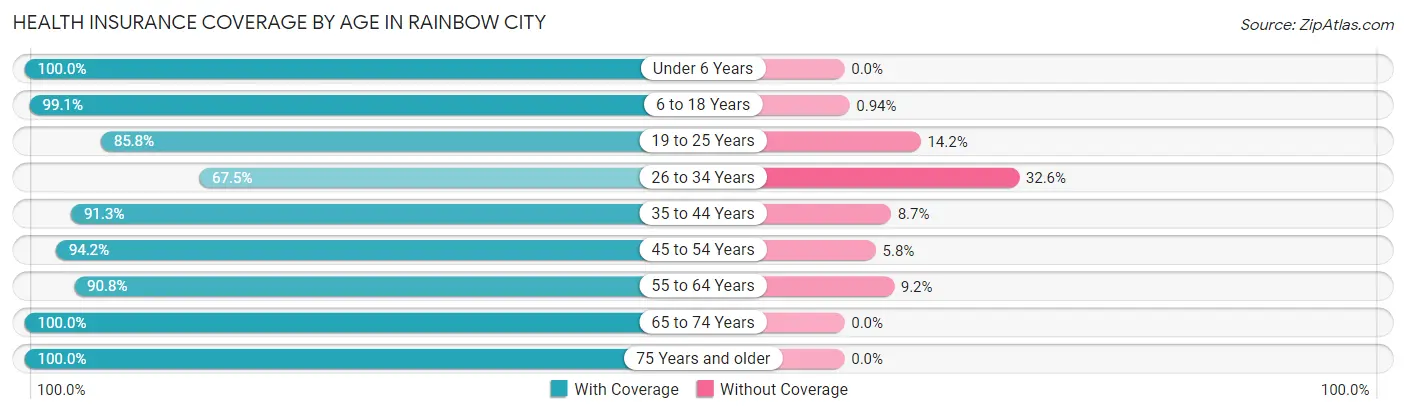
| Age Bracket | With Coverage | Without Coverage |
| Under 6 Years | 498 (100.0%) | 0 (0.0%) |
| 6 to 18 Years | 1,794 (99.1%) | 17 (0.9%) |
| 19 to 25 Years | 785 (85.8%) | 130 (14.2%) |
| 26 to 34 Years | 864 (67.4%) | 417 (32.6%) |
| 35 to 44 Years | 897 (91.3%) | 85 (8.7%) |
| 45 to 54 Years | 1,611 (94.2%) | 100 (5.8%) |
| 55 to 64 Years | 964 (90.8%) | 98 (9.2%) |
| 65 to 74 Years | 992 (100.0%) | 0 (0.0%) |
| 75 Years and older | 907 (100.0%) | 0 (0.0%) |
| Total | 9,312 (91.7%) | 847 (8.3%) |
Health Insurance Coverage by Citizenship Status in Rainbow City
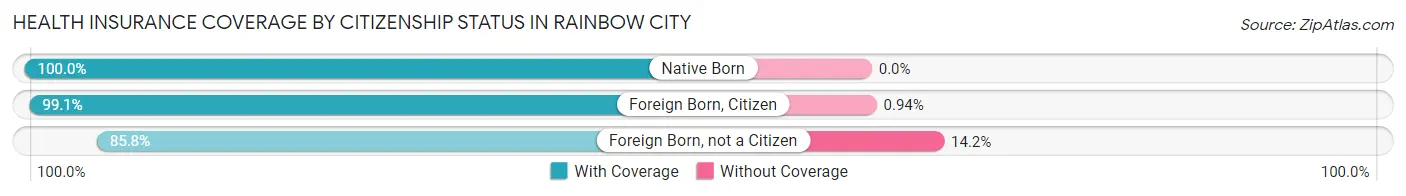
| Citizenship Status | With Coverage | Without Coverage |
| Native Born | 498 (100.0%) | 0 (0.0%) |
| Foreign Born, Citizen | 1,794 (99.1%) | 17 (0.9%) |
| Foreign Born, not a Citizen | 785 (85.8%) | 130 (14.2%) |
Health Insurance Coverage by Household Income in Rainbow City
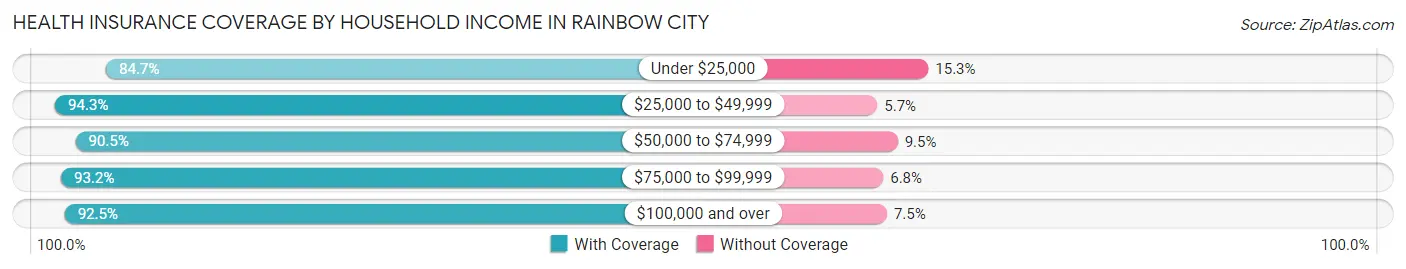
| Household Income | With Coverage | Without Coverage |
| Under $25,000 | 981 (84.7%) | 177 (15.3%) |
| $25,000 to $49,999 | 1,632 (94.3%) | 99 (5.7%) |
| $50,000 to $74,999 | 1,527 (90.5%) | 161 (9.5%) |
| $75,000 to $99,999 | 1,322 (93.2%) | 97 (6.8%) |
| $100,000 and over | 3,838 (92.5%) | 312 (7.5%) |
Public vs Private Health Insurance Coverage by Age in Rainbow City
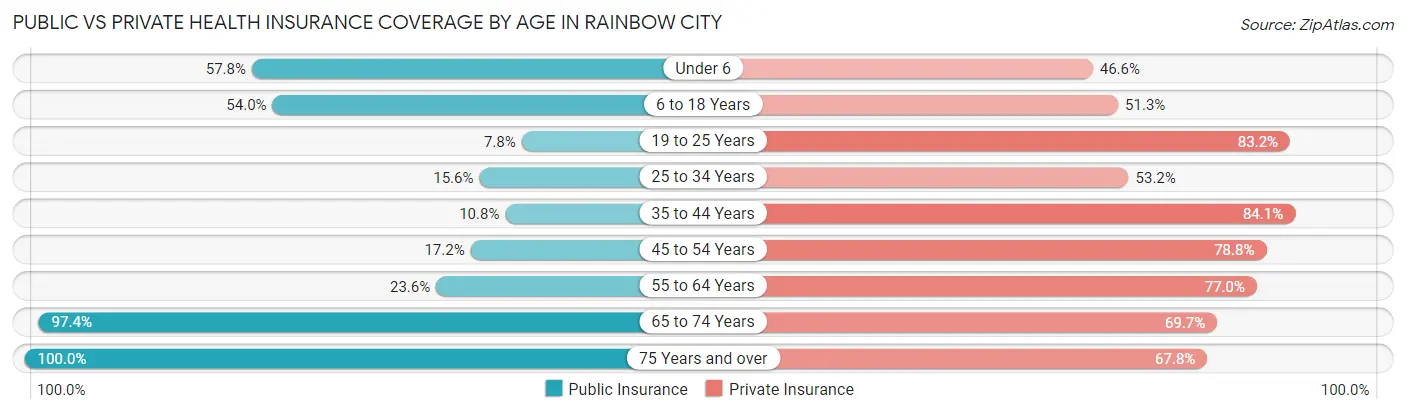
| Age Bracket | Public Insurance | Private Insurance |
| Under 6 | 288 (57.8%) | 232 (46.6%) |
| 6 to 18 Years | 978 (54.0%) | 929 (51.3%) |
| 19 to 25 Years | 71 (7.8%) | 761 (83.2%) |
| 25 to 34 Years | 200 (15.6%) | 682 (53.2%) |
| 35 to 44 Years | 106 (10.8%) | 826 (84.1%) |
| 45 to 54 Years | 295 (17.2%) | 1,348 (78.8%) |
| 55 to 64 Years | 251 (23.6%) | 818 (77.0%) |
| 65 to 74 Years | 966 (97.4%) | 691 (69.7%) |
| 75 Years and over | 907 (100.0%) | 615 (67.8%) |
| Total | 4,062 (40.0%) | 6,902 (67.9%) |
Disability Status by Sex by Age in Rainbow City
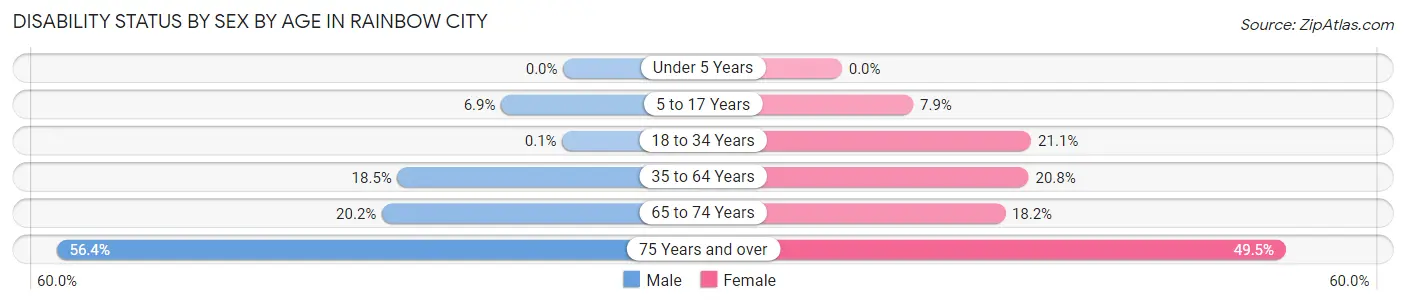
| Age Bracket | Male | Female |
| Under 5 Years | 0 (0.0%) | 0 (0.0%) |
| 5 to 17 Years | 45 (6.9%) | 97 (7.9%) |
| 18 to 34 Years | 1 (0.1%) | 248 (21.1%) |
| 35 to 64 Years | 314 (18.4%) | 427 (20.8%) |
| 65 to 74 Years | 88 (20.2%) | 101 (18.2%) |
| 75 Years and over | 206 (56.4%) | 268 (49.4%) |
Disability Class by Sex by Age in Rainbow City
Disability Class: Hearing Difficulty
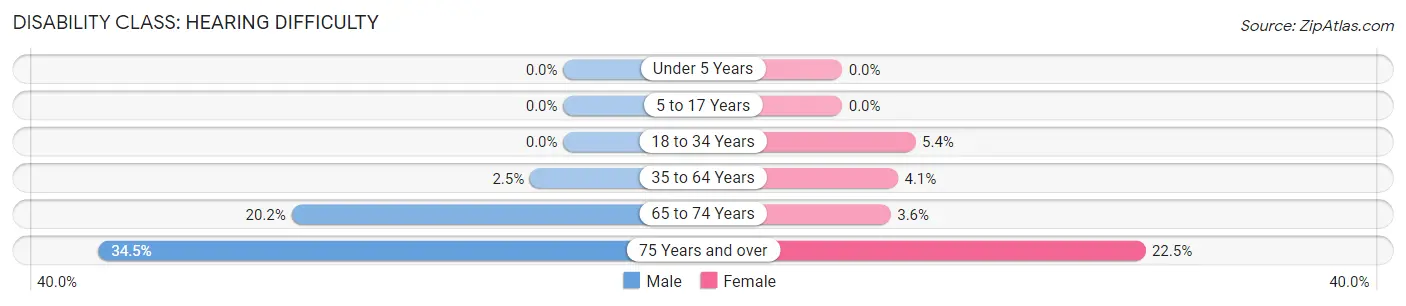
| Age Bracket | Male | Female |
| Under 5 Years | 0 (0.0%) | 0 (0.0%) |
| 5 to 17 Years | 0 (0.0%) | 0 (0.0%) |
| 18 to 34 Years | 0 (0.0%) | 64 (5.4%) |
| 35 to 64 Years | 42 (2.5%) | 85 (4.1%) |
| 65 to 74 Years | 88 (20.2%) | 20 (3.6%) |
| 75 Years and over | 126 (34.5%) | 122 (22.5%) |
Disability Class: Vision Difficulty
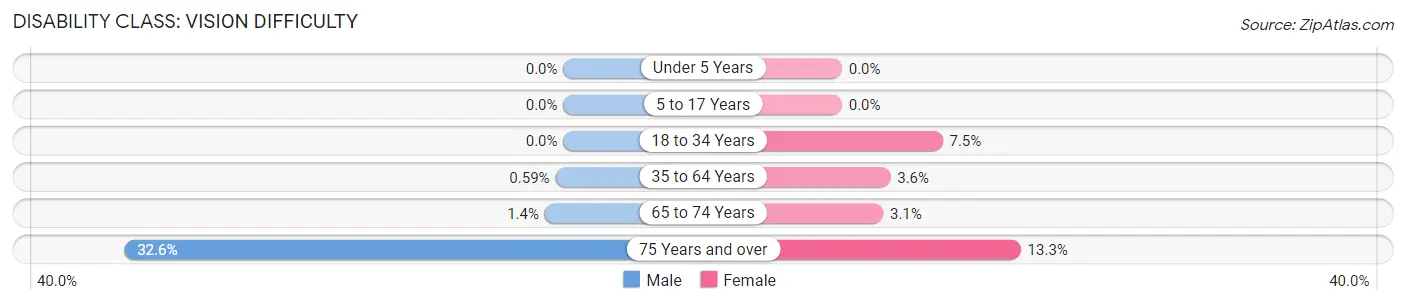
| Age Bracket | Male | Female |
| Under 5 Years | 0 (0.0%) | 0 (0.0%) |
| 5 to 17 Years | 0 (0.0%) | 0 (0.0%) |
| 18 to 34 Years | 0 (0.0%) | 88 (7.5%) |
| 35 to 64 Years | 10 (0.6%) | 74 (3.6%) |
| 65 to 74 Years | 6 (1.4%) | 17 (3.1%) |
| 75 Years and over | 119 (32.6%) | 72 (13.3%) |
Disability Class: Cognitive Difficulty
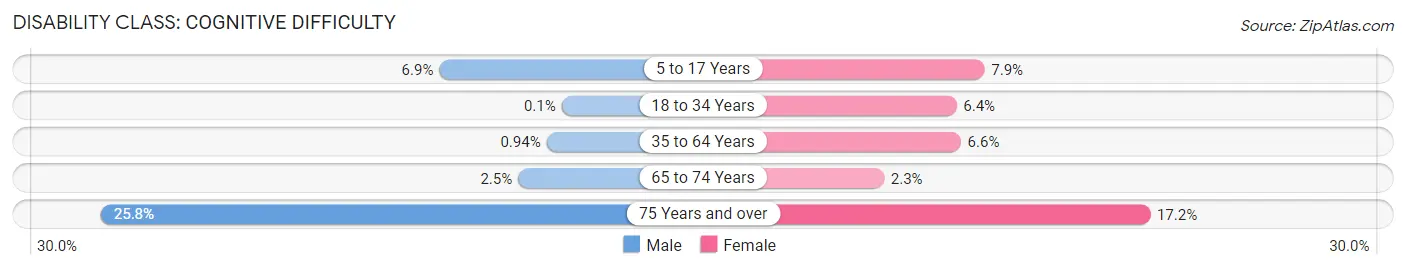
| Age Bracket | Male | Female |
| 5 to 17 Years | 45 (6.9%) | 97 (7.9%) |
| 18 to 34 Years | 1 (0.1%) | 75 (6.4%) |
| 35 to 64 Years | 16 (0.9%) | 136 (6.6%) |
| 65 to 74 Years | 11 (2.5%) | 13 (2.3%) |
| 75 Years and over | 94 (25.8%) | 93 (17.2%) |
Disability Class: Ambulatory Difficulty
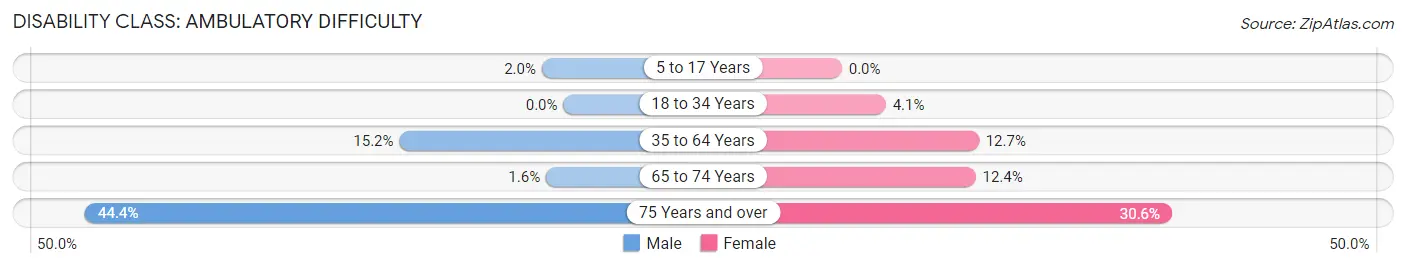
| Age Bracket | Male | Female |
| 5 to 17 Years | 13 (2.0%) | 0 (0.0%) |
| 18 to 34 Years | 0 (0.0%) | 48 (4.1%) |
| 35 to 64 Years | 259 (15.2%) | 261 (12.7%) |
| 65 to 74 Years | 7 (1.6%) | 69 (12.4%) |
| 75 Years and over | 162 (44.4%) | 166 (30.6%) |
Disability Class: Self-Care Difficulty
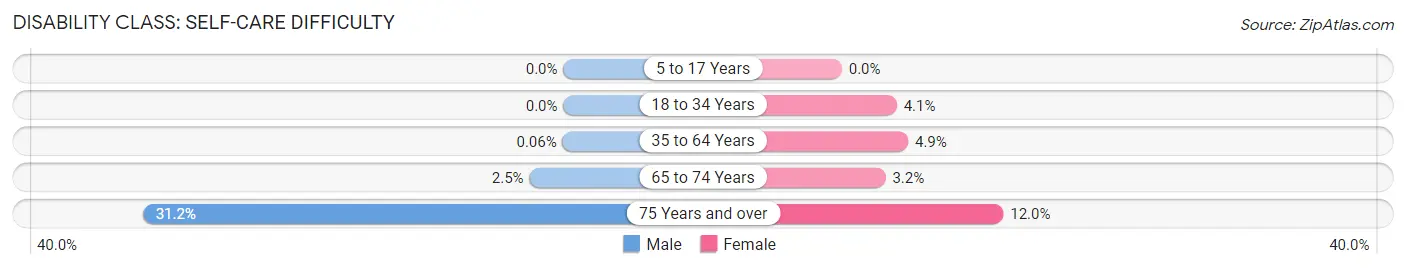
| Age Bracket | Male | Female |
| 5 to 17 Years | 0 (0.0%) | 0 (0.0%) |
| 18 to 34 Years | 0 (0.0%) | 48 (4.1%) |
| 35 to 64 Years | 1 (0.1%) | 101 (4.9%) |
| 65 to 74 Years | 11 (2.5%) | 18 (3.2%) |
| 75 Years and over | 114 (31.2%) | 65 (12.0%) |
Technology Access in Rainbow City
Computing Device Access in Rainbow City
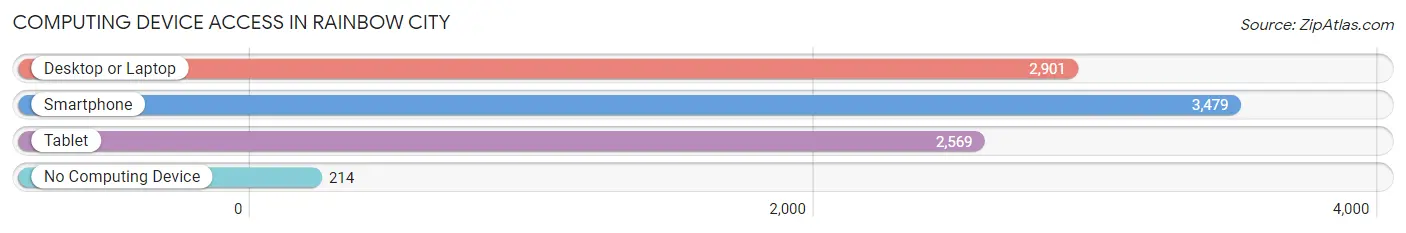
| Device Type | # Households | % Households |
| Desktop or Laptop | 2,901 | 74.2% |
| Smartphone | 3,479 | 89.0% |
| Tablet | 2,569 | 65.7% |
| No Computing Device | 214 | 5.5% |
| Total | 3,908 | 100.0% |
Internet Access in Rainbow City
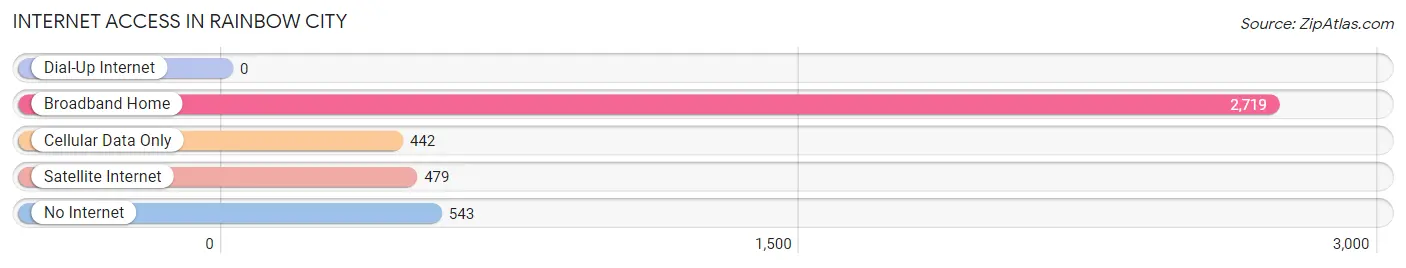
| Internet Type | # Households | % Households |
| Dial-Up Internet | 0 | 0.0% |
| Broadband Home | 2,719 | 69.6% |
| Cellular Data Only | 442 | 11.3% |
| Satellite Internet | 479 | 12.3% |
| No Internet | 543 | 13.9% |
| Total | 3,908 | 100.0% |
Rainbow City Summary
Rainbow City, Alabama is a small city located in Etowah County, Alabama. It is situated in the foothills of the Appalachian Mountains and is part of the Gadsden Metropolitan Statistical Area. The city has a population of approximately 8,000 people and is known for its small-town charm and friendly atmosphere.
History
Rainbow City was founded in the late 1800s by a group of settlers from Georgia. The city was originally known as “The Crossroads” due to its location at the intersection of two major roads. The city was officially incorporated in 1951 and was named after the nearby Rainbow Creek.
Geography
Rainbow City is located in the foothills of the Appalachian Mountains in Etowah County, Alabama. The city is situated at the intersection of two major roads, US Highway 411 and Alabama State Route 77. The city is located approximately 20 miles northeast of Gadsden and approximately 40 miles southwest of Birmingham. The city has a total area of 4.2 square miles, all of which is land.
Economy
Rainbow City’s economy is largely based on manufacturing and retail. The city is home to several manufacturing plants, including a paper mill, a steel mill, and a plastics plant. The city also has a number of retail stores, including a Walmart Supercenter, a Lowe’s Home Improvement store, and a variety of other stores.
Demographics
As of the 2010 census, Rainbow City had a population of 8,113 people. The racial makeup of the city was 79.2% White, 16.2% African American, 0.4% Native American, 0.7% Asian, 0.1% Pacific Islander, 1.7% from other races, and 1.7% from two or more races. Hispanic or Latino of any race were 3.3% of the population.
The median income for a household in the city was $37,917, and the median income for a family was $45,917. The per capita income for the city was $19,917. About 11.2% of families and 14.2% of the population were below the poverty line, including 19.2% of those under age 18 and 8.2% of those age 65 or over.
Rainbow City is a small city with a rich history and a friendly atmosphere. The city has a diverse economy and a population that is diverse in terms of race and ethnicity. The city is a great place to live and work, and it is a great place to raise a family.
Common Questions
What is Per Capita Income in Rainbow City?
Per Capita income in Rainbow City is $34,622.
What is the Median Family Income in Rainbow City?
Median Family Income in Rainbow City is $86,037.
What is the Median Household income in Rainbow City?
Median Household Income in Rainbow City is $60,260.
What is Income or Wage Gap in Rainbow City?
Income or Wage Gap in Rainbow City is 31.5%.
Women in Rainbow City earn 68.5 cents for every dollar earned by a man.
What is Family Income Deficit in Rainbow City?
Family Income Deficit in Rainbow City is $10,744.
Families that are below poverty line in Rainbow City earn $10,744 less on average than the poverty threshold level.
What is Inequality or Gini Index in Rainbow City?
Inequality or Gini Index in Rainbow City is 0.45.
What is the Total Population of Rainbow City?
Total Population of Rainbow City is 10,184.
What is the Total Male Population of Rainbow City?
Total Male Population of Rainbow City is 4,304.
What is the Total Female Population of Rainbow City?
Total Female Population of Rainbow City is 5,880.
What is the Ratio of Males per 100 Females in Rainbow City?
There are 73.20 Males per 100 Females in Rainbow City.
What is the Ratio of Females per 100 Males in Rainbow City?
There are 136.62 Females per 100 Males in Rainbow City.
What is the Median Population Age in Rainbow City?
Median Population Age in Rainbow City is 41.0 Years.
What is the Average Family Size in Rainbow City
Average Family Size in Rainbow City is 3.2 People.
What is the Average Household Size in Rainbow City
Average Household Size in Rainbow City is 2.6 People.
How Large is the Labor Force in Rainbow City?
There are 4,773 People in the Labor Forcein in Rainbow City.
What is the Percentage of People in the Labor Force in Rainbow City?
58.8% of People are in the Labor Force in Rainbow City.
What is the Unemployment Rate in Rainbow City?
Unemployment Rate in Rainbow City is 8.3%.