Opelika, AL Map & Demographics
Opelika Map
Opelika Overview
$31,462
PER CAPITA INCOME
$77,131
AVG FAMILY INCOME
$55,218
AVG HOUSEHOLD INCOME
20.3%
WAGE / INCOME GAP [ % ]
79.7¢/ $1
WAGE / INCOME GAP [ $ ]
0.47
INEQUALITY / GINI INDEX
31,361
TOTAL POPULATION
15,339
MALE POPULATION
16,022
FEMALE POPULATION
95.74
MALES / 100 FEMALES
104.45
FEMALES / 100 MALES
39.6
MEDIAN AGE
3.2
AVG FAMILY SIZE
2.5
AVG HOUSEHOLD SIZE
15,043
LABOR FORCE [ PEOPLE ]
59.0%
PERCENT IN LABOR FORCE
5.1%
UNEMPLOYMENT RATE
Opelika Area Codes
Income in Opelika
Income Overview in Opelika
Per Capita Income in Opelika is $31,462, while median incomes of families and households are $77,131 and $55,218 respectively.
| Characteristic | Number | Measure |
| Per Capita Income | 31,361 | $31,462 |
| Median Family Income | 7,892 | $77,131 |
| Mean Family Income | 7,892 | $94,685 |
| Median Household Income | 12,295 | $55,218 |
| Mean Household Income | 12,295 | $75,687 |
| Income Deficit | 7,892 | $0 |
| Wage / Income Gap (%) | 31,361 | 20.32% |
| Wage / Income Gap ($) | 31,361 | 79.68¢ per $1 |
| Gini / Inequality Index | 31,361 | 0.47 |
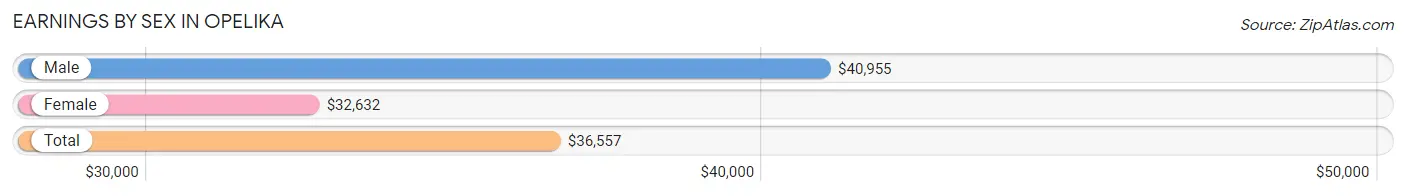
Earnings by Sex in Opelika
Average Earnings in Opelika are $36,557, $40,955 for men and $32,632 for women, a difference of 20.3%.
| Sex | Number | Average Earnings |
| Male | 7,913 (52.1%) | $40,955 |
| Female | 7,266 (47.9%) | $32,632 |
| Total | 15,179 (100.0%) | $36,557 |
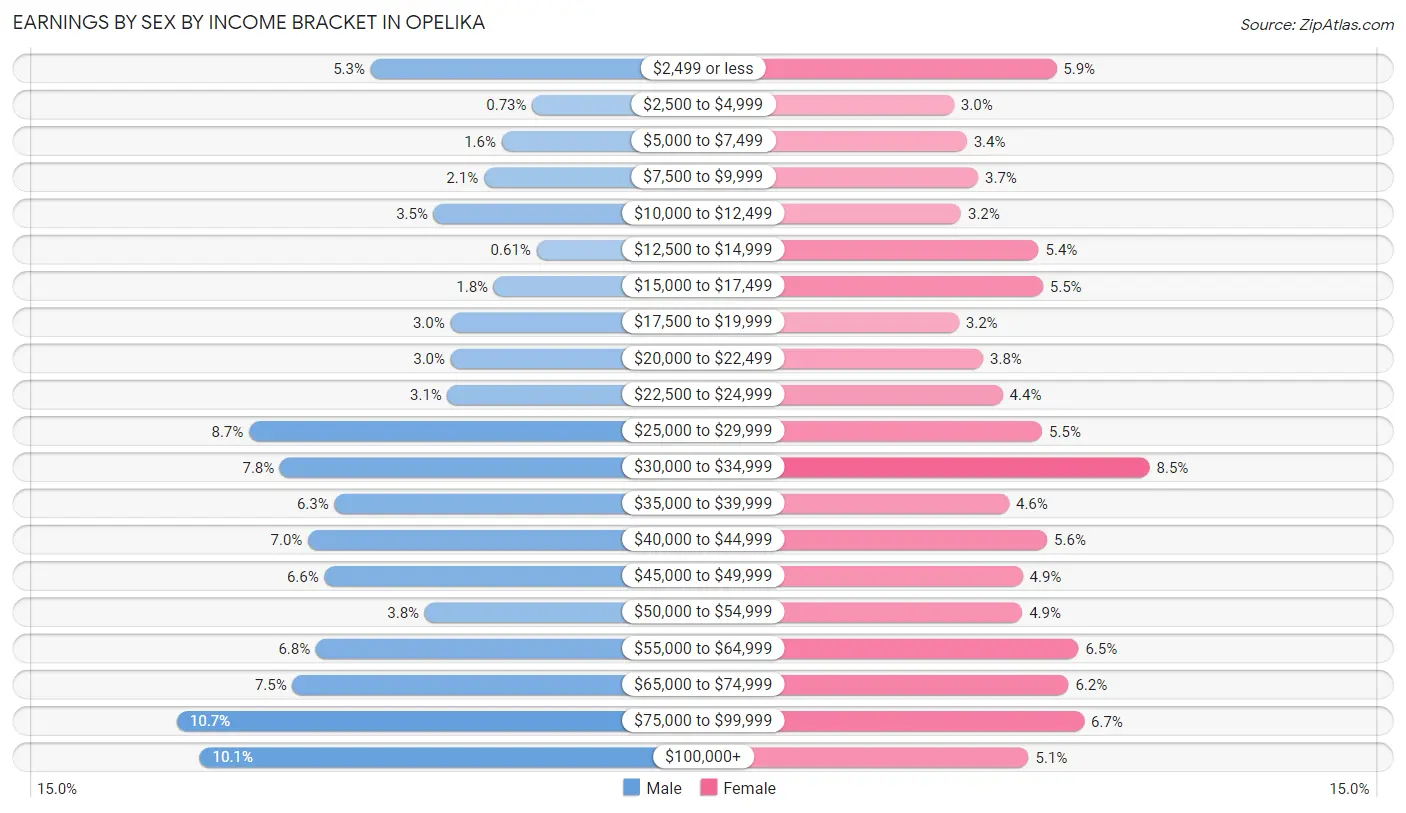
Earnings by Sex by Income Bracket in Opelika
The most common earnings brackets in Opelika are $75,000 to $99,999 for men (848 | 10.7%) and $30,000 to $34,999 for women (618 | 8.5%).
| Income | Male | Female |
| $2,499 or less | 417 (5.3%) | 428 (5.9%) |
| $2,500 to $4,999 | 58 (0.7%) | 219 (3.0%) |
| $5,000 to $7,499 | 126 (1.6%) | 245 (3.4%) |
| $7,500 to $9,999 | 165 (2.1%) | 268 (3.7%) |
| $10,000 to $12,499 | 277 (3.5%) | 233 (3.2%) |
| $12,500 to $14,999 | 48 (0.6%) | 392 (5.4%) |
| $15,000 to $17,499 | 143 (1.8%) | 400 (5.5%) |
| $17,500 to $19,999 | 240 (3.0%) | 229 (3.2%) |
| $20,000 to $22,499 | 239 (3.0%) | 278 (3.8%) |
| $22,500 to $24,999 | 246 (3.1%) | 318 (4.4%) |
| $25,000 to $29,999 | 688 (8.7%) | 399 (5.5%) |
| $30,000 to $34,999 | 619 (7.8%) | 618 (8.5%) |
| $35,000 to $39,999 | 498 (6.3%) | 331 (4.6%) |
| $40,000 to $44,999 | 556 (7.0%) | 409 (5.6%) |
| $45,000 to $49,999 | 520 (6.6%) | 359 (4.9%) |
| $50,000 to $54,999 | 297 (3.7%) | 358 (4.9%) |
| $55,000 to $64,999 | 539 (6.8%) | 473 (6.5%) |
| $65,000 to $74,999 | 591 (7.5%) | 453 (6.2%) |
| $75,000 to $99,999 | 848 (10.7%) | 485 (6.7%) |
| $100,000+ | 798 (10.1%) | 371 (5.1%) |
| Total | 7,913 (100.0%) | 7,266 (100.0%) |
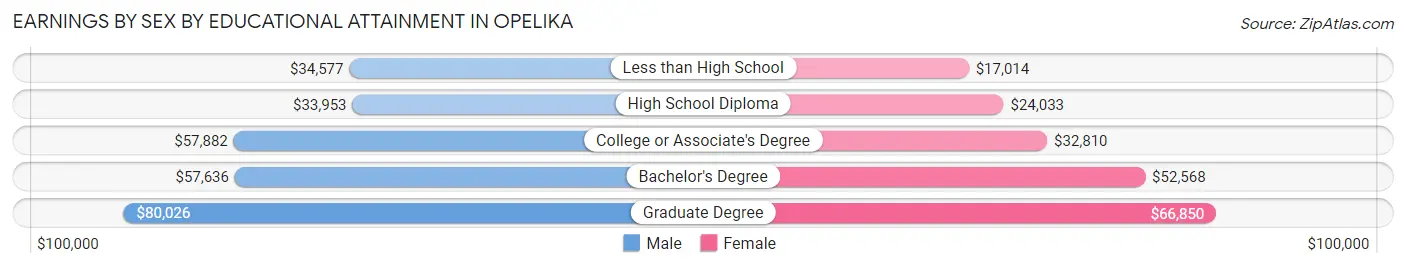
Earnings by Sex by Educational Attainment in Opelika
Average earnings in Opelika are $47,206 for men and $35,472 for women, a difference of 24.9%. Men with an educational attainment of graduate degree enjoy the highest average annual earnings of $80,026, while those with high school diploma education earn the least with $33,953. Women with an educational attainment of graduate degree earn the most with the average annual earnings of $66,850, while those with less than high school education have the smallest earnings of $17,014.
| Educational Attainment | Male Income | Female Income |
| Less than High School | $34,577 | $17,014 |
| High School Diploma | $33,953 | $24,033 |
| College or Associate's Degree | $57,882 | $32,810 |
| Bachelor's Degree | $57,636 | $52,568 |
| Graduate Degree | $80,026 | $66,850 |
| Total | $47,206 | $35,472 |
Family Income in Opelika
Family Income Brackets in Opelika
According to the Opelika family income data, there are 1,507 families falling into the $75,000 to $99,999 income range, which is the most common income bracket and makes up 19.1% of all families. Conversely, the $10,000 to $14,999 income bracket is the least frequent group with only 174 families (2.2%) belonging to this category.
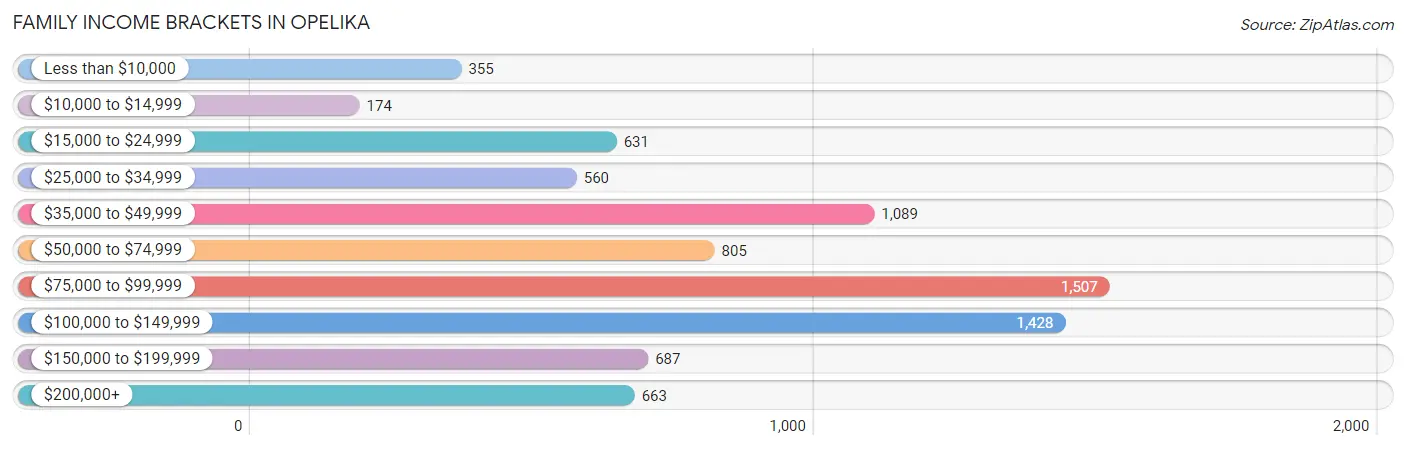
| Income Bracket | # Families | % Families |
| Less than $10,000 | 355 | 4.5% |
| $10,000 to $14,999 | 174 | 2.2% |
| $15,000 to $24,999 | 631 | 8.0% |
| $25,000 to $34,999 | 560 | 7.1% |
| $35,000 to $49,999 | 1,089 | 13.8% |
| $50,000 to $74,999 | 805 | 10.2% |
| $75,000 to $99,999 | 1,507 | 19.1% |
| $100,000 to $149,999 | 1,428 | 18.1% |
| $150,000 to $199,999 | 687 | 8.7% |
| $200,000+ | 663 | 8.4% |
Family Income by Famaliy Size in Opelika
3-person families (1,802 | 22.8%) account for the highest median family income in Opelika with $83,963 per family, while 2-person families (3,885 | 49.2%) have the highest median income of $38,537 per family member.
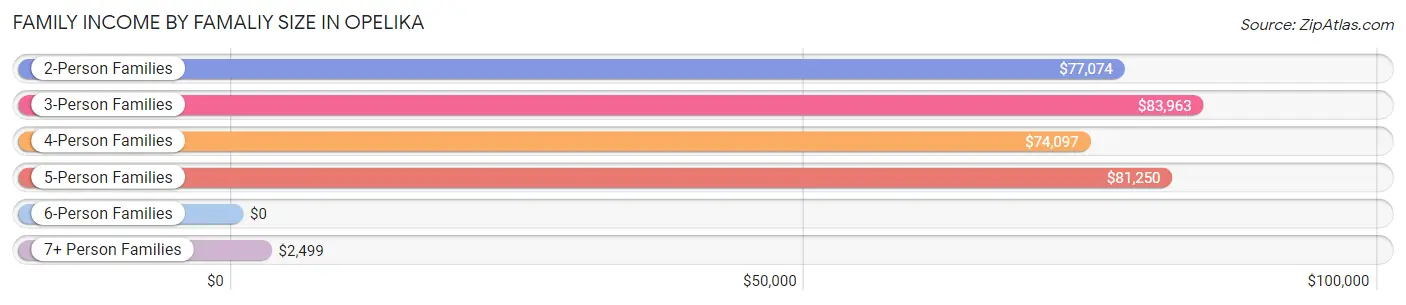
| Income Bracket | # Families | Median Income |
| 2-Person Families | 3,885 (49.2%) | $77,074 |
| 3-Person Families | 1,802 (22.8%) | $83,963 |
| 4-Person Families | 1,239 (15.7%) | $74,097 |
| 5-Person Families | 725 (9.2%) | $81,250 |
| 6-Person Families | 70 (0.9%) | $0 |
| 7+ Person Families | 171 (2.2%) | $2,499 |
| Total | 7,892 (100.0%) | $77,131 |
Family Income by Number of Earners in Opelika
The median family income in Opelika is $77,131, with families comprising 3+ earners (722) having the highest median family income of $108,636, while families with no earners (1,613) have the lowest median family income of $43,932, accounting for 9.1% and 20.4% of families, respectively.
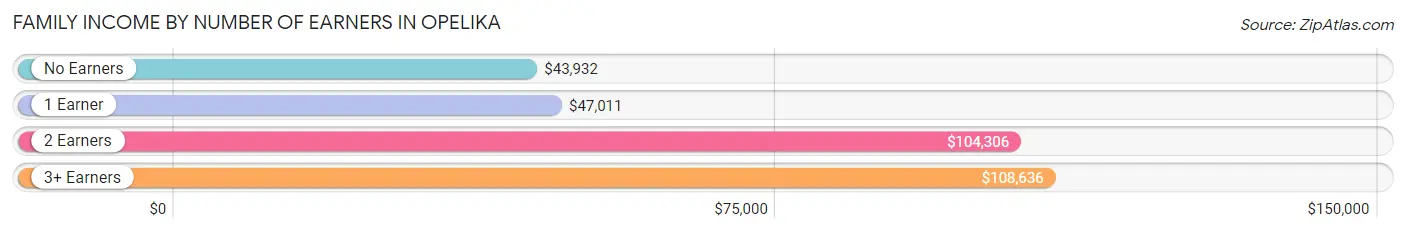
| Number of Earners | # Families | Median Income |
| No Earners | 1,613 (20.4%) | $43,932 |
| 1 Earner | 2,698 (34.2%) | $47,011 |
| 2 Earners | 2,859 (36.2%) | $104,306 |
| 3+ Earners | 722 (9.1%) | $108,636 |
| Total | 7,892 (100.0%) | $77,131 |
Household Income in Opelika
Household Income Brackets in Opelika
With 1,746 households falling in the category, the $50,000 to $74,999 income range is the most frequent in Opelika, accounting for 14.2% of all households. In contrast, only 676 households (5.5%) fall into the $200,000+ income bracket, making it the least populous group.
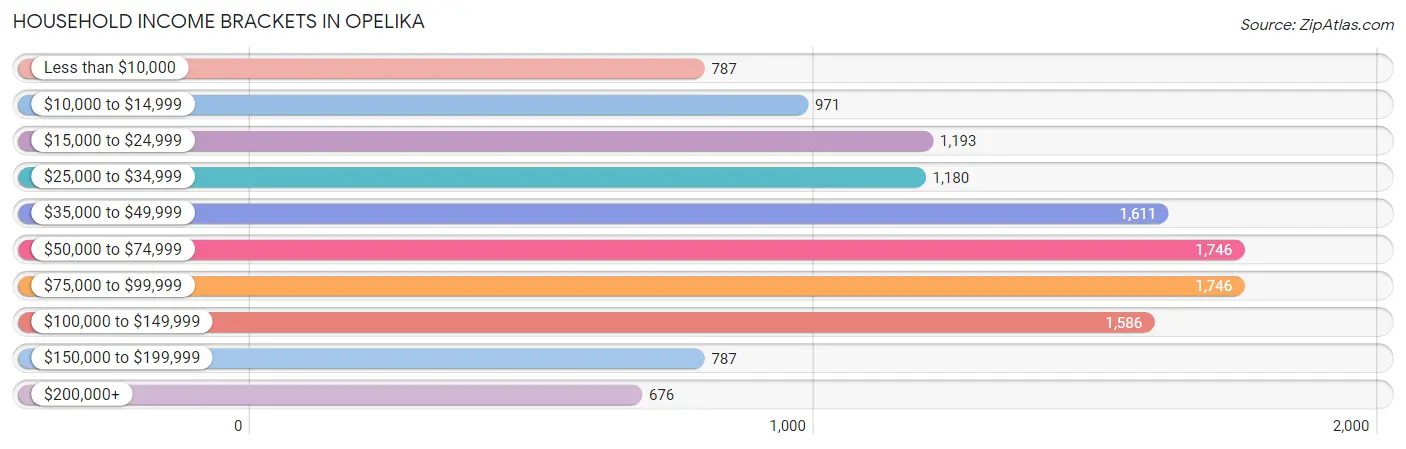
| Income Bracket | # Households | % Households |
| Less than $10,000 | 787 | 6.4% |
| $10,000 to $14,999 | 971 | 7.9% |
| $15,000 to $24,999 | 1,193 | 9.7% |
| $25,000 to $34,999 | 1,180 | 9.6% |
| $35,000 to $49,999 | 1,611 | 13.1% |
| $50,000 to $74,999 | 1,746 | 14.2% |
| $75,000 to $99,999 | 1,746 | 14.2% |
| $100,000 to $149,999 | 1,586 | 12.9% |
| $150,000 to $199,999 | 787 | 6.4% |
| $200,000+ | 676 | 5.5% |
Household Income by Householder Age in Opelika
The median household income in Opelika is $55,218, with the highest median household income of $64,073 found in the 45 to 64 years age bracket for the primary householder. A total of 4,713 households (38.3%) fall into this category. Meanwhile, the 25 to 44 years age bracket for the primary householder has the lowest median household income of $49,000, with 3,654 households (29.7%) in this group.
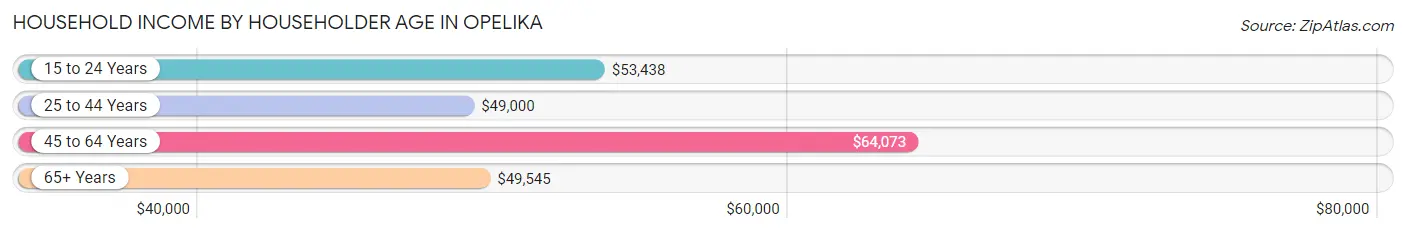
| Income Bracket | # Households | Median Income |
| 15 to 24 Years | 392 (3.2%) | $53,438 |
| 25 to 44 Years | 3,654 (29.7%) | $49,000 |
| 45 to 64 Years | 4,713 (38.3%) | $64,073 |
| 65+ Years | 3,536 (28.8%) | $49,545 |
| Total | 12,295 (100.0%) | $55,218 |
Poverty in Opelika
Income Below Poverty by Sex and Age in Opelika
With 12.7% poverty level for males and 21.9% for females among the residents of Opelika, 15 year old males and 12 to 14 year old females are the most vulnerable to poverty, with 87 males (56.1%) and 356 females (45.2%) in their respective age groups living below the poverty level.
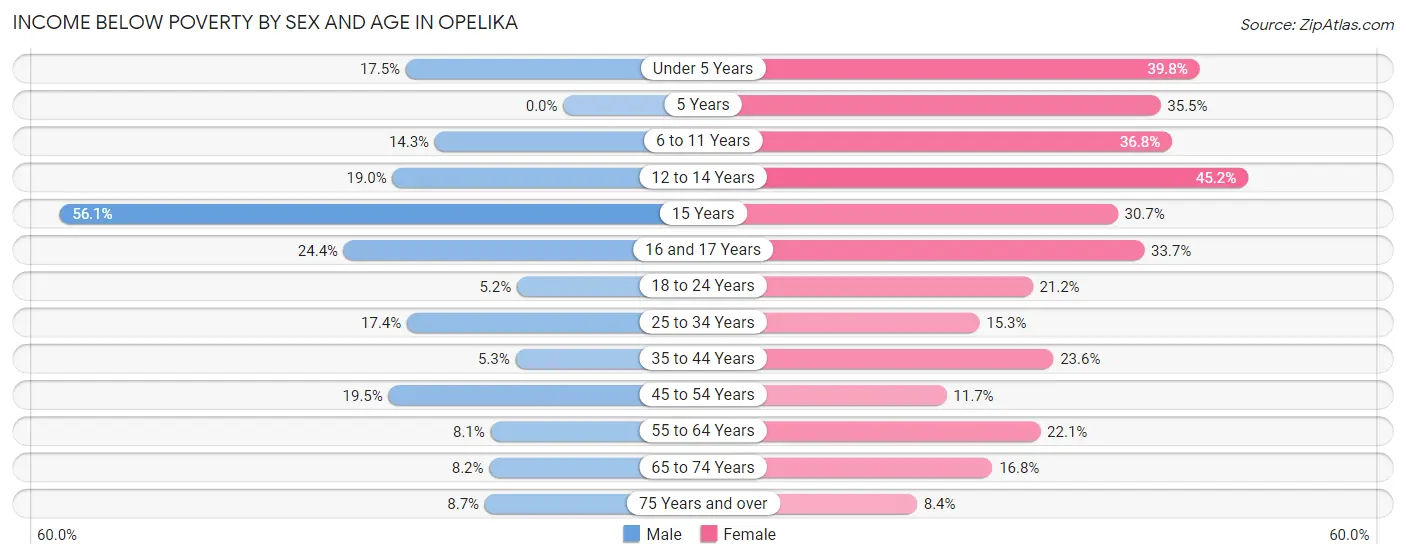
| Age Bracket | Male | Female |
| Under 5 Years | 179 (17.5%) | 404 (39.8%) |
| 5 Years | 0 (0.0%) | 55 (35.5%) |
| 6 to 11 Years | 140 (14.3%) | 249 (36.8%) |
| 12 to 14 Years | 136 (19.0%) | 356 (45.2%) |
| 15 Years | 87 (56.1%) | 39 (30.7%) |
| 16 and 17 Years | 110 (24.4%) | 205 (33.7%) |
| 18 to 24 Years | 74 (5.2%) | 252 (21.2%) |
| 25 to 34 Years | 344 (17.4%) | 344 (15.3%) |
| 35 to 44 Years | 101 (5.3%) | 444 (23.5%) |
| 45 to 54 Years | 393 (19.5%) | 216 (11.7%) |
| 55 to 64 Years | 143 (8.1%) | 511 (22.1%) |
| 65 to 74 Years | 139 (8.2%) | 303 (16.8%) |
| 75 Years and over | 63 (8.7%) | 99 (8.4%) |
| Total | 1,909 (12.7%) | 3,477 (21.9%) |
Income Above Poverty by Sex and Age in Opelika
According to the poverty statistics in Opelika, males aged 5 years and females aged 75 years and over are the age groups that are most secure financially, with 100.0% of males and 91.6% of females in these age groups living above the poverty line.
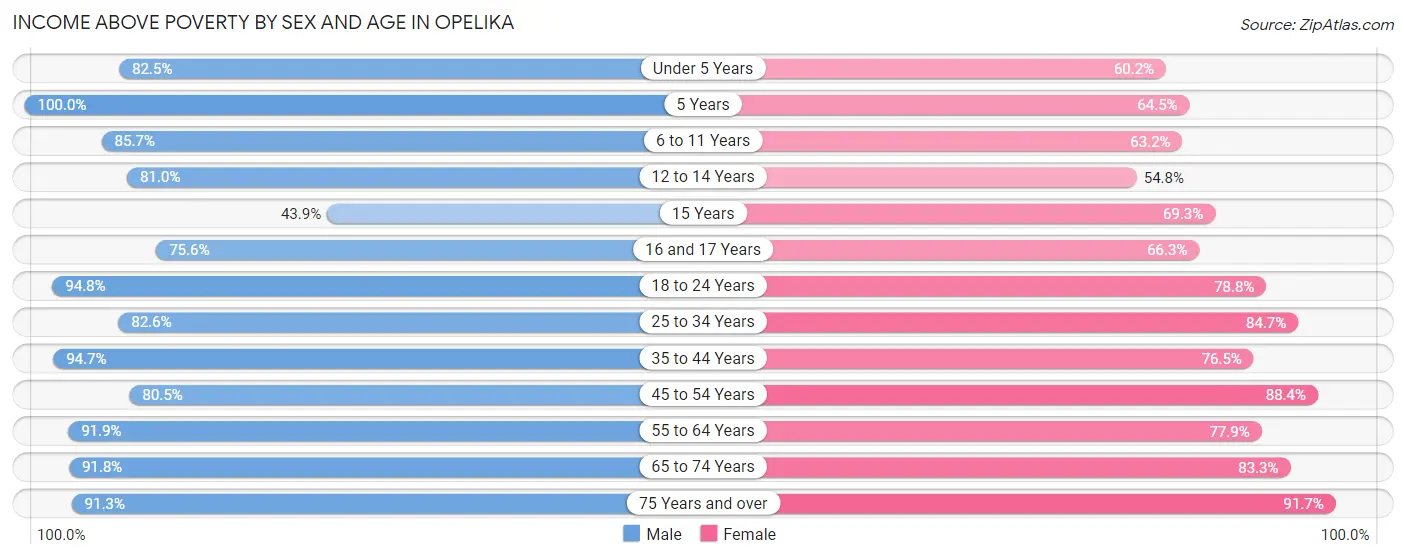
| Age Bracket | Male | Female |
| Under 5 Years | 842 (82.5%) | 610 (60.2%) |
| 5 Years | 230 (100.0%) | 100 (64.5%) |
| 6 to 11 Years | 839 (85.7%) | 428 (63.2%) |
| 12 to 14 Years | 579 (81.0%) | 431 (54.8%) |
| 15 Years | 68 (43.9%) | 88 (69.3%) |
| 16 and 17 Years | 340 (75.6%) | 404 (66.3%) |
| 18 to 24 Years | 1,359 (94.8%) | 935 (78.8%) |
| 25 to 34 Years | 1,633 (82.6%) | 1,901 (84.7%) |
| 35 to 44 Years | 1,797 (94.7%) | 1,441 (76.4%) |
| 45 to 54 Years | 1,627 (80.5%) | 1,638 (88.3%) |
| 55 to 64 Years | 1,623 (91.9%) | 1,802 (77.9%) |
| 65 to 74 Years | 1,547 (91.8%) | 1,506 (83.3%) |
| 75 Years and over | 659 (91.3%) | 1,086 (91.6%) |
| Total | 13,143 (87.3%) | 12,370 (78.1%) |
Income Below Poverty Among Married-Couple Families in Opelika
The poverty statistics for married-couple families in Opelika show that 5.7% or 308 of the total 5,407 families live below the poverty line. Families with 5 or more children have the highest poverty rate of 100.0%, comprising of 92 families. On the other hand, families with no children have the lowest poverty rate of 3.4%, which includes 114 families.
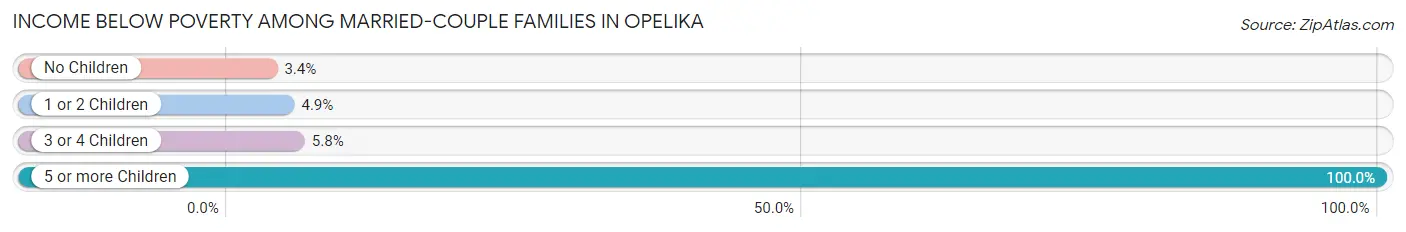
| Children | Above Poverty | Below Poverty |
| No Children | 3,210 (96.6%) | 114 (3.4%) |
| 1 or 2 Children | 1,468 (95.1%) | 76 (4.9%) |
| 3 or 4 Children | 421 (94.2%) | 26 (5.8%) |
| 5 or more Children | 0 (0.0%) | 92 (100.0%) |
| Total | 5,099 (94.3%) | 308 (5.7%) |
Income Below Poverty Among Single-Parent Households in Opelika
According to the poverty data in Opelika, 4.1% or 22 single-father households and 36.6% or 713 single-mother households are living below the poverty line. Among single-father households, those with no children have the highest poverty rate, with 22 households (8.9%) experiencing poverty. Likewise, among single-mother households, those with 3 or 4 children have the highest poverty rate, with 146 households (67.3%) falling below the poverty line.
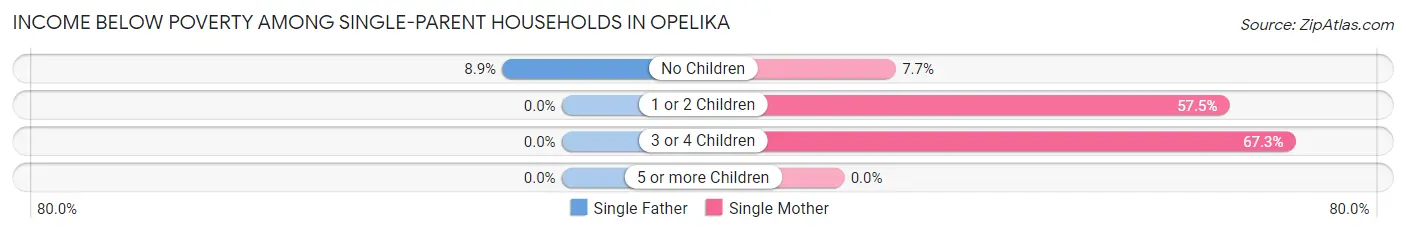
| Children | Single Father | Single Mother |
| No Children | 22 (8.9%) | 66 (7.7%) |
| 1 or 2 Children | 0 (0.0%) | 501 (57.5%) |
| 3 or 4 Children | 0 (0.0%) | 146 (67.3%) |
| 5 or more Children | 0 (0.0%) | 0 (0.0%) |
| Total | 22 (4.1%) | 713 (36.6%) |
Income Below Poverty Among Married-Couple vs Single-Parent Households in Opelika
The poverty data for Opelika shows that 308 of the married-couple family households (5.7%) and 735 of the single-parent households (29.6%) are living below the poverty level. Within the married-couple family households, those with 5 or more children have the highest poverty rate, with 92 households (100.0%) falling below the poverty line. Among the single-parent households, those with 1 or 2 children have the highest poverty rate, with 501 household (54.6%) living below poverty.
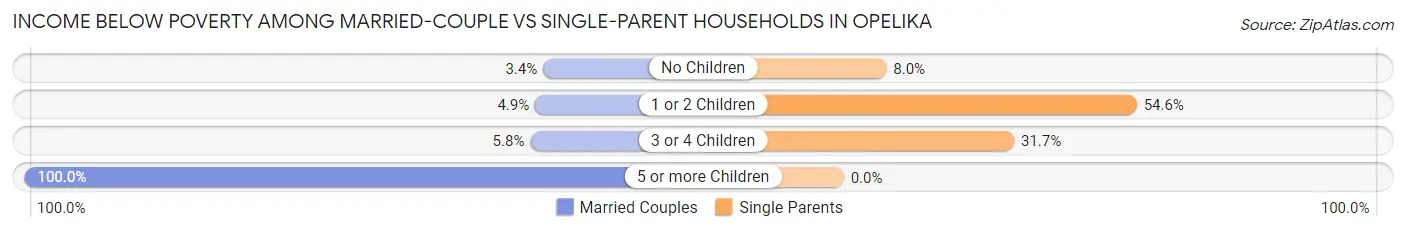
| Children | Married-Couple Families | Single-Parent Households |
| No Children | 114 (3.4%) | 88 (8.0%) |
| 1 or 2 Children | 76 (4.9%) | 501 (54.6%) |
| 3 or 4 Children | 26 (5.8%) | 146 (31.7%) |
| 5 or more Children | 92 (100.0%) | 0 (0.0%) |
| Total | 308 (5.7%) | 735 (29.6%) |
Race in Opelika
The most populous races in Opelika are White / Caucasian (17,628 | 56.2%), Black / African American (11,456 | 36.5%), and Hispanic or Latino (2,006 | 6.4%).
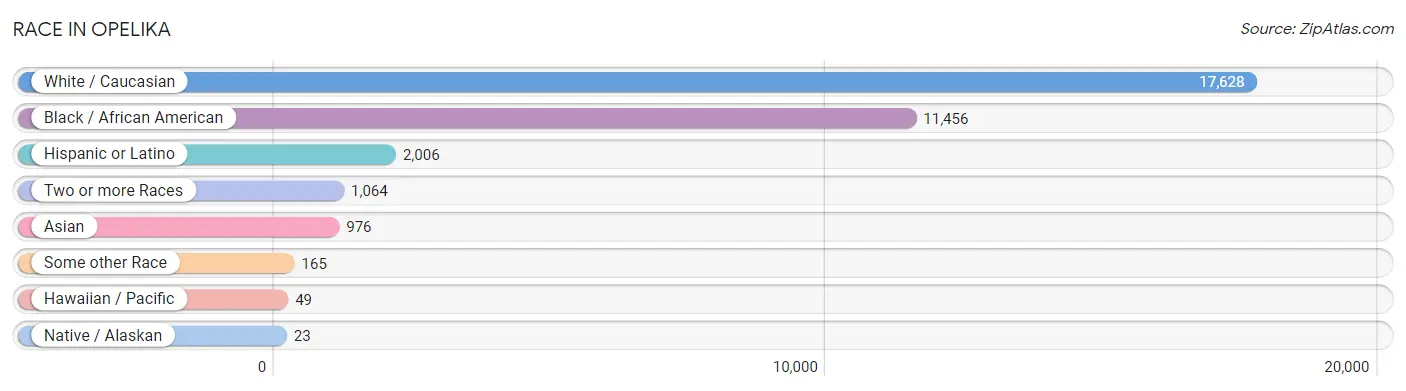
| Race | # Population | % Population |
| Asian | 976 | 3.1% |
| Black / African American | 11,456 | 36.5% |
| Hawaiian / Pacific | 49 | 0.2% |
| Hispanic or Latino | 2,006 | 6.4% |
| Native / Alaskan | 23 | 0.1% |
| White / Caucasian | 17,628 | 56.2% |
| Two or more Races | 1,064 | 3.4% |
| Some other Race | 165 | 0.5% |
| Total | 31,361 | 100.0% |
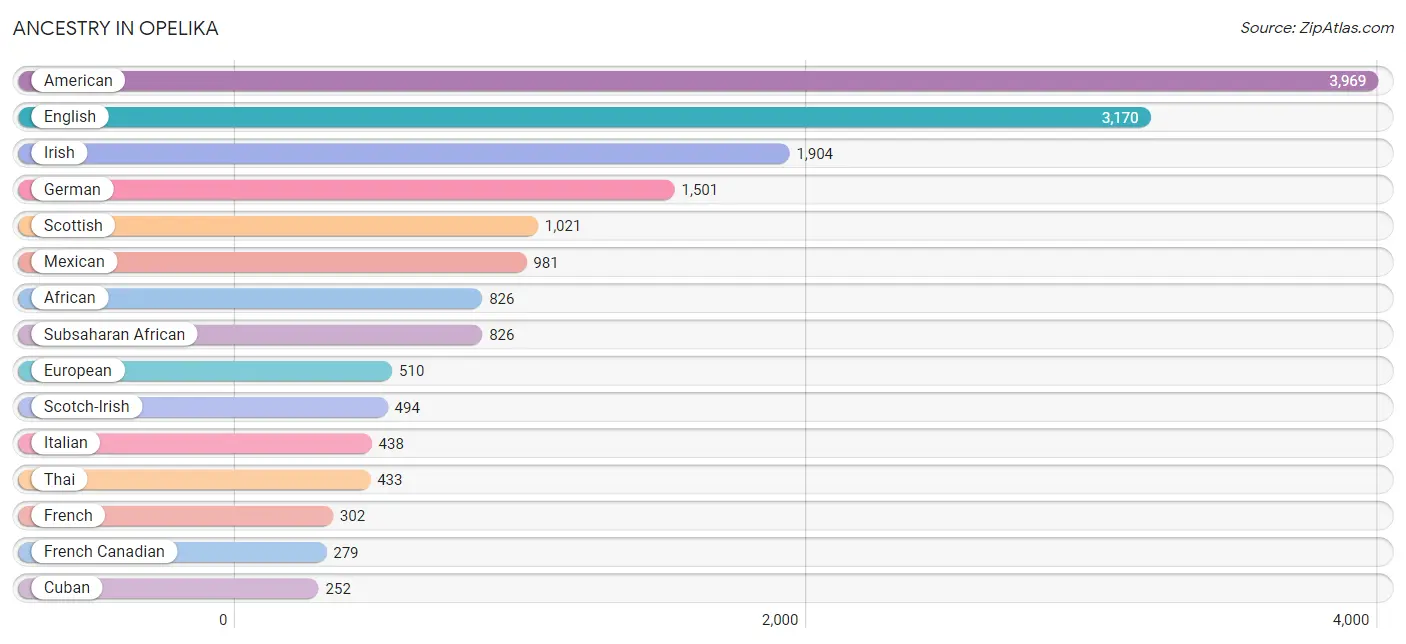
Ancestry in Opelika
The most populous ancestries reported in Opelika are American (3,969 | 12.7%), English (3,170 | 10.1%), Irish (1,904 | 6.1%), German (1,501 | 4.8%), and Scottish (1,021 | 3.3%), together accounting for 36.9% of all Opelika residents.
| Ancestry | # Population | % Population |
| African | 826 | 2.6% |
| American | 3,969 | 12.7% |
| Arab | 13 | 0.0% |
| Austrian | 16 | 0.1% |
| Belgian | 6 | 0.0% |
| Bhutanese | 13 | 0.0% |
| Blackfeet | 102 | 0.3% |
| British | 104 | 0.3% |
| Burmese | 213 | 0.7% |
| Central American | 206 | 0.7% |
| Cherokee | 57 | 0.2% |
| Colombian | 20 | 0.1% |
| Creek | 31 | 0.1% |
| Croatian | 7 | 0.0% |
| Cuban | 252 | 0.8% |
| Danish | 175 | 0.6% |
| Dutch | 72 | 0.2% |
| English | 3,170 | 10.1% |
| European | 510 | 1.6% |
| Filipino | 12 | 0.0% |
| Finnish | 14 | 0.0% |
| French | 302 | 1.0% |
| French Canadian | 279 | 0.9% |
| German | 1,501 | 4.8% |
| Greek | 70 | 0.2% |
| Guatemalan | 206 | 0.7% |
| Guyanese | 10 | 0.0% |
| Haitian | 24 | 0.1% |
| Hungarian | 12 | 0.0% |
| Indian (Asian) | 119 | 0.4% |
| Irish | 1,904 | 6.1% |
| Italian | 438 | 1.4% |
| Jamaican | 73 | 0.2% |
| Korean | 70 | 0.2% |
| Lithuanian | 13 | 0.0% |
| Malaysian | 52 | 0.2% |
| Mexican | 981 | 3.1% |
| Mexican American Indian | 7 | 0.0% |
| Mongolian | 5 | 0.0% |
| Native Hawaiian | 49 | 0.2% |
| Northern European | 1 | 0.0% |
| Norwegian | 124 | 0.4% |
| Pakistani | 32 | 0.1% |
| Polish | 169 | 0.5% |
| Portuguese | 20 | 0.1% |
| Puerto Rican | 175 | 0.6% |
| Scandinavian | 58 | 0.2% |
| Scotch-Irish | 494 | 1.6% |
| Scottish | 1,021 | 3.3% |
| Seminole | 7 | 0.0% |
| Slavic | 55 | 0.2% |
| Slovak | 222 | 0.7% |
| South American | 20 | 0.1% |
| Sri Lankan | 51 | 0.2% |
| Subsaharan African | 826 | 2.6% |
| Swedish | 116 | 0.4% |
| Swiss | 128 | 0.4% |
| Syrian | 13 | 0.0% |
| Thai | 433 | 1.4% |
| Ukrainian | 10 | 0.0% |
| Vietnamese | 21 | 0.1% |
| Welsh | 201 | 0.6% | View All 62 Rows |
Immigrants in Opelika
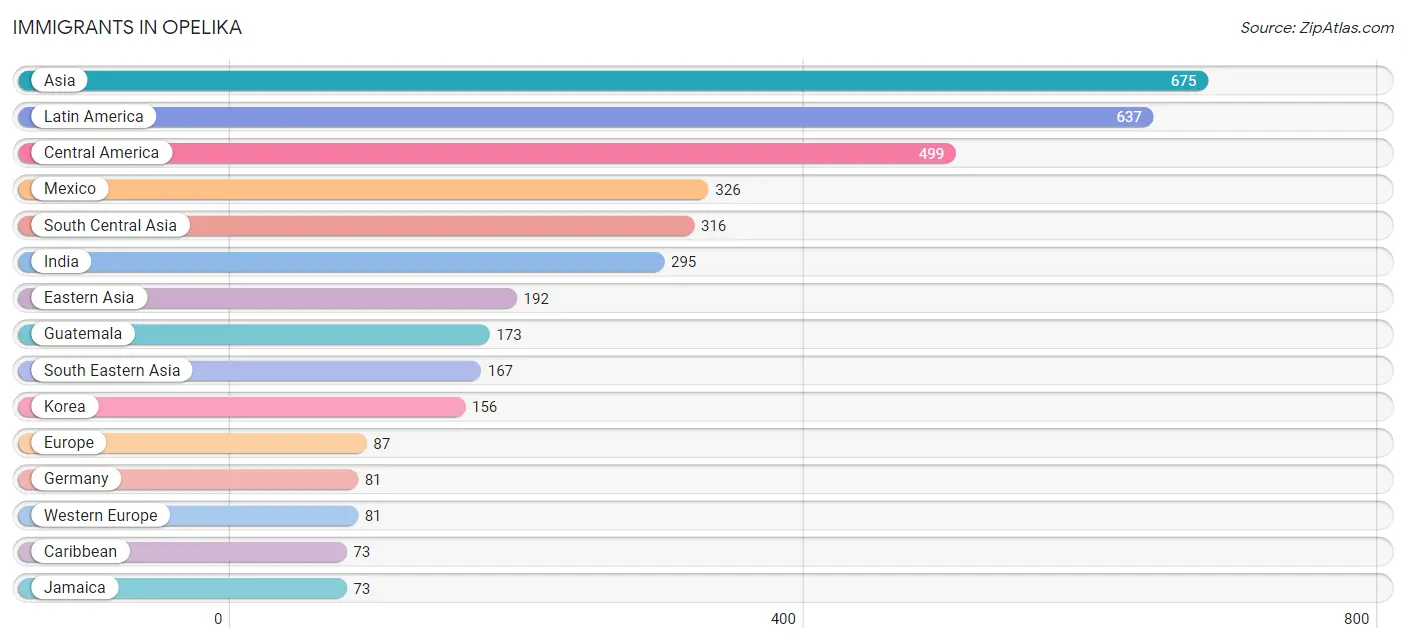
The most numerous immigrant groups reported in Opelika came from Asia (675 | 2.1%), Latin America (637 | 2.0%), Central America (499 | 1.6%), Mexico (326 | 1.0%), and South Central Asia (316 | 1.0%), together accounting for 7.8% of all Opelika residents.
| Immigration Origin | # Population | % Population |
| Asia | 675 | 2.1% |
| Bangladesh | 21 | 0.1% |
| Brazil | 21 | 0.1% |
| Caribbean | 73 | 0.2% |
| Central America | 499 | 1.6% |
| China | 36 | 0.1% |
| Colombia | 20 | 0.1% |
| Eastern Asia | 192 | 0.6% |
| Europe | 87 | 0.3% |
| Germany | 81 | 0.3% |
| Guatemala | 173 | 0.5% |
| Guyana | 24 | 0.1% |
| India | 295 | 0.9% |
| Jamaica | 73 | 0.2% |
| Korea | 156 | 0.5% |
| Laos | 19 | 0.1% |
| Latin America | 637 | 2.0% |
| Malaysia | 5 | 0.0% |
| Mexico | 326 | 1.0% |
| Northern Europe | 6 | 0.0% |
| Philippines | 43 | 0.1% |
| South America | 65 | 0.2% |
| South Central Asia | 316 | 1.0% |
| South Eastern Asia | 167 | 0.5% |
| Taiwan | 6 | 0.0% |
| Thailand | 49 | 0.2% |
| Vietnam | 51 | 0.2% |
| Western Europe | 81 | 0.3% | View All 28 Rows |
Sex and Age in Opelika
Sex and Age in Opelika
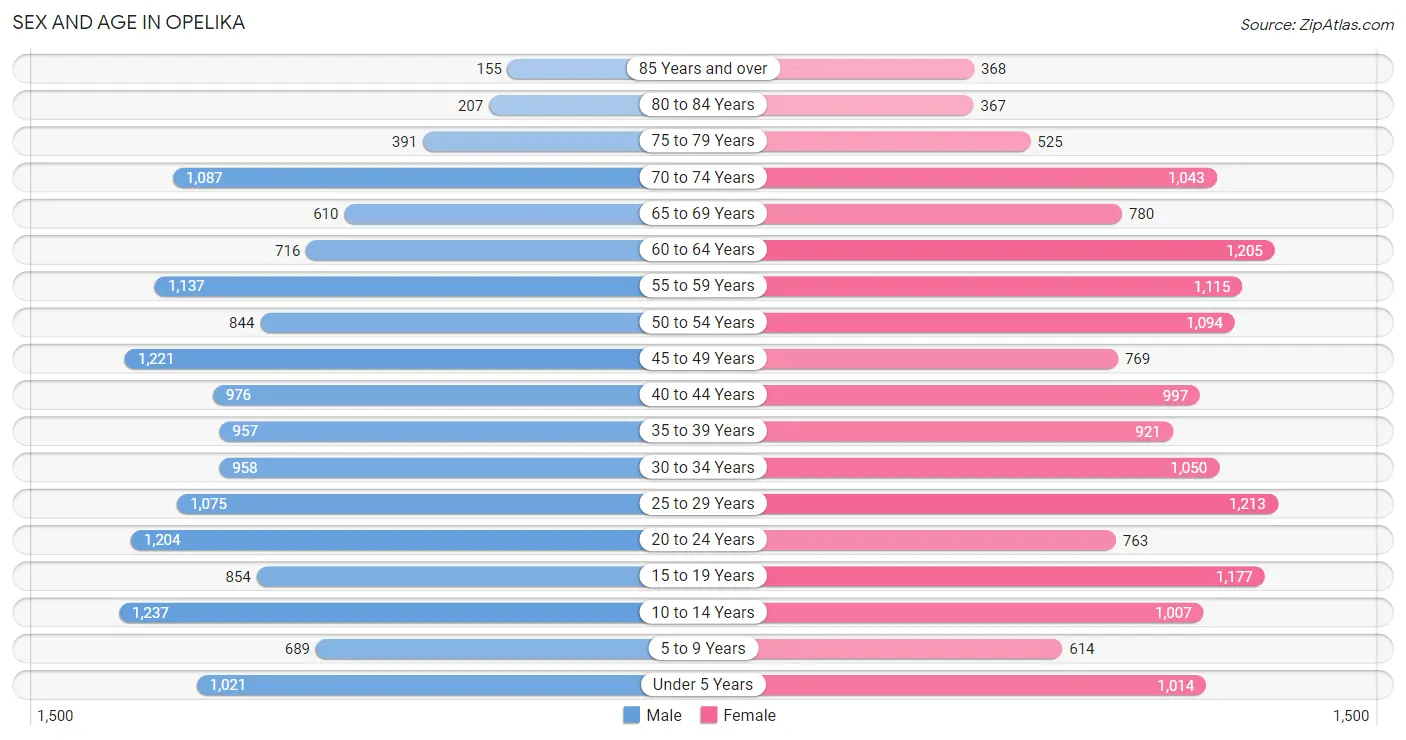
The most populous age groups in Opelika are 10 to 14 Years (1,237 | 8.1%) for men and 25 to 29 Years (1,213 | 7.6%) for women.
| Age Bracket | Male | Female |
| Under 5 Years | 1,021 (6.7%) | 1,014 (6.3%) |
| 5 to 9 Years | 689 (4.5%) | 614 (3.8%) |
| 10 to 14 Years | 1,237 (8.1%) | 1,007 (6.3%) |
| 15 to 19 Years | 854 (5.6%) | 1,177 (7.3%) |
| 20 to 24 Years | 1,204 (7.9%) | 763 (4.8%) |
| 25 to 29 Years | 1,075 (7.0%) | 1,213 (7.6%) |
| 30 to 34 Years | 958 (6.2%) | 1,050 (6.6%) |
| 35 to 39 Years | 957 (6.2%) | 921 (5.8%) |
| 40 to 44 Years | 976 (6.4%) | 997 (6.2%) |
| 45 to 49 Years | 1,221 (8.0%) | 769 (4.8%) |
| 50 to 54 Years | 844 (5.5%) | 1,094 (6.8%) |
| 55 to 59 Years | 1,137 (7.4%) | 1,115 (7.0%) |
| 60 to 64 Years | 716 (4.7%) | 1,205 (7.5%) |
| 65 to 69 Years | 610 (4.0%) | 780 (4.9%) |
| 70 to 74 Years | 1,087 (7.1%) | 1,043 (6.5%) |
| 75 to 79 Years | 391 (2.5%) | 525 (3.3%) |
| 80 to 84 Years | 207 (1.3%) | 367 (2.3%) |
| 85 Years and over | 155 (1.0%) | 368 (2.3%) |
| Total | 15,339 (100.0%) | 16,022 (100.0%) |
Families and Households in Opelika
Median Family Size in Opelika
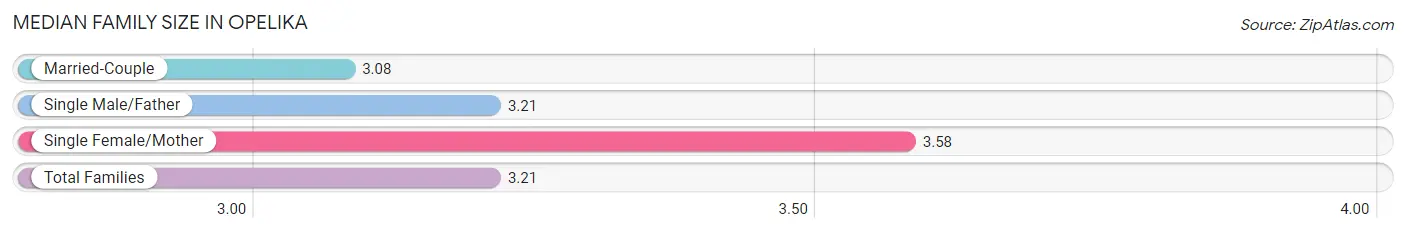
The median family size in Opelika is 3.21 persons per family, with single female/mother families (1,948 | 24.7%) accounting for the largest median family size of 3.58 persons per family. On the other hand, married-couple families (5,407 | 68.5%) represent the smallest median family size with 3.08 persons per family.
| Family Type | # Families | Family Size |
| Married-Couple | 5,407 (68.5%) | 3.08 |
| Single Male/Father | 537 (6.8%) | 3.21 |
| Single Female/Mother | 1,948 (24.7%) | 3.58 |
| Total Families | 7,892 (100.0%) | 3.21 |
Median Household Size in Opelika
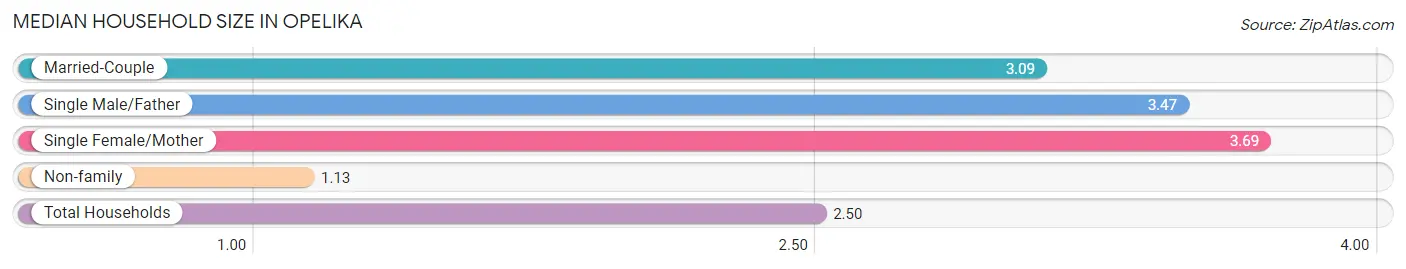
The median household size in Opelika is 2.50 persons per household, with single female/mother households (1,948 | 15.8%) accounting for the largest median household size of 3.69 persons per household. non-family households (4,403 | 35.8%) represent the smallest median household size with 1.13 persons per household.
| Household Type | # Households | Household Size |
| Married-Couple | 5,407 (44.0%) | 3.09 |
| Single Male/Father | 537 (4.4%) | 3.47 |
| Single Female/Mother | 1,948 (15.8%) | 3.69 |
| Non-family | 4,403 (35.8%) | 1.13 |
| Total Households | 12,295 (100.0%) | 2.50 |
Household Size by Marriage Status in Opelika
Out of a total of 12,295 households in Opelika, 7,892 (64.2%) are family households, while 4,403 (35.8%) are nonfamily households. The most numerous type of family households are 2-person households, comprising 3,823, and the most common type of nonfamily households are 1-person households, comprising 4,004.
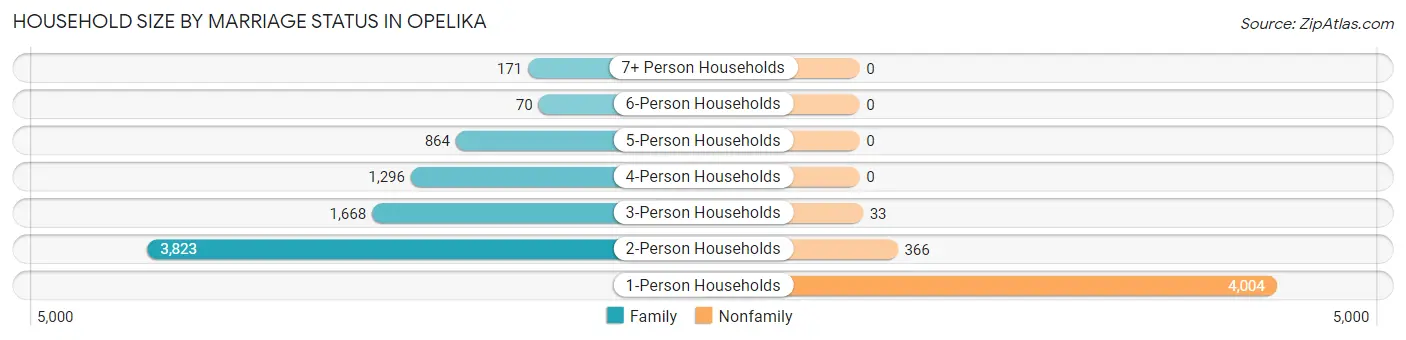
| Household Size | Family Households | Nonfamily Households |
| 1-Person Households | - | 4,004 (32.6%) |
| 2-Person Households | 3,823 (31.1%) | 366 (3.0%) |
| 3-Person Households | 1,668 (13.6%) | 33 (0.3%) |
| 4-Person Households | 1,296 (10.5%) | 0 (0.0%) |
| 5-Person Households | 864 (7.0%) | 0 (0.0%) |
| 6-Person Households | 70 (0.6%) | 0 (0.0%) |
| 7+ Person Households | 171 (1.4%) | 0 (0.0%) |
| Total | 7,892 (64.2%) | 4,403 (35.8%) |
Female Fertility in Opelika
Fertility by Age in Opelika
Average fertility rate in Opelika is 55.0 births per 1,000 women. Women in the age bracket of 15 to 19 years have the highest fertility rate with 76.0 births per 1,000 women. Women in the age bracket of 20 to 34 years acount for 45.0% of all women with births.
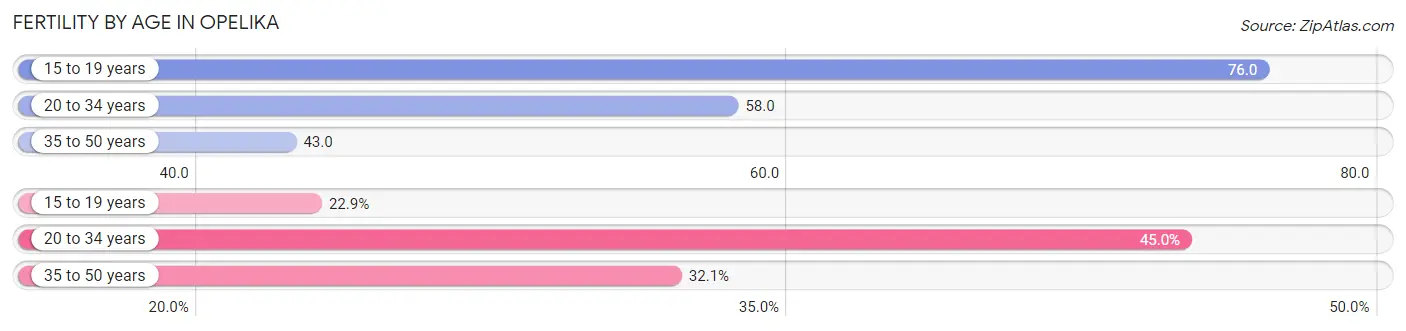
| Age Bracket | Women with Births | Births / 1,000 Women |
| 15 to 19 years | 90 (22.9%) | 76.0 |
| 20 to 34 years | 177 (45.0%) | 58.0 |
| 35 to 50 years | 126 (32.1%) | 43.0 |
| Total | 393 (100.0%) | 55.0 |
Fertility by Age by Marriage Status in Opelika
71.0% of women with births (393) in Opelika are married. The highest percentage of unmarried women with births falls into 15 to 19 years age bracket with 100.0% of them unmarried at the time of birth, while the lowest percentage of unmarried women with births belong to 35 to 50 years age bracket with 7.1% of them unmarried.
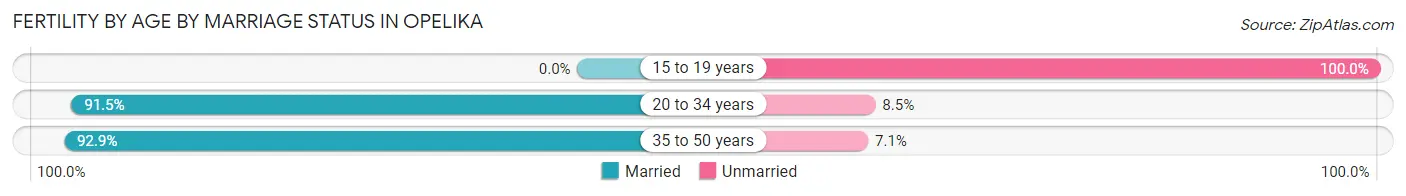
| Age Bracket | Married | Unmarried |
| 15 to 19 years | 0 (0.0%) | 90 (100.0%) |
| 20 to 34 years | 162 (91.5%) | 15 (8.5%) |
| 35 to 50 years | 117 (92.9%) | 9 (7.1%) |
| Total | 279 (71.0%) | 114 (29.0%) |
Fertility by Education in Opelika
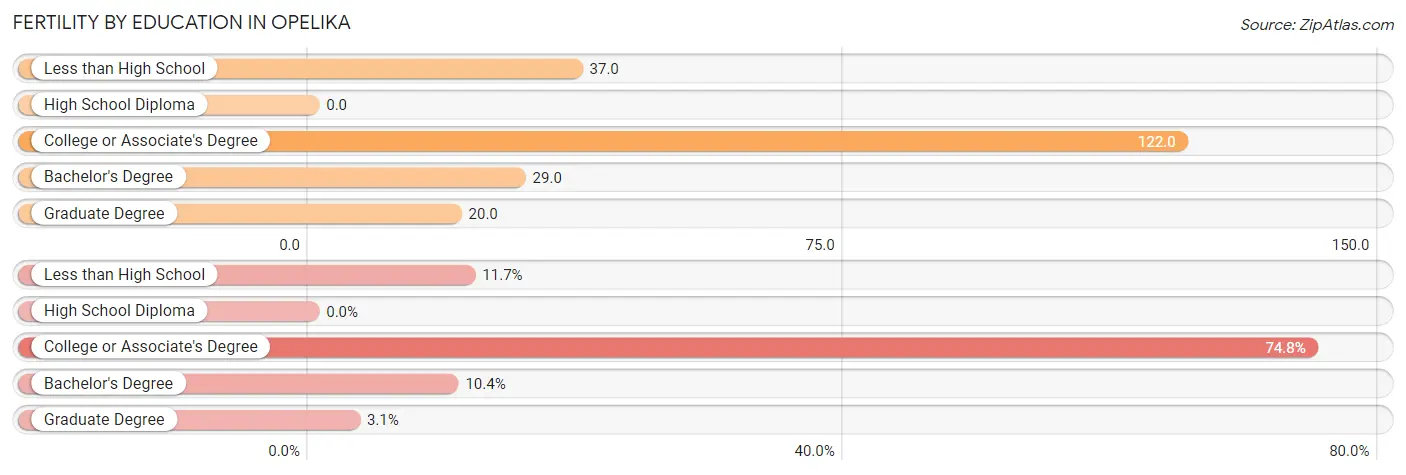
| Educational Attainment | Women with Births | Births / 1,000 Women |
| Less than High School | 46 (11.7%) | 37.0 |
| High School Diploma | 0 (0.0%) | 0.0 |
| College or Associate's Degree | 294 (74.8%) | 122.0 |
| Bachelor's Degree | 41 (10.4%) | 29.0 |
| Graduate Degree | 12 (3.0%) | 20.0 |
| Total | 393 (100.0%) | 55.0 |
Fertility by Education by Marriage Status in Opelika
29.0% of women with births in Opelika are unmarried. Women with the educational attainment of bachelor's degree are most likely to be married with 100.0% of them married at childbirth, while women with the educational attainment of less than high school are least likely to be married with 100.0% of them unmarried at childbirth.
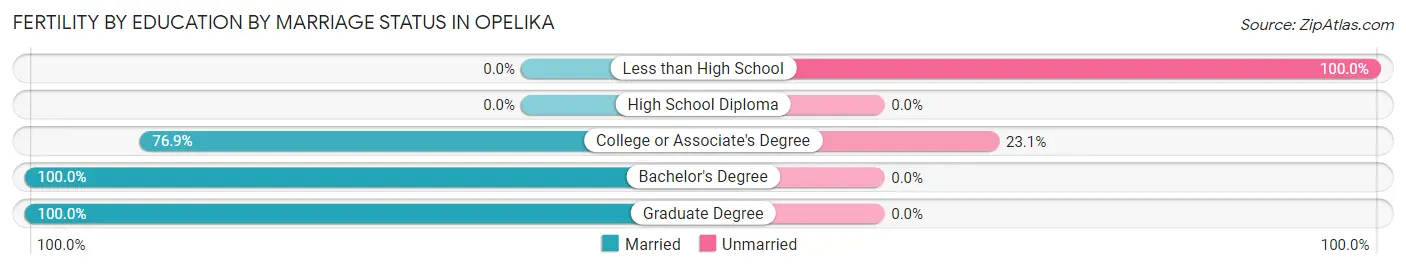
| Educational Attainment | Married | Unmarried |
| Less than High School | 0 (0.0%) | 46 (100.0%) |
| High School Diploma | 0 (0.0%) | 0 (0.0%) |
| College or Associate's Degree | 226 (76.9%) | 68 (23.1%) |
| Bachelor's Degree | 41 (100.0%) | 0 (0.0%) |
| Graduate Degree | 12 (100.0%) | 0 (0.0%) |
| Total | 279 (71.0%) | 114 (29.0%) |
Employment Characteristics in Opelika
Employment by Class of Employer in Opelika
Among the 14,101 employed individuals in Opelika, private company employees (9,834 | 69.7%), not-for-profit organizations (1,048 | 7.4%), and state government employees (938 | 6.7%) make up the most common classes of employment.
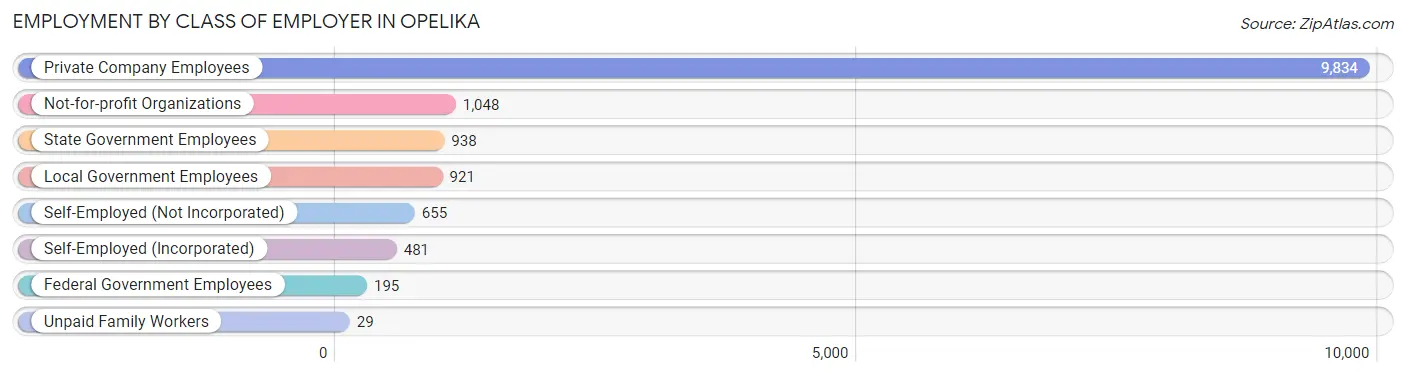
| Employer Class | # Employees | % Employees |
| Private Company Employees | 9,834 | 69.7% |
| Self-Employed (Incorporated) | 481 | 3.4% |
| Self-Employed (Not Incorporated) | 655 | 4.6% |
| Not-for-profit Organizations | 1,048 | 7.4% |
| Local Government Employees | 921 | 6.5% |
| State Government Employees | 938 | 6.7% |
| Federal Government Employees | 195 | 1.4% |
| Unpaid Family Workers | 29 | 0.2% |
| Total | 14,101 | 100.0% |
Employment Status by Age in Opelika
According to the labor force statistics for Opelika, out of the total population over 16 years of age (25,496), 59.0% or 15,043 individuals are in the labor force, with 5.1% or 767 of them unemployed. The age group with the highest labor force participation rate is 35 to 44 years, with 85.8% or 3,304 individuals in the labor force. Within the labor force, the 20 to 24 years age range has the highest percentage of unemployed individuals, with 14.7% or 238 of them being unemployed.
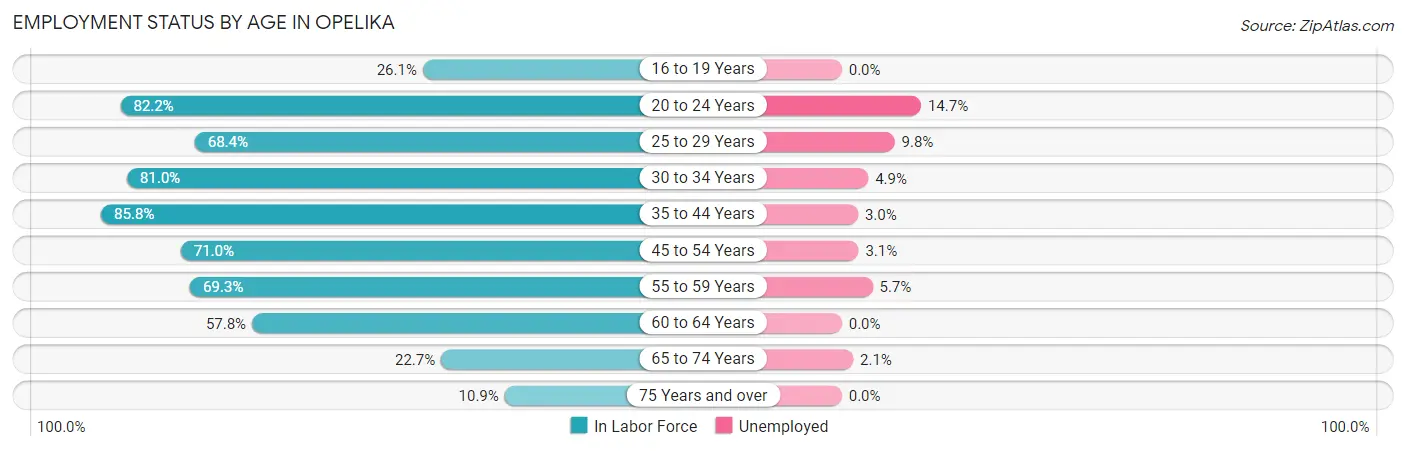
| Age Bracket | In Labor Force | Unemployed |
| 16 to 19 Years | 456 (26.1%) | 0 (0.0%) |
| 20 to 24 Years | 1,617 (82.2%) | 238 (14.7%) |
| 25 to 29 Years | 1,565 (68.4%) | 153 (9.8%) |
| 30 to 34 Years | 1,626 (81.0%) | 80 (4.9%) |
| 35 to 44 Years | 3,304 (85.8%) | 99 (3.0%) |
| 45 to 54 Years | 2,789 (71.0%) | 86 (3.1%) |
| 55 to 59 Years | 1,561 (69.3%) | 89 (5.7%) |
| 60 to 64 Years | 1,110 (57.8%) | 0 (0.0%) |
| 65 to 74 Years | 799 (22.7%) | 17 (2.1%) |
| 75 Years and over | 219 (10.9%) | 0 (0.0%) |
| Total | 15,043 (59.0%) | 767 (5.1%) |
Employment Status by Educational Attainment in Opelika
According to labor force statistics for Opelika, 73.6% of individuals (11,959) out of the total population between 25 and 64 years of age (16,248) are in the labor force, with 4.2% or 502 of them being unemployed. The group with the highest labor force participation rate are those with the educational attainment of bachelor's degree or higher, with 90.5% or 4,791 individuals in the labor force. Within the labor force, individuals with college / associate degree education have the highest percentage of unemployment, with 7.8% or 294 of them being unemployed.
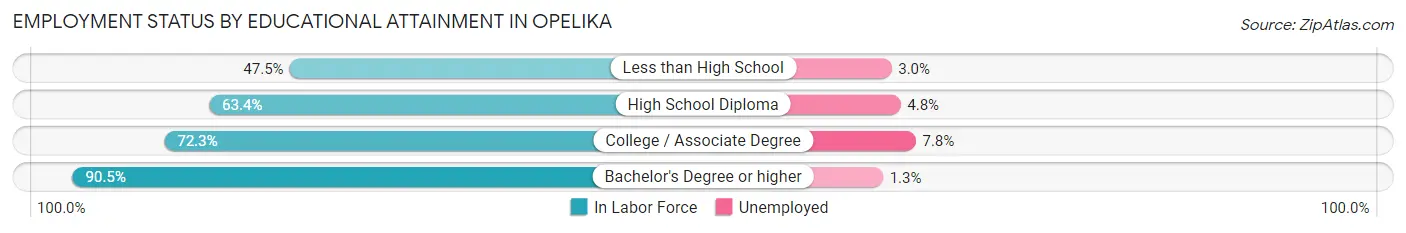
| Educational Attainment | In Labor Force | Unemployed |
| Less than High School | 725 (47.5%) | 46 (3.0%) |
| High School Diploma | 2,670 (63.4%) | 202 (4.8%) |
| College / Associate Degree | 3,772 (72.3%) | 407 (7.8%) |
| Bachelor's Degree or higher | 4,791 (90.5%) | 69 (1.3%) |
| Total | 11,959 (73.6%) | 682 (4.2%) |
Employment Occupations by Sex in Opelika
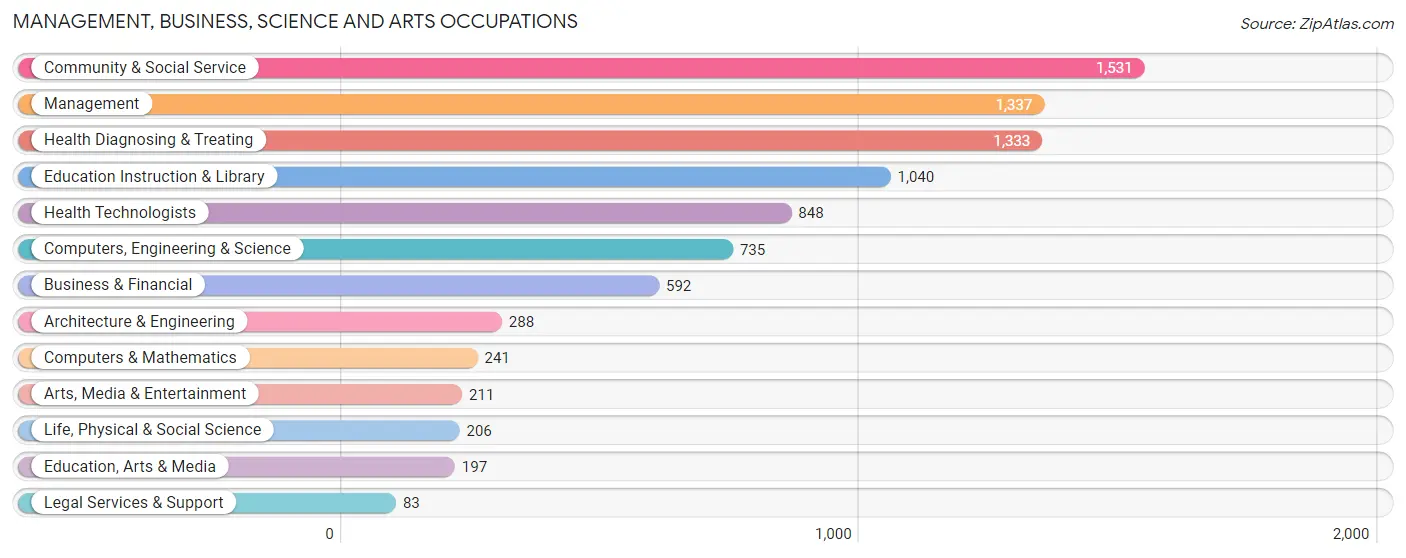
Management, Business, Science and Arts Occupations
The most common Management, Business, Science and Arts occupations in Opelika are Community & Social Service (1,531 | 10.7%), Management (1,337 | 9.4%), Health Diagnosing & Treating (1,333 | 9.3%), Education Instruction & Library (1,040 | 7.3%), and Health Technologists (848 | 5.9%).
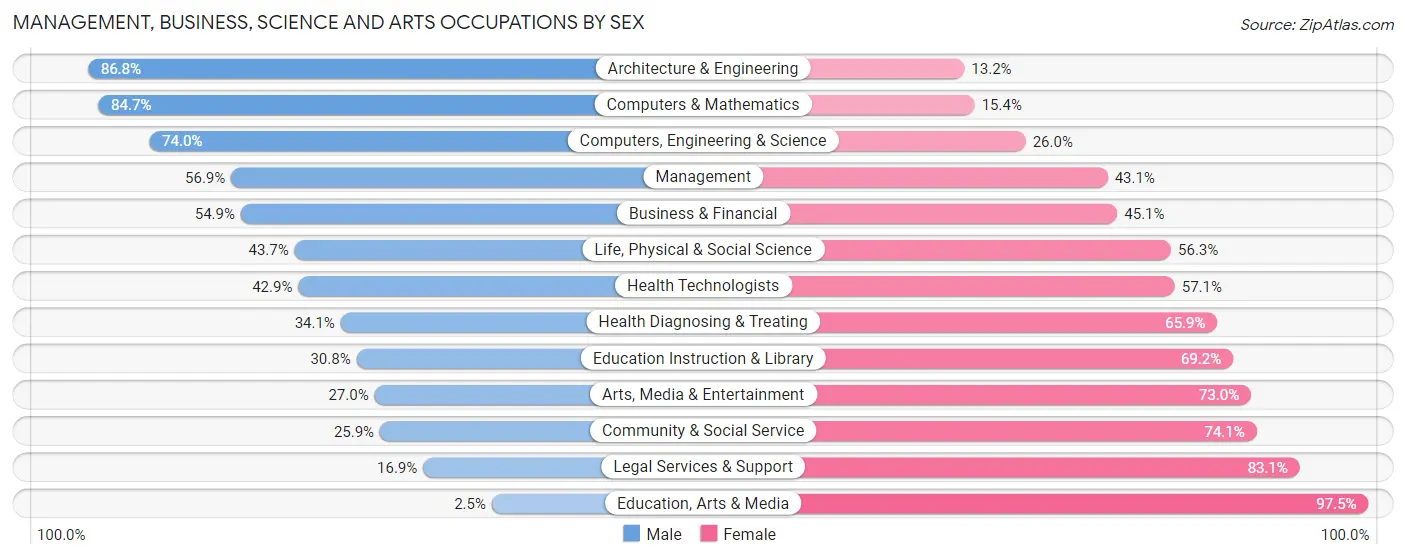
Management, Business, Science and Arts Occupations by Sex
Within the Management, Business, Science and Arts occupations in Opelika, the most male-oriented occupations are Architecture & Engineering (86.8%), Computers & Mathematics (84.7%), and Computers, Engineering & Science (74.0%), while the most female-oriented occupations are Education, Arts & Media (97.5%), Legal Services & Support (83.1%), and Community & Social Service (74.1%).
| Occupation | Male | Female |
| Management | 761 (56.9%) | 576 (43.1%) |
| Business & Financial | 325 (54.9%) | 267 (45.1%) |
| Computers, Engineering & Science | 544 (74.0%) | 191 (26.0%) |
| Computers & Mathematics | 204 (84.7%) | 37 (15.3%) |
| Architecture & Engineering | 250 (86.8%) | 38 (13.2%) |
| Life, Physical & Social Science | 90 (43.7%) | 116 (56.3%) |
| Community & Social Service | 396 (25.9%) | 1,135 (74.1%) |
| Education, Arts & Media | 5 (2.5%) | 192 (97.5%) |
| Legal Services & Support | 14 (16.9%) | 69 (83.1%) |
| Education Instruction & Library | 320 (30.8%) | 720 (69.2%) |
| Arts, Media & Entertainment | 57 (27.0%) | 154 (73.0%) |
| Health Diagnosing & Treating | 454 (34.1%) | 879 (65.9%) |
| Health Technologists | 364 (42.9%) | 484 (57.1%) |
| Total (Category) | 2,480 (44.9%) | 3,048 (55.1%) |
| Total (Overall) | 7,463 (52.3%) | 6,809 (47.7%) |
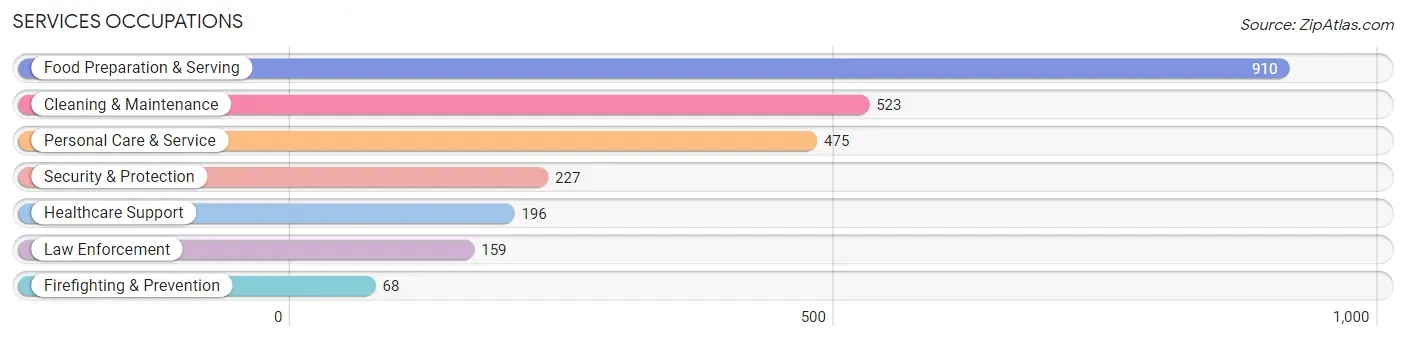
Services Occupations
The most common Services occupations in Opelika are Food Preparation & Serving (910 | 6.4%), Cleaning & Maintenance (523 | 3.7%), Personal Care & Service (475 | 3.3%), Security & Protection (227 | 1.6%), and Healthcare Support (196 | 1.4%).
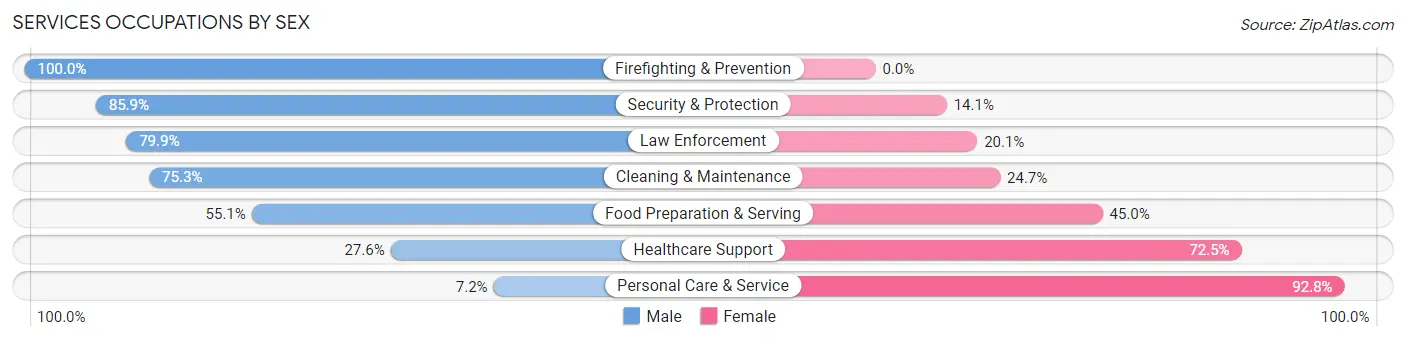
Services Occupations by Sex
Within the Services occupations in Opelika, the most male-oriented occupations are Firefighting & Prevention (100.0%), Security & Protection (85.9%), and Law Enforcement (79.9%), while the most female-oriented occupations are Personal Care & Service (92.8%), Healthcare Support (72.5%), and Food Preparation & Serving (45.0%).
| Occupation | Male | Female |
| Healthcare Support | 54 (27.6%) | 142 (72.5%) |
| Security & Protection | 195 (85.9%) | 32 (14.1%) |
| Firefighting & Prevention | 68 (100.0%) | 0 (0.0%) |
| Law Enforcement | 127 (79.9%) | 32 (20.1%) |
| Food Preparation & Serving | 501 (55.0%) | 409 (45.0%) |
| Cleaning & Maintenance | 394 (75.3%) | 129 (24.7%) |
| Personal Care & Service | 34 (7.2%) | 441 (92.8%) |
| Total (Category) | 1,178 (50.5%) | 1,153 (49.5%) |
| Total (Overall) | 7,463 (52.3%) | 6,809 (47.7%) |
Sales and Office Occupations
The most common Sales and Office occupations in Opelika are Sales & Related (1,562 | 10.9%), and Office & Administration (1,537 | 10.8%).

Sales and Office Occupations by Sex
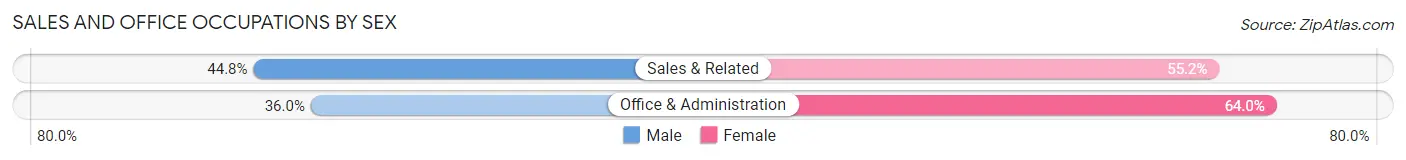
| Occupation | Male | Female |
| Sales & Related | 700 (44.8%) | 862 (55.2%) |
| Office & Administration | 553 (36.0%) | 984 (64.0%) |
| Total (Category) | 1,253 (40.4%) | 1,846 (59.6%) |
| Total (Overall) | 7,463 (52.3%) | 6,809 (47.7%) |
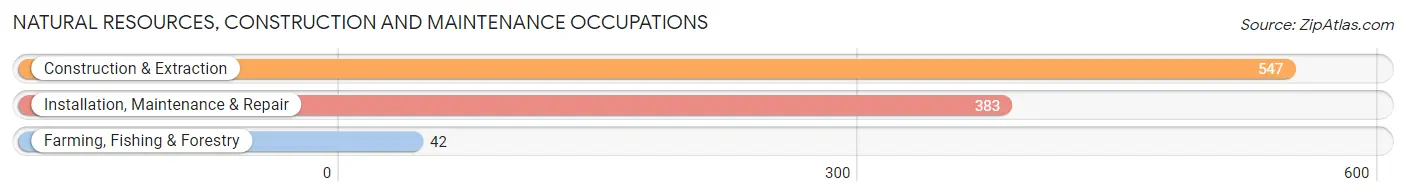
Natural Resources, Construction and Maintenance Occupations
The most common Natural Resources, Construction and Maintenance occupations in Opelika are Construction & Extraction (547 | 3.8%), Installation, Maintenance & Repair (383 | 2.7%), and Farming, Fishing & Forestry (42 | 0.3%).
Natural Resources, Construction and Maintenance Occupations by Sex
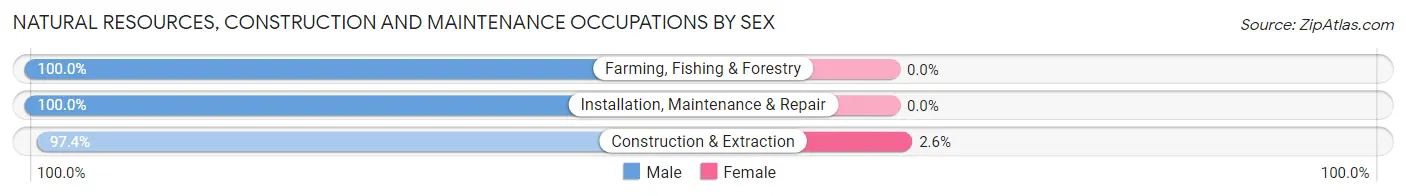
| Occupation | Male | Female |
| Farming, Fishing & Forestry | 42 (100.0%) | 0 (0.0%) |
| Construction & Extraction | 533 (97.4%) | 14 (2.6%) |
| Installation, Maintenance & Repair | 383 (100.0%) | 0 (0.0%) |
| Total (Category) | 958 (98.6%) | 14 (1.4%) |
| Total (Overall) | 7,463 (52.3%) | 6,809 (47.7%) |
Production, Transportation and Moving Occupations
The most common Production, Transportation and Moving occupations in Opelika are Production (1,696 | 11.9%), Material Moving (372 | 2.6%), and Transportation (274 | 1.9%).
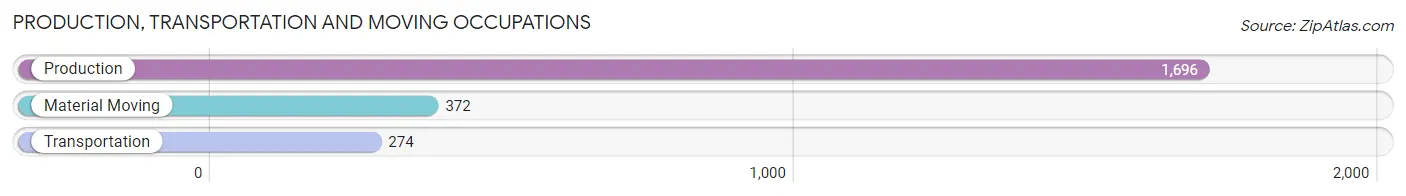
Production, Transportation and Moving Occupations by Sex
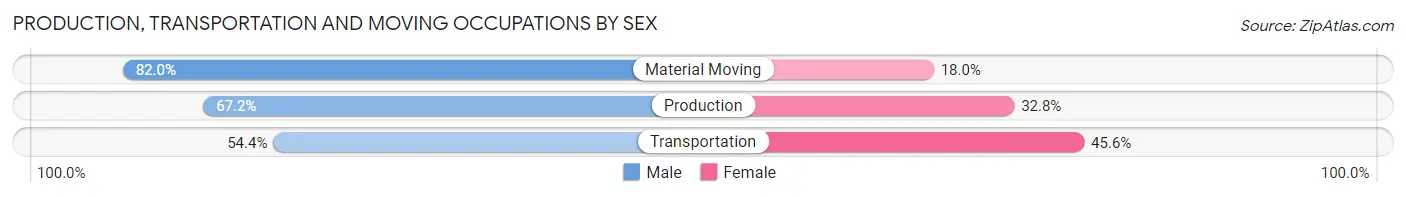
| Occupation | Male | Female |
| Production | 1,140 (67.2%) | 556 (32.8%) |
| Transportation | 149 (54.4%) | 125 (45.6%) |
| Material Moving | 305 (82.0%) | 67 (18.0%) |
| Total (Category) | 1,594 (68.1%) | 748 (31.9%) |
| Total (Overall) | 7,463 (52.3%) | 6,809 (47.7%) |
Employment Industries by Sex in Opelika
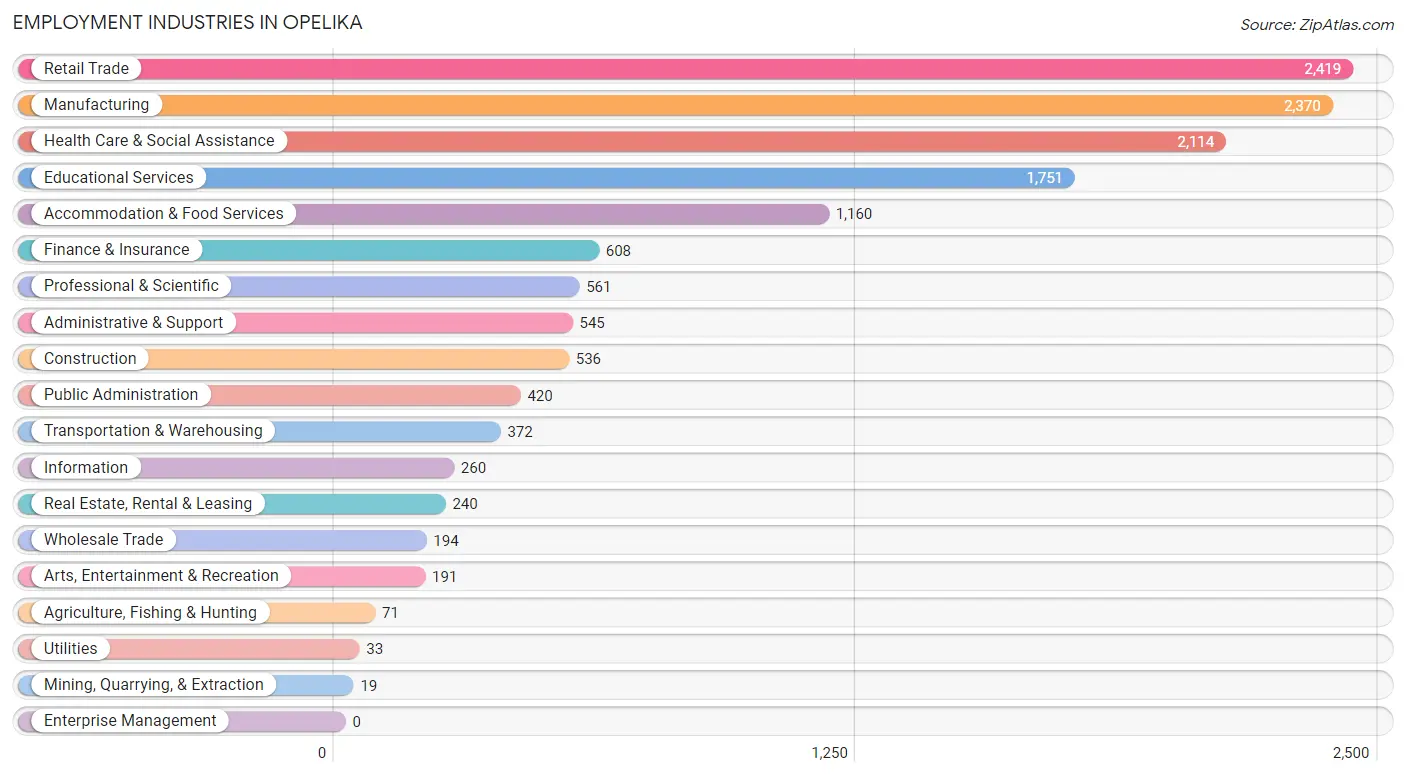
Employment Industries in Opelika
The major employment industries in Opelika include Retail Trade (2,419 | 17.0%), Manufacturing (2,370 | 16.6%), Health Care & Social Assistance (2,114 | 14.8%), Educational Services (1,751 | 12.3%), and Accommodation & Food Services (1,160 | 8.1%).
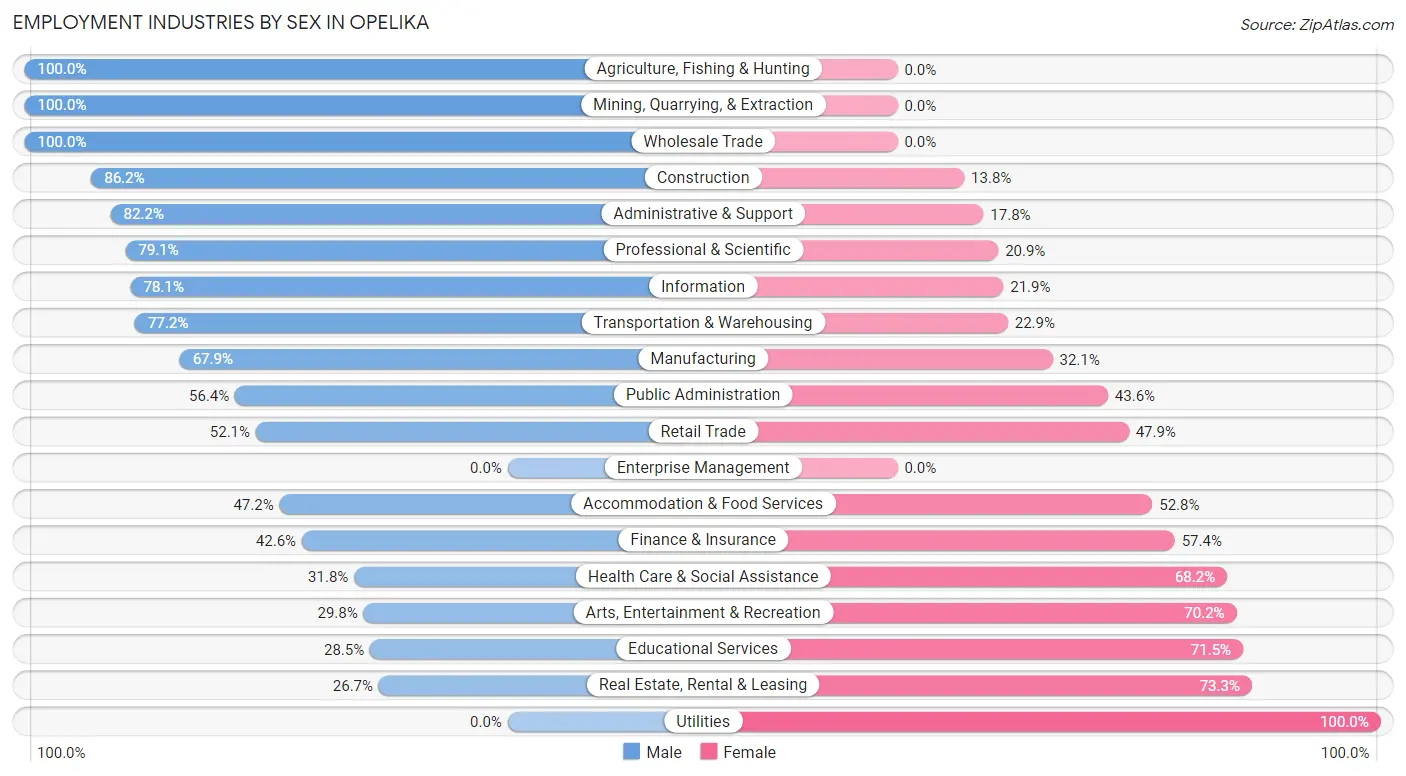
Employment Industries by Sex in Opelika
The Opelika industries that see more men than women are Agriculture, Fishing & Hunting (100.0%), Mining, Quarrying, & Extraction (100.0%), and Wholesale Trade (100.0%), whereas the industries that tend to have a higher number of women are Utilities (100.0%), Real Estate, Rental & Leasing (73.3%), and Educational Services (71.5%).
| Industry | Male | Female |
| Agriculture, Fishing & Hunting | 71 (100.0%) | 0 (0.0%) |
| Mining, Quarrying, & Extraction | 19 (100.0%) | 0 (0.0%) |
| Construction | 462 (86.2%) | 74 (13.8%) |
| Manufacturing | 1,609 (67.9%) | 761 (32.1%) |
| Wholesale Trade | 194 (100.0%) | 0 (0.0%) |
| Retail Trade | 1,261 (52.1%) | 1,158 (47.9%) |
| Transportation & Warehousing | 287 (77.1%) | 85 (22.9%) |
| Utilities | 0 (0.0%) | 33 (100.0%) |
| Information | 203 (78.1%) | 57 (21.9%) |
| Finance & Insurance | 259 (42.6%) | 349 (57.4%) |
| Real Estate, Rental & Leasing | 64 (26.7%) | 176 (73.3%) |
| Professional & Scientific | 444 (79.1%) | 117 (20.9%) |
| Enterprise Management | 0 (0.0%) | 0 (0.0%) |
| Administrative & Support | 448 (82.2%) | 97 (17.8%) |
| Educational Services | 499 (28.5%) | 1,252 (71.5%) |
| Health Care & Social Assistance | 672 (31.8%) | 1,442 (68.2%) |
| Arts, Entertainment & Recreation | 57 (29.8%) | 134 (70.2%) |
| Accommodation & Food Services | 548 (47.2%) | 612 (52.8%) |
| Public Administration | 237 (56.4%) | 183 (43.6%) |
| Total | 7,463 (52.3%) | 6,809 (47.7%) |
Education in Opelika
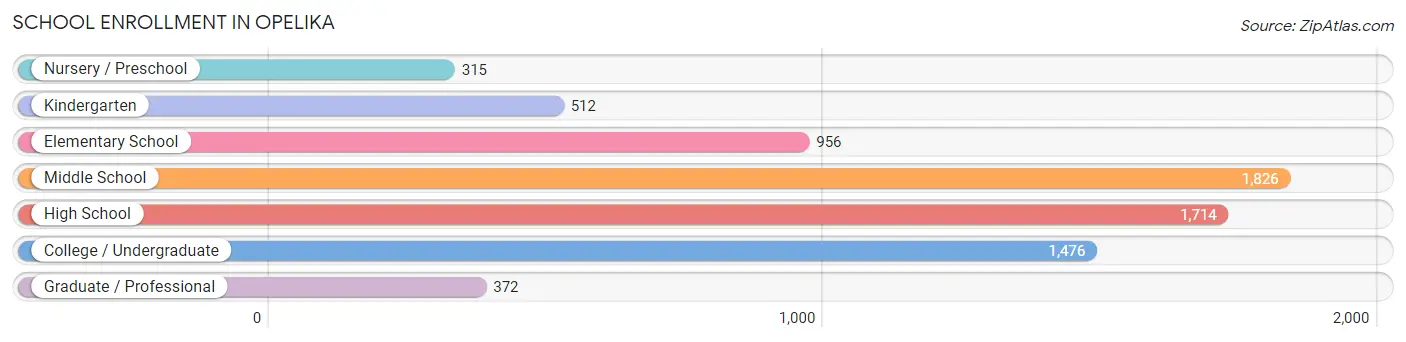
School Enrollment in Opelika
The most common levels of schooling among the 7,171 students in Opelika are middle school (1,826 | 25.5%), high school (1,714 | 23.9%), and college / undergraduate (1,476 | 20.6%).
| School Level | # Students | % Students |
| Nursery / Preschool | 315 | 4.4% |
| Kindergarten | 512 | 7.1% |
| Elementary School | 956 | 13.3% |
| Middle School | 1,826 | 25.5% |
| High School | 1,714 | 23.9% |
| College / Undergraduate | 1,476 | 20.6% |
| Graduate / Professional | 372 | 5.2% |
| Total | 7,171 | 100.0% |
School Enrollment by Age by Funding Source in Opelika
Out of a total of 7,171 students who are enrolled in schools in Opelika, 1,298 (18.1%) attend a private institution, while the remaining 5,873 (81.9%) are enrolled in public schools. The age group of 3 to 4 year olds has the highest likelihood of being enrolled in private schools, with 135 (36.0% in the age bracket) enrolled. Conversely, the age group of 18 to 19 year olds has the lowest likelihood of being enrolled in a private school, with 459 (97.0% in the age bracket) attending a public institution.
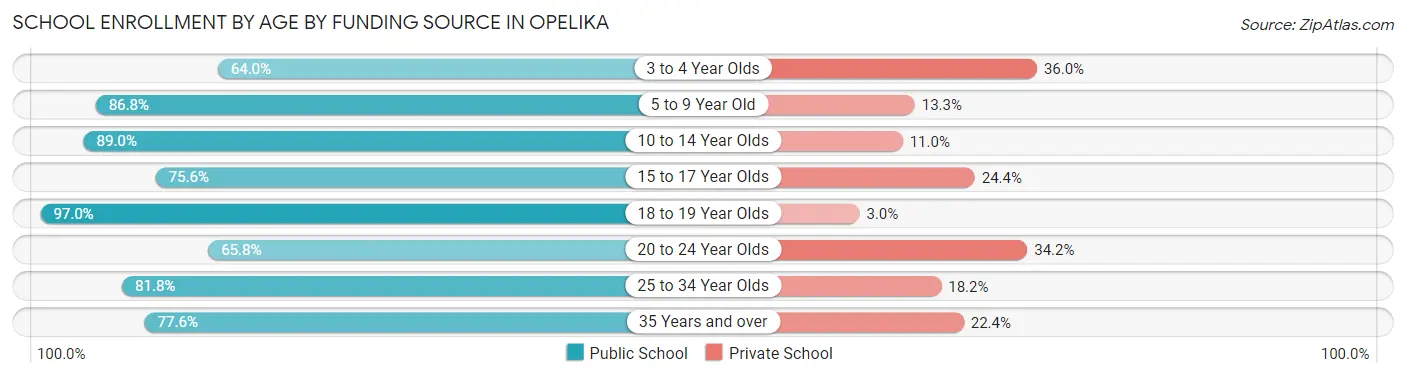
| Age Bracket | Public School | Private School |
| 3 to 4 Year Olds | 240 (64.0%) | 135 (36.0%) |
| 5 to 9 Year Old | 1,054 (86.8%) | 161 (13.3%) |
| 10 to 14 Year Olds | 1,959 (89.0%) | 242 (11.0%) |
| 15 to 17 Year Olds | 944 (75.6%) | 305 (24.4%) |
| 18 to 19 Year Olds | 459 (97.0%) | 14 (3.0%) |
| 20 to 24 Year Olds | 502 (65.8%) | 261 (34.2%) |
| 25 to 34 Year Olds | 414 (81.8%) | 92 (18.2%) |
| 35 Years and over | 302 (77.6%) | 87 (22.4%) |
| Total | 5,873 (81.9%) | 1,298 (18.1%) |
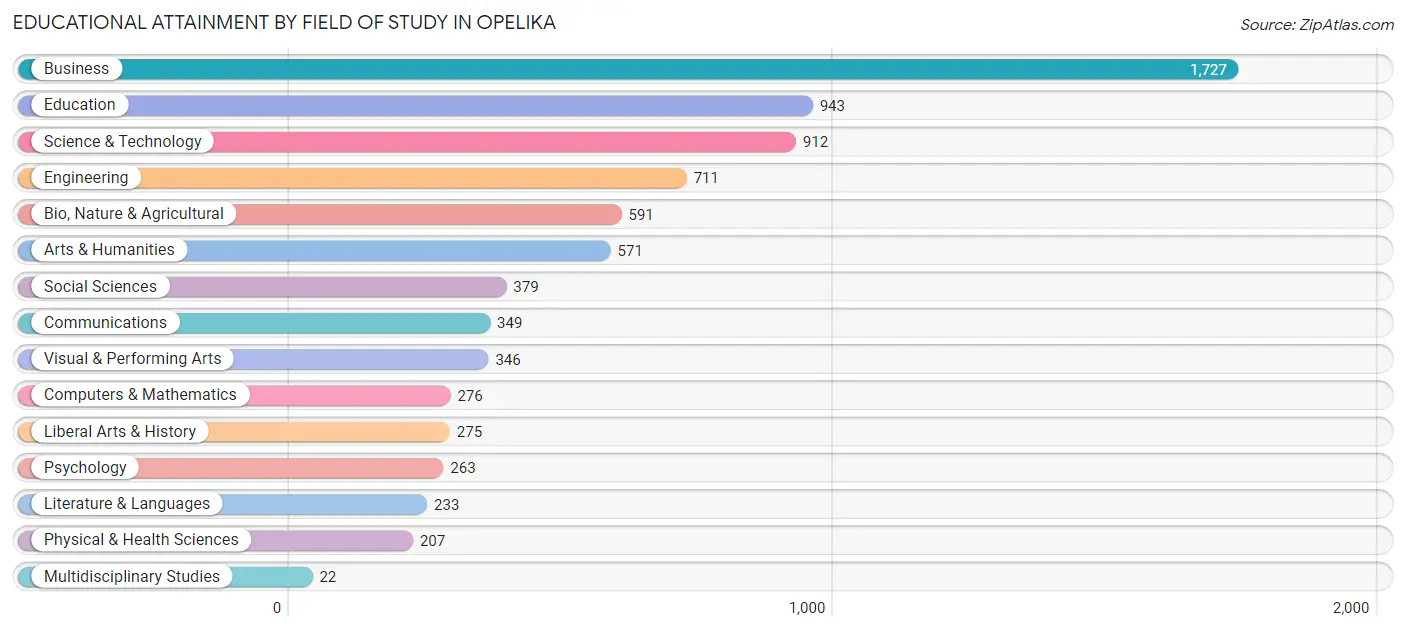
Educational Attainment by Field of Study in Opelika
Business (1,727 | 22.1%), education (943 | 12.1%), science & technology (912 | 11.7%), engineering (711 | 9.1%), and bio, nature & agricultural (591 | 7.6%) are the most common fields of study among 7,805 individuals in Opelika who have obtained a bachelor's degree or higher.
| Field of Study | # Graduates | % Graduates |
| Computers & Mathematics | 276 | 3.5% |
| Bio, Nature & Agricultural | 591 | 7.6% |
| Physical & Health Sciences | 207 | 2.6% |
| Psychology | 263 | 3.4% |
| Social Sciences | 379 | 4.9% |
| Engineering | 711 | 9.1% |
| Multidisciplinary Studies | 22 | 0.3% |
| Science & Technology | 912 | 11.7% |
| Business | 1,727 | 22.1% |
| Education | 943 | 12.1% |
| Literature & Languages | 233 | 3.0% |
| Liberal Arts & History | 275 | 3.5% |
| Visual & Performing Arts | 346 | 4.4% |
| Communications | 349 | 4.5% |
| Arts & Humanities | 571 | 7.3% |
| Total | 7,805 | 100.0% |
Transportation & Commute in Opelika
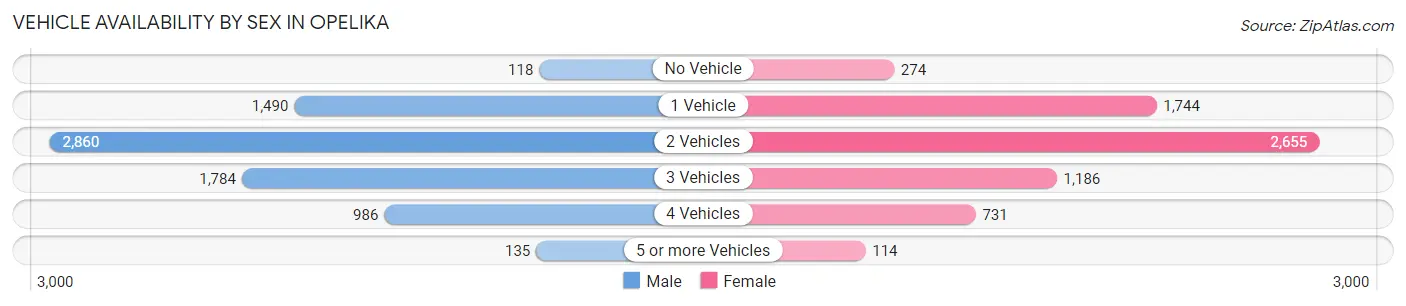
Vehicle Availability by Sex in Opelika
The most prevalent vehicle ownership categories in Opelika are males with 2 vehicles (2,860, accounting for 38.8%) and females with 2 vehicles (2,655, making up 42.7%).
| Vehicles Available | Male | Female |
| No Vehicle | 118 (1.6%) | 274 (4.1%) |
| 1 Vehicle | 1,490 (20.2%) | 1,744 (26.0%) |
| 2 Vehicles | 2,860 (38.8%) | 2,655 (39.6%) |
| 3 Vehicles | 1,784 (24.2%) | 1,186 (17.7%) |
| 4 Vehicles | 986 (13.4%) | 731 (10.9%) |
| 5 or more Vehicles | 135 (1.8%) | 114 (1.7%) |
| Total | 7,373 (100.0%) | 6,704 (100.0%) |
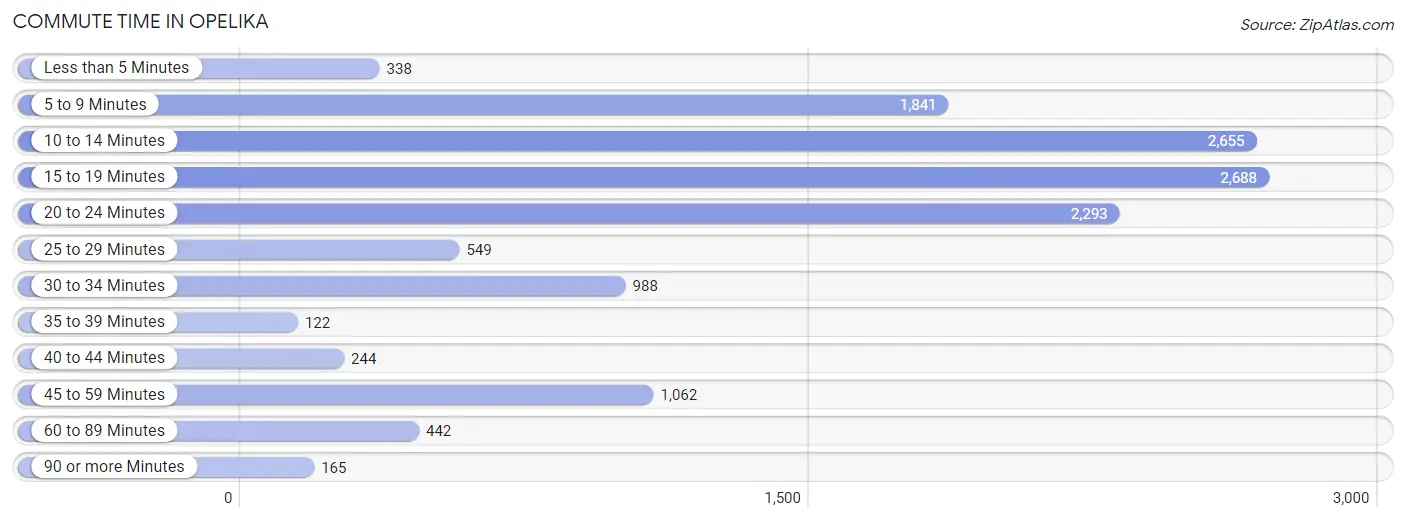
Commute Time in Opelika
The most frequently occuring commute durations in Opelika are 15 to 19 minutes (2,688 commuters, 20.1%), 10 to 14 minutes (2,655 commuters, 19.8%), and 20 to 24 minutes (2,293 commuters, 17.1%).
| Commute Time | # Commuters | % Commuters |
| Less than 5 Minutes | 338 | 2.5% |
| 5 to 9 Minutes | 1,841 | 13.8% |
| 10 to 14 Minutes | 2,655 | 19.8% |
| 15 to 19 Minutes | 2,688 | 20.1% |
| 20 to 24 Minutes | 2,293 | 17.1% |
| 25 to 29 Minutes | 549 | 4.1% |
| 30 to 34 Minutes | 988 | 7.4% |
| 35 to 39 Minutes | 122 | 0.9% |
| 40 to 44 Minutes | 244 | 1.8% |
| 45 to 59 Minutes | 1,062 | 7.9% |
| 60 to 89 Minutes | 442 | 3.3% |
| 90 or more Minutes | 165 | 1.2% |
Commute Time by Sex in Opelika
The most common commute times in Opelika are 10 to 14 minutes (1,472 commuters, 20.7%) for males and 15 to 19 minutes (1,453 commuters, 23.1%) for females.

| Commute Time | Male | Female |
| Less than 5 Minutes | 216 (3.0%) | 122 (1.9%) |
| 5 to 9 Minutes | 775 (10.9%) | 1,066 (16.9%) |
| 10 to 14 Minutes | 1,472 (20.7%) | 1,183 (18.8%) |
| 15 to 19 Minutes | 1,235 (17.4%) | 1,453 (23.1%) |
| 20 to 24 Minutes | 1,366 (19.3%) | 927 (14.7%) |
| 25 to 29 Minutes | 366 (5.2%) | 183 (2.9%) |
| 30 to 34 Minutes | 569 (8.0%) | 419 (6.7%) |
| 35 to 39 Minutes | 20 (0.3%) | 102 (1.6%) |
| 40 to 44 Minutes | 140 (2.0%) | 104 (1.7%) |
| 45 to 59 Minutes | 527 (7.4%) | 535 (8.5%) |
| 60 to 89 Minutes | 317 (4.5%) | 125 (2.0%) |
| 90 or more Minutes | 93 (1.3%) | 72 (1.1%) |
Time of Departure to Work by Sex in Opelika
The most frequent times of departure to work in Opelika are 7:30 AM to 7:59 AM (1,090, 15.4%) for males and 7:30 AM to 7:59 AM (958, 15.2%) for females.
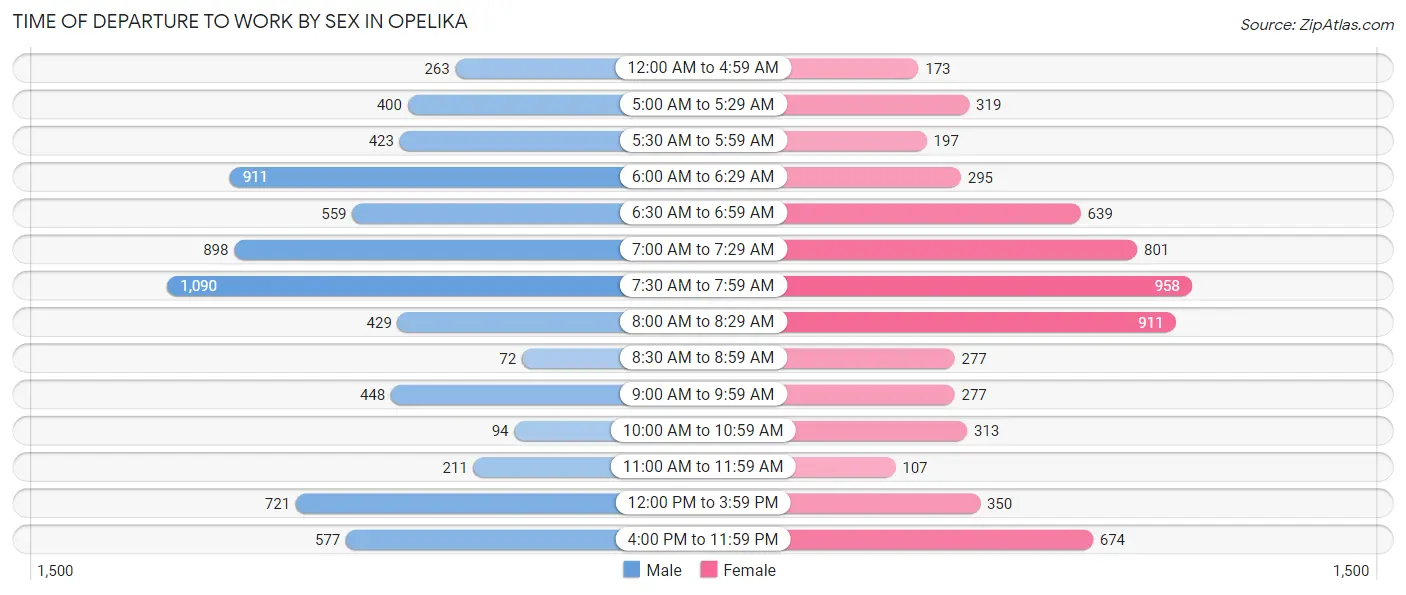
| Time of Departure | Male | Female |
| 12:00 AM to 4:59 AM | 263 (3.7%) | 173 (2.8%) |
| 5:00 AM to 5:29 AM | 400 (5.6%) | 319 (5.1%) |
| 5:30 AM to 5:59 AM | 423 (6.0%) | 197 (3.1%) |
| 6:00 AM to 6:29 AM | 911 (12.8%) | 295 (4.7%) |
| 6:30 AM to 6:59 AM | 559 (7.9%) | 639 (10.2%) |
| 7:00 AM to 7:29 AM | 898 (12.7%) | 801 (12.7%) |
| 7:30 AM to 7:59 AM | 1,090 (15.4%) | 958 (15.2%) |
| 8:00 AM to 8:29 AM | 429 (6.0%) | 911 (14.5%) |
| 8:30 AM to 8:59 AM | 72 (1.0%) | 277 (4.4%) |
| 9:00 AM to 9:59 AM | 448 (6.3%) | 277 (4.4%) |
| 10:00 AM to 10:59 AM | 94 (1.3%) | 313 (5.0%) |
| 11:00 AM to 11:59 AM | 211 (3.0%) | 107 (1.7%) |
| 12:00 PM to 3:59 PM | 721 (10.2%) | 350 (5.6%) |
| 4:00 PM to 11:59 PM | 577 (8.1%) | 674 (10.7%) |
| Total | 7,096 (100.0%) | 6,291 (100.0%) |
Housing Occupancy in Opelika
Occupancy by Ownership in Opelika
Of the total 12,295 dwellings in Opelika, owner-occupied units account for 8,544 (69.5%), while renter-occupied units make up 3,751 (30.5%).
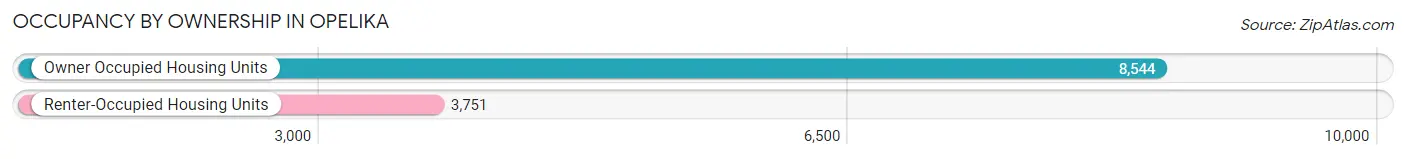
| Occupancy | # Housing Units | % Housing Units |
| Owner Occupied Housing Units | 8,544 | 69.5% |
| Renter-Occupied Housing Units | 3,751 | 30.5% |
| Total Occupied Housing Units | 12,295 | 100.0% |
Occupancy by Household Size in Opelika
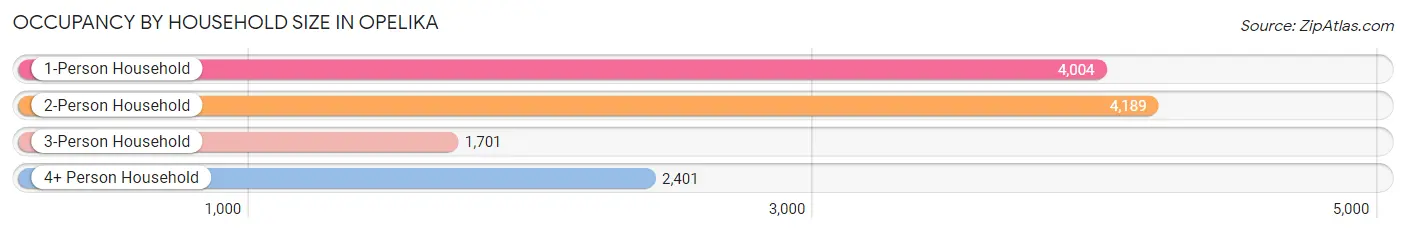
| Household Size | # Housing Units | % Housing Units |
| 1-Person Household | 4,004 | 32.6% |
| 2-Person Household | 4,189 | 34.1% |
| 3-Person Household | 1,701 | 13.8% |
| 4+ Person Household | 2,401 | 19.5% |
| Total Housing Units | 12,295 | 100.0% |
Occupancy by Ownership by Household Size in Opelika
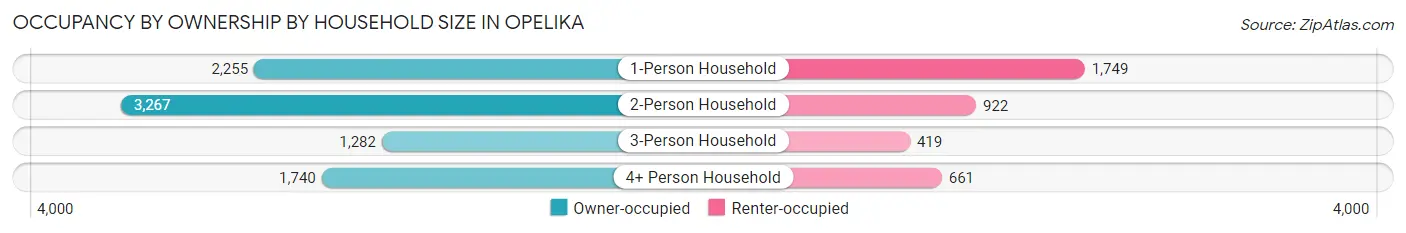
| Household Size | Owner-occupied | Renter-occupied |
| 1-Person Household | 2,255 (56.3%) | 1,749 (43.7%) |
| 2-Person Household | 3,267 (78.0%) | 922 (22.0%) |
| 3-Person Household | 1,282 (75.4%) | 419 (24.6%) |
| 4+ Person Household | 1,740 (72.5%) | 661 (27.5%) |
| Total Housing Units | 8,544 (69.5%) | 3,751 (30.5%) |
Occupancy by Educational Attainment in Opelika
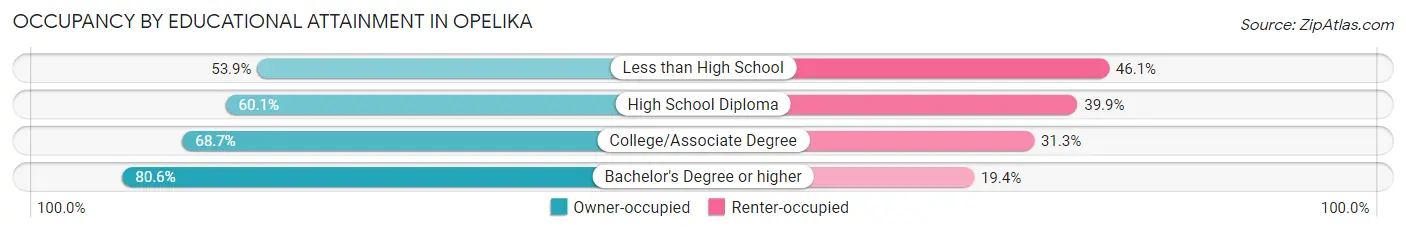
| Household Size | Owner-occupied | Renter-occupied |
| Less than High School | 676 (53.9%) | 579 (46.1%) |
| High School Diploma | 1,736 (60.1%) | 1,151 (39.9%) |
| College/Associate Degree | 2,541 (68.7%) | 1,157 (31.3%) |
| Bachelor's Degree or higher | 3,591 (80.6%) | 864 (19.4%) |
Occupancy by Age of Householder in Opelika
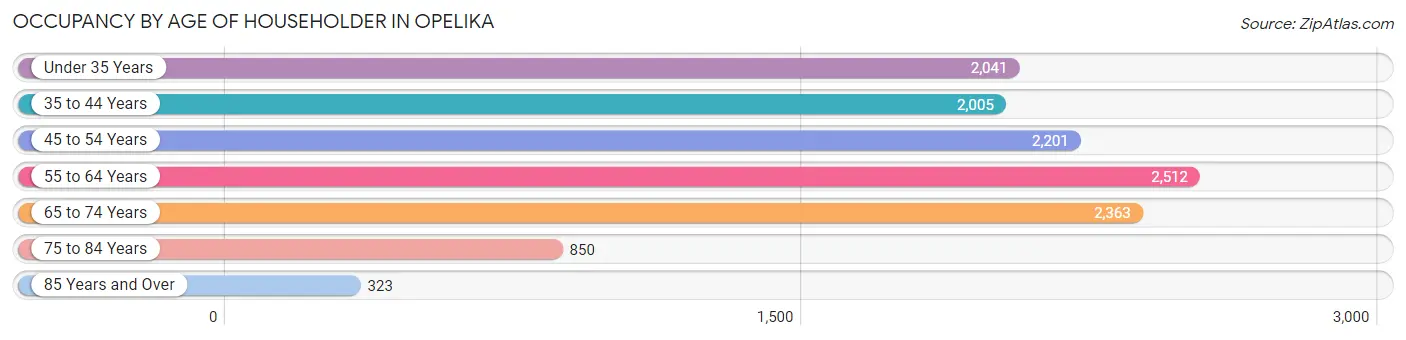
| Age Bracket | # Households | % Households |
| Under 35 Years | 2,041 | 16.6% |
| 35 to 44 Years | 2,005 | 16.3% |
| 45 to 54 Years | 2,201 | 17.9% |
| 55 to 64 Years | 2,512 | 20.4% |
| 65 to 74 Years | 2,363 | 19.2% |
| 75 to 84 Years | 850 | 6.9% |
| 85 Years and Over | 323 | 2.6% |
| Total | 12,295 | 100.0% |
Housing Finances in Opelika
Median Income by Occupancy in Opelika
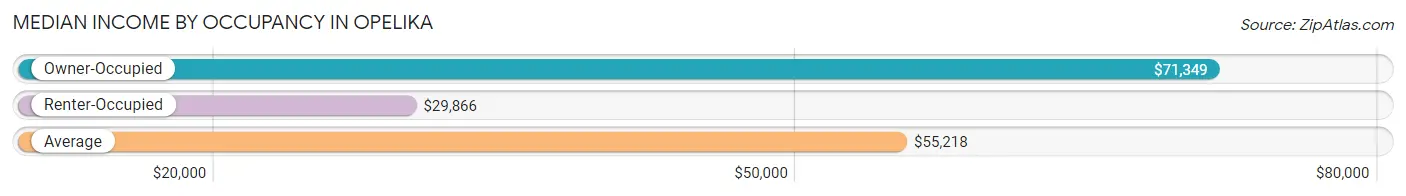
| Occupancy Type | # Households | Median Income |
| Owner-Occupied | 8,544 (69.5%) | $71,349 |
| Renter-Occupied | 3,751 (30.5%) | $29,866 |
| Average | 12,295 (100.0%) | $55,218 |
Occupancy by Householder Income Bracket in Opelika
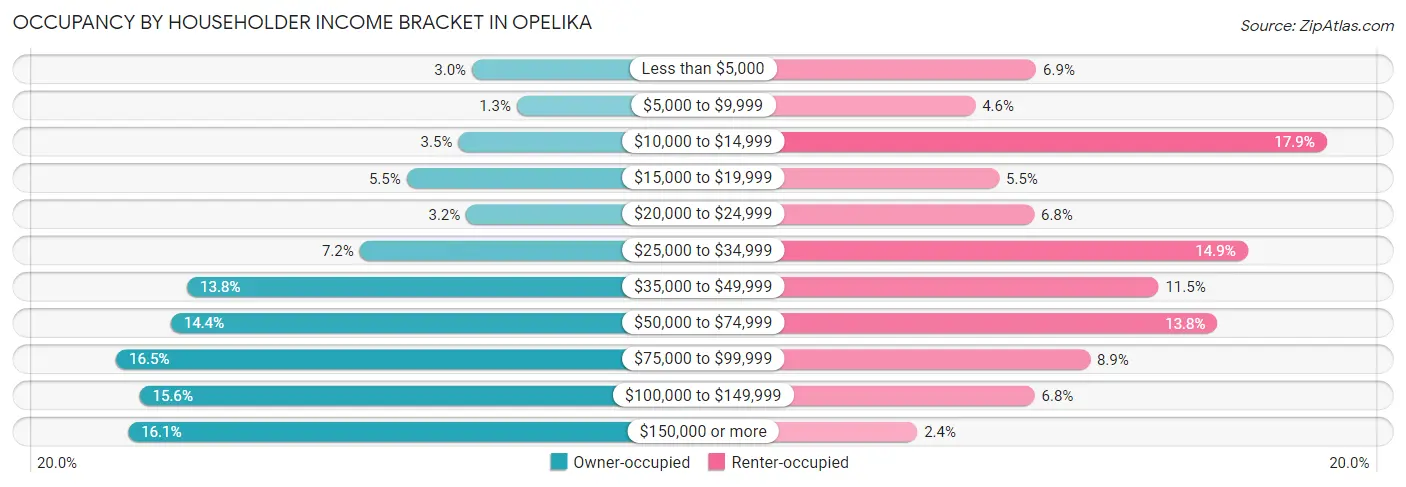
| Income Bracket | Owner-occupied | Renter-occupied |
| Less than $5,000 | 253 (3.0%) | 258 (6.9%) |
| $5,000 to $9,999 | 107 (1.3%) | 171 (4.6%) |
| $10,000 to $14,999 | 297 (3.5%) | 673 (17.9%) |
| $15,000 to $19,999 | 466 (5.4%) | 205 (5.5%) |
| $20,000 to $24,999 | 272 (3.2%) | 255 (6.8%) |
| $25,000 to $34,999 | 619 (7.2%) | 560 (14.9%) |
| $35,000 to $49,999 | 1,180 (13.8%) | 433 (11.5%) |
| $50,000 to $74,999 | 1,233 (14.4%) | 517 (13.8%) |
| $75,000 to $99,999 | 1,411 (16.5%) | 335 (8.9%) |
| $100,000 to $149,999 | 1,335 (15.6%) | 256 (6.8%) |
| $150,000 or more | 1,371 (16.1%) | 88 (2.4%) |
| Total | 8,544 (100.0%) | 3,751 (100.0%) |
Monthly Housing Cost Tiers in Opelika
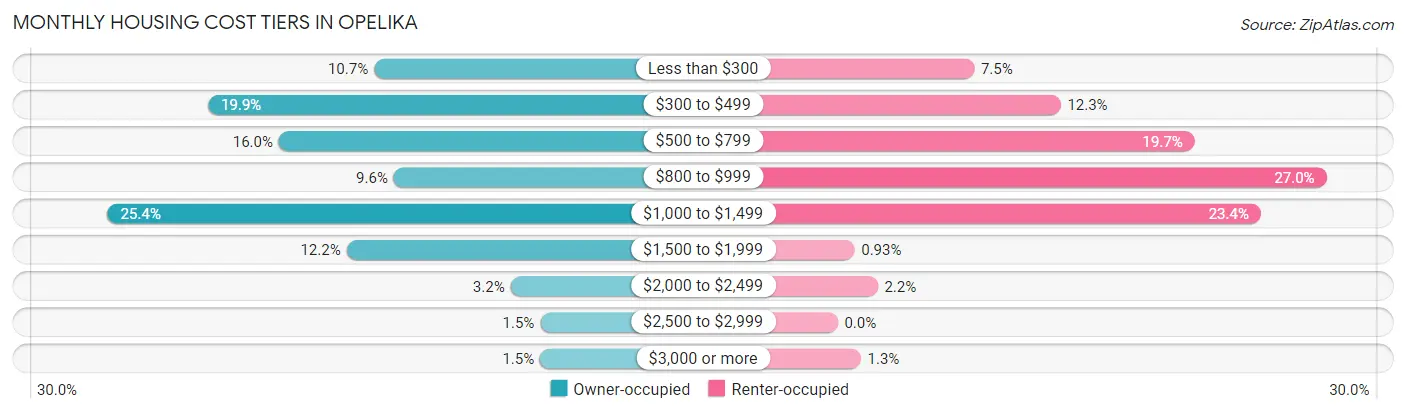
| Monthly Cost | Owner-occupied | Renter-occupied |
| Less than $300 | 914 (10.7%) | 283 (7.5%) |
| $300 to $499 | 1,698 (19.9%) | 462 (12.3%) |
| $500 to $799 | 1,364 (16.0%) | 740 (19.7%) |
| $800 to $999 | 821 (9.6%) | 1,013 (27.0%) |
| $1,000 to $1,499 | 2,172 (25.4%) | 877 (23.4%) |
| $1,500 to $1,999 | 1,044 (12.2%) | 35 (0.9%) |
| $2,000 to $2,499 | 270 (3.2%) | 83 (2.2%) |
| $2,500 to $2,999 | 130 (1.5%) | 0 (0.0%) |
| $3,000 or more | 131 (1.5%) | 48 (1.3%) |
| Total | 8,544 (100.0%) | 3,751 (100.0%) |
Physical Housing Characteristics in Opelika
Housing Structures in Opelika
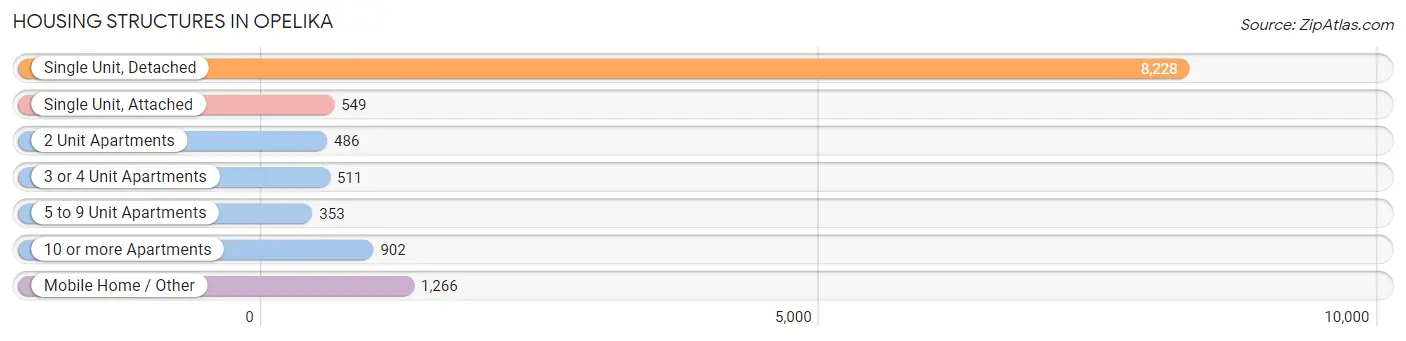
| Structure Type | # Housing Units | % Housing Units |
| Single Unit, Detached | 8,228 | 66.9% |
| Single Unit, Attached | 549 | 4.5% |
| 2 Unit Apartments | 486 | 4.0% |
| 3 or 4 Unit Apartments | 511 | 4.2% |
| 5 to 9 Unit Apartments | 353 | 2.9% |
| 10 or more Apartments | 902 | 7.3% |
| Mobile Home / Other | 1,266 | 10.3% |
| Total | 12,295 | 100.0% |
Housing Structures by Occupancy in Opelika
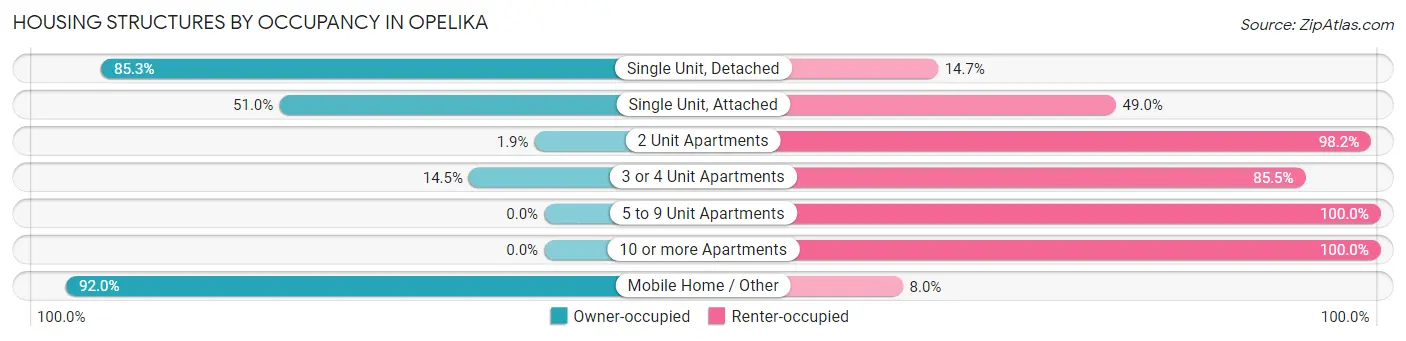
| Structure Type | Owner-occupied | Renter-occupied |
| Single Unit, Detached | 7,016 (85.3%) | 1,212 (14.7%) |
| Single Unit, Attached | 280 (51.0%) | 269 (49.0%) |
| 2 Unit Apartments | 9 (1.8%) | 477 (98.2%) |
| 3 or 4 Unit Apartments | 74 (14.5%) | 437 (85.5%) |
| 5 to 9 Unit Apartments | 0 (0.0%) | 353 (100.0%) |
| 10 or more Apartments | 0 (0.0%) | 902 (100.0%) |
| Mobile Home / Other | 1,165 (92.0%) | 101 (8.0%) |
| Total | 8,544 (69.5%) | 3,751 (30.5%) |
Housing Structures by Number of Rooms in Opelika
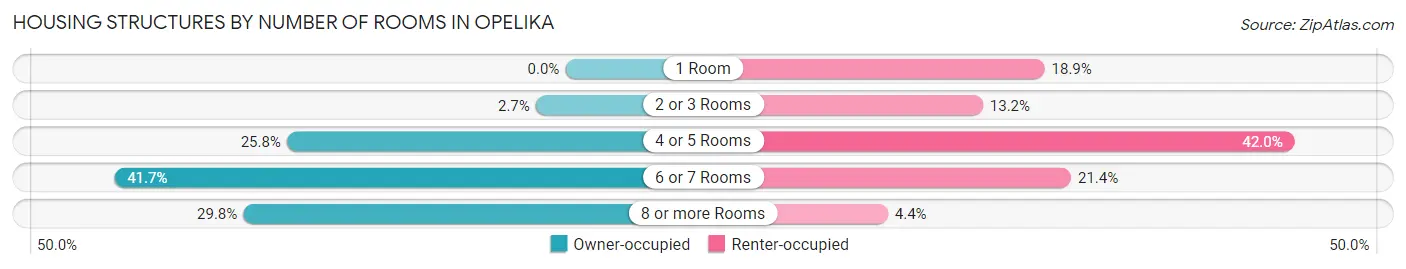
| Number of Rooms | Owner-occupied | Renter-occupied |
| 1 Room | 0 (0.0%) | 710 (18.9%) |
| 2 or 3 Rooms | 234 (2.7%) | 496 (13.2%) |
| 4 or 5 Rooms | 2,201 (25.8%) | 1,577 (42.0%) |
| 6 or 7 Rooms | 3,564 (41.7%) | 802 (21.4%) |
| 8 or more Rooms | 2,545 (29.8%) | 166 (4.4%) |
| Total | 8,544 (100.0%) | 3,751 (100.0%) |
Housing Structure by Heating Type in Opelika
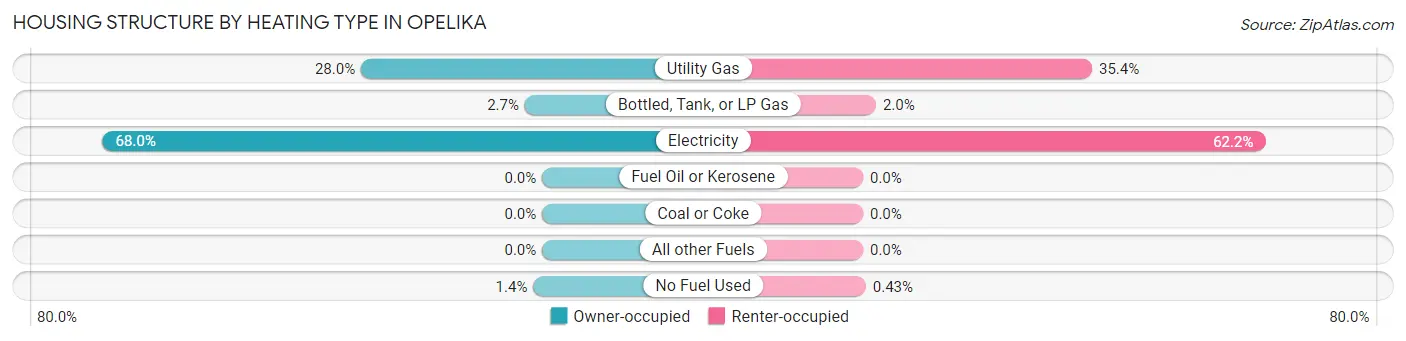
| Heating Type | Owner-occupied | Renter-occupied |
| Utility Gas | 2,392 (28.0%) | 1,328 (35.4%) |
| Bottled, Tank, or LP Gas | 229 (2.7%) | 75 (2.0%) |
| Electricity | 5,806 (67.9%) | 2,332 (62.2%) |
| Fuel Oil or Kerosene | 0 (0.0%) | 0 (0.0%) |
| Coal or Coke | 0 (0.0%) | 0 (0.0%) |
| All other Fuels | 0 (0.0%) | 0 (0.0%) |
| No Fuel Used | 117 (1.4%) | 16 (0.4%) |
| Total | 8,544 (100.0%) | 3,751 (100.0%) |
Household Vehicle Usage in Opelika
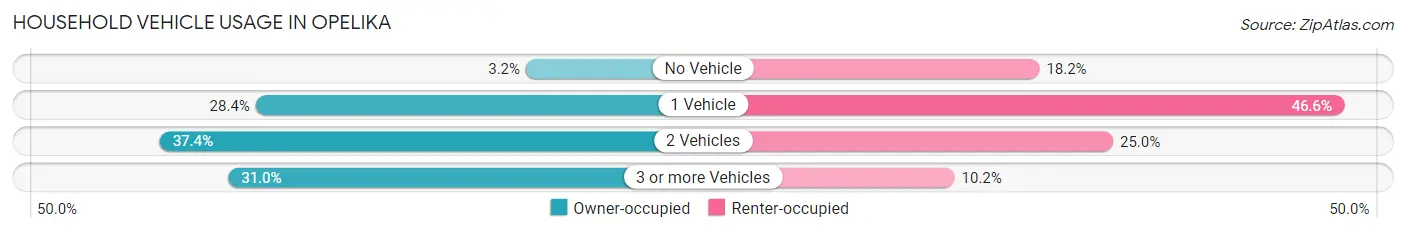
| Vehicles per Household | Owner-occupied | Renter-occupied |
| No Vehicle | 274 (3.2%) | 681 (18.2%) |
| 1 Vehicle | 2,429 (28.4%) | 1,747 (46.6%) |
| 2 Vehicles | 3,194 (37.4%) | 939 (25.0%) |
| 3 or more Vehicles | 2,647 (31.0%) | 384 (10.2%) |
| Total | 8,544 (100.0%) | 3,751 (100.0%) |
Real Estate & Mortgages in Opelika
Real Estate and Mortgage Overview in Opelika
| Characteristic | Without Mortgage | With Mortgage |
| Housing Units | 3,455 | 5,089 |
| Median Property Value | $176,200 | $198,300 |
| Median Household Income | $51,804 | $761 |
| Monthly Housing Costs | $394 | $130 |
| Real Estate Taxes | $939 | $690 |
Property Value by Mortgage Status in Opelika
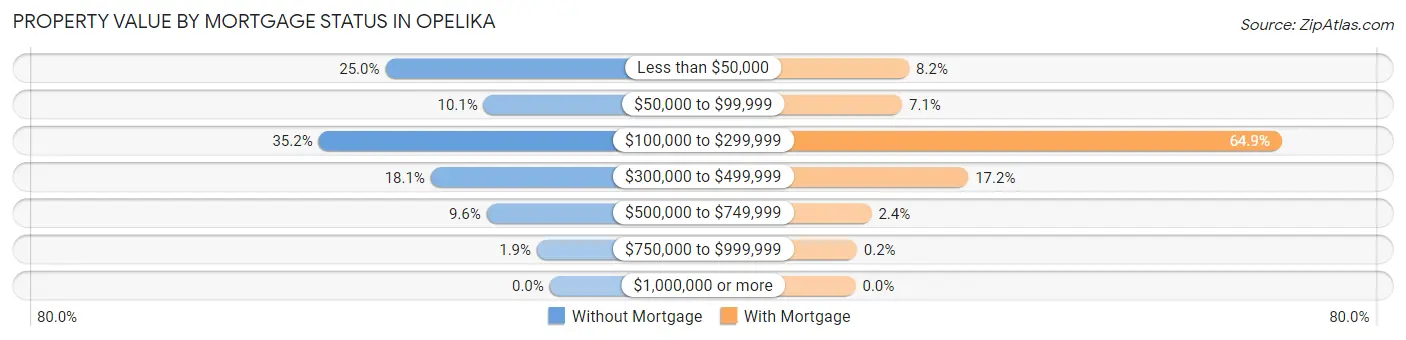
| Property Value | Without Mortgage | With Mortgage |
| Less than $50,000 | 865 (25.0%) | 416 (8.2%) |
| $50,000 to $99,999 | 348 (10.1%) | 361 (7.1%) |
| $100,000 to $299,999 | 1,217 (35.2%) | 3,305 (64.9%) |
| $300,000 to $499,999 | 626 (18.1%) | 874 (17.2%) |
| $500,000 to $749,999 | 332 (9.6%) | 123 (2.4%) |
| $750,000 to $999,999 | 67 (1.9%) | 10 (0.2%) |
| $1,000,000 or more | 0 (0.0%) | 0 (0.0%) |
| Total | 3,455 (100.0%) | 5,089 (100.0%) |
Household Income by Mortgage Status in Opelika
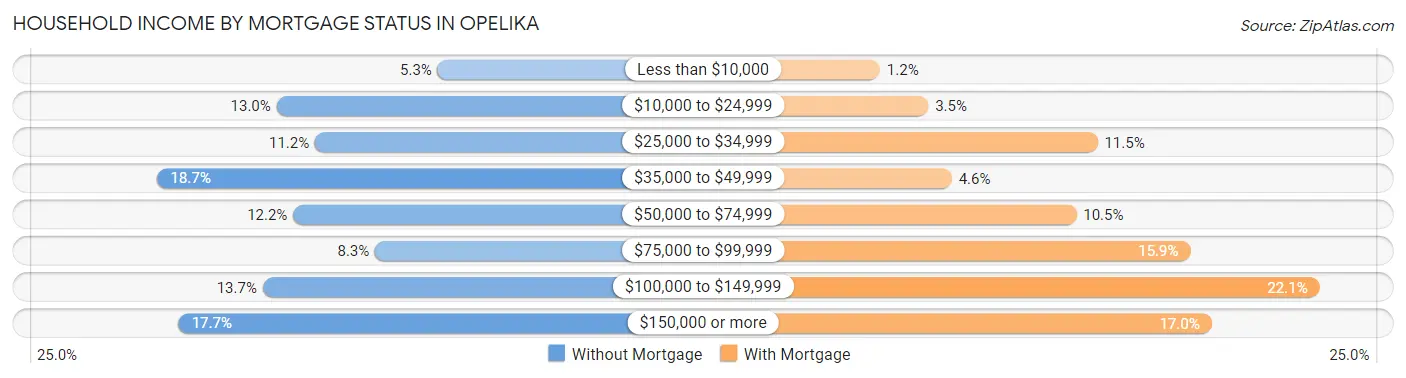
| Household Income | Without Mortgage | With Mortgage |
| Less than $10,000 | 184 (5.3%) | 59 (1.2%) |
| $10,000 to $24,999 | 449 (13.0%) | 176 (3.5%) |
| $25,000 to $34,999 | 386 (11.2%) | 586 (11.5%) |
| $35,000 to $49,999 | 645 (18.7%) | 233 (4.6%) |
| $50,000 to $74,999 | 422 (12.2%) | 535 (10.5%) |
| $75,000 to $99,999 | 287 (8.3%) | 811 (15.9%) |
| $100,000 to $149,999 | 472 (13.7%) | 1,124 (22.1%) |
| $150,000 or more | 610 (17.7%) | 863 (17.0%) |
| Total | 3,455 (100.0%) | 5,089 (100.0%) |
Property Value to Household Income Ratio in Opelika
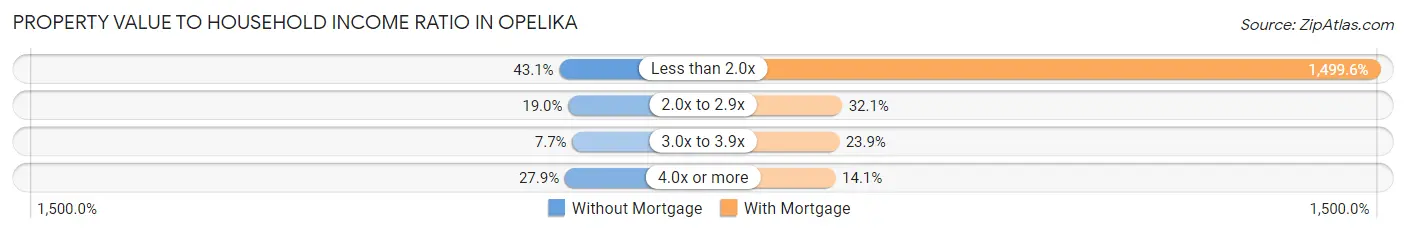
| Value-to-Income Ratio | Without Mortgage | With Mortgage |
| Less than 2.0x | 1,489 (43.1%) | 76,315 (1,499.6%) |
| 2.0x to 2.9x | 655 (19.0%) | 1,633 (32.1%) |
| 3.0x to 3.9x | 266 (7.7%) | 1,215 (23.9%) |
| 4.0x or more | 965 (27.9%) | 716 (14.1%) |
| Total | 3,455 (100.0%) | 5,089 (100.0%) |
Real Estate Taxes by Mortgage Status in Opelika
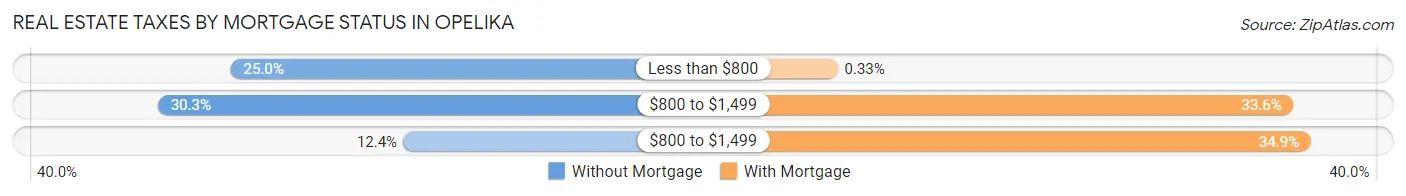
| Property Taxes | Without Mortgage | With Mortgage |
| Less than $800 | 862 (24.9%) | 17 (0.3%) |
| $800 to $1,499 | 1,046 (30.3%) | 1,712 (33.6%) |
| $800 to $1,499 | 427 (12.4%) | 1,777 (34.9%) |
| Total | 3,455 (100.0%) | 5,089 (100.0%) |
Health & Disability in Opelika
Health Insurance Coverage by Age in Opelika
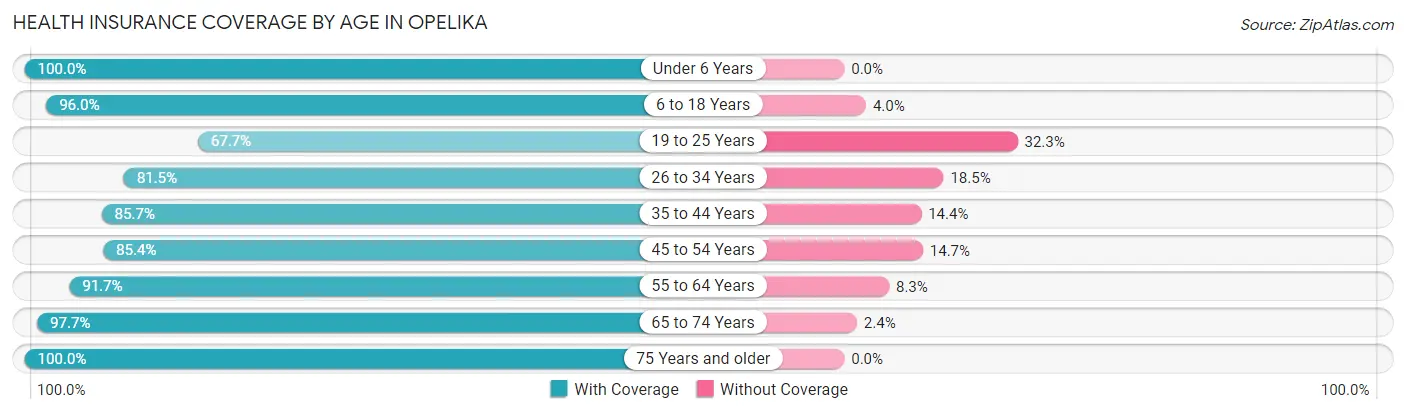
| Age Bracket | With Coverage | Without Coverage |
| Under 6 Years | 2,420 (100.0%) | 0 (0.0%) |
| 6 to 18 Years | 4,604 (96.0%) | 194 (4.0%) |
| 19 to 25 Years | 1,827 (67.7%) | 872 (32.3%) |
| 26 to 34 Years | 3,133 (81.5%) | 711 (18.5%) |
| 35 to 44 Years | 3,240 (85.7%) | 543 (14.3%) |
| 45 to 54 Years | 3,298 (85.4%) | 566 (14.6%) |
| 55 to 64 Years | 3,739 (91.7%) | 340 (8.3%) |
| 65 to 74 Years | 3,413 (97.7%) | 82 (2.4%) |
| 75 Years and older | 1,907 (100.0%) | 0 (0.0%) |
| Total | 27,581 (89.3%) | 3,308 (10.7%) |
Health Insurance Coverage by Citizenship Status in Opelika
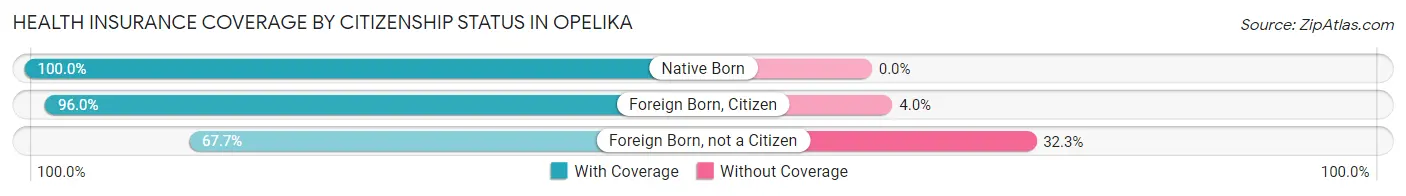
| Citizenship Status | With Coverage | Without Coverage |
| Native Born | 2,420 (100.0%) | 0 (0.0%) |
| Foreign Born, Citizen | 4,604 (96.0%) | 194 (4.0%) |
| Foreign Born, not a Citizen | 1,827 (67.7%) | 872 (32.3%) |
Health Insurance Coverage by Household Income in Opelika
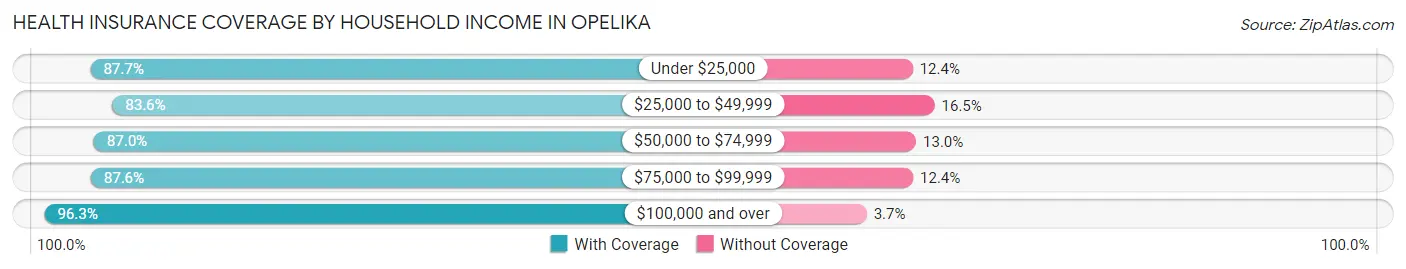
| Household Income | With Coverage | Without Coverage |
| Under $25,000 | 5,108 (87.6%) | 720 (12.3%) |
| $25,000 to $49,999 | 5,674 (83.6%) | 1,117 (16.5%) |
| $50,000 to $74,999 | 3,035 (87.0%) | 453 (13.0%) |
| $75,000 to $99,999 | 4,562 (87.6%) | 647 (12.4%) |
| $100,000 and over | 9,081 (96.3%) | 352 (3.7%) |
Public vs Private Health Insurance Coverage by Age in Opelika
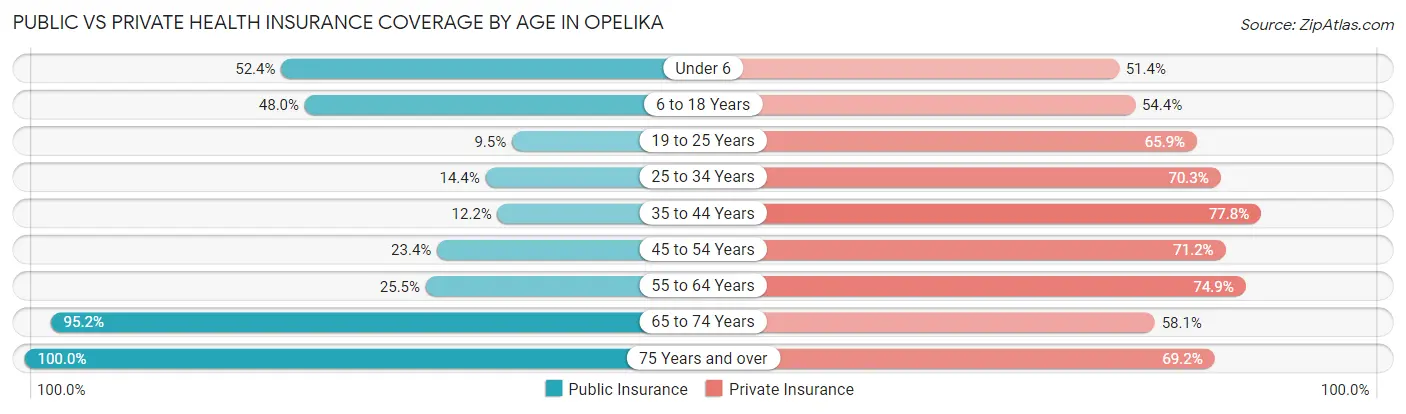
| Age Bracket | Public Insurance | Private Insurance |
| Under 6 | 1,267 (52.4%) | 1,244 (51.4%) |
| 6 to 18 Years | 2,302 (48.0%) | 2,611 (54.4%) |
| 19 to 25 Years | 257 (9.5%) | 1,779 (65.9%) |
| 25 to 34 Years | 555 (14.4%) | 2,702 (70.3%) |
| 35 to 44 Years | 461 (12.2%) | 2,943 (77.8%) |
| 45 to 54 Years | 905 (23.4%) | 2,751 (71.2%) |
| 55 to 64 Years | 1,041 (25.5%) | 3,057 (74.9%) |
| 65 to 74 Years | 3,326 (95.2%) | 2,030 (58.1%) |
| 75 Years and over | 1,907 (100.0%) | 1,319 (69.2%) |
| Total | 12,021 (38.9%) | 20,436 (66.2%) |
Disability Status by Sex by Age in Opelika
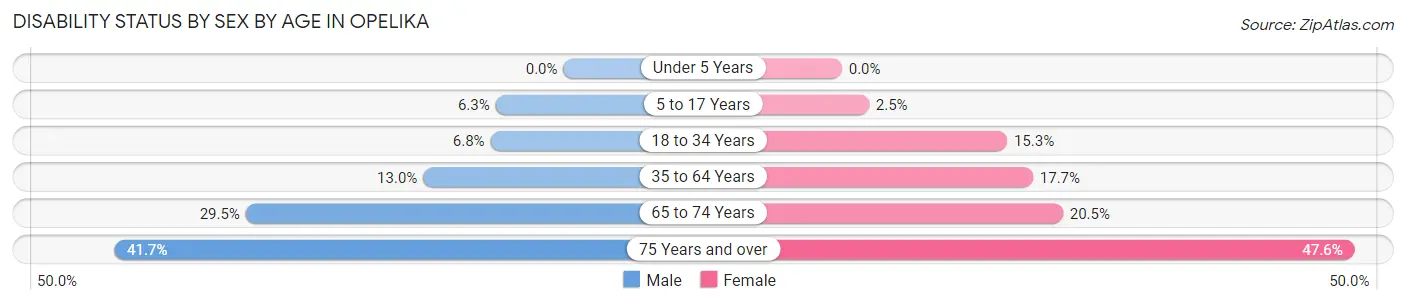
| Age Bracket | Male | Female |
| Under 5 Years | 0 (0.0%) | 0 (0.0%) |
| 5 to 17 Years | 159 (6.3%) | 59 (2.5%) |
| 18 to 34 Years | 231 (6.8%) | 526 (15.3%) |
| 35 to 64 Years | 738 (13.0%) | 1,073 (17.7%) |
| 65 to 74 Years | 497 (29.5%) | 371 (20.5%) |
| 75 Years and over | 301 (41.7%) | 564 (47.6%) |
Disability Class by Sex by Age in Opelika
Disability Class: Hearing Difficulty
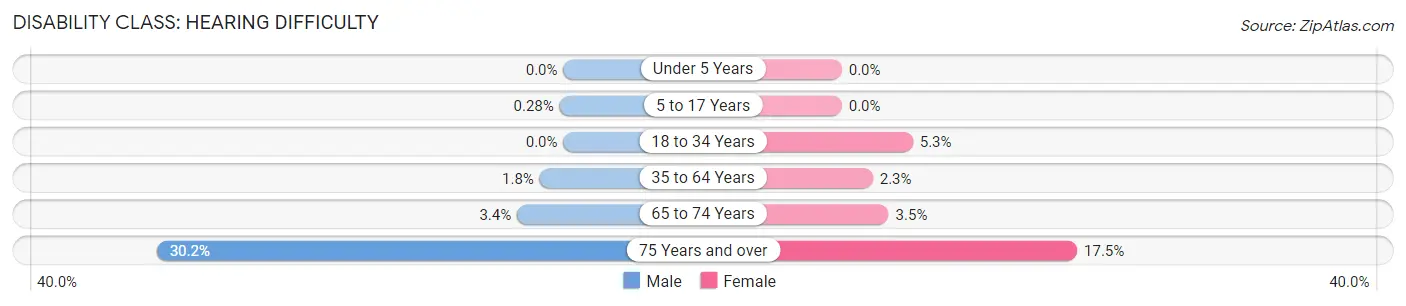
| Age Bracket | Male | Female |
| Under 5 Years | 0 (0.0%) | 0 (0.0%) |
| 5 to 17 Years | 7 (0.3%) | 0 (0.0%) |
| 18 to 34 Years | 0 (0.0%) | 181 (5.3%) |
| 35 to 64 Years | 100 (1.8%) | 139 (2.3%) |
| 65 to 74 Years | 58 (3.4%) | 63 (3.5%) |
| 75 Years and over | 218 (30.2%) | 207 (17.5%) |
Disability Class: Vision Difficulty
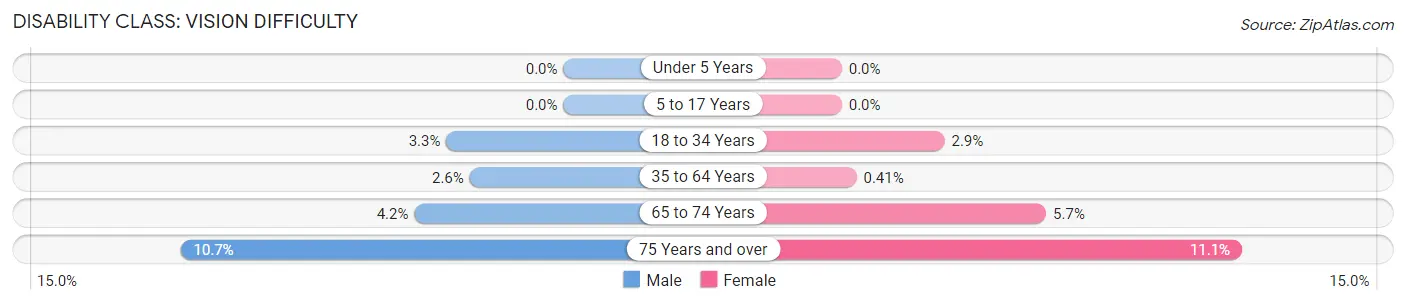
| Age Bracket | Male | Female |
| Under 5 Years | 0 (0.0%) | 0 (0.0%) |
| 5 to 17 Years | 0 (0.0%) | 0 (0.0%) |
| 18 to 34 Years | 111 (3.3%) | 98 (2.9%) |
| 35 to 64 Years | 148 (2.6%) | 25 (0.4%) |
| 65 to 74 Years | 70 (4.2%) | 103 (5.7%) |
| 75 Years and over | 77 (10.7%) | 132 (11.1%) |
Disability Class: Cognitive Difficulty
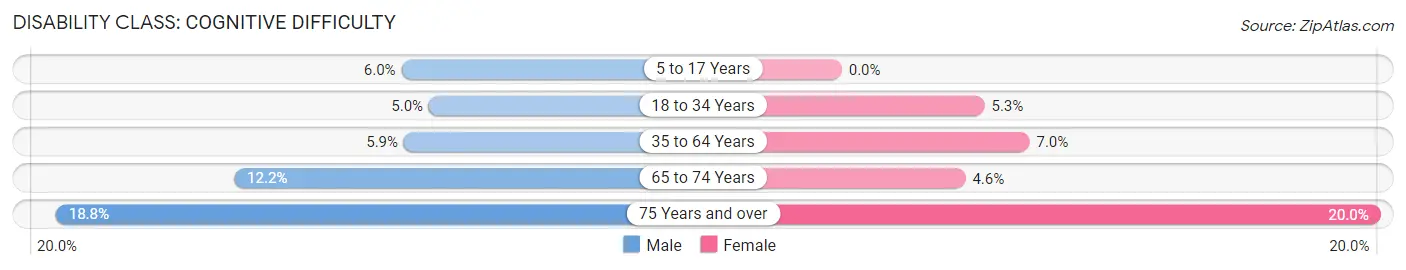
| Age Bracket | Male | Female |
| 5 to 17 Years | 152 (6.0%) | 0 (0.0%) |
| 18 to 34 Years | 170 (5.0%) | 182 (5.3%) |
| 35 to 64 Years | 336 (5.9%) | 422 (7.0%) |
| 65 to 74 Years | 206 (12.2%) | 83 (4.6%) |
| 75 Years and over | 136 (18.8%) | 237 (20.0%) |
Disability Class: Ambulatory Difficulty
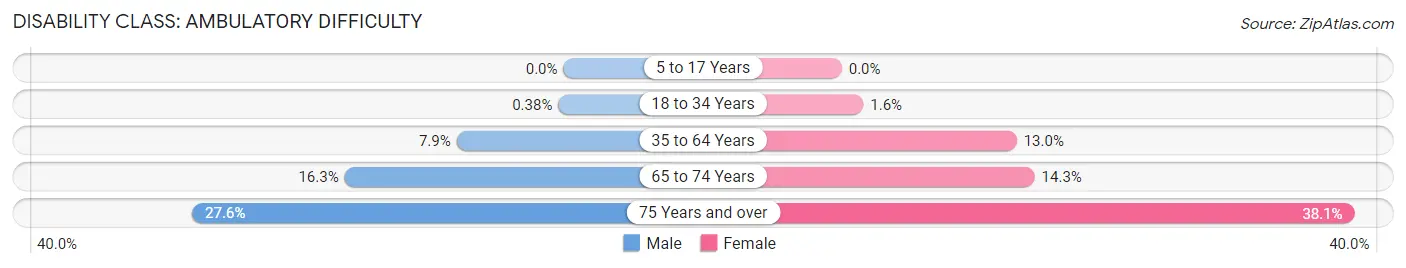
| Age Bracket | Male | Female |
| 5 to 17 Years | 0 (0.0%) | 0 (0.0%) |
| 18 to 34 Years | 13 (0.4%) | 55 (1.6%) |
| 35 to 64 Years | 450 (7.9%) | 786 (13.0%) |
| 65 to 74 Years | 274 (16.3%) | 259 (14.3%) |
| 75 Years and over | 199 (27.6%) | 451 (38.1%) |
Disability Class: Self-Care Difficulty
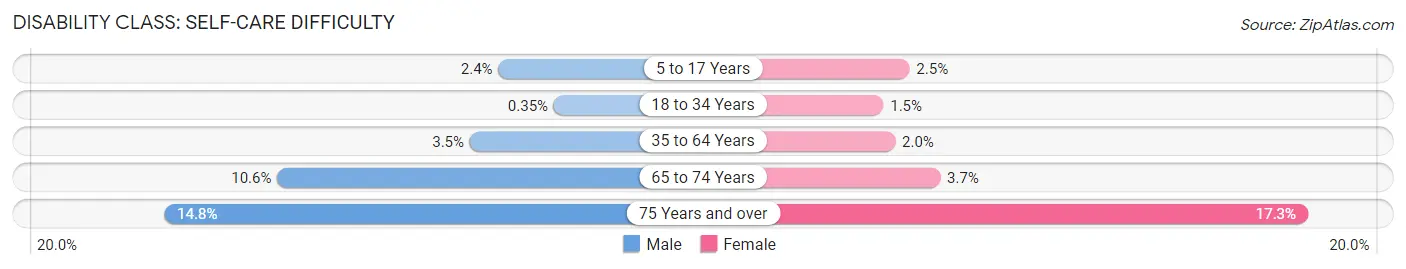
| Age Bracket | Male | Female |
| 5 to 17 Years | 61 (2.4%) | 59 (2.5%) |
| 18 to 34 Years | 12 (0.4%) | 53 (1.5%) |
| 35 to 64 Years | 197 (3.5%) | 120 (2.0%) |
| 65 to 74 Years | 179 (10.6%) | 66 (3.6%) |
| 75 Years and over | 107 (14.8%) | 205 (17.3%) |
Technology Access in Opelika
Computing Device Access in Opelika
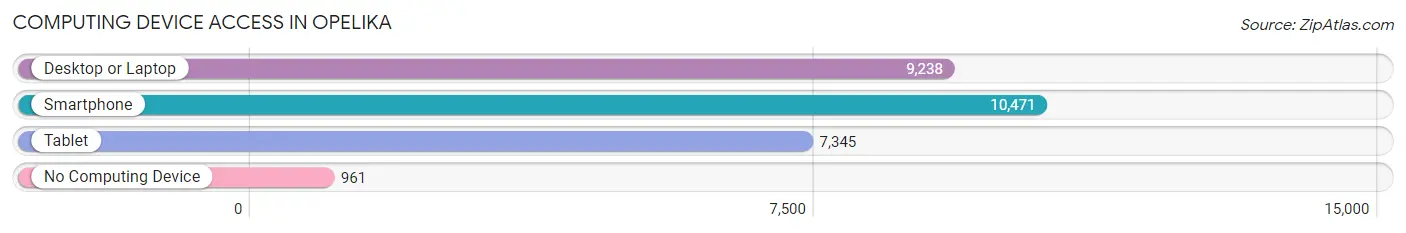
| Device Type | # Households | % Households |
| Desktop or Laptop | 9,238 | 75.1% |
| Smartphone | 10,471 | 85.2% |
| Tablet | 7,345 | 59.7% |
| No Computing Device | 961 | 7.8% |
| Total | 12,295 | 100.0% |
Internet Access in Opelika
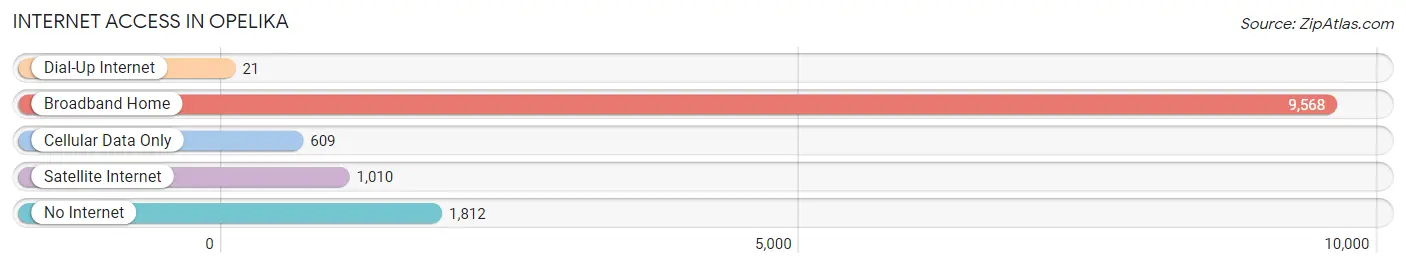
| Internet Type | # Households | % Households |
| Dial-Up Internet | 21 | 0.2% |
| Broadband Home | 9,568 | 77.8% |
| Cellular Data Only | 609 | 5.0% |
| Satellite Internet | 1,010 | 8.2% |
| No Internet | 1,812 | 14.7% |
| Total | 12,295 | 100.0% |
Opelika Summary
Opelika, Alabama is a city located in Lee County, Alabama, United States. It is the county seat of Lee County and is located in the east-central part of the state. As of the 2010 census, the population of Opelika was 28,635.
History
The area that is now Opelika was originally inhabited by the Creek Indians. The first white settlers arrived in the area in the early 1800s. The city was founded in 1842 by a group of settlers from Georgia and was named after a Creek Indian village. The city was incorporated in 1854.
During the Civil War, Opelika was the site of several battles, including the Battle of Opelika in 1864. After the war, the city experienced a period of growth and development. The city was connected to the railroad in 1872, which helped to spur economic growth.
In the late 19th century, Opelika became a center for the textile industry. The city was home to several cotton mills and other textile-related businesses. The city also became a center for the lumber industry, with several sawmills located in the area.
In the early 20th century, Opelika experienced a period of growth and development. The city was connected to the electric grid in 1912, and the first paved roads were built in the city in the 1920s. The city also experienced a period of population growth, with the population increasing from 4,000 in 1910 to over 10,000 by 1930.
Geography
Opelika is located in east-central Alabama, approximately 60 miles east of Montgomery and 80 miles southwest of Atlanta, Georgia. The city is situated at the intersection of Interstate 85 and U.S. Route 280.
The city is located in the foothills of the Appalachian Mountains and is part of the Black Belt region of Alabama. The city is located on the banks of the Chattahoochee River. The city has a total area of 24.2 square miles, of which 24.1 square miles is land and 0.1 square miles is water.
Economy
Opelika’s economy is largely based on manufacturing and retail. The city is home to several manufacturing companies, including a Honda plant, a Goodyear tire plant, and a Tyson Foods plant. The city is also home to several retail stores, including Walmart, Target, and Lowe’s.
The city is also home to several educational institutions, including Auburn University at Montgomery, Southern Union State Community College, and Central Alabama Community College.
Demographics
As of the 2010 census, the population of Opelika was 28,635. The racial makeup of the city was 57.3% White, 37.2% African American, 0.3% Native American, 1.7% Asian, 0.1% Pacific Islander, 1.3% from other races, and 2.3% from two or more races. Hispanic or Latino of any race were 4.2% of the population.
The median income for a household in the city was $37,945, and the median income for a family was $45,945. The per capita income for the city was $20,845. About 17.2% of families and 21.2% of the population were below the poverty line, including 28.2% of those under age 18 and 11.2% of those age 65 or over.
Common Questions
What is Per Capita Income in Opelika?
Per Capita income in Opelika is $31,462.
What is the Median Family Income in Opelika?
Median Family Income in Opelika is $77,131.
What is the Median Household income in Opelika?
Median Household Income in Opelika is $55,218.
What is Income or Wage Gap in Opelika?
Income or Wage Gap in Opelika is 20.3%.
Women in Opelika earn 79.7 cents for every dollar earned by a man.
What is Inequality or Gini Index in Opelika?
Inequality or Gini Index in Opelika is 0.47.
What is the Total Population of Opelika?
Total Population of Opelika is 31,361.
What is the Total Male Population of Opelika?
Total Male Population of Opelika is 15,339.
What is the Total Female Population of Opelika?
Total Female Population of Opelika is 16,022.
What is the Ratio of Males per 100 Females in Opelika?
There are 95.74 Males per 100 Females in Opelika.
What is the Ratio of Females per 100 Males in Opelika?
There are 104.45 Females per 100 Males in Opelika.
What is the Median Population Age in Opelika?
Median Population Age in Opelika is 39.6 Years.
What is the Average Family Size in Opelika
Average Family Size in Opelika is 3.2 People.
What is the Average Household Size in Opelika
Average Household Size in Opelika is 2.5 People.
How Large is the Labor Force in Opelika?
There are 15,043 People in the Labor Forcein in Opelika.
What is the Percentage of People in the Labor Force in Opelika?
59.0% of People are in the Labor Force in Opelika.
What is the Unemployment Rate in Opelika?
Unemployment Rate in Opelika is 5.1%.