Guntersville, AL Map & Demographics
Guntersville Map
Guntersville Overview
$37,110
PER CAPITA INCOME
$86,204
AVG FAMILY INCOME
$61,453
AVG HOUSEHOLD INCOME
44.6%
WAGE / INCOME GAP [ % ]
55.4¢/ $1
WAGE / INCOME GAP [ $ ]
$14,849
FAMILY INCOME DEFICIT
0.51
INEQUALITY / GINI INDEX
8,644
TOTAL POPULATION
4,409
MALE POPULATION
4,235
FEMALE POPULATION
104.11
MALES / 100 FEMALES
96.05
FEMALES / 100 MALES
43.2
MEDIAN AGE
3.0
AVG FAMILY SIZE
2.4
AVG HOUSEHOLD SIZE
3,386
LABOR FORCE [ PEOPLE ]
48.4%
PERCENT IN LABOR FORCE
3.7%
UNEMPLOYMENT RATE
Guntersville Zip Codes
Guntersville Area Codes
Income in Guntersville
Income Overview in Guntersville
Per Capita Income in Guntersville is $37,110, while median incomes of families and households are $86,204 and $61,453 respectively.
| Characteristic | Number | Measure |
| Per Capita Income | 8,644 | $37,110 |
| Median Family Income | 2,286 | $86,204 |
| Mean Family Income | 2,286 | $111,048 |
| Median Household Income | 3,364 | $61,453 |
| Mean Household Income | 3,364 | $90,080 |
| Income Deficit | 2,286 | $14,849 |
| Wage / Income Gap (%) | 8,644 | 44.55% |
| Wage / Income Gap ($) | 8,644 | 55.45¢ per $1 |
| Gini / Inequality Index | 8,644 | 0.51 |
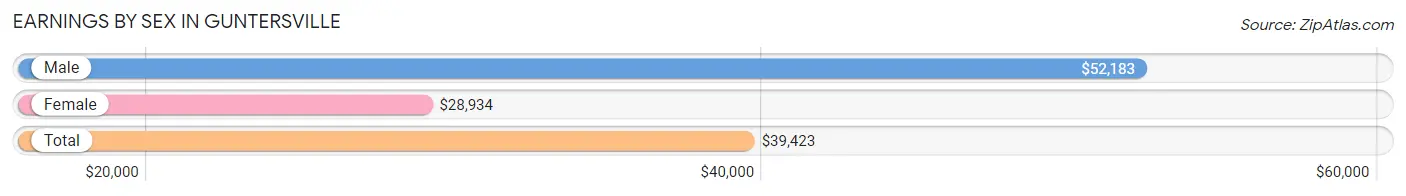
Earnings by Sex in Guntersville
Average Earnings in Guntersville are $39,423, $52,183 for men and $28,934 for women, a difference of 44.6%.
| Sex | Number | Average Earnings |
| Male | 2,072 (54.2%) | $52,183 |
| Female | 1,754 (45.8%) | $28,934 |
| Total | 3,826 (100.0%) | $39,423 |
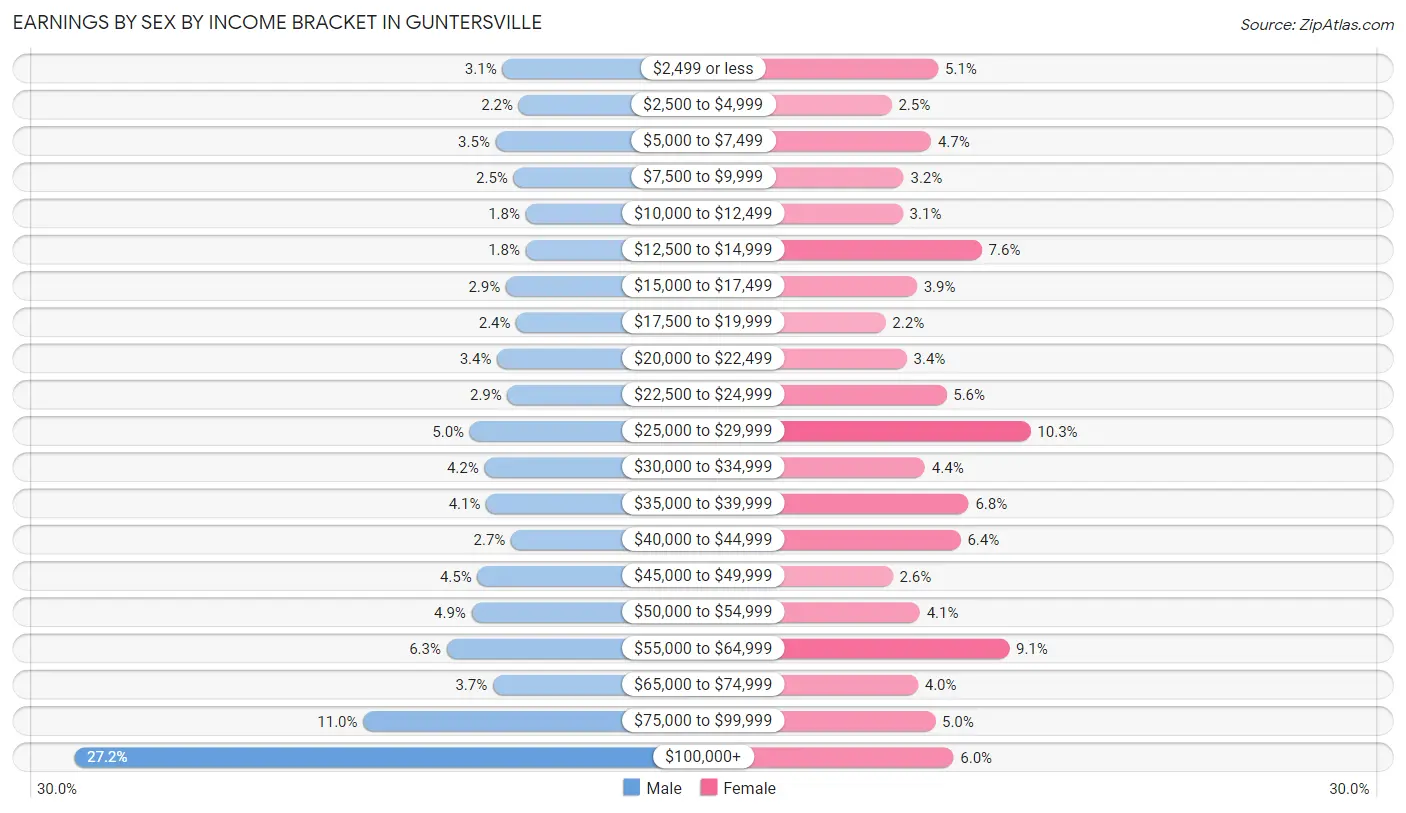
Earnings by Sex by Income Bracket in Guntersville
The most common earnings brackets in Guntersville are $100,000+ for men (564 | 27.2%) and $25,000 to $29,999 for women (181 | 10.3%).
| Income | Male | Female |
| $2,499 or less | 65 (3.1%) | 90 (5.1%) |
| $2,500 to $4,999 | 46 (2.2%) | 44 (2.5%) |
| $5,000 to $7,499 | 73 (3.5%) | 83 (4.7%) |
| $7,500 to $9,999 | 52 (2.5%) | 56 (3.2%) |
| $10,000 to $12,499 | 38 (1.8%) | 55 (3.1%) |
| $12,500 to $14,999 | 38 (1.8%) | 133 (7.6%) |
| $15,000 to $17,499 | 61 (2.9%) | 69 (3.9%) |
| $17,500 to $19,999 | 49 (2.4%) | 38 (2.2%) |
| $20,000 to $22,499 | 71 (3.4%) | 59 (3.4%) |
| $22,500 to $24,999 | 59 (2.9%) | 98 (5.6%) |
| $25,000 to $29,999 | 103 (5.0%) | 181 (10.3%) |
| $30,000 to $34,999 | 86 (4.2%) | 77 (4.4%) |
| $35,000 to $39,999 | 84 (4.1%) | 120 (6.8%) |
| $40,000 to $44,999 | 55 (2.6%) | 112 (6.4%) |
| $45,000 to $49,999 | 94 (4.5%) | 45 (2.6%) |
| $50,000 to $54,999 | 101 (4.9%) | 72 (4.1%) |
| $55,000 to $64,999 | 130 (6.3%) | 160 (9.1%) |
| $65,000 to $74,999 | 76 (3.7%) | 70 (4.0%) |
| $75,000 to $99,999 | 227 (11.0%) | 87 (5.0%) |
| $100,000+ | 564 (27.2%) | 105 (6.0%) |
| Total | 2,072 (100.0%) | 1,754 (100.0%) |
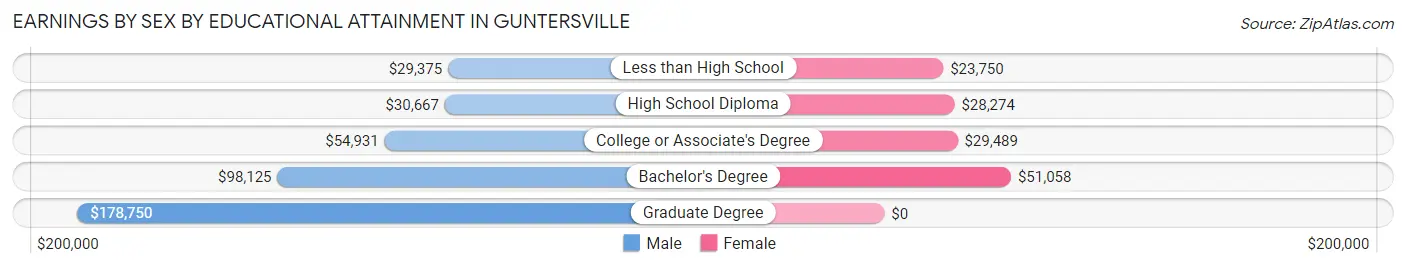
Earnings by Sex by Educational Attainment in Guntersville
Average earnings in Guntersville are $57,750 for men and $32,611 for women, a difference of 43.5%. Men with an educational attainment of graduate degree enjoy the highest average annual earnings of $178,750, while those with less than high school education earn the least with $29,375. Women with an educational attainment of bachelor's degree earn the most with the average annual earnings of $51,058, while those with less than high school education have the smallest earnings of $23,750.
| Educational Attainment | Male Income | Female Income |
| Less than High School | $29,375 | $23,750 |
| High School Diploma | $30,667 | $28,274 |
| College or Associate's Degree | $54,931 | $29,489 |
| Bachelor's Degree | $98,125 | $51,058 |
| Graduate Degree | $178,750 | $0 |
| Total | $57,750 | $32,611 |
Family Income in Guntersville
Family Income Brackets in Guntersville
According to the Guntersville family income data, there are 478 families falling into the $100,000 to $149,999 income range, which is the most common income bracket and makes up 20.9% of all families. Conversely, the $10,000 to $14,999 income bracket is the least frequent group with only 43 families (1.9%) belonging to this category.
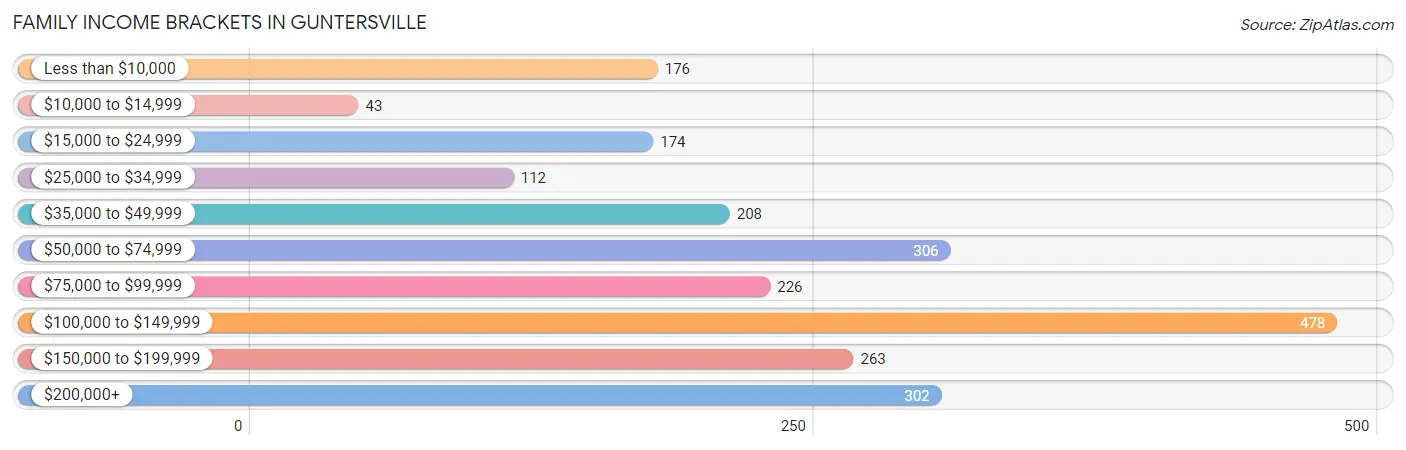
| Income Bracket | # Families | % Families |
| Less than $10,000 | 176 | 7.7% |
| $10,000 to $14,999 | 43 | 1.9% |
| $15,000 to $24,999 | 174 | 7.6% |
| $25,000 to $34,999 | 112 | 4.9% |
| $35,000 to $49,999 | 208 | 9.1% |
| $50,000 to $74,999 | 306 | 13.4% |
| $75,000 to $99,999 | 226 | 9.9% |
| $100,000 to $149,999 | 478 | 20.9% |
| $150,000 to $199,999 | 263 | 11.5% |
| $200,000+ | 302 | 13.2% |
Family Income by Famaliy Size in Guntersville
7+ person families (17 | 0.7%) account for the highest median family income in Guntersville with $250,001 per family, while 2-person families (1,344 | 58.8%) have the highest median income of $42,464 per family member.
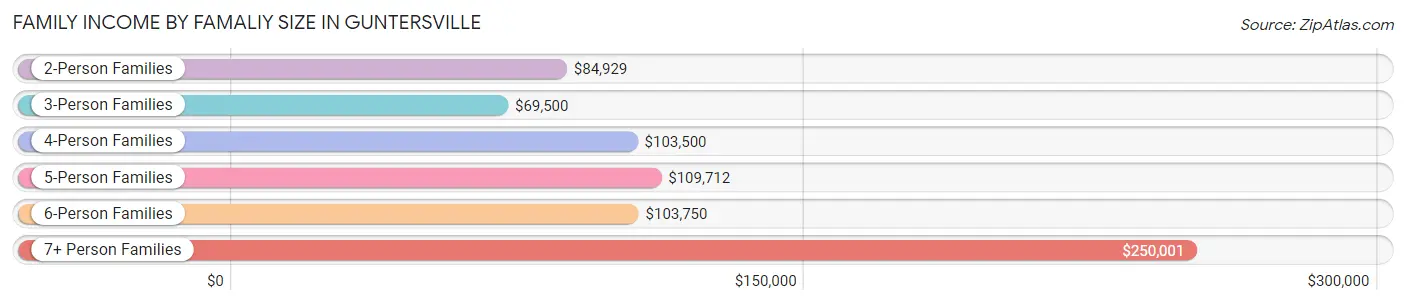
| Income Bracket | # Families | Median Income |
| 2-Person Families | 1,344 (58.8%) | $84,929 |
| 3-Person Families | 392 (17.2%) | $69,500 |
| 4-Person Families | 418 (18.3%) | $103,500 |
| 5-Person Families | 63 (2.8%) | $109,712 |
| 6-Person Families | 52 (2.3%) | $103,750 |
| 7+ Person Families | 17 (0.7%) | $250,001 |
| Total | 2,286 (100.0%) | $86,204 |
Family Income by Number of Earners in Guntersville
The median family income in Guntersville is $86,204, with families comprising 3+ earners (119) having the highest median family income of $139,375, while families with no earners (532) have the lowest median family income of $42,500, accounting for 5.2% and 23.3% of families, respectively.
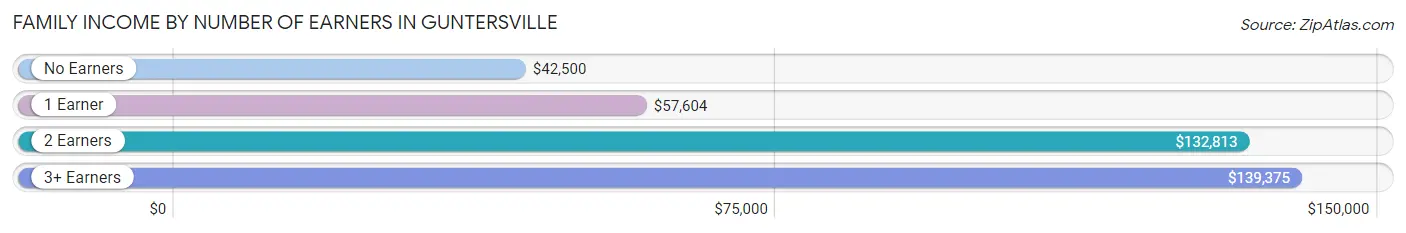
| Number of Earners | # Families | Median Income |
| No Earners | 532 (23.3%) | $42,500 |
| 1 Earner | 815 (35.6%) | $57,604 |
| 2 Earners | 820 (35.9%) | $132,813 |
| 3+ Earners | 119 (5.2%) | $139,375 |
| Total | 2,286 (100.0%) | $86,204 |
Household Income in Guntersville
Household Income Brackets in Guntersville
With 552 households falling in the category, the $100,000 to $149,999 income range is the most frequent in Guntersville, accounting for 16.4% of all households. In contrast, only 209 households (6.2%) fall into the $10,000 to $14,999 income bracket, making it the least populous group.
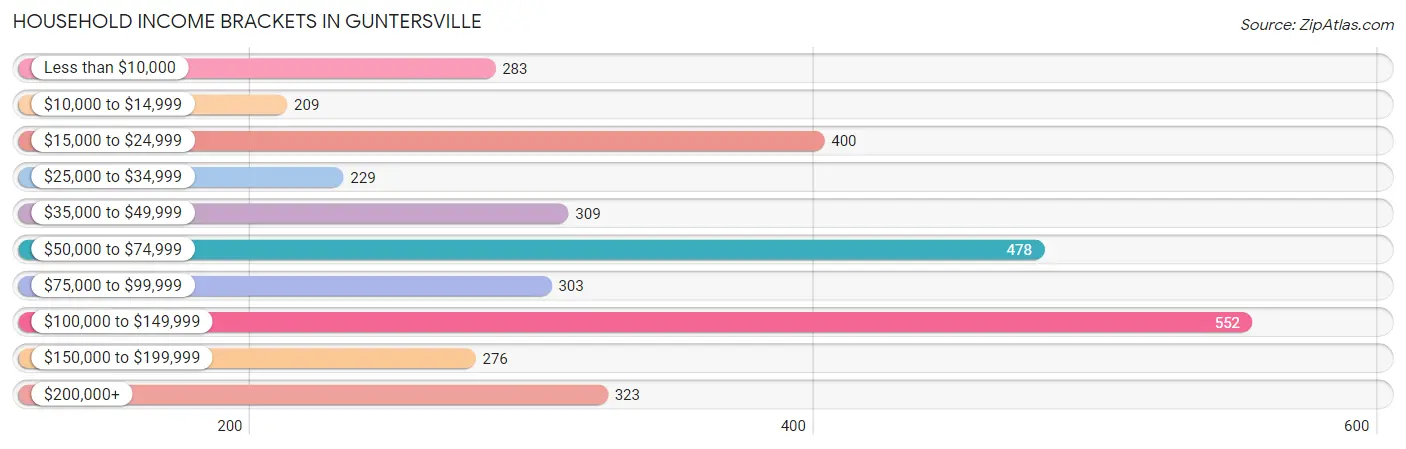
| Income Bracket | # Households | % Households |
| Less than $10,000 | 283 | 8.4% |
| $10,000 to $14,999 | 209 | 6.2% |
| $15,000 to $24,999 | 400 | 11.9% |
| $25,000 to $34,999 | 229 | 6.8% |
| $35,000 to $49,999 | 309 | 9.2% |
| $50,000 to $74,999 | 478 | 14.2% |
| $75,000 to $99,999 | 303 | 9.0% |
| $100,000 to $149,999 | 552 | 16.4% |
| $150,000 to $199,999 | 276 | 8.2% |
| $200,000+ | 323 | 9.6% |
Household Income by Householder Age in Guntersville
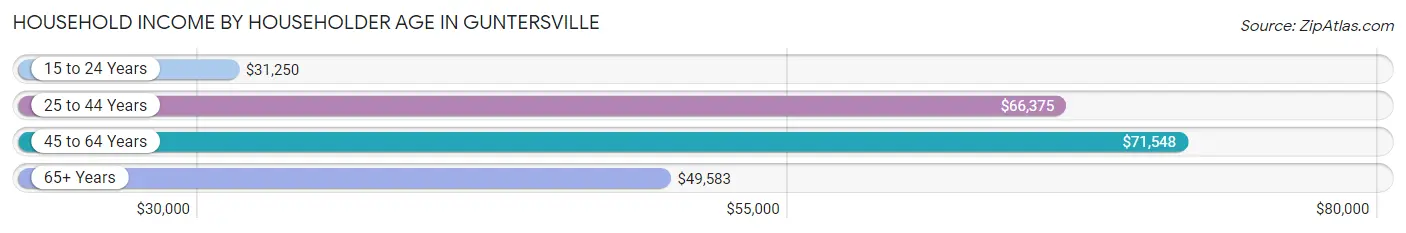
The median household income in Guntersville is $61,453, with the highest median household income of $71,548 found in the 45 to 64 years age bracket for the primary householder. A total of 1,254 households (37.3%) fall into this category. Meanwhile, the 15 to 24 years age bracket for the primary householder has the lowest median household income of $31,250, with 67 households (2.0%) in this group.
| Income Bracket | # Households | Median Income |
| 15 to 24 Years | 67 (2.0%) | $31,250 |
| 25 to 44 Years | 980 (29.1%) | $66,375 |
| 45 to 64 Years | 1,254 (37.3%) | $71,548 |
| 65+ Years | 1,063 (31.6%) | $49,583 |
| Total | 3,364 (100.0%) | $61,453 |
Poverty in Guntersville
Income Below Poverty by Sex and Age in Guntersville
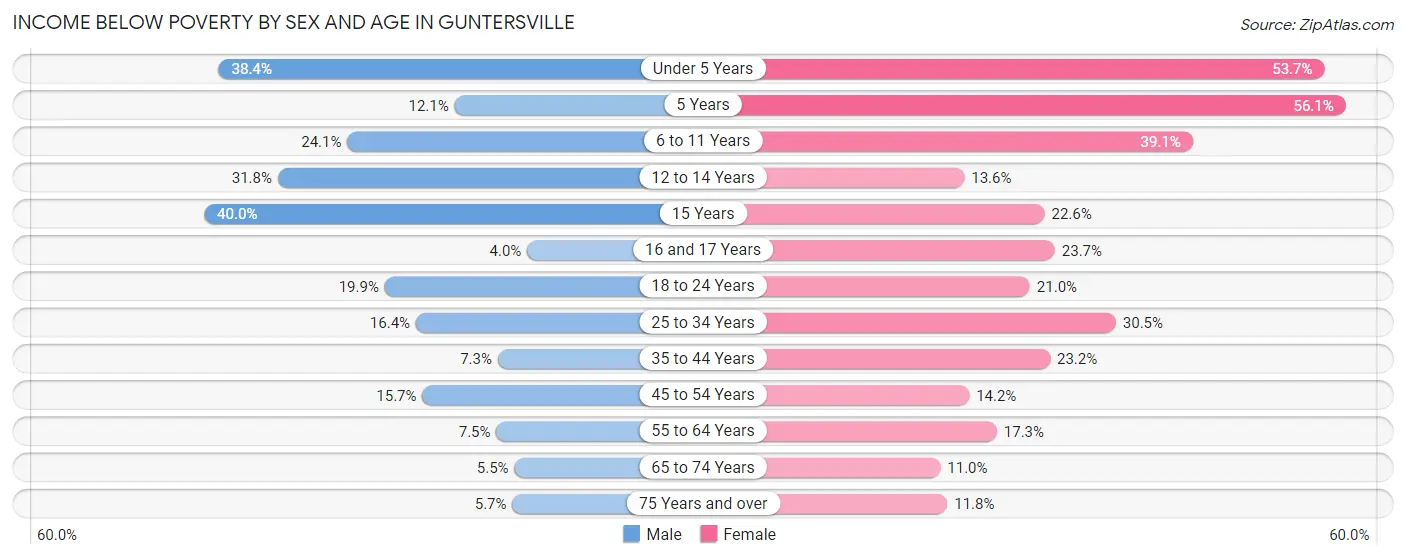
With 15.3% poverty level for males and 22.6% for females among the residents of Guntersville, 15 year old males and 5 year old females are the most vulnerable to poverty, with 16 males (40.0%) and 23 females (56.1%) in their respective age groups living below the poverty level.
| Age Bracket | Male | Female |
| Under 5 Years | 129 (38.4%) | 137 (53.7%) |
| 5 Years | 4 (12.1%) | 23 (56.1%) |
| 6 to 11 Years | 64 (24.1%) | 109 (39.1%) |
| 12 to 14 Years | 76 (31.8%) | 15 (13.6%) |
| 15 Years | 16 (40.0%) | 7 (22.6%) |
| 16 and 17 Years | 6 (4.0%) | 14 (23.7%) |
| 18 to 24 Years | 71 (19.9%) | 44 (20.9%) |
| 25 to 34 Years | 88 (16.4%) | 188 (30.5%) |
| 35 to 44 Years | 29 (7.3%) | 93 (23.2%) |
| 45 to 54 Years | 73 (15.7%) | 65 (14.2%) |
| 55 to 64 Years | 49 (7.5%) | 110 (17.3%) |
| 65 to 74 Years | 26 (5.4%) | 55 (11.0%) |
| 75 Years and over | 15 (5.7%) | 49 (11.7%) |
| Total | 646 (15.3%) | 909 (22.6%) |
Income Above Poverty by Sex and Age in Guntersville
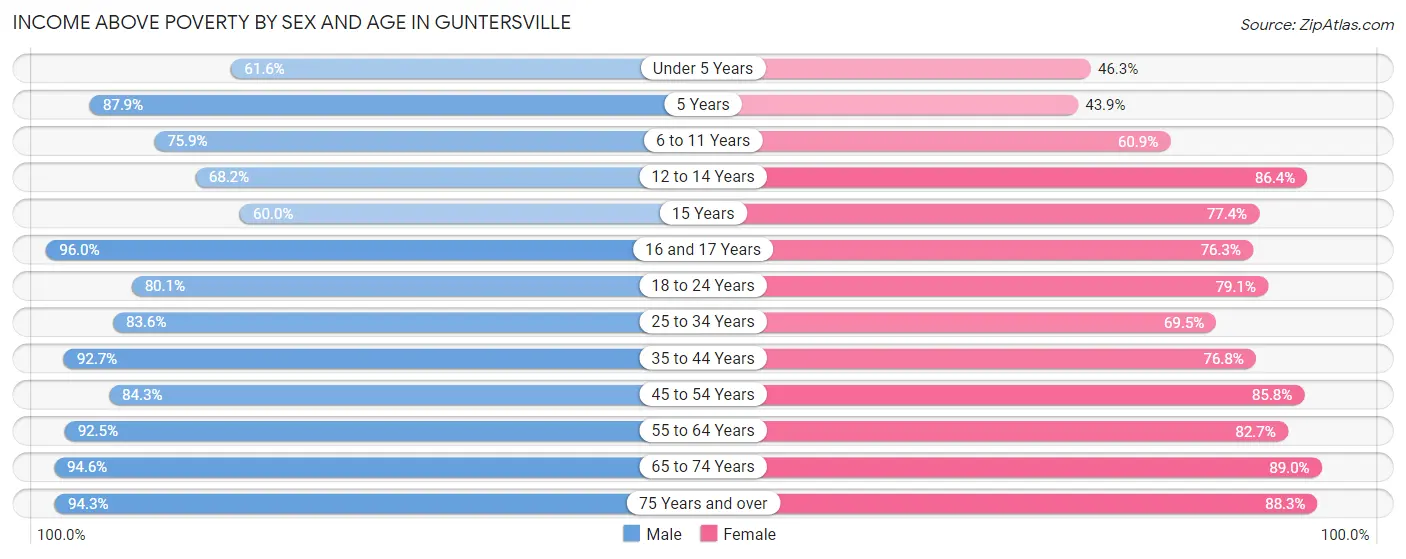
According to the poverty statistics in Guntersville, males aged 16 and 17 years and females aged 65 to 74 years are the age groups that are most secure financially, with 96.0% of males and 89.0% of females in these age groups living above the poverty line.
| Age Bracket | Male | Female |
| Under 5 Years | 207 (61.6%) | 118 (46.3%) |
| 5 Years | 29 (87.9%) | 18 (43.9%) |
| 6 to 11 Years | 202 (75.9%) | 170 (60.9%) |
| 12 to 14 Years | 163 (68.2%) | 95 (86.4%) |
| 15 Years | 24 (60.0%) | 24 (77.4%) |
| 16 and 17 Years | 143 (96.0%) | 45 (76.3%) |
| 18 to 24 Years | 286 (80.1%) | 166 (79.0%) |
| 25 to 34 Years | 448 (83.6%) | 428 (69.5%) |
| 35 to 44 Years | 368 (92.7%) | 308 (76.8%) |
| 45 to 54 Years | 392 (84.3%) | 393 (85.8%) |
| 55 to 64 Years | 608 (92.5%) | 527 (82.7%) |
| 65 to 74 Years | 451 (94.6%) | 446 (89.0%) |
| 75 Years and over | 249 (94.3%) | 368 (88.2%) |
| Total | 3,570 (84.7%) | 3,106 (77.4%) |
Income Below Poverty Among Married-Couple Families in Guntersville
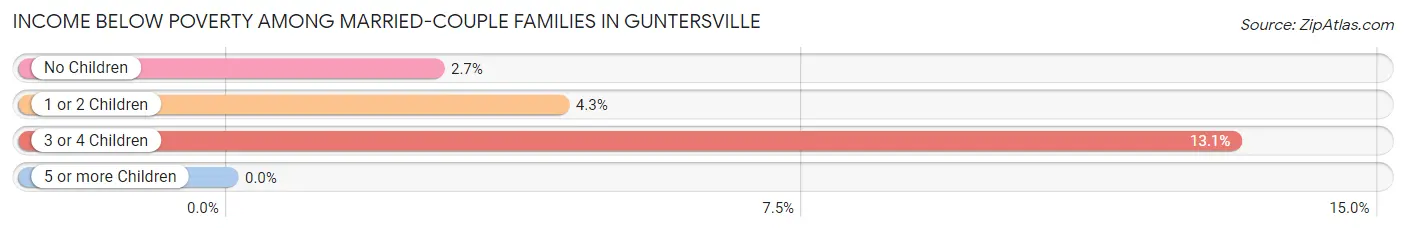
The poverty statistics for married-couple families in Guntersville show that 3.6% or 56 of the total 1,553 families live below the poverty line. Families with 3 or 4 children have the highest poverty rate of 13.1%, comprising of 8 families. On the other hand, families with 5 or more children have the lowest poverty rate of 0.0%, which includes 0 families.
| Children | Above Poverty | Below Poverty |
| No Children | 976 (97.3%) | 27 (2.7%) |
| 1 or 2 Children | 465 (95.7%) | 21 (4.3%) |
| 3 or 4 Children | 53 (86.9%) | 8 (13.1%) |
| 5 or more Children | 3 (100.0%) | 0 (0.0%) |
| Total | 1,497 (96.4%) | 56 (3.6%) |
Income Below Poverty Among Single-Parent Households in Guntersville
According to the poverty data in Guntersville, 12.7% or 28 single-father households and 43.4% or 222 single-mother households are living below the poverty line. Among single-father households, those with 3 or 4 children have the highest poverty rate, with 12 households (85.7%) experiencing poverty. Likewise, among single-mother households, those with 3 or 4 children have the highest poverty rate, with 78 households (98.7%) falling below the poverty line.
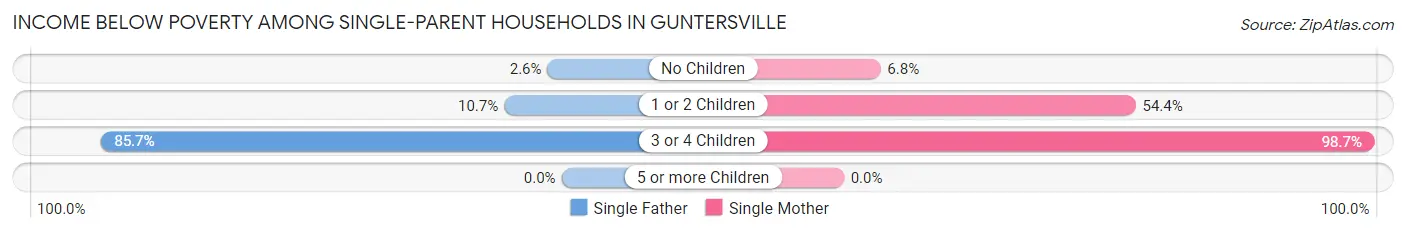
| Children | Single Father | Single Mother |
| No Children | 2 (2.6%) | 13 (6.8%) |
| 1 or 2 Children | 14 (10.7%) | 131 (54.4%) |
| 3 or 4 Children | 12 (85.7%) | 78 (98.7%) |
| 5 or more Children | 0 (0.0%) | 0 (0.0%) |
| Total | 28 (12.7%) | 222 (43.4%) |
Income Below Poverty Among Married-Couple vs Single-Parent Households in Guntersville
The poverty data for Guntersville shows that 56 of the married-couple family households (3.6%) and 250 of the single-parent households (34.1%) are living below the poverty level. Within the married-couple family households, those with 3 or 4 children have the highest poverty rate, with 8 households (13.1%) falling below the poverty line. Among the single-parent households, those with 3 or 4 children have the highest poverty rate, with 90 household (96.8%) living below poverty.
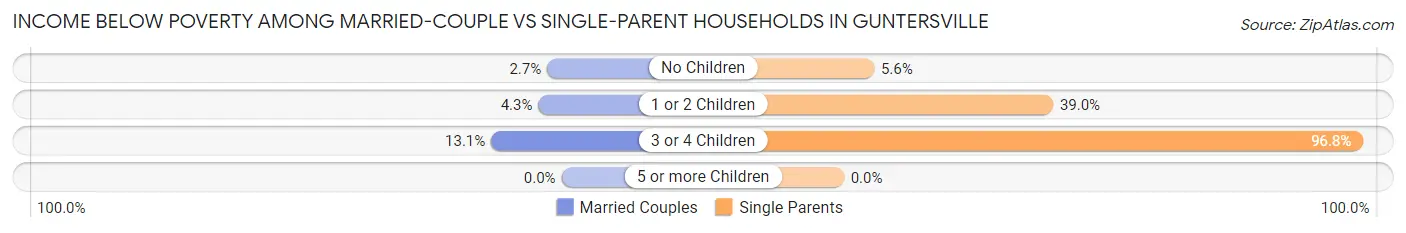
| Children | Married-Couple Families | Single-Parent Households |
| No Children | 27 (2.7%) | 15 (5.6%) |
| 1 or 2 Children | 21 (4.3%) | 145 (39.0%) |
| 3 or 4 Children | 8 (13.1%) | 90 (96.8%) |
| 5 or more Children | 0 (0.0%) | 0 (0.0%) |
| Total | 56 (3.6%) | 250 (34.1%) |
Race in Guntersville
The most populous races in Guntersville are White / Caucasian (7,187 | 83.1%), Black / African American (793 | 9.2%), and Two or more Races (502 | 5.8%).
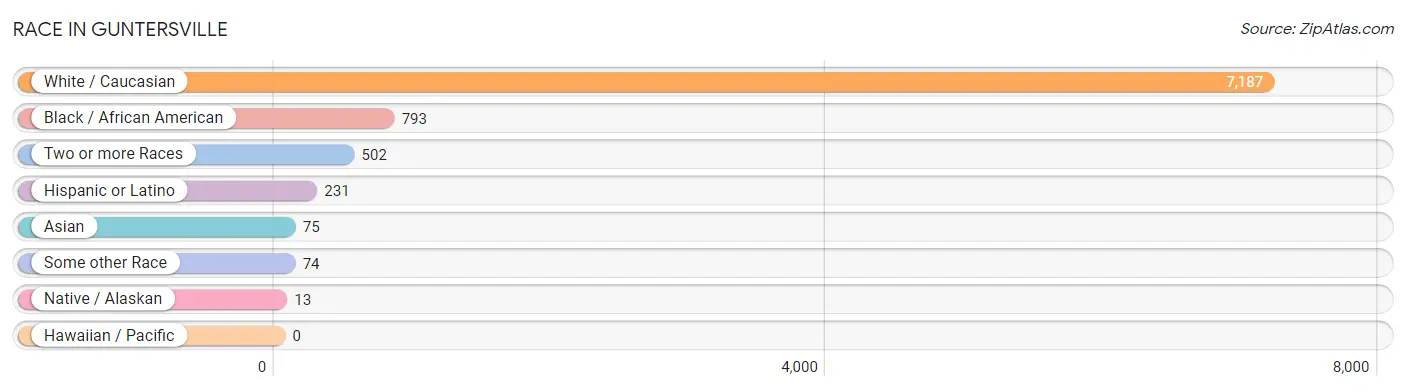
| Race | # Population | % Population |
| Asian | 75 | 0.9% |
| Black / African American | 793 | 9.2% |
| Hawaiian / Pacific | 0 | 0.0% |
| Hispanic or Latino | 231 | 2.7% |
| Native / Alaskan | 13 | 0.2% |
| White / Caucasian | 7,187 | 83.1% |
| Two or more Races | 502 | 5.8% |
| Some other Race | 74 | 0.9% |
| Total | 8,644 | 100.0% |
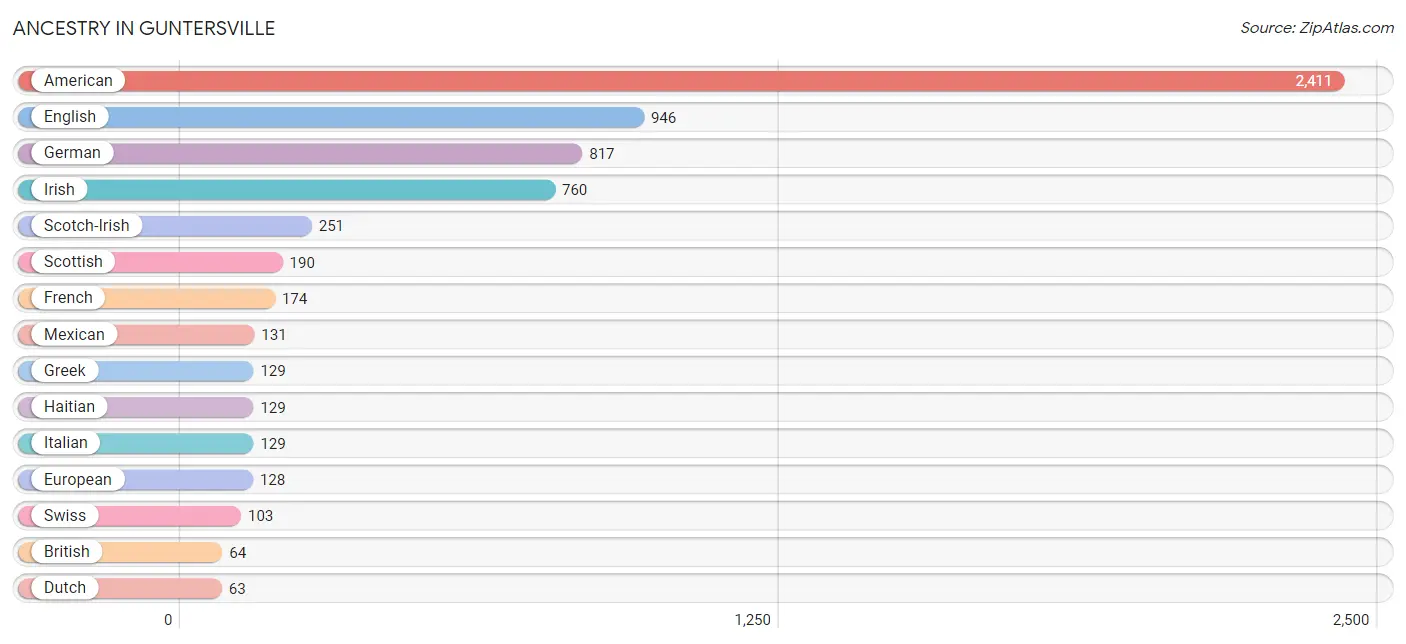
Ancestry in Guntersville
The most populous ancestries reported in Guntersville are American (2,411 | 27.9%), English (946 | 10.9%), German (817 | 9.5%), Irish (760 | 8.8%), and Scotch-Irish (251 | 2.9%), together accounting for 60.0% of all Guntersville residents.
| Ancestry | # Population | % Population |
| African | 5 | 0.1% |
| American | 2,411 | 27.9% |
| Arab | 6 | 0.1% |
| Austrian | 4 | 0.1% |
| Bhutanese | 11 | 0.1% |
| Blackfeet | 11 | 0.1% |
| British | 64 | 0.7% |
| Bulgarian | 1 | 0.0% |
| Canadian | 6 | 0.1% |
| Central American | 21 | 0.2% |
| Cherokee | 58 | 0.7% |
| Chippewa | 5 | 0.1% |
| Choctaw | 2 | 0.0% |
| Creek | 4 | 0.1% |
| Cuban | 15 | 0.2% |
| Czech | 19 | 0.2% |
| Danish | 4 | 0.1% |
| Dutch | 63 | 0.7% |
| Eastern European | 3 | 0.0% |
| English | 946 | 10.9% |
| Ethiopian | 26 | 0.3% |
| European | 128 | 1.5% |
| Finnish | 4 | 0.1% |
| French | 174 | 2.0% |
| French Canadian | 22 | 0.3% |
| German | 817 | 9.5% |
| Greek | 129 | 1.5% |
| Haitian | 129 | 1.5% |
| Honduran | 19 | 0.2% |
| Indian (Asian) | 8 | 0.1% |
| Irish | 760 | 8.8% |
| Italian | 129 | 1.5% |
| Jamaican | 1 | 0.0% |
| Korean | 27 | 0.3% |
| Lebanese | 2 | 0.0% |
| Lithuanian | 2 | 0.0% |
| Mexican | 131 | 1.5% |
| Native Hawaiian | 1 | 0.0% |
| Nicaraguan | 2 | 0.0% |
| Nigerian | 2 | 0.0% |
| Northern European | 4 | 0.1% |
| Norwegian | 36 | 0.4% |
| Polish | 31 | 0.4% |
| Portuguese | 1 | 0.0% |
| Puerto Rican | 2 | 0.0% |
| Russian | 7 | 0.1% |
| Scandinavian | 24 | 0.3% |
| Scotch-Irish | 251 | 2.9% |
| Scottish | 190 | 2.2% |
| Seminole | 1 | 0.0% |
| Serbian | 2 | 0.0% |
| Slavic | 4 | 0.1% |
| Slovak | 1 | 0.0% |
| Slovene | 3 | 0.0% |
| South American Indian | 1 | 0.0% |
| Spaniard | 7 | 0.1% |
| Spanish | 10 | 0.1% |
| Spanish American | 1 | 0.0% |
| Subsaharan African | 34 | 0.4% |
| Swedish | 46 | 0.5% |
| Swiss | 103 | 1.2% |
| Syrian | 4 | 0.1% |
| Thai | 45 | 0.5% |
| Ukrainian | 7 | 0.1% |
| Welsh | 42 | 0.5% | View All 65 Rows |
Immigrants in Guntersville
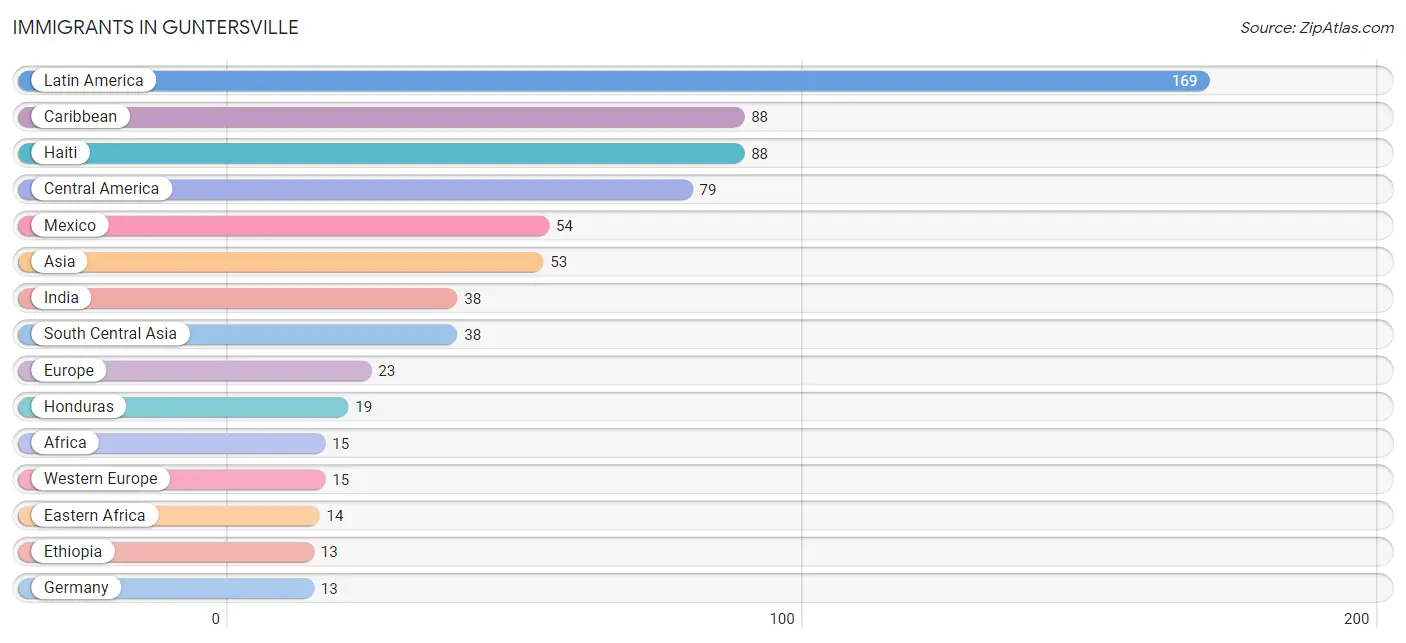
The most numerous immigrant groups reported in Guntersville came from Latin America (169 | 2.0%), Caribbean (88 | 1.0%), Haiti (88 | 1.0%), Central America (79 | 0.9%), and Mexico (54 | 0.6%), together accounting for 5.5% of all Guntersville residents.
| Immigration Origin | # Population | % Population |
| Africa | 15 | 0.2% |
| Argentina | 2 | 0.0% |
| Asia | 53 | 0.6% |
| Bulgaria | 1 | 0.0% |
| Canada | 7 | 0.1% |
| Caribbean | 88 | 1.0% |
| Central America | 79 | 0.9% |
| China | 2 | 0.0% |
| Eastern Africa | 14 | 0.2% |
| Eastern Asia | 2 | 0.0% |
| Eastern Europe | 1 | 0.0% |
| England | 1 | 0.0% |
| Ethiopia | 13 | 0.2% |
| Europe | 23 | 0.3% |
| France | 2 | 0.0% |
| Germany | 13 | 0.2% |
| Greece | 1 | 0.0% |
| Guatemala | 4 | 0.1% |
| Haiti | 88 | 1.0% |
| Honduras | 19 | 0.2% |
| India | 38 | 0.4% |
| Latin America | 169 | 2.0% |
| Mexico | 54 | 0.6% |
| Nicaragua | 2 | 0.0% |
| Northern Europe | 6 | 0.1% |
| Philippines | 13 | 0.2% |
| Scotland | 2 | 0.0% |
| South America | 2 | 0.0% |
| South Central Asia | 38 | 0.4% |
| South Eastern Asia | 13 | 0.2% |
| Southern Europe | 1 | 0.0% |
| Western Europe | 15 | 0.2% | View All 32 Rows |
Sex and Age in Guntersville
Sex and Age in Guntersville
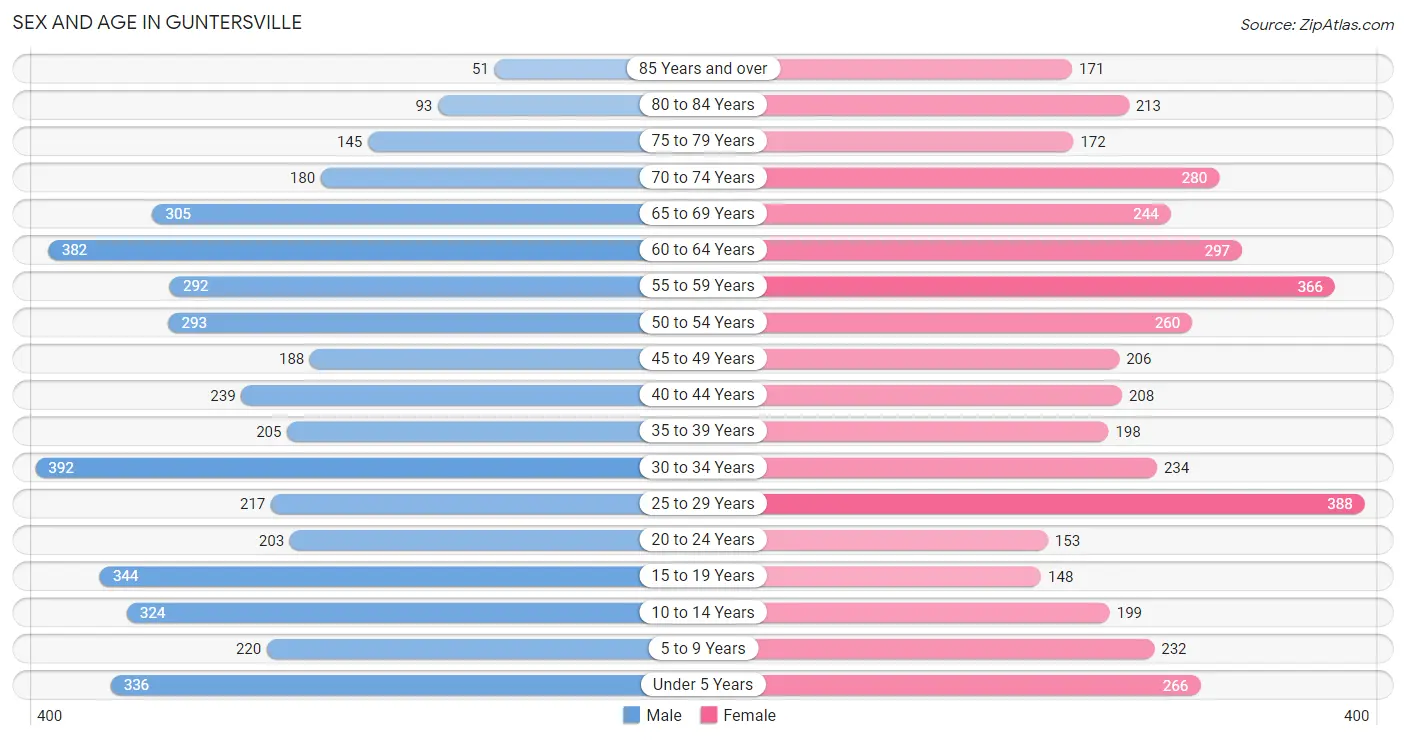
The most populous age groups in Guntersville are 30 to 34 Years (392 | 8.9%) for men and 25 to 29 Years (388 | 9.2%) for women.
| Age Bracket | Male | Female |
| Under 5 Years | 336 (7.6%) | 266 (6.3%) |
| 5 to 9 Years | 220 (5.0%) | 232 (5.5%) |
| 10 to 14 Years | 324 (7.3%) | 199 (4.7%) |
| 15 to 19 Years | 344 (7.8%) | 148 (3.5%) |
| 20 to 24 Years | 203 (4.6%) | 153 (3.6%) |
| 25 to 29 Years | 217 (4.9%) | 388 (9.2%) |
| 30 to 34 Years | 392 (8.9%) | 234 (5.5%) |
| 35 to 39 Years | 205 (4.6%) | 198 (4.7%) |
| 40 to 44 Years | 239 (5.4%) | 208 (4.9%) |
| 45 to 49 Years | 188 (4.3%) | 206 (4.9%) |
| 50 to 54 Years | 293 (6.7%) | 260 (6.1%) |
| 55 to 59 Years | 292 (6.6%) | 366 (8.6%) |
| 60 to 64 Years | 382 (8.7%) | 297 (7.0%) |
| 65 to 69 Years | 305 (6.9%) | 244 (5.8%) |
| 70 to 74 Years | 180 (4.1%) | 280 (6.6%) |
| 75 to 79 Years | 145 (3.3%) | 172 (4.1%) |
| 80 to 84 Years | 93 (2.1%) | 213 (5.0%) |
| 85 Years and over | 51 (1.2%) | 171 (4.0%) |
| Total | 4,409 (100.0%) | 4,235 (100.0%) |
Families and Households in Guntersville
Median Family Size in Guntersville
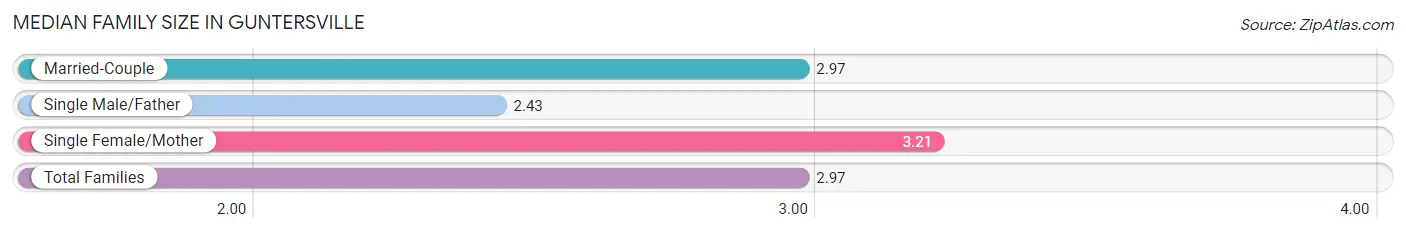
The median family size in Guntersville is 2.97 persons per family, with single female/mother families (512 | 22.4%) accounting for the largest median family size of 3.21 persons per family. On the other hand, single male/father families (221 | 9.7%) represent the smallest median family size with 2.43 persons per family.
| Family Type | # Families | Family Size |
| Married-Couple | 1,553 (67.9%) | 2.97 |
| Single Male/Father | 221 (9.7%) | 2.43 |
| Single Female/Mother | 512 (22.4%) | 3.21 |
| Total Families | 2,286 (100.0%) | 2.97 |
Median Household Size in Guntersville
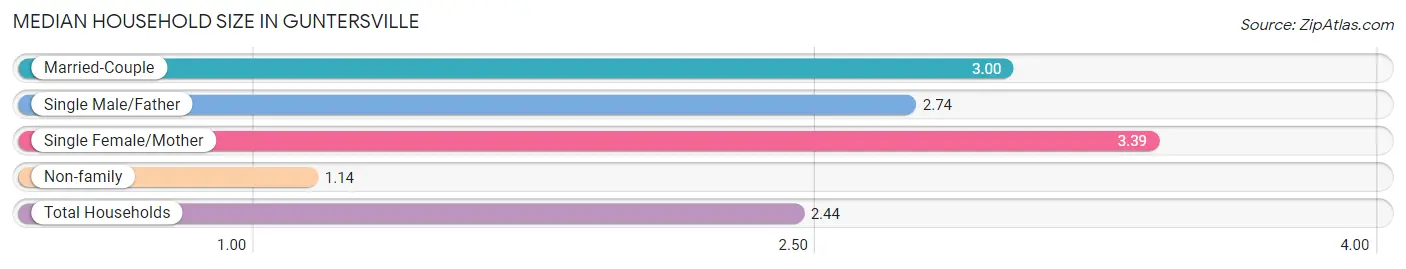
The median household size in Guntersville is 2.44 persons per household, with single female/mother households (512 | 15.2%) accounting for the largest median household size of 3.39 persons per household. non-family households (1,078 | 32.1%) represent the smallest median household size with 1.14 persons per household.
| Household Type | # Households | Household Size |
| Married-Couple | 1,553 (46.2%) | 3.00 |
| Single Male/Father | 221 (6.6%) | 2.74 |
| Single Female/Mother | 512 (15.2%) | 3.39 |
| Non-family | 1,078 (32.1%) | 1.14 |
| Total Households | 3,364 (100.0%) | 2.44 |
Household Size by Marriage Status in Guntersville
Out of a total of 3,364 households in Guntersville, 2,286 (67.9%) are family households, while 1,078 (32.1%) are nonfamily households. The most numerous type of family households are 2-person households, comprising 1,250, and the most common type of nonfamily households are 1-person households, comprising 985.
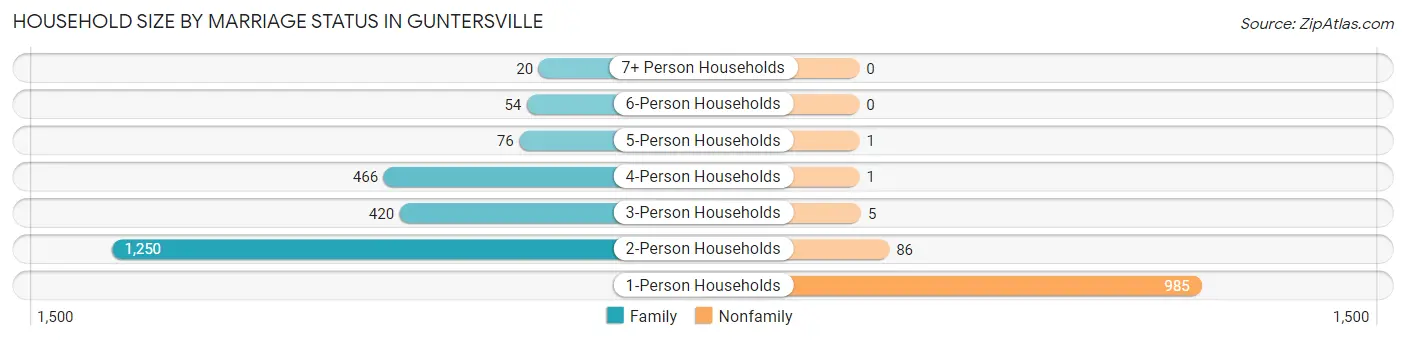
| Household Size | Family Households | Nonfamily Households |
| 1-Person Households | - | 985 (29.3%) |
| 2-Person Households | 1,250 (37.2%) | 86 (2.6%) |
| 3-Person Households | 420 (12.5%) | 5 (0.2%) |
| 4-Person Households | 466 (13.9%) | 1 (0.0%) |
| 5-Person Households | 76 (2.3%) | 1 (0.0%) |
| 6-Person Households | 54 (1.6%) | 0 (0.0%) |
| 7+ Person Households | 20 (0.6%) | 0 (0.0%) |
| Total | 2,286 (67.9%) | 1,078 (32.1%) |
Female Fertility in Guntersville
Fertility by Age in Guntersville
Average fertility rate in Guntersville is 101.0 births per 1,000 women. Women in the age bracket of 20 to 34 years have the highest fertility rate with 185.0 births per 1,000 women. Women in the age bracket of 20 to 34 years acount for 89.9% of all women with births.
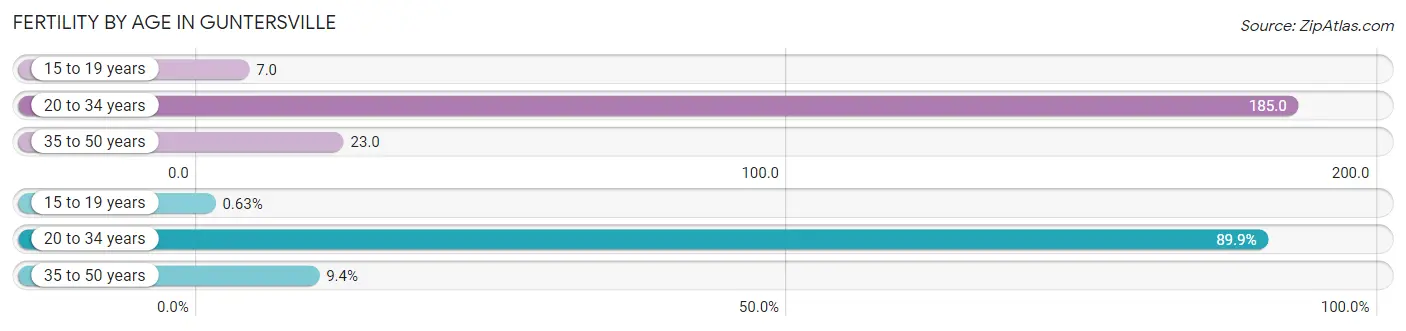
| Age Bracket | Women with Births | Births / 1,000 Women |
| 15 to 19 years | 1 (0.6%) | 7.0 |
| 20 to 34 years | 143 (89.9%) | 185.0 |
| 35 to 50 years | 15 (9.4%) | 23.0 |
| Total | 159 (100.0%) | 101.0 |
Fertility by Age by Marriage Status in Guntersville
56.6% of women with births (159) in Guntersville are married. The highest percentage of unmarried women with births falls into 15 to 19 years age bracket with 100.0% of them unmarried at the time of birth, while the lowest percentage of unmarried women with births belong to 35 to 50 years age bracket with 6.7% of them unmarried.
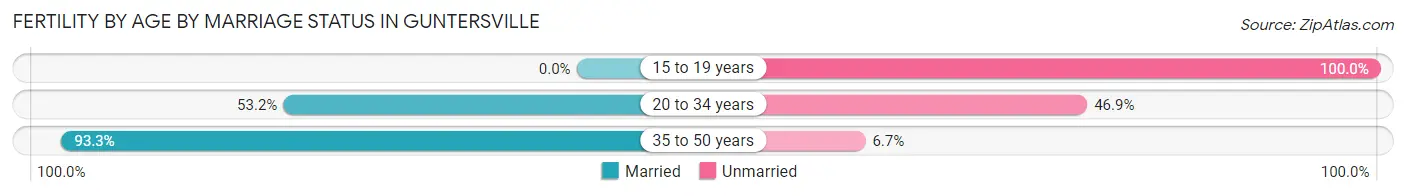
| Age Bracket | Married | Unmarried |
| 15 to 19 years | 0 (0.0%) | 1 (100.0%) |
| 20 to 34 years | 76 (53.1%) | 67 (46.9%) |
| 35 to 50 years | 14 (93.3%) | 1 (6.7%) |
| Total | 90 (56.6%) | 69 (43.4%) |
Fertility by Education in Guntersville
Average fertility rate in Guntersville is 101.0 births per 1,000 women. Women with the education attainment of bachelor's degree have the highest fertility rate of 213.0 births per 1,000 women, while women with the education attainment of graduate degree have the lowest fertility at 17.0 births per 1,000 women. Women with the education attainment of bachelor's degree represent 40.3% of all women with births.
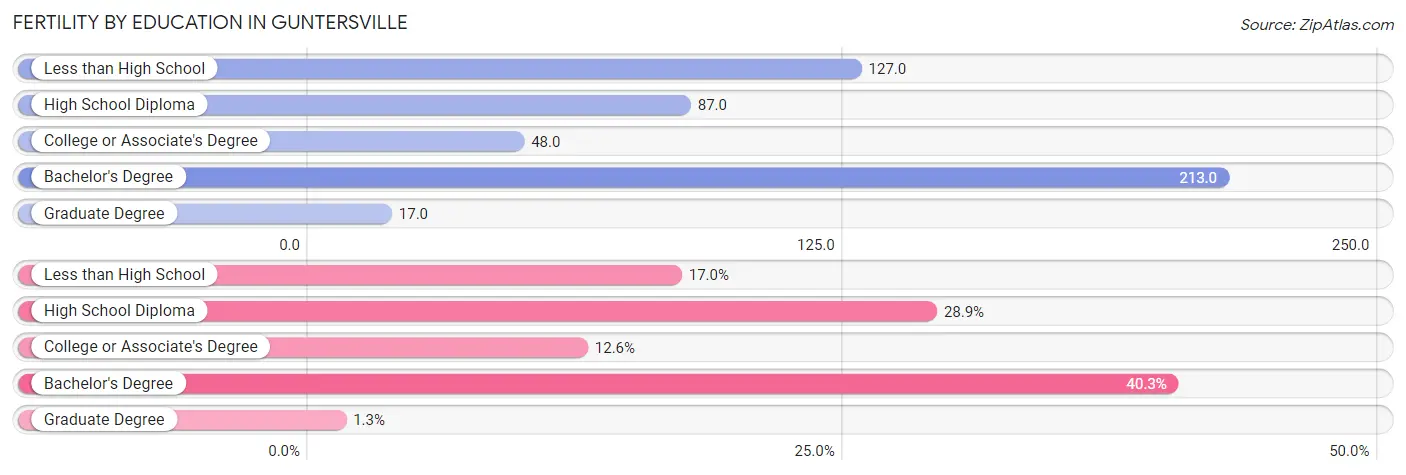
| Educational Attainment | Women with Births | Births / 1,000 Women |
| Less than High School | 27 (17.0%) | 127.0 |
| High School Diploma | 46 (28.9%) | 87.0 |
| College or Associate's Degree | 20 (12.6%) | 48.0 |
| Bachelor's Degree | 64 (40.3%) | 213.0 |
| Graduate Degree | 2 (1.3%) | 17.0 |
| Total | 159 (100.0%) | 101.0 |
Fertility by Education by Marriage Status in Guntersville
43.4% of women with births in Guntersville are unmarried. Women with the educational attainment of graduate degree are most likely to be married with 100.0% of them married at childbirth, while women with the educational attainment of less than high school are least likely to be married with 96.3% of them unmarried at childbirth.
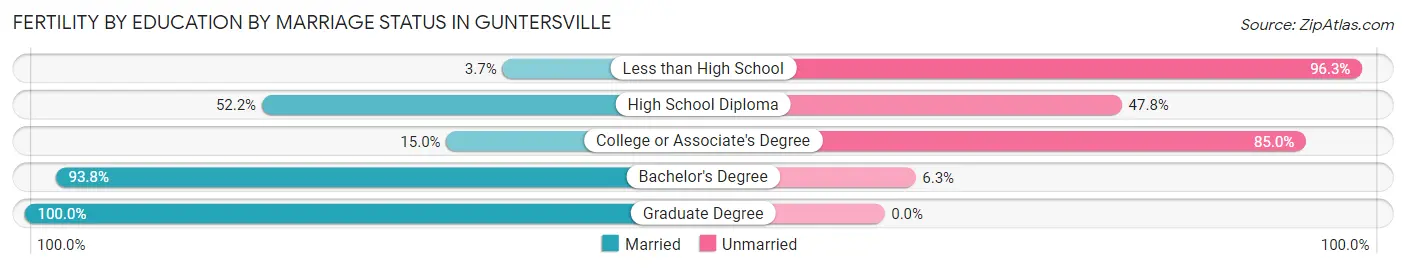
| Educational Attainment | Married | Unmarried |
| Less than High School | 1 (3.7%) | 26 (96.3%) |
| High School Diploma | 24 (52.2%) | 22 (47.8%) |
| College or Associate's Degree | 3 (15.0%) | 17 (85.0%) |
| Bachelor's Degree | 60 (93.8%) | 4 (6.2%) |
| Graduate Degree | 2 (100.0%) | 0 (0.0%) |
| Total | 90 (56.6%) | 69 (43.4%) |
Employment Characteristics in Guntersville
Employment by Class of Employer in Guntersville
Among the 3,238 employed individuals in Guntersville, private company employees (2,312 | 71.4%), self-employed (not incorporated) (234 | 7.2%), and self-employed (incorporated) (195 | 6.0%) make up the most common classes of employment.
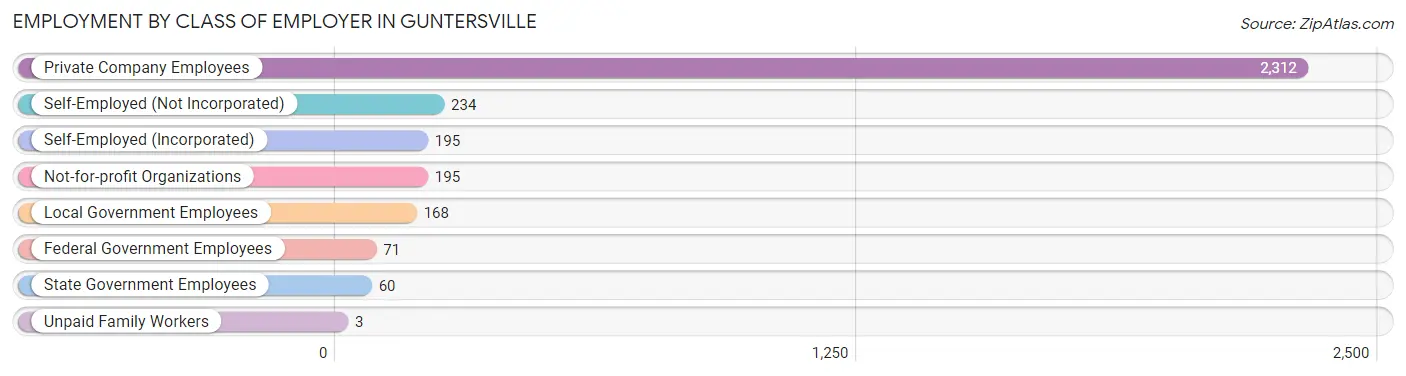
| Employer Class | # Employees | % Employees |
| Private Company Employees | 2,312 | 71.4% |
| Self-Employed (Incorporated) | 195 | 6.0% |
| Self-Employed (Not Incorporated) | 234 | 7.2% |
| Not-for-profit Organizations | 195 | 6.0% |
| Local Government Employees | 168 | 5.2% |
| State Government Employees | 60 | 1.8% |
| Federal Government Employees | 71 | 2.2% |
| Unpaid Family Workers | 3 | 0.1% |
| Total | 3,238 | 100.0% |
Employment Status by Age in Guntersville
According to the labor force statistics for Guntersville, out of the total population over 16 years of age (6,996), 48.4% or 3,386 individuals are in the labor force, with 3.7% or 125 of them unemployed. The age group with the highest labor force participation rate is 25 to 29 years, with 76.7% or 464 individuals in the labor force. Within the labor force, the 30 to 34 years age range has the highest percentage of unemployed individuals, with 7.6% or 33 of them being unemployed.
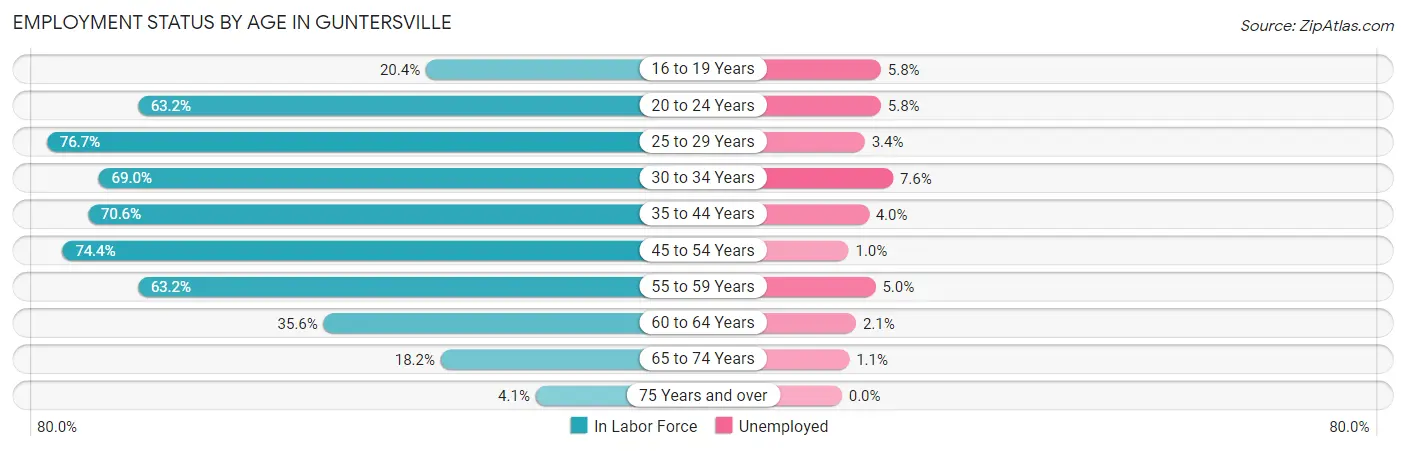
| Age Bracket | In Labor Force | Unemployed |
| 16 to 19 Years | 86 (20.4%) | 5 (5.8%) |
| 20 to 24 Years | 225 (63.2%) | 13 (5.8%) |
| 25 to 29 Years | 464 (76.7%) | 16 (3.4%) |
| 30 to 34 Years | 432 (69.0%) | 33 (7.6%) |
| 35 to 44 Years | 600 (70.6%) | 24 (4.0%) |
| 45 to 54 Years | 705 (74.4%) | 7 (1.0%) |
| 55 to 59 Years | 416 (63.2%) | 21 (5.0%) |
| 60 to 64 Years | 242 (35.6%) | 5 (2.1%) |
| 65 to 74 Years | 184 (18.2%) | 2 (1.1%) |
| 75 Years and over | 35 (4.1%) | 0 (0.0%) |
| Total | 3,386 (48.4%) | 125 (3.7%) |
Employment Status by Educational Attainment in Guntersville
According to labor force statistics for Guntersville, 65.5% of individuals (2,859) out of the total population between 25 and 64 years of age (4,365) are in the labor force, with 3.7% or 106 of them being unemployed. The group with the highest labor force participation rate are those with the educational attainment of bachelor's degree or higher, with 85.6% or 1,285 individuals in the labor force. Within the labor force, individuals with college / associate degree education have the highest percentage of unemployment, with 6.7% or 56 of them being unemployed.
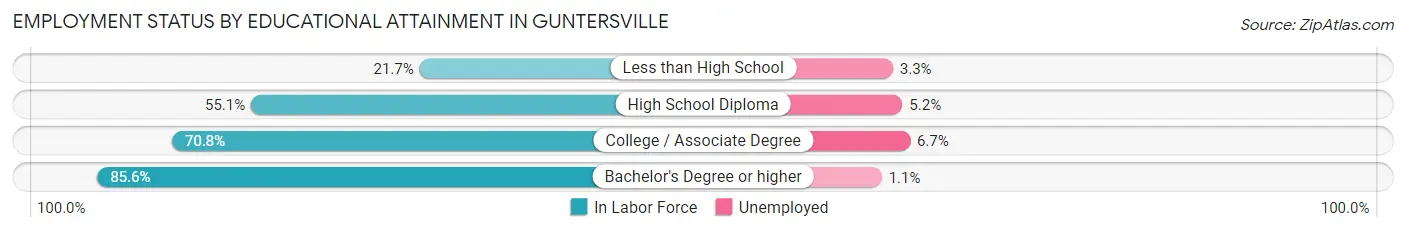
| Educational Attainment | In Labor Force | Unemployed |
| Less than High School | 123 (21.7%) | 19 (3.3%) |
| High School Diploma | 612 (55.1%) | 58 (5.2%) |
| College / Associate Degree | 839 (70.8%) | 79 (6.7%) |
| Bachelor's Degree or higher | 1,285 (85.6%) | 17 (1.1%) |
| Total | 2,859 (65.5%) | 162 (3.7%) |
Employment Occupations by Sex in Guntersville
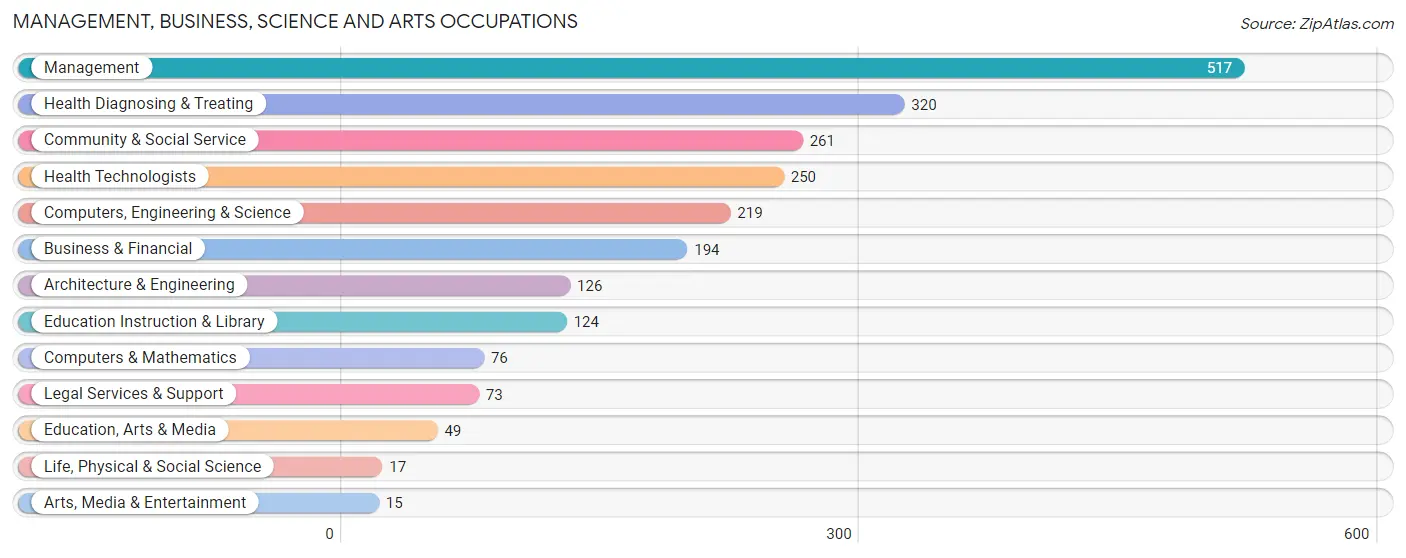
Management, Business, Science and Arts Occupations
The most common Management, Business, Science and Arts occupations in Guntersville are Management (517 | 15.9%), Health Diagnosing & Treating (320 | 9.8%), Community & Social Service (261 | 8.0%), Health Technologists (250 | 7.7%), and Computers, Engineering & Science (219 | 6.7%).
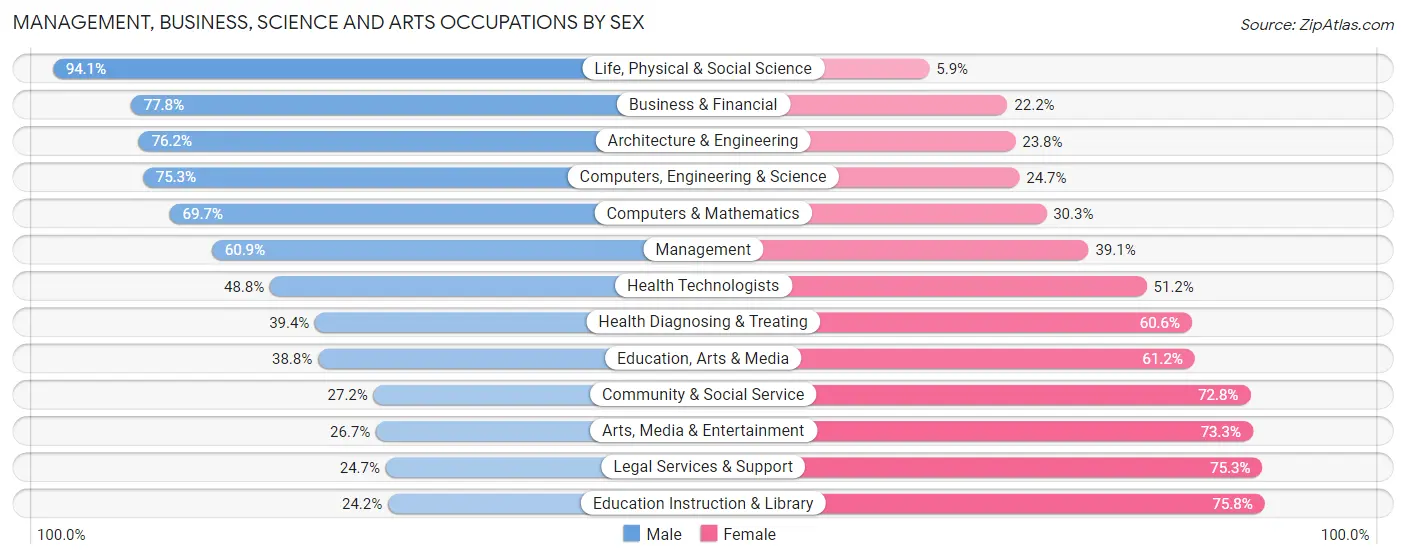
Management, Business, Science and Arts Occupations by Sex
Within the Management, Business, Science and Arts occupations in Guntersville, the most male-oriented occupations are Life, Physical & Social Science (94.1%), Business & Financial (77.8%), and Architecture & Engineering (76.2%), while the most female-oriented occupations are Education Instruction & Library (75.8%), Legal Services & Support (75.3%), and Arts, Media & Entertainment (73.3%).
| Occupation | Male | Female |
| Management | 315 (60.9%) | 202 (39.1%) |
| Business & Financial | 151 (77.8%) | 43 (22.2%) |
| Computers, Engineering & Science | 165 (75.3%) | 54 (24.7%) |
| Computers & Mathematics | 53 (69.7%) | 23 (30.3%) |
| Architecture & Engineering | 96 (76.2%) | 30 (23.8%) |
| Life, Physical & Social Science | 16 (94.1%) | 1 (5.9%) |
| Community & Social Service | 71 (27.2%) | 190 (72.8%) |
| Education, Arts & Media | 19 (38.8%) | 30 (61.2%) |
| Legal Services & Support | 18 (24.7%) | 55 (75.3%) |
| Education Instruction & Library | 30 (24.2%) | 94 (75.8%) |
| Arts, Media & Entertainment | 4 (26.7%) | 11 (73.3%) |
| Health Diagnosing & Treating | 126 (39.4%) | 194 (60.6%) |
| Health Technologists | 122 (48.8%) | 128 (51.2%) |
| Total (Category) | 828 (54.8%) | 683 (45.2%) |
| Total (Overall) | 1,762 (54.0%) | 1,499 (46.0%) |
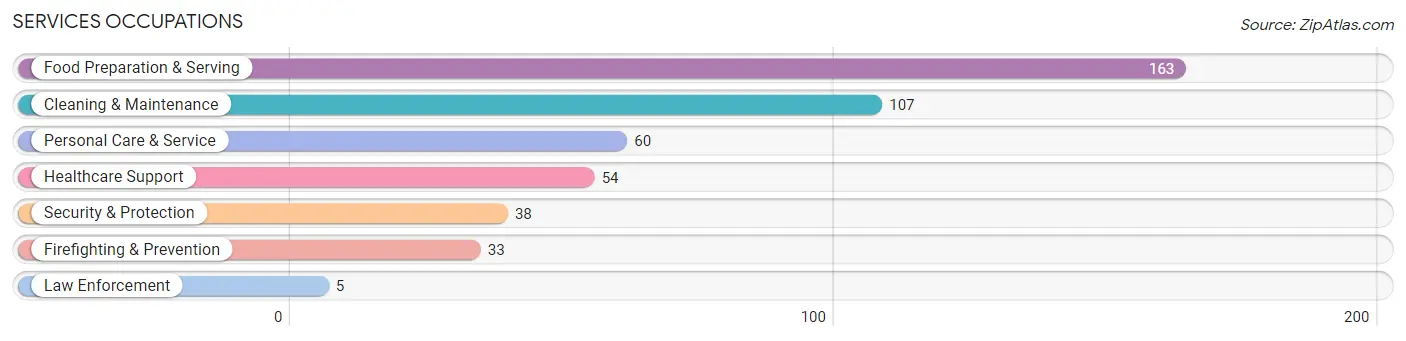
Services Occupations
The most common Services occupations in Guntersville are Food Preparation & Serving (163 | 5.0%), Cleaning & Maintenance (107 | 3.3%), Personal Care & Service (60 | 1.8%), Healthcare Support (54 | 1.7%), and Security & Protection (38 | 1.2%).
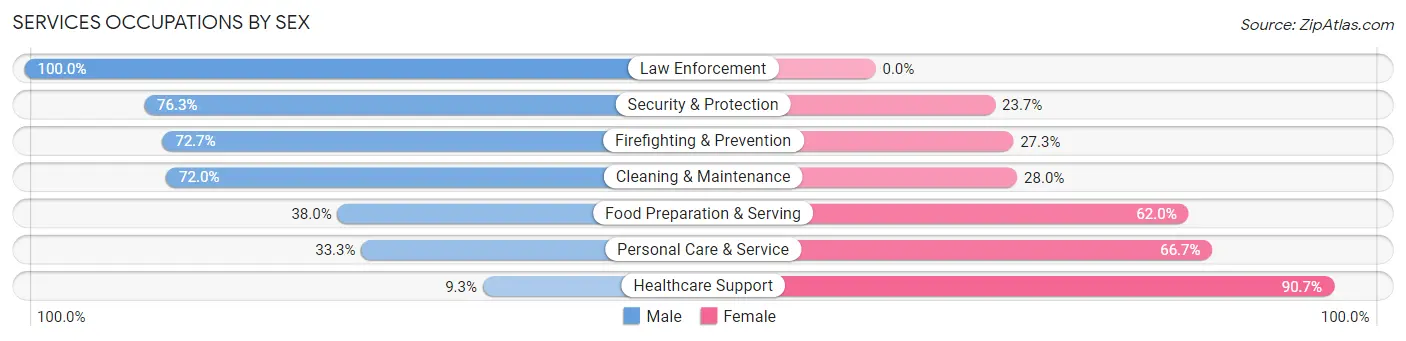
Services Occupations by Sex
Within the Services occupations in Guntersville, the most male-oriented occupations are Law Enforcement (100.0%), Security & Protection (76.3%), and Firefighting & Prevention (72.7%), while the most female-oriented occupations are Healthcare Support (90.7%), Personal Care & Service (66.7%), and Food Preparation & Serving (62.0%).
| Occupation | Male | Female |
| Healthcare Support | 5 (9.3%) | 49 (90.7%) |
| Security & Protection | 29 (76.3%) | 9 (23.7%) |
| Firefighting & Prevention | 24 (72.7%) | 9 (27.3%) |
| Law Enforcement | 5 (100.0%) | 0 (0.0%) |
| Food Preparation & Serving | 62 (38.0%) | 101 (62.0%) |
| Cleaning & Maintenance | 77 (72.0%) | 30 (28.0%) |
| Personal Care & Service | 20 (33.3%) | 40 (66.7%) |
| Total (Category) | 193 (45.7%) | 229 (54.3%) |
| Total (Overall) | 1,762 (54.0%) | 1,499 (46.0%) |
Sales and Office Occupations
The most common Sales and Office occupations in Guntersville are Sales & Related (389 | 11.9%), and Office & Administration (318 | 9.8%).
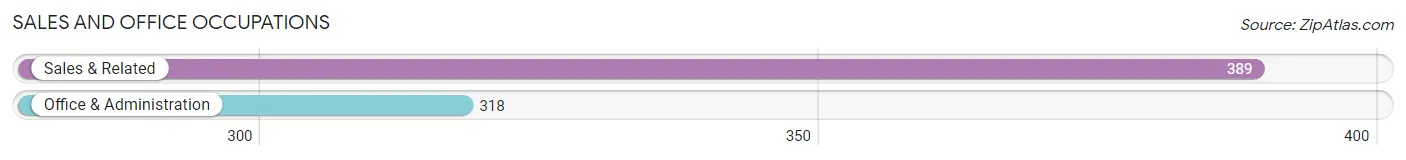
Sales and Office Occupations by Sex
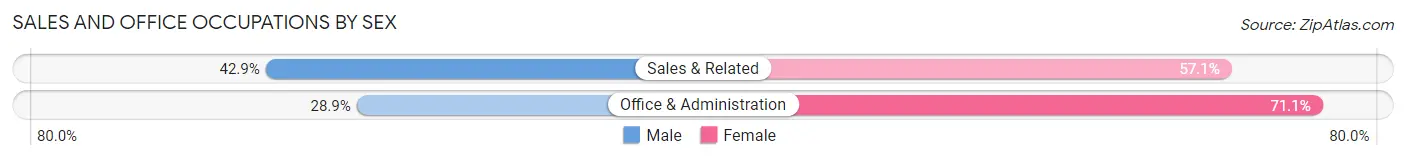
| Occupation | Male | Female |
| Sales & Related | 167 (42.9%) | 222 (57.1%) |
| Office & Administration | 92 (28.9%) | 226 (71.1%) |
| Total (Category) | 259 (36.6%) | 448 (63.4%) |
| Total (Overall) | 1,762 (54.0%) | 1,499 (46.0%) |
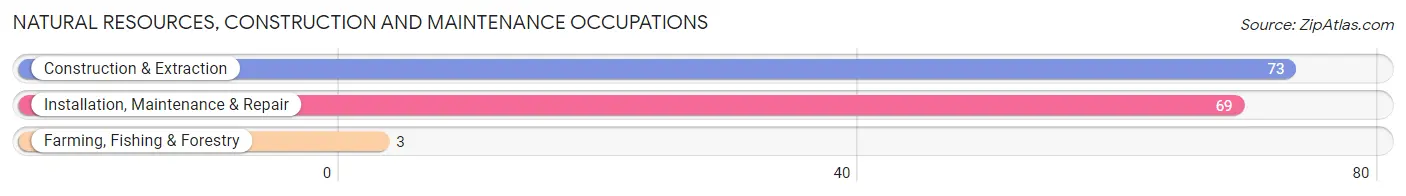
Natural Resources, Construction and Maintenance Occupations
The most common Natural Resources, Construction and Maintenance occupations in Guntersville are Construction & Extraction (73 | 2.2%), Installation, Maintenance & Repair (69 | 2.1%), and Farming, Fishing & Forestry (3 | 0.1%).
Natural Resources, Construction and Maintenance Occupations by Sex
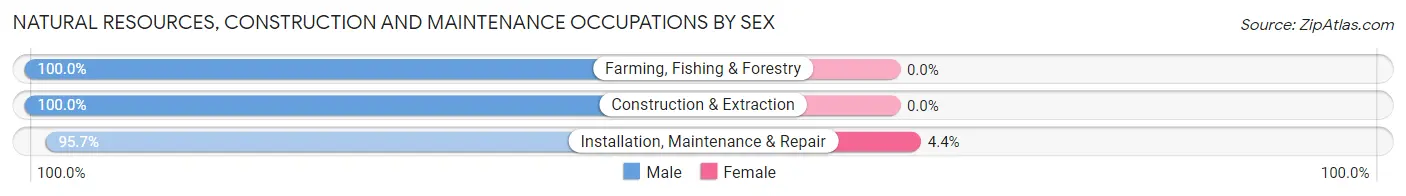
| Occupation | Male | Female |
| Farming, Fishing & Forestry | 3 (100.0%) | 0 (0.0%) |
| Construction & Extraction | 73 (100.0%) | 0 (0.0%) |
| Installation, Maintenance & Repair | 66 (95.7%) | 3 (4.3%) |
| Total (Category) | 142 (97.9%) | 3 (2.1%) |
| Total (Overall) | 1,762 (54.0%) | 1,499 (46.0%) |
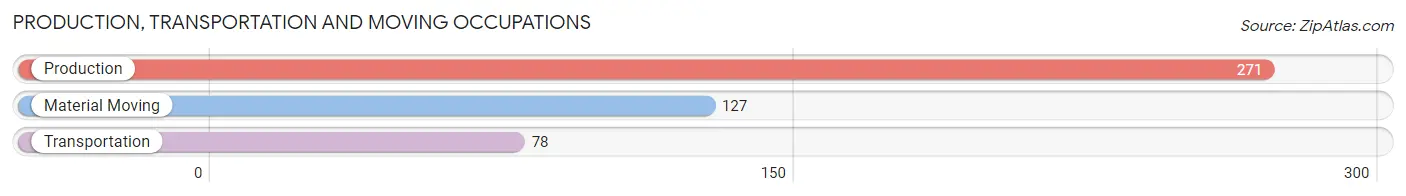
Production, Transportation and Moving Occupations
The most common Production, Transportation and Moving occupations in Guntersville are Production (271 | 8.3%), Material Moving (127 | 3.9%), and Transportation (78 | 2.4%).
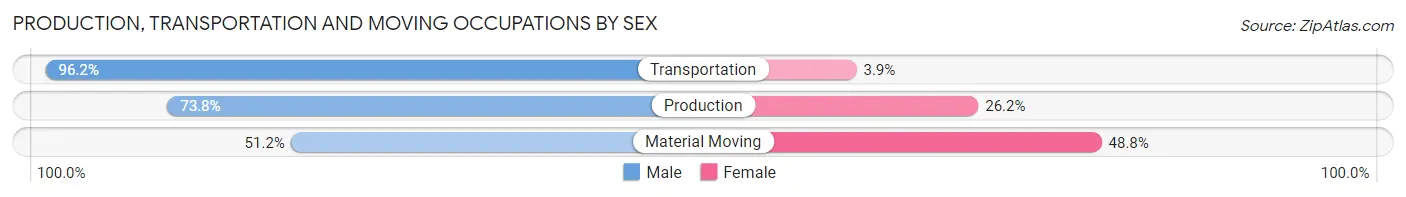
Production, Transportation and Moving Occupations by Sex
| Occupation | Male | Female |
| Production | 200 (73.8%) | 71 (26.2%) |
| Transportation | 75 (96.2%) | 3 (3.8%) |
| Material Moving | 65 (51.2%) | 62 (48.8%) |
| Total (Category) | 340 (71.4%) | 136 (28.6%) |
| Total (Overall) | 1,762 (54.0%) | 1,499 (46.0%) |
Employment Industries by Sex in Guntersville
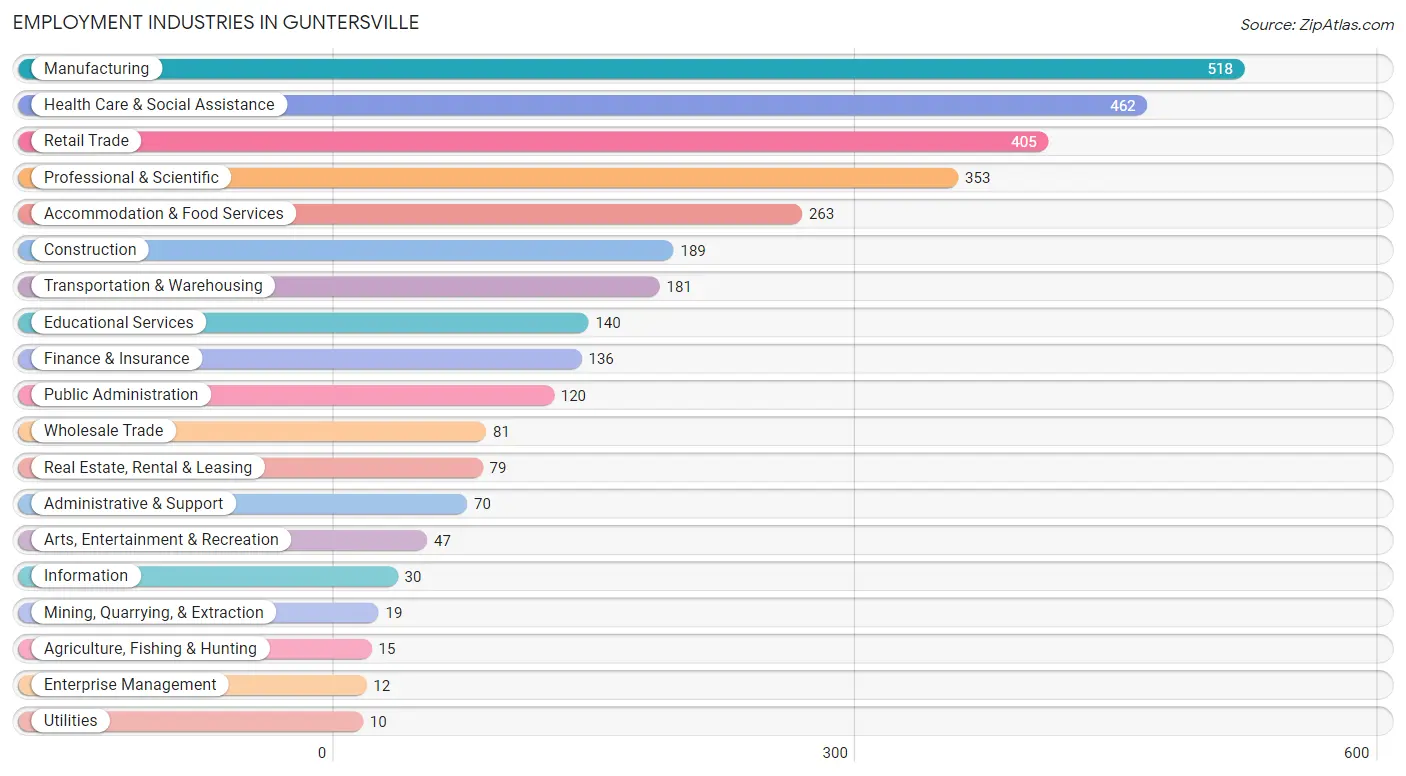
Employment Industries in Guntersville
The major employment industries in Guntersville include Manufacturing (518 | 15.9%), Health Care & Social Assistance (462 | 14.2%), Retail Trade (405 | 12.4%), Professional & Scientific (353 | 10.8%), and Accommodation & Food Services (263 | 8.1%).
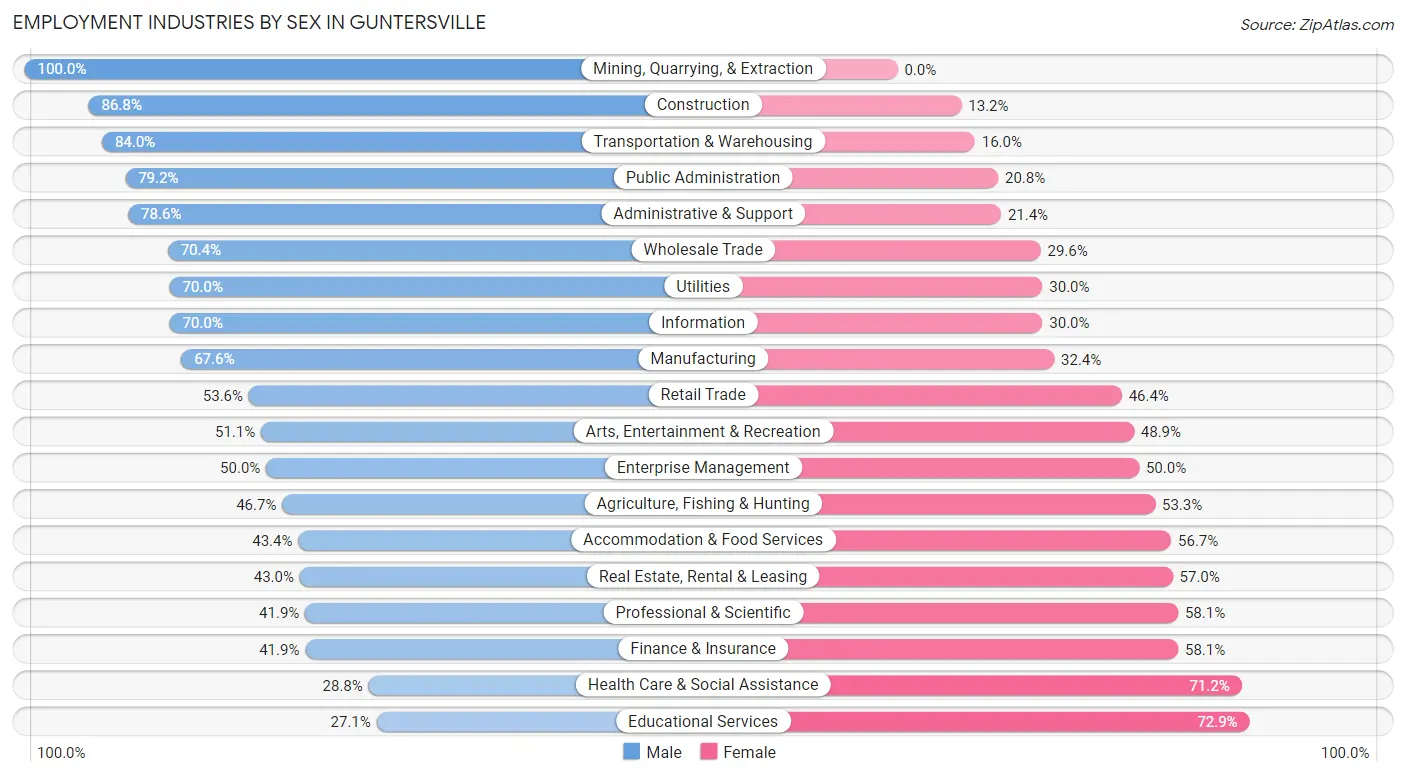
Employment Industries by Sex in Guntersville
The Guntersville industries that see more men than women are Mining, Quarrying, & Extraction (100.0%), Construction (86.8%), and Transportation & Warehousing (84.0%), whereas the industries that tend to have a higher number of women are Educational Services (72.9%), Health Care & Social Assistance (71.2%), and Finance & Insurance (58.1%).
| Industry | Male | Female |
| Agriculture, Fishing & Hunting | 7 (46.7%) | 8 (53.3%) |
| Mining, Quarrying, & Extraction | 19 (100.0%) | 0 (0.0%) |
| Construction | 164 (86.8%) | 25 (13.2%) |
| Manufacturing | 350 (67.6%) | 168 (32.4%) |
| Wholesale Trade | 57 (70.4%) | 24 (29.6%) |
| Retail Trade | 217 (53.6%) | 188 (46.4%) |
| Transportation & Warehousing | 152 (84.0%) | 29 (16.0%) |
| Utilities | 7 (70.0%) | 3 (30.0%) |
| Information | 21 (70.0%) | 9 (30.0%) |
| Finance & Insurance | 57 (41.9%) | 79 (58.1%) |
| Real Estate, Rental & Leasing | 34 (43.0%) | 45 (57.0%) |
| Professional & Scientific | 148 (41.9%) | 205 (58.1%) |
| Enterprise Management | 6 (50.0%) | 6 (50.0%) |
| Administrative & Support | 55 (78.6%) | 15 (21.4%) |
| Educational Services | 38 (27.1%) | 102 (72.9%) |
| Health Care & Social Assistance | 133 (28.8%) | 329 (71.2%) |
| Arts, Entertainment & Recreation | 24 (51.1%) | 23 (48.9%) |
| Accommodation & Food Services | 114 (43.3%) | 149 (56.7%) |
| Public Administration | 95 (79.2%) | 25 (20.8%) |
| Total | 1,762 (54.0%) | 1,499 (46.0%) |
Education in Guntersville
School Enrollment in Guntersville
The most common levels of schooling among the 1,664 students in Guntersville are high school (400 | 24.0%), middle school (387 | 23.3%), and elementary school (324 | 19.5%).
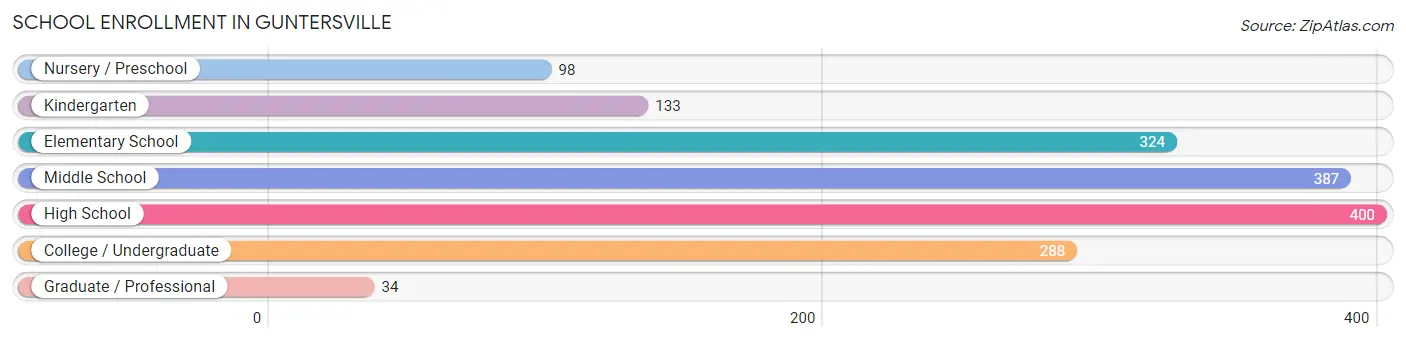
| School Level | # Students | % Students |
| Nursery / Preschool | 98 | 5.9% |
| Kindergarten | 133 | 8.0% |
| Elementary School | 324 | 19.5% |
| Middle School | 387 | 23.3% |
| High School | 400 | 24.0% |
| College / Undergraduate | 288 | 17.3% |
| Graduate / Professional | 34 | 2.0% |
| Total | 1,664 | 100.0% |
School Enrollment by Age by Funding Source in Guntersville
Out of a total of 1,664 students who are enrolled in schools in Guntersville, 200 (12.0%) attend a private institution, while the remaining 1,464 (88.0%) are enrolled in public schools. The age group of 15 to 17 year olds has the highest likelihood of being enrolled in private schools, with 108 (38.9% in the age bracket) enrolled. Conversely, the age group of 20 to 24 year olds has the lowest likelihood of being enrolled in a private school, with 106 (100.0% in the age bracket) attending a public institution.
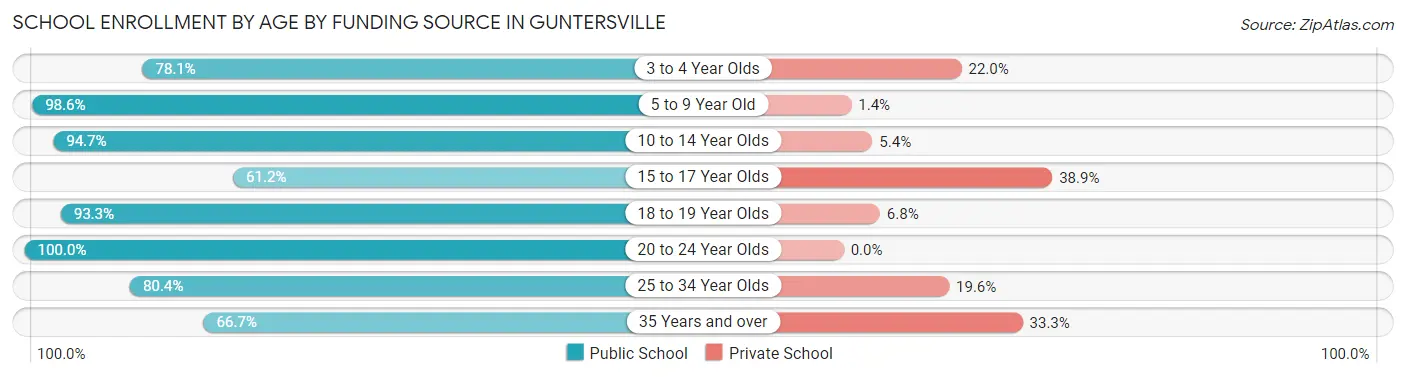
| Age Bracket | Public School | Private School |
| 3 to 4 Year Olds | 64 (78.0%) | 18 (22.0%) |
| 5 to 9 Year Old | 414 (98.6%) | 6 (1.4%) |
| 10 to 14 Year Olds | 478 (94.7%) | 27 (5.3%) |
| 15 to 17 Year Olds | 170 (61.2%) | 108 (38.9%) |
| 18 to 19 Year Olds | 152 (93.2%) | 11 (6.8%) |
| 20 to 24 Year Olds | 106 (100.0%) | 0 (0.0%) |
| 25 to 34 Year Olds | 45 (80.4%) | 11 (19.6%) |
| 35 Years and over | 36 (66.7%) | 18 (33.3%) |
| Total | 1,464 (88.0%) | 200 (12.0%) |
Educational Attainment by Field of Study in Guntersville
Business (671 | 29.4%), education (318 | 14.0%), engineering (219 | 9.6%), arts & humanities (189 | 8.3%), and liberal arts & history (169 | 7.4%) are the most common fields of study among 2,280 individuals in Guntersville who have obtained a bachelor's degree or higher.
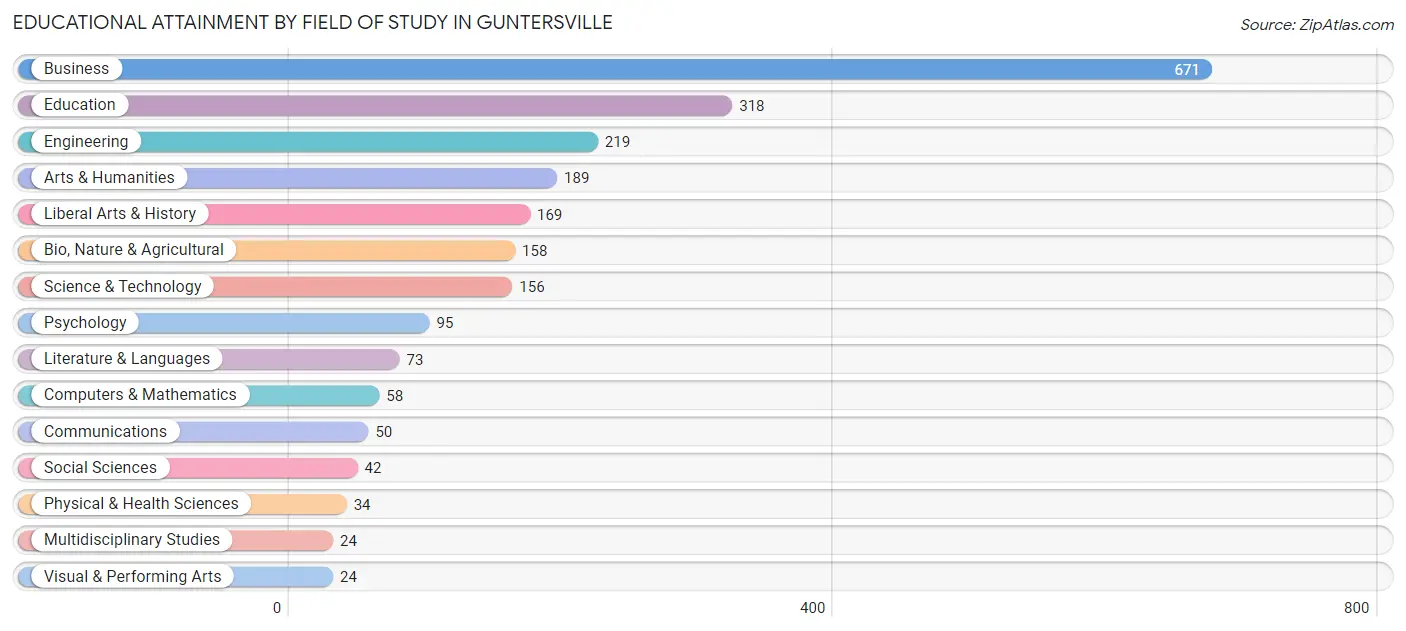
| Field of Study | # Graduates | % Graduates |
| Computers & Mathematics | 58 | 2.5% |
| Bio, Nature & Agricultural | 158 | 6.9% |
| Physical & Health Sciences | 34 | 1.5% |
| Psychology | 95 | 4.2% |
| Social Sciences | 42 | 1.8% |
| Engineering | 219 | 9.6% |
| Multidisciplinary Studies | 24 | 1.1% |
| Science & Technology | 156 | 6.8% |
| Business | 671 | 29.4% |
| Education | 318 | 14.0% |
| Literature & Languages | 73 | 3.2% |
| Liberal Arts & History | 169 | 7.4% |
| Visual & Performing Arts | 24 | 1.1% |
| Communications | 50 | 2.2% |
| Arts & Humanities | 189 | 8.3% |
| Total | 2,280 | 100.0% |
Transportation & Commute in Guntersville
Vehicle Availability by Sex in Guntersville
The most prevalent vehicle ownership categories in Guntersville are males with 2 vehicles (753, accounting for 42.9%) and females with 2 vehicles (573, making up 51.0%).
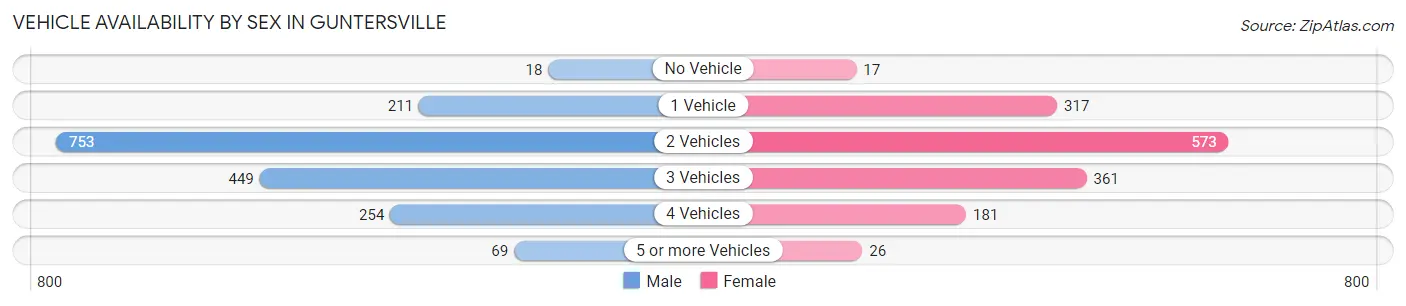
| Vehicles Available | Male | Female |
| No Vehicle | 18 (1.0%) | 17 (1.1%) |
| 1 Vehicle | 211 (12.0%) | 317 (21.5%) |
| 2 Vehicles | 753 (42.9%) | 573 (38.9%) |
| 3 Vehicles | 449 (25.6%) | 361 (24.5%) |
| 4 Vehicles | 254 (14.5%) | 181 (12.3%) |
| 5 or more Vehicles | 69 (3.9%) | 26 (1.8%) |
| Total | 1,754 (100.0%) | 1,475 (100.0%) |
Commute Time in Guntersville
The most frequently occuring commute durations in Guntersville are 10 to 14 minutes (589 commuters, 19.9%), 5 to 9 minutes (478 commuters, 16.2%), and 15 to 19 minutes (438 commuters, 14.8%).
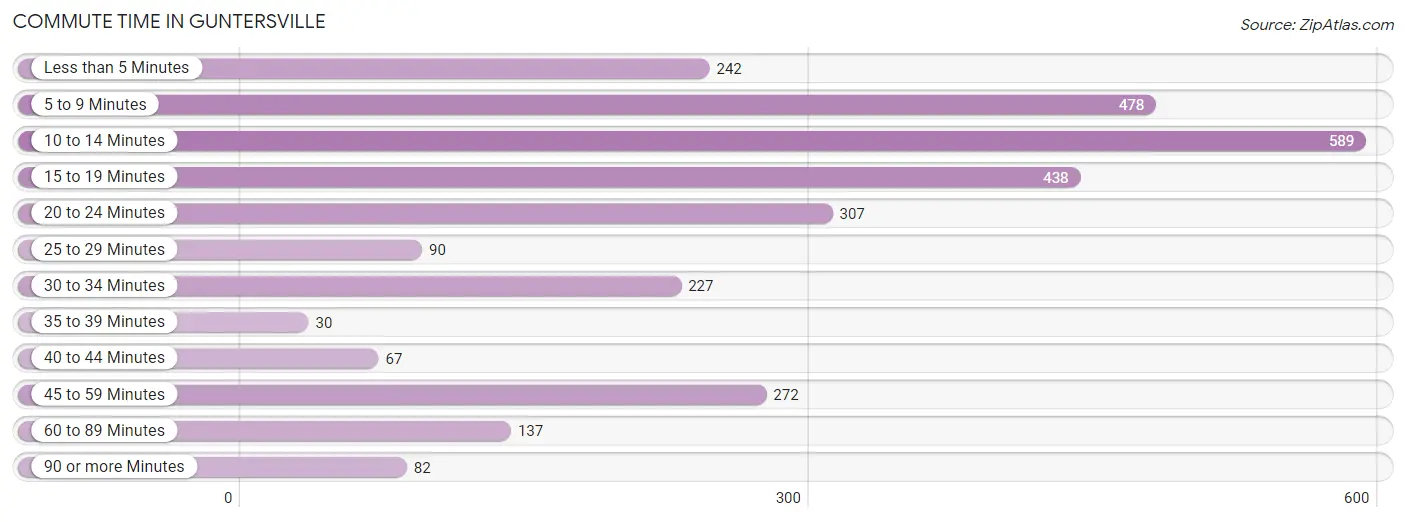
| Commute Time | # Commuters | % Commuters |
| Less than 5 Minutes | 242 | 8.2% |
| 5 to 9 Minutes | 478 | 16.2% |
| 10 to 14 Minutes | 589 | 19.9% |
| 15 to 19 Minutes | 438 | 14.8% |
| 20 to 24 Minutes | 307 | 10.4% |
| 25 to 29 Minutes | 90 | 3.0% |
| 30 to 34 Minutes | 227 | 7.7% |
| 35 to 39 Minutes | 30 | 1.0% |
| 40 to 44 Minutes | 67 | 2.3% |
| 45 to 59 Minutes | 272 | 9.2% |
| 60 to 89 Minutes | 137 | 4.6% |
| 90 or more Minutes | 82 | 2.8% |
Commute Time by Sex in Guntersville
The most common commute times in Guntersville are 10 to 14 minutes (316 commuters, 19.7%) for males and 10 to 14 minutes (273 commuters, 20.1%) for females.
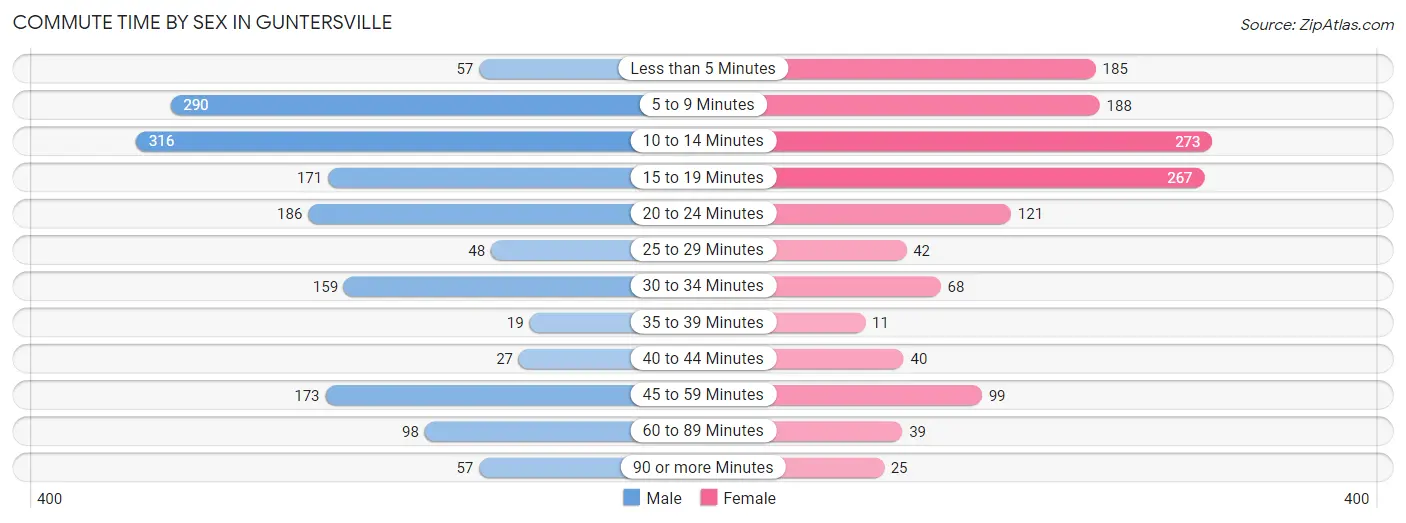
| Commute Time | Male | Female |
| Less than 5 Minutes | 57 (3.6%) | 185 (13.6%) |
| 5 to 9 Minutes | 290 (18.1%) | 188 (13.8%) |
| 10 to 14 Minutes | 316 (19.7%) | 273 (20.1%) |
| 15 to 19 Minutes | 171 (10.7%) | 267 (19.7%) |
| 20 to 24 Minutes | 186 (11.6%) | 121 (8.9%) |
| 25 to 29 Minutes | 48 (3.0%) | 42 (3.1%) |
| 30 to 34 Minutes | 159 (9.9%) | 68 (5.0%) |
| 35 to 39 Minutes | 19 (1.2%) | 11 (0.8%) |
| 40 to 44 Minutes | 27 (1.7%) | 40 (2.9%) |
| 45 to 59 Minutes | 173 (10.8%) | 99 (7.3%) |
| 60 to 89 Minutes | 98 (6.1%) | 39 (2.9%) |
| 90 or more Minutes | 57 (3.6%) | 25 (1.8%) |
Time of Departure to Work by Sex in Guntersville
The most frequent times of departure to work in Guntersville are 7:00 AM to 7:29 AM (232, 14.5%) for males and 7:00 AM to 7:29 AM (226, 16.6%) for females.
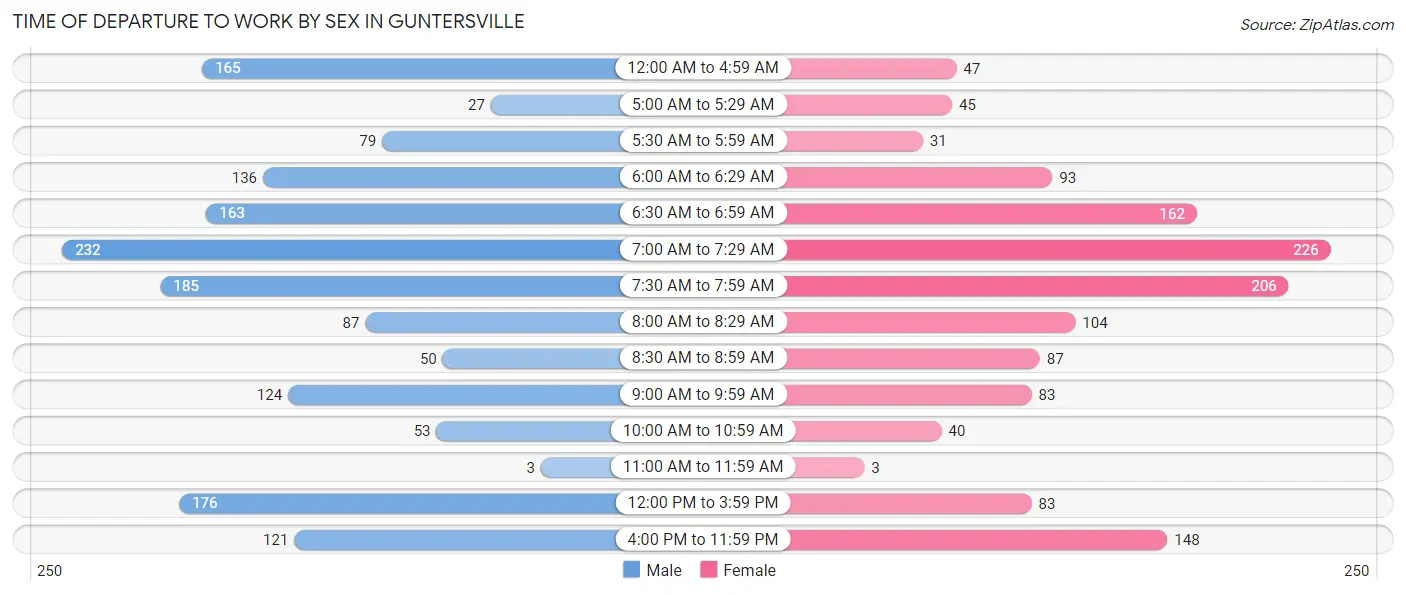
| Time of Departure | Male | Female |
| 12:00 AM to 4:59 AM | 165 (10.3%) | 47 (3.5%) |
| 5:00 AM to 5:29 AM | 27 (1.7%) | 45 (3.3%) |
| 5:30 AM to 5:59 AM | 79 (4.9%) | 31 (2.3%) |
| 6:00 AM to 6:29 AM | 136 (8.5%) | 93 (6.9%) |
| 6:30 AM to 6:59 AM | 163 (10.2%) | 162 (11.9%) |
| 7:00 AM to 7:29 AM | 232 (14.5%) | 226 (16.6%) |
| 7:30 AM to 7:59 AM | 185 (11.6%) | 206 (15.2%) |
| 8:00 AM to 8:29 AM | 87 (5.4%) | 104 (7.7%) |
| 8:30 AM to 8:59 AM | 50 (3.1%) | 87 (6.4%) |
| 9:00 AM to 9:59 AM | 124 (7.7%) | 83 (6.1%) |
| 10:00 AM to 10:59 AM | 53 (3.3%) | 40 (2.9%) |
| 11:00 AM to 11:59 AM | 3 (0.2%) | 3 (0.2%) |
| 12:00 PM to 3:59 PM | 176 (11.0%) | 83 (6.1%) |
| 4:00 PM to 11:59 PM | 121 (7.6%) | 148 (10.9%) |
| Total | 1,601 (100.0%) | 1,358 (100.0%) |
Housing Occupancy in Guntersville
Occupancy by Ownership in Guntersville
Of the total 3,364 dwellings in Guntersville, owner-occupied units account for 2,215 (65.8%), while renter-occupied units make up 1,149 (34.2%).
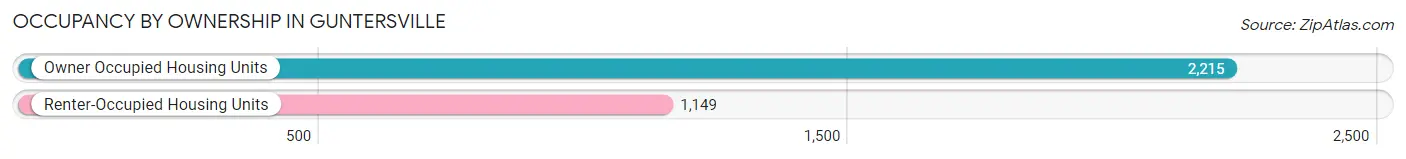
| Occupancy | # Housing Units | % Housing Units |
| Owner Occupied Housing Units | 2,215 | 65.8% |
| Renter-Occupied Housing Units | 1,149 | 34.2% |
| Total Occupied Housing Units | 3,364 | 100.0% |
Occupancy by Household Size in Guntersville
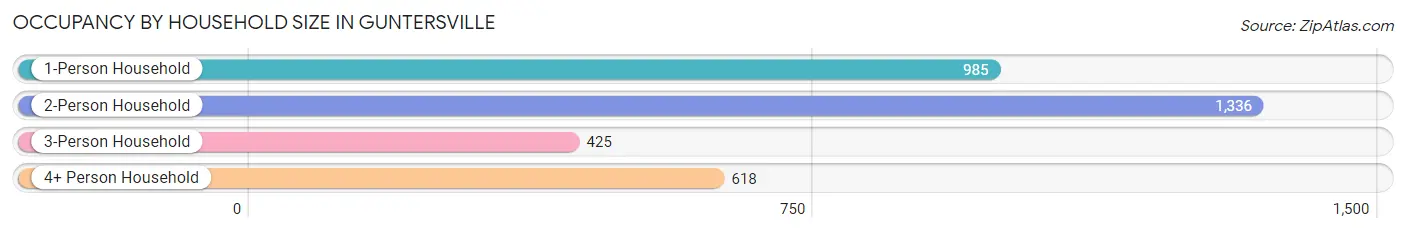
| Household Size | # Housing Units | % Housing Units |
| 1-Person Household | 985 | 29.3% |
| 2-Person Household | 1,336 | 39.7% |
| 3-Person Household | 425 | 12.6% |
| 4+ Person Household | 618 | 18.4% |
| Total Housing Units | 3,364 | 100.0% |
Occupancy by Ownership by Household Size in Guntersville
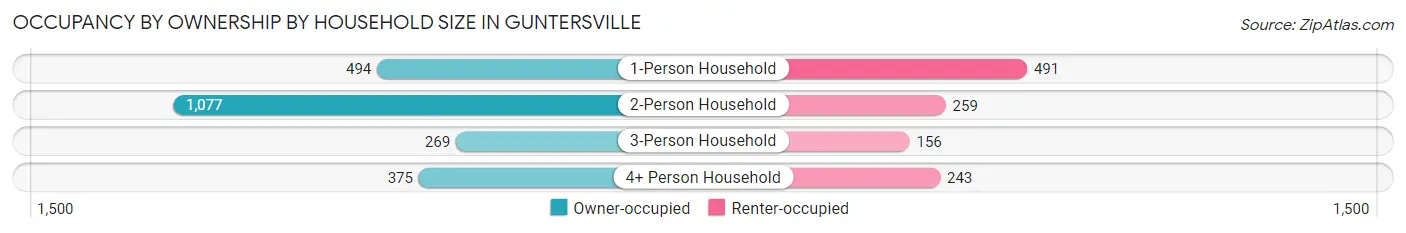
| Household Size | Owner-occupied | Renter-occupied |
| 1-Person Household | 494 (50.1%) | 491 (49.8%) |
| 2-Person Household | 1,077 (80.6%) | 259 (19.4%) |
| 3-Person Household | 269 (63.3%) | 156 (36.7%) |
| 4+ Person Household | 375 (60.7%) | 243 (39.3%) |
| Total Housing Units | 2,215 (65.8%) | 1,149 (34.2%) |
Occupancy by Educational Attainment in Guntersville
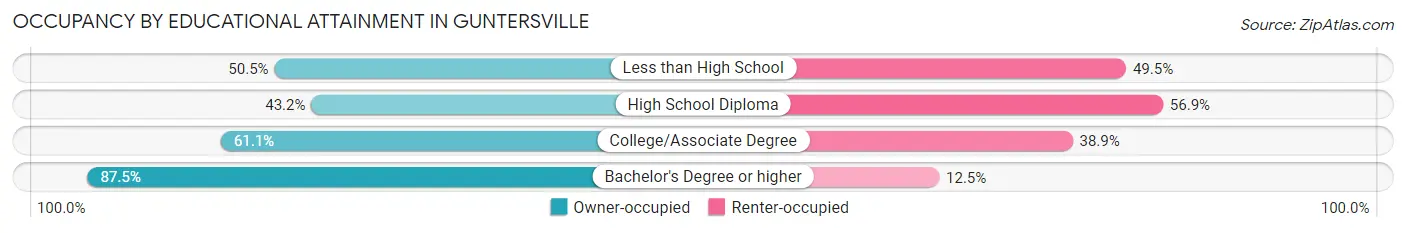
| Household Size | Owner-occupied | Renter-occupied |
| Less than High School | 213 (50.5%) | 209 (49.5%) |
| High School Diploma | 312 (43.1%) | 411 (56.9%) |
| College/Associate Degree | 582 (61.1%) | 371 (38.9%) |
| Bachelor's Degree or higher | 1,108 (87.5%) | 158 (12.5%) |
Occupancy by Age of Householder in Guntersville
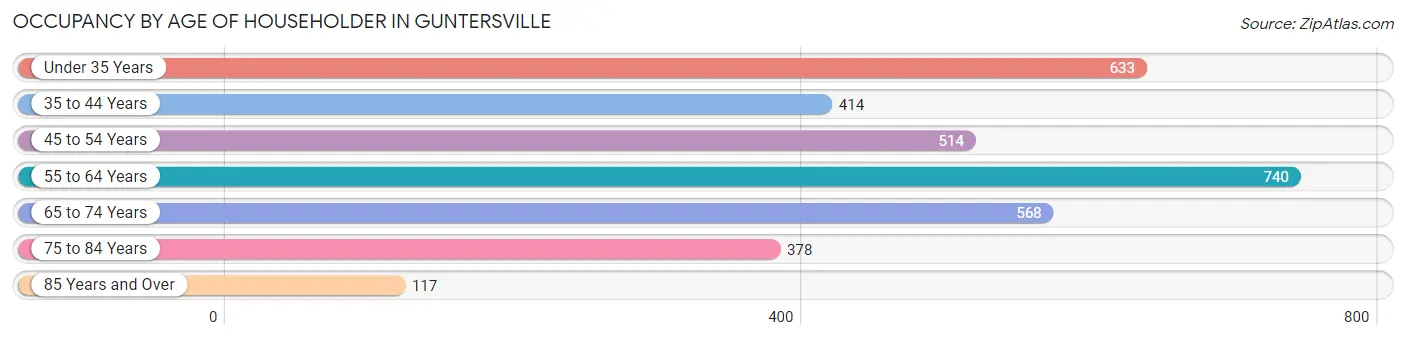
| Age Bracket | # Households | % Households |
| Under 35 Years | 633 | 18.8% |
| 35 to 44 Years | 414 | 12.3% |
| 45 to 54 Years | 514 | 15.3% |
| 55 to 64 Years | 740 | 22.0% |
| 65 to 74 Years | 568 | 16.9% |
| 75 to 84 Years | 378 | 11.2% |
| 85 Years and Over | 117 | 3.5% |
| Total | 3,364 | 100.0% |
Housing Finances in Guntersville
Median Income by Occupancy in Guntersville
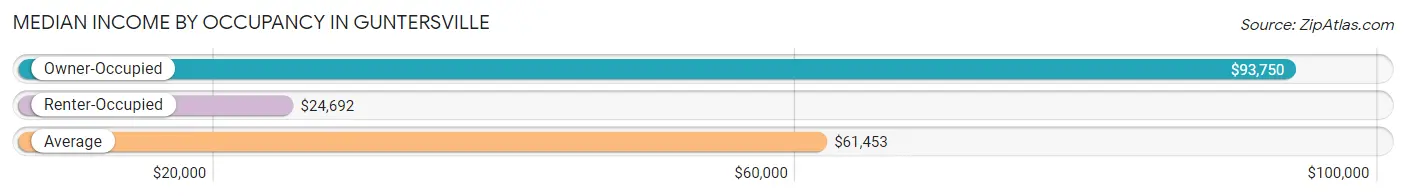
| Occupancy Type | # Households | Median Income |
| Owner-Occupied | 2,215 (65.8%) | $93,750 |
| Renter-Occupied | 1,149 (34.2%) | $24,692 |
| Average | 3,364 (100.0%) | $61,453 |
Occupancy by Householder Income Bracket in Guntersville
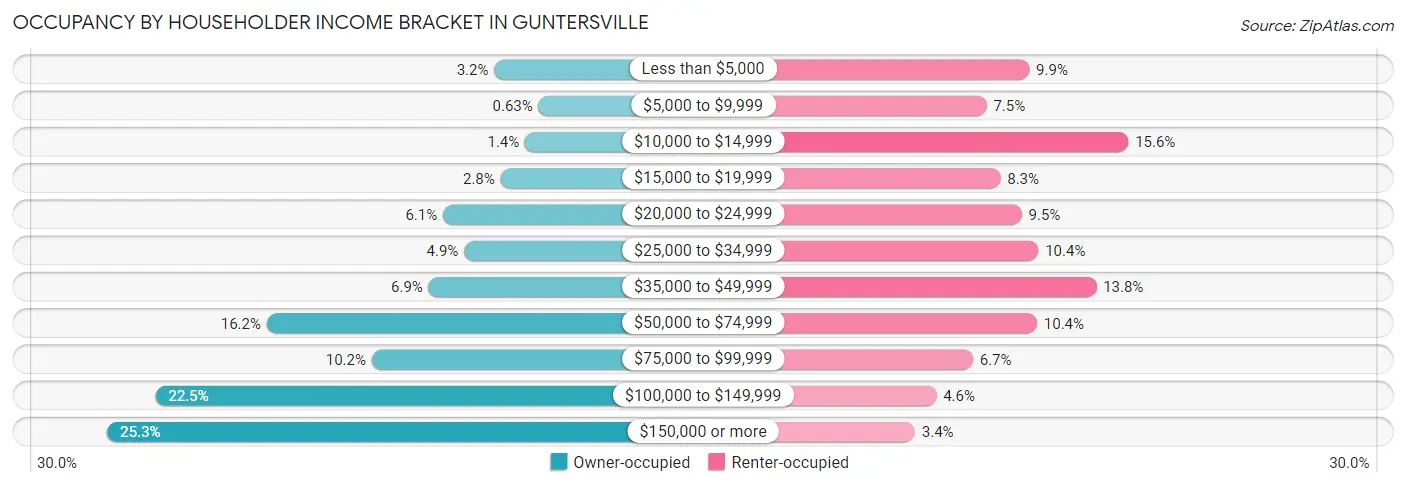
| Income Bracket | Owner-occupied | Renter-occupied |
| Less than $5,000 | 70 (3.2%) | 114 (9.9%) |
| $5,000 to $9,999 | 14 (0.6%) | 86 (7.5%) |
| $10,000 to $14,999 | 31 (1.4%) | 179 (15.6%) |
| $15,000 to $19,999 | 62 (2.8%) | 95 (8.3%) |
| $20,000 to $24,999 | 135 (6.1%) | 109 (9.5%) |
| $25,000 to $34,999 | 108 (4.9%) | 120 (10.4%) |
| $35,000 to $49,999 | 153 (6.9%) | 158 (13.8%) |
| $50,000 to $74,999 | 358 (16.2%) | 119 (10.4%) |
| $75,000 to $99,999 | 225 (10.2%) | 77 (6.7%) |
| $100,000 to $149,999 | 499 (22.5%) | 53 (4.6%) |
| $150,000 or more | 560 (25.3%) | 39 (3.4%) |
| Total | 2,215 (100.0%) | 1,149 (100.0%) |
Monthly Housing Cost Tiers in Guntersville
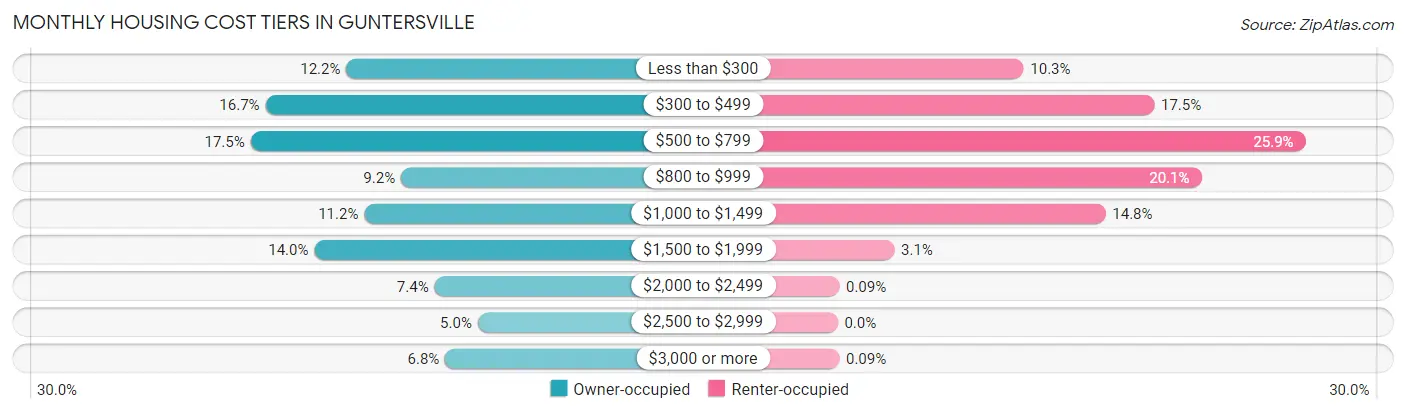
| Monthly Cost | Owner-occupied | Renter-occupied |
| Less than $300 | 271 (12.2%) | 118 (10.3%) |
| $300 to $499 | 370 (16.7%) | 201 (17.5%) |
| $500 to $799 | 388 (17.5%) | 297 (25.9%) |
| $800 to $999 | 204 (9.2%) | 231 (20.1%) |
| $1,000 to $1,499 | 249 (11.2%) | 170 (14.8%) |
| $1,500 to $1,999 | 310 (14.0%) | 36 (3.1%) |
| $2,000 to $2,499 | 163 (7.4%) | 1 (0.1%) |
| $2,500 to $2,999 | 110 (5.0%) | 0 (0.0%) |
| $3,000 or more | 150 (6.8%) | 1 (0.1%) |
| Total | 2,215 (100.0%) | 1,149 (100.0%) |
Physical Housing Characteristics in Guntersville
Housing Structures in Guntersville
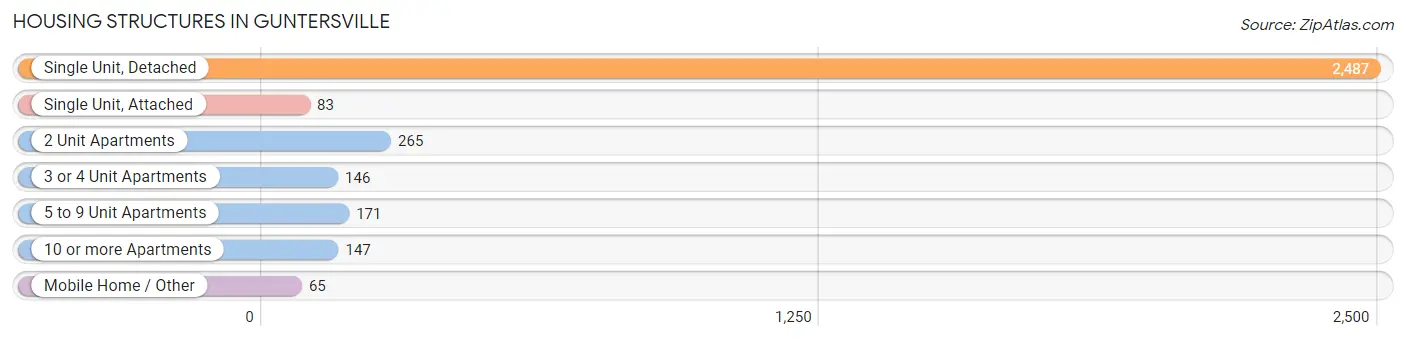
| Structure Type | # Housing Units | % Housing Units |
| Single Unit, Detached | 2,487 | 73.9% |
| Single Unit, Attached | 83 | 2.5% |
| 2 Unit Apartments | 265 | 7.9% |
| 3 or 4 Unit Apartments | 146 | 4.3% |
| 5 to 9 Unit Apartments | 171 | 5.1% |
| 10 or more Apartments | 147 | 4.4% |
| Mobile Home / Other | 65 | 1.9% |
| Total | 3,364 | 100.0% |
Housing Structures by Occupancy in Guntersville
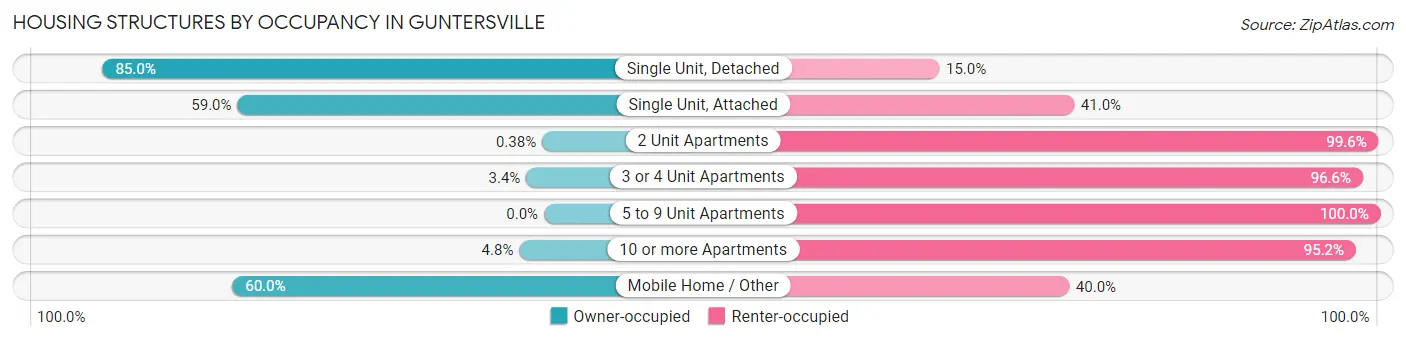
| Structure Type | Owner-occupied | Renter-occupied |
| Single Unit, Detached | 2,114 (85.0%) | 373 (15.0%) |
| Single Unit, Attached | 49 (59.0%) | 34 (41.0%) |
| 2 Unit Apartments | 1 (0.4%) | 264 (99.6%) |
| 3 or 4 Unit Apartments | 5 (3.4%) | 141 (96.6%) |
| 5 to 9 Unit Apartments | 0 (0.0%) | 171 (100.0%) |
| 10 or more Apartments | 7 (4.8%) | 140 (95.2%) |
| Mobile Home / Other | 39 (60.0%) | 26 (40.0%) |
| Total | 2,215 (65.8%) | 1,149 (34.2%) |
Housing Structures by Number of Rooms in Guntersville
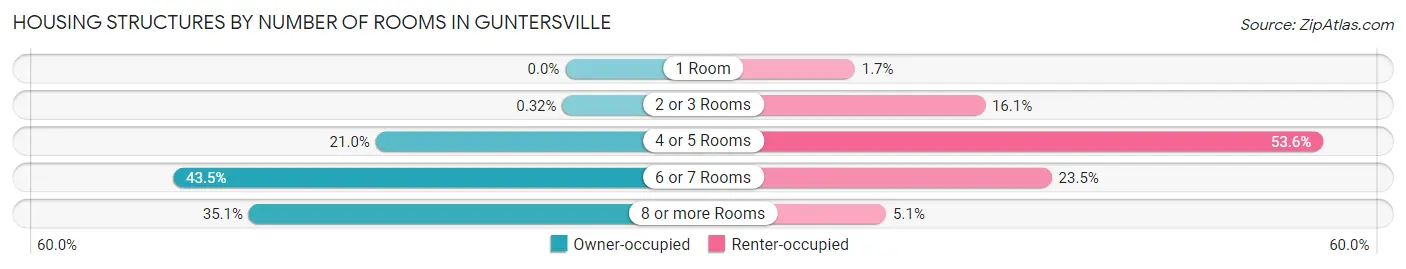
| Number of Rooms | Owner-occupied | Renter-occupied |
| 1 Room | 0 (0.0%) | 19 (1.7%) |
| 2 or 3 Rooms | 7 (0.3%) | 185 (16.1%) |
| 4 or 5 Rooms | 466 (21.0%) | 616 (53.6%) |
| 6 or 7 Rooms | 964 (43.5%) | 270 (23.5%) |
| 8 or more Rooms | 778 (35.1%) | 59 (5.1%) |
| Total | 2,215 (100.0%) | 1,149 (100.0%) |
Housing Structure by Heating Type in Guntersville
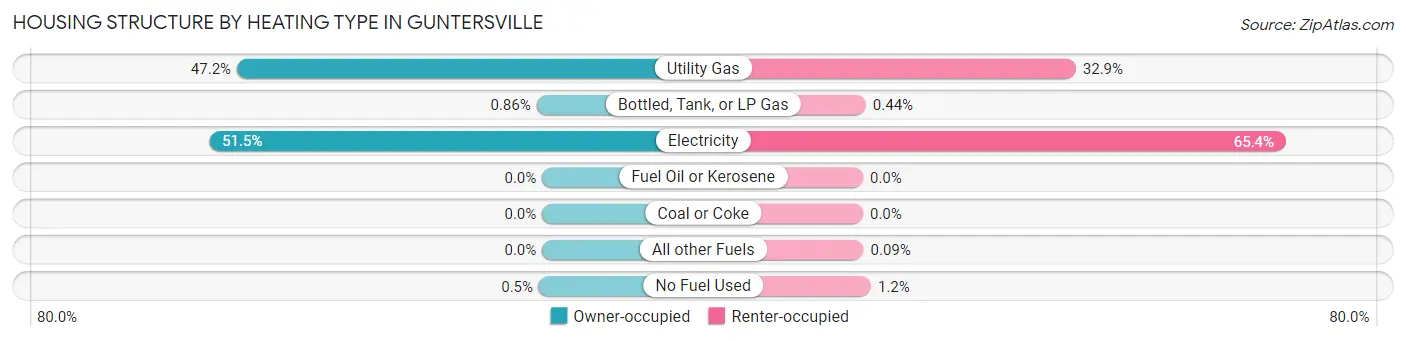
| Heating Type | Owner-occupied | Renter-occupied |
| Utility Gas | 1,045 (47.2%) | 378 (32.9%) |
| Bottled, Tank, or LP Gas | 19 (0.9%) | 5 (0.4%) |
| Electricity | 1,140 (51.5%) | 751 (65.4%) |
| Fuel Oil or Kerosene | 0 (0.0%) | 0 (0.0%) |
| Coal or Coke | 0 (0.0%) | 0 (0.0%) |
| All other Fuels | 0 (0.0%) | 1 (0.1%) |
| No Fuel Used | 11 (0.5%) | 14 (1.2%) |
| Total | 2,215 (100.0%) | 1,149 (100.0%) |
Household Vehicle Usage in Guntersville
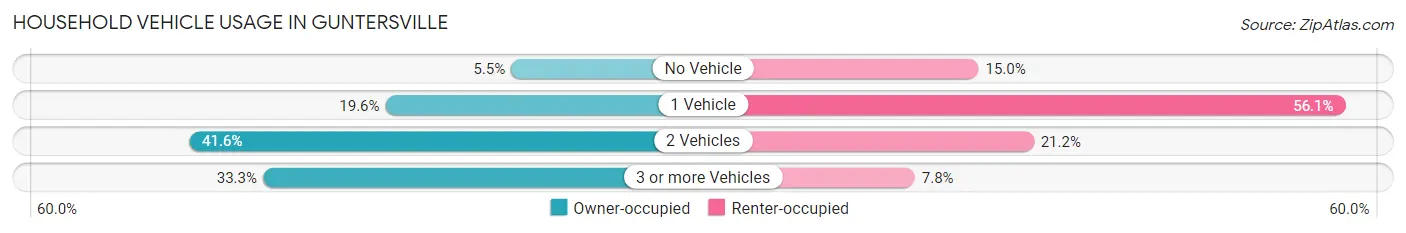
| Vehicles per Household | Owner-occupied | Renter-occupied |
| No Vehicle | 122 (5.5%) | 172 (15.0%) |
| 1 Vehicle | 434 (19.6%) | 644 (56.0%) |
| 2 Vehicles | 921 (41.6%) | 243 (21.1%) |
| 3 or more Vehicles | 738 (33.3%) | 90 (7.8%) |
| Total | 2,215 (100.0%) | 1,149 (100.0%) |
Real Estate & Mortgages in Guntersville
Real Estate and Mortgage Overview in Guntersville
| Characteristic | Without Mortgage | With Mortgage |
| Housing Units | 1,012 | 1,203 |
| Median Property Value | $239,500 | $286,100 |
| Median Household Income | $57,917 | $426 |
| Monthly Housing Costs | $442 | $150 |
| Real Estate Taxes | $965 | $98 |
Property Value by Mortgage Status in Guntersville
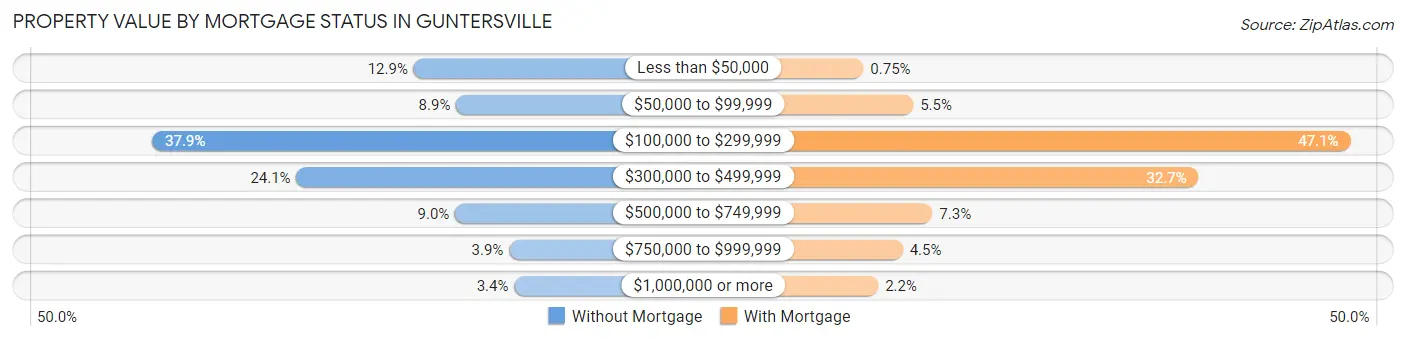
| Property Value | Without Mortgage | With Mortgage |
| Less than $50,000 | 131 (12.9%) | 9 (0.7%) |
| $50,000 to $99,999 | 90 (8.9%) | 66 (5.5%) |
| $100,000 to $299,999 | 383 (37.9%) | 567 (47.1%) |
| $300,000 to $499,999 | 244 (24.1%) | 393 (32.7%) |
| $500,000 to $749,999 | 91 (9.0%) | 88 (7.3%) |
| $750,000 to $999,999 | 39 (3.8%) | 54 (4.5%) |
| $1,000,000 or more | 34 (3.4%) | 26 (2.2%) |
| Total | 1,012 (100.0%) | 1,203 (100.0%) |
Household Income by Mortgage Status in Guntersville
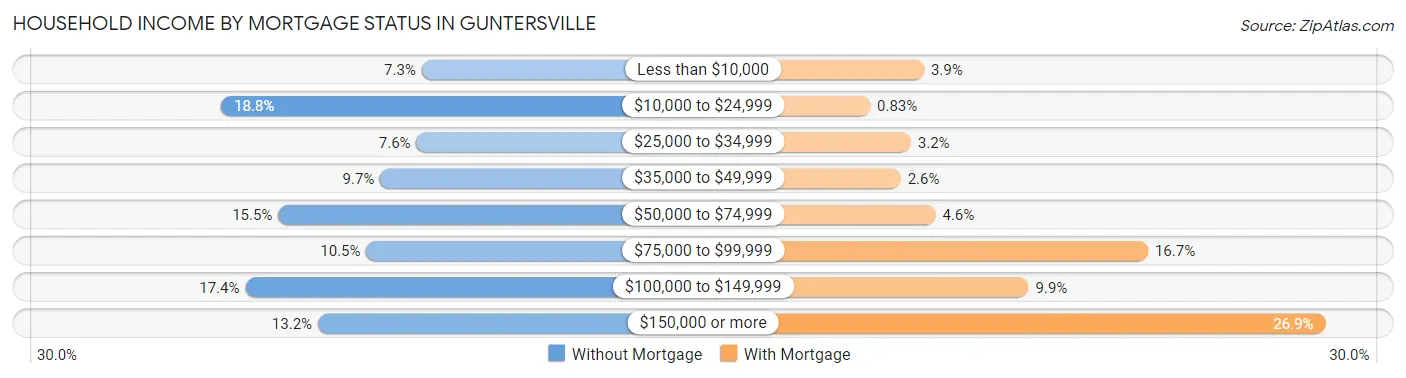
| Household Income | Without Mortgage | With Mortgage |
| Less than $10,000 | 74 (7.3%) | 47 (3.9%) |
| $10,000 to $24,999 | 190 (18.8%) | 10 (0.8%) |
| $25,000 to $34,999 | 77 (7.6%) | 38 (3.2%) |
| $35,000 to $49,999 | 98 (9.7%) | 31 (2.6%) |
| $50,000 to $74,999 | 157 (15.5%) | 55 (4.6%) |
| $75,000 to $99,999 | 106 (10.5%) | 201 (16.7%) |
| $100,000 to $149,999 | 176 (17.4%) | 119 (9.9%) |
| $150,000 or more | 134 (13.2%) | 323 (26.9%) |
| Total | 1,012 (100.0%) | 1,203 (100.0%) |
Property Value to Household Income Ratio in Guntersville
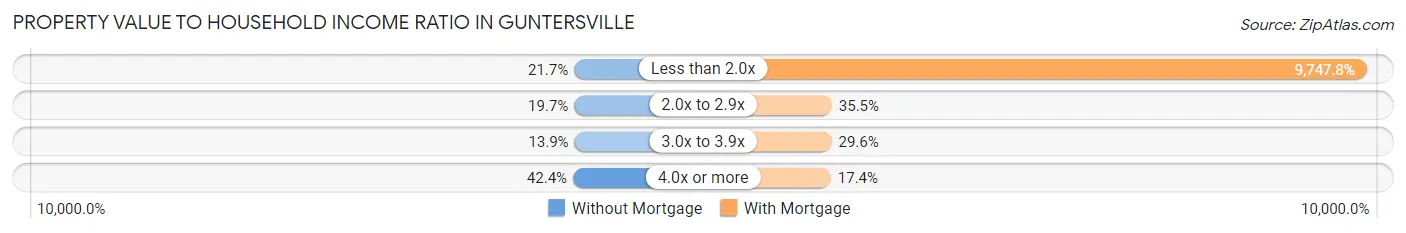
| Value-to-Income Ratio | Without Mortgage | With Mortgage |
| Less than 2.0x | 220 (21.7%) | 117,266 (9,747.8%) |
| 2.0x to 2.9x | 199 (19.7%) | 427 (35.5%) |
| 3.0x to 3.9x | 141 (13.9%) | 356 (29.6%) |
| 4.0x or more | 429 (42.4%) | 209 (17.4%) |
| Total | 1,012 (100.0%) | 1,203 (100.0%) |
Real Estate Taxes by Mortgage Status in Guntersville
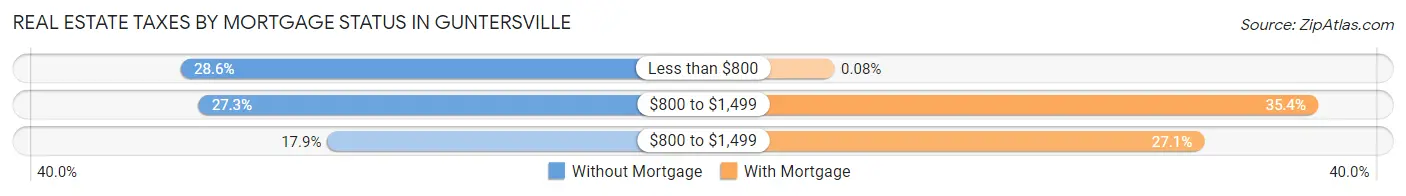
| Property Taxes | Without Mortgage | With Mortgage |
| Less than $800 | 289 (28.6%) | 1 (0.1%) |
| $800 to $1,499 | 276 (27.3%) | 426 (35.4%) |
| $800 to $1,499 | 181 (17.9%) | 326 (27.1%) |
| Total | 1,012 (100.0%) | 1,203 (100.0%) |
Health & Disability in Guntersville
Health Insurance Coverage by Age in Guntersville
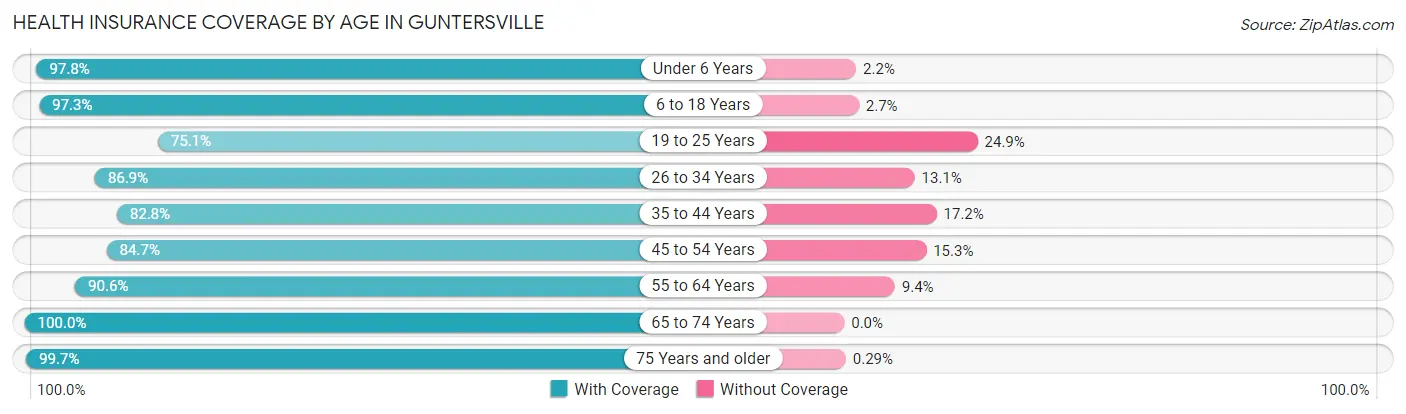
| Age Bracket | With Coverage | Without Coverage |
| Under 6 Years | 664 (97.8%) | 15 (2.2%) |
| 6 to 18 Years | 1,258 (97.3%) | 35 (2.7%) |
| 19 to 25 Years | 408 (75.1%) | 135 (24.9%) |
| 26 to 34 Years | 921 (86.9%) | 139 (13.1%) |
| 35 to 44 Years | 659 (82.8%) | 137 (17.2%) |
| 45 to 54 Years | 782 (84.7%) | 141 (15.3%) |
| 55 to 64 Years | 1,172 (90.6%) | 122 (9.4%) |
| 65 to 74 Years | 978 (100.0%) | 0 (0.0%) |
| 75 Years and older | 679 (99.7%) | 2 (0.3%) |
| Total | 7,521 (91.2%) | 726 (8.8%) |
Health Insurance Coverage by Citizenship Status in Guntersville
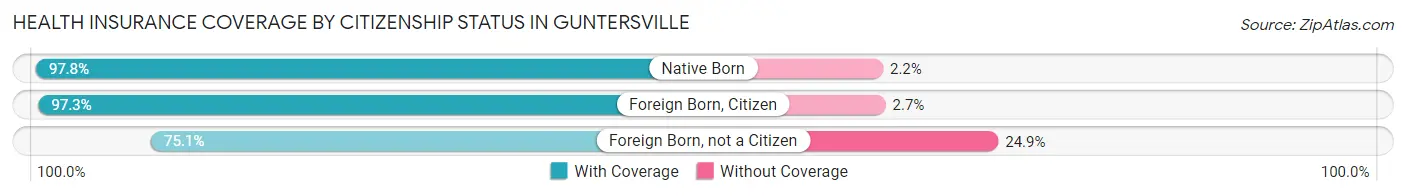
| Citizenship Status | With Coverage | Without Coverage |
| Native Born | 664 (97.8%) | 15 (2.2%) |
| Foreign Born, Citizen | 1,258 (97.3%) | 35 (2.7%) |
| Foreign Born, not a Citizen | 408 (75.1%) | 135 (24.9%) |
Health Insurance Coverage by Household Income in Guntersville
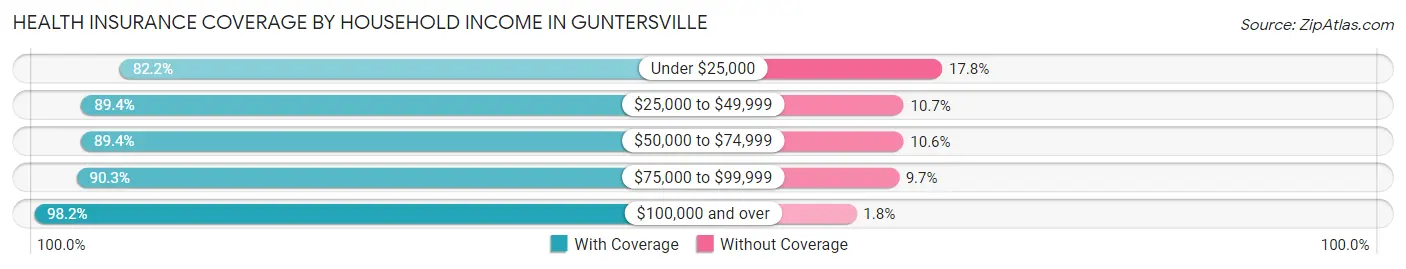
| Household Income | With Coverage | Without Coverage |
| Under $25,000 | 1,423 (82.2%) | 309 (17.8%) |
| $25,000 to $49,999 | 1,049 (89.3%) | 125 (10.6%) |
| $50,000 to $74,999 | 1,037 (89.4%) | 123 (10.6%) |
| $75,000 to $99,999 | 742 (90.3%) | 80 (9.7%) |
| $100,000 and over | 3,267 (98.2%) | 60 (1.8%) |
Public vs Private Health Insurance Coverage by Age in Guntersville
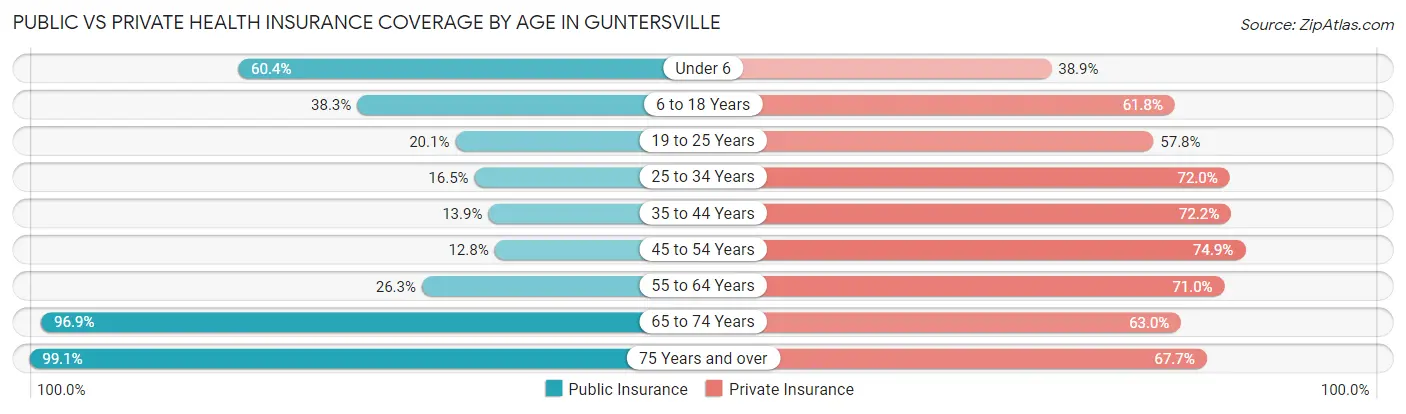
| Age Bracket | Public Insurance | Private Insurance |
| Under 6 | 410 (60.4%) | 264 (38.9%) |
| 6 to 18 Years | 495 (38.3%) | 799 (61.8%) |
| 19 to 25 Years | 109 (20.1%) | 314 (57.8%) |
| 25 to 34 Years | 175 (16.5%) | 763 (72.0%) |
| 35 to 44 Years | 111 (13.9%) | 575 (72.2%) |
| 45 to 54 Years | 118 (12.8%) | 691 (74.9%) |
| 55 to 64 Years | 340 (26.3%) | 919 (71.0%) |
| 65 to 74 Years | 948 (96.9%) | 616 (63.0%) |
| 75 Years and over | 675 (99.1%) | 461 (67.7%) |
| Total | 3,381 (41.0%) | 5,402 (65.5%) |
Disability Status by Sex by Age in Guntersville
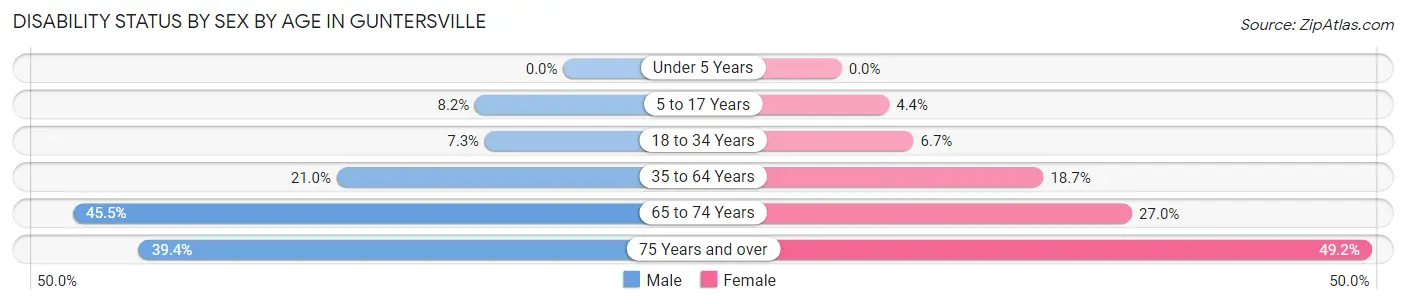
| Age Bracket | Male | Female |
| Under 5 Years | 0 (0.0%) | 0 (0.0%) |
| 5 to 17 Years | 60 (8.2%) | 23 (4.4%) |
| 18 to 34 Years | 65 (7.3%) | 55 (6.7%) |
| 35 to 64 Years | 319 (21.0%) | 280 (18.7%) |
| 65 to 74 Years | 217 (45.5%) | 135 (27.0%) |
| 75 Years and over | 104 (39.4%) | 205 (49.2%) |
Disability Class by Sex by Age in Guntersville
Disability Class: Hearing Difficulty
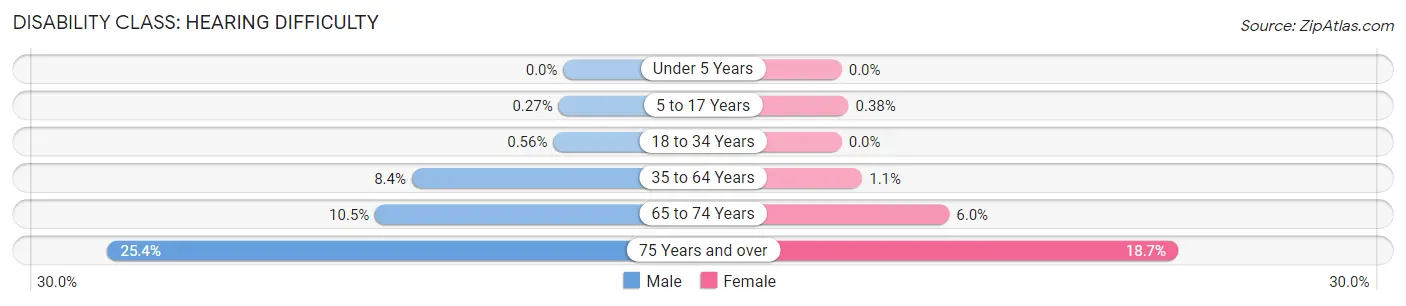
| Age Bracket | Male | Female |
| Under 5 Years | 0 (0.0%) | 0 (0.0%) |
| 5 to 17 Years | 2 (0.3%) | 2 (0.4%) |
| 18 to 34 Years | 5 (0.6%) | 0 (0.0%) |
| 35 to 64 Years | 128 (8.4%) | 17 (1.1%) |
| 65 to 74 Years | 50 (10.5%) | 30 (6.0%) |
| 75 Years and over | 67 (25.4%) | 78 (18.7%) |
Disability Class: Vision Difficulty
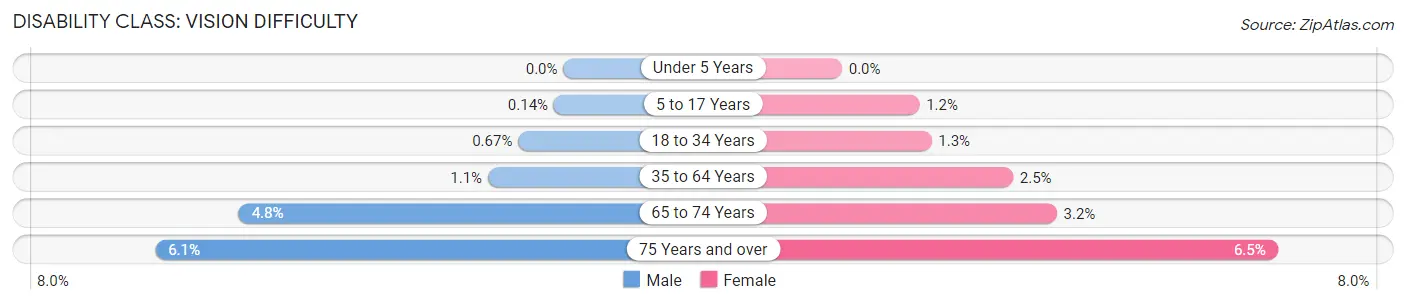
| Age Bracket | Male | Female |
| Under 5 Years | 0 (0.0%) | 0 (0.0%) |
| 5 to 17 Years | 1 (0.1%) | 6 (1.1%) |
| 18 to 34 Years | 6 (0.7%) | 11 (1.3%) |
| 35 to 64 Years | 17 (1.1%) | 38 (2.5%) |
| 65 to 74 Years | 23 (4.8%) | 16 (3.2%) |
| 75 Years and over | 16 (6.1%) | 27 (6.5%) |
Disability Class: Cognitive Difficulty
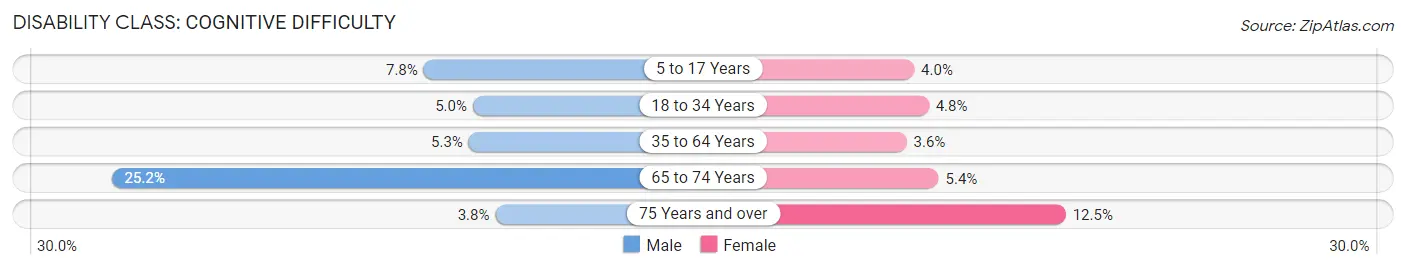
| Age Bracket | Male | Female |
| 5 to 17 Years | 57 (7.8%) | 21 (4.0%) |
| 18 to 34 Years | 45 (5.0%) | 40 (4.8%) |
| 35 to 64 Years | 80 (5.3%) | 54 (3.6%) |
| 65 to 74 Years | 120 (25.2%) | 27 (5.4%) |
| 75 Years and over | 10 (3.8%) | 52 (12.5%) |
Disability Class: Ambulatory Difficulty
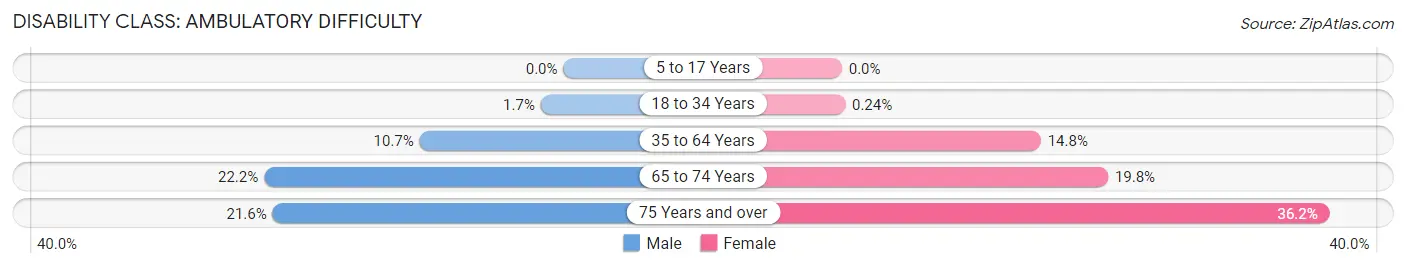
| Age Bracket | Male | Female |
| 5 to 17 Years | 0 (0.0%) | 0 (0.0%) |
| 18 to 34 Years | 15 (1.7%) | 2 (0.2%) |
| 35 to 64 Years | 162 (10.7%) | 221 (14.8%) |
| 65 to 74 Years | 106 (22.2%) | 99 (19.8%) |
| 75 Years and over | 57 (21.6%) | 151 (36.2%) |
Disability Class: Self-Care Difficulty
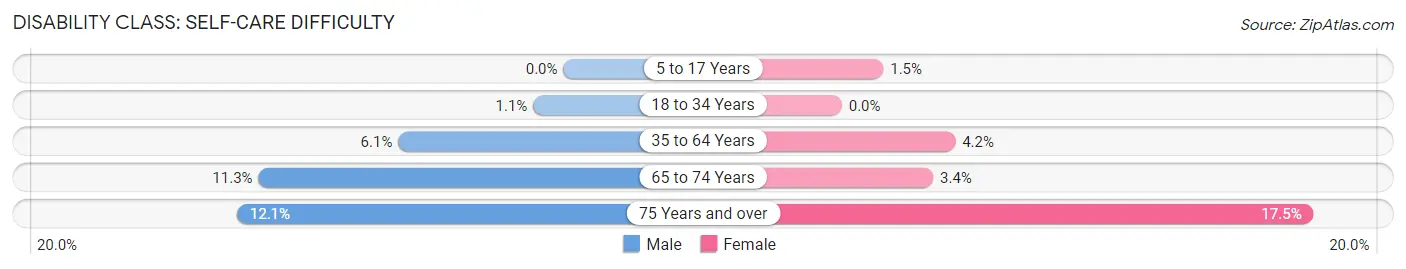
| Age Bracket | Male | Female |
| 5 to 17 Years | 0 (0.0%) | 8 (1.5%) |
| 18 to 34 Years | 10 (1.1%) | 0 (0.0%) |
| 35 to 64 Years | 93 (6.1%) | 63 (4.2%) |
| 65 to 74 Years | 54 (11.3%) | 17 (3.4%) |
| 75 Years and over | 32 (12.1%) | 73 (17.5%) |
Technology Access in Guntersville
Computing Device Access in Guntersville
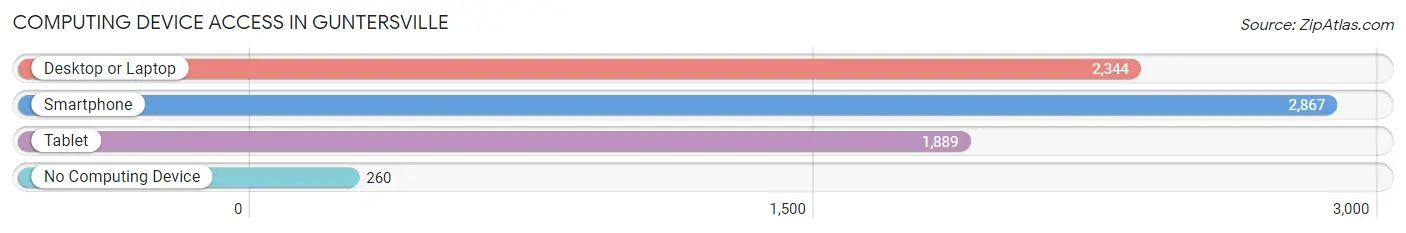
| Device Type | # Households | % Households |
| Desktop or Laptop | 2,344 | 69.7% |
| Smartphone | 2,867 | 85.2% |
| Tablet | 1,889 | 56.1% |
| No Computing Device | 260 | 7.7% |
| Total | 3,364 | 100.0% |
Internet Access in Guntersville
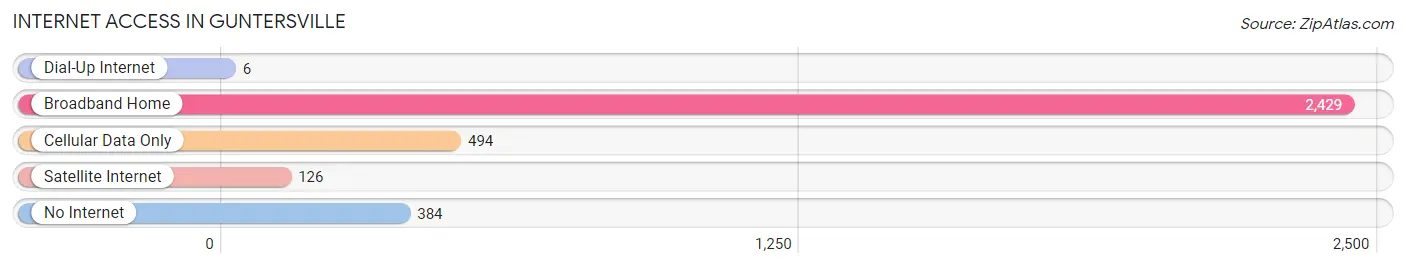
| Internet Type | # Households | % Households |
| Dial-Up Internet | 6 | 0.2% |
| Broadband Home | 2,429 | 72.2% |
| Cellular Data Only | 494 | 14.7% |
| Satellite Internet | 126 | 3.7% |
| No Internet | 384 | 11.4% |
| Total | 3,364 | 100.0% |
Guntersville Summary
Guntersville, Alabama is a city located in Marshall County, Alabama, United States. It is the county seat of Marshall County and is situated along the banks of the Tennessee River. The city is located in the foothills of the Appalachian Mountains and is part of the Huntsville-Decatur Combined Statistical Area. As of the 2010 census, the population of Guntersville was 8,197.
History
The area that is now Guntersville was originally inhabited by the Cherokee and Creek Native American tribes. The first European settlers arrived in the area in the early 19th century, and the town was officially founded in 1848. The town was named after John Gunter, a local landowner who donated the land for the town.
In the late 19th century, Guntersville became an important port on the Tennessee River. The town was also a major center for the production of cotton and other agricultural products. During the Civil War, the town was occupied by Union forces and served as a supply depot.
Geography
Guntersville is located at 34°20'N 86°17'W (34.33, -86.28). It is situated along the banks of the Tennessee River in the foothills of the Appalachian Mountains. The city has a total area of 11.2 square miles, of which 10.9 square miles is land and 0.3 square miles is water.
Economy
The economy of Guntersville is largely based on tourism and manufacturing. The city is home to several large manufacturing companies, including 3M, Honda, and Goodyear. Tourism is also an important part of the local economy, with the city being home to several popular attractions, including Lake Guntersville State Park, Guntersville Dam, and the Guntersville Museum and Cultural Center.
Demographics
As of the 2010 census, there were 8,197 people, 3,521 households, and 2,092 families residing in the city. The population density was 751.2 people per square mile. The racial makeup of the city was 81.2% White, 15.2% African American, 0.4% Native American, 0.7% Asian, 0.1% Pacific Islander, 1.2% from other races, and 1.2% from two or more races. Hispanic or Latino of any race were 3.2% of the population.
The median income for a household in the city was $35,938, and the median income for a family was $45,938. The per capita income for the city was $20,938. About 14.2% of families and 17.2% of the population were below the poverty line, including 25.2% of those under age 18 and 11.2% of those age 65 or over.
Common Questions
What is Per Capita Income in Guntersville?
Per Capita income in Guntersville is $37,110.
What is the Median Family Income in Guntersville?
Median Family Income in Guntersville is $86,204.
What is the Median Household income in Guntersville?
Median Household Income in Guntersville is $61,453.
What is Income or Wage Gap in Guntersville?
Income or Wage Gap in Guntersville is 44.6%.
Women in Guntersville earn 55.4 cents for every dollar earned by a man.
What is Family Income Deficit in Guntersville?
Family Income Deficit in Guntersville is $14,849.
Families that are below poverty line in Guntersville earn $14,849 less on average than the poverty threshold level.
What is Inequality or Gini Index in Guntersville?
Inequality or Gini Index in Guntersville is 0.51.
What is the Total Population of Guntersville?
Total Population of Guntersville is 8,644.
What is the Total Male Population of Guntersville?
Total Male Population of Guntersville is 4,409.
What is the Total Female Population of Guntersville?
Total Female Population of Guntersville is 4,235.
What is the Ratio of Males per 100 Females in Guntersville?
There are 104.11 Males per 100 Females in Guntersville.
What is the Ratio of Females per 100 Males in Guntersville?
There are 96.05 Females per 100 Males in Guntersville.
What is the Median Population Age in Guntersville?
Median Population Age in Guntersville is 43.2 Years.
What is the Average Family Size in Guntersville
Average Family Size in Guntersville is 3.0 People.
What is the Average Household Size in Guntersville
Average Household Size in Guntersville is 2.4 People.
How Large is the Labor Force in Guntersville?
There are 3,386 People in the Labor Forcein in Guntersville.
What is the Percentage of People in the Labor Force in Guntersville?
48.4% of People are in the Labor Force in Guntersville.
What is the Unemployment Rate in Guntersville?
Unemployment Rate in Guntersville is 3.7%.