Hartselle, AL Map & Demographics
Hartselle Map
Hartselle Overview
$33,007
PER CAPITA INCOME
$89,781
AVG FAMILY INCOME
$64,876
AVG HOUSEHOLD INCOME
45.7%
WAGE / INCOME GAP [ % ]
54.3¢/ $1
WAGE / INCOME GAP [ $ ]
$9,742
FAMILY INCOME DEFICIT
0.43
INEQUALITY / GINI INDEX
15,414
TOTAL POPULATION
6,923
MALE POPULATION
8,491
FEMALE POPULATION
81.53
MALES / 100 FEMALES
122.65
FEMALES / 100 MALES
39.6
MEDIAN AGE
3.2
AVG FAMILY SIZE
2.6
AVG HOUSEHOLD SIZE
7,276
LABOR FORCE [ PEOPLE ]
59.2%
PERCENT IN LABOR FORCE
3.9%
UNEMPLOYMENT RATE
Hartselle Zip Codes
Hartselle Area Codes
Income in Hartselle
Income Overview in Hartselle
Per Capita Income in Hartselle is $33,007, while median incomes of families and households are $89,781 and $64,876 respectively.
| Characteristic | Number | Measure |
| Per Capita Income | 15,414 | $33,007 |
| Median Family Income | 4,212 | $89,781 |
| Mean Family Income | 4,212 | $100,026 |
| Median Household Income | 5,825 | $64,876 |
| Mean Household Income | 5,825 | $84,409 |
| Income Deficit | 4,212 | $9,742 |
| Wage / Income Gap (%) | 15,414 | 45.66% |
| Wage / Income Gap ($) | 15,414 | 54.34¢ per $1 |
| Gini / Inequality Index | 15,414 | 0.43 |
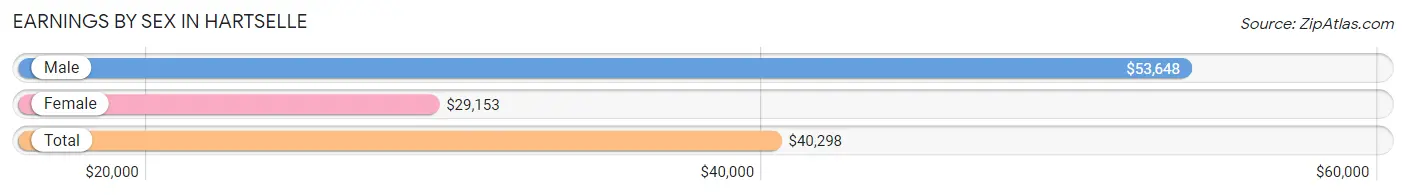
Earnings by Sex in Hartselle
Average Earnings in Hartselle are $40,298, $53,648 for men and $29,153 for women, a difference of 45.7%.
| Sex | Number | Average Earnings |
| Male | 3,441 (45.8%) | $53,648 |
| Female | 4,074 (54.2%) | $29,153 |
| Total | 7,515 (100.0%) | $40,298 |
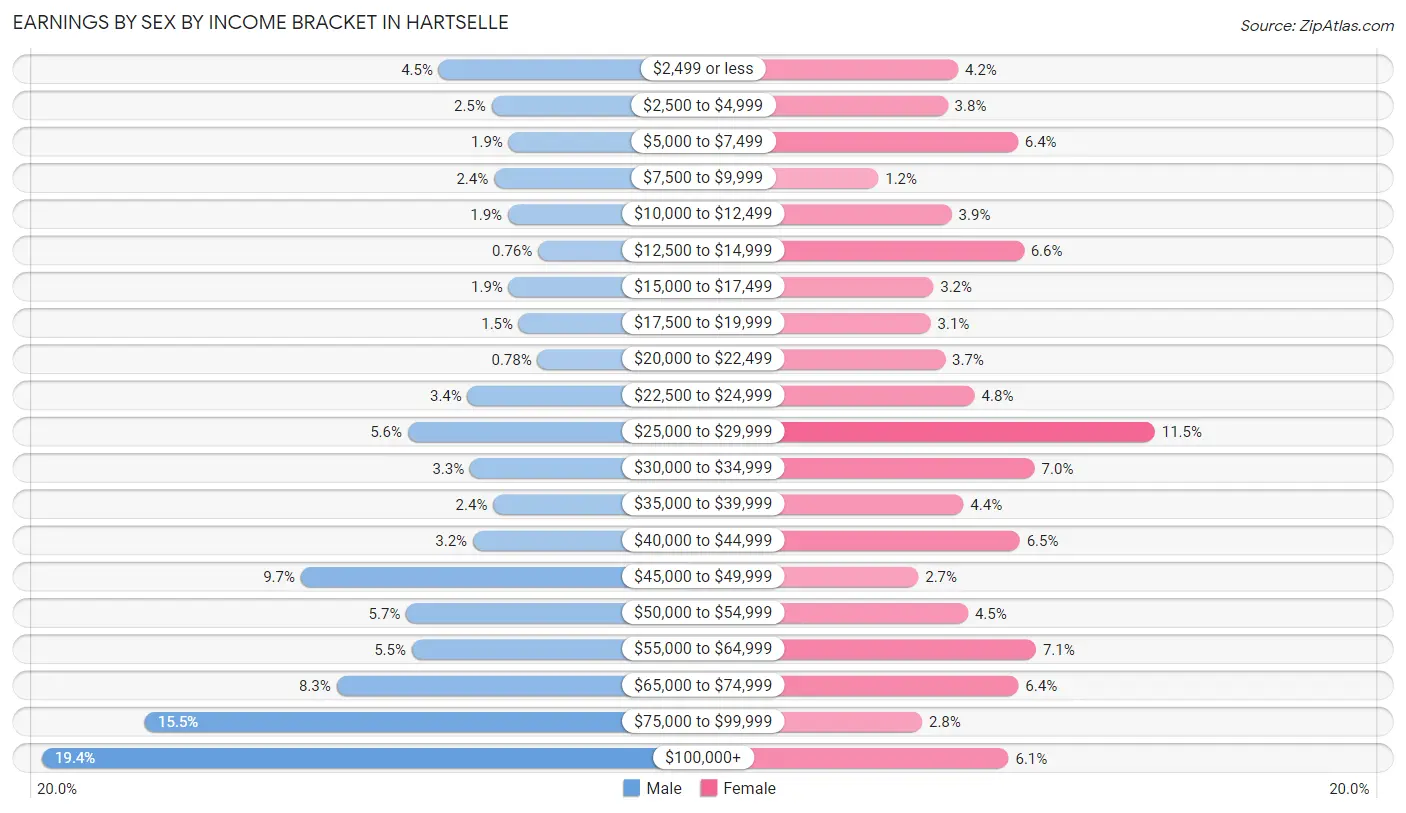
Earnings by Sex by Income Bracket in Hartselle
The most common earnings brackets in Hartselle are $100,000+ for men (666 | 19.4%) and $25,000 to $29,999 for women (470 | 11.5%).
| Income | Male | Female |
| $2,499 or less | 154 (4.5%) | 170 (4.2%) |
| $2,500 to $4,999 | 86 (2.5%) | 154 (3.8%) |
| $5,000 to $7,499 | 64 (1.9%) | 261 (6.4%) |
| $7,500 to $9,999 | 83 (2.4%) | 48 (1.2%) |
| $10,000 to $12,499 | 65 (1.9%) | 160 (3.9%) |
| $12,500 to $14,999 | 26 (0.8%) | 270 (6.6%) |
| $15,000 to $17,499 | 64 (1.9%) | 132 (3.2%) |
| $17,500 to $19,999 | 51 (1.5%) | 128 (3.1%) |
| $20,000 to $22,499 | 27 (0.8%) | 150 (3.7%) |
| $22,500 to $24,999 | 117 (3.4%) | 195 (4.8%) |
| $25,000 to $29,999 | 194 (5.6%) | 470 (11.5%) |
| $30,000 to $34,999 | 114 (3.3%) | 287 (7.0%) |
| $35,000 to $39,999 | 84 (2.4%) | 178 (4.4%) |
| $40,000 to $44,999 | 110 (3.2%) | 264 (6.5%) |
| $45,000 to $49,999 | 332 (9.7%) | 109 (2.7%) |
| $50,000 to $54,999 | 196 (5.7%) | 185 (4.5%) |
| $55,000 to $64,999 | 189 (5.5%) | 289 (7.1%) |
| $65,000 to $74,999 | 286 (8.3%) | 262 (6.4%) |
| $75,000 to $99,999 | 533 (15.5%) | 115 (2.8%) |
| $100,000+ | 666 (19.4%) | 247 (6.1%) |
| Total | 3,441 (100.0%) | 4,074 (100.0%) |
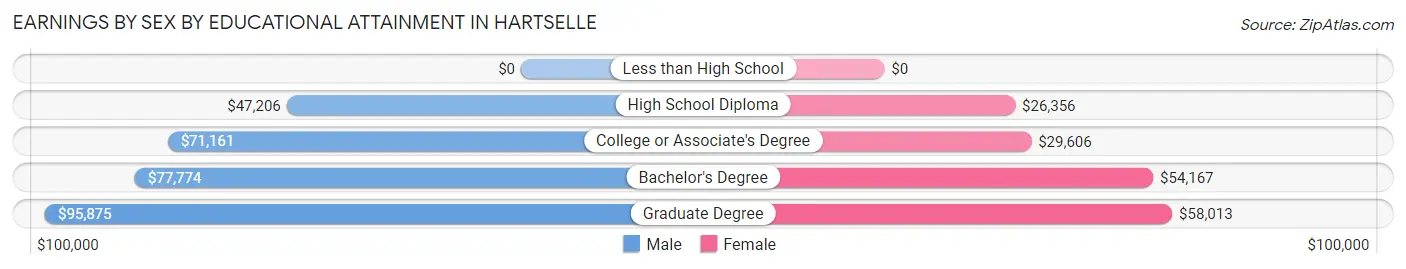
Earnings by Sex by Educational Attainment in Hartselle
Average earnings in Hartselle are $66,822 for men and $32,524 for women, a difference of 51.3%. Men with an educational attainment of graduate degree enjoy the highest average annual earnings of $95,875, while those with high school diploma education earn the least with $47,206. Women with an educational attainment of graduate degree earn the most with the average annual earnings of $58,013, while those with high school diploma education have the smallest earnings of $26,356.
| Educational Attainment | Male Income | Female Income |
| Less than High School | - | - |
| High School Diploma | $47,206 | $26,356 |
| College or Associate's Degree | $71,161 | $29,606 |
| Bachelor's Degree | $77,774 | $54,167 |
| Graduate Degree | $95,875 | $58,013 |
| Total | $66,822 | $32,524 |
Family Income in Hartselle
Family Income Brackets in Hartselle
According to the Hartselle family income data, there are 1,015 families falling into the $100,000 to $149,999 income range, which is the most common income bracket and makes up 24.1% of all families. Conversely, the $10,000 to $14,999 income bracket is the least frequent group with only 93 families (2.2%) belonging to this category.
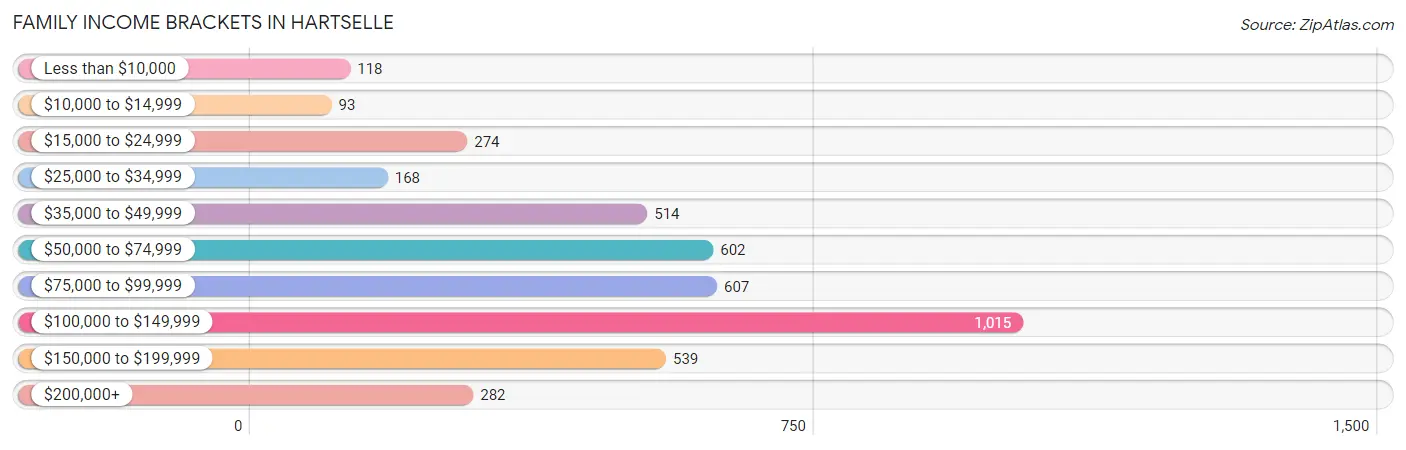
| Income Bracket | # Families | % Families |
| Less than $10,000 | 118 | 2.8% |
| $10,000 to $14,999 | 93 | 2.2% |
| $15,000 to $24,999 | 274 | 6.5% |
| $25,000 to $34,999 | 168 | 4.0% |
| $35,000 to $49,999 | 514 | 12.2% |
| $50,000 to $74,999 | 602 | 14.3% |
| $75,000 to $99,999 | 607 | 14.4% |
| $100,000 to $149,999 | 1,015 | 24.1% |
| $150,000 to $199,999 | 539 | 12.8% |
| $200,000+ | 282 | 6.7% |
Family Income by Famaliy Size in Hartselle
4-person families (742 | 17.6%) account for the highest median family income in Hartselle with $138,462 per family, while 3-person families (680 | 16.1%) have the highest median income of $35,104 per family member.
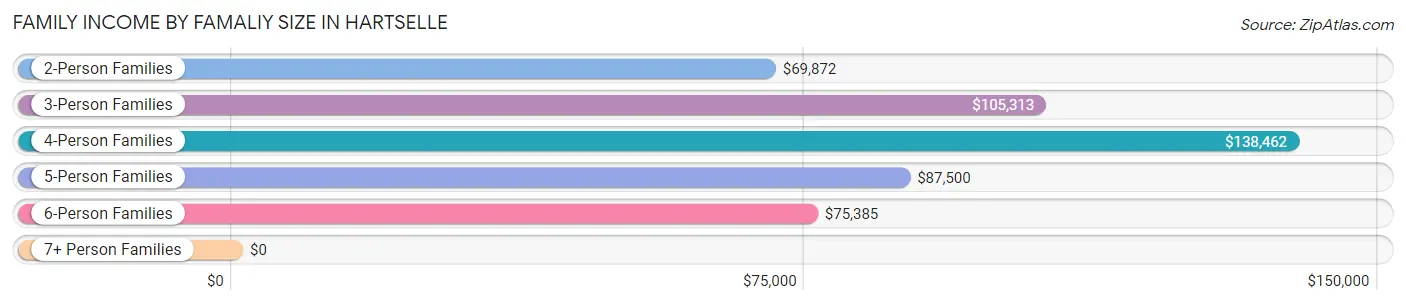
| Income Bracket | # Families | Median Income |
| 2-Person Families | 2,195 (52.1%) | $69,872 |
| 3-Person Families | 680 (16.1%) | $105,313 |
| 4-Person Families | 742 (17.6%) | $138,462 |
| 5-Person Families | 468 (11.1%) | $87,500 |
| 6-Person Families | 74 (1.8%) | $75,385 |
| 7+ Person Families | 53 (1.3%) | $0 |
| Total | 4,212 (100.0%) | $89,781 |
Family Income by Number of Earners in Hartselle
The median family income in Hartselle is $89,781, with families comprising 3+ earners (425) having the highest median family income of $153,795, while families with no earners (721) have the lowest median family income of $54,034, accounting for 10.1% and 17.1% of families, respectively.
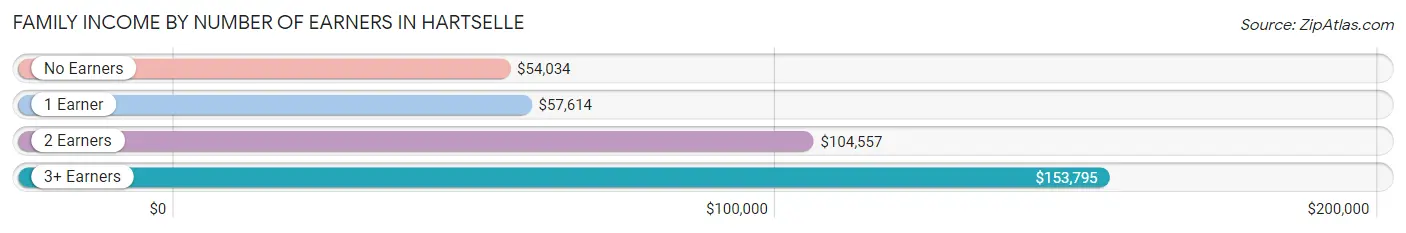
| Number of Earners | # Families | Median Income |
| No Earners | 721 (17.1%) | $54,034 |
| 1 Earner | 1,159 (27.5%) | $57,614 |
| 2 Earners | 1,907 (45.3%) | $104,557 |
| 3+ Earners | 425 (10.1%) | $153,795 |
| Total | 4,212 (100.0%) | $89,781 |
Household Income in Hartselle
Household Income Brackets in Hartselle
With 1,171 households falling in the category, the $100,000 to $149,999 income range is the most frequent in Hartselle, accounting for 20.1% of all households. In contrast, only 291 households (5.0%) fall into the $200,000+ income bracket, making it the least populous group.
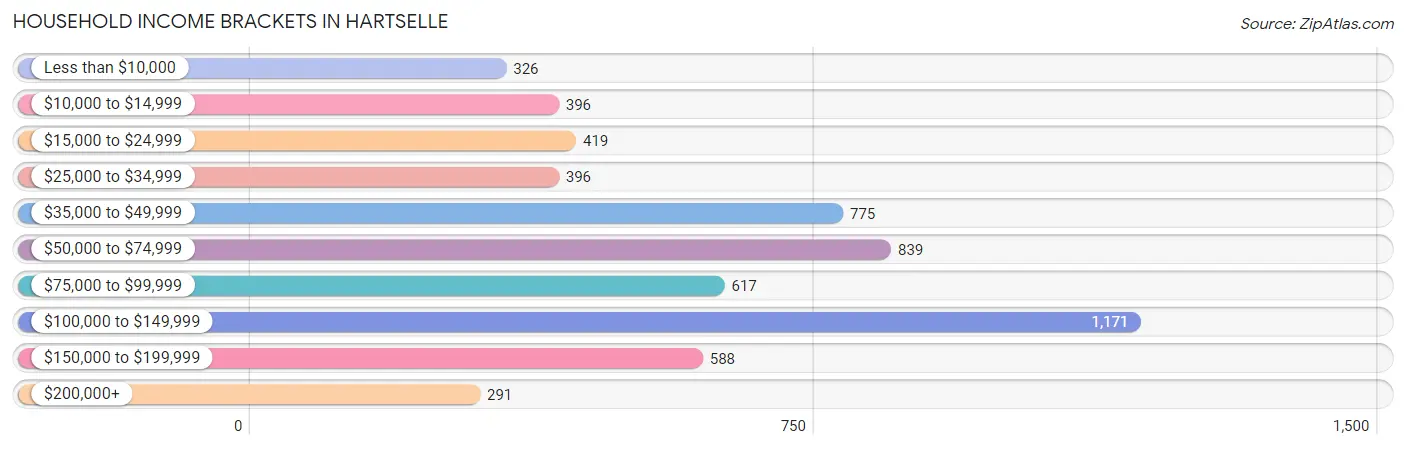
| Income Bracket | # Households | % Households |
| Less than $10,000 | 326 | 5.6% |
| $10,000 to $14,999 | 396 | 6.8% |
| $15,000 to $24,999 | 419 | 7.2% |
| $25,000 to $34,999 | 396 | 6.8% |
| $35,000 to $49,999 | 775 | 13.3% |
| $50,000 to $74,999 | 839 | 14.4% |
| $75,000 to $99,999 | 617 | 10.6% |
| $100,000 to $149,999 | 1,171 | 20.1% |
| $150,000 to $199,999 | 588 | 10.1% |
| $200,000+ | 291 | 5.0% |
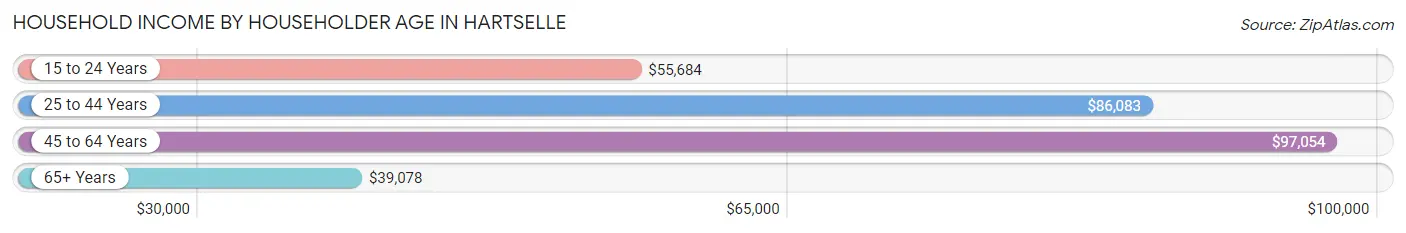
Household Income by Householder Age in Hartselle
The median household income in Hartselle is $64,876, with the highest median household income of $97,054 found in the 45 to 64 years age bracket for the primary householder. A total of 2,348 households (40.3%) fall into this category. Meanwhile, the 65+ years age bracket for the primary householder has the lowest median household income of $39,078, with 1,764 households (30.3%) in this group.
| Income Bracket | # Households | Median Income |
| 15 to 24 Years | 251 (4.3%) | $55,684 |
| 25 to 44 Years | 1,462 (25.1%) | $86,083 |
| 45 to 64 Years | 2,348 (40.3%) | $97,054 |
| 65+ Years | 1,764 (30.3%) | $39,078 |
| Total | 5,825 (100.0%) | $64,876 |
Poverty in Hartselle
Income Below Poverty by Sex and Age in Hartselle
With 9.0% poverty level for males and 16.1% for females among the residents of Hartselle, under 5 year old males and 16 and 17 year old females are the most vulnerable to poverty, with 106 males (21.8%) and 162 females (56.1%) in their respective age groups living below the poverty level.
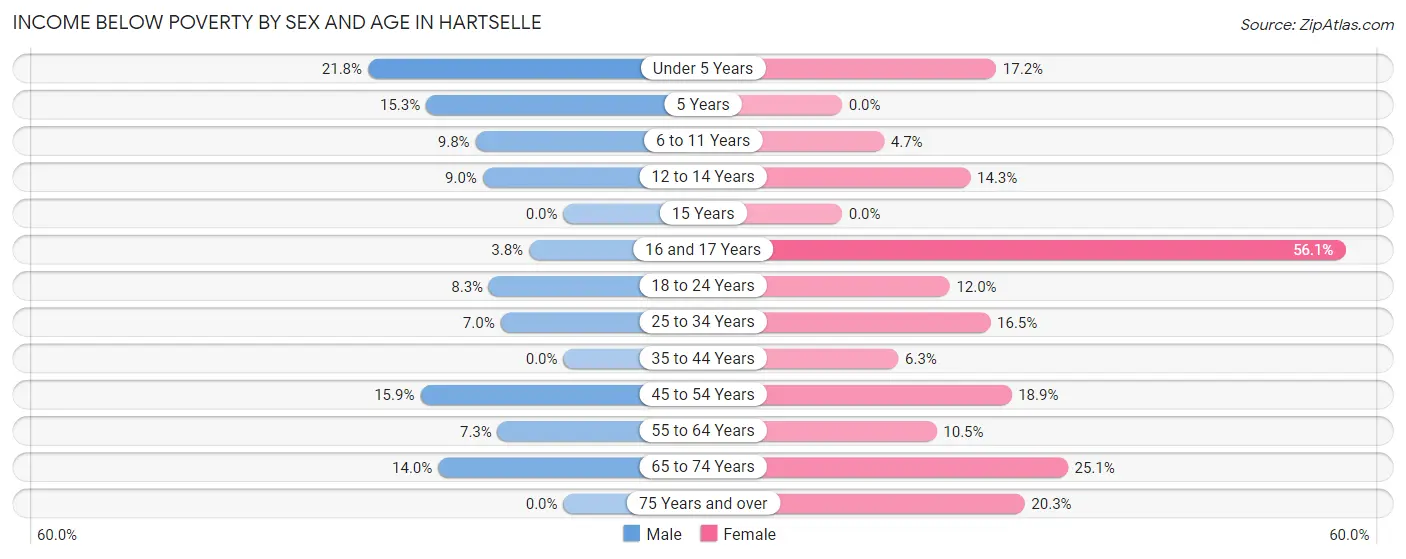
| Age Bracket | Male | Female |
| Under 5 Years | 106 (21.8%) | 75 (17.2%) |
| 5 Years | 13 (15.3%) | 0 (0.0%) |
| 6 to 11 Years | 80 (9.8%) | 24 (4.7%) |
| 12 to 14 Years | 23 (9.0%) | 32 (14.3%) |
| 15 Years | 0 (0.0%) | 0 (0.0%) |
| 16 and 17 Years | 8 (3.8%) | 162 (56.1%) |
| 18 to 24 Years | 58 (8.3%) | 82 (12.0%) |
| 25 to 34 Years | 47 (7.0%) | 191 (16.5%) |
| 35 to 44 Years | 0 (0.0%) | 71 (6.3%) |
| 45 to 54 Years | 135 (15.9%) | 237 (18.9%) |
| 55 to 64 Years | 65 (7.3%) | 110 (10.5%) |
| 65 to 74 Years | 88 (14.0%) | 227 (25.1%) |
| 75 Years and over | 0 (0.0%) | 154 (20.3%) |
| Total | 623 (9.0%) | 1,365 (16.1%) |
Income Above Poverty by Sex and Age in Hartselle
According to the poverty statistics in Hartselle, males aged 15 years and females aged 5 years are the age groups that are most secure financially, with 100.0% of males and 100.0% of females in these age groups living above the poverty line.
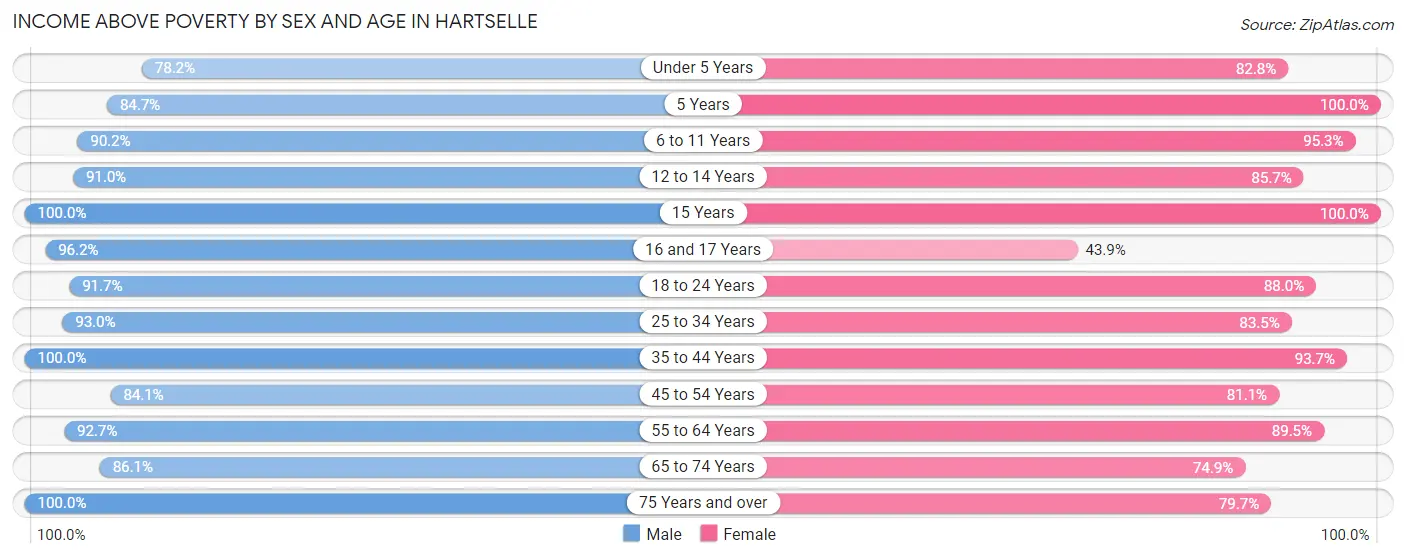
| Age Bracket | Male | Female |
| Under 5 Years | 381 (78.2%) | 362 (82.8%) |
| 5 Years | 72 (84.7%) | 29 (100.0%) |
| 6 to 11 Years | 737 (90.2%) | 489 (95.3%) |
| 12 to 14 Years | 233 (91.0%) | 192 (85.7%) |
| 15 Years | 203 (100.0%) | 43 (100.0%) |
| 16 and 17 Years | 201 (96.2%) | 127 (43.9%) |
| 18 to 24 Years | 642 (91.7%) | 602 (88.0%) |
| 25 to 34 Years | 624 (93.0%) | 965 (83.5%) |
| 35 to 44 Years | 672 (100.0%) | 1,062 (93.7%) |
| 45 to 54 Years | 712 (84.1%) | 1,019 (81.1%) |
| 55 to 64 Years | 823 (92.7%) | 935 (89.5%) |
| 65 to 74 Years | 543 (86.1%) | 676 (74.9%) |
| 75 Years and over | 438 (100.0%) | 603 (79.7%) |
| Total | 6,281 (91.0%) | 7,104 (83.9%) |
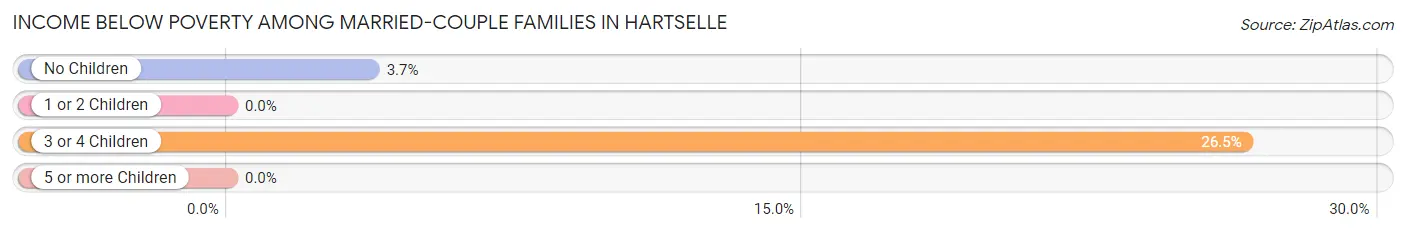
Income Below Poverty Among Married-Couple Families in Hartselle
The poverty statistics for married-couple families in Hartselle show that 5.6% or 175 of the total 3,155 families live below the poverty line. Families with 3 or 4 children have the highest poverty rate of 26.5%, comprising of 109 families. On the other hand, families with 1 or 2 children have the lowest poverty rate of 0.0%, which includes 0 families.
| Children | Above Poverty | Below Poverty |
| No Children | 1,716 (96.3%) | 66 (3.7%) |
| 1 or 2 Children | 947 (100.0%) | 0 (0.0%) |
| 3 or 4 Children | 302 (73.5%) | 109 (26.5%) |
| 5 or more Children | 15 (100.0%) | 0 (0.0%) |
| Total | 2,980 (94.5%) | 175 (5.6%) |
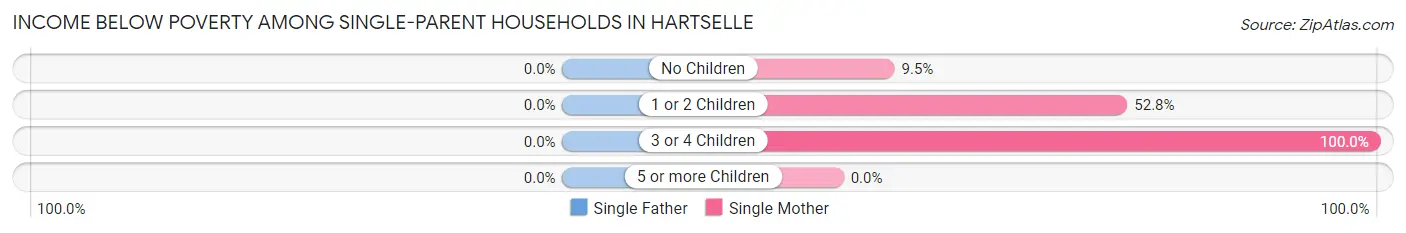
Income Below Poverty Among Single-Parent Households in Hartselle
| Children | Single Father | Single Mother |
| No Children | 0 (0.0%) | 41 (9.5%) |
| 1 or 2 Children | 0 (0.0%) | 205 (52.8%) |
| 3 or 4 Children | 0 (0.0%) | 19 (100.0%) |
| 5 or more Children | 0 (0.0%) | 0 (0.0%) |
| Total | 0 (0.0%) | 265 (31.6%) |
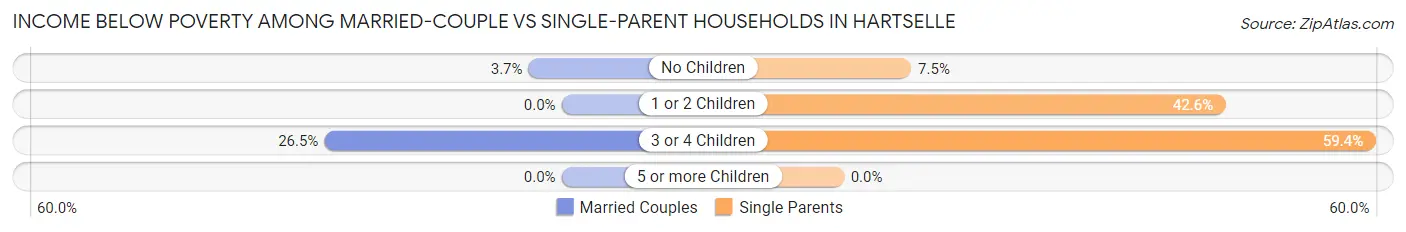
Income Below Poverty Among Married-Couple vs Single-Parent Households in Hartselle
The poverty data for Hartselle shows that 175 of the married-couple family households (5.6%) and 265 of the single-parent households (25.1%) are living below the poverty level. Within the married-couple family households, those with 3 or 4 children have the highest poverty rate, with 109 households (26.5%) falling below the poverty line. Among the single-parent households, those with 3 or 4 children have the highest poverty rate, with 19 household (59.4%) living below poverty.
| Children | Married-Couple Families | Single-Parent Households |
| No Children | 66 (3.7%) | 41 (7.5%) |
| 1 or 2 Children | 0 (0.0%) | 205 (42.6%) |
| 3 or 4 Children | 109 (26.5%) | 19 (59.4%) |
| 5 or more Children | 0 (0.0%) | 0 (0.0%) |
| Total | 175 (5.6%) | 265 (25.1%) |
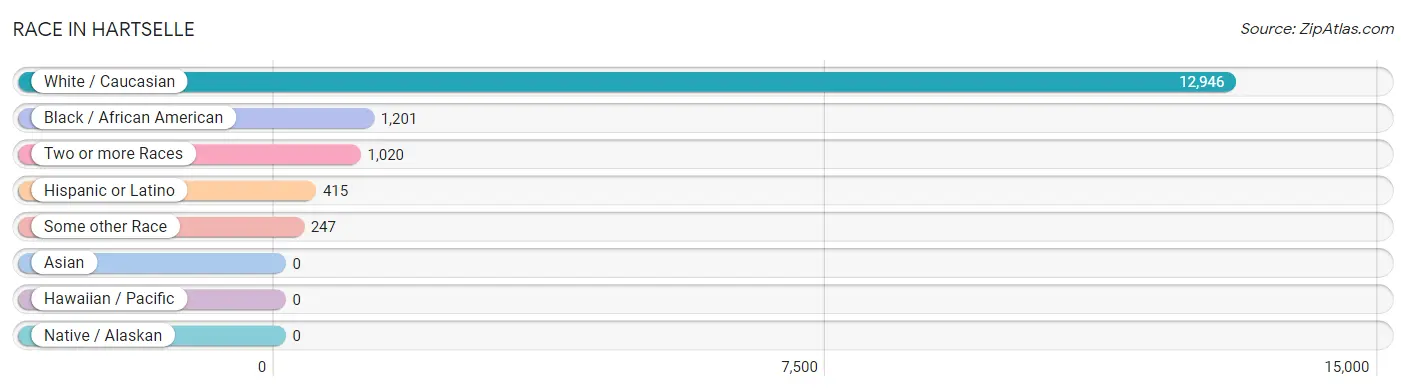
Race in Hartselle
The most populous races in Hartselle are White / Caucasian (12,946 | 84.0%), Black / African American (1,201 | 7.8%), and Two or more Races (1,020 | 6.6%).
| Race | # Population | % Population |
| Asian | 0 | 0.0% |
| Black / African American | 1,201 | 7.8% |
| Hawaiian / Pacific | 0 | 0.0% |
| Hispanic or Latino | 415 | 2.7% |
| Native / Alaskan | 0 | 0.0% |
| White / Caucasian | 12,946 | 84.0% |
| Two or more Races | 1,020 | 6.6% |
| Some other Race | 247 | 1.6% |
| Total | 15,414 | 100.0% |
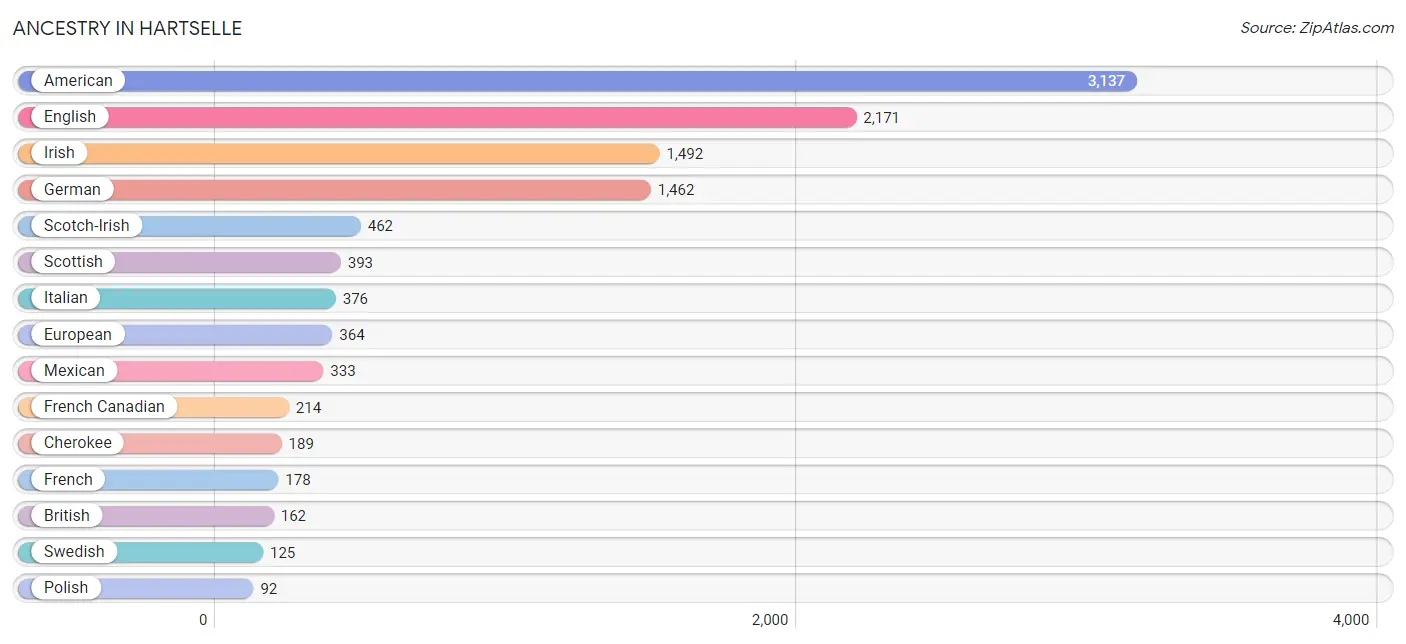
Ancestry in Hartselle
The most populous ancestries reported in Hartselle are American (3,137 | 20.3%), English (2,171 | 14.1%), Irish (1,492 | 9.7%), German (1,462 | 9.5%), and Scotch-Irish (462 | 3.0%), together accounting for 56.6% of all Hartselle residents.
| Ancestry | # Population | % Population |
| African | 18 | 0.1% |
| American | 3,137 | 20.3% |
| Apache | 34 | 0.2% |
| Blackfeet | 41 | 0.3% |
| British | 162 | 1.1% |
| Burmese | 59 | 0.4% |
| Central American | 43 | 0.3% |
| Cherokee | 189 | 1.2% |
| Cuban | 1 | 0.0% |
| Czech | 49 | 0.3% |
| Danish | 33 | 0.2% |
| Dutch | 39 | 0.3% |
| Dutch West Indian | 9 | 0.1% |
| English | 2,171 | 14.1% |
| European | 364 | 2.4% |
| French | 178 | 1.1% |
| French Canadian | 214 | 1.4% |
| German | 1,462 | 9.5% |
| Greek | 18 | 0.1% |
| Guatemalan | 43 | 0.3% |
| Indian (Asian) | 17 | 0.1% |
| Irish | 1,492 | 9.7% |
| Israeli | 18 | 0.1% |
| Italian | 376 | 2.4% |
| Korean | 84 | 0.5% |
| Mexican | 333 | 2.2% |
| Nigerian | 28 | 0.2% |
| Northern European | 11 | 0.1% |
| Norwegian | 52 | 0.3% |
| Polish | 92 | 0.6% |
| Portuguese | 16 | 0.1% |
| Puerto Rican | 18 | 0.1% |
| Russian | 16 | 0.1% |
| Samoan | 56 | 0.4% |
| Scandinavian | 21 | 0.1% |
| Scotch-Irish | 462 | 3.0% |
| Scottish | 393 | 2.5% |
| Subsaharan African | 46 | 0.3% |
| Swedish | 125 | 0.8% |
| Welsh | 54 | 0.4% | View All 40 Rows |
Immigrants in Hartselle
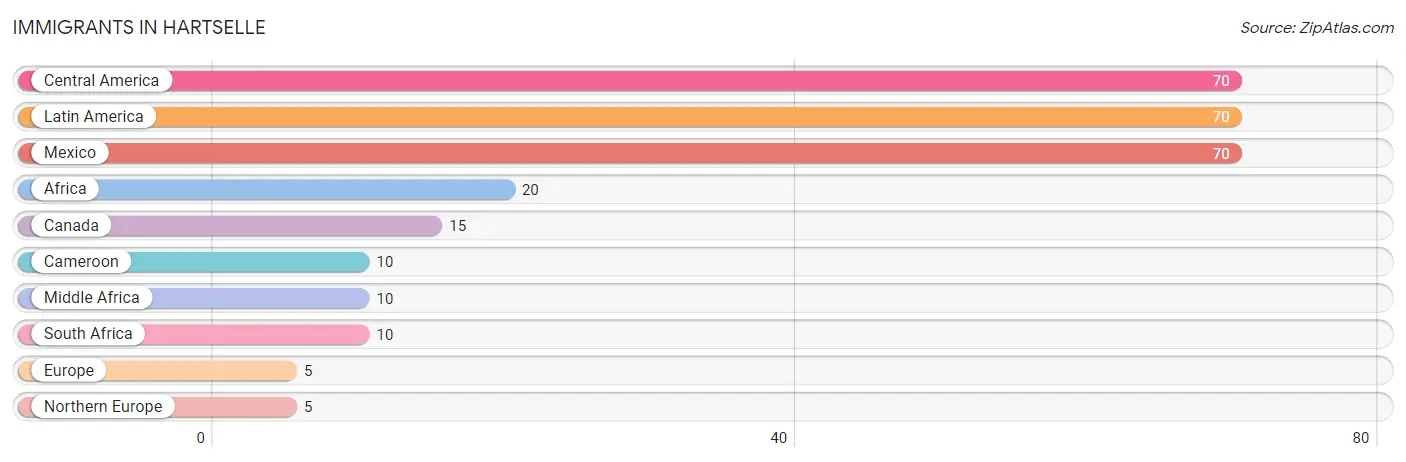
The most numerous immigrant groups reported in Hartselle came from Central America (70 | 0.4%), Latin America (70 | 0.4%), Mexico (70 | 0.4%), Africa (20 | 0.1%), and Canada (15 | 0.1%), together accounting for 1.6% of all Hartselle residents.
| Immigration Origin | # Population | % Population |
| Africa | 20 | 0.1% |
| Cameroon | 10 | 0.1% |
| Canada | 15 | 0.1% |
| Central America | 70 | 0.4% |
| Europe | 5 | 0.0% |
| Latin America | 70 | 0.4% |
| Mexico | 70 | 0.4% |
| Middle Africa | 10 | 0.1% |
| Northern Europe | 5 | 0.0% |
| South Africa | 10 | 0.1% | View All 10 Rows |
Sex and Age in Hartselle
Sex and Age in Hartselle
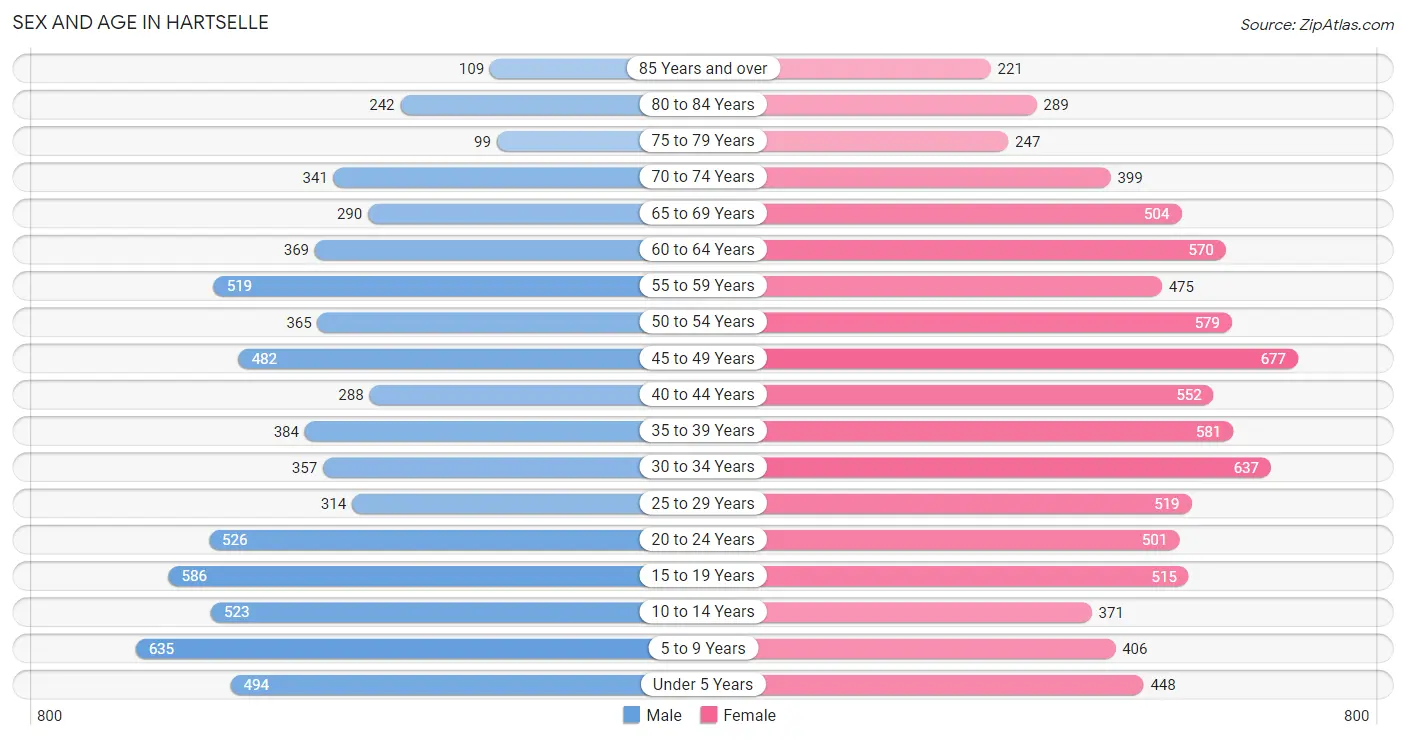
The most populous age groups in Hartselle are 5 to 9 Years (635 | 9.2%) for men and 45 to 49 Years (677 | 8.0%) for women.
| Age Bracket | Male | Female |
| Under 5 Years | 494 (7.1%) | 448 (5.3%) |
| 5 to 9 Years | 635 (9.2%) | 406 (4.8%) |
| 10 to 14 Years | 523 (7.5%) | 371 (4.4%) |
| 15 to 19 Years | 586 (8.5%) | 515 (6.1%) |
| 20 to 24 Years | 526 (7.6%) | 501 (5.9%) |
| 25 to 29 Years | 314 (4.5%) | 519 (6.1%) |
| 30 to 34 Years | 357 (5.2%) | 637 (7.5%) |
| 35 to 39 Years | 384 (5.6%) | 581 (6.8%) |
| 40 to 44 Years | 288 (4.2%) | 552 (6.5%) |
| 45 to 49 Years | 482 (7.0%) | 677 (8.0%) |
| 50 to 54 Years | 365 (5.3%) | 579 (6.8%) |
| 55 to 59 Years | 519 (7.5%) | 475 (5.6%) |
| 60 to 64 Years | 369 (5.3%) | 570 (6.7%) |
| 65 to 69 Years | 290 (4.2%) | 504 (5.9%) |
| 70 to 74 Years | 341 (4.9%) | 399 (4.7%) |
| 75 to 79 Years | 99 (1.4%) | 247 (2.9%) |
| 80 to 84 Years | 242 (3.5%) | 289 (3.4%) |
| 85 Years and over | 109 (1.6%) | 221 (2.6%) |
| Total | 6,923 (100.0%) | 8,491 (100.0%) |
Families and Households in Hartselle
Median Family Size in Hartselle
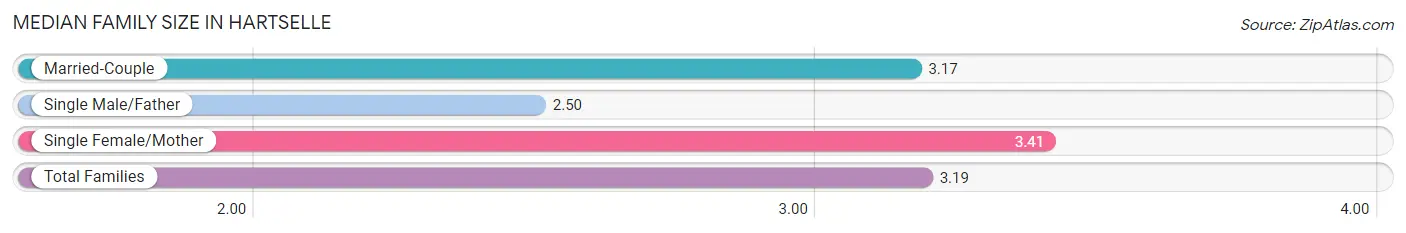
The median family size in Hartselle is 3.19 persons per family, with single female/mother families (839 | 19.9%) accounting for the largest median family size of 3.41 persons per family. On the other hand, single male/father families (218 | 5.2%) represent the smallest median family size with 2.50 persons per family.
| Family Type | # Families | Family Size |
| Married-Couple | 3,155 (74.9%) | 3.17 |
| Single Male/Father | 218 (5.2%) | 2.50 |
| Single Female/Mother | 839 (19.9%) | 3.41 |
| Total Families | 4,212 (100.0%) | 3.19 |
Median Household Size in Hartselle
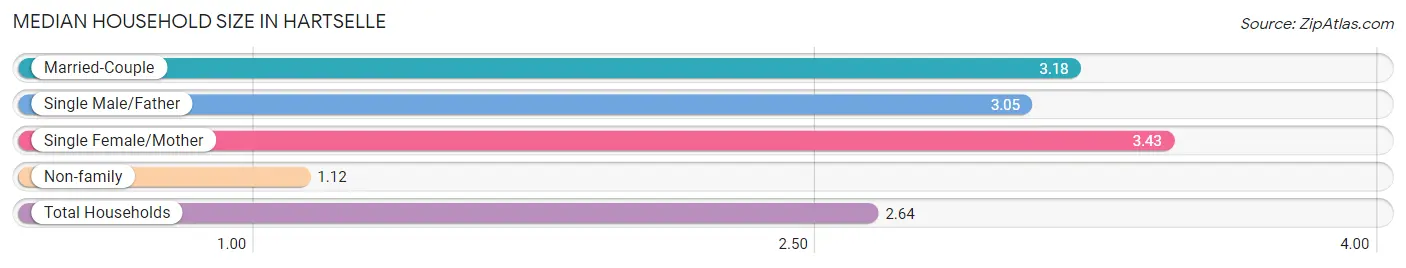
The median household size in Hartselle is 2.64 persons per household, with single female/mother households (839 | 14.4%) accounting for the largest median household size of 3.43 persons per household. non-family households (1,613 | 27.7%) represent the smallest median household size with 1.12 persons per household.
| Household Type | # Households | Household Size |
| Married-Couple | 3,155 (54.2%) | 3.18 |
| Single Male/Father | 218 (3.7%) | 3.05 |
| Single Female/Mother | 839 (14.4%) | 3.43 |
| Non-family | 1,613 (27.7%) | 1.12 |
| Total Households | 5,825 (100.0%) | 2.64 |
Household Size by Marriage Status in Hartselle
Out of a total of 5,825 households in Hartselle, 4,212 (72.3%) are family households, while 1,613 (27.7%) are nonfamily households. The most numerous type of family households are 2-person households, comprising 2,115, and the most common type of nonfamily households are 1-person households, comprising 1,430.
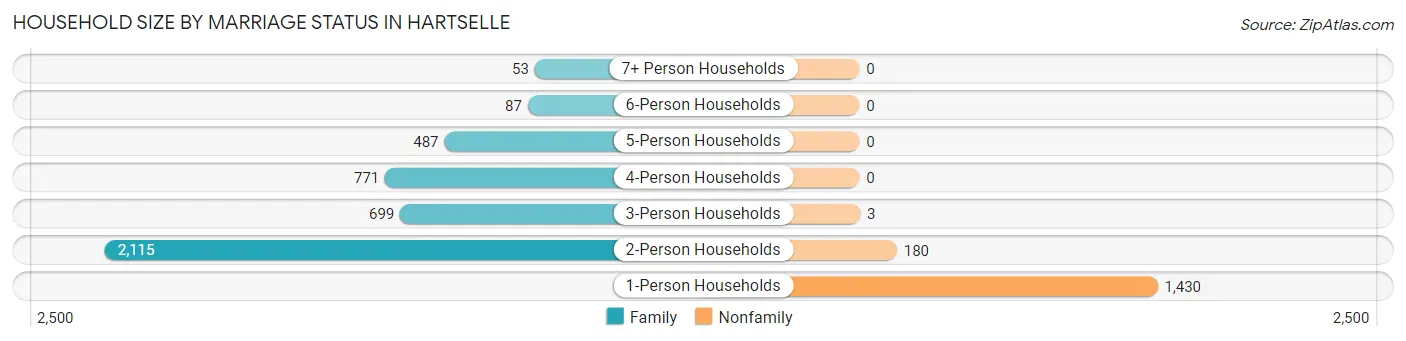
| Household Size | Family Households | Nonfamily Households |
| 1-Person Households | - | 1,430 (24.5%) |
| 2-Person Households | 2,115 (36.3%) | 180 (3.1%) |
| 3-Person Households | 699 (12.0%) | 3 (0.1%) |
| 4-Person Households | 771 (13.2%) | 0 (0.0%) |
| 5-Person Households | 487 (8.4%) | 0 (0.0%) |
| 6-Person Households | 87 (1.5%) | 0 (0.0%) |
| 7+ Person Households | 53 (0.9%) | 0 (0.0%) |
| Total | 4,212 (72.3%) | 1,613 (27.7%) |
Female Fertility in Hartselle
Fertility by Age in Hartselle
Average fertility rate in Hartselle is 12.0 births per 1,000 women. Women in the age bracket of 20 to 34 years have the highest fertility rate with 30.0 births per 1,000 women. Women in the age bracket of 20 to 34 years acount for 100.0% of all women with births.
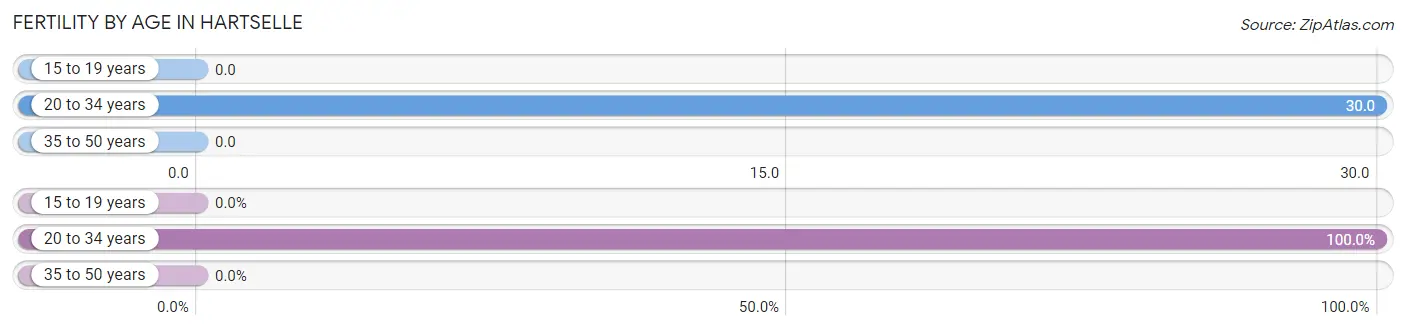
| Age Bracket | Women with Births | Births / 1,000 Women |
| 15 to 19 years | 0 (0.0%) | 0.0 |
| 20 to 34 years | 49 (100.0%) | 30.0 |
| 35 to 50 years | 0 (0.0%) | 0.0 |
| Total | 49 (100.0%) | 12.0 |
Fertility by Age by Marriage Status in Hartselle
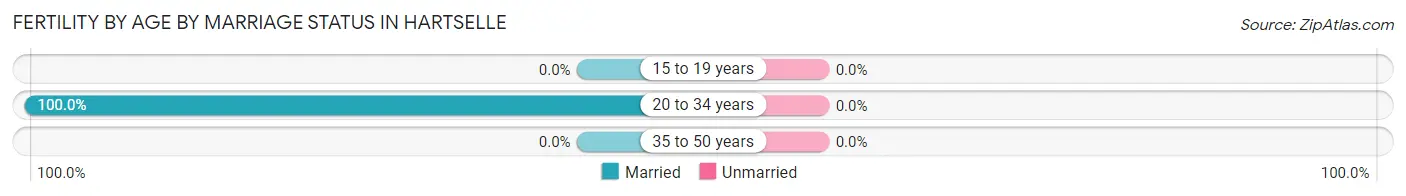
| Age Bracket | Married | Unmarried |
| 15 to 19 years | 0 (0.0%) | 0 (0.0%) |
| 20 to 34 years | 49 (100.0%) | 0 (0.0%) |
| 35 to 50 years | 0 (0.0%) | 0 (0.0%) |
| Total | 49 (100.0%) | 0 (0.0%) |
Fertility by Education in Hartselle
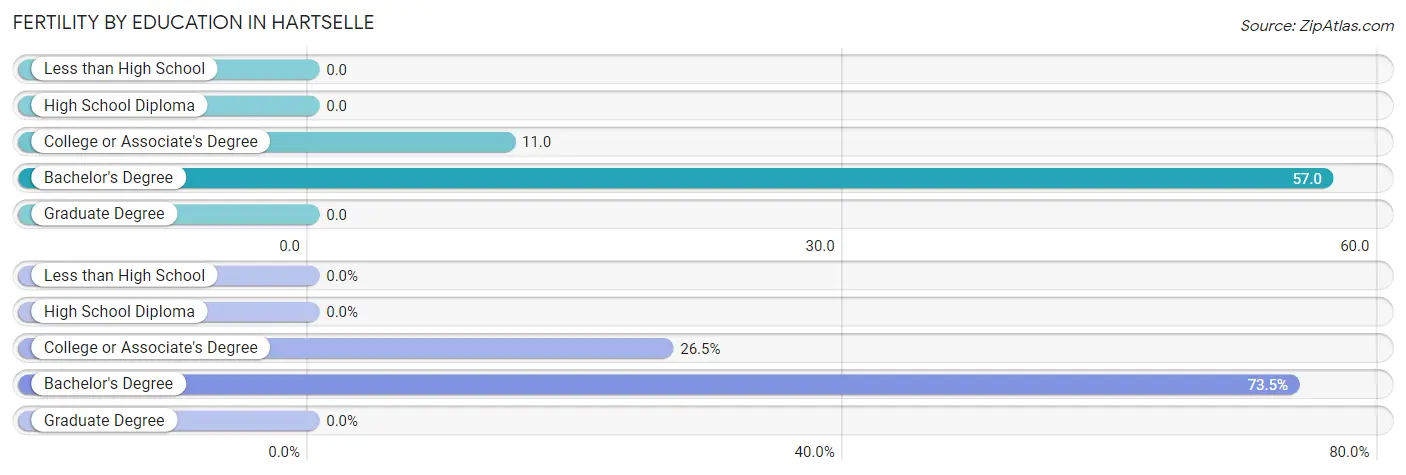
| Educational Attainment | Women with Births | Births / 1,000 Women |
| Less than High School | 0 (0.0%) | 0.0 |
| High School Diploma | 0 (0.0%) | 0.0 |
| College or Associate's Degree | 13 (26.5%) | 11.0 |
| Bachelor's Degree | 36 (73.5%) | 57.0 |
| Graduate Degree | 0 (0.0%) | 0.0 |
| Total | 49 (100.0%) | 12.0 |
Fertility by Education by Marriage Status in Hartselle
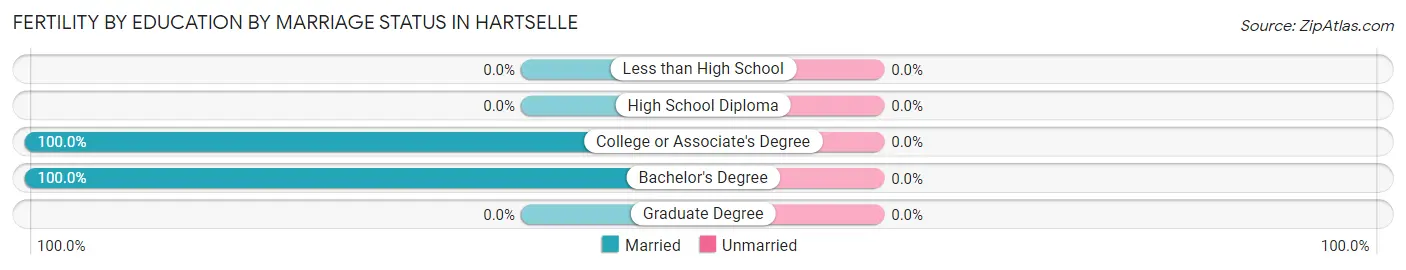
| Educational Attainment | Married | Unmarried |
| Less than High School | 0 (0.0%) | 0 (0.0%) |
| High School Diploma | 0 (0.0%) | 0 (0.0%) |
| College or Associate's Degree | 13 (100.0%) | 0 (0.0%) |
| Bachelor's Degree | 36 (100.0%) | 0 (0.0%) |
| Graduate Degree | 0 (0.0%) | 0 (0.0%) |
| Total | 49 (100.0%) | 0 (0.0%) |
Employment Characteristics in Hartselle
Employment by Class of Employer in Hartselle
Among the 6,914 employed individuals in Hartselle, private company employees (4,981 | 72.0%), local government employees (686 | 9.9%), and not-for-profit organizations (305 | 4.4%) make up the most common classes of employment.
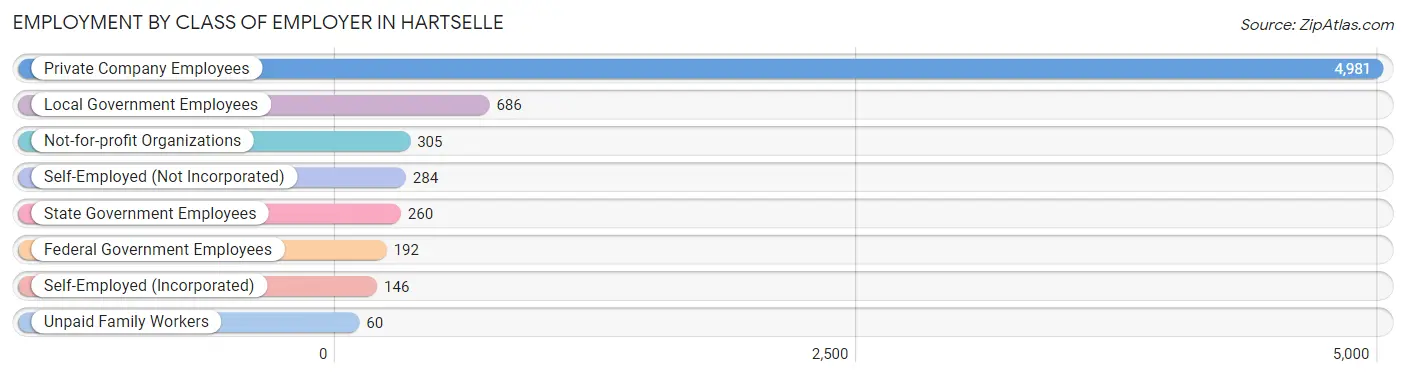
| Employer Class | # Employees | % Employees |
| Private Company Employees | 4,981 | 72.0% |
| Self-Employed (Incorporated) | 146 | 2.1% |
| Self-Employed (Not Incorporated) | 284 | 4.1% |
| Not-for-profit Organizations | 305 | 4.4% |
| Local Government Employees | 686 | 9.9% |
| State Government Employees | 260 | 3.8% |
| Federal Government Employees | 192 | 2.8% |
| Unpaid Family Workers | 60 | 0.9% |
| Total | 6,914 | 100.0% |
Employment Status by Age in Hartselle
According to the labor force statistics for Hartselle, out of the total population over 16 years of age (12,291), 59.2% or 7,276 individuals are in the labor force, with 3.9% or 284 of them unemployed. The age group with the highest labor force participation rate is 30 to 34 years, with 90.2% or 897 individuals in the labor force. Within the labor force, the 20 to 24 years age range has the highest percentage of unemployed individuals, with 21.2% or 191 of them being unemployed.
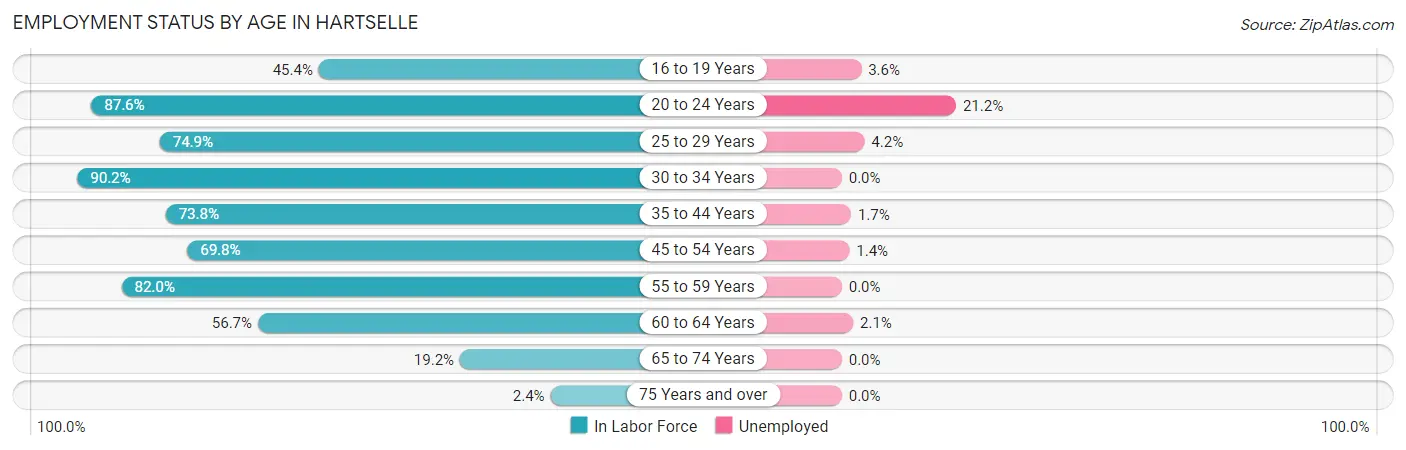
| Age Bracket | In Labor Force | Unemployed |
| 16 to 19 Years | 388 (45.4%) | 14 (3.6%) |
| 20 to 24 Years | 900 (87.6%) | 191 (21.2%) |
| 25 to 29 Years | 624 (74.9%) | 26 (4.2%) |
| 30 to 34 Years | 897 (90.2%) | 0 (0.0%) |
| 35 to 44 Years | 1,332 (73.8%) | 23 (1.7%) |
| 45 to 54 Years | 1,468 (69.8%) | 21 (1.4%) |
| 55 to 59 Years | 815 (82.0%) | 0 (0.0%) |
| 60 to 64 Years | 532 (56.7%) | 11 (2.1%) |
| 65 to 74 Years | 295 (19.2%) | 0 (0.0%) |
| 75 Years and over | 29 (2.4%) | 0 (0.0%) |
| Total | 7,276 (59.2%) | 284 (3.9%) |
Employment Status by Educational Attainment in Hartselle
According to labor force statistics for Hartselle, 73.9% of individuals (5,667) out of the total population between 25 and 64 years of age (7,668) are in the labor force, with 1.4% or 79 of them being unemployed. The group with the highest labor force participation rate are those with the educational attainment of bachelor's degree or higher, with 84.8% or 1,862 individuals in the labor force. Within the labor force, individuals with college / associate degree education have the highest percentage of unemployment, with 2.3% or 47 of them being unemployed.
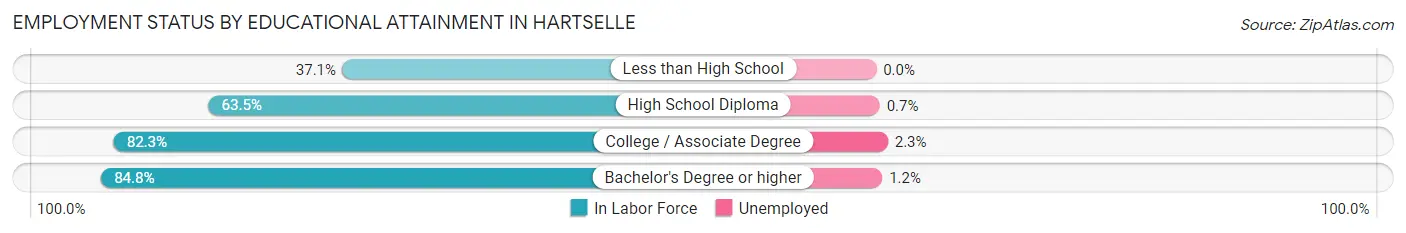
| Educational Attainment | In Labor Force | Unemployed |
| Less than High School | 198 (37.1%) | 0 (0.0%) |
| High School Diploma | 1,554 (63.5%) | 17 (0.7%) |
| College / Associate Degree | 2,051 (82.3%) | 57 (2.3%) |
| Bachelor's Degree or higher | 1,862 (84.8%) | 26 (1.2%) |
| Total | 5,667 (73.9%) | 107 (1.4%) |
Employment Occupations by Sex in Hartselle
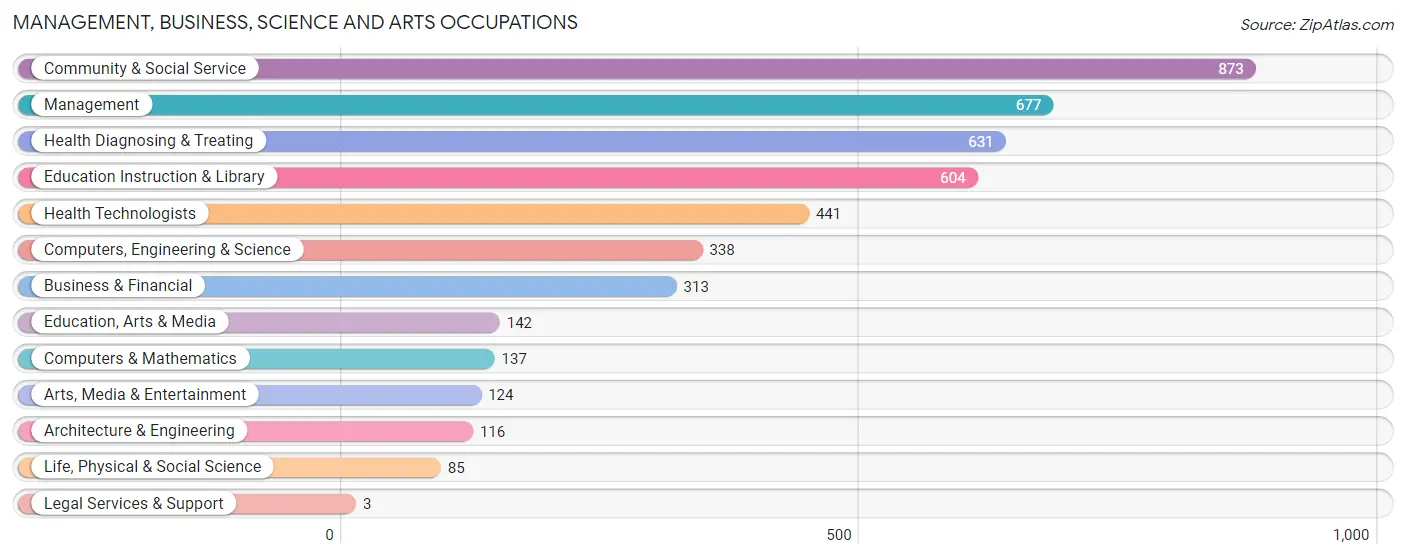
Management, Business, Science and Arts Occupations
The most common Management, Business, Science and Arts occupations in Hartselle are Community & Social Service (873 | 12.5%), Management (677 | 9.7%), Health Diagnosing & Treating (631 | 9.0%), Education Instruction & Library (604 | 8.6%), and Health Technologists (441 | 6.3%).
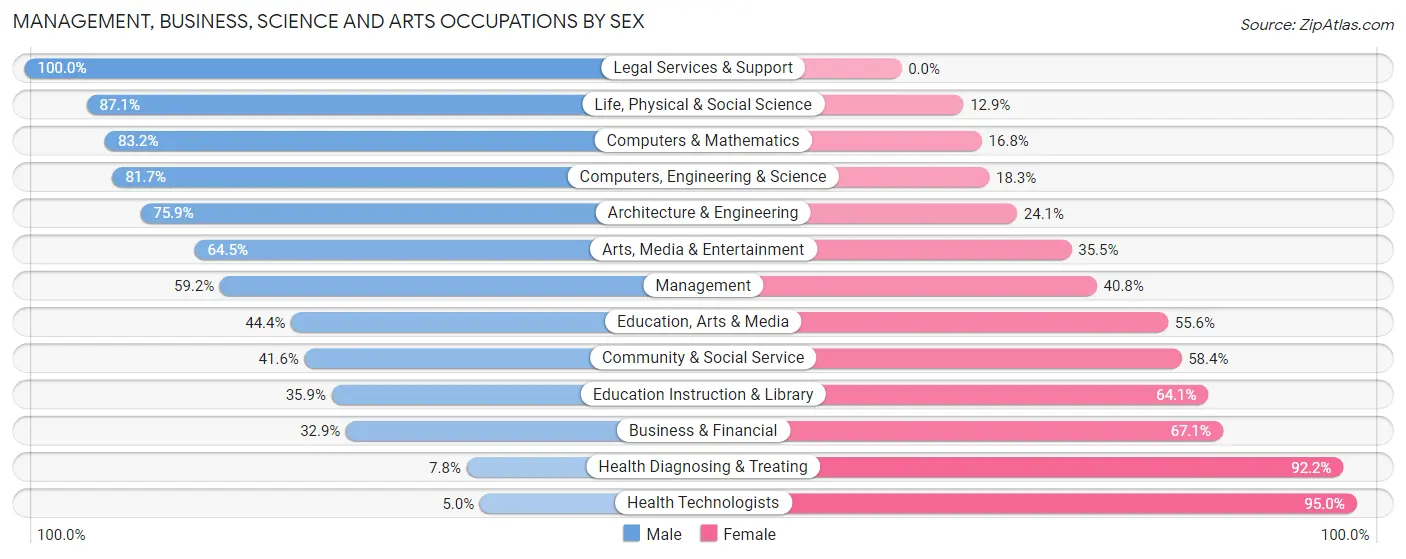
Management, Business, Science and Arts Occupations by Sex
Within the Management, Business, Science and Arts occupations in Hartselle, the most male-oriented occupations are Legal Services & Support (100.0%), Life, Physical & Social Science (87.1%), and Computers & Mathematics (83.2%), while the most female-oriented occupations are Health Technologists (95.0%), Health Diagnosing & Treating (92.2%), and Business & Financial (67.1%).
| Occupation | Male | Female |
| Management | 401 (59.2%) | 276 (40.8%) |
| Business & Financial | 103 (32.9%) | 210 (67.1%) |
| Computers, Engineering & Science | 276 (81.7%) | 62 (18.3%) |
| Computers & Mathematics | 114 (83.2%) | 23 (16.8%) |
| Architecture & Engineering | 88 (75.9%) | 28 (24.1%) |
| Life, Physical & Social Science | 74 (87.1%) | 11 (12.9%) |
| Community & Social Service | 363 (41.6%) | 510 (58.4%) |
| Education, Arts & Media | 63 (44.4%) | 79 (55.6%) |
| Legal Services & Support | 3 (100.0%) | 0 (0.0%) |
| Education Instruction & Library | 217 (35.9%) | 387 (64.1%) |
| Arts, Media & Entertainment | 80 (64.5%) | 44 (35.5%) |
| Health Diagnosing & Treating | 49 (7.8%) | 582 (92.2%) |
| Health Technologists | 22 (5.0%) | 419 (95.0%) |
| Total (Category) | 1,192 (42.1%) | 1,640 (57.9%) |
| Total (Overall) | 3,206 (45.9%) | 3,787 (54.1%) |
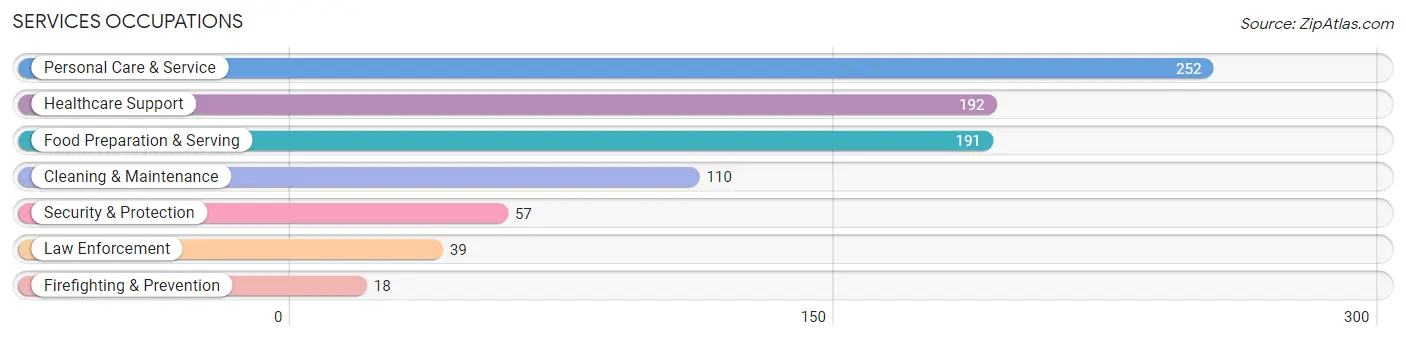
Services Occupations
The most common Services occupations in Hartselle are Personal Care & Service (252 | 3.6%), Healthcare Support (192 | 2.8%), Food Preparation & Serving (191 | 2.7%), Cleaning & Maintenance (110 | 1.6%), and Security & Protection (57 | 0.8%).
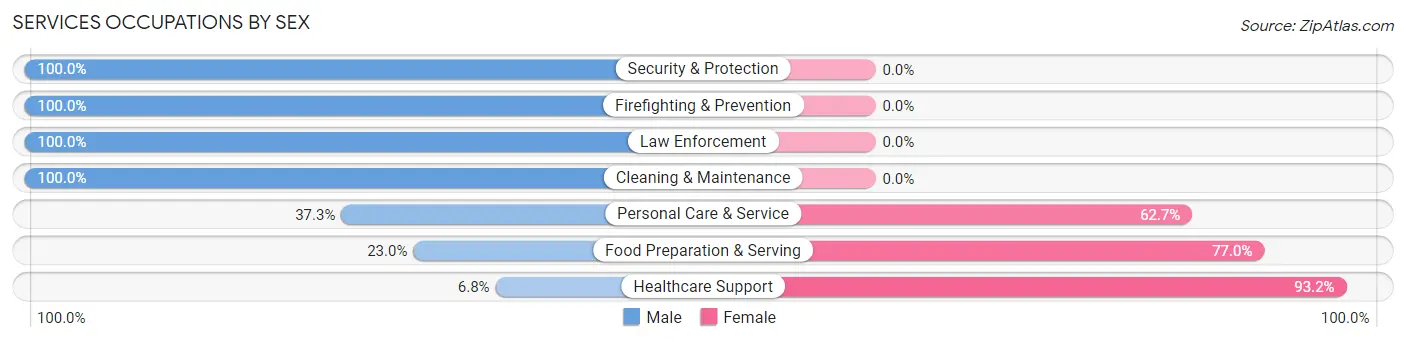
Services Occupations by Sex
Within the Services occupations in Hartselle, the most male-oriented occupations are Security & Protection (100.0%), Firefighting & Prevention (100.0%), and Law Enforcement (100.0%), while the most female-oriented occupations are Healthcare Support (93.2%), Food Preparation & Serving (77.0%), and Personal Care & Service (62.7%).
| Occupation | Male | Female |
| Healthcare Support | 13 (6.8%) | 179 (93.2%) |
| Security & Protection | 57 (100.0%) | 0 (0.0%) |
| Firefighting & Prevention | 18 (100.0%) | 0 (0.0%) |
| Law Enforcement | 39 (100.0%) | 0 (0.0%) |
| Food Preparation & Serving | 44 (23.0%) | 147 (77.0%) |
| Cleaning & Maintenance | 110 (100.0%) | 0 (0.0%) |
| Personal Care & Service | 94 (37.3%) | 158 (62.7%) |
| Total (Category) | 318 (39.7%) | 484 (60.4%) |
| Total (Overall) | 3,206 (45.9%) | 3,787 (54.1%) |
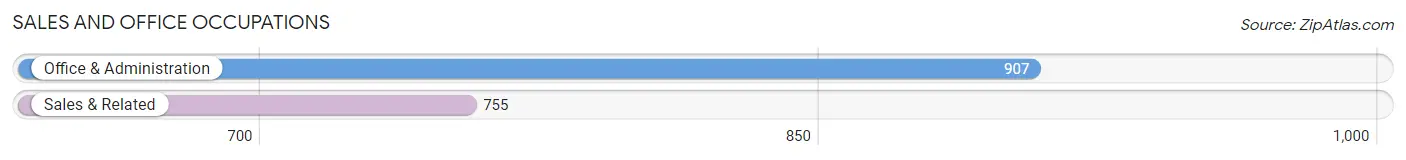
Sales and Office Occupations
The most common Sales and Office occupations in Hartselle are Office & Administration (907 | 13.0%), and Sales & Related (755 | 10.8%).
Sales and Office Occupations by Sex
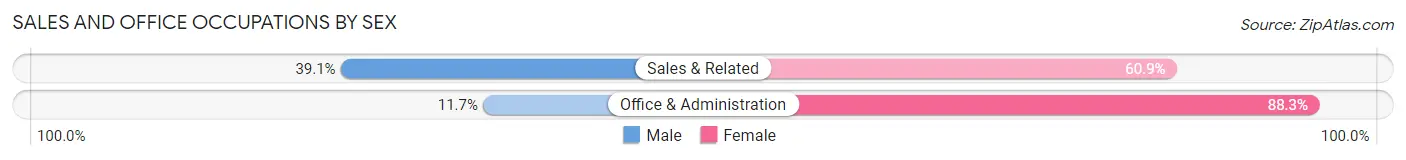
| Occupation | Male | Female |
| Sales & Related | 295 (39.1%) | 460 (60.9%) |
| Office & Administration | 106 (11.7%) | 801 (88.3%) |
| Total (Category) | 401 (24.1%) | 1,261 (75.9%) |
| Total (Overall) | 3,206 (45.9%) | 3,787 (54.1%) |
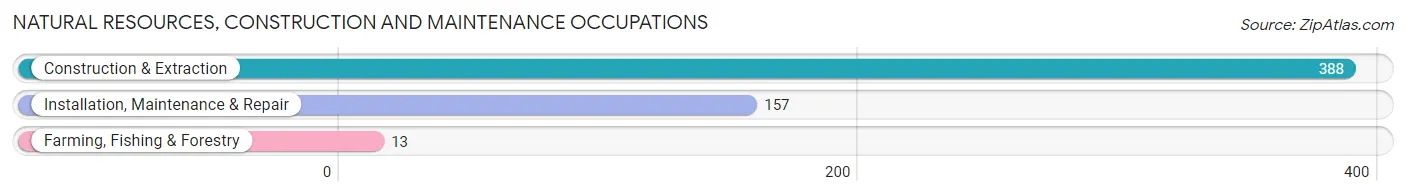
Natural Resources, Construction and Maintenance Occupations
The most common Natural Resources, Construction and Maintenance occupations in Hartselle are Construction & Extraction (388 | 5.6%), Installation, Maintenance & Repair (157 | 2.2%), and Farming, Fishing & Forestry (13 | 0.2%).
Natural Resources, Construction and Maintenance Occupations by Sex
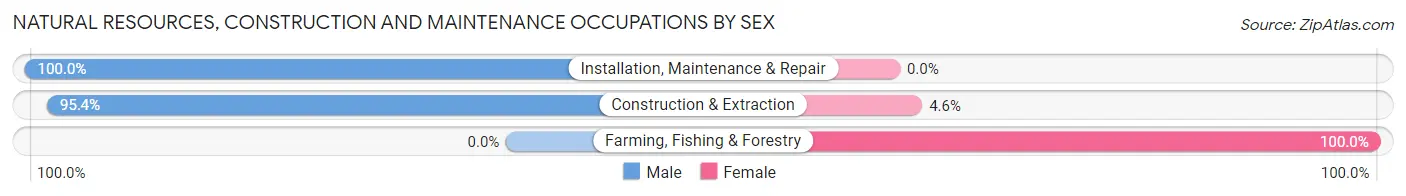
| Occupation | Male | Female |
| Farming, Fishing & Forestry | 0 (0.0%) | 13 (100.0%) |
| Construction & Extraction | 370 (95.4%) | 18 (4.6%) |
| Installation, Maintenance & Repair | 157 (100.0%) | 0 (0.0%) |
| Total (Category) | 527 (94.4%) | 31 (5.6%) |
| Total (Overall) | 3,206 (45.9%) | 3,787 (54.1%) |
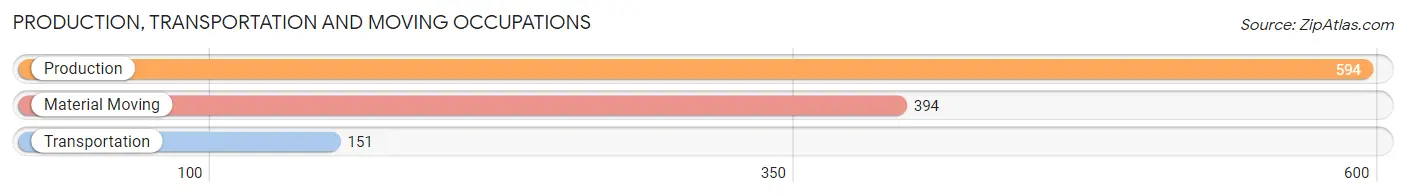
Production, Transportation and Moving Occupations
The most common Production, Transportation and Moving occupations in Hartselle are Production (594 | 8.5%), Material Moving (394 | 5.6%), and Transportation (151 | 2.2%).
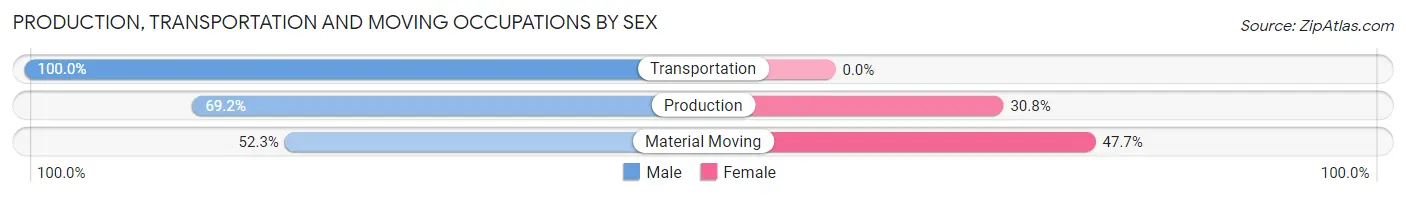
Production, Transportation and Moving Occupations by Sex
| Occupation | Male | Female |
| Production | 411 (69.2%) | 183 (30.8%) |
| Transportation | 151 (100.0%) | 0 (0.0%) |
| Material Moving | 206 (52.3%) | 188 (47.7%) |
| Total (Category) | 768 (67.4%) | 371 (32.6%) |
| Total (Overall) | 3,206 (45.9%) | 3,787 (54.1%) |
Employment Industries by Sex in Hartselle
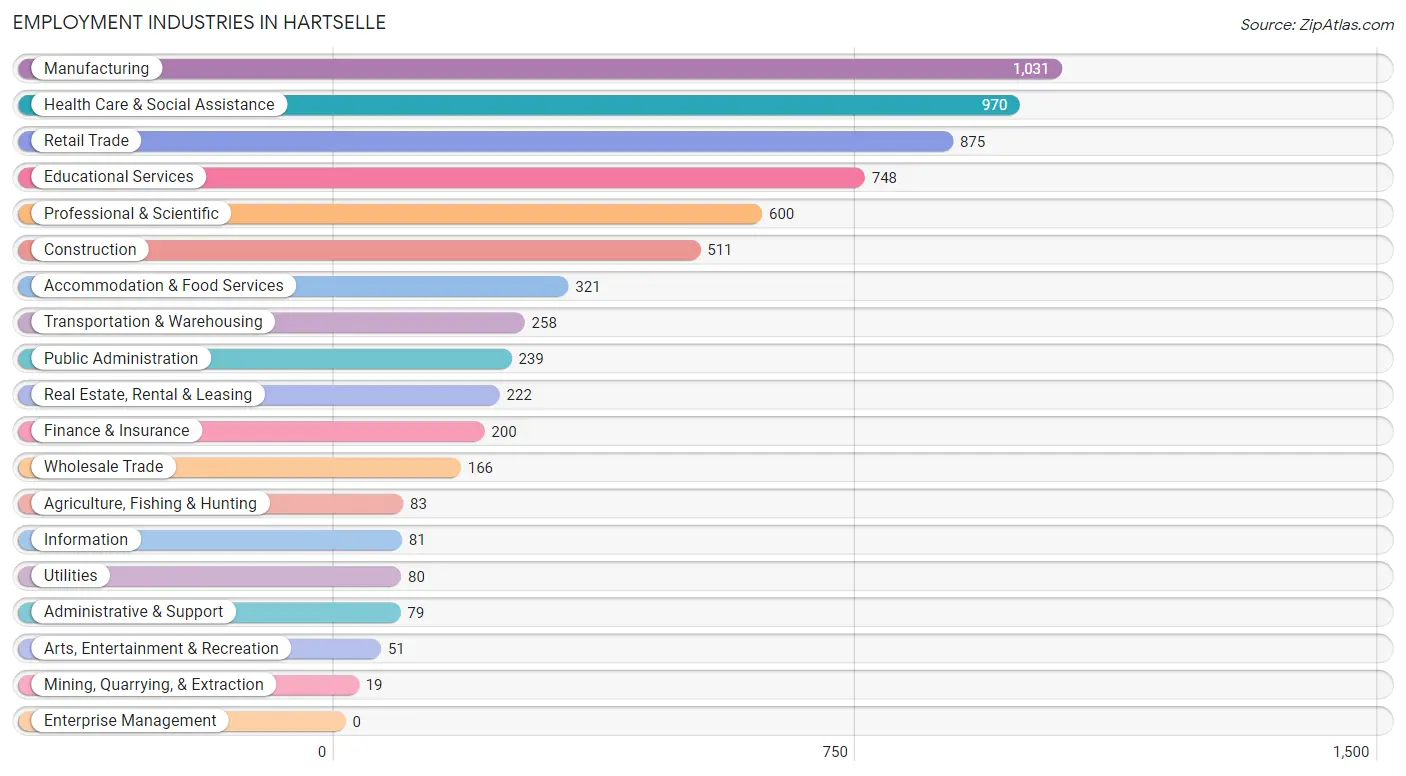
Employment Industries in Hartselle
The major employment industries in Hartselle include Manufacturing (1,031 | 14.7%), Health Care & Social Assistance (970 | 13.9%), Retail Trade (875 | 12.5%), Educational Services (748 | 10.7%), and Professional & Scientific (600 | 8.6%).
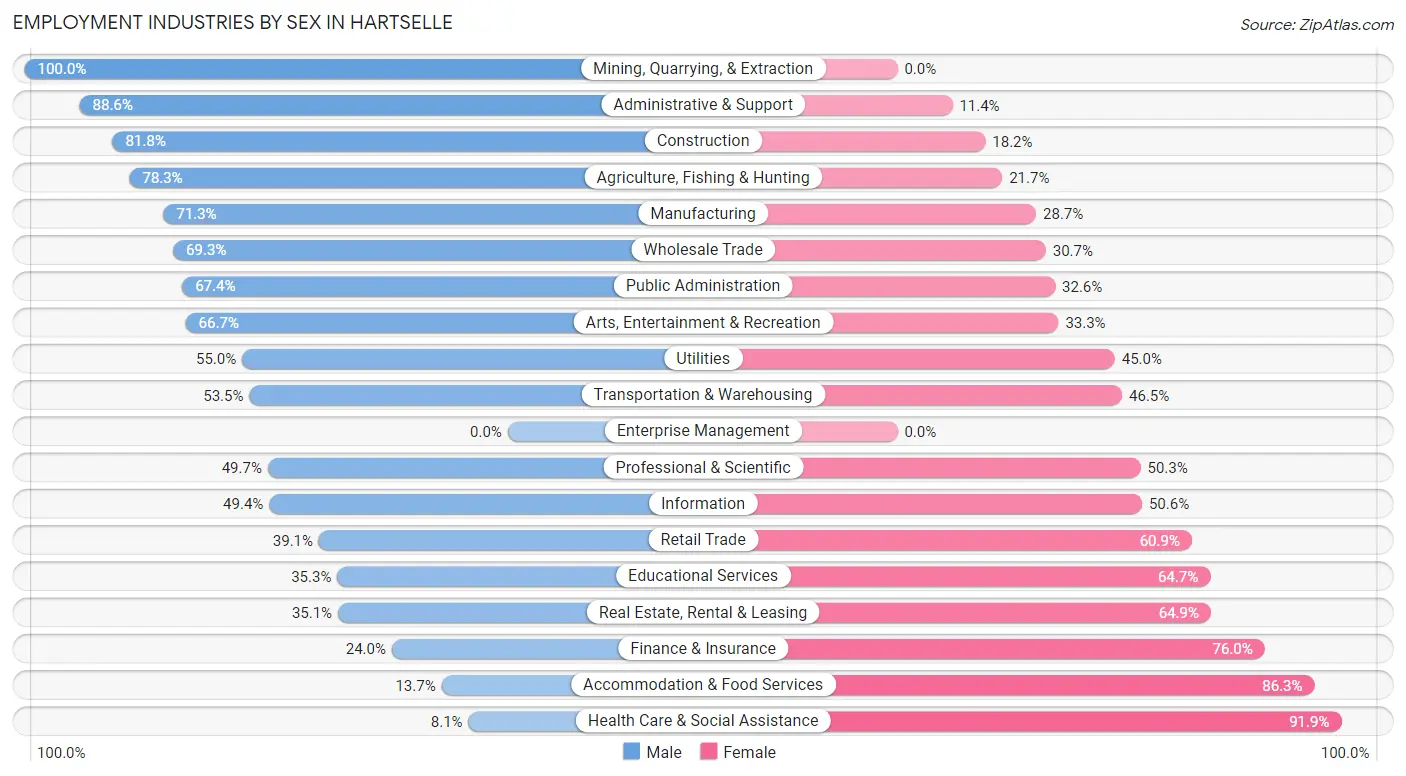
Employment Industries by Sex in Hartselle
The Hartselle industries that see more men than women are Mining, Quarrying, & Extraction (100.0%), Administrative & Support (88.6%), and Construction (81.8%), whereas the industries that tend to have a higher number of women are Health Care & Social Assistance (91.9%), Accommodation & Food Services (86.3%), and Finance & Insurance (76.0%).
| Industry | Male | Female |
| Agriculture, Fishing & Hunting | 65 (78.3%) | 18 (21.7%) |
| Mining, Quarrying, & Extraction | 19 (100.0%) | 0 (0.0%) |
| Construction | 418 (81.8%) | 93 (18.2%) |
| Manufacturing | 735 (71.3%) | 296 (28.7%) |
| Wholesale Trade | 115 (69.3%) | 51 (30.7%) |
| Retail Trade | 342 (39.1%) | 533 (60.9%) |
| Transportation & Warehousing | 138 (53.5%) | 120 (46.5%) |
| Utilities | 44 (55.0%) | 36 (45.0%) |
| Information | 40 (49.4%) | 41 (50.6%) |
| Finance & Insurance | 48 (24.0%) | 152 (76.0%) |
| Real Estate, Rental & Leasing | 78 (35.1%) | 144 (64.9%) |
| Professional & Scientific | 298 (49.7%) | 302 (50.3%) |
| Enterprise Management | 0 (0.0%) | 0 (0.0%) |
| Administrative & Support | 70 (88.6%) | 9 (11.4%) |
| Educational Services | 264 (35.3%) | 484 (64.7%) |
| Health Care & Social Assistance | 79 (8.1%) | 891 (91.9%) |
| Arts, Entertainment & Recreation | 34 (66.7%) | 17 (33.3%) |
| Accommodation & Food Services | 44 (13.7%) | 277 (86.3%) |
| Public Administration | 161 (67.4%) | 78 (32.6%) |
| Total | 3,206 (45.9%) | 3,787 (54.1%) |
Education in Hartselle
School Enrollment in Hartselle
The most common levels of schooling among the 3,320 students in Hartselle are high school (886 | 26.7%), elementary school (788 | 23.7%), and middle school (685 | 20.6%).
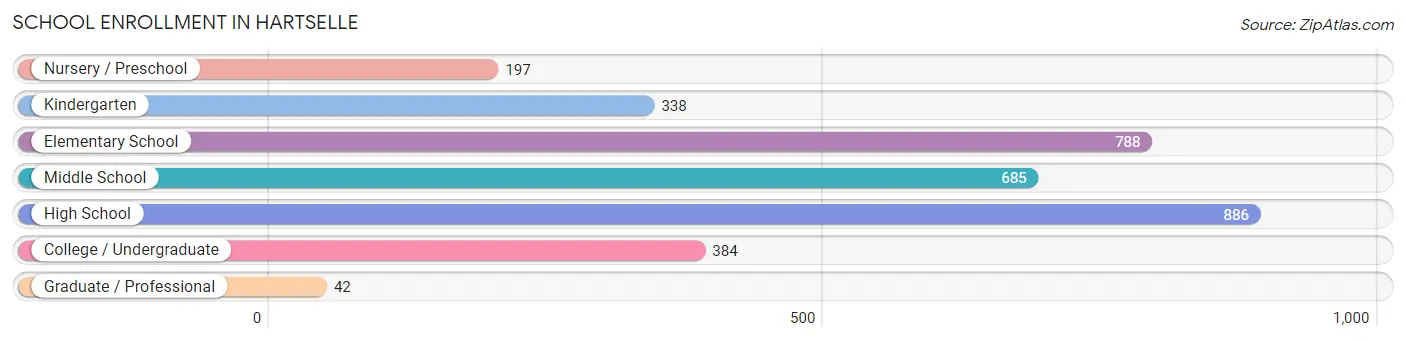
| School Level | # Students | % Students |
| Nursery / Preschool | 197 | 5.9% |
| Kindergarten | 338 | 10.2% |
| Elementary School | 788 | 23.7% |
| Middle School | 685 | 20.6% |
| High School | 886 | 26.7% |
| College / Undergraduate | 384 | 11.6% |
| Graduate / Professional | 42 | 1.3% |
| Total | 3,320 | 100.0% |
School Enrollment by Age by Funding Source in Hartselle
Out of a total of 3,320 students who are enrolled in schools in Hartselle, 292 (8.8%) attend a private institution, while the remaining 3,028 (91.2%) are enrolled in public schools. The age group of 3 to 4 year olds has the highest likelihood of being enrolled in private schools, with 96 (53.0% in the age bracket) enrolled. Conversely, the age group of 25 to 34 year olds has the lowest likelihood of being enrolled in a private school, with 74 (100.0% in the age bracket) attending a public institution.
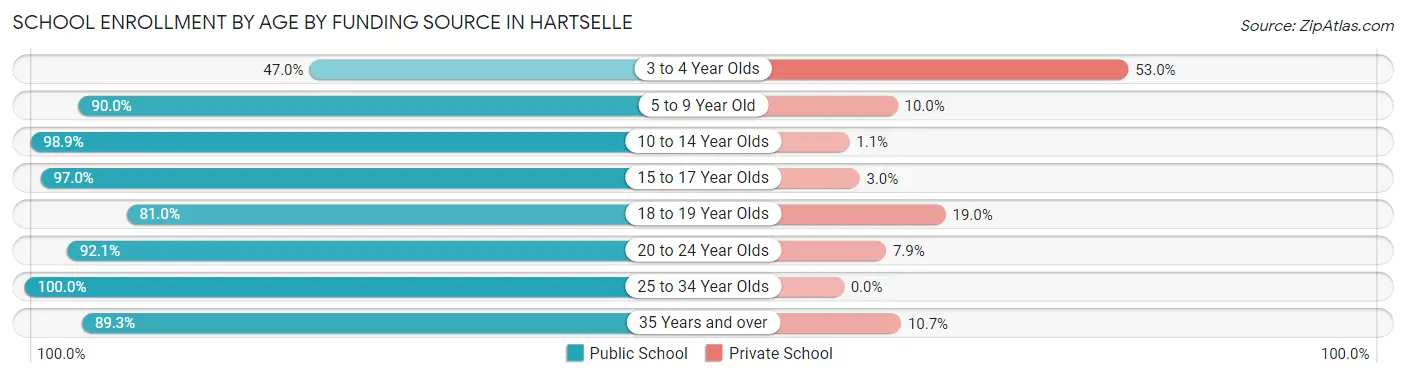
| Age Bracket | Public School | Private School |
| 3 to 4 Year Olds | 85 (47.0%) | 96 (53.0%) |
| 5 to 9 Year Old | 915 (90.0%) | 102 (10.0%) |
| 10 to 14 Year Olds | 839 (98.9%) | 9 (1.1%) |
| 15 to 17 Year Olds | 722 (97.0%) | 22 (3.0%) |
| 18 to 19 Year Olds | 175 (81.0%) | 41 (19.0%) |
| 20 to 24 Year Olds | 152 (92.1%) | 13 (7.9%) |
| 25 to 34 Year Olds | 74 (100.0%) | 0 (0.0%) |
| 35 Years and over | 67 (89.3%) | 8 (10.7%) |
| Total | 3,028 (91.2%) | 292 (8.8%) |
Educational Attainment by Field of Study in Hartselle
Education (829 | 27.9%), business (674 | 22.7%), science & technology (456 | 15.3%), psychology (181 | 6.1%), and engineering (177 | 5.9%) are the most common fields of study among 2,974 individuals in Hartselle who have obtained a bachelor's degree or higher.
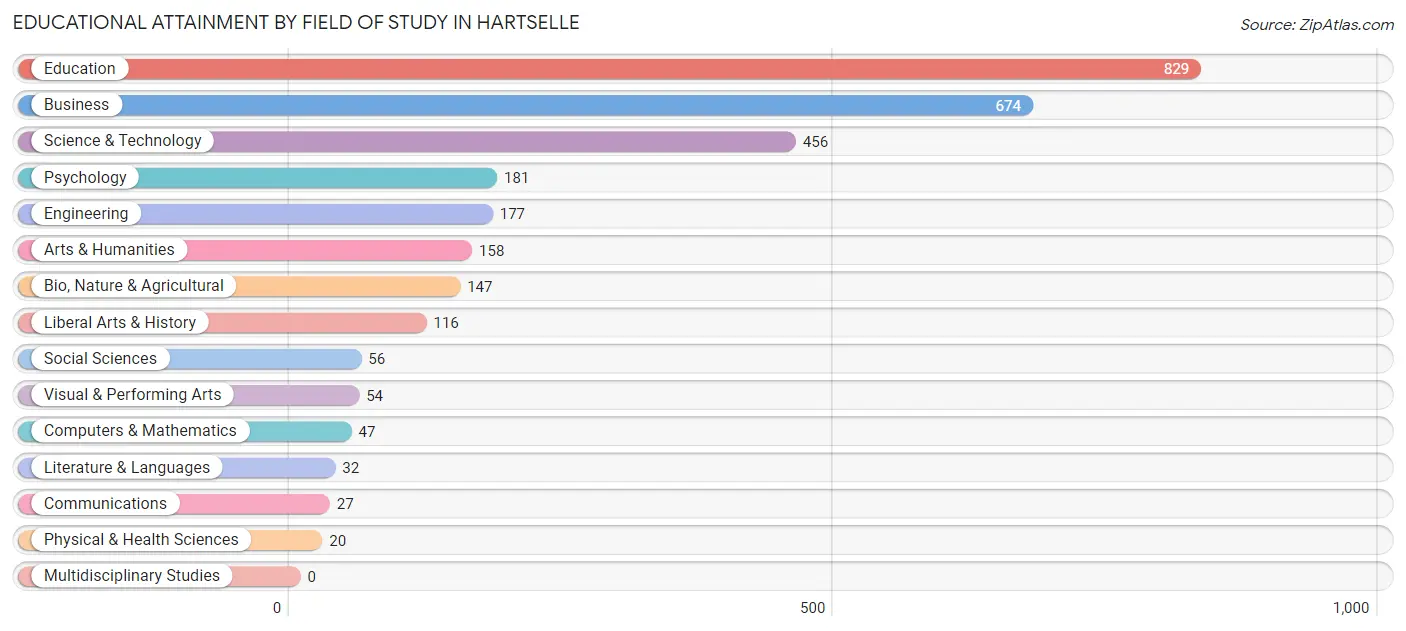
| Field of Study | # Graduates | % Graduates |
| Computers & Mathematics | 47 | 1.6% |
| Bio, Nature & Agricultural | 147 | 4.9% |
| Physical & Health Sciences | 20 | 0.7% |
| Psychology | 181 | 6.1% |
| Social Sciences | 56 | 1.9% |
| Engineering | 177 | 5.9% |
| Multidisciplinary Studies | 0 | 0.0% |
| Science & Technology | 456 | 15.3% |
| Business | 674 | 22.7% |
| Education | 829 | 27.9% |
| Literature & Languages | 32 | 1.1% |
| Liberal Arts & History | 116 | 3.9% |
| Visual & Performing Arts | 54 | 1.8% |
| Communications | 27 | 0.9% |
| Arts & Humanities | 158 | 5.3% |
| Total | 2,974 | 100.0% |
Transportation & Commute in Hartselle
Vehicle Availability by Sex in Hartselle
The most prevalent vehicle ownership categories in Hartselle are males with 2 vehicles (1,232, accounting for 38.8%) and females with 2 vehicles (1,662, making up 33.0%).
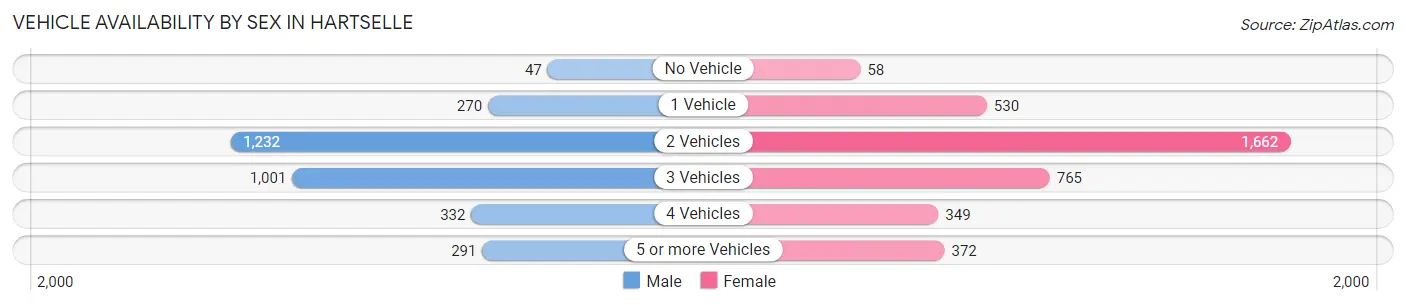
| Vehicles Available | Male | Female |
| No Vehicle | 47 (1.5%) | 58 (1.5%) |
| 1 Vehicle | 270 (8.5%) | 530 (14.2%) |
| 2 Vehicles | 1,232 (38.8%) | 1,662 (44.5%) |
| 3 Vehicles | 1,001 (31.6%) | 765 (20.5%) |
| 4 Vehicles | 332 (10.5%) | 349 (9.3%) |
| 5 or more Vehicles | 291 (9.2%) | 372 (10.0%) |
| Total | 3,173 (100.0%) | 3,736 (100.0%) |
Commute Time in Hartselle
The most frequently occuring commute durations in Hartselle are 30 to 34 minutes (962 commuters, 14.4%), 15 to 19 minutes (860 commuters, 12.9%), and 45 to 59 minutes (849 commuters, 12.7%).
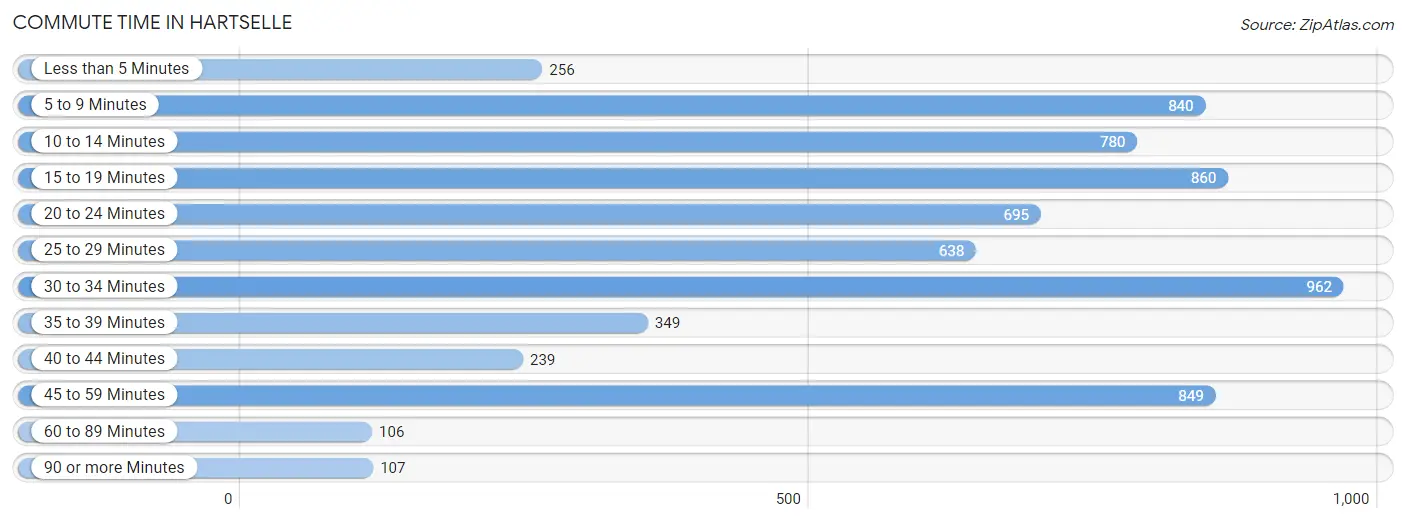
| Commute Time | # Commuters | % Commuters |
| Less than 5 Minutes | 256 | 3.8% |
| 5 to 9 Minutes | 840 | 12.6% |
| 10 to 14 Minutes | 780 | 11.7% |
| 15 to 19 Minutes | 860 | 12.9% |
| 20 to 24 Minutes | 695 | 10.4% |
| 25 to 29 Minutes | 638 | 9.6% |
| 30 to 34 Minutes | 962 | 14.4% |
| 35 to 39 Minutes | 349 | 5.2% |
| 40 to 44 Minutes | 239 | 3.6% |
| 45 to 59 Minutes | 849 | 12.7% |
| 60 to 89 Minutes | 106 | 1.6% |
| 90 or more Minutes | 107 | 1.6% |
Commute Time by Sex in Hartselle
The most common commute times in Hartselle are 30 to 34 minutes (477 commuters, 15.6%) for males and 5 to 9 minutes (640 commuters, 17.6%) for females.
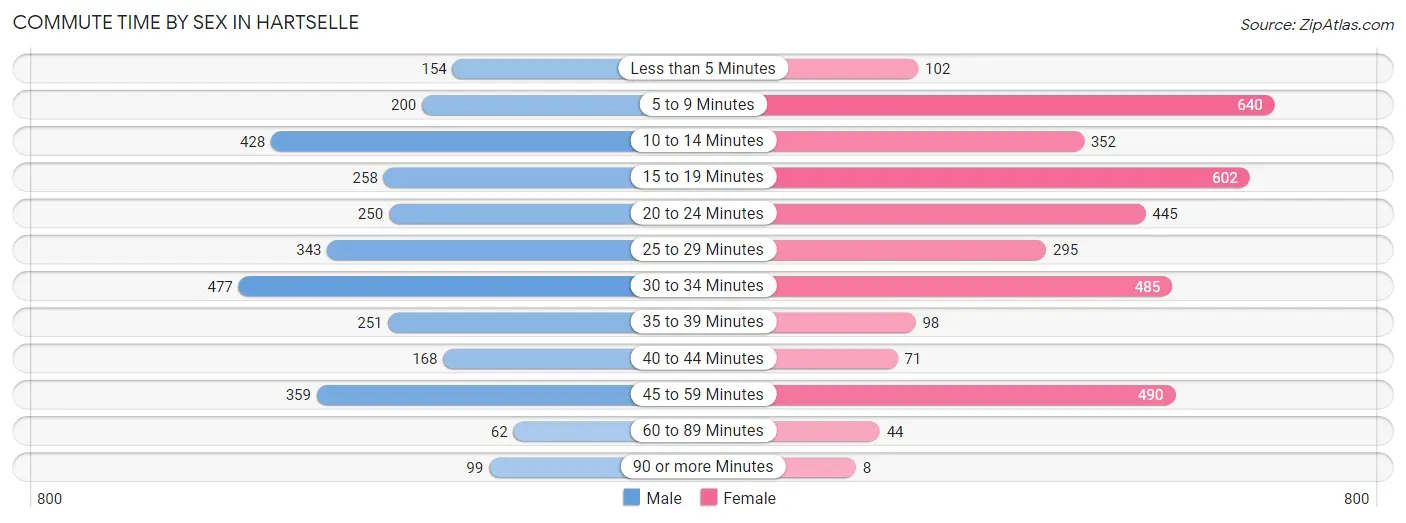
| Commute Time | Male | Female |
| Less than 5 Minutes | 154 (5.1%) | 102 (2.8%) |
| 5 to 9 Minutes | 200 (6.6%) | 640 (17.6%) |
| 10 to 14 Minutes | 428 (14.0%) | 352 (9.7%) |
| 15 to 19 Minutes | 258 (8.5%) | 602 (16.6%) |
| 20 to 24 Minutes | 250 (8.2%) | 445 (12.2%) |
| 25 to 29 Minutes | 343 (11.3%) | 295 (8.1%) |
| 30 to 34 Minutes | 477 (15.6%) | 485 (13.4%) |
| 35 to 39 Minutes | 251 (8.2%) | 98 (2.7%) |
| 40 to 44 Minutes | 168 (5.5%) | 71 (1.9%) |
| 45 to 59 Minutes | 359 (11.8%) | 490 (13.5%) |
| 60 to 89 Minutes | 62 (2.0%) | 44 (1.2%) |
| 90 or more Minutes | 99 (3.3%) | 8 (0.2%) |
Time of Departure to Work by Sex in Hartselle
The most frequent times of departure to work in Hartselle are 7:00 AM to 7:29 AM (493, 16.2%) for males and 7:30 AM to 7:59 AM (691, 19.0%) for females.
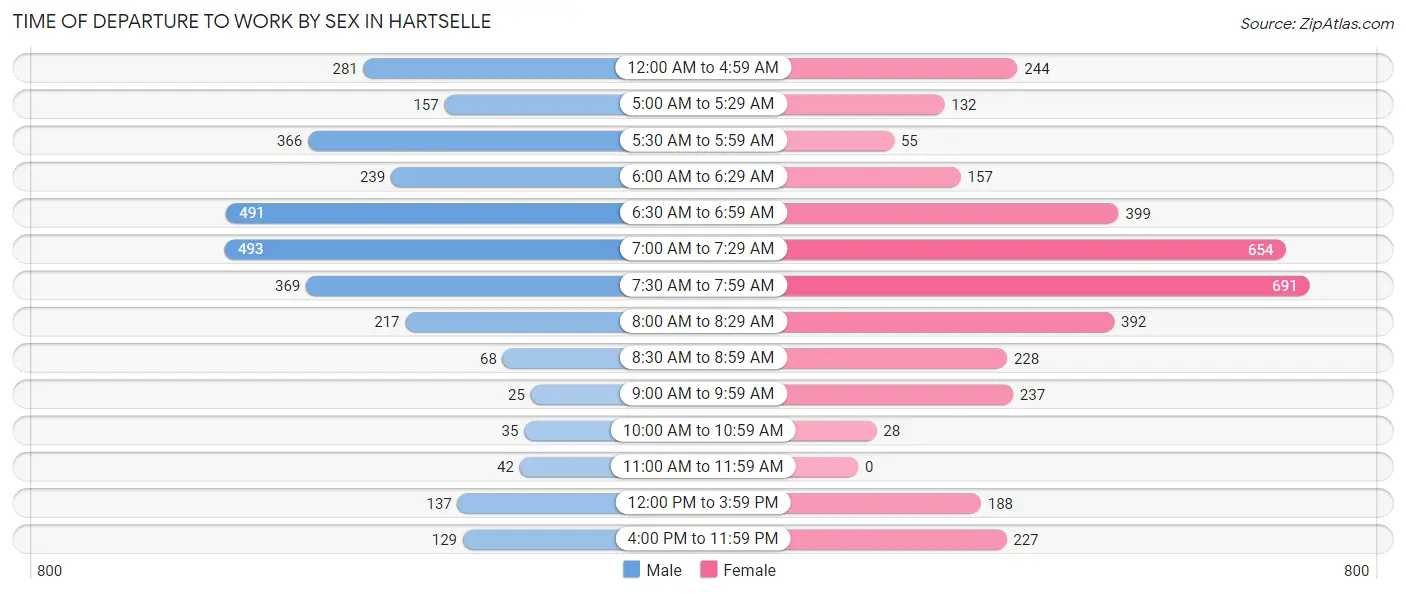
| Time of Departure | Male | Female |
| 12:00 AM to 4:59 AM | 281 (9.2%) | 244 (6.7%) |
| 5:00 AM to 5:29 AM | 157 (5.1%) | 132 (3.6%) |
| 5:30 AM to 5:59 AM | 366 (12.0%) | 55 (1.5%) |
| 6:00 AM to 6:29 AM | 239 (7.8%) | 157 (4.3%) |
| 6:30 AM to 6:59 AM | 491 (16.1%) | 399 (11.0%) |
| 7:00 AM to 7:29 AM | 493 (16.2%) | 654 (18.0%) |
| 7:30 AM to 7:59 AM | 369 (12.1%) | 691 (19.0%) |
| 8:00 AM to 8:29 AM | 217 (7.1%) | 392 (10.8%) |
| 8:30 AM to 8:59 AM | 68 (2.2%) | 228 (6.3%) |
| 9:00 AM to 9:59 AM | 25 (0.8%) | 237 (6.5%) |
| 10:00 AM to 10:59 AM | 35 (1.1%) | 28 (0.8%) |
| 11:00 AM to 11:59 AM | 42 (1.4%) | 0 (0.0%) |
| 12:00 PM to 3:59 PM | 137 (4.5%) | 188 (5.2%) |
| 4:00 PM to 11:59 PM | 129 (4.2%) | 227 (6.2%) |
| Total | 3,049 (100.0%) | 3,632 (100.0%) |
Housing Occupancy in Hartselle
Occupancy by Ownership in Hartselle
Of the total 5,825 dwellings in Hartselle, owner-occupied units account for 4,342 (74.5%), while renter-occupied units make up 1,483 (25.5%).
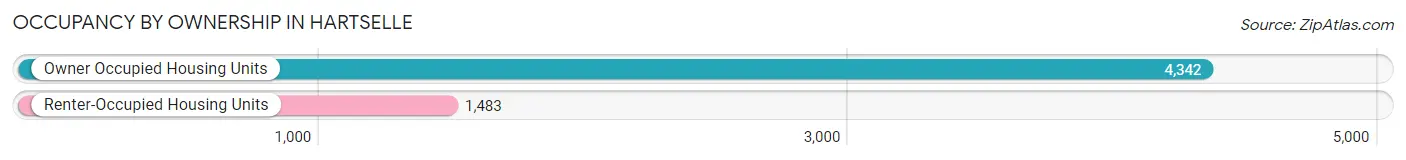
| Occupancy | # Housing Units | % Housing Units |
| Owner Occupied Housing Units | 4,342 | 74.5% |
| Renter-Occupied Housing Units | 1,483 | 25.5% |
| Total Occupied Housing Units | 5,825 | 100.0% |
Occupancy by Household Size in Hartselle
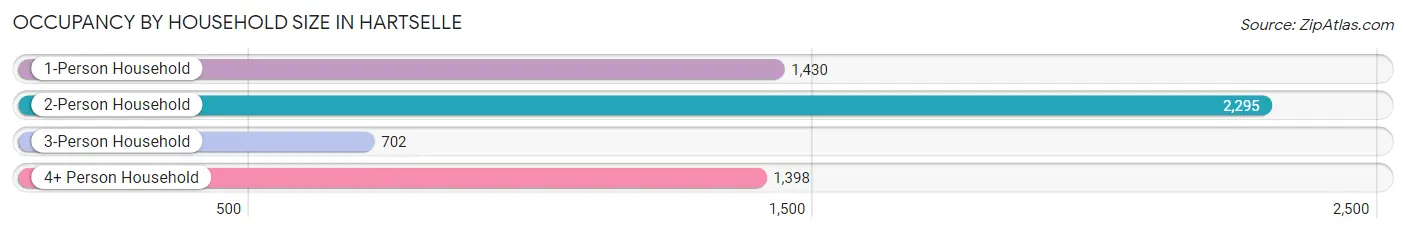
| Household Size | # Housing Units | % Housing Units |
| 1-Person Household | 1,430 | 24.5% |
| 2-Person Household | 2,295 | 39.4% |
| 3-Person Household | 702 | 12.0% |
| 4+ Person Household | 1,398 | 24.0% |
| Total Housing Units | 5,825 | 100.0% |
Occupancy by Ownership by Household Size in Hartselle
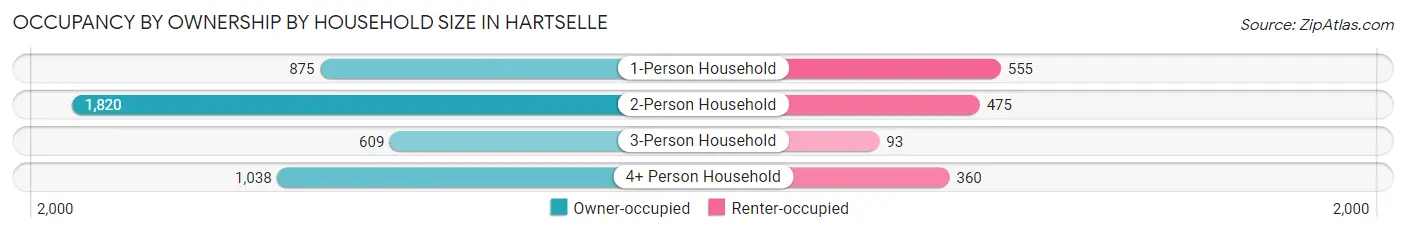
| Household Size | Owner-occupied | Renter-occupied |
| 1-Person Household | 875 (61.2%) | 555 (38.8%) |
| 2-Person Household | 1,820 (79.3%) | 475 (20.7%) |
| 3-Person Household | 609 (86.8%) | 93 (13.3%) |
| 4+ Person Household | 1,038 (74.3%) | 360 (25.8%) |
| Total Housing Units | 4,342 (74.5%) | 1,483 (25.5%) |
Occupancy by Educational Attainment in Hartselle
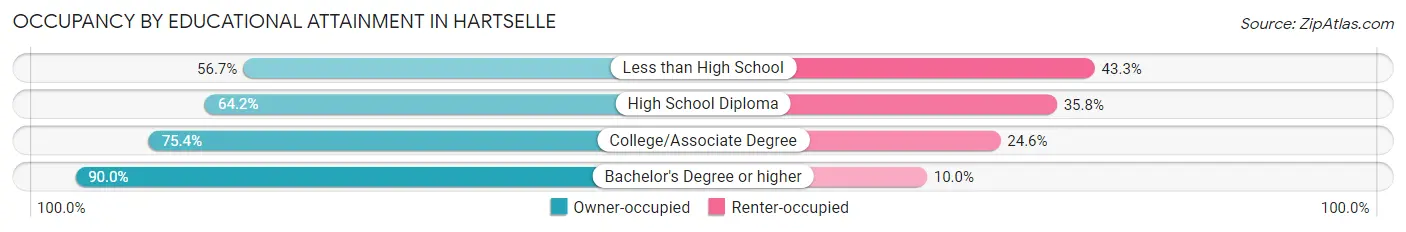
| Household Size | Owner-occupied | Renter-occupied |
| Less than High School | 229 (56.7%) | 175 (43.3%) |
| High School Diploma | 1,207 (64.2%) | 673 (35.8%) |
| College/Associate Degree | 1,445 (75.4%) | 472 (24.6%) |
| Bachelor's Degree or higher | 1,461 (90.0%) | 163 (10.0%) |
Occupancy by Age of Householder in Hartselle
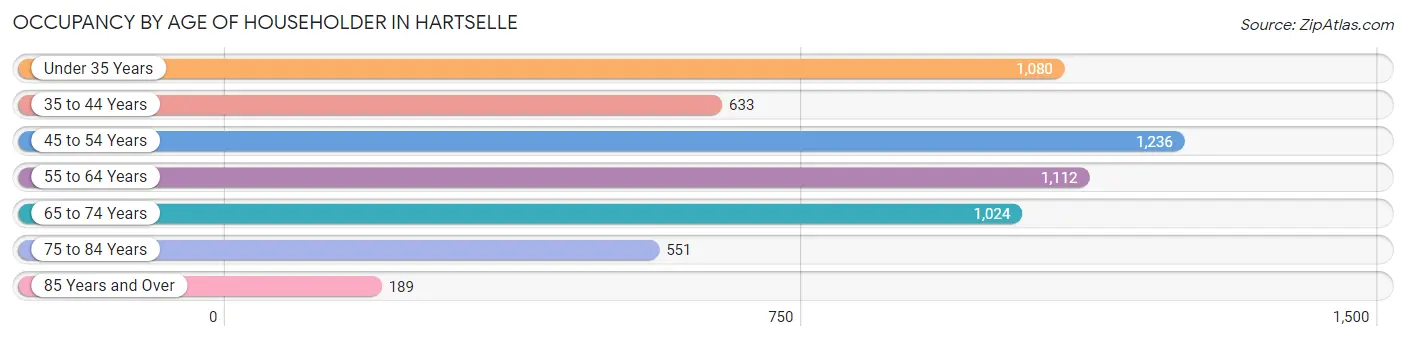
| Age Bracket | # Households | % Households |
| Under 35 Years | 1,080 | 18.5% |
| 35 to 44 Years | 633 | 10.9% |
| 45 to 54 Years | 1,236 | 21.2% |
| 55 to 64 Years | 1,112 | 19.1% |
| 65 to 74 Years | 1,024 | 17.6% |
| 75 to 84 Years | 551 | 9.5% |
| 85 Years and Over | 189 | 3.2% |
| Total | 5,825 | 100.0% |
Housing Finances in Hartselle
Median Income by Occupancy in Hartselle
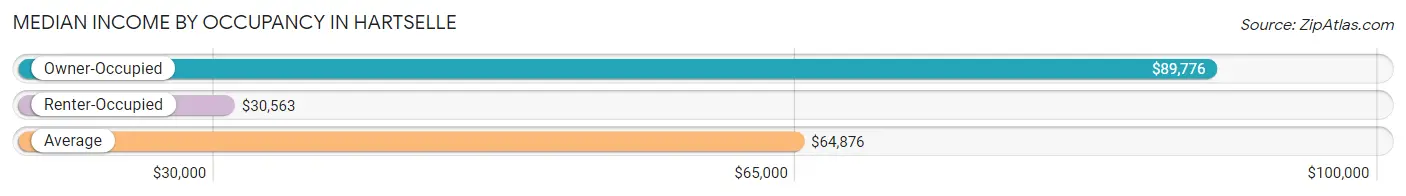
| Occupancy Type | # Households | Median Income |
| Owner-Occupied | 4,342 (74.5%) | $89,776 |
| Renter-Occupied | 1,483 (25.5%) | $30,563 |
| Average | 5,825 (100.0%) | $64,876 |
Occupancy by Householder Income Bracket in Hartselle
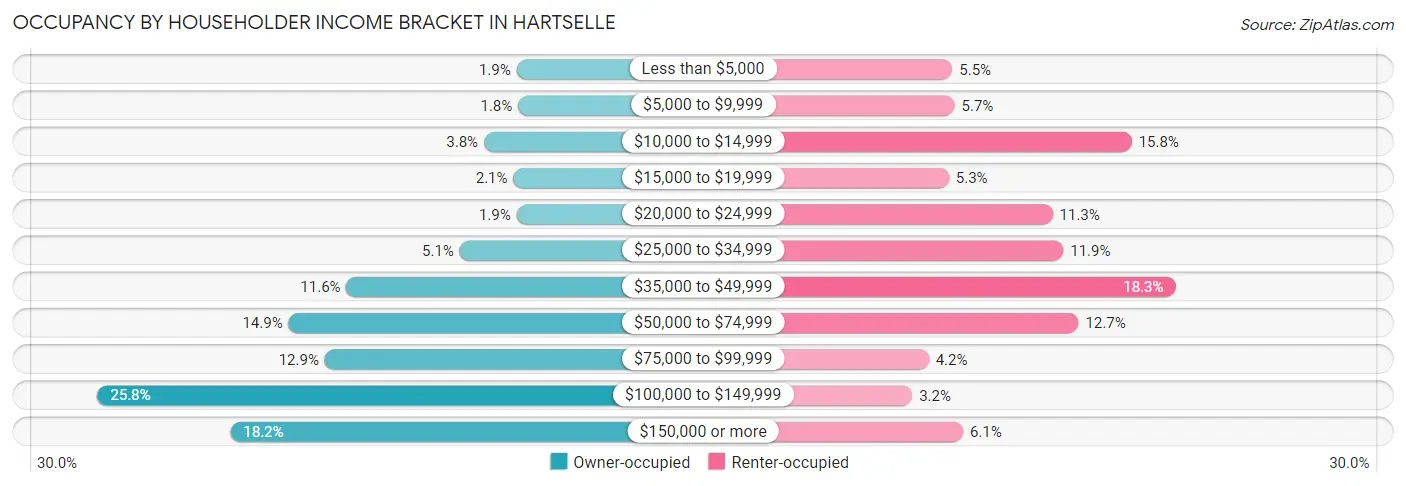
| Income Bracket | Owner-occupied | Renter-occupied |
| Less than $5,000 | 82 (1.9%) | 82 (5.5%) |
| $5,000 to $9,999 | 78 (1.8%) | 84 (5.7%) |
| $10,000 to $14,999 | 163 (3.7%) | 234 (15.8%) |
| $15,000 to $19,999 | 90 (2.1%) | 79 (5.3%) |
| $20,000 to $24,999 | 82 (1.9%) | 167 (11.3%) |
| $25,000 to $34,999 | 223 (5.1%) | 176 (11.9%) |
| $35,000 to $49,999 | 504 (11.6%) | 271 (18.3%) |
| $50,000 to $74,999 | 648 (14.9%) | 189 (12.7%) |
| $75,000 to $99,999 | 558 (12.9%) | 62 (4.2%) |
| $100,000 to $149,999 | 1,122 (25.8%) | 48 (3.2%) |
| $150,000 or more | 792 (18.2%) | 91 (6.1%) |
| Total | 4,342 (100.0%) | 1,483 (100.0%) |
Monthly Housing Cost Tiers in Hartselle
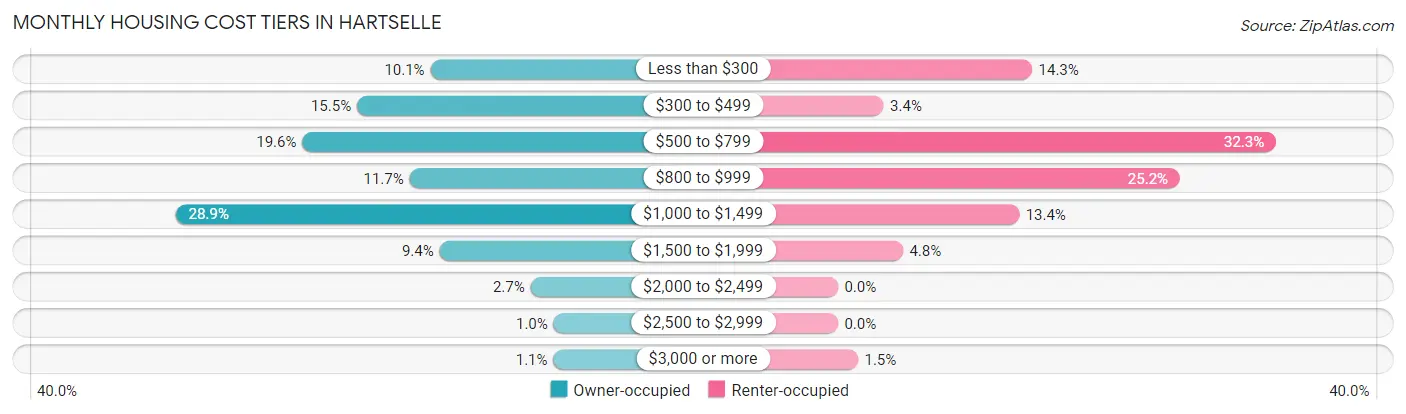
| Monthly Cost | Owner-occupied | Renter-occupied |
| Less than $300 | 439 (10.1%) | 212 (14.3%) |
| $300 to $499 | 674 (15.5%) | 50 (3.4%) |
| $500 to $799 | 849 (19.6%) | 479 (32.3%) |
| $800 to $999 | 506 (11.7%) | 374 (25.2%) |
| $1,000 to $1,499 | 1,254 (28.9%) | 198 (13.4%) |
| $1,500 to $1,999 | 410 (9.4%) | 71 (4.8%) |
| $2,000 to $2,499 | 119 (2.7%) | 0 (0.0%) |
| $2,500 to $2,999 | 45 (1.0%) | 0 (0.0%) |
| $3,000 or more | 46 (1.1%) | 22 (1.5%) |
| Total | 4,342 (100.0%) | 1,483 (100.0%) |
Physical Housing Characteristics in Hartselle
Housing Structures in Hartselle
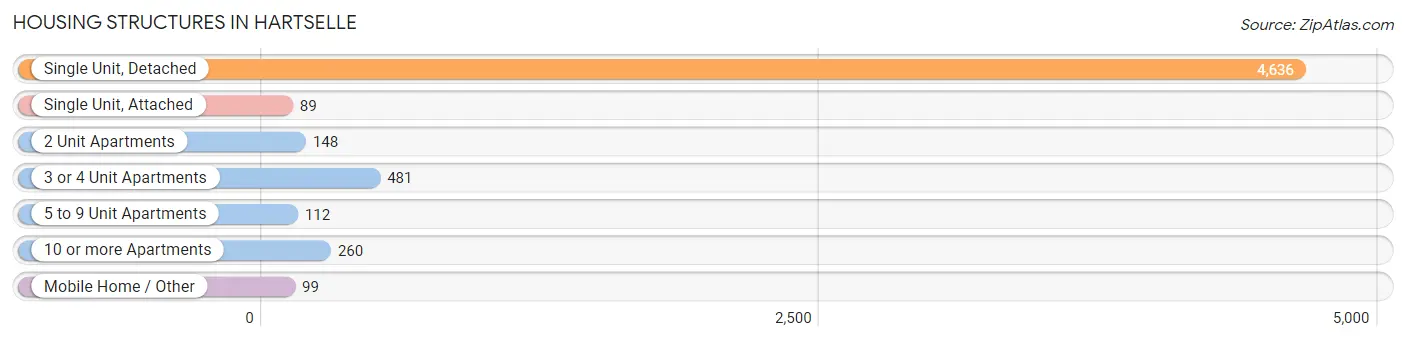
| Structure Type | # Housing Units | % Housing Units |
| Single Unit, Detached | 4,636 | 79.6% |
| Single Unit, Attached | 89 | 1.5% |
| 2 Unit Apartments | 148 | 2.5% |
| 3 or 4 Unit Apartments | 481 | 8.3% |
| 5 to 9 Unit Apartments | 112 | 1.9% |
| 10 or more Apartments | 260 | 4.5% |
| Mobile Home / Other | 99 | 1.7% |
| Total | 5,825 | 100.0% |
Housing Structures by Occupancy in Hartselle
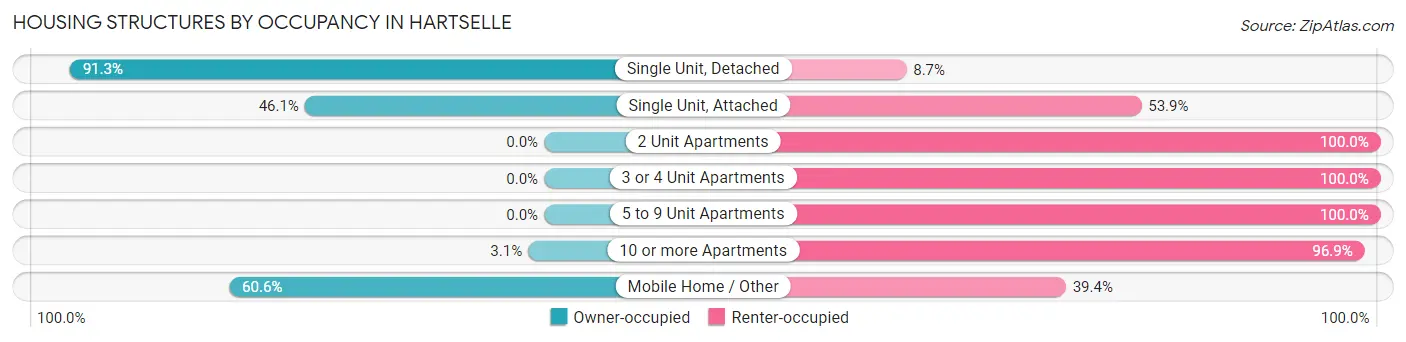
| Structure Type | Owner-occupied | Renter-occupied |
| Single Unit, Detached | 4,233 (91.3%) | 403 (8.7%) |
| Single Unit, Attached | 41 (46.1%) | 48 (53.9%) |
| 2 Unit Apartments | 0 (0.0%) | 148 (100.0%) |
| 3 or 4 Unit Apartments | 0 (0.0%) | 481 (100.0%) |
| 5 to 9 Unit Apartments | 0 (0.0%) | 112 (100.0%) |
| 10 or more Apartments | 8 (3.1%) | 252 (96.9%) |
| Mobile Home / Other | 60 (60.6%) | 39 (39.4%) |
| Total | 4,342 (74.5%) | 1,483 (25.5%) |
Housing Structures by Number of Rooms in Hartselle
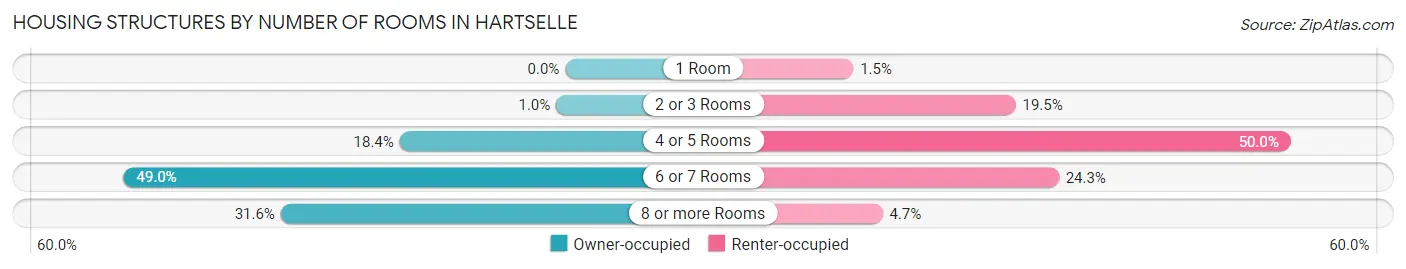
| Number of Rooms | Owner-occupied | Renter-occupied |
| 1 Room | 0 (0.0%) | 22 (1.5%) |
| 2 or 3 Rooms | 44 (1.0%) | 289 (19.5%) |
| 4 or 5 Rooms | 798 (18.4%) | 742 (50.0%) |
| 6 or 7 Rooms | 2,129 (49.0%) | 360 (24.3%) |
| 8 or more Rooms | 1,371 (31.6%) | 70 (4.7%) |
| Total | 4,342 (100.0%) | 1,483 (100.0%) |
Housing Structure by Heating Type in Hartselle
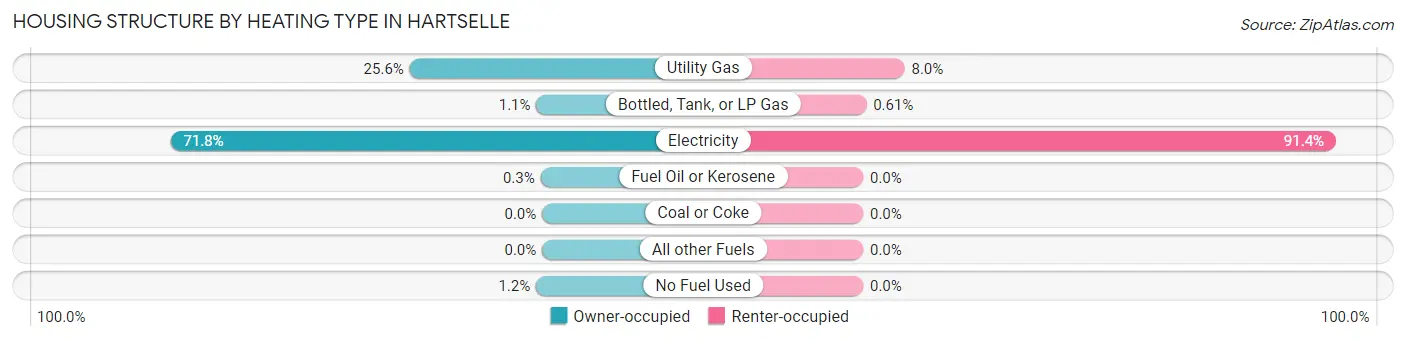
| Heating Type | Owner-occupied | Renter-occupied |
| Utility Gas | 1,111 (25.6%) | 119 (8.0%) |
| Bottled, Tank, or LP Gas | 48 (1.1%) | 9 (0.6%) |
| Electricity | 3,119 (71.8%) | 1,355 (91.4%) |
| Fuel Oil or Kerosene | 13 (0.3%) | 0 (0.0%) |
| Coal or Coke | 0 (0.0%) | 0 (0.0%) |
| All other Fuels | 0 (0.0%) | 0 (0.0%) |
| No Fuel Used | 51 (1.2%) | 0 (0.0%) |
| Total | 4,342 (100.0%) | 1,483 (100.0%) |
Household Vehicle Usage in Hartselle
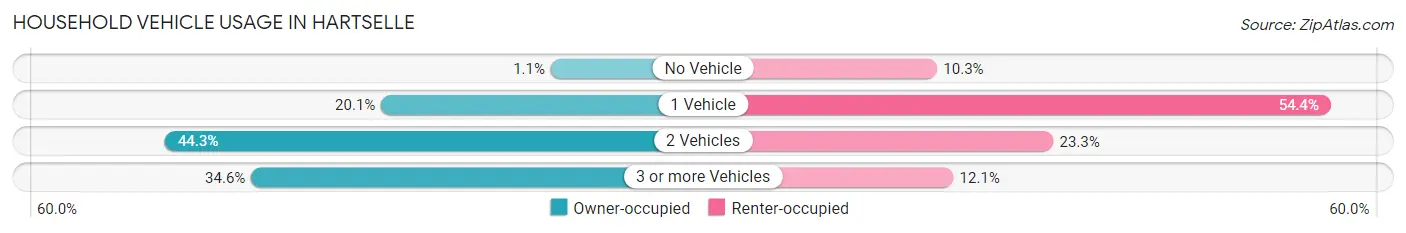
| Vehicles per Household | Owner-occupied | Renter-occupied |
| No Vehicle | 46 (1.1%) | 152 (10.2%) |
| 1 Vehicle | 871 (20.1%) | 807 (54.4%) |
| 2 Vehicles | 1,922 (44.3%) | 345 (23.3%) |
| 3 or more Vehicles | 1,503 (34.6%) | 179 (12.1%) |
| Total | 4,342 (100.0%) | 1,483 (100.0%) |
Real Estate & Mortgages in Hartselle
Real Estate and Mortgage Overview in Hartselle
| Characteristic | Without Mortgage | With Mortgage |
| Housing Units | 1,828 | 2,514 |
| Median Property Value | $164,300 | $179,700 |
| Median Household Income | $63,856 | $617 |
| Monthly Housing Costs | $455 | $46 |
| Real Estate Taxes | $544 | $201 |
Property Value by Mortgage Status in Hartselle
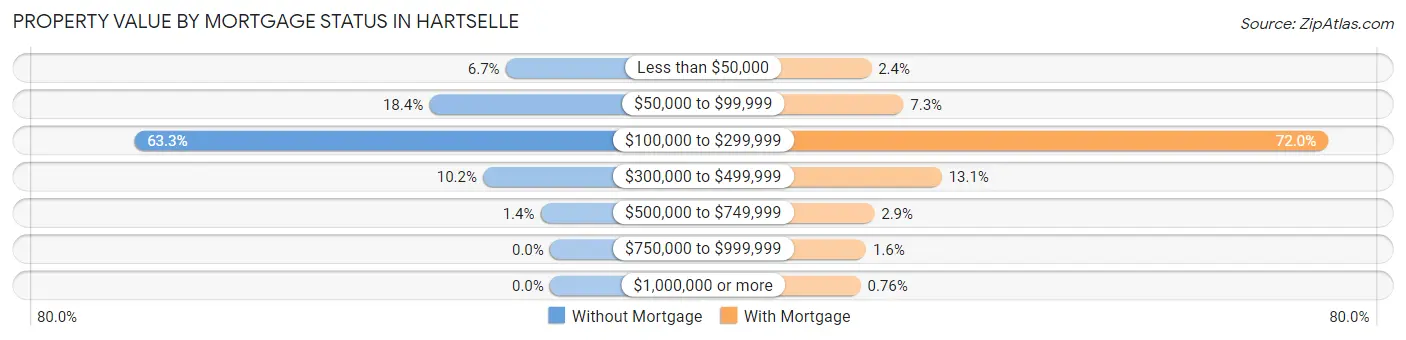
| Property Value | Without Mortgage | With Mortgage |
| Less than $50,000 | 123 (6.7%) | 60 (2.4%) |
| $50,000 to $99,999 | 336 (18.4%) | 183 (7.3%) |
| $100,000 to $299,999 | 1,157 (63.3%) | 1,810 (72.0%) |
| $300,000 to $499,999 | 186 (10.2%) | 330 (13.1%) |
| $500,000 to $749,999 | 26 (1.4%) | 72 (2.9%) |
| $750,000 to $999,999 | 0 (0.0%) | 40 (1.6%) |
| $1,000,000 or more | 0 (0.0%) | 19 (0.8%) |
| Total | 1,828 (100.0%) | 2,514 (100.0%) |
Household Income by Mortgage Status in Hartselle
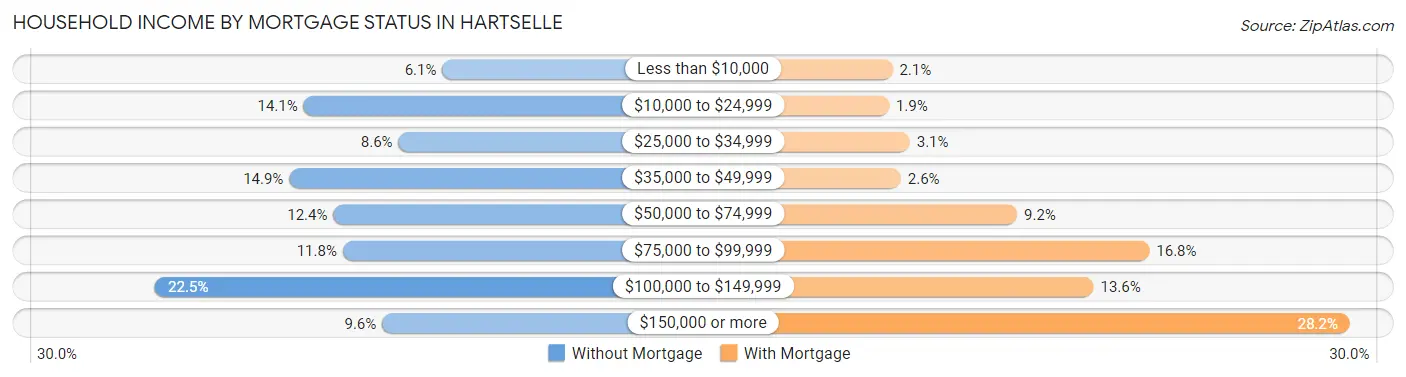
| Household Income | Without Mortgage | With Mortgage |
| Less than $10,000 | 112 (6.1%) | 53 (2.1%) |
| $10,000 to $24,999 | 257 (14.1%) | 48 (1.9%) |
| $25,000 to $34,999 | 158 (8.6%) | 78 (3.1%) |
| $35,000 to $49,999 | 272 (14.9%) | 65 (2.6%) |
| $50,000 to $74,999 | 226 (12.4%) | 232 (9.2%) |
| $75,000 to $99,999 | 216 (11.8%) | 422 (16.8%) |
| $100,000 to $149,999 | 412 (22.5%) | 342 (13.6%) |
| $150,000 or more | 175 (9.6%) | 710 (28.2%) |
| Total | 1,828 (100.0%) | 2,514 (100.0%) |
Property Value to Household Income Ratio in Hartselle
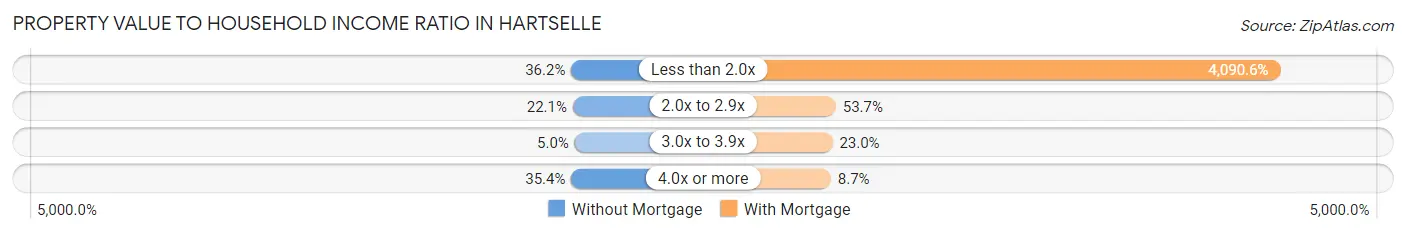
| Value-to-Income Ratio | Without Mortgage | With Mortgage |
| Less than 2.0x | 662 (36.2%) | 102,838 (4,090.6%) |
| 2.0x to 2.9x | 404 (22.1%) | 1,350 (53.7%) |
| 3.0x to 3.9x | 92 (5.0%) | 578 (23.0%) |
| 4.0x or more | 647 (35.4%) | 218 (8.7%) |
| Total | 1,828 (100.0%) | 2,514 (100.0%) |
Real Estate Taxes by Mortgage Status in Hartselle
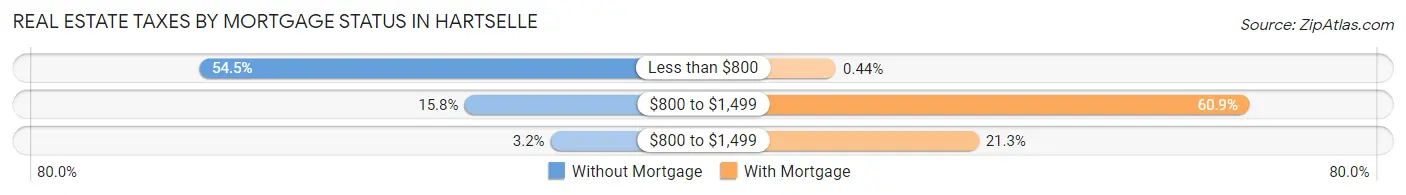
| Property Taxes | Without Mortgage | With Mortgage |
| Less than $800 | 996 (54.5%) | 11 (0.4%) |
| $800 to $1,499 | 288 (15.8%) | 1,531 (60.9%) |
| $800 to $1,499 | 58 (3.2%) | 535 (21.3%) |
| Total | 1,828 (100.0%) | 2,514 (100.0%) |
Health & Disability in Hartselle
Health Insurance Coverage by Age in Hartselle
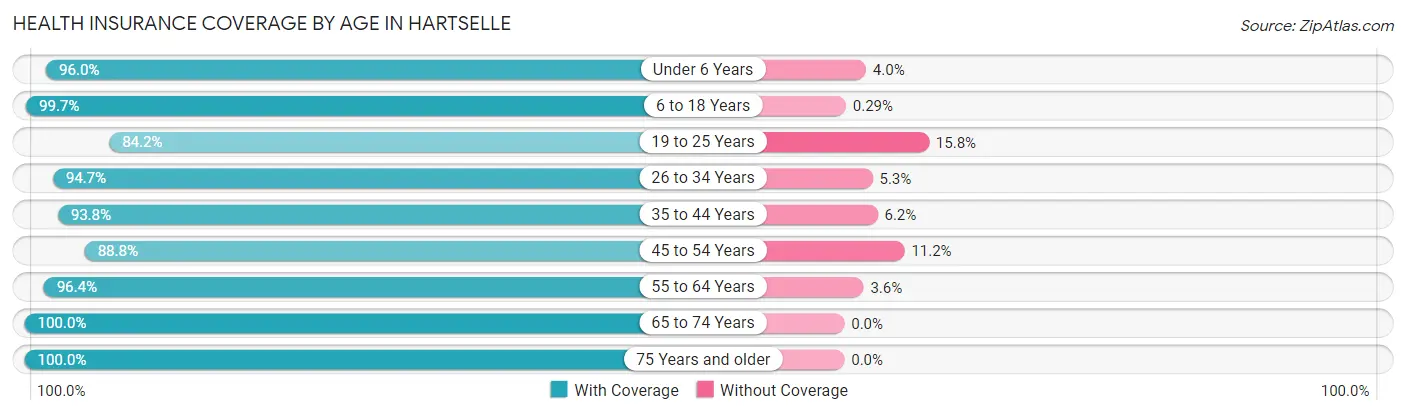
| Age Bracket | With Coverage | Without Coverage |
| Under 6 Years | 1,024 (96.0%) | 43 (4.0%) |
| 6 to 18 Years | 2,792 (99.7%) | 8 (0.3%) |
| 19 to 25 Years | 1,089 (84.2%) | 204 (15.8%) |
| 26 to 34 Years | 1,584 (94.7%) | 88 (5.3%) |
| 35 to 44 Years | 1,693 (93.8%) | 112 (6.2%) |
| 45 to 54 Years | 1,867 (88.8%) | 236 (11.2%) |
| 55 to 64 Years | 1,864 (96.4%) | 69 (3.6%) |
| 65 to 74 Years | 1,534 (100.0%) | 0 (0.0%) |
| 75 Years and older | 1,195 (100.0%) | 0 (0.0%) |
| Total | 14,642 (95.1%) | 760 (4.9%) |
Health Insurance Coverage by Citizenship Status in Hartselle
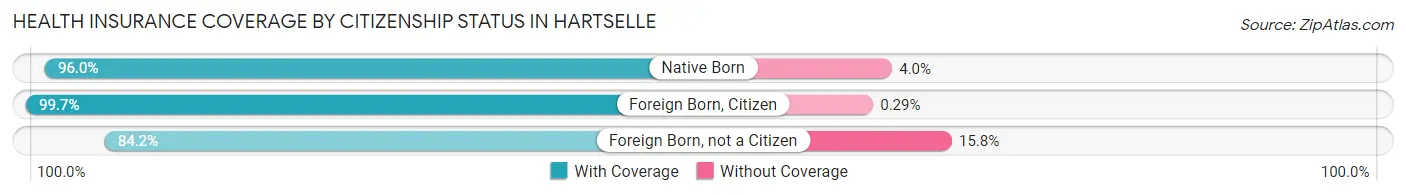
| Citizenship Status | With Coverage | Without Coverage |
| Native Born | 1,024 (96.0%) | 43 (4.0%) |
| Foreign Born, Citizen | 2,792 (99.7%) | 8 (0.3%) |
| Foreign Born, not a Citizen | 1,089 (84.2%) | 204 (15.8%) |
Health Insurance Coverage by Household Income in Hartselle
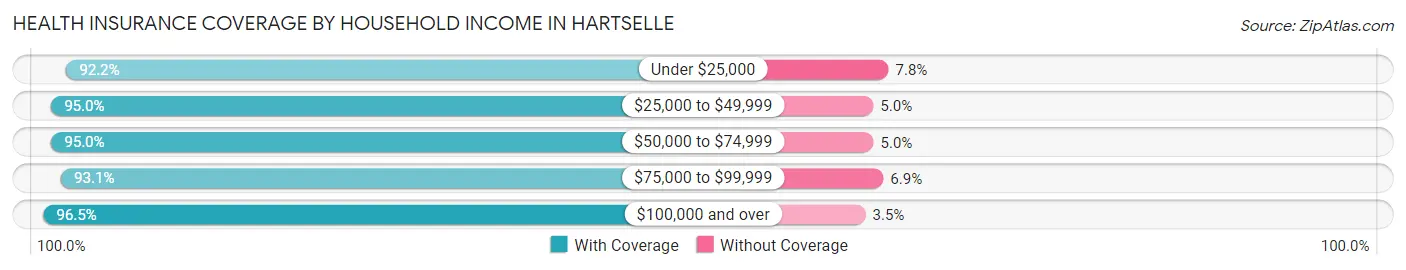
| Household Income | With Coverage | Without Coverage |
| Under $25,000 | 1,860 (92.2%) | 158 (7.8%) |
| $25,000 to $49,999 | 2,400 (95.0%) | 126 (5.0%) |
| $50,000 to $74,999 | 2,098 (95.0%) | 111 (5.0%) |
| $75,000 to $99,999 | 1,602 (93.1%) | 118 (6.9%) |
| $100,000 and over | 6,673 (96.5%) | 244 (3.5%) |
Public vs Private Health Insurance Coverage by Age in Hartselle
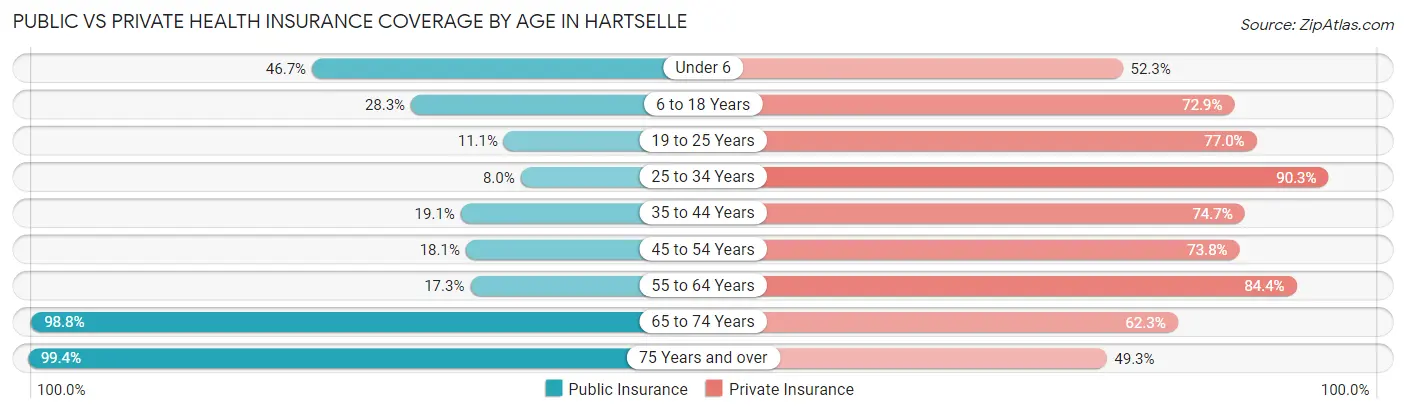
| Age Bracket | Public Insurance | Private Insurance |
| Under 6 | 498 (46.7%) | 558 (52.3%) |
| 6 to 18 Years | 792 (28.3%) | 2,040 (72.9%) |
| 19 to 25 Years | 143 (11.1%) | 995 (76.9%) |
| 25 to 34 Years | 133 (8.0%) | 1,510 (90.3%) |
| 35 to 44 Years | 344 (19.1%) | 1,349 (74.7%) |
| 45 to 54 Years | 381 (18.1%) | 1,552 (73.8%) |
| 55 to 64 Years | 334 (17.3%) | 1,631 (84.4%) |
| 65 to 74 Years | 1,515 (98.8%) | 956 (62.3%) |
| 75 Years and over | 1,188 (99.4%) | 589 (49.3%) |
| Total | 5,328 (34.6%) | 11,180 (72.6%) |
Disability Status by Sex by Age in Hartselle
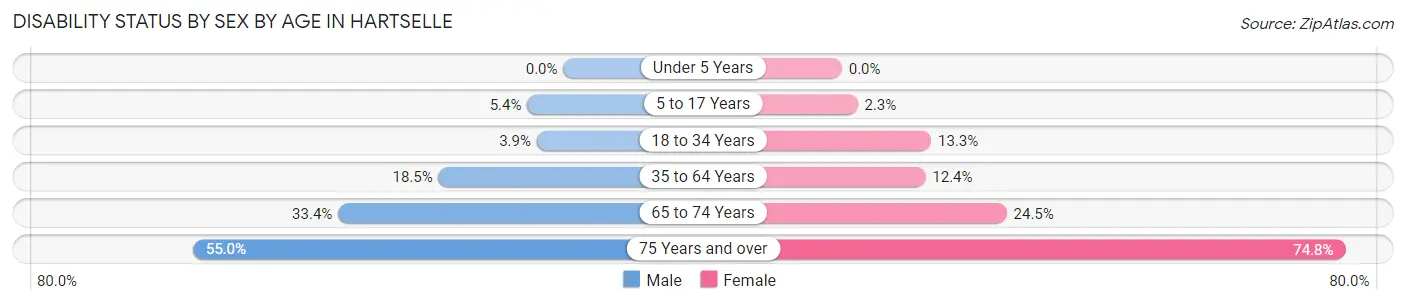
| Age Bracket | Male | Female |
| Under 5 Years | 0 (0.0%) | 0 (0.0%) |
| 5 to 17 Years | 84 (5.3%) | 26 (2.3%) |
| 18 to 34 Years | 54 (3.9%) | 244 (13.3%) |
| 35 to 64 Years | 446 (18.5%) | 426 (12.4%) |
| 65 to 74 Years | 211 (33.4%) | 221 (24.5%) |
| 75 Years and over | 241 (55.0%) | 566 (74.8%) |
Disability Class by Sex by Age in Hartselle
Disability Class: Hearing Difficulty
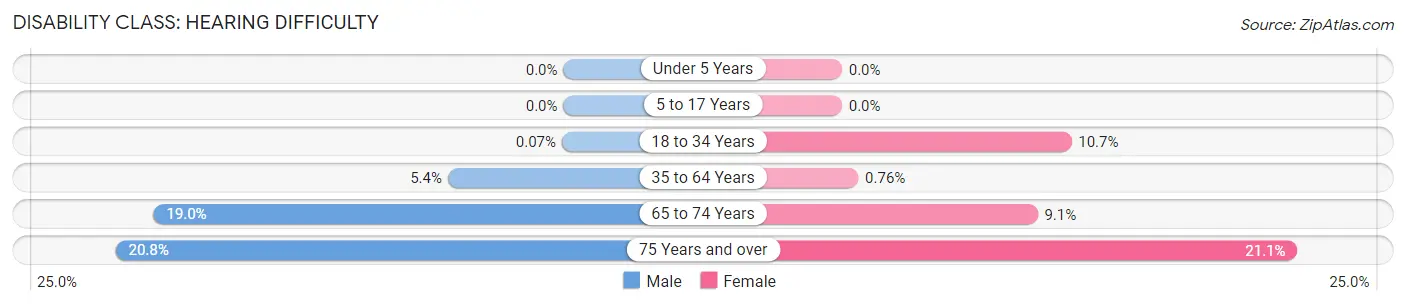
| Age Bracket | Male | Female |
| Under 5 Years | 0 (0.0%) | 0 (0.0%) |
| 5 to 17 Years | 0 (0.0%) | 0 (0.0%) |
| 18 to 34 Years | 1 (0.1%) | 196 (10.6%) |
| 35 to 64 Years | 129 (5.4%) | 26 (0.8%) |
| 65 to 74 Years | 120 (19.0%) | 82 (9.1%) |
| 75 Years and over | 91 (20.8%) | 160 (21.1%) |
Disability Class: Vision Difficulty
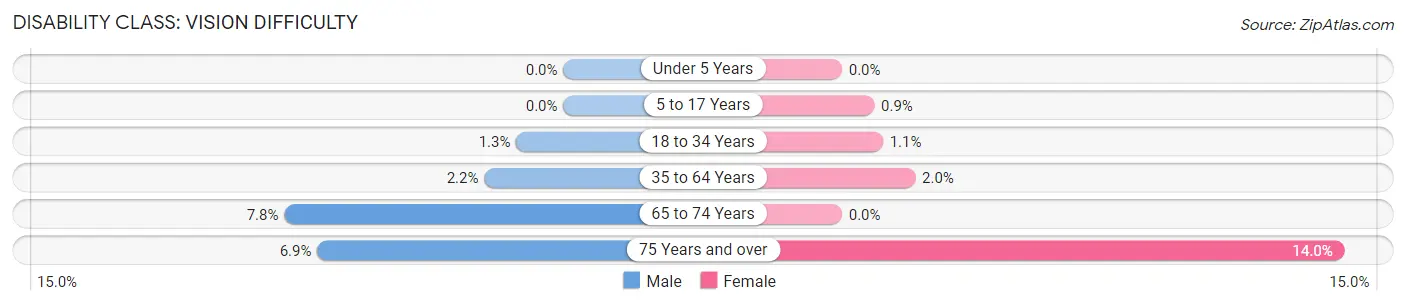
| Age Bracket | Male | Female |
| Under 5 Years | 0 (0.0%) | 0 (0.0%) |
| 5 to 17 Years | 0 (0.0%) | 10 (0.9%) |
| 18 to 34 Years | 18 (1.3%) | 21 (1.1%) |
| 35 to 64 Years | 53 (2.2%) | 70 (2.0%) |
| 65 to 74 Years | 49 (7.8%) | 0 (0.0%) |
| 75 Years and over | 30 (6.9%) | 106 (14.0%) |
Disability Class: Cognitive Difficulty
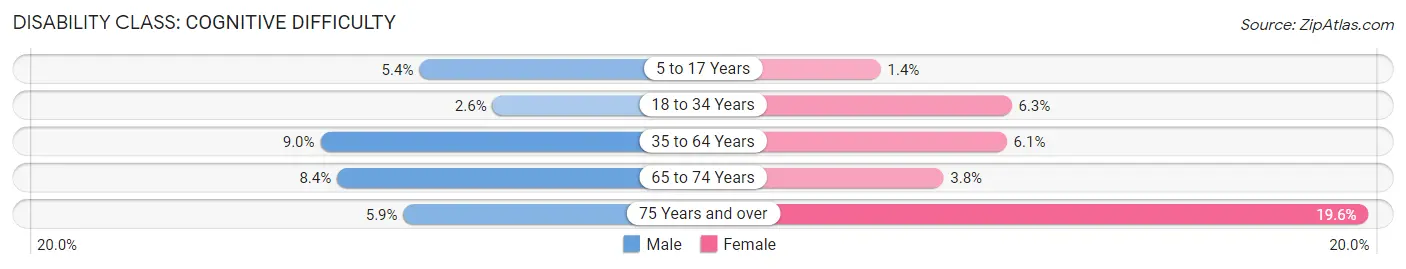
| Age Bracket | Male | Female |
| 5 to 17 Years | 84 (5.3%) | 16 (1.4%) |
| 18 to 34 Years | 36 (2.6%) | 116 (6.3%) |
| 35 to 64 Years | 217 (9.0%) | 210 (6.1%) |
| 65 to 74 Years | 53 (8.4%) | 34 (3.8%) |
| 75 Years and over | 26 (5.9%) | 148 (19.6%) |
Disability Class: Ambulatory Difficulty
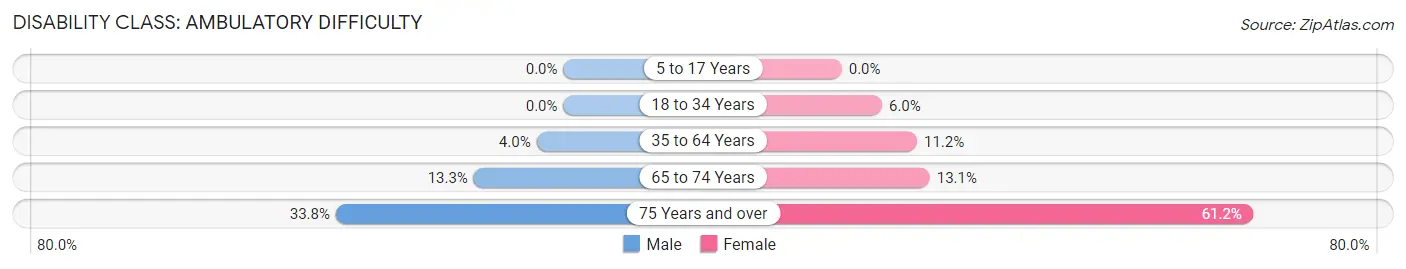
| Age Bracket | Male | Female |
| 5 to 17 Years | 0 (0.0%) | 0 (0.0%) |
| 18 to 34 Years | 0 (0.0%) | 110 (6.0%) |
| 35 to 64 Years | 96 (4.0%) | 384 (11.2%) |
| 65 to 74 Years | 84 (13.3%) | 118 (13.1%) |
| 75 Years and over | 148 (33.8%) | 463 (61.2%) |
Disability Class: Self-Care Difficulty
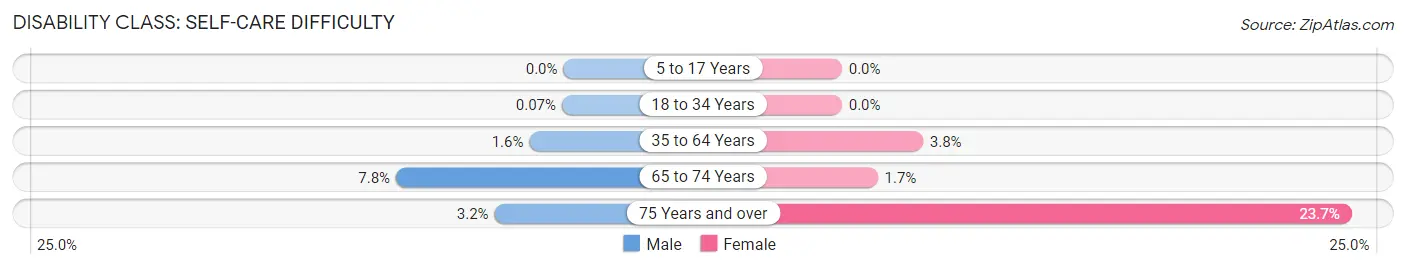
| Age Bracket | Male | Female |
| 5 to 17 Years | 0 (0.0%) | 0 (0.0%) |
| 18 to 34 Years | 1 (0.1%) | 0 (0.0%) |
| 35 to 64 Years | 38 (1.6%) | 129 (3.8%) |
| 65 to 74 Years | 49 (7.8%) | 15 (1.7%) |
| 75 Years and over | 14 (3.2%) | 179 (23.6%) |
Technology Access in Hartselle
Computing Device Access in Hartselle
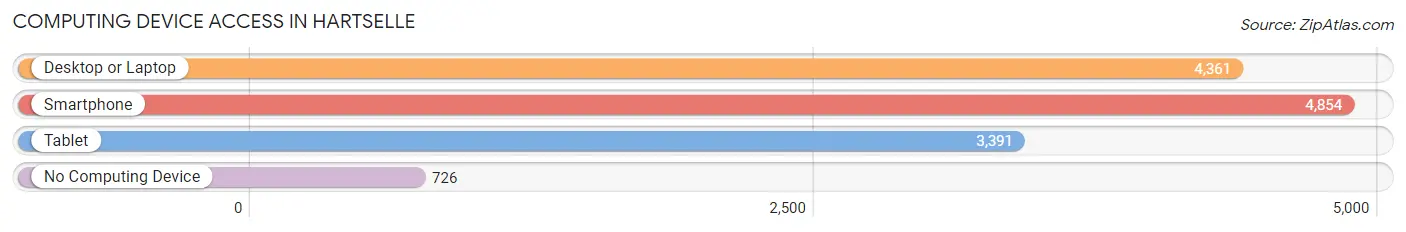
| Device Type | # Households | % Households |
| Desktop or Laptop | 4,361 | 74.9% |
| Smartphone | 4,854 | 83.3% |
| Tablet | 3,391 | 58.2% |
| No Computing Device | 726 | 12.5% |
| Total | 5,825 | 100.0% |
Internet Access in Hartselle
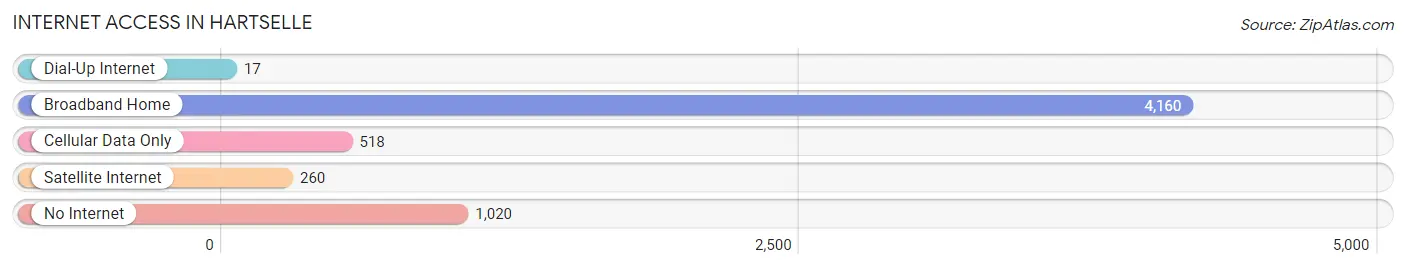
| Internet Type | # Households | % Households |
| Dial-Up Internet | 17 | 0.3% |
| Broadband Home | 4,160 | 71.4% |
| Cellular Data Only | 518 | 8.9% |
| Satellite Internet | 260 | 4.5% |
| No Internet | 1,020 | 17.5% |
| Total | 5,825 | 100.0% |
Hartselle Summary
Hartselle, Alabama is a city located in Morgan County, Alabama, United States. It is part of the Decatur Metropolitan Statistical Area. The population was 14,255 at the 2010 census.
History
Hartselle was founded in 1870 by William Hartsell, a former Confederate soldier. The town was named after him and was incorporated in 1875. The town was originally a farming community, but it soon developed into a manufacturing center. The first industry in Hartselle was a cotton mill, which was built in 1887. The town also had a brick factory, a sawmill, and a grist mill.
In the early 1900s, the town began to grow rapidly. The population increased from 1,000 in 1900 to 4,000 in 1920. The town was also home to several churches, schools, and businesses.
In the 1950s, the town began to experience a decline in population. This was due to the decline of the cotton industry and the rise of the automobile industry. The population decreased to 3,000 in 1960.
In the 1970s, the town began to experience a resurgence. The population increased to 8,000 in 1980. This was due to the growth of the manufacturing industry and the development of the city's infrastructure.
Geography
Hartselle is located at 34°26'45" North, 86°54'45" West (34.4459, -86.9125). The city is situated in the foothills of the Appalachian Mountains. The city is located in the Tennessee Valley and is part of the Decatur Metropolitan Statistical Area.
The city has a total area of 16.2 square miles, of which 16.1 square miles is land and 0.1 square miles is water. The city is located near the Tennessee River and is surrounded by several lakes, including Lake Guntersville, Lake Wheeler, and Lake Wilson.
Economy
The economy of Hartselle is largely based on manufacturing. The city is home to several large manufacturing companies, including Hartselle Industries, Inc., which produces automotive parts, and Hartselle Foundry, which produces castings for the automotive industry.
The city is also home to several small businesses, including restaurants, retail stores, and service providers. The city is also home to several educational institutions, including the University of Alabama in Huntsville and Wallace State Community College.
Demographics
As of the 2010 census, the population of Hartselle was 14,255. The racial makeup of the city was 79.2% White, 17.2% African American, 0.4% Native American, 0.7% Asian, 0.1% Pacific Islander, 1.2% from other races, and 1.2% from two or more races. Hispanic or Latino of any race were 2.7% of the population.
The median income for a household in the city was $37,945, and the median income for a family was $45,945. The per capita income for the city was $19,945. About 11.2% of families and 14.2% of the population were below the poverty line, including 19.2% of those under age 18 and 10.2% of those age 65 or over.
Common Questions
What is Per Capita Income in Hartselle?
Per Capita income in Hartselle is $33,007.
What is the Median Family Income in Hartselle?
Median Family Income in Hartselle is $89,781.
What is the Median Household income in Hartselle?
Median Household Income in Hartselle is $64,876.
What is Income or Wage Gap in Hartselle?
Income or Wage Gap in Hartselle is 45.7%.
Women in Hartselle earn 54.3 cents for every dollar earned by a man.
What is Family Income Deficit in Hartselle?
Family Income Deficit in Hartselle is $9,742.
Families that are below poverty line in Hartselle earn $9,742 less on average than the poverty threshold level.
What is Inequality or Gini Index in Hartselle?
Inequality or Gini Index in Hartselle is 0.43.
What is the Total Population of Hartselle?
Total Population of Hartselle is 15,414.
What is the Total Male Population of Hartselle?
Total Male Population of Hartselle is 6,923.
What is the Total Female Population of Hartselle?
Total Female Population of Hartselle is 8,491.
What is the Ratio of Males per 100 Females in Hartselle?
There are 81.53 Males per 100 Females in Hartselle.
What is the Ratio of Females per 100 Males in Hartselle?
There are 122.65 Females per 100 Males in Hartselle.
What is the Median Population Age in Hartselle?
Median Population Age in Hartselle is 39.6 Years.
What is the Average Family Size in Hartselle
Average Family Size in Hartselle is 3.2 People.
What is the Average Household Size in Hartselle
Average Household Size in Hartselle is 2.6 People.
How Large is the Labor Force in Hartselle?
There are 7,276 People in the Labor Forcein in Hartselle.
What is the Percentage of People in the Labor Force in Hartselle?
59.2% of People are in the Labor Force in Hartselle.
What is the Unemployment Rate in Hartselle?
Unemployment Rate in Hartselle is 3.9%.