Jacksonville, AL Map & Demographics
Jacksonville Map
Jacksonville Overview
$24,334
PER CAPITA INCOME
$62,715
AVG FAMILY INCOME
$46,451
AVG HOUSEHOLD INCOME
17.0%
WAGE / INCOME GAP [ % ]
83.0¢/ $1
WAGE / INCOME GAP [ $ ]
$6,643
FAMILY INCOME DEFICIT
0.48
INEQUALITY / GINI INDEX
14,227
TOTAL POPULATION
6,606
MALE POPULATION
7,621
FEMALE POPULATION
86.68
MALES / 100 FEMALES
115.36
FEMALES / 100 MALES
28.8
MEDIAN AGE
3.0
AVG FAMILY SIZE
2.2
AVG HOUSEHOLD SIZE
7,144
LABOR FORCE [ PEOPLE ]
57.9%
PERCENT IN LABOR FORCE
6.9%
UNEMPLOYMENT RATE
Jacksonville Zip Codes
Jacksonville Area Codes
Income in Jacksonville
Income Overview in Jacksonville
Per Capita Income in Jacksonville is $24,334, while median incomes of families and households are $62,715 and $46,451 respectively.
| Characteristic | Number | Measure |
| Per Capita Income | 14,227 | $24,334 |
| Median Family Income | 2,651 | $62,715 |
| Mean Family Income | 2,651 | $80,863 |
| Median Household Income | 5,364 | $46,451 |
| Mean Household Income | 5,364 | $60,429 |
| Income Deficit | 2,651 | $6,643 |
| Wage / Income Gap (%) | 14,227 | 16.99% |
| Wage / Income Gap ($) | 14,227 | 83.01¢ per $1 |
| Gini / Inequality Index | 14,227 | 0.48 |
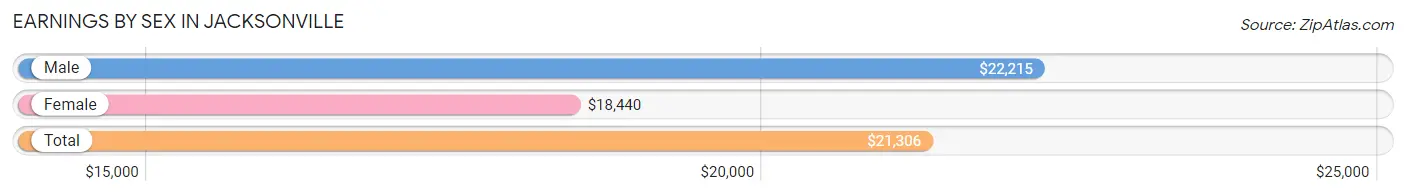
Earnings by Sex in Jacksonville
Average Earnings in Jacksonville are $21,306, $22,215 for men and $18,440 for women, a difference of 17.0%.
| Sex | Number | Average Earnings |
| Male | 3,744 (47.6%) | $22,215 |
| Female | 4,118 (52.4%) | $18,440 |
| Total | 7,862 (100.0%) | $21,306 |
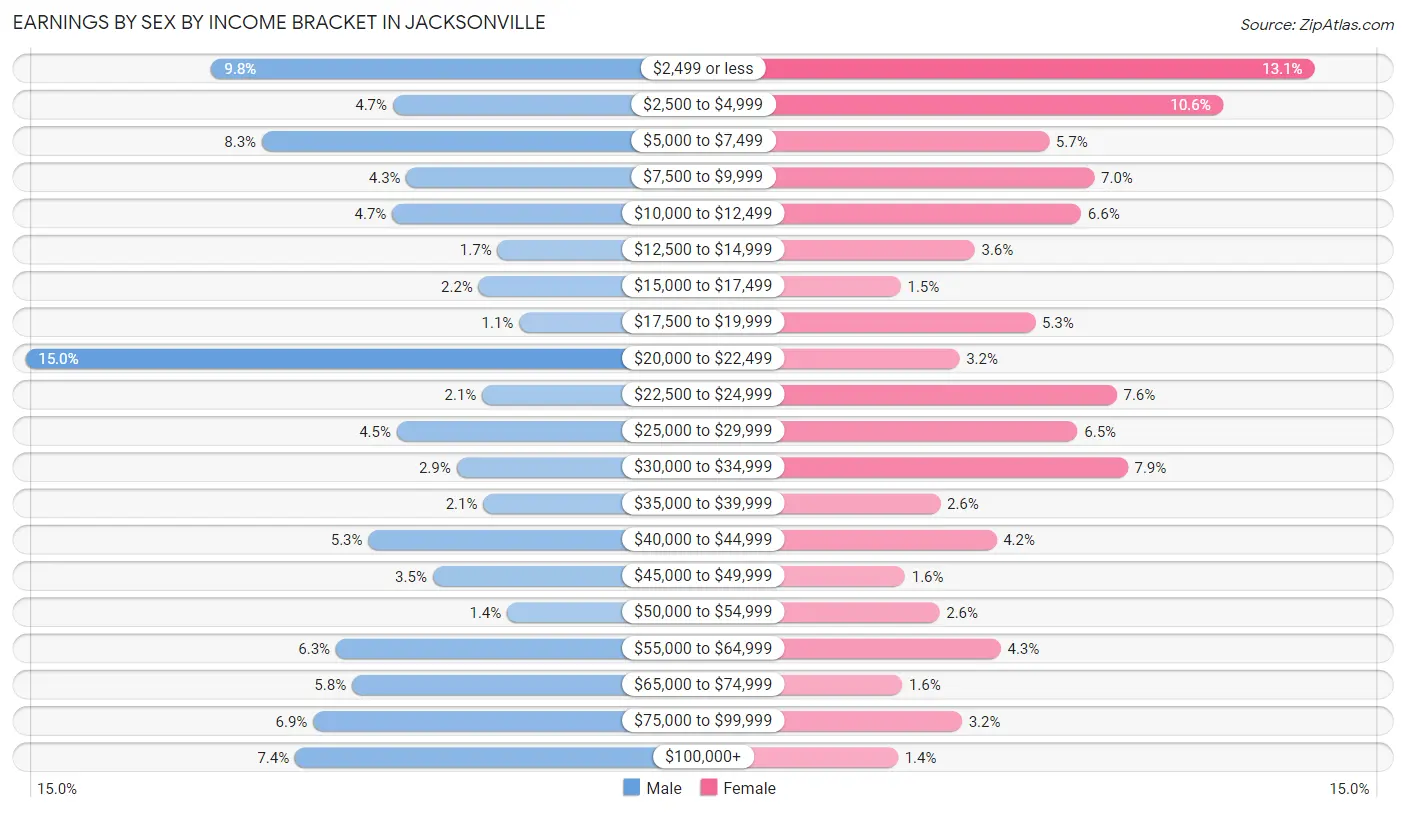
Earnings by Sex by Income Bracket in Jacksonville
The most common earnings brackets in Jacksonville are $20,000 to $22,499 for men (561 | 15.0%) and $2,499 or less for women (541 | 13.1%).
| Income | Male | Female |
| $2,499 or less | 365 (9.8%) | 541 (13.1%) |
| $2,500 to $4,999 | 174 (4.6%) | 435 (10.6%) |
| $5,000 to $7,499 | 312 (8.3%) | 234 (5.7%) |
| $7,500 to $9,999 | 160 (4.3%) | 286 (7.0%) |
| $10,000 to $12,499 | 175 (4.7%) | 271 (6.6%) |
| $12,500 to $14,999 | 64 (1.7%) | 148 (3.6%) |
| $15,000 to $17,499 | 84 (2.2%) | 62 (1.5%) |
| $17,500 to $19,999 | 41 (1.1%) | 218 (5.3%) |
| $20,000 to $22,499 | 561 (15.0%) | 130 (3.2%) |
| $22,500 to $24,999 | 80 (2.1%) | 312 (7.6%) |
| $25,000 to $29,999 | 170 (4.5%) | 267 (6.5%) |
| $30,000 to $34,999 | 107 (2.9%) | 325 (7.9%) |
| $35,000 to $39,999 | 79 (2.1%) | 108 (2.6%) |
| $40,000 to $44,999 | 200 (5.3%) | 173 (4.2%) |
| $45,000 to $49,999 | 132 (3.5%) | 67 (1.6%) |
| $50,000 to $54,999 | 54 (1.4%) | 107 (2.6%) |
| $55,000 to $64,999 | 234 (6.2%) | 178 (4.3%) |
| $65,000 to $74,999 | 217 (5.8%) | 64 (1.5%) |
| $75,000 to $99,999 | 258 (6.9%) | 133 (3.2%) |
| $100,000+ | 277 (7.4%) | 59 (1.4%) |
| Total | 3,744 (100.0%) | 4,118 (100.0%) |
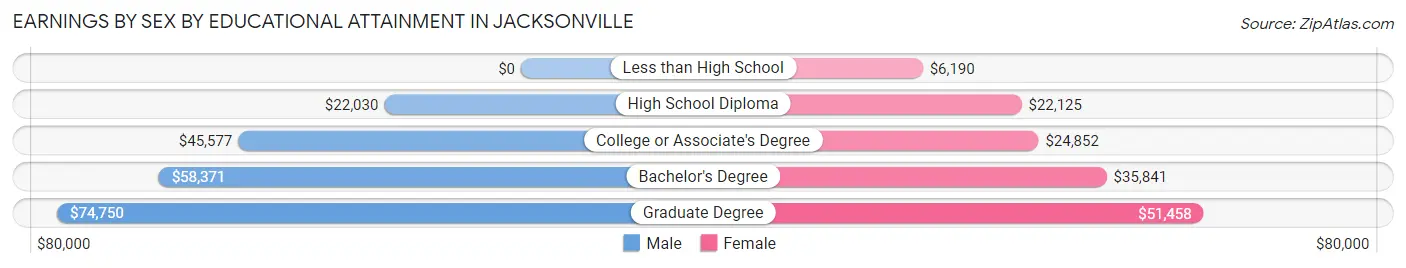
Earnings by Sex by Educational Attainment in Jacksonville
Average earnings in Jacksonville are $41,572 for men and $27,853 for women, a difference of 33.0%. Men with an educational attainment of graduate degree enjoy the highest average annual earnings of $74,750, while those with high school diploma education earn the least with $22,030. Women with an educational attainment of graduate degree earn the most with the average annual earnings of $51,458, while those with less than high school education have the smallest earnings of $6,190.
| Educational Attainment | Male Income | Female Income |
| Less than High School | - | - |
| High School Diploma | $22,030 | $22,125 |
| College or Associate's Degree | $45,577 | $24,852 |
| Bachelor's Degree | $58,371 | $35,841 |
| Graduate Degree | $74,750 | $51,458 |
| Total | $41,572 | $27,853 |
Family Income in Jacksonville
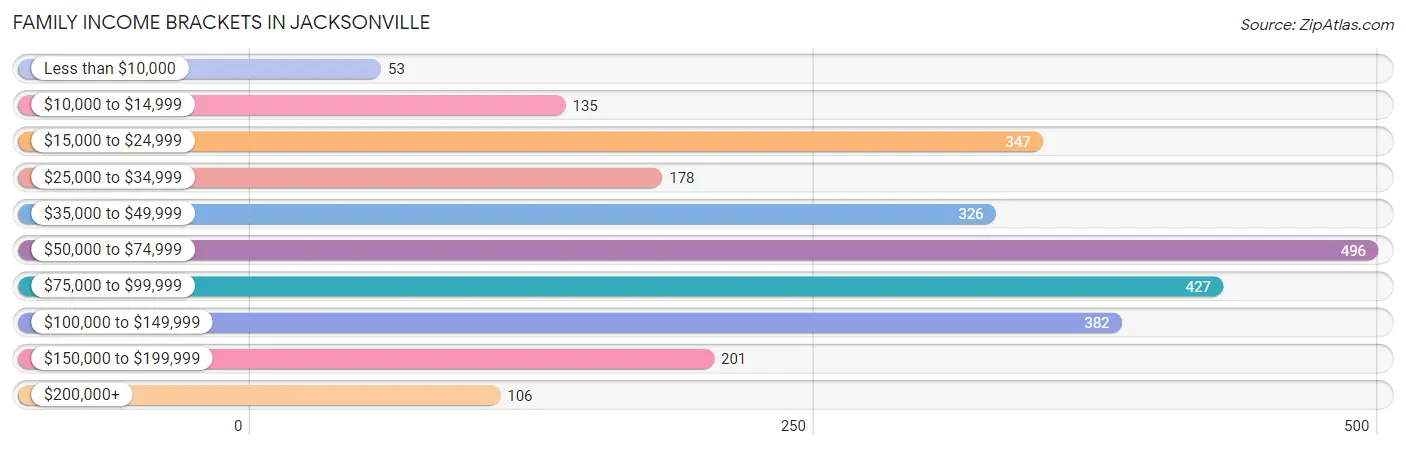
Family Income Brackets in Jacksonville
According to the Jacksonville family income data, there are 496 families falling into the $50,000 to $74,999 income range, which is the most common income bracket and makes up 18.7% of all families. Conversely, the less than $10,000 income bracket is the least frequent group with only 53 families (2.0%) belonging to this category.
| Income Bracket | # Families | % Families |
| Less than $10,000 | 53 | 2.0% |
| $10,000 to $14,999 | 135 | 5.1% |
| $15,000 to $24,999 | 347 | 13.1% |
| $25,000 to $34,999 | 178 | 6.7% |
| $35,000 to $49,999 | 326 | 12.3% |
| $50,000 to $74,999 | 496 | 18.7% |
| $75,000 to $99,999 | 427 | 16.1% |
| $100,000 to $149,999 | 382 | 14.4% |
| $150,000 to $199,999 | 201 | 7.6% |
| $200,000+ | 106 | 4.0% |
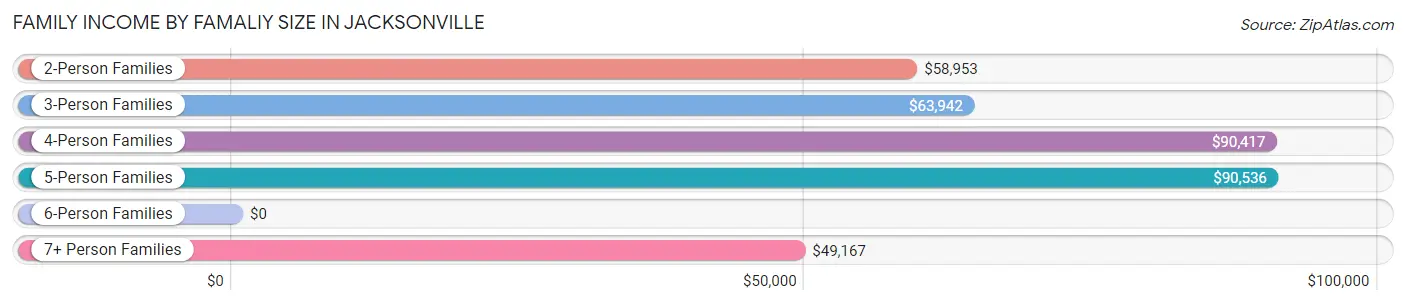
Family Income by Famaliy Size in Jacksonville
5-person families (115 | 4.3%) account for the highest median family income in Jacksonville with $90,536 per family, while 2-person families (1,336 | 50.4%) have the highest median income of $29,476 per family member.
| Income Bracket | # Families | Median Income |
| 2-Person Families | 1,336 (50.4%) | $58,953 |
| 3-Person Families | 755 (28.5%) | $63,942 |
| 4-Person Families | 406 (15.3%) | $90,417 |
| 5-Person Families | 115 (4.3%) | $90,536 |
| 6-Person Families | 7 (0.3%) | $0 |
| 7+ Person Families | 32 (1.2%) | $49,167 |
| Total | 2,651 (100.0%) | $62,715 |
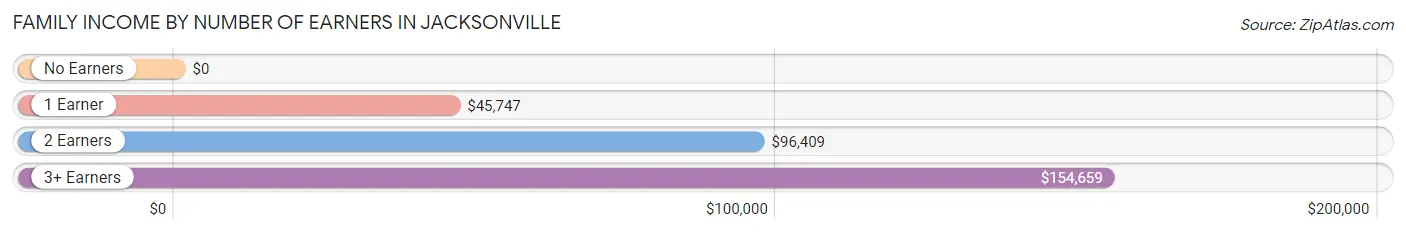
Family Income by Number of Earners in Jacksonville
| Number of Earners | # Families | Median Income |
| No Earners | 270 (10.2%) | $0 |
| 1 Earner | 1,128 (42.5%) | $45,747 |
| 2 Earners | 1,092 (41.2%) | $96,409 |
| 3+ Earners | 161 (6.1%) | $154,659 |
| Total | 2,651 (100.0%) | $62,715 |
Household Income in Jacksonville
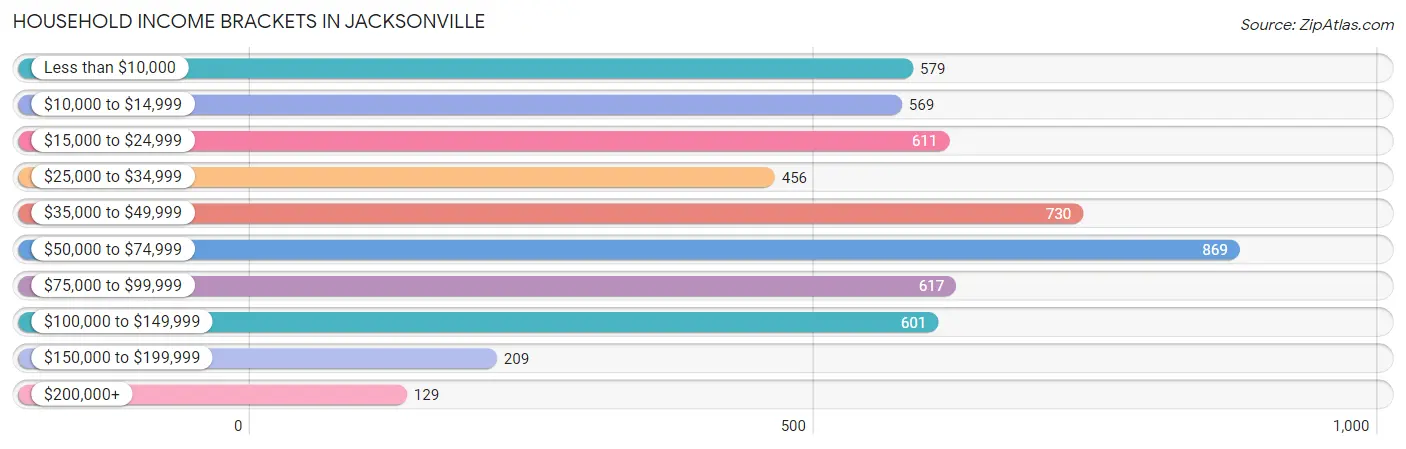
Household Income Brackets in Jacksonville
With 869 households falling in the category, the $50,000 to $74,999 income range is the most frequent in Jacksonville, accounting for 16.2% of all households. In contrast, only 129 households (2.4%) fall into the $200,000+ income bracket, making it the least populous group.
| Income Bracket | # Households | % Households |
| Less than $10,000 | 579 | 10.8% |
| $10,000 to $14,999 | 569 | 10.6% |
| $15,000 to $24,999 | 611 | 11.4% |
| $25,000 to $34,999 | 456 | 8.5% |
| $35,000 to $49,999 | 730 | 13.6% |
| $50,000 to $74,999 | 869 | 16.2% |
| $75,000 to $99,999 | 617 | 11.5% |
| $100,000 to $149,999 | 601 | 11.2% |
| $150,000 to $199,999 | 209 | 3.9% |
| $200,000+ | 129 | 2.4% |
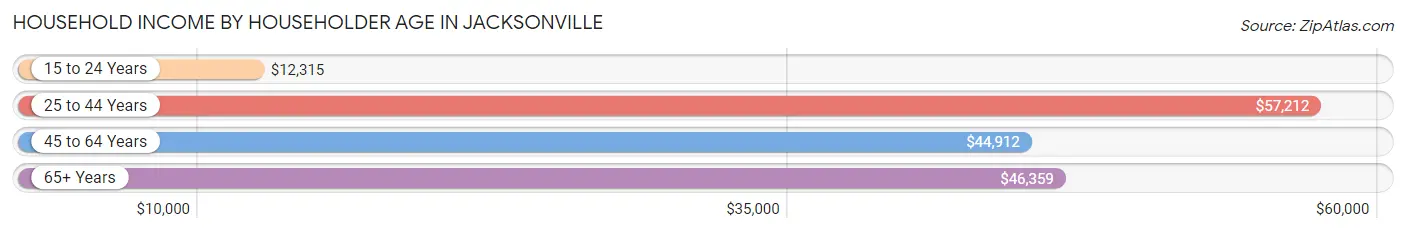
Household Income by Householder Age in Jacksonville
The median household income in Jacksonville is $46,451, with the highest median household income of $57,212 found in the 25 to 44 years age bracket for the primary householder. A total of 1,701 households (31.7%) fall into this category. Meanwhile, the 15 to 24 years age bracket for the primary householder has the lowest median household income of $12,315, with 710 households (13.2%) in this group.
| Income Bracket | # Households | Median Income |
| 15 to 24 Years | 710 (13.2%) | $12,315 |
| 25 to 44 Years | 1,701 (31.7%) | $57,212 |
| 45 to 64 Years | 1,803 (33.6%) | $44,912 |
| 65+ Years | 1,150 (21.4%) | $46,359 |
| Total | 5,364 (100.0%) | $46,451 |
Poverty in Jacksonville
Income Below Poverty by Sex and Age in Jacksonville
With 22.8% poverty level for males and 31.9% for females among the residents of Jacksonville, 18 to 24 year old males and 18 to 24 year old females are the most vulnerable to poverty, with 571 males (57.2%) and 953 females (66.6%) in their respective age groups living below the poverty level.
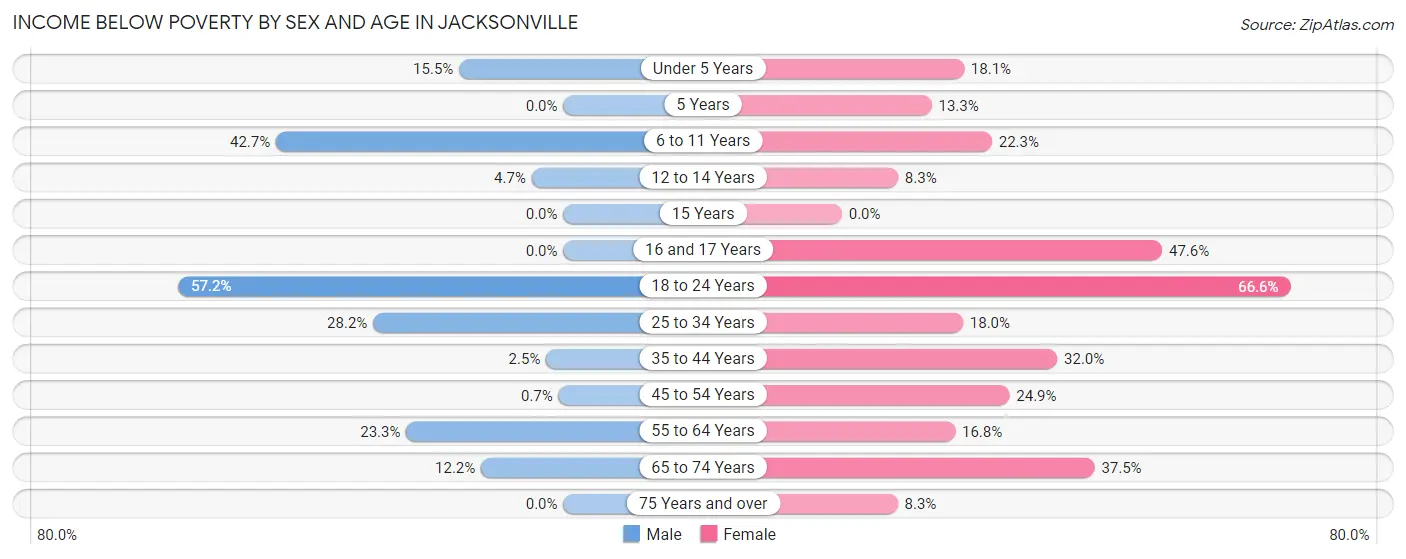
| Age Bracket | Male | Female |
| Under 5 Years | 73 (15.5%) | 31 (18.1%) |
| 5 Years | 0 (0.0%) | 10 (13.3%) |
| 6 to 11 Years | 157 (42.7%) | 49 (22.3%) |
| 12 to 14 Years | 10 (4.7%) | 10 (8.3%) |
| 15 Years | 0 (0.0%) | 0 (0.0%) |
| 16 and 17 Years | 0 (0.0%) | 39 (47.6%) |
| 18 to 24 Years | 571 (57.2%) | 953 (66.6%) |
| 25 to 34 Years | 259 (28.2%) | 167 (18.0%) |
| 35 to 44 Years | 26 (2.5%) | 204 (32.0%) |
| 45 to 54 Years | 2 (0.7%) | 157 (24.9%) |
| 55 to 64 Years | 174 (23.3%) | 159 (16.8%) |
| 65 to 74 Years | 32 (12.2%) | 203 (37.5%) |
| 75 Years and over | 0 (0.0%) | 35 (8.3%) |
| Total | 1,304 (22.8%) | 2,017 (31.9%) |
Income Above Poverty by Sex and Age in Jacksonville
According to the poverty statistics in Jacksonville, males aged 5 years and females aged 15 years are the age groups that are most secure financially, with 100.0% of males and 100.0% of females in these age groups living above the poverty line.
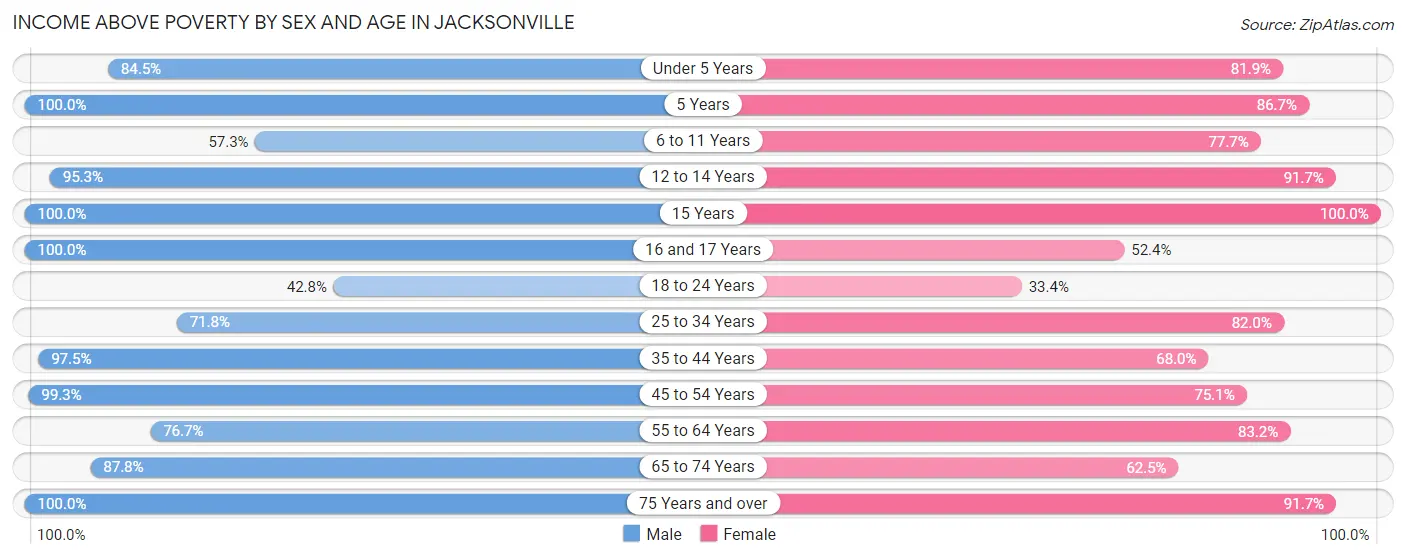
| Age Bracket | Male | Female |
| Under 5 Years | 399 (84.5%) | 140 (81.9%) |
| 5 Years | 55 (100.0%) | 65 (86.7%) |
| 6 to 11 Years | 211 (57.3%) | 171 (77.7%) |
| 12 to 14 Years | 203 (95.3%) | 110 (91.7%) |
| 15 Years | 57 (100.0%) | 121 (100.0%) |
| 16 and 17 Years | 15 (100.0%) | 43 (52.4%) |
| 18 to 24 Years | 427 (42.8%) | 478 (33.4%) |
| 25 to 34 Years | 658 (71.8%) | 762 (82.0%) |
| 35 to 44 Years | 999 (97.5%) | 434 (68.0%) |
| 45 to 54 Years | 283 (99.3%) | 474 (75.1%) |
| 55 to 64 Years | 572 (76.7%) | 787 (83.2%) |
| 65 to 74 Years | 230 (87.8%) | 338 (62.5%) |
| 75 Years and over | 304 (100.0%) | 387 (91.7%) |
| Total | 4,413 (77.2%) | 4,310 (68.1%) |
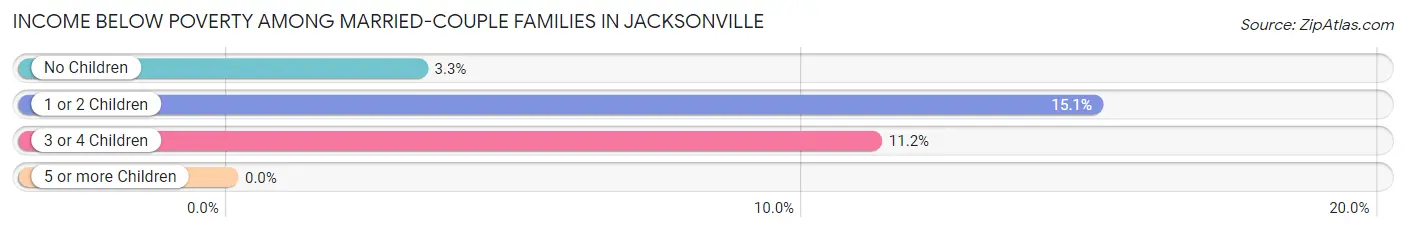
Income Below Poverty Among Married-Couple Families in Jacksonville
The poverty statistics for married-couple families in Jacksonville show that 8.1% or 125 of the total 1,537 families live below the poverty line. Families with 1 or 2 children have the highest poverty rate of 15.1%, comprising of 85 families. On the other hand, families with 5 or more children have the lowest poverty rate of 0.0%, which includes 0 families.
| Children | Above Poverty | Below Poverty |
| No Children | 820 (96.7%) | 28 (3.3%) |
| 1 or 2 Children | 479 (84.9%) | 85 (15.1%) |
| 3 or 4 Children | 95 (88.8%) | 12 (11.2%) |
| 5 or more Children | 18 (100.0%) | 0 (0.0%) |
| Total | 1,412 (91.9%) | 125 (8.1%) |
Income Below Poverty Among Single-Parent Households in Jacksonville
According to the poverty data in Jacksonville, 36.8% or 118 single-father households and 28.9% or 229 single-mother households are living below the poverty line. Among single-father households, those with 3 or 4 children have the highest poverty rate, with 55 households (82.1%) experiencing poverty. Likewise, among single-mother households, those with 1 or 2 children have the highest poverty rate, with 110 households (37.9%) falling below the poverty line.
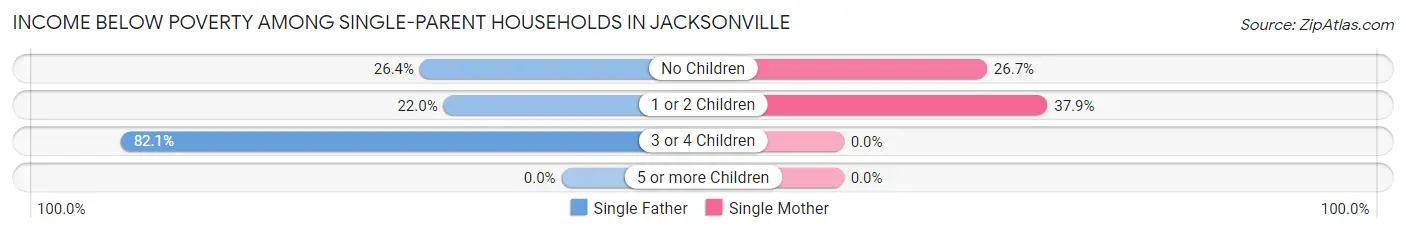
| Children | Single Father | Single Mother |
| No Children | 43 (26.4%) | 119 (26.7%) |
| 1 or 2 Children | 20 (22.0%) | 110 (37.9%) |
| 3 or 4 Children | 55 (82.1%) | 0 (0.0%) |
| 5 or more Children | 0 (0.0%) | 0 (0.0%) |
| Total | 118 (36.8%) | 229 (28.9%) |
Income Below Poverty Among Married-Couple vs Single-Parent Households in Jacksonville
The poverty data for Jacksonville shows that 125 of the married-couple family households (8.1%) and 347 of the single-parent households (31.1%) are living below the poverty level. Within the married-couple family households, those with 1 or 2 children have the highest poverty rate, with 85 households (15.1%) falling below the poverty line. Among the single-parent households, those with 3 or 4 children have the highest poverty rate, with 55 household (44.4%) living below poverty.
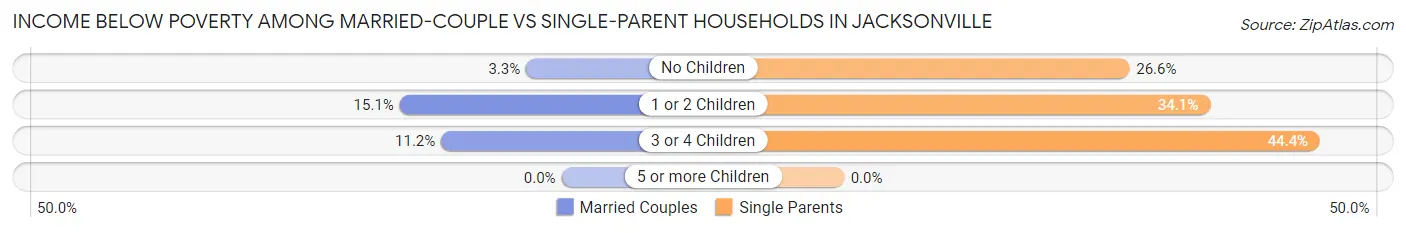
| Children | Married-Couple Families | Single-Parent Households |
| No Children | 28 (3.3%) | 162 (26.6%) |
| 1 or 2 Children | 85 (15.1%) | 130 (34.1%) |
| 3 or 4 Children | 12 (11.2%) | 55 (44.4%) |
| 5 or more Children | 0 (0.0%) | 0 (0.0%) |
| Total | 125 (8.1%) | 347 (31.1%) |
Race in Jacksonville
The most populous races in Jacksonville are White / Caucasian (9,914 | 69.7%), Black / African American (3,460 | 24.3%), and Hispanic or Latino (636 | 4.5%).
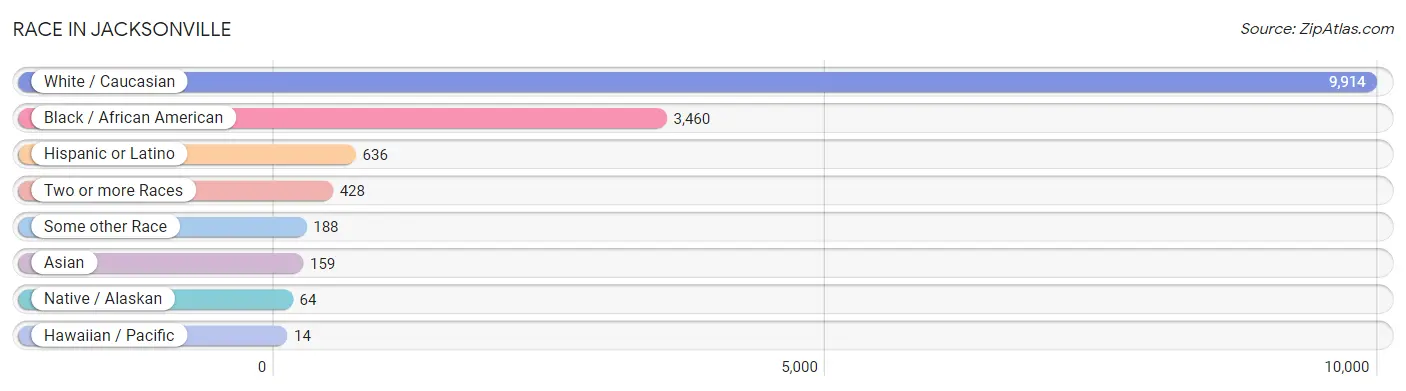
| Race | # Population | % Population |
| Asian | 159 | 1.1% |
| Black / African American | 3,460 | 24.3% |
| Hawaiian / Pacific | 14 | 0.1% |
| Hispanic or Latino | 636 | 4.5% |
| Native / Alaskan | 64 | 0.4% |
| White / Caucasian | 9,914 | 69.7% |
| Two or more Races | 428 | 3.0% |
| Some other Race | 188 | 1.3% |
| Total | 14,227 | 100.0% |
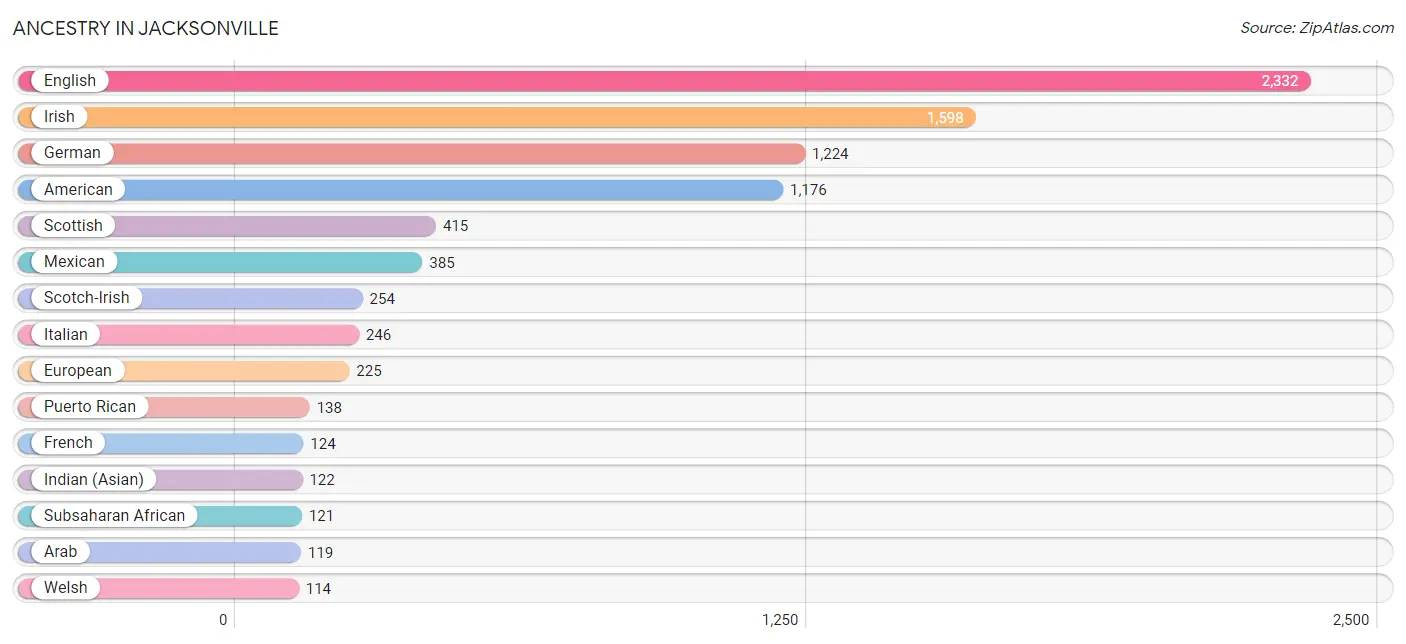
Ancestry in Jacksonville
The most populous ancestries reported in Jacksonville are English (2,332 | 16.4%), Irish (1,598 | 11.2%), German (1,224 | 8.6%), American (1,176 | 8.3%), and Scottish (415 | 2.9%), together accounting for 47.4% of all Jacksonville residents.
| Ancestry | # Population | % Population |
| African | 60 | 0.4% |
| American | 1,176 | 8.3% |
| Arab | 119 | 0.8% |
| Australian | 7 | 0.1% |
| Austrian | 7 | 0.1% |
| British | 88 | 0.6% |
| Burmese | 34 | 0.2% |
| Central American | 31 | 0.2% |
| Cherokee | 14 | 0.1% |
| Creek | 24 | 0.2% |
| Danish | 3 | 0.0% |
| Dominican | 34 | 0.2% |
| Dutch | 110 | 0.8% |
| English | 2,332 | 16.4% |
| European | 225 | 1.6% |
| French | 124 | 0.9% |
| French Canadian | 27 | 0.2% |
| German | 1,224 | 8.6% |
| Greek | 5 | 0.0% |
| Indian (Asian) | 122 | 0.9% |
| Iranian | 5 | 0.0% |
| Iraqi | 18 | 0.1% |
| Irish | 1,598 | 11.2% |
| Italian | 246 | 1.7% |
| Jamaican | 93 | 0.6% |
| Korean | 102 | 0.7% |
| Lebanese | 21 | 0.2% |
| Malaysian | 56 | 0.4% |
| Mexican | 385 | 2.7% |
| Mexican American Indian | 12 | 0.1% |
| Native Hawaiian | 14 | 0.1% |
| Nigerian | 48 | 0.3% |
| Norwegian | 7 | 0.1% |
| Panamanian | 31 | 0.2% |
| Polish | 87 | 0.6% |
| Puerto Rican | 138 | 1.0% |
| Romanian | 29 | 0.2% |
| Scandinavian | 66 | 0.5% |
| Scotch-Irish | 254 | 1.8% |
| Scottish | 415 | 2.9% |
| Slovak | 6 | 0.0% |
| Subsaharan African | 121 | 0.9% |
| Swedish | 82 | 0.6% |
| Swiss | 59 | 0.4% |
| Syrian | 72 | 0.5% |
| Thai | 28 | 0.2% |
| Welsh | 114 | 0.8% |
| West Indian | 7 | 0.1% | View All 48 Rows |
Immigrants in Jacksonville
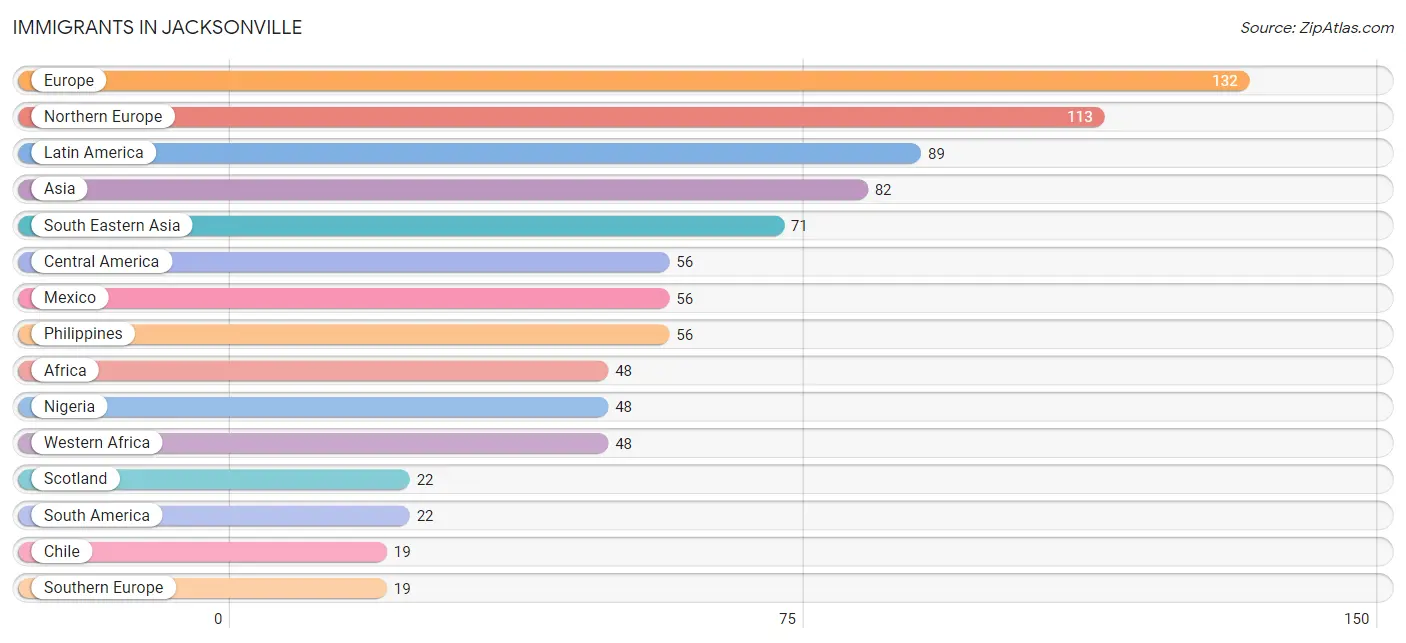
The most numerous immigrant groups reported in Jacksonville came from Europe (132 | 0.9%), Northern Europe (113 | 0.8%), Latin America (89 | 0.6%), Asia (82 | 0.6%), and South Eastern Asia (71 | 0.5%), together accounting for 3.4% of all Jacksonville residents.
| Immigration Origin | # Population | % Population |
| Africa | 48 | 0.3% |
| Asia | 82 | 0.6% |
| Canada | 7 | 0.1% |
| Caribbean | 11 | 0.1% |
| Central America | 56 | 0.4% |
| Chile | 19 | 0.1% |
| China | 1 | 0.0% |
| Cuba | 4 | 0.0% |
| Eastern Asia | 3 | 0.0% |
| England | 9 | 0.1% |
| Europe | 132 | 0.9% |
| Iraq | 8 | 0.1% |
| Italy | 10 | 0.1% |
| Korea | 2 | 0.0% |
| Latin America | 89 | 0.6% |
| Mexico | 56 | 0.4% |
| Nigeria | 48 | 0.3% |
| Northern Europe | 113 | 0.8% |
| Philippines | 56 | 0.4% |
| Scotland | 22 | 0.2% |
| South America | 22 | 0.2% |
| South Eastern Asia | 71 | 0.5% |
| Southern Europe | 19 | 0.1% |
| Spain | 9 | 0.1% |
| Taiwan | 1 | 0.0% |
| Thailand | 15 | 0.1% |
| Trinidad and Tobago | 7 | 0.1% |
| Venezuela | 3 | 0.0% |
| Western Africa | 48 | 0.3% |
| Western Asia | 8 | 0.1% | View All 30 Rows |
Sex and Age in Jacksonville
Sex and Age in Jacksonville
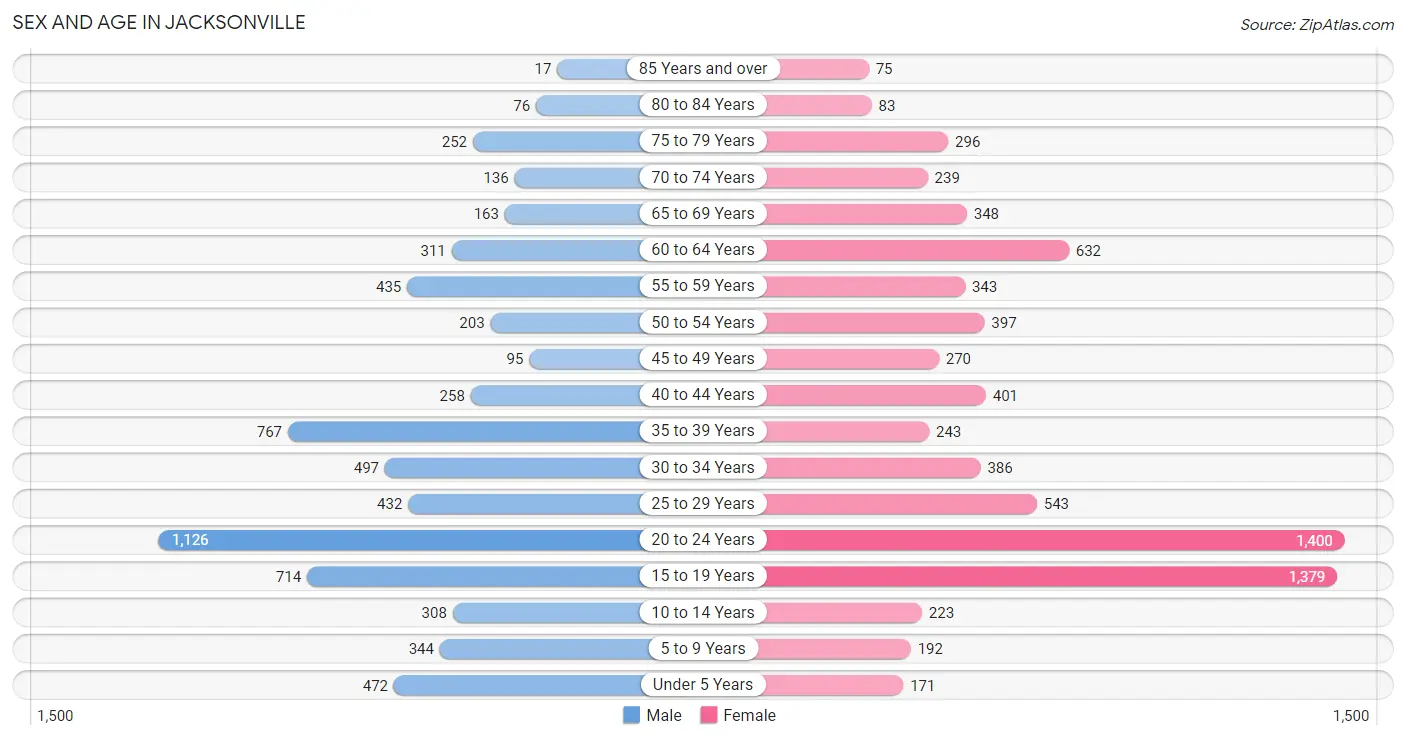
The most populous age groups in Jacksonville are 20 to 24 Years (1,126 | 17.1%) for men and 20 to 24 Years (1,400 | 18.4%) for women.
| Age Bracket | Male | Female |
| Under 5 Years | 472 (7.1%) | 171 (2.2%) |
| 5 to 9 Years | 344 (5.2%) | 192 (2.5%) |
| 10 to 14 Years | 308 (4.7%) | 223 (2.9%) |
| 15 to 19 Years | 714 (10.8%) | 1,379 (18.1%) |
| 20 to 24 Years | 1,126 (17.1%) | 1,400 (18.4%) |
| 25 to 29 Years | 432 (6.5%) | 543 (7.1%) |
| 30 to 34 Years | 497 (7.5%) | 386 (5.1%) |
| 35 to 39 Years | 767 (11.6%) | 243 (3.2%) |
| 40 to 44 Years | 258 (3.9%) | 401 (5.3%) |
| 45 to 49 Years | 95 (1.4%) | 270 (3.5%) |
| 50 to 54 Years | 203 (3.1%) | 397 (5.2%) |
| 55 to 59 Years | 435 (6.6%) | 343 (4.5%) |
| 60 to 64 Years | 311 (4.7%) | 632 (8.3%) |
| 65 to 69 Years | 163 (2.5%) | 348 (4.6%) |
| 70 to 74 Years | 136 (2.1%) | 239 (3.1%) |
| 75 to 79 Years | 252 (3.8%) | 296 (3.9%) |
| 80 to 84 Years | 76 (1.1%) | 83 (1.1%) |
| 85 Years and over | 17 (0.3%) | 75 (1.0%) |
| Total | 6,606 (100.0%) | 7,621 (100.0%) |
Families and Households in Jacksonville
Median Family Size in Jacksonville
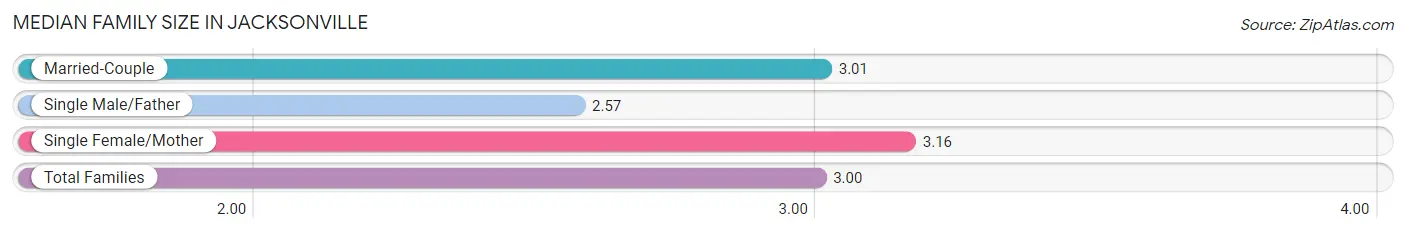
The median family size in Jacksonville is 3.00 persons per family, with single female/mother families (793 | 29.9%) accounting for the largest median family size of 3.16 persons per family. On the other hand, single male/father families (321 | 12.1%) represent the smallest median family size with 2.57 persons per family.
| Family Type | # Families | Family Size |
| Married-Couple | 1,537 (58.0%) | 3.01 |
| Single Male/Father | 321 (12.1%) | 2.57 |
| Single Female/Mother | 793 (29.9%) | 3.16 |
| Total Families | 2,651 (100.0%) | 3.00 |
Median Household Size in Jacksonville
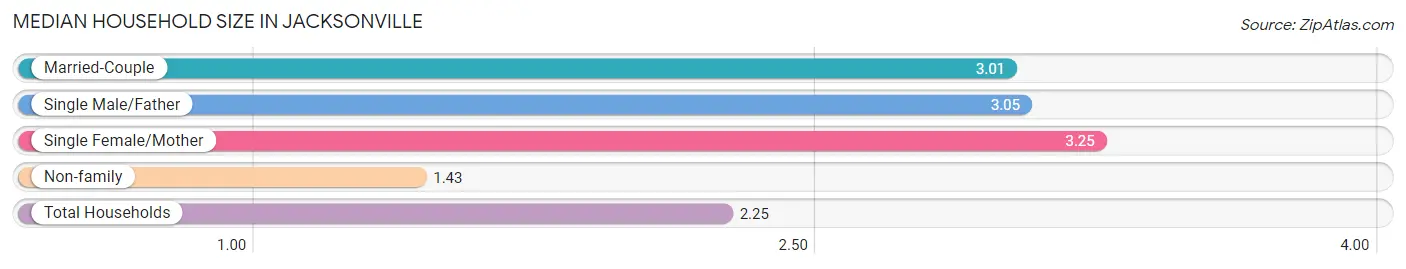
The median household size in Jacksonville is 2.25 persons per household, with single female/mother households (793 | 14.8%) accounting for the largest median household size of 3.25 persons per household. non-family households (2,713 | 50.6%) represent the smallest median household size with 1.43 persons per household.
| Household Type | # Households | Household Size |
| Married-Couple | 1,537 (28.6%) | 3.01 |
| Single Male/Father | 321 (6.0%) | 3.05 |
| Single Female/Mother | 793 (14.8%) | 3.25 |
| Non-family | 2,713 (50.6%) | 1.43 |
| Total Households | 5,364 (100.0%) | 2.25 |
Household Size by Marriage Status in Jacksonville
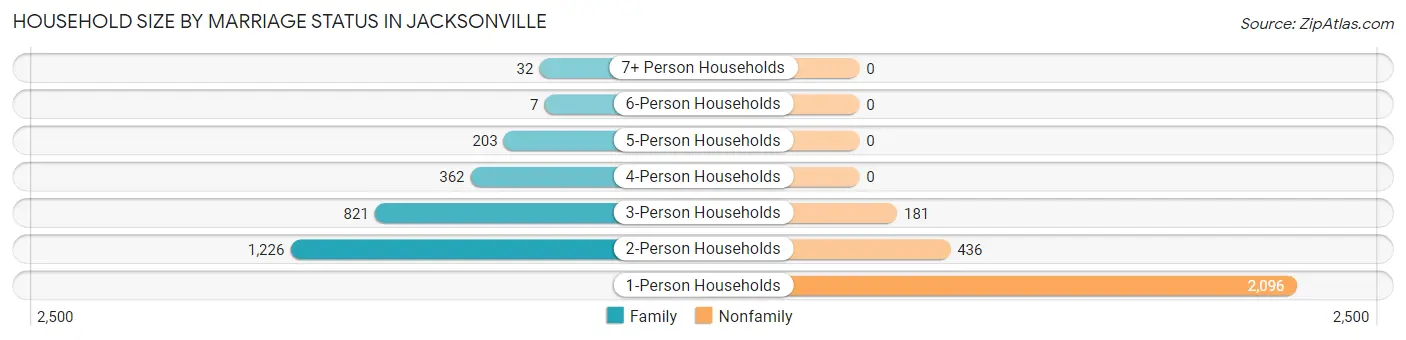
Out of a total of 5,364 households in Jacksonville, 2,651 (49.4%) are family households, while 2,713 (50.6%) are nonfamily households. The most numerous type of family households are 2-person households, comprising 1,226, and the most common type of nonfamily households are 1-person households, comprising 2,096.
| Household Size | Family Households | Nonfamily Households |
| 1-Person Households | - | 2,096 (39.1%) |
| 2-Person Households | 1,226 (22.9%) | 436 (8.1%) |
| 3-Person Households | 821 (15.3%) | 181 (3.4%) |
| 4-Person Households | 362 (6.8%) | 0 (0.0%) |
| 5-Person Households | 203 (3.8%) | 0 (0.0%) |
| 6-Person Households | 7 (0.1%) | 0 (0.0%) |
| 7+ Person Households | 32 (0.6%) | 0 (0.0%) |
| Total | 2,651 (49.4%) | 2,713 (50.6%) |
Female Fertility in Jacksonville
Fertility by Age in Jacksonville
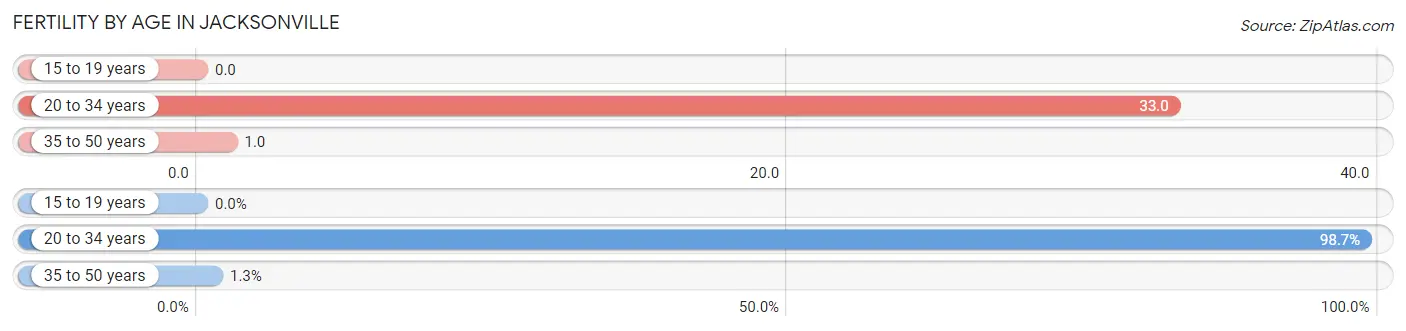
Average fertility rate in Jacksonville is 17.0 births per 1,000 women. Women in the age bracket of 20 to 34 years have the highest fertility rate with 33.0 births per 1,000 women. Women in the age bracket of 20 to 34 years acount for 98.7% of all women with births.
| Age Bracket | Women with Births | Births / 1,000 Women |
| 15 to 19 years | 0 (0.0%) | 0.0 |
| 20 to 34 years | 78 (98.7%) | 33.0 |
| 35 to 50 years | 1 (1.3%) | 1.0 |
| Total | 79 (100.0%) | 17.0 |
Fertility by Age by Marriage Status in Jacksonville
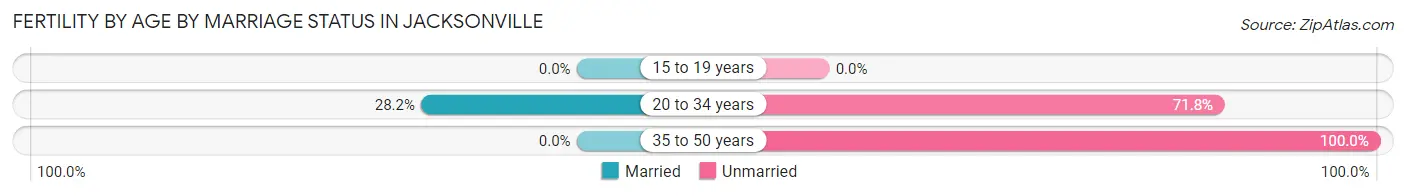
27.8% of women with births (79) in Jacksonville are married. The highest percentage of unmarried women with births falls into 35 to 50 years age bracket with 100.0% of them unmarried at the time of birth, while the lowest percentage of unmarried women with births belong to 20 to 34 years age bracket with 71.8% of them unmarried.
| Age Bracket | Married | Unmarried |
| 15 to 19 years | 0 (0.0%) | 0 (0.0%) |
| 20 to 34 years | 22 (28.2%) | 56 (71.8%) |
| 35 to 50 years | 0 (0.0%) | 1 (100.0%) |
| Total | 22 (27.9%) | 57 (72.2%) |
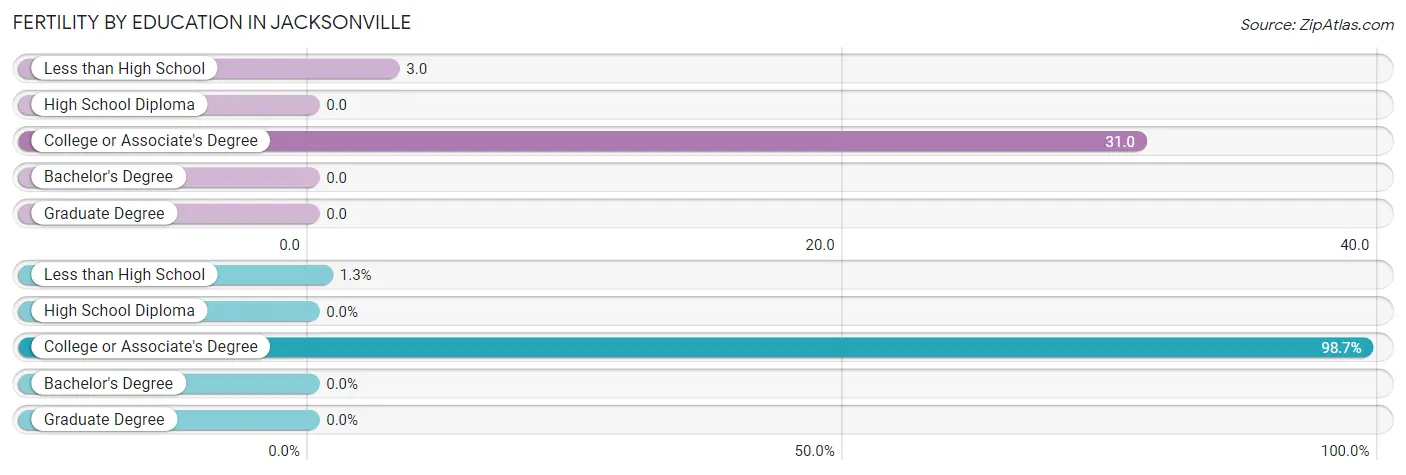
Fertility by Education in Jacksonville
| Educational Attainment | Women with Births | Births / 1,000 Women |
| Less than High School | 1 (1.3%) | 3.0 |
| High School Diploma | 0 (0.0%) | 0.0 |
| College or Associate's Degree | 78 (98.7%) | 31.0 |
| Bachelor's Degree | 0 (0.0%) | 0.0 |
| Graduate Degree | 0 (0.0%) | 0.0 |
| Total | 79 (100.0%) | 17.0 |
Fertility by Education by Marriage Status in Jacksonville
72.2% of women with births in Jacksonville are unmarried. Women with the educational attainment of college or associate's degree are most likely to be married with 28.2% of them married at childbirth, while women with the educational attainment of less than high school are least likely to be married with 100.0% of them unmarried at childbirth.
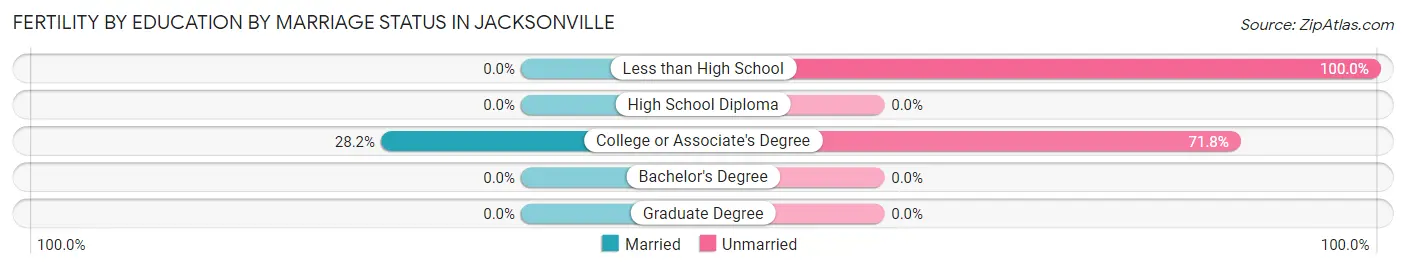
| Educational Attainment | Married | Unmarried |
| Less than High School | 0 (0.0%) | 1 (100.0%) |
| High School Diploma | 0 (0.0%) | 0 (0.0%) |
| College or Associate's Degree | 22 (28.2%) | 56 (71.8%) |
| Bachelor's Degree | 0 (0.0%) | 0 (0.0%) |
| Graduate Degree | 0 (0.0%) | 0 (0.0%) |
| Total | 22 (27.9%) | 57 (72.2%) |
Employment Characteristics in Jacksonville
Employment by Class of Employer in Jacksonville
Among the 6,325 employed individuals in Jacksonville, private company employees (4,384 | 69.3%), state government employees (674 | 10.7%), and local government employees (473 | 7.5%) make up the most common classes of employment.
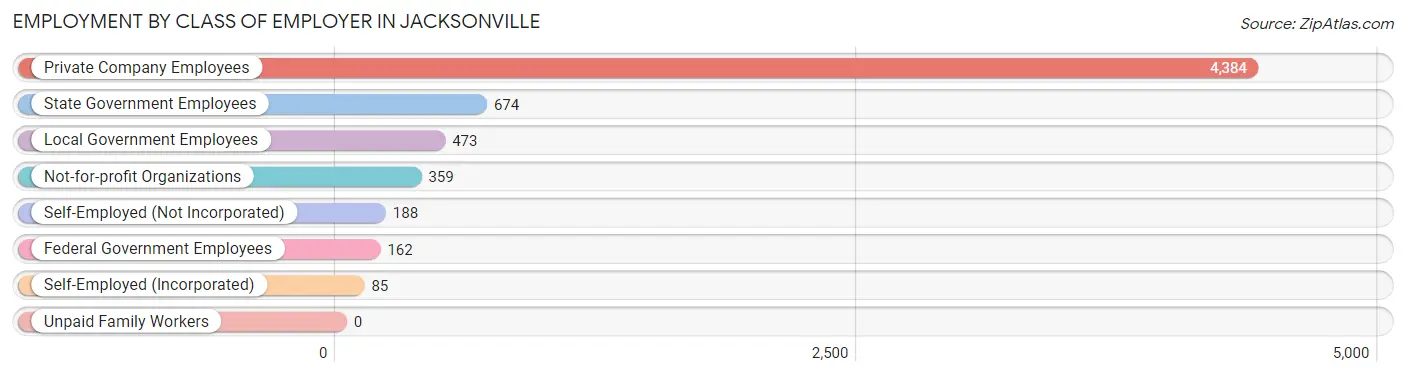
| Employer Class | # Employees | % Employees |
| Private Company Employees | 4,384 | 69.3% |
| Self-Employed (Incorporated) | 85 | 1.3% |
| Self-Employed (Not Incorporated) | 188 | 3.0% |
| Not-for-profit Organizations | 359 | 5.7% |
| Local Government Employees | 473 | 7.5% |
| State Government Employees | 674 | 10.7% |
| Federal Government Employees | 162 | 2.6% |
| Unpaid Family Workers | 0 | 0.0% |
| Total | 6,325 | 100.0% |
Employment Status by Age in Jacksonville
According to the labor force statistics for Jacksonville, out of the total population over 16 years of age (12,339), 57.9% or 7,144 individuals are in the labor force, with 6.9% or 493 of them unemployed. The age group with the highest labor force participation rate is 35 to 44 years, with 95.9% or 1,601 individuals in the labor force. Within the labor force, the 16 to 19 years age range has the highest percentage of unemployed individuals, with 26.3% or 199 of them being unemployed.
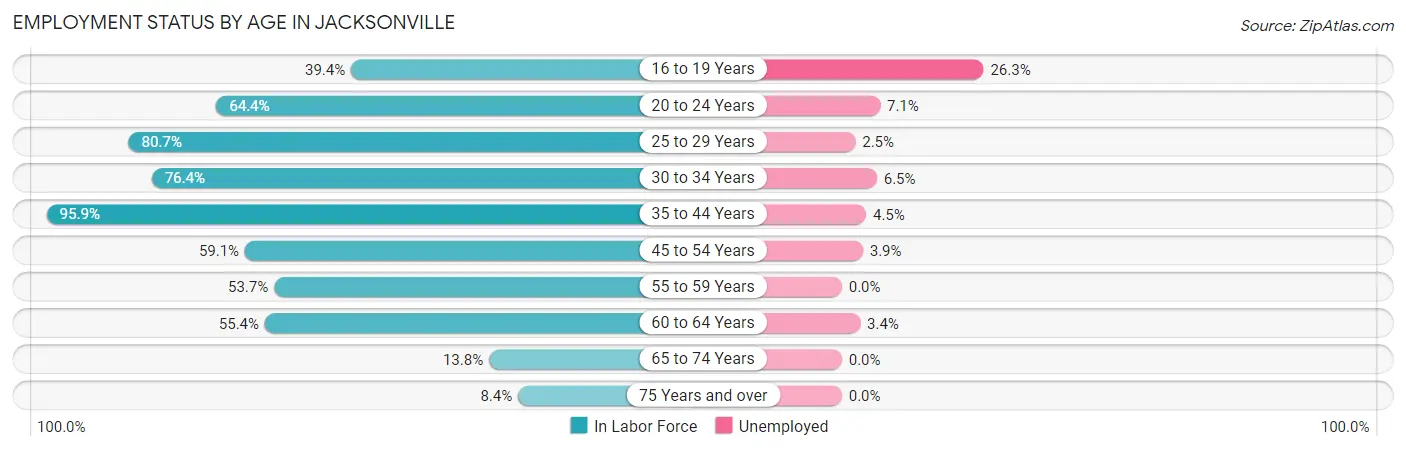
| Age Bracket | In Labor Force | Unemployed |
| 16 to 19 Years | 755 (39.4%) | 199 (26.3%) |
| 20 to 24 Years | 1,627 (64.4%) | 116 (7.1%) |
| 25 to 29 Years | 787 (80.7%) | 20 (2.5%) |
| 30 to 34 Years | 675 (76.4%) | 44 (6.5%) |
| 35 to 44 Years | 1,601 (95.9%) | 72 (4.5%) |
| 45 to 54 Years | 570 (59.1%) | 22 (3.9%) |
| 55 to 59 Years | 418 (53.7%) | 0 (0.0%) |
| 60 to 64 Years | 522 (55.4%) | 18 (3.4%) |
| 65 to 74 Years | 122 (13.8%) | 0 (0.0%) |
| 75 Years and over | 67 (8.4%) | 0 (0.0%) |
| Total | 7,144 (57.9%) | 493 (6.9%) |
Employment Status by Educational Attainment in Jacksonville
According to labor force statistics for Jacksonville, 73.6% of individuals (4,573) out of the total population between 25 and 64 years of age (6,213) are in the labor force, with 3.8% or 174 of them being unemployed. The group with the highest labor force participation rate are those with the educational attainment of bachelor's degree or higher, with 82.6% or 1,560 individuals in the labor force. Within the labor force, individuals with college / associate degree education have the highest percentage of unemployment, with 7.0% or 89 of them being unemployed.
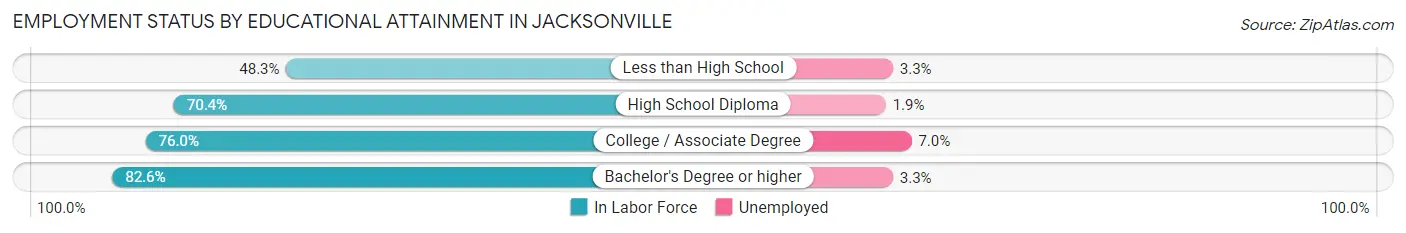
| Educational Attainment | In Labor Force | Unemployed |
| Less than High School | 276 (48.3%) | 19 (3.3%) |
| High School Diploma | 1,463 (70.4%) | 39 (1.9%) |
| College / Associate Degree | 1,272 (76.0%) | 117 (7.0%) |
| Bachelor's Degree or higher | 1,560 (82.6%) | 62 (3.3%) |
| Total | 4,573 (73.6%) | 236 (3.8%) |
Employment Occupations by Sex in Jacksonville
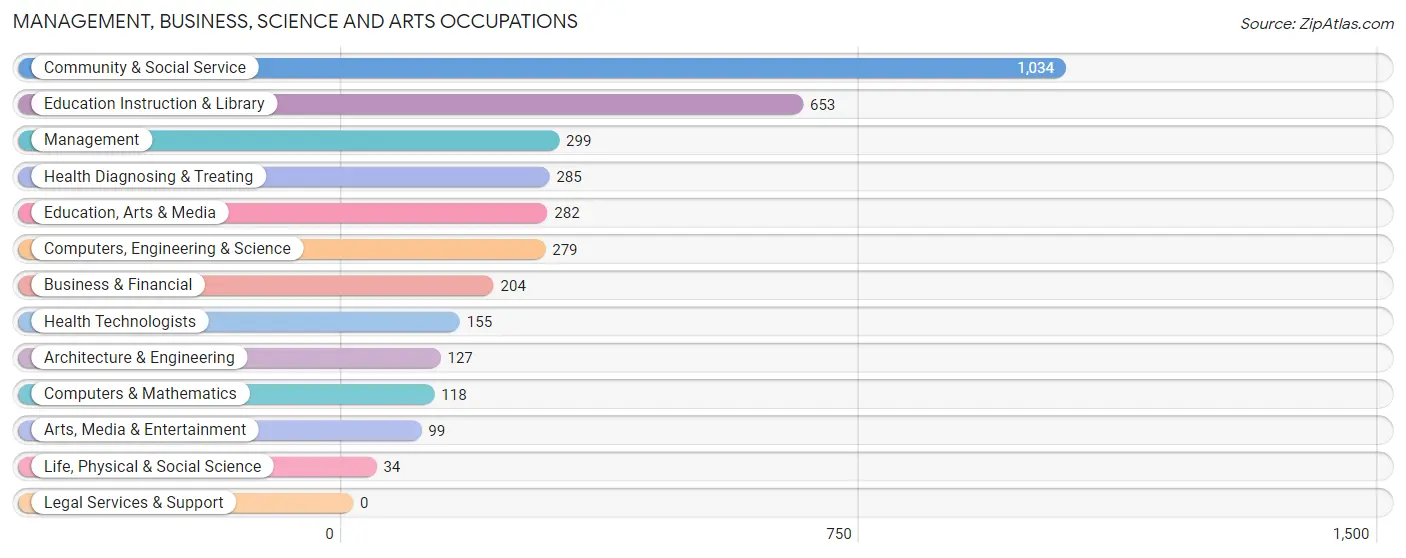
Management, Business, Science and Arts Occupations
The most common Management, Business, Science and Arts occupations in Jacksonville are Community & Social Service (1,034 | 15.7%), Education Instruction & Library (653 | 9.9%), Management (299 | 4.5%), Health Diagnosing & Treating (285 | 4.3%), and Education, Arts & Media (282 | 4.3%).
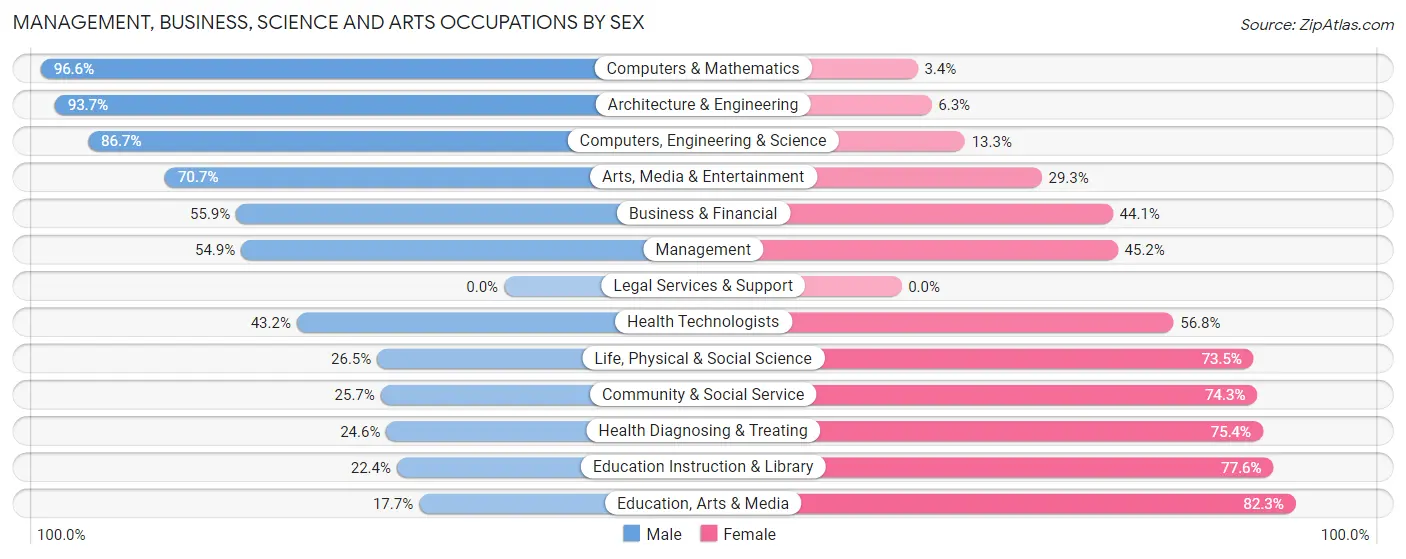
Management, Business, Science and Arts Occupations by Sex
Within the Management, Business, Science and Arts occupations in Jacksonville, the most male-oriented occupations are Computers & Mathematics (96.6%), Architecture & Engineering (93.7%), and Computers, Engineering & Science (86.7%), while the most female-oriented occupations are Education, Arts & Media (82.3%), Education Instruction & Library (77.6%), and Health Diagnosing & Treating (75.4%).
| Occupation | Male | Female |
| Management | 164 (54.8%) | 135 (45.2%) |
| Business & Financial | 114 (55.9%) | 90 (44.1%) |
| Computers, Engineering & Science | 242 (86.7%) | 37 (13.3%) |
| Computers & Mathematics | 114 (96.6%) | 4 (3.4%) |
| Architecture & Engineering | 119 (93.7%) | 8 (6.3%) |
| Life, Physical & Social Science | 9 (26.5%) | 25 (73.5%) |
| Community & Social Service | 266 (25.7%) | 768 (74.3%) |
| Education, Arts & Media | 50 (17.7%) | 232 (82.3%) |
| Legal Services & Support | 0 (0.0%) | 0 (0.0%) |
| Education Instruction & Library | 146 (22.4%) | 507 (77.6%) |
| Arts, Media & Entertainment | 70 (70.7%) | 29 (29.3%) |
| Health Diagnosing & Treating | 70 (24.6%) | 215 (75.4%) |
| Health Technologists | 67 (43.2%) | 88 (56.8%) |
| Total (Category) | 856 (40.7%) | 1,245 (59.3%) |
| Total (Overall) | 3,157 (48.0%) | 3,422 (52.0%) |
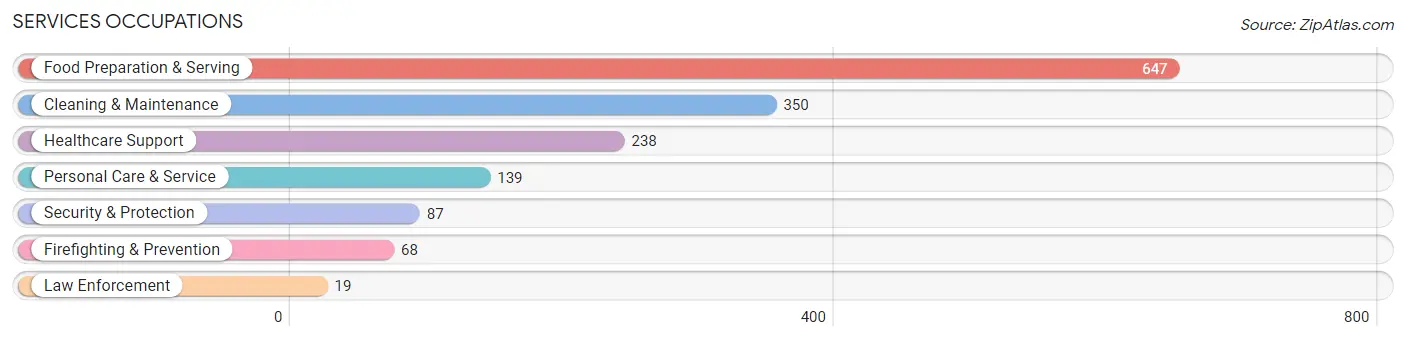
Services Occupations
The most common Services occupations in Jacksonville are Food Preparation & Serving (647 | 9.8%), Cleaning & Maintenance (350 | 5.3%), Healthcare Support (238 | 3.6%), Personal Care & Service (139 | 2.1%), and Security & Protection (87 | 1.3%).
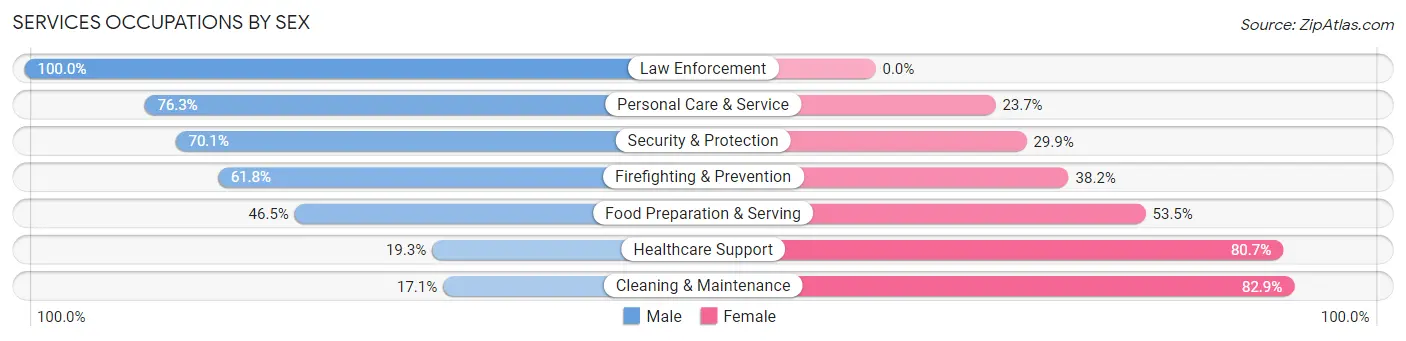
Services Occupations by Sex
Within the Services occupations in Jacksonville, the most male-oriented occupations are Law Enforcement (100.0%), Personal Care & Service (76.3%), and Security & Protection (70.1%), while the most female-oriented occupations are Cleaning & Maintenance (82.9%), Healthcare Support (80.7%), and Food Preparation & Serving (53.5%).
| Occupation | Male | Female |
| Healthcare Support | 46 (19.3%) | 192 (80.7%) |
| Security & Protection | 61 (70.1%) | 26 (29.9%) |
| Firefighting & Prevention | 42 (61.8%) | 26 (38.2%) |
| Law Enforcement | 19 (100.0%) | 0 (0.0%) |
| Food Preparation & Serving | 301 (46.5%) | 346 (53.5%) |
| Cleaning & Maintenance | 60 (17.1%) | 290 (82.9%) |
| Personal Care & Service | 106 (76.3%) | 33 (23.7%) |
| Total (Category) | 574 (39.3%) | 887 (60.7%) |
| Total (Overall) | 3,157 (48.0%) | 3,422 (52.0%) |
Sales and Office Occupations
The most common Sales and Office occupations in Jacksonville are Sales & Related (1,021 | 15.5%), and Office & Administration (765 | 11.6%).

Sales and Office Occupations by Sex
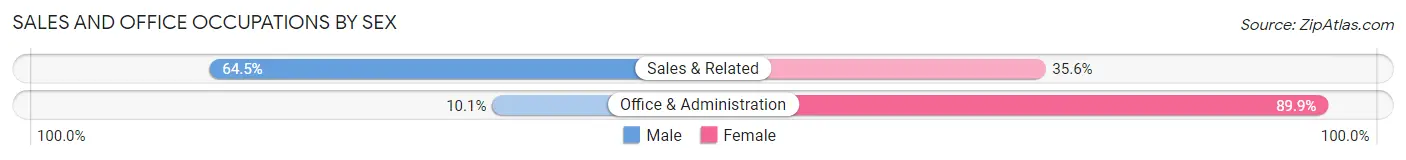
| Occupation | Male | Female |
| Sales & Related | 658 (64.4%) | 363 (35.5%) |
| Office & Administration | 77 (10.1%) | 688 (89.9%) |
| Total (Category) | 735 (41.1%) | 1,051 (58.9%) |
| Total (Overall) | 3,157 (48.0%) | 3,422 (52.0%) |
Natural Resources, Construction and Maintenance Occupations
The most common Natural Resources, Construction and Maintenance occupations in Jacksonville are Construction & Extraction (310 | 4.7%), and Installation, Maintenance & Repair (91 | 1.4%).

Natural Resources, Construction and Maintenance Occupations by Sex
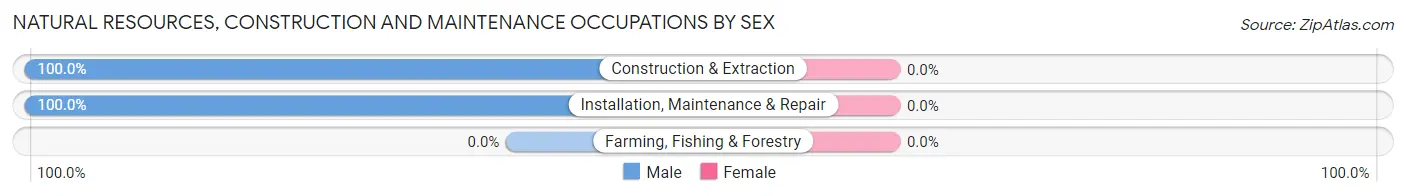
| Occupation | Male | Female |
| Farming, Fishing & Forestry | 0 (0.0%) | 0 (0.0%) |
| Construction & Extraction | 310 (100.0%) | 0 (0.0%) |
| Installation, Maintenance & Repair | 91 (100.0%) | 0 (0.0%) |
| Total (Category) | 401 (100.0%) | 0 (0.0%) |
| Total (Overall) | 3,157 (48.0%) | 3,422 (52.0%) |
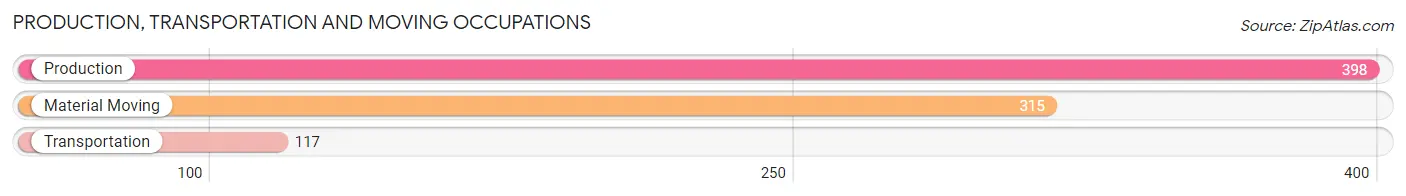
Production, Transportation and Moving Occupations
The most common Production, Transportation and Moving occupations in Jacksonville are Production (398 | 6.0%), Material Moving (315 | 4.8%), and Transportation (117 | 1.8%).
Production, Transportation and Moving Occupations by Sex
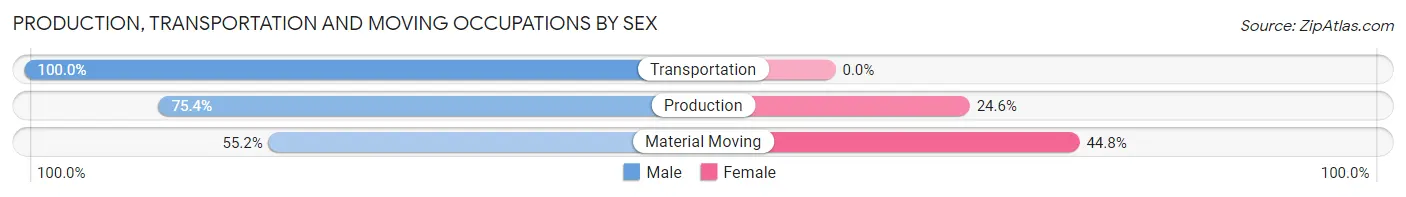
| Occupation | Male | Female |
| Production | 300 (75.4%) | 98 (24.6%) |
| Transportation | 117 (100.0%) | 0 (0.0%) |
| Material Moving | 174 (55.2%) | 141 (44.8%) |
| Total (Category) | 591 (71.2%) | 239 (28.8%) |
| Total (Overall) | 3,157 (48.0%) | 3,422 (52.0%) |
Employment Industries by Sex in Jacksonville
Employment Industries in Jacksonville
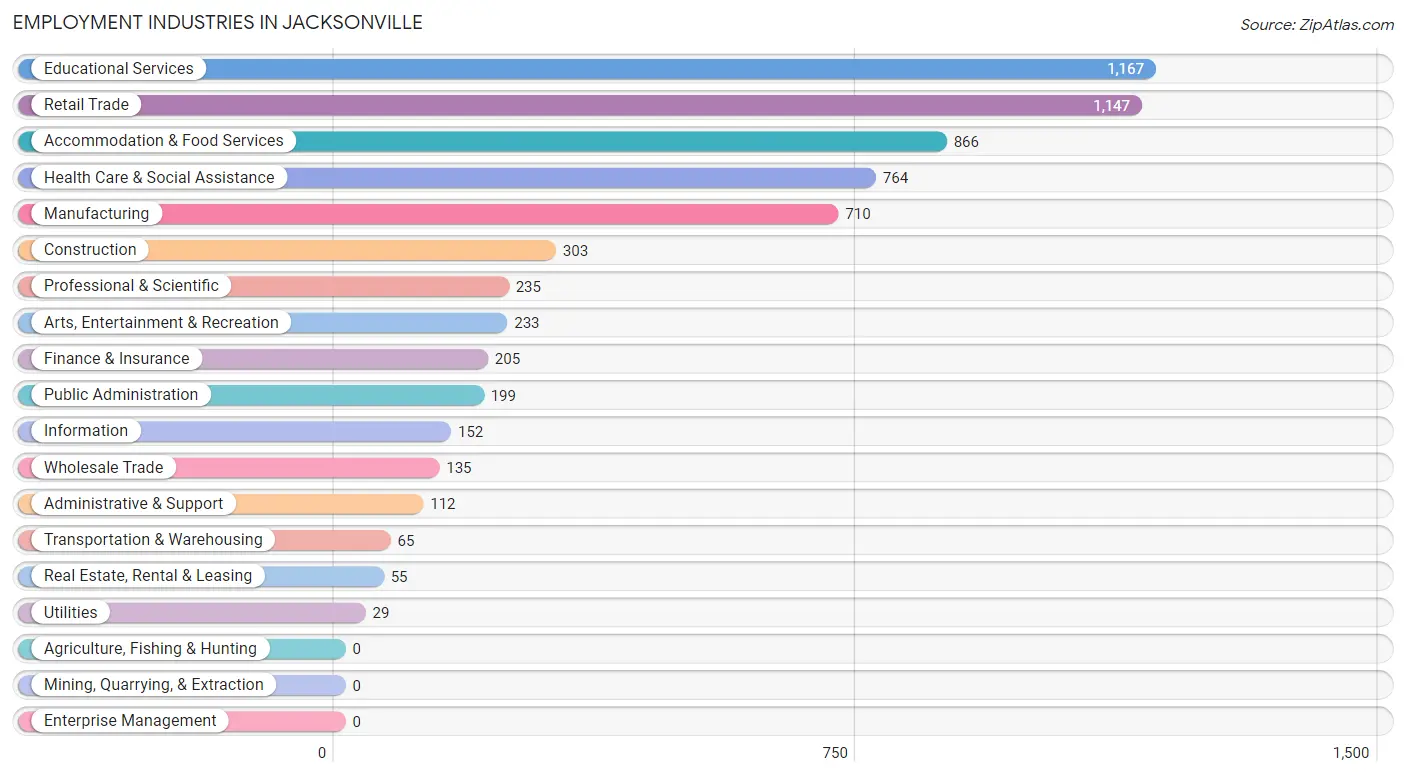
The major employment industries in Jacksonville include Educational Services (1,167 | 17.7%), Retail Trade (1,147 | 17.4%), Accommodation & Food Services (866 | 13.2%), Health Care & Social Assistance (764 | 11.6%), and Manufacturing (710 | 10.8%).
Employment Industries by Sex in Jacksonville
The Jacksonville industries that see more men than women are Construction (100.0%), Utilities (100.0%), and Real Estate, Rental & Leasing (90.9%), whereas the industries that tend to have a higher number of women are Professional & Scientific (78.7%), Educational Services (76.8%), and Health Care & Social Assistance (74.2%).
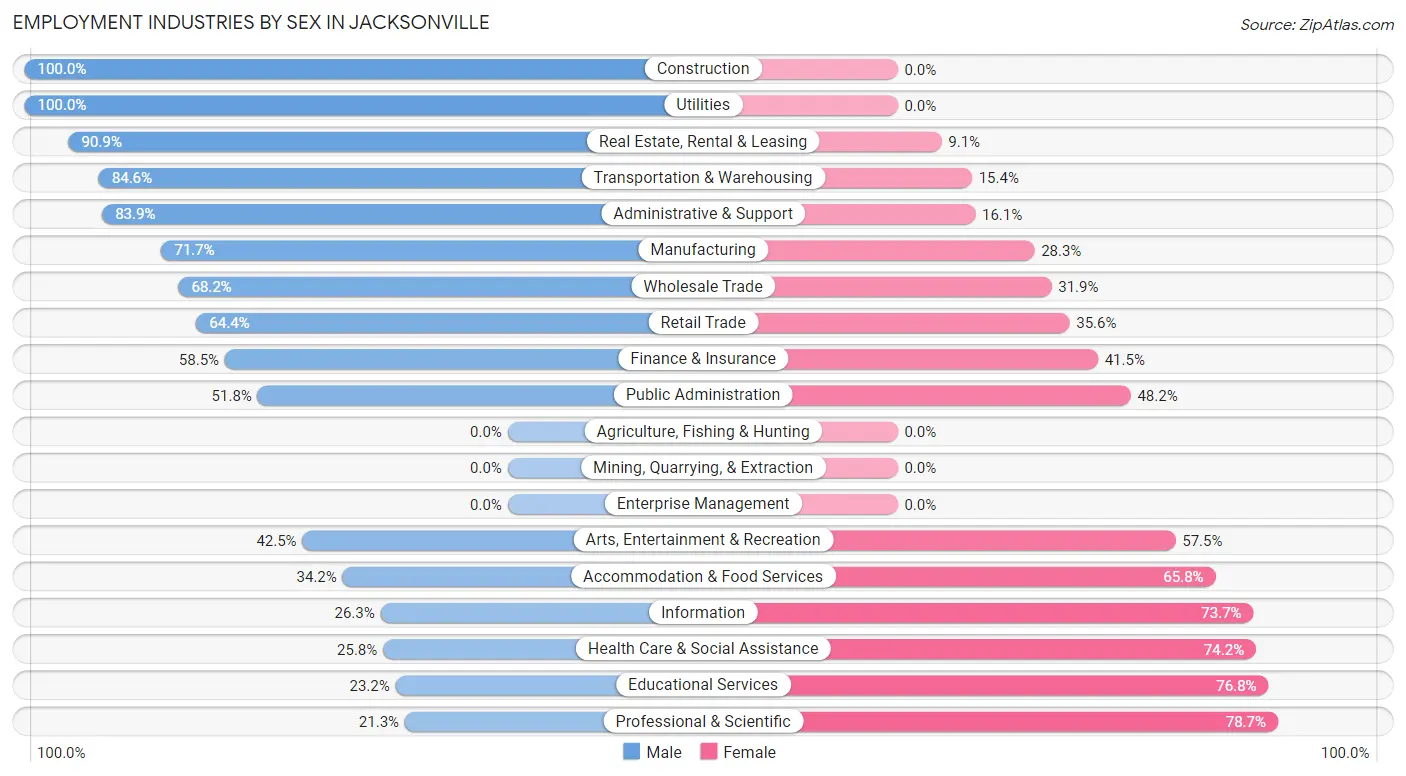
| Industry | Male | Female |
| Agriculture, Fishing & Hunting | 0 (0.0%) | 0 (0.0%) |
| Mining, Quarrying, & Extraction | 0 (0.0%) | 0 (0.0%) |
| Construction | 303 (100.0%) | 0 (0.0%) |
| Manufacturing | 509 (71.7%) | 201 (28.3%) |
| Wholesale Trade | 92 (68.1%) | 43 (31.9%) |
| Retail Trade | 739 (64.4%) | 408 (35.6%) |
| Transportation & Warehousing | 55 (84.6%) | 10 (15.4%) |
| Utilities | 29 (100.0%) | 0 (0.0%) |
| Information | 40 (26.3%) | 112 (73.7%) |
| Finance & Insurance | 120 (58.5%) | 85 (41.5%) |
| Real Estate, Rental & Leasing | 50 (90.9%) | 5 (9.1%) |
| Professional & Scientific | 50 (21.3%) | 185 (78.7%) |
| Enterprise Management | 0 (0.0%) | 0 (0.0%) |
| Administrative & Support | 94 (83.9%) | 18 (16.1%) |
| Educational Services | 271 (23.2%) | 896 (76.8%) |
| Health Care & Social Assistance | 197 (25.8%) | 567 (74.2%) |
| Arts, Entertainment & Recreation | 99 (42.5%) | 134 (57.5%) |
| Accommodation & Food Services | 296 (34.2%) | 570 (65.8%) |
| Public Administration | 103 (51.8%) | 96 (48.2%) |
| Total | 3,157 (48.0%) | 3,422 (52.0%) |
Education in Jacksonville
School Enrollment in Jacksonville
The most common levels of schooling among the 5,448 students in Jacksonville are college / undergraduate (3,722 | 68.3%), middle school (469 | 8.6%), and elementary school (453 | 8.3%).
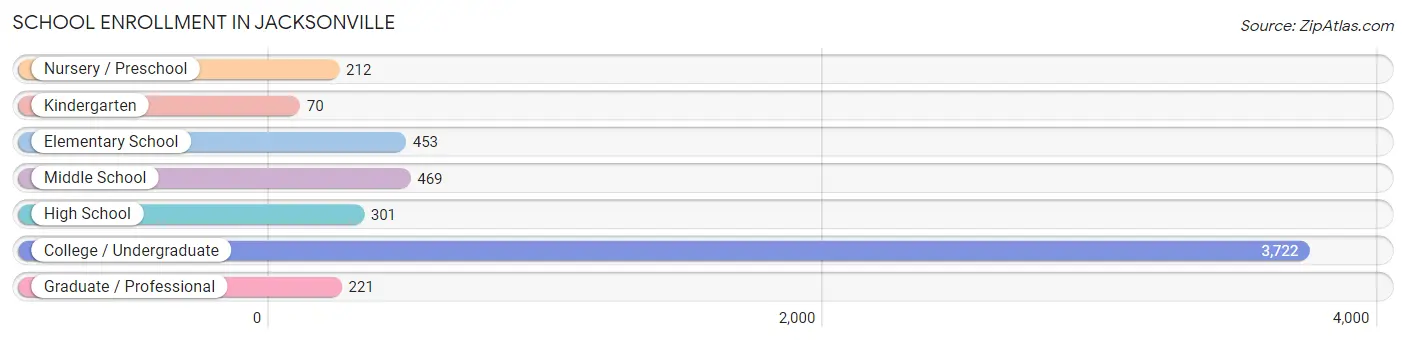
| School Level | # Students | % Students |
| Nursery / Preschool | 212 | 3.9% |
| Kindergarten | 70 | 1.3% |
| Elementary School | 453 | 8.3% |
| Middle School | 469 | 8.6% |
| High School | 301 | 5.5% |
| College / Undergraduate | 3,722 | 68.3% |
| Graduate / Professional | 221 | 4.1% |
| Total | 5,448 | 100.0% |
School Enrollment by Age by Funding Source in Jacksonville
Out of a total of 5,448 students who are enrolled in schools in Jacksonville, 452 (8.3%) attend a private institution, while the remaining 4,996 (91.7%) are enrolled in public schools. The age group of 35 years and over has the highest likelihood of being enrolled in private schools, with 29 (31.2% in the age bracket) enrolled. Conversely, the age group of 3 to 4 year olds has the lowest likelihood of being enrolled in a private school, with 180 (100.0% in the age bracket) attending a public institution.
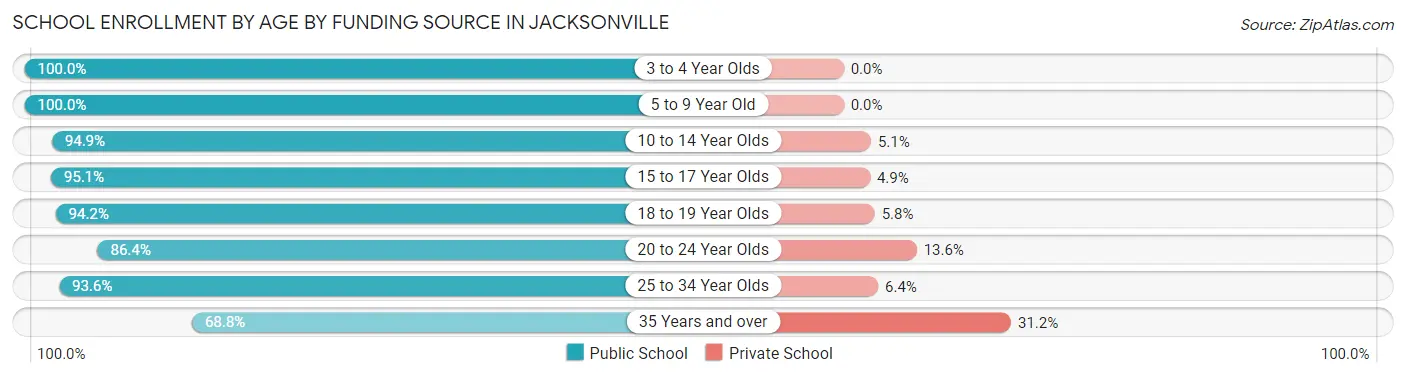
| Age Bracket | Public School | Private School |
| 3 to 4 Year Olds | 180 (100.0%) | 0 (0.0%) |
| 5 to 9 Year Old | 492 (100.0%) | 0 (0.0%) |
| 10 to 14 Year Olds | 504 (94.9%) | 27 (5.1%) |
| 15 to 17 Year Olds | 291 (95.1%) | 15 (4.9%) |
| 18 to 19 Year Olds | 1,548 (94.2%) | 95 (5.8%) |
| 20 to 24 Year Olds | 1,715 (86.4%) | 270 (13.6%) |
| 25 to 34 Year Olds | 204 (93.6%) | 14 (6.4%) |
| 35 Years and over | 64 (68.8%) | 29 (31.2%) |
| Total | 4,996 (91.7%) | 452 (8.3%) |
Educational Attainment by Field of Study in Jacksonville
Education (402 | 15.6%), arts & humanities (374 | 14.5%), business (373 | 14.5%), science & technology (279 | 10.8%), and liberal arts & history (219 | 8.5%) are the most common fields of study among 2,574 individuals in Jacksonville who have obtained a bachelor's degree or higher.
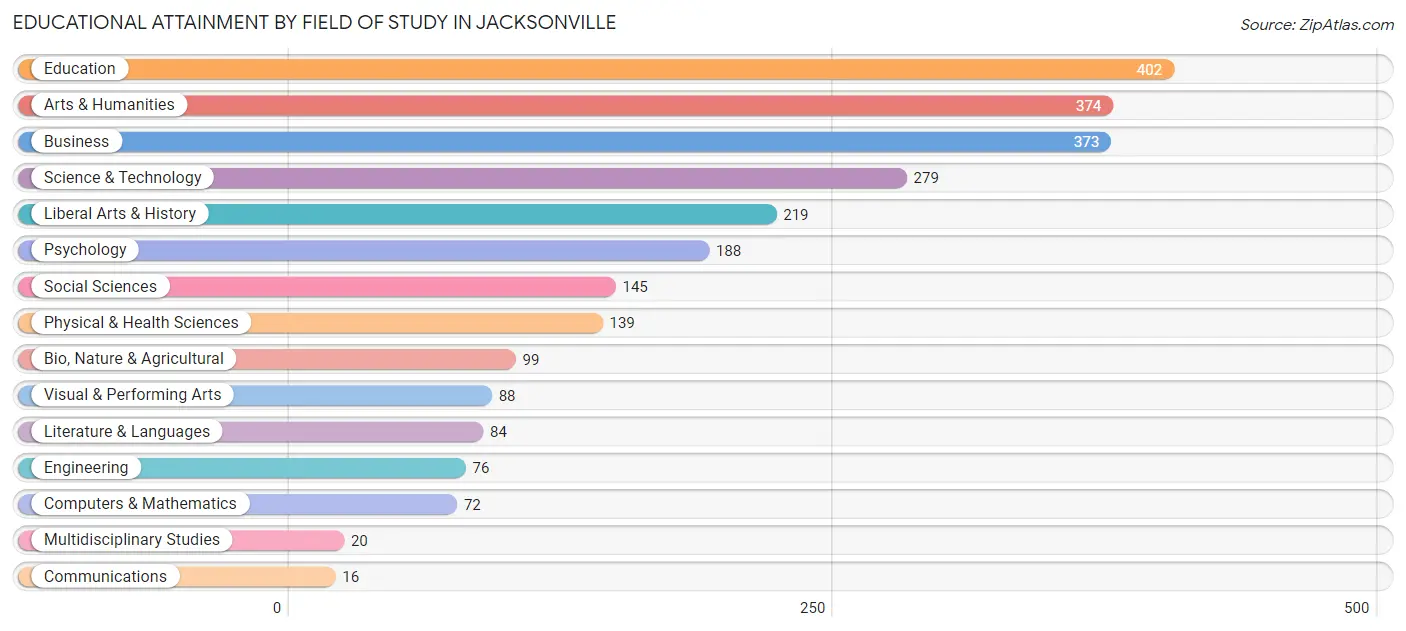
| Field of Study | # Graduates | % Graduates |
| Computers & Mathematics | 72 | 2.8% |
| Bio, Nature & Agricultural | 99 | 3.8% |
| Physical & Health Sciences | 139 | 5.4% |
| Psychology | 188 | 7.3% |
| Social Sciences | 145 | 5.6% |
| Engineering | 76 | 2.9% |
| Multidisciplinary Studies | 20 | 0.8% |
| Science & Technology | 279 | 10.8% |
| Business | 373 | 14.5% |
| Education | 402 | 15.6% |
| Literature & Languages | 84 | 3.3% |
| Liberal Arts & History | 219 | 8.5% |
| Visual & Performing Arts | 88 | 3.4% |
| Communications | 16 | 0.6% |
| Arts & Humanities | 374 | 14.5% |
| Total | 2,574 | 100.0% |
Transportation & Commute in Jacksonville
Vehicle Availability by Sex in Jacksonville
The most prevalent vehicle ownership categories in Jacksonville are males with 2 vehicles (1,986, accounting for 65.1%) and females with 2 vehicles (1,343, making up 70.5%).
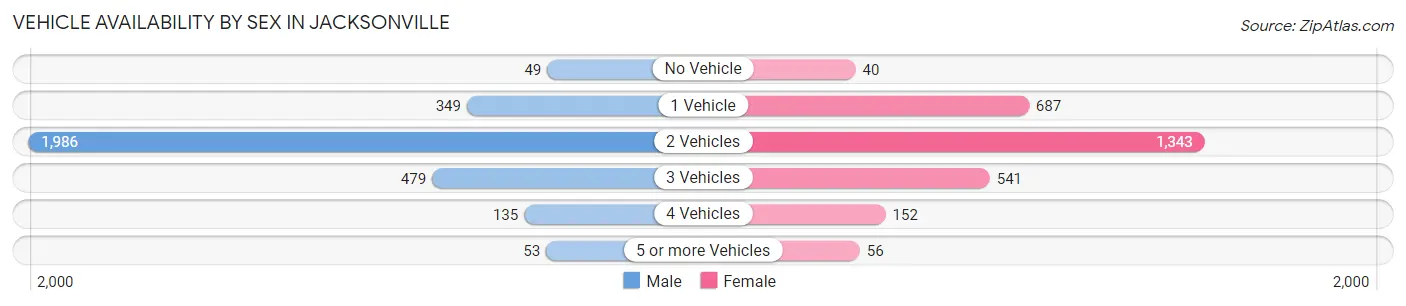
| Vehicles Available | Male | Female |
| No Vehicle | 49 (1.6%) | 40 (1.4%) |
| 1 Vehicle | 349 (11.4%) | 687 (24.4%) |
| 2 Vehicles | 1,986 (65.1%) | 1,343 (47.6%) |
| 3 Vehicles | 479 (15.7%) | 541 (19.2%) |
| 4 Vehicles | 135 (4.4%) | 152 (5.4%) |
| 5 or more Vehicles | 53 (1.7%) | 56 (2.0%) |
| Total | 3,051 (100.0%) | 2,819 (100.0%) |
Commute Time in Jacksonville
The most frequently occuring commute durations in Jacksonville are 5 to 9 minutes (1,699 commuters, 27.6%), 15 to 19 minutes (965 commuters, 15.7%), and 30 to 34 minutes (804 commuters, 13.1%).
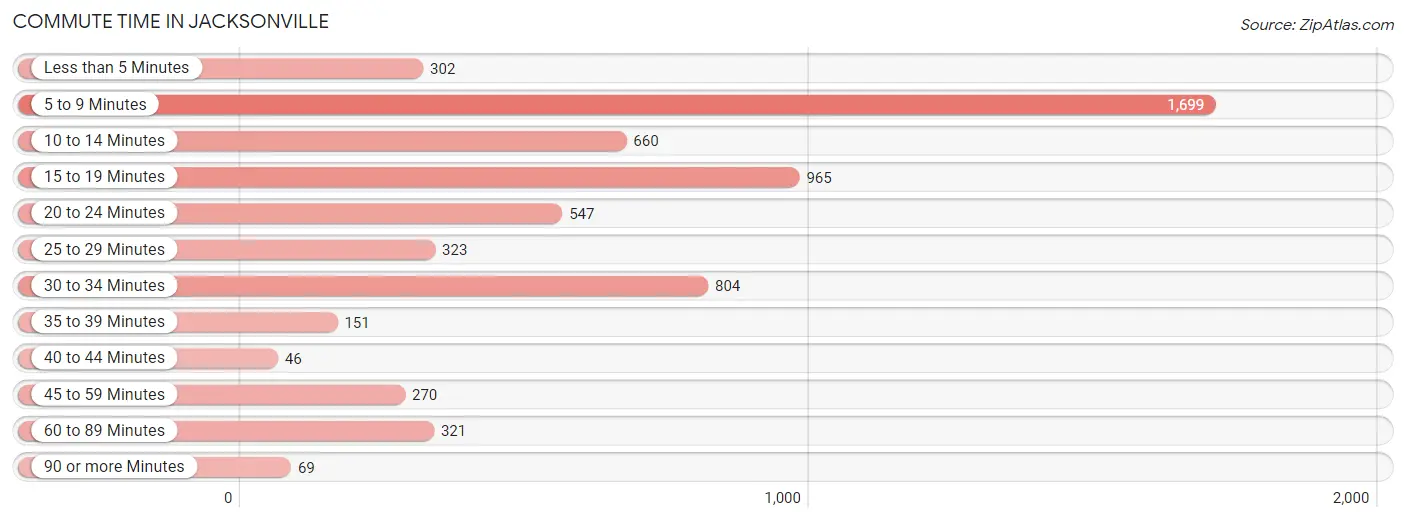
| Commute Time | # Commuters | % Commuters |
| Less than 5 Minutes | 302 | 4.9% |
| 5 to 9 Minutes | 1,699 | 27.6% |
| 10 to 14 Minutes | 660 | 10.7% |
| 15 to 19 Minutes | 965 | 15.7% |
| 20 to 24 Minutes | 547 | 8.9% |
| 25 to 29 Minutes | 323 | 5.2% |
| 30 to 34 Minutes | 804 | 13.1% |
| 35 to 39 Minutes | 151 | 2.5% |
| 40 to 44 Minutes | 46 | 0.7% |
| 45 to 59 Minutes | 270 | 4.4% |
| 60 to 89 Minutes | 321 | 5.2% |
| 90 or more Minutes | 69 | 1.1% |
Commute Time by Sex in Jacksonville
The most common commute times in Jacksonville are 5 to 9 minutes (1,089 commuters, 34.6%) for males and 5 to 9 minutes (610 commuters, 20.3%) for females.
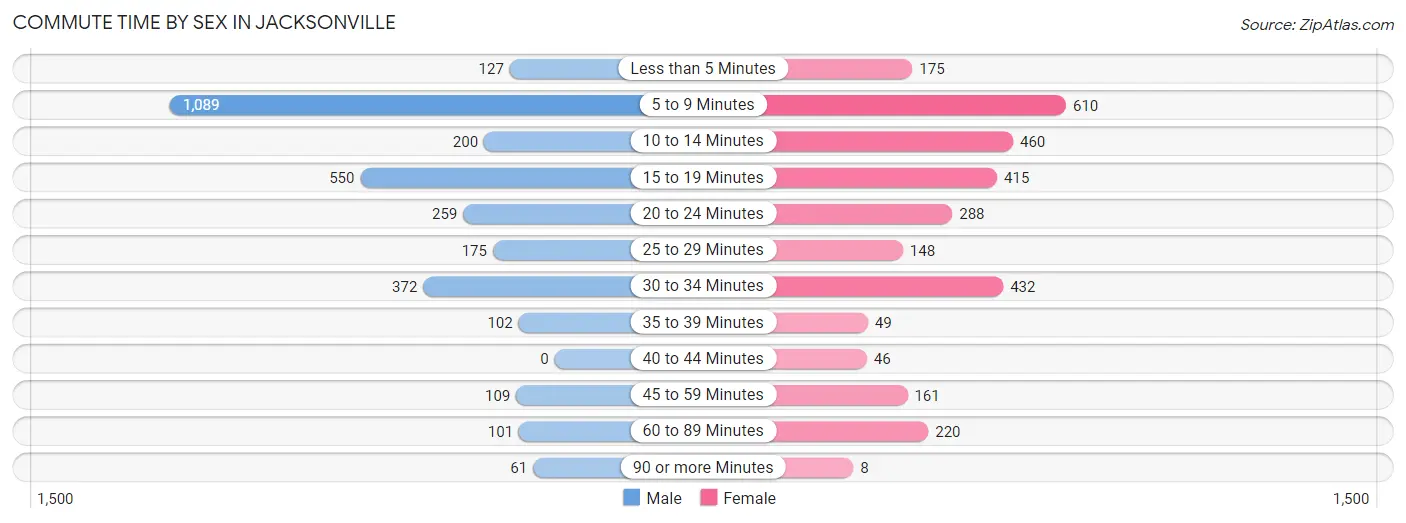
| Commute Time | Male | Female |
| Less than 5 Minutes | 127 (4.0%) | 175 (5.8%) |
| 5 to 9 Minutes | 1,089 (34.6%) | 610 (20.3%) |
| 10 to 14 Minutes | 200 (6.4%) | 460 (15.3%) |
| 15 to 19 Minutes | 550 (17.5%) | 415 (13.8%) |
| 20 to 24 Minutes | 259 (8.2%) | 288 (9.6%) |
| 25 to 29 Minutes | 175 (5.6%) | 148 (4.9%) |
| 30 to 34 Minutes | 372 (11.8%) | 432 (14.3%) |
| 35 to 39 Minutes | 102 (3.2%) | 49 (1.6%) |
| 40 to 44 Minutes | 0 (0.0%) | 46 (1.5%) |
| 45 to 59 Minutes | 109 (3.5%) | 161 (5.3%) |
| 60 to 89 Minutes | 101 (3.2%) | 220 (7.3%) |
| 90 or more Minutes | 61 (1.9%) | 8 (0.3%) |
Time of Departure to Work by Sex in Jacksonville
The most frequent times of departure to work in Jacksonville are 7:00 AM to 7:29 AM (588, 18.7%) for males and 7:30 AM to 7:59 AM (542, 18.0%) for females.
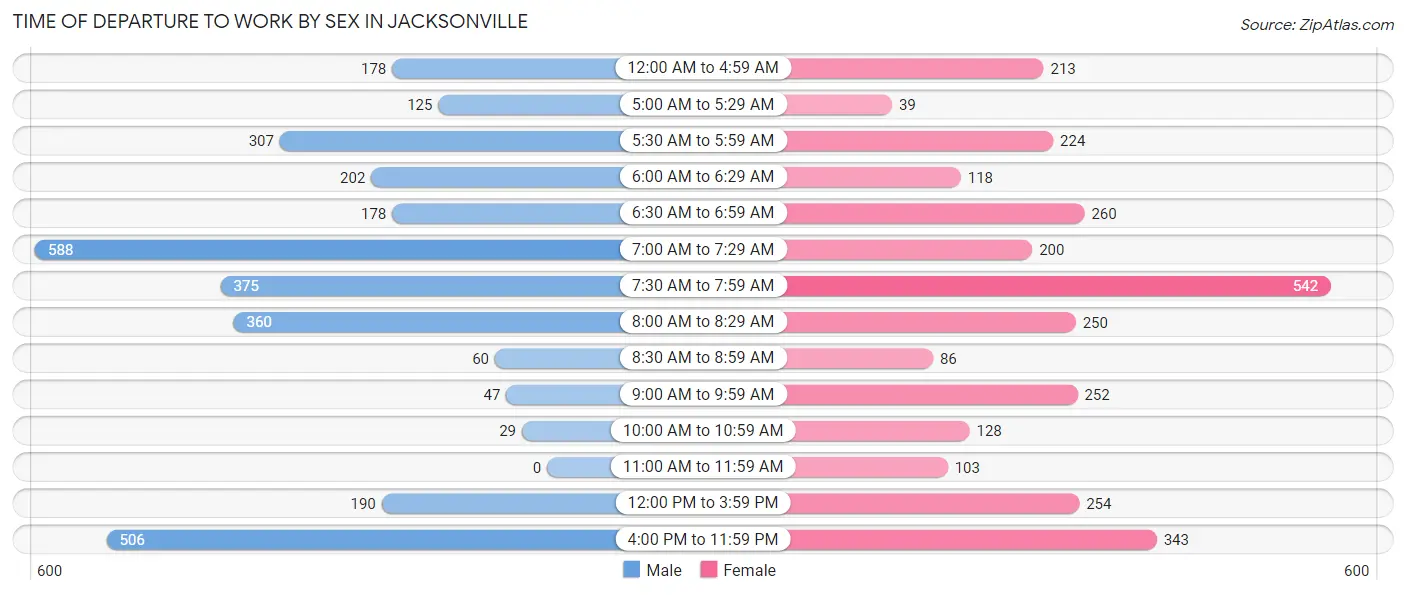
| Time of Departure | Male | Female |
| 12:00 AM to 4:59 AM | 178 (5.7%) | 213 (7.1%) |
| 5:00 AM to 5:29 AM | 125 (4.0%) | 39 (1.3%) |
| 5:30 AM to 5:59 AM | 307 (9.8%) | 224 (7.4%) |
| 6:00 AM to 6:29 AM | 202 (6.4%) | 118 (3.9%) |
| 6:30 AM to 6:59 AM | 178 (5.7%) | 260 (8.6%) |
| 7:00 AM to 7:29 AM | 588 (18.7%) | 200 (6.6%) |
| 7:30 AM to 7:59 AM | 375 (11.9%) | 542 (18.0%) |
| 8:00 AM to 8:29 AM | 360 (11.5%) | 250 (8.3%) |
| 8:30 AM to 8:59 AM | 60 (1.9%) | 86 (2.9%) |
| 9:00 AM to 9:59 AM | 47 (1.5%) | 252 (8.4%) |
| 10:00 AM to 10:59 AM | 29 (0.9%) | 128 (4.3%) |
| 11:00 AM to 11:59 AM | 0 (0.0%) | 103 (3.4%) |
| 12:00 PM to 3:59 PM | 190 (6.0%) | 254 (8.4%) |
| 4:00 PM to 11:59 PM | 506 (16.1%) | 343 (11.4%) |
| Total | 3,145 (100.0%) | 3,012 (100.0%) |
Housing Occupancy in Jacksonville
Occupancy by Ownership in Jacksonville
Of the total 5,364 dwellings in Jacksonville, owner-occupied units account for 2,827 (52.7%), while renter-occupied units make up 2,537 (47.3%).
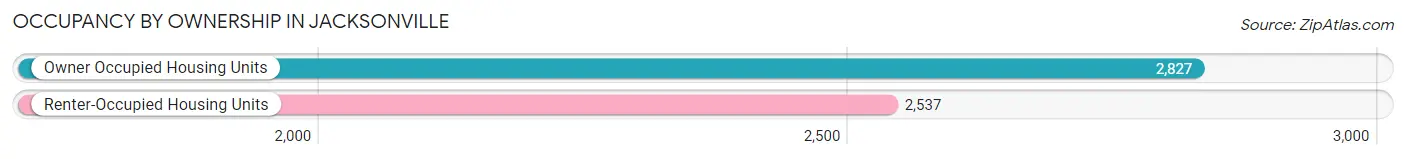
| Occupancy | # Housing Units | % Housing Units |
| Owner Occupied Housing Units | 2,827 | 52.7% |
| Renter-Occupied Housing Units | 2,537 | 47.3% |
| Total Occupied Housing Units | 5,364 | 100.0% |
Occupancy by Household Size in Jacksonville
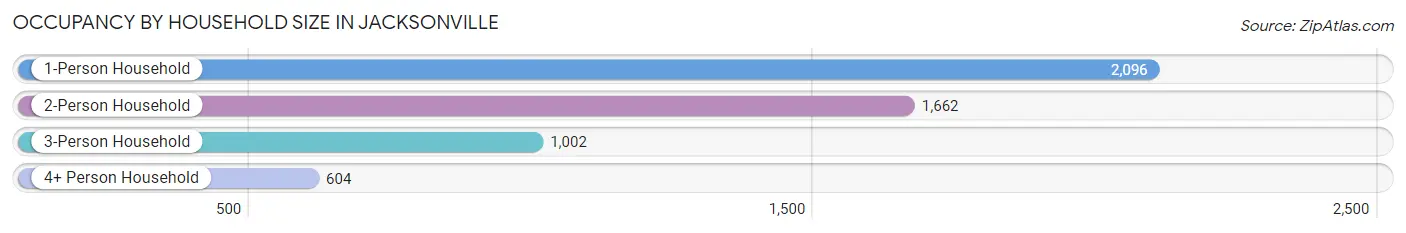
| Household Size | # Housing Units | % Housing Units |
| 1-Person Household | 2,096 | 39.1% |
| 2-Person Household | 1,662 | 31.0% |
| 3-Person Household | 1,002 | 18.7% |
| 4+ Person Household | 604 | 11.3% |
| Total Housing Units | 5,364 | 100.0% |
Occupancy by Ownership by Household Size in Jacksonville
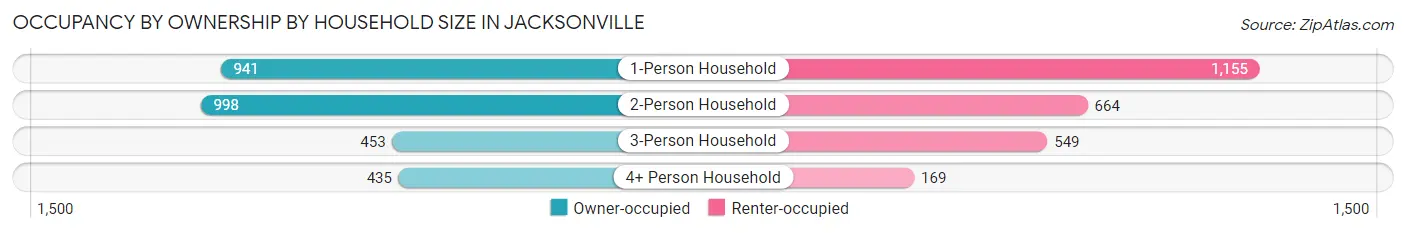
| Household Size | Owner-occupied | Renter-occupied |
| 1-Person Household | 941 (44.9%) | 1,155 (55.1%) |
| 2-Person Household | 998 (60.1%) | 664 (40.0%) |
| 3-Person Household | 453 (45.2%) | 549 (54.8%) |
| 4+ Person Household | 435 (72.0%) | 169 (28.0%) |
| Total Housing Units | 2,827 (52.7%) | 2,537 (47.3%) |
Occupancy by Educational Attainment in Jacksonville
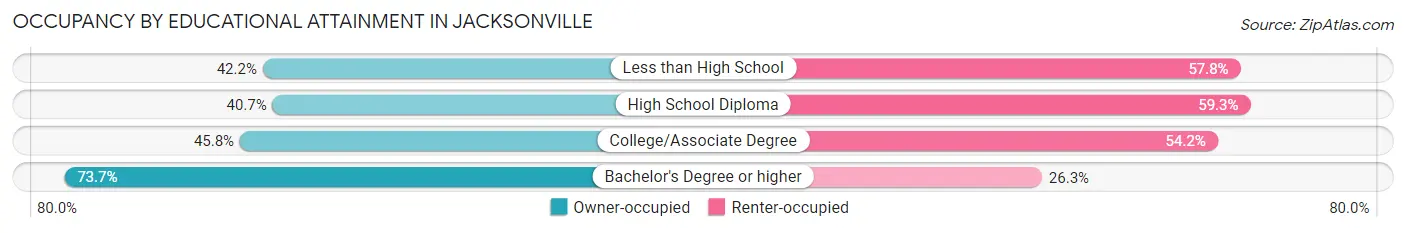
| Household Size | Owner-occupied | Renter-occupied |
| Less than High School | 258 (42.2%) | 353 (57.8%) |
| High School Diploma | 532 (40.7%) | 776 (59.3%) |
| College/Associate Degree | 826 (45.8%) | 976 (54.2%) |
| Bachelor's Degree or higher | 1,211 (73.7%) | 432 (26.3%) |
Occupancy by Age of Householder in Jacksonville
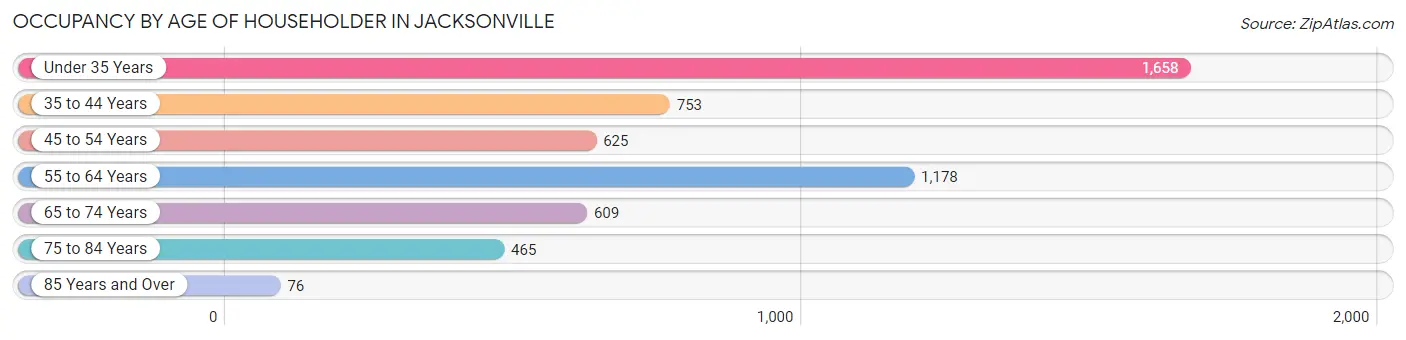
| Age Bracket | # Households | % Households |
| Under 35 Years | 1,658 | 30.9% |
| 35 to 44 Years | 753 | 14.0% |
| 45 to 54 Years | 625 | 11.7% |
| 55 to 64 Years | 1,178 | 22.0% |
| 65 to 74 Years | 609 | 11.4% |
| 75 to 84 Years | 465 | 8.7% |
| 85 Years and Over | 76 | 1.4% |
| Total | 5,364 | 100.0% |
Housing Finances in Jacksonville
Median Income by Occupancy in Jacksonville
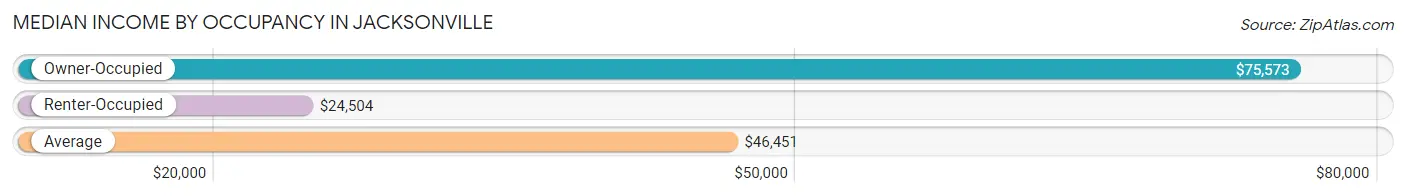
| Occupancy Type | # Households | Median Income |
| Owner-Occupied | 2,827 (52.7%) | $75,573 |
| Renter-Occupied | 2,537 (47.3%) | $24,504 |
| Average | 5,364 (100.0%) | $46,451 |
Occupancy by Householder Income Bracket in Jacksonville
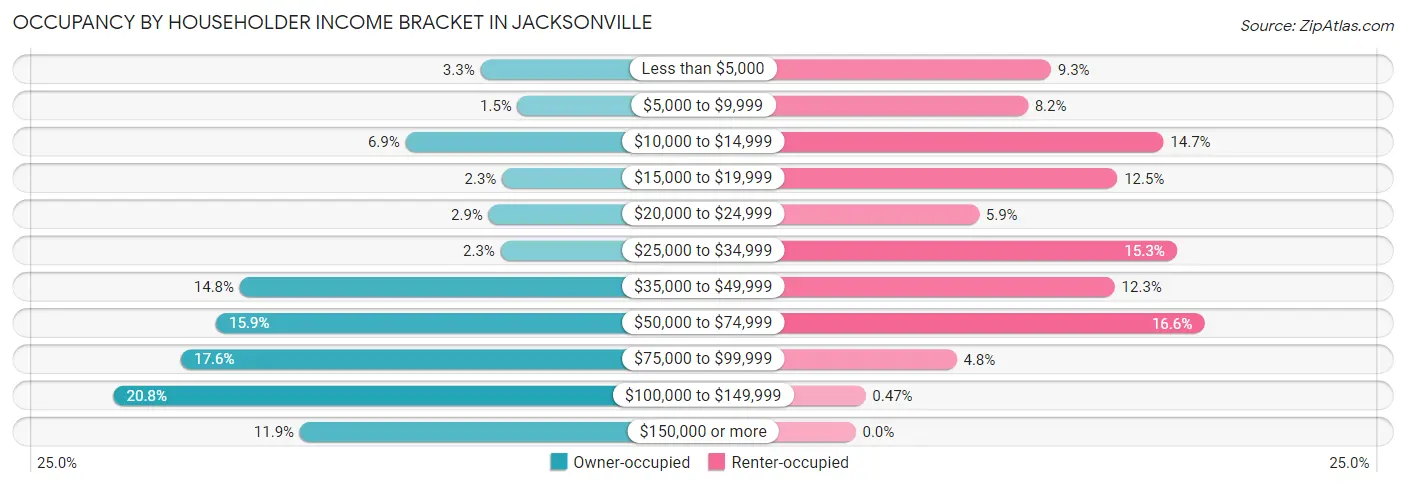
| Income Bracket | Owner-occupied | Renter-occupied |
| Less than $5,000 | 93 (3.3%) | 236 (9.3%) |
| $5,000 to $9,999 | 43 (1.5%) | 208 (8.2%) |
| $10,000 to $14,999 | 194 (6.9%) | 372 (14.7%) |
| $15,000 to $19,999 | 64 (2.3%) | 316 (12.5%) |
| $20,000 to $24,999 | 82 (2.9%) | 149 (5.9%) |
| $25,000 to $34,999 | 66 (2.3%) | 388 (15.3%) |
| $35,000 to $49,999 | 417 (14.7%) | 313 (12.3%) |
| $50,000 to $74,999 | 449 (15.9%) | 421 (16.6%) |
| $75,000 to $99,999 | 496 (17.5%) | 122 (4.8%) |
| $100,000 to $149,999 | 587 (20.8%) | 12 (0.5%) |
| $150,000 or more | 336 (11.9%) | 0 (0.0%) |
| Total | 2,827 (100.0%) | 2,537 (100.0%) |
Monthly Housing Cost Tiers in Jacksonville
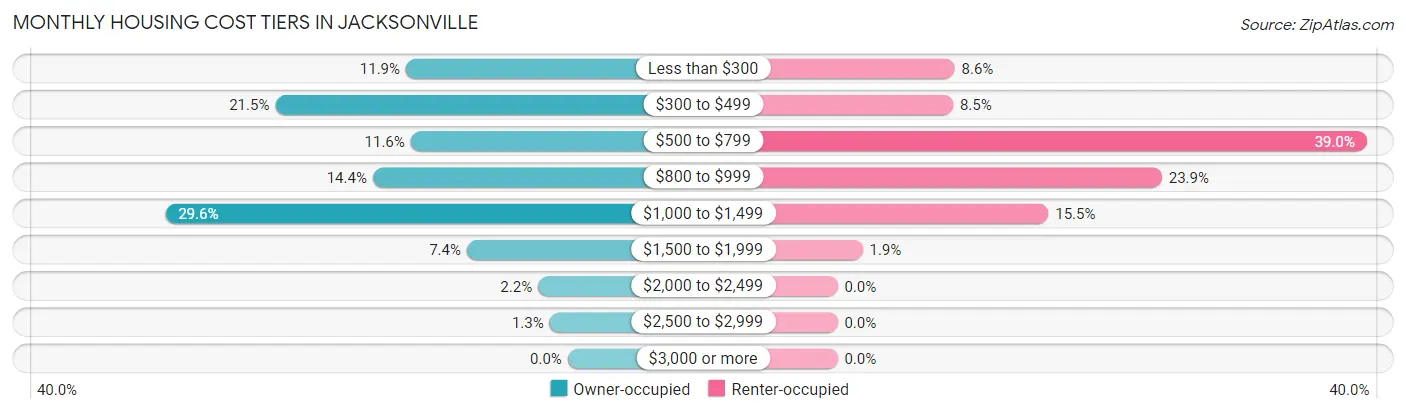
| Monthly Cost | Owner-occupied | Renter-occupied |
| Less than $300 | 337 (11.9%) | 219 (8.6%) |
| $300 to $499 | 609 (21.5%) | 216 (8.5%) |
| $500 to $799 | 327 (11.6%) | 989 (39.0%) |
| $800 to $999 | 406 (14.4%) | 606 (23.9%) |
| $1,000 to $1,499 | 838 (29.6%) | 394 (15.5%) |
| $1,500 to $1,999 | 210 (7.4%) | 47 (1.8%) |
| $2,000 to $2,499 | 62 (2.2%) | 0 (0.0%) |
| $2,500 to $2,999 | 38 (1.3%) | 0 (0.0%) |
| $3,000 or more | 0 (0.0%) | 0 (0.0%) |
| Total | 2,827 (100.0%) | 2,537 (100.0%) |
Physical Housing Characteristics in Jacksonville
Housing Structures in Jacksonville
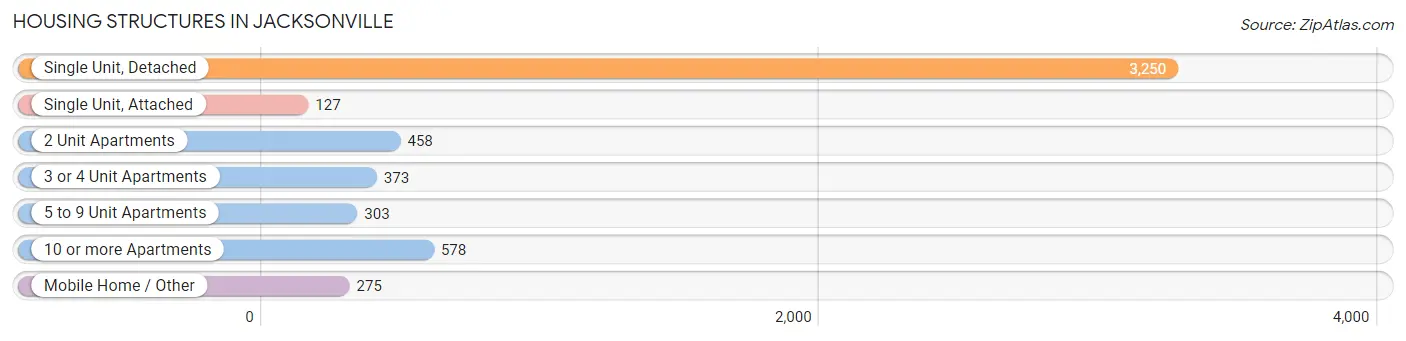
| Structure Type | # Housing Units | % Housing Units |
| Single Unit, Detached | 3,250 | 60.6% |
| Single Unit, Attached | 127 | 2.4% |
| 2 Unit Apartments | 458 | 8.5% |
| 3 or 4 Unit Apartments | 373 | 7.0% |
| 5 to 9 Unit Apartments | 303 | 5.7% |
| 10 or more Apartments | 578 | 10.8% |
| Mobile Home / Other | 275 | 5.1% |
| Total | 5,364 | 100.0% |
Housing Structures by Occupancy in Jacksonville
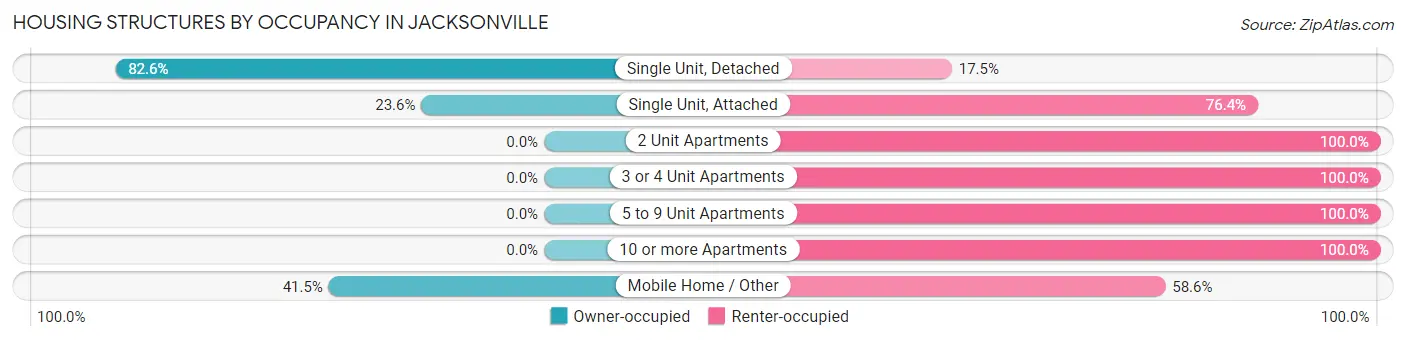
| Structure Type | Owner-occupied | Renter-occupied |
| Single Unit, Detached | 2,683 (82.6%) | 567 (17.4%) |
| Single Unit, Attached | 30 (23.6%) | 97 (76.4%) |
| 2 Unit Apartments | 0 (0.0%) | 458 (100.0%) |
| 3 or 4 Unit Apartments | 0 (0.0%) | 373 (100.0%) |
| 5 to 9 Unit Apartments | 0 (0.0%) | 303 (100.0%) |
| 10 or more Apartments | 0 (0.0%) | 578 (100.0%) |
| Mobile Home / Other | 114 (41.4%) | 161 (58.6%) |
| Total | 2,827 (52.7%) | 2,537 (47.3%) |
Housing Structures by Number of Rooms in Jacksonville
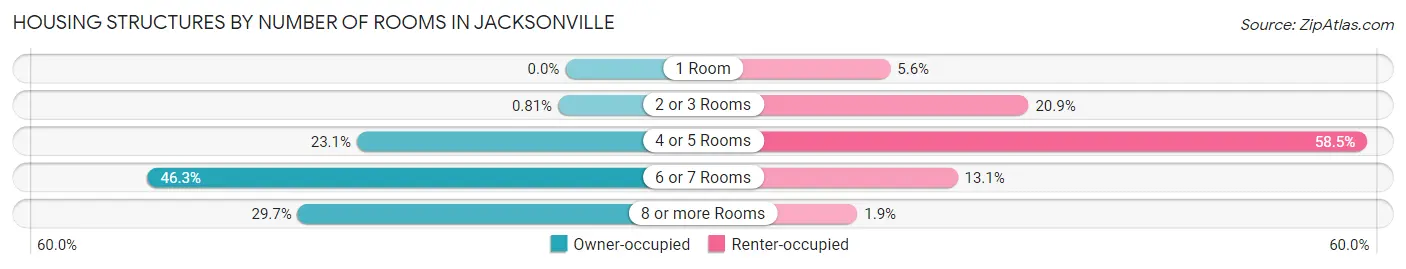
| Number of Rooms | Owner-occupied | Renter-occupied |
| 1 Room | 0 (0.0%) | 142 (5.6%) |
| 2 or 3 Rooms | 23 (0.8%) | 531 (20.9%) |
| 4 or 5 Rooms | 654 (23.1%) | 1,484 (58.5%) |
| 6 or 7 Rooms | 1,310 (46.3%) | 331 (13.1%) |
| 8 or more Rooms | 840 (29.7%) | 49 (1.9%) |
| Total | 2,827 (100.0%) | 2,537 (100.0%) |
Housing Structure by Heating Type in Jacksonville
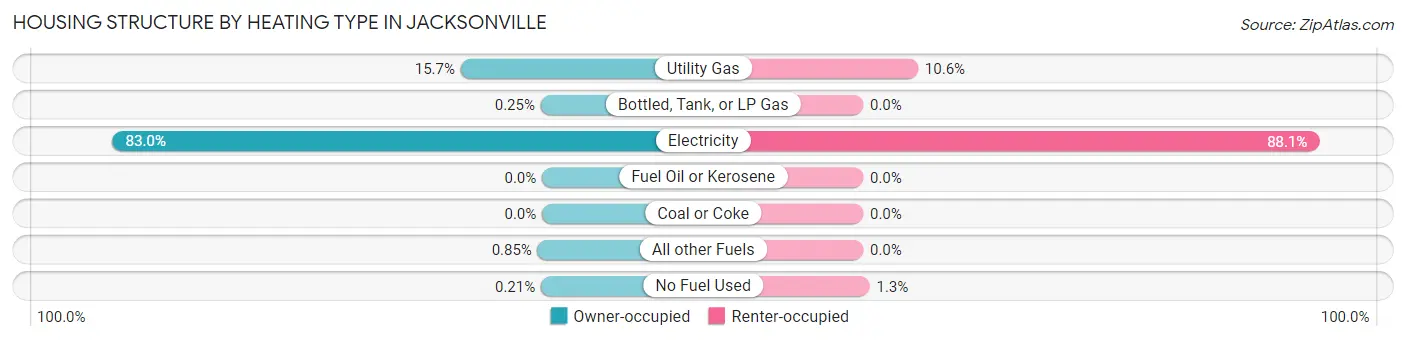
| Heating Type | Owner-occupied | Renter-occupied |
| Utility Gas | 444 (15.7%) | 269 (10.6%) |
| Bottled, Tank, or LP Gas | 7 (0.3%) | 0 (0.0%) |
| Electricity | 2,346 (83.0%) | 2,236 (88.1%) |
| Fuel Oil or Kerosene | 0 (0.0%) | 0 (0.0%) |
| Coal or Coke | 0 (0.0%) | 0 (0.0%) |
| All other Fuels | 24 (0.9%) | 0 (0.0%) |
| No Fuel Used | 6 (0.2%) | 32 (1.3%) |
| Total | 2,827 (100.0%) | 2,537 (100.0%) |
Household Vehicle Usage in Jacksonville
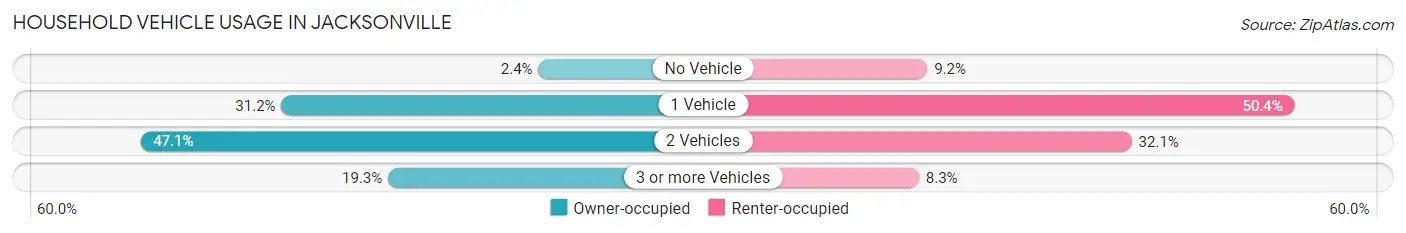
| Vehicles per Household | Owner-occupied | Renter-occupied |
| No Vehicle | 69 (2.4%) | 234 (9.2%) |
| 1 Vehicle | 883 (31.2%) | 1,278 (50.4%) |
| 2 Vehicles | 1,330 (47.0%) | 815 (32.1%) |
| 3 or more Vehicles | 545 (19.3%) | 210 (8.3%) |
| Total | 2,827 (100.0%) | 2,537 (100.0%) |
Real Estate & Mortgages in Jacksonville
Real Estate and Mortgage Overview in Jacksonville
| Characteristic | Without Mortgage | With Mortgage |
| Housing Units | 1,076 | 1,751 |
| Median Property Value | $143,600 | $183,800 |
| Median Household Income | $50,200 | $232 |
| Monthly Housing Costs | $375 | $0 |
| Real Estate Taxes | $723 | $223 |
Property Value by Mortgage Status in Jacksonville
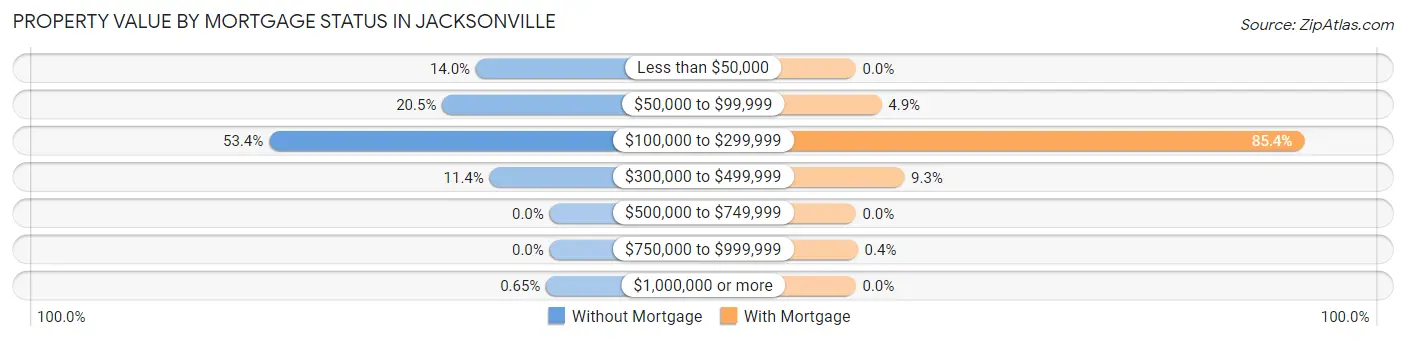
| Property Value | Without Mortgage | With Mortgage |
| Less than $50,000 | 151 (14.0%) | 0 (0.0%) |
| $50,000 to $99,999 | 220 (20.4%) | 86 (4.9%) |
| $100,000 to $299,999 | 575 (53.4%) | 1,496 (85.4%) |
| $300,000 to $499,999 | 123 (11.4%) | 162 (9.2%) |
| $500,000 to $749,999 | 0 (0.0%) | 0 (0.0%) |
| $750,000 to $999,999 | 0 (0.0%) | 7 (0.4%) |
| $1,000,000 or more | 7 (0.6%) | 0 (0.0%) |
| Total | 1,076 (100.0%) | 1,751 (100.0%) |
Household Income by Mortgage Status in Jacksonville
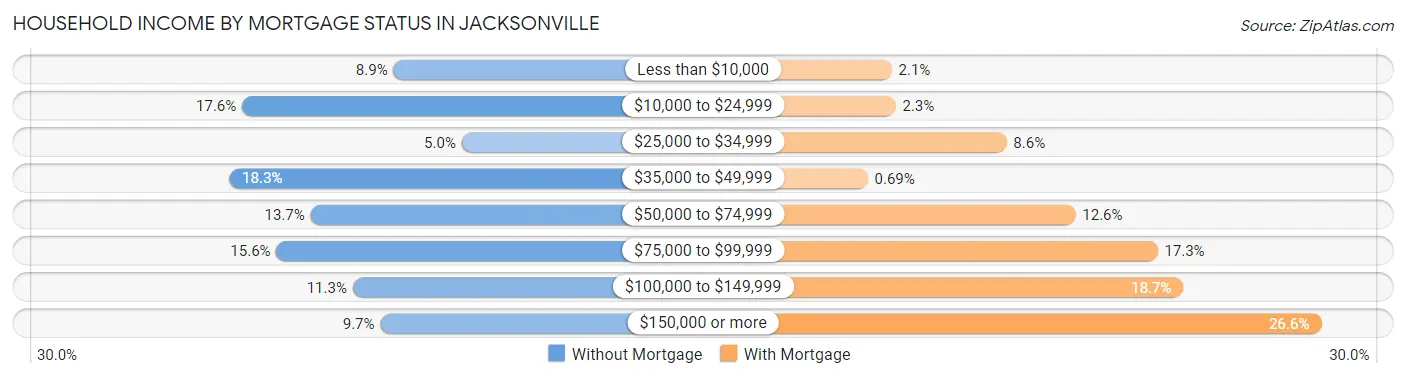
| Household Income | Without Mortgage | With Mortgage |
| Less than $10,000 | 96 (8.9%) | 36 (2.1%) |
| $10,000 to $24,999 | 189 (17.6%) | 40 (2.3%) |
| $25,000 to $34,999 | 54 (5.0%) | 151 (8.6%) |
| $35,000 to $49,999 | 197 (18.3%) | 12 (0.7%) |
| $50,000 to $74,999 | 147 (13.7%) | 220 (12.6%) |
| $75,000 to $99,999 | 168 (15.6%) | 302 (17.2%) |
| $100,000 to $149,999 | 121 (11.3%) | 328 (18.7%) |
| $150,000 or more | 104 (9.7%) | 466 (26.6%) |
| Total | 1,076 (100.0%) | 1,751 (100.0%) |
Property Value to Household Income Ratio in Jacksonville
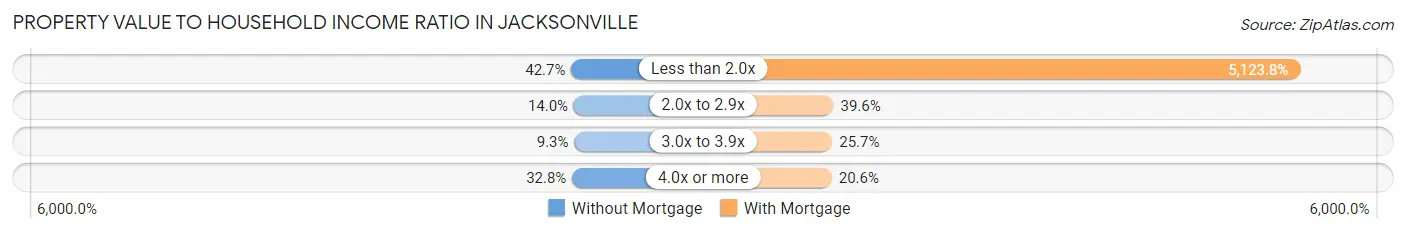
| Value-to-Income Ratio | Without Mortgage | With Mortgage |
| Less than 2.0x | 459 (42.7%) | 89,718 (5,123.8%) |
| 2.0x to 2.9x | 151 (14.0%) | 693 (39.6%) |
| 3.0x to 3.9x | 100 (9.3%) | 450 (25.7%) |
| 4.0x or more | 353 (32.8%) | 360 (20.6%) |
| Total | 1,076 (100.0%) | 1,751 (100.0%) |
Real Estate Taxes by Mortgage Status in Jacksonville
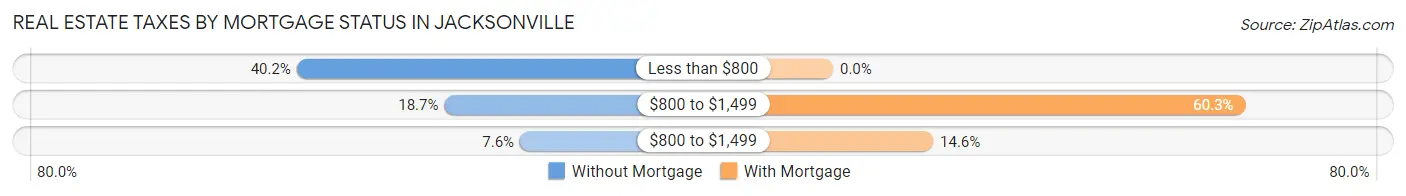
| Property Taxes | Without Mortgage | With Mortgage |
| Less than $800 | 433 (40.2%) | 0 (0.0%) |
| $800 to $1,499 | 201 (18.7%) | 1,055 (60.3%) |
| $800 to $1,499 | 82 (7.6%) | 256 (14.6%) |
| Total | 1,076 (100.0%) | 1,751 (100.0%) |
Health & Disability in Jacksonville
Health Insurance Coverage by Age in Jacksonville
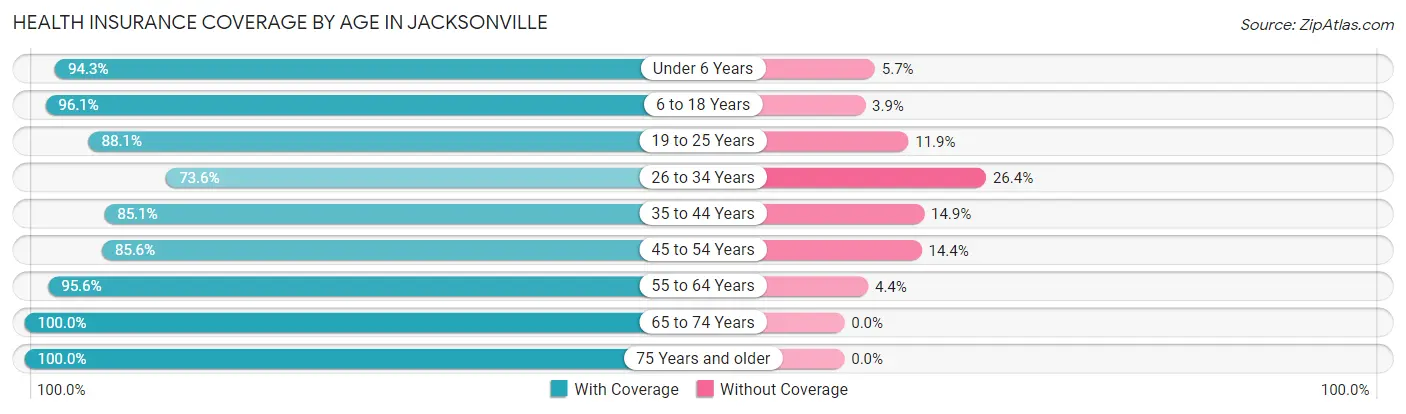
| Age Bracket | With Coverage | Without Coverage |
| Under 6 Years | 729 (94.3%) | 44 (5.7%) |
| 6 to 18 Years | 2,008 (96.1%) | 81 (3.9%) |
| 19 to 25 Years | 3,230 (88.1%) | 438 (11.9%) |
| 26 to 34 Years | 1,203 (73.6%) | 432 (26.4%) |
| 35 to 44 Years | 1,368 (85.1%) | 239 (14.9%) |
| 45 to 54 Years | 784 (85.6%) | 132 (14.4%) |
| 55 to 64 Years | 1,617 (95.6%) | 75 (4.4%) |
| 65 to 74 Years | 803 (100.0%) | 0 (0.0%) |
| 75 Years and older | 726 (100.0%) | 0 (0.0%) |
| Total | 12,468 (89.6%) | 1,441 (10.4%) |
Health Insurance Coverage by Citizenship Status in Jacksonville
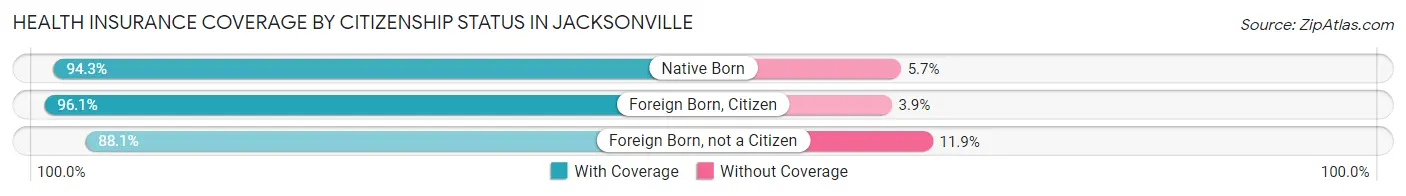
| Citizenship Status | With Coverage | Without Coverage |
| Native Born | 729 (94.3%) | 44 (5.7%) |
| Foreign Born, Citizen | 2,008 (96.1%) | 81 (3.9%) |
| Foreign Born, not a Citizen | 3,230 (88.1%) | 438 (11.9%) |
Health Insurance Coverage by Household Income in Jacksonville
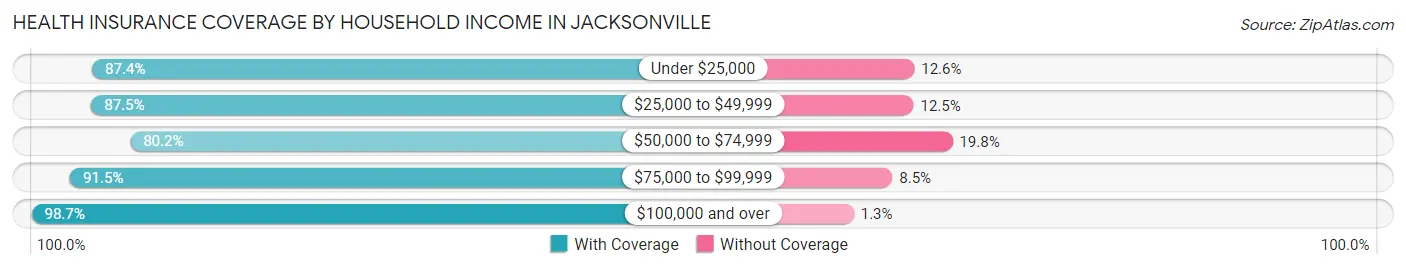
| Household Income | With Coverage | Without Coverage |
| Under $25,000 | 2,626 (87.4%) | 380 (12.6%) |
| $25,000 to $49,999 | 2,422 (87.5%) | 346 (12.5%) |
| $50,000 to $74,999 | 1,835 (80.2%) | 453 (19.8%) |
| $75,000 to $99,999 | 1,338 (91.5%) | 125 (8.5%) |
| $100,000 and over | 2,420 (98.7%) | 32 (1.3%) |
Public vs Private Health Insurance Coverage by Age in Jacksonville
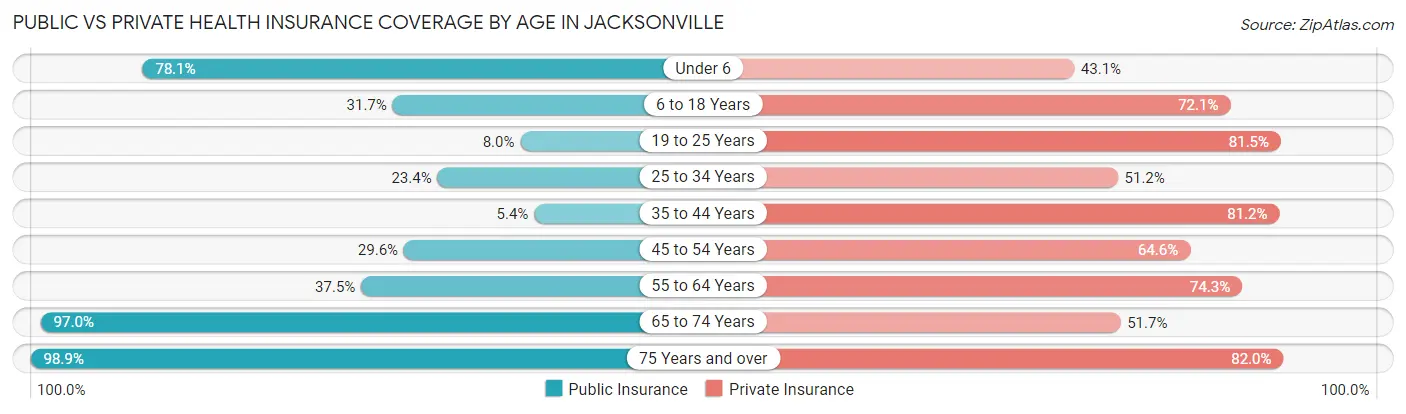
| Age Bracket | Public Insurance | Private Insurance |
| Under 6 | 604 (78.1%) | 333 (43.1%) |
| 6 to 18 Years | 662 (31.7%) | 1,506 (72.1%) |
| 19 to 25 Years | 293 (8.0%) | 2,989 (81.5%) |
| 25 to 34 Years | 382 (23.4%) | 837 (51.2%) |
| 35 to 44 Years | 87 (5.4%) | 1,305 (81.2%) |
| 45 to 54 Years | 271 (29.6%) | 592 (64.6%) |
| 55 to 64 Years | 635 (37.5%) | 1,257 (74.3%) |
| 65 to 74 Years | 779 (97.0%) | 415 (51.7%) |
| 75 Years and over | 718 (98.9%) | 595 (82.0%) |
| Total | 4,431 (31.9%) | 9,829 (70.7%) |
Disability Status by Sex by Age in Jacksonville
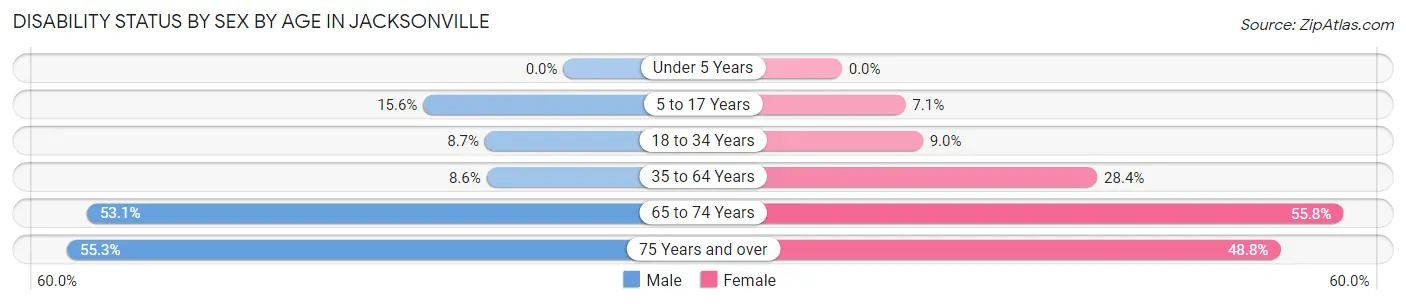
| Age Bracket | Male | Female |
| Under 5 Years | 0 (0.0%) | 0 (0.0%) |
| 5 to 17 Years | 113 (15.6%) | 46 (7.1%) |
| 18 to 34 Years | 234 (8.7%) | 313 (9.0%) |
| 35 to 64 Years | 171 (8.6%) | 630 (28.4%) |
| 65 to 74 Years | 139 (53.0%) | 302 (55.8%) |
| 75 Years and over | 168 (55.3%) | 206 (48.8%) |
Disability Class by Sex by Age in Jacksonville
Disability Class: Hearing Difficulty
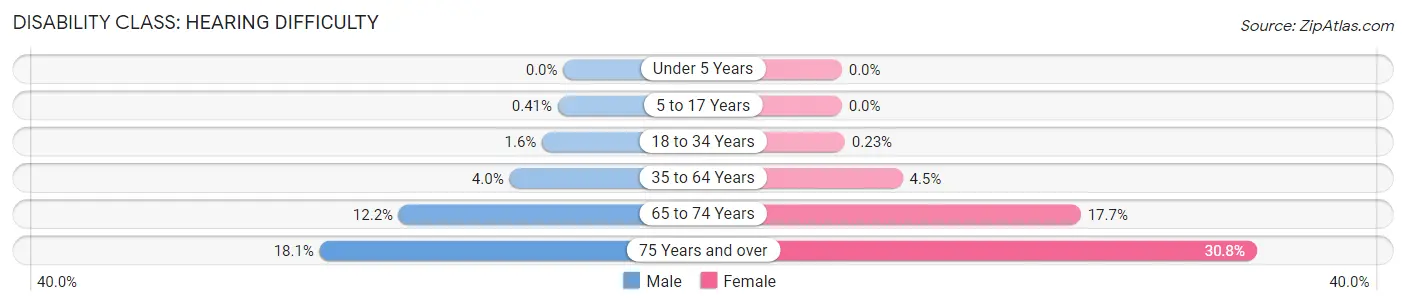
| Age Bracket | Male | Female |
| Under 5 Years | 0 (0.0%) | 0 (0.0%) |
| 5 to 17 Years | 3 (0.4%) | 0 (0.0%) |
| 18 to 34 Years | 42 (1.6%) | 8 (0.2%) |
| 35 to 64 Years | 80 (4.0%) | 100 (4.5%) |
| 65 to 74 Years | 32 (12.2%) | 96 (17.7%) |
| 75 Years and over | 55 (18.1%) | 130 (30.8%) |
Disability Class: Vision Difficulty
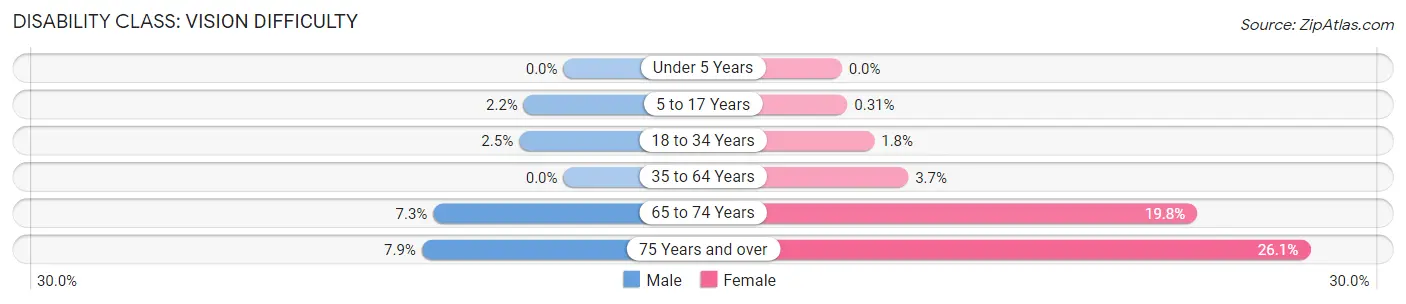
| Age Bracket | Male | Female |
| Under 5 Years | 0 (0.0%) | 0 (0.0%) |
| 5 to 17 Years | 16 (2.2%) | 2 (0.3%) |
| 18 to 34 Years | 66 (2.5%) | 63 (1.8%) |
| 35 to 64 Years | 0 (0.0%) | 82 (3.7%) |
| 65 to 74 Years | 19 (7.2%) | 107 (19.8%) |
| 75 Years and over | 24 (7.9%) | 110 (26.1%) |
Disability Class: Cognitive Difficulty
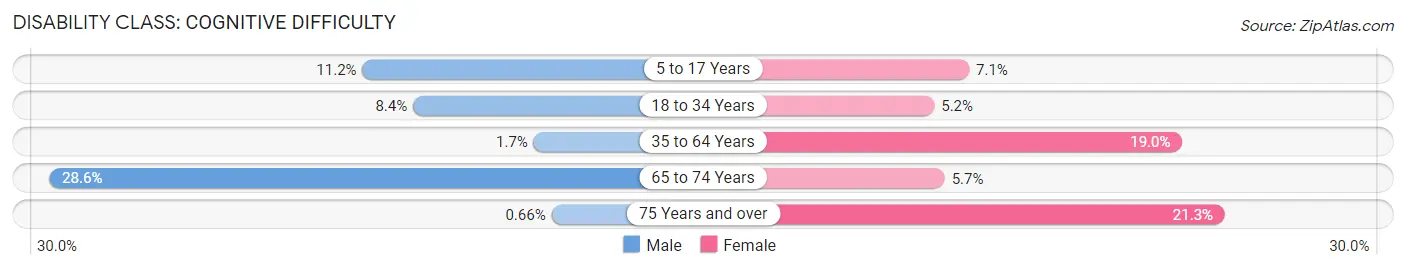
| Age Bracket | Male | Female |
| 5 to 17 Years | 81 (11.2%) | 46 (7.1%) |
| 18 to 34 Years | 224 (8.4%) | 179 (5.1%) |
| 35 to 64 Years | 33 (1.7%) | 420 (19.0%) |
| 65 to 74 Years | 75 (28.6%) | 31 (5.7%) |
| 75 Years and over | 2 (0.7%) | 90 (21.3%) |
Disability Class: Ambulatory Difficulty
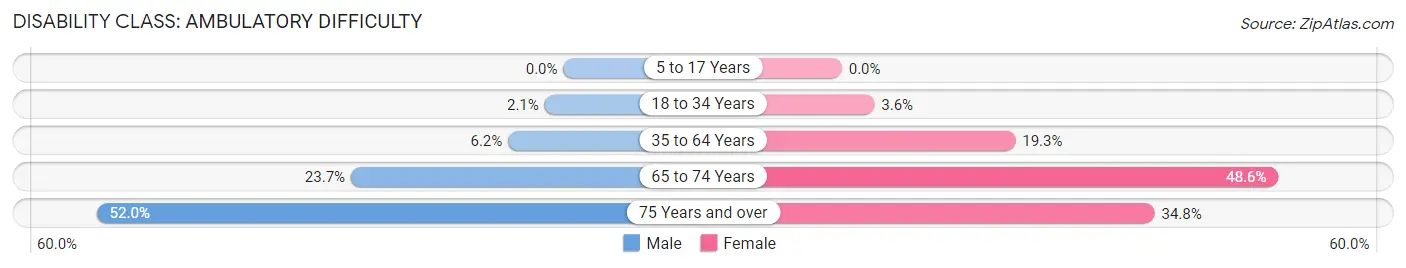
| Age Bracket | Male | Female |
| 5 to 17 Years | 0 (0.0%) | 0 (0.0%) |
| 18 to 34 Years | 56 (2.1%) | 126 (3.6%) |
| 35 to 64 Years | 123 (6.1%) | 428 (19.3%) |
| 65 to 74 Years | 62 (23.7%) | 263 (48.6%) |
| 75 Years and over | 158 (52.0%) | 147 (34.8%) |
Disability Class: Self-Care Difficulty
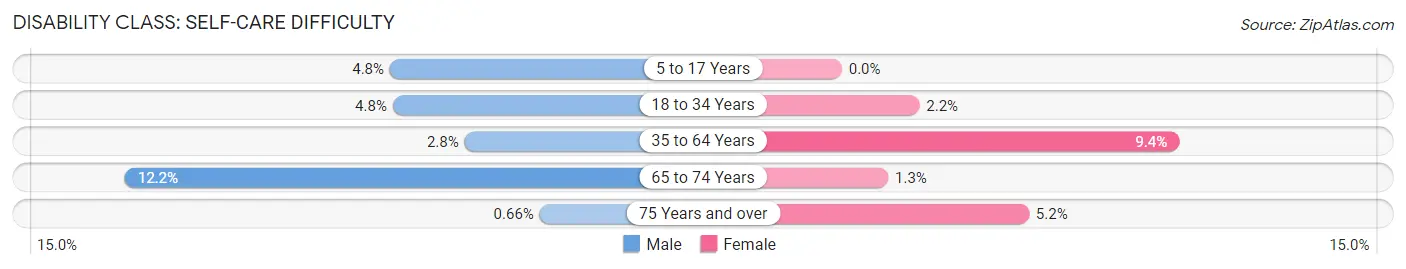
| Age Bracket | Male | Female |
| 5 to 17 Years | 35 (4.8%) | 0 (0.0%) |
| 18 to 34 Years | 127 (4.8%) | 75 (2.2%) |
| 35 to 64 Years | 55 (2.8%) | 208 (9.4%) |
| 65 to 74 Years | 32 (12.2%) | 7 (1.3%) |
| 75 Years and over | 2 (0.7%) | 22 (5.2%) |
Technology Access in Jacksonville
Computing Device Access in Jacksonville
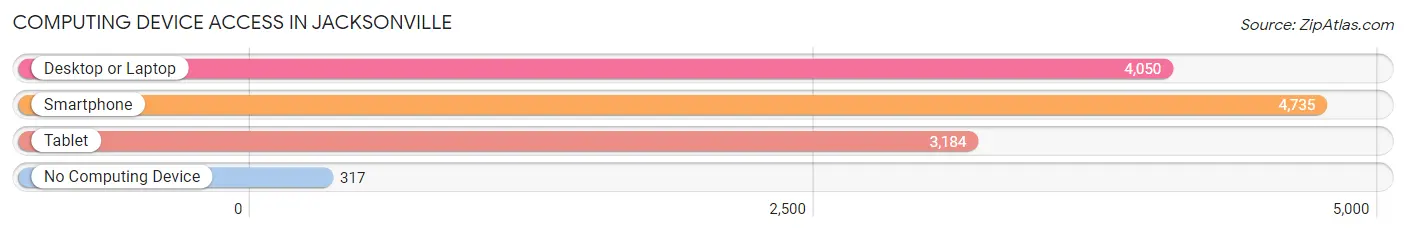
| Device Type | # Households | % Households |
| Desktop or Laptop | 4,050 | 75.5% |
| Smartphone | 4,735 | 88.3% |
| Tablet | 3,184 | 59.4% |
| No Computing Device | 317 | 5.9% |
| Total | 5,364 | 100.0% |
Internet Access in Jacksonville
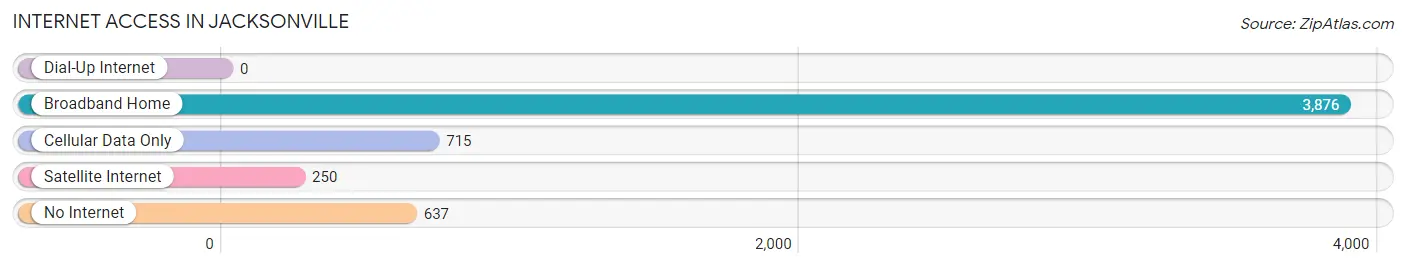
| Internet Type | # Households | % Households |
| Dial-Up Internet | 0 | 0.0% |
| Broadband Home | 3,876 | 72.3% |
| Cellular Data Only | 715 | 13.3% |
| Satellite Internet | 250 | 4.7% |
| No Internet | 637 | 11.9% |
| Total | 5,364 | 100.0% |
Jacksonville Summary
Jacksonville, Alabama is a small city located in Calhoun County in the northeastern part of the state. It is the county seat of Calhoun County and is located about 20 miles south of Anniston. The city has a population of about 12,000 people and is part of the Anniston-Oxford Metropolitan Statistical Area.
History
Jacksonville was founded in 1833 and was named after President Andrew Jackson. The city was originally a trading post and was the site of a major battle during the Civil War. The Battle of Jacksonville was fought on April 11, 1865 and was a major victory for the Union forces. After the war, the city was rebuilt and became a major center for the timber and coal industries.
Geography
Jacksonville is located in the foothills of the Appalachian Mountains and is situated at the intersection of two major highways, US Highway 431 and Alabama Highway 21. The city is located about 20 miles south of Anniston and is about 90 miles northeast of Birmingham. The city is surrounded by rolling hills and is located in a valley. The city is located at an elevation of about 600 feet above sea level.
Economy
Jacksonville’s economy is largely based on the timber and coal industries. The city is home to several timber mills and coal mines. The city is also home to several manufacturing plants, including a paper mill and a furniture factory. The city is also home to several retail stores and restaurants.
Demographics
As of the 2010 census, the population of Jacksonville was 11,637. The racial makeup of the city was 79.3% White, 17.2% African American, 0.3% Native American, 0.7% Asian, 0.1% Pacific Islander, and 2.4% from two or more races. The median household income was $31,945 and the median family income was $41,945. The per capita income was $17,945.
Jacksonville is a small city with a rich history and a diverse economy. The city is home to several industries and is a great place to live and work. The city is also home to several retail stores and restaurants, making it a great place to visit. Jacksonville is a great place to live and work and is a great place to visit.
Common Questions
What is Per Capita Income in Jacksonville?
Per Capita income in Jacksonville is $24,334.
What is the Median Family Income in Jacksonville?
Median Family Income in Jacksonville is $62,715.
What is the Median Household income in Jacksonville?
Median Household Income in Jacksonville is $46,451.
What is Income or Wage Gap in Jacksonville?
Income or Wage Gap in Jacksonville is 17.0%.
Women in Jacksonville earn 83.0 cents for every dollar earned by a man.
What is Family Income Deficit in Jacksonville?
Family Income Deficit in Jacksonville is $6,643.
Families that are below poverty line in Jacksonville earn $6,643 less on average than the poverty threshold level.
What is Inequality or Gini Index in Jacksonville?
Inequality or Gini Index in Jacksonville is 0.48.
What is the Total Population of Jacksonville?
Total Population of Jacksonville is 14,227.
What is the Total Male Population of Jacksonville?
Total Male Population of Jacksonville is 6,606.
What is the Total Female Population of Jacksonville?
Total Female Population of Jacksonville is 7,621.
What is the Ratio of Males per 100 Females in Jacksonville?
There are 86.68 Males per 100 Females in Jacksonville.
What is the Ratio of Females per 100 Males in Jacksonville?
There are 115.36 Females per 100 Males in Jacksonville.
What is the Median Population Age in Jacksonville?
Median Population Age in Jacksonville is 28.8 Years.
What is the Average Family Size in Jacksonville
Average Family Size in Jacksonville is 3.0 People.
What is the Average Household Size in Jacksonville
Average Household Size in Jacksonville is 2.2 People.
How Large is the Labor Force in Jacksonville?
There are 7,144 People in the Labor Forcein in Jacksonville.
What is the Percentage of People in the Labor Force in Jacksonville?
57.9% of People are in the Labor Force in Jacksonville.
What is the Unemployment Rate in Jacksonville?
Unemployment Rate in Jacksonville is 6.9%.