River Falls, WI Map & Demographics
River Falls Map
River Falls Overview
$31,811
PER CAPITA INCOME
$99,297
AVG FAMILY INCOME
$72,247
AVG HOUSEHOLD INCOME
55.1%
WAGE / INCOME GAP [ % ]
44.9¢/ $1
WAGE / INCOME GAP [ $ ]
0.42
INEQUALITY / GINI INDEX
16,165
TOTAL POPULATION
7,596
MALE POPULATION
8,569
FEMALE POPULATION
88.65
MALES / 100 FEMALES
112.81
FEMALES / 100 MALES
26.8
MEDIAN AGE
3.0
AVG FAMILY SIZE
2.5
AVG HOUSEHOLD SIZE
9,467
LABOR FORCE [ PEOPLE ]
69.2%
PERCENT IN LABOR FORCE
3.3%
UNEMPLOYMENT RATE
River Falls Zip Codes
River Falls Area Codes
Income in River Falls
Income Overview in River Falls
Per Capita Income in River Falls is $31,811, while median incomes of families and households are $99,297 and $72,247 respectively.
| Characteristic | Number | Measure |
| Per Capita Income | 16,165 | $31,811 |
| Median Family Income | 3,056 | $99,297 |
| Mean Family Income | 3,056 | $106,065 |
| Median Household Income | 5,416 | $72,247 |
| Mean Household Income | 5,416 | $89,094 |
| Income Deficit | 3,056 | $0 |
| Wage / Income Gap (%) | 16,165 | 55.09% |
| Wage / Income Gap ($) | 16,165 | 44.91¢ per $1 |
| Gini / Inequality Index | 16,165 | 0.42 |
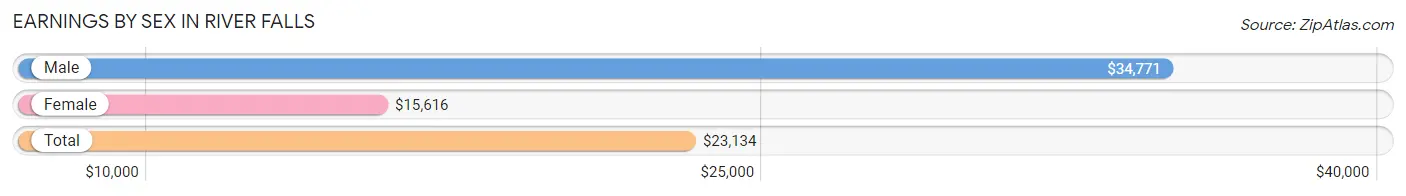
Earnings by Sex in River Falls
Average Earnings in River Falls are $23,134, $34,771 for men and $15,616 for women, a difference of 55.1%.
| Sex | Number | Average Earnings |
| Male | 4,976 (46.0%) | $34,771 |
| Female | 5,848 (54.0%) | $15,616 |
| Total | 10,824 (100.0%) | $23,134 |
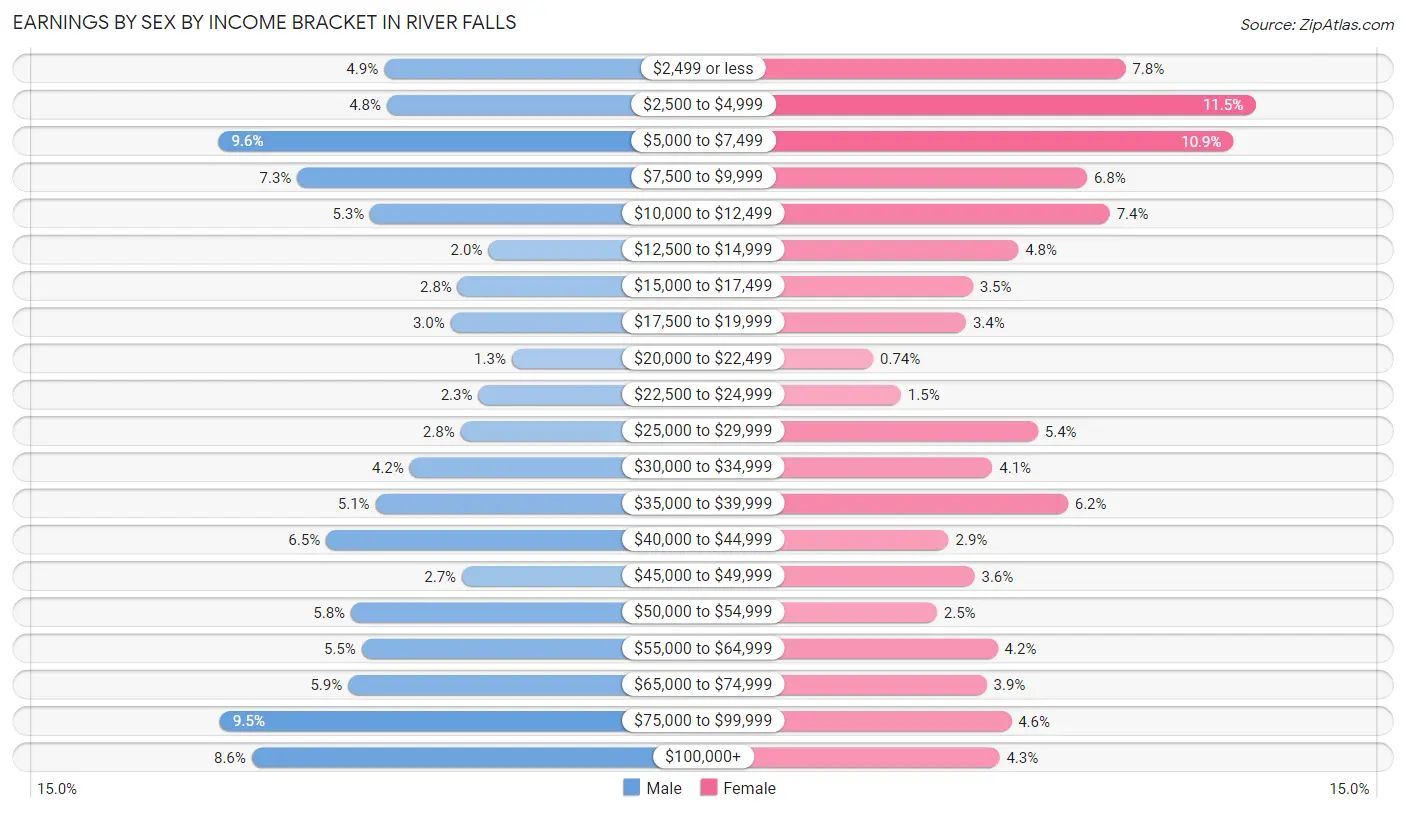
Earnings by Sex by Income Bracket in River Falls
The most common earnings brackets in River Falls are $5,000 to $7,499 for men (475 | 9.6%) and $2,500 to $4,999 for women (671 | 11.5%).
| Income | Male | Female |
| $2,499 or less | 244 (4.9%) | 458 (7.8%) |
| $2,500 to $4,999 | 240 (4.8%) | 671 (11.5%) |
| $5,000 to $7,499 | 475 (9.6%) | 635 (10.9%) |
| $7,500 to $9,999 | 365 (7.3%) | 395 (6.8%) |
| $10,000 to $12,499 | 263 (5.3%) | 432 (7.4%) |
| $12,500 to $14,999 | 98 (2.0%) | 282 (4.8%) |
| $15,000 to $17,499 | 141 (2.8%) | 207 (3.5%) |
| $17,500 to $19,999 | 151 (3.0%) | 196 (3.4%) |
| $20,000 to $22,499 | 65 (1.3%) | 43 (0.7%) |
| $22,500 to $24,999 | 112 (2.2%) | 89 (1.5%) |
| $25,000 to $29,999 | 137 (2.8%) | 314 (5.4%) |
| $30,000 to $34,999 | 208 (4.2%) | 239 (4.1%) |
| $35,000 to $39,999 | 256 (5.1%) | 363 (6.2%) |
| $40,000 to $44,999 | 325 (6.5%) | 167 (2.9%) |
| $45,000 to $49,999 | 135 (2.7%) | 210 (3.6%) |
| $50,000 to $54,999 | 290 (5.8%) | 148 (2.5%) |
| $55,000 to $64,999 | 275 (5.5%) | 248 (4.2%) |
| $65,000 to $74,999 | 294 (5.9%) | 230 (3.9%) |
| $75,000 to $99,999 | 473 (9.5%) | 270 (4.6%) |
| $100,000+ | 429 (8.6%) | 251 (4.3%) |
| Total | 4,976 (100.0%) | 5,848 (100.0%) |
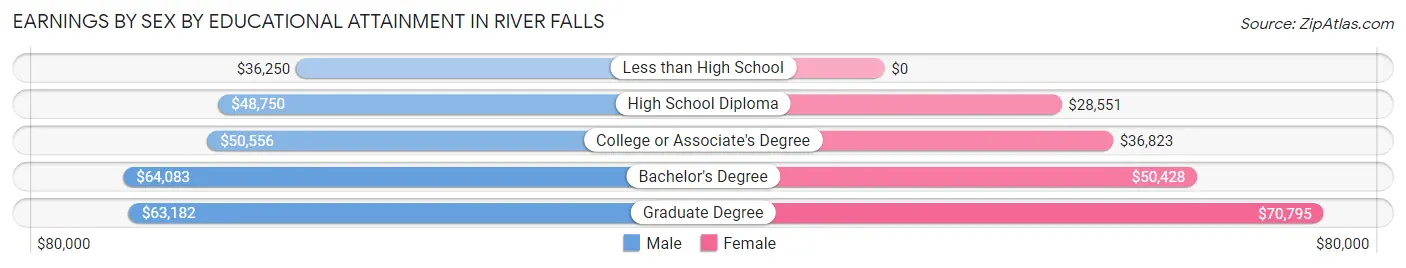
Earnings by Sex by Educational Attainment in River Falls
Average earnings in River Falls are $53,063 for men and $42,250 for women, a difference of 20.4%. Men with an educational attainment of bachelor's degree enjoy the highest average annual earnings of $64,083, while those with less than high school education earn the least with $36,250. Women with an educational attainment of graduate degree earn the most with the average annual earnings of $70,795, while those with high school diploma education have the smallest earnings of $28,551.
| Educational Attainment | Male Income | Female Income |
| Less than High School | $36,250 | $0 |
| High School Diploma | $48,750 | $28,551 |
| College or Associate's Degree | $50,556 | $36,823 |
| Bachelor's Degree | $64,083 | $50,428 |
| Graduate Degree | $63,182 | $70,795 |
| Total | $53,063 | $42,250 |
Family Income in River Falls
Family Income Brackets in River Falls
According to the River Falls family income data, there are 972 families falling into the $100,000 to $149,999 income range, which is the most common income bracket and makes up 31.8% of all families. Conversely, the $15,000 to $24,999 income bracket is the least frequent group with only 15 families (0.5%) belonging to this category.
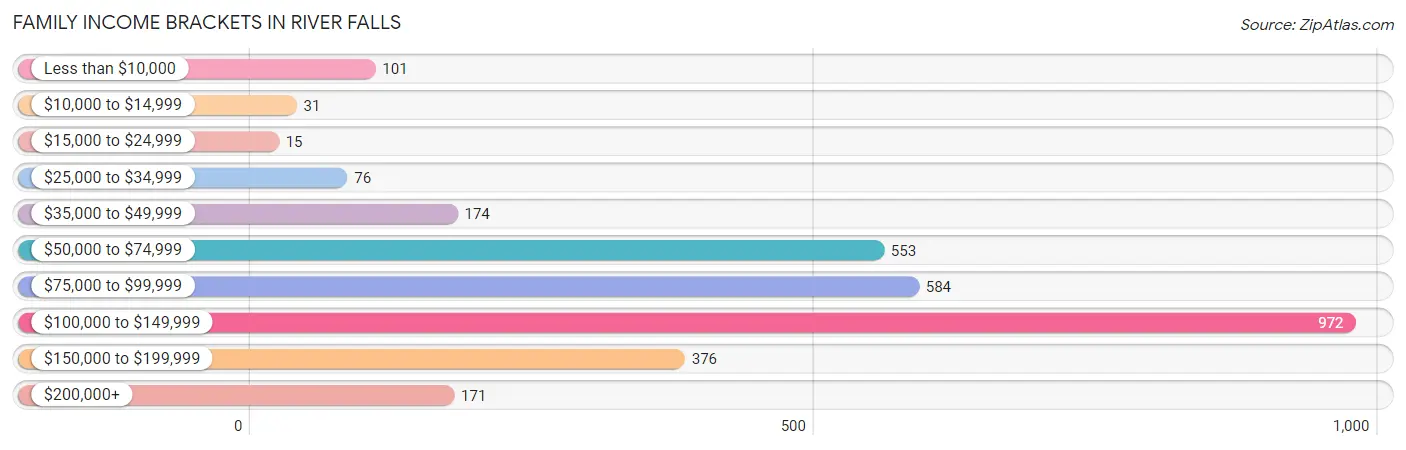
| Income Bracket | # Families | % Families |
| Less than $10,000 | 101 | 3.3% |
| $10,000 to $14,999 | 31 | 1.0% |
| $15,000 to $24,999 | 15 | 0.5% |
| $25,000 to $34,999 | 76 | 2.5% |
| $35,000 to $49,999 | 174 | 5.7% |
| $50,000 to $74,999 | 553 | 18.1% |
| $75,000 to $99,999 | 584 | 19.1% |
| $100,000 to $149,999 | 972 | 31.8% |
| $150,000 to $199,999 | 376 | 12.3% |
| $200,000+ | 171 | 5.6% |
Family Income by Famaliy Size in River Falls
6-person families (82 | 2.7%) account for the highest median family income in River Falls with $225,566 per family, while 2-person families (1,392 | 45.6%) have the highest median income of $44,289 per family member.
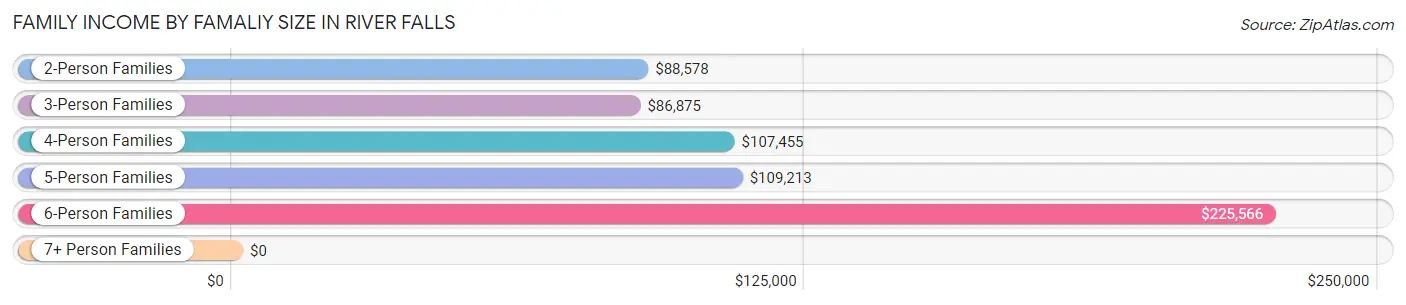
| Income Bracket | # Families | Median Income |
| 2-Person Families | 1,392 (45.6%) | $88,578 |
| 3-Person Families | 690 (22.6%) | $86,875 |
| 4-Person Families | 625 (20.4%) | $107,455 |
| 5-Person Families | 227 (7.4%) | $109,213 |
| 6-Person Families | 82 (2.7%) | $225,566 |
| 7+ Person Families | 40 (1.3%) | $0 |
| Total | 3,056 (100.0%) | $99,297 |
Family Income by Number of Earners in River Falls
The median family income in River Falls is $99,297, with families comprising 3+ earners (267) having the highest median family income of $143,036, while families with 1 earner (815) have the lowest median family income of $76,264, accounting for 8.7% and 26.7% of families, respectively.
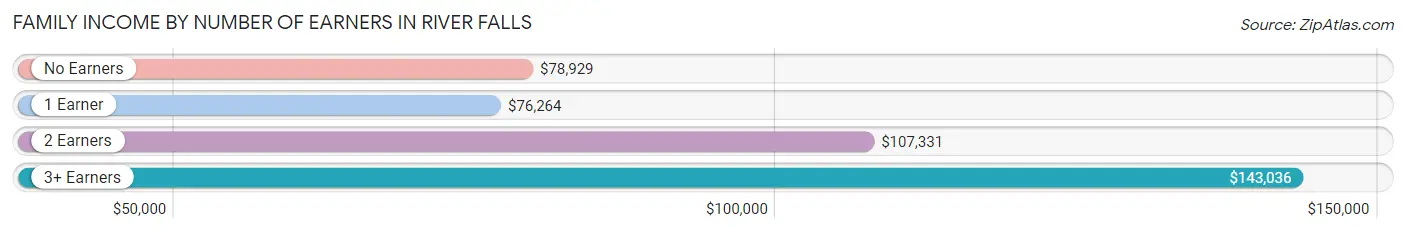
| Number of Earners | # Families | Median Income |
| No Earners | 310 (10.1%) | $78,929 |
| 1 Earner | 815 (26.7%) | $76,264 |
| 2 Earners | 1,664 (54.4%) | $107,331 |
| 3+ Earners | 267 (8.7%) | $143,036 |
| Total | 3,056 (100.0%) | $99,297 |
Household Income in River Falls
Household Income Brackets in River Falls
With 1,143 households falling in the category, the $100,000 to $149,999 income range is the most frequent in River Falls, accounting for 21.1% of all households. In contrast, only 152 households (2.8%) fall into the $10,000 to $14,999 income bracket, making it the least populous group.
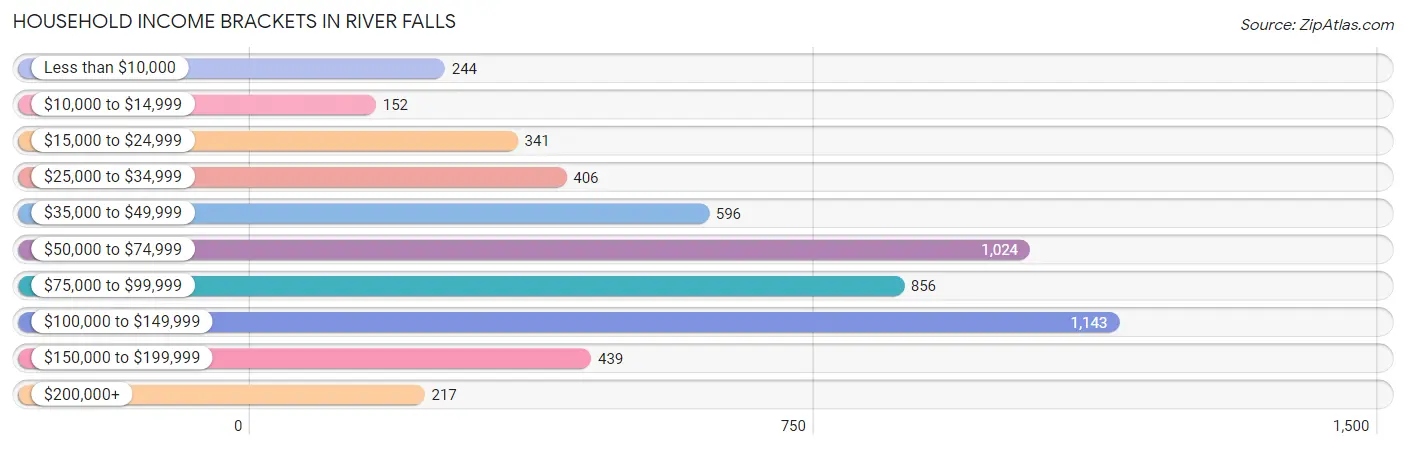
| Income Bracket | # Households | % Households |
| Less than $10,000 | 244 | 4.5% |
| $10,000 to $14,999 | 152 | 2.8% |
| $15,000 to $24,999 | 341 | 6.3% |
| $25,000 to $34,999 | 406 | 7.5% |
| $35,000 to $49,999 | 596 | 11.0% |
| $50,000 to $74,999 | 1,024 | 18.9% |
| $75,000 to $99,999 | 856 | 15.8% |
| $100,000 to $149,999 | 1,143 | 21.1% |
| $150,000 to $199,999 | 439 | 8.1% |
| $200,000+ | 217 | 4.0% |
Household Income by Householder Age in River Falls
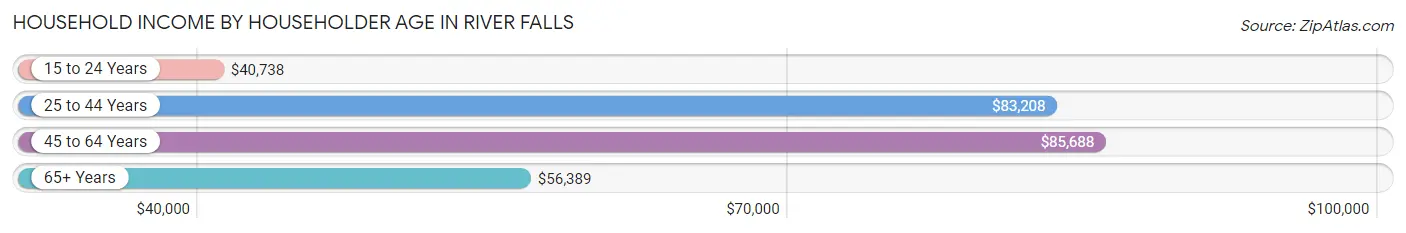
The median household income in River Falls is $72,247, with the highest median household income of $85,688 found in the 45 to 64 years age bracket for the primary householder. A total of 1,717 households (31.7%) fall into this category. Meanwhile, the 15 to 24 years age bracket for the primary householder has the lowest median household income of $40,738, with 751 households (13.9%) in this group.
| Income Bracket | # Households | Median Income |
| 15 to 24 Years | 751 (13.9%) | $40,738 |
| 25 to 44 Years | 1,762 (32.5%) | $83,208 |
| 45 to 64 Years | 1,717 (31.7%) | $85,688 |
| 65+ Years | 1,186 (21.9%) | $56,389 |
| Total | 5,416 (100.0%) | $72,247 |
Poverty in River Falls
Income Below Poverty by Sex and Age in River Falls
With 15.6% poverty level for males and 20.5% for females among the residents of River Falls, 18 to 24 year old males and 18 to 24 year old females are the most vulnerable to poverty, with 569 males (49.1%) and 1,069 females (58.1%) in their respective age groups living below the poverty level.
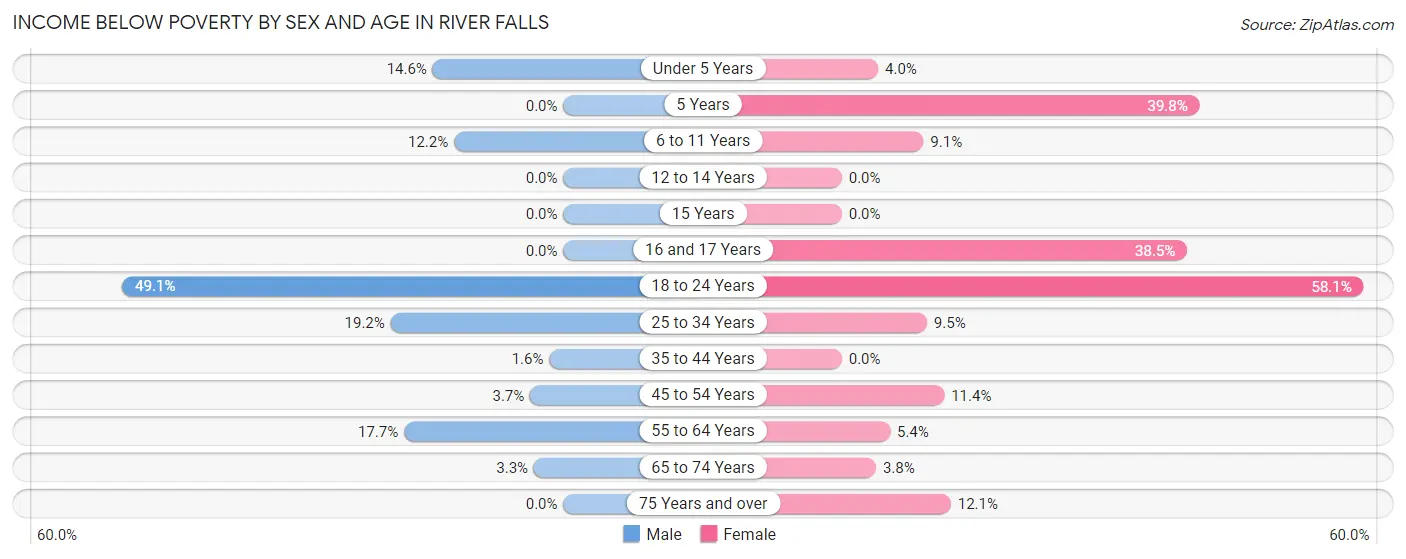
| Age Bracket | Male | Female |
| Under 5 Years | 55 (14.5%) | 8 (4.0%) |
| 5 Years | 0 (0.0%) | 49 (39.8%) |
| 6 to 11 Years | 64 (12.2%) | 49 (9.1%) |
| 12 to 14 Years | 0 (0.0%) | 0 (0.0%) |
| 15 Years | 0 (0.0%) | 0 (0.0%) |
| 16 and 17 Years | 0 (0.0%) | 10 (38.5%) |
| 18 to 24 Years | 569 (49.1%) | 1,069 (58.1%) |
| 25 to 34 Years | 187 (19.2%) | 85 (9.5%) |
| 35 to 44 Years | 13 (1.6%) | 0 (0.0%) |
| 45 to 54 Years | 31 (3.7%) | 64 (11.4%) |
| 55 to 64 Years | 116 (17.7%) | 44 (5.4%) |
| 65 to 74 Years | 21 (3.3%) | 18 (3.8%) |
| 75 Years and over | 0 (0.0%) | 55 (12.1%) |
| Total | 1,056 (15.6%) | 1,451 (20.5%) |
Income Above Poverty by Sex and Age in River Falls
According to the poverty statistics in River Falls, males aged 5 years and females aged 12 to 14 years are the age groups that are most secure financially, with 100.0% of males and 100.0% of females in these age groups living above the poverty line.
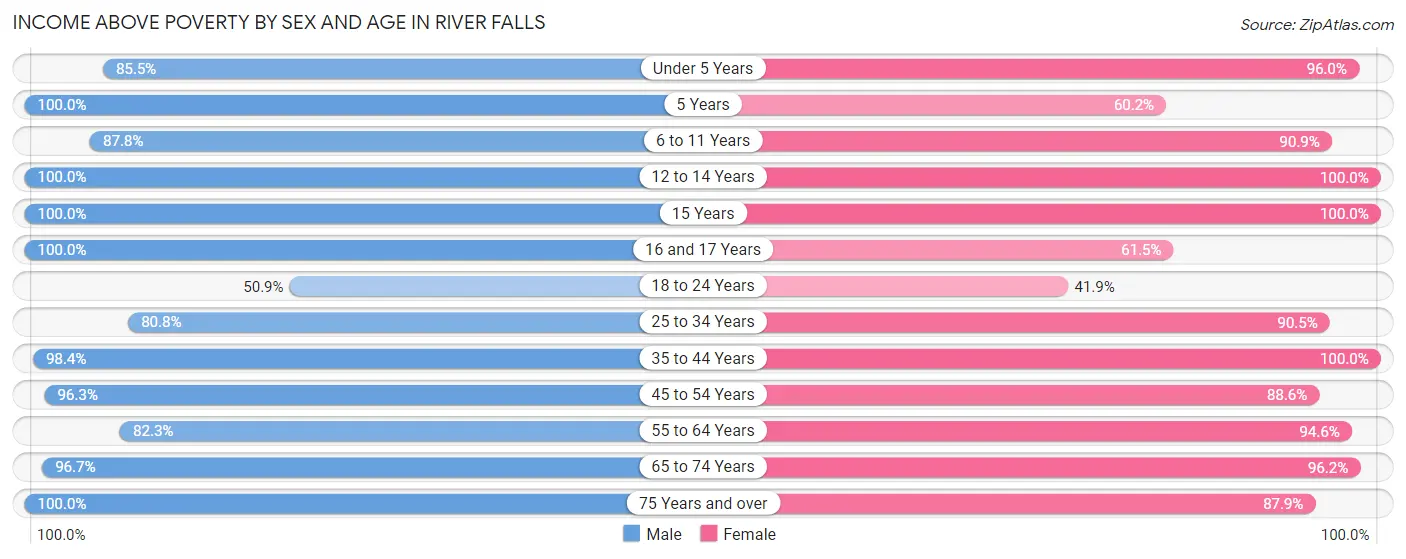
| Age Bracket | Male | Female |
| Under 5 Years | 323 (85.5%) | 190 (96.0%) |
| 5 Years | 53 (100.0%) | 74 (60.2%) |
| 6 to 11 Years | 462 (87.8%) | 490 (90.9%) |
| 12 to 14 Years | 260 (100.0%) | 249 (100.0%) |
| 15 Years | 79 (100.0%) | 76 (100.0%) |
| 16 and 17 Years | 156 (100.0%) | 16 (61.5%) |
| 18 to 24 Years | 589 (50.9%) | 771 (41.9%) |
| 25 to 34 Years | 785 (80.8%) | 812 (90.5%) |
| 35 to 44 Years | 821 (98.4%) | 815 (100.0%) |
| 45 to 54 Years | 806 (96.3%) | 497 (88.6%) |
| 55 to 64 Years | 538 (82.3%) | 775 (94.6%) |
| 65 to 74 Years | 619 (96.7%) | 454 (96.2%) |
| 75 Years and over | 231 (100.0%) | 398 (87.9%) |
| Total | 5,722 (84.4%) | 5,617 (79.5%) |
Income Below Poverty Among Married-Couple Families in River Falls
The poverty statistics for married-couple families in River Falls show that 1.0% or 24 of the total 2,350 families live below the poverty line. Families with no children have the highest poverty rate of 1.8%, comprising of 24 families. On the other hand, families with 1 or 2 children have the lowest poverty rate of 0.0%, which includes 0 families.
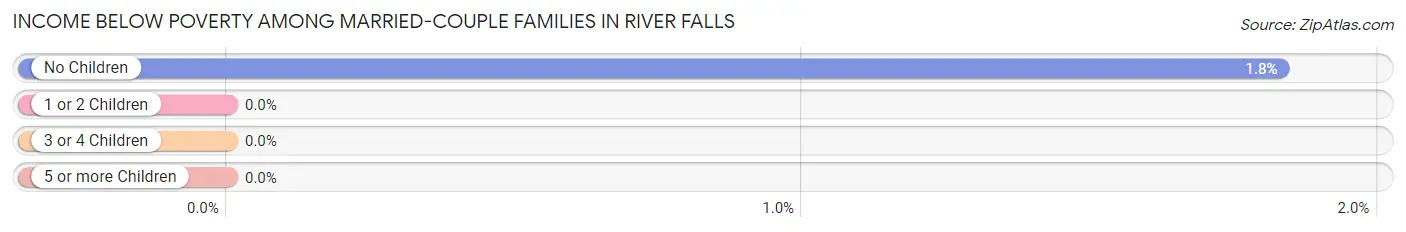
| Children | Above Poverty | Below Poverty |
| No Children | 1,288 (98.2%) | 24 (1.8%) |
| 1 or 2 Children | 810 (100.0%) | 0 (0.0%) |
| 3 or 4 Children | 228 (100.0%) | 0 (0.0%) |
| 5 or more Children | 0 (0.0%) | 0 (0.0%) |
| Total | 2,326 (99.0%) | 24 (1.0%) |
Income Below Poverty Among Single-Parent Households in River Falls
According to the poverty data in River Falls, 12.3% or 29 single-father households and 17.0% or 80 single-mother households are living below the poverty line. Among single-father households, those with 1 or 2 children have the highest poverty rate, with 29 households (22.8%) experiencing poverty. Likewise, among single-mother households, those with 3 or 4 children have the highest poverty rate, with 46 households (65.7%) falling below the poverty line.
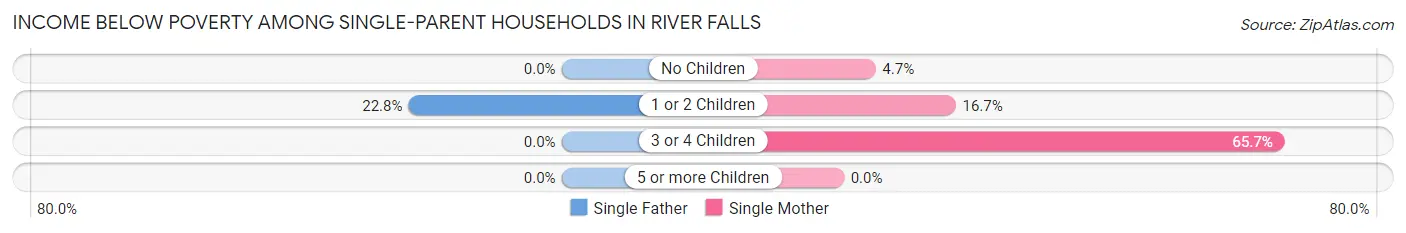
| Children | Single Father | Single Mother |
| No Children | 0 (0.0%) | 13 (4.7%) |
| 1 or 2 Children | 29 (22.8%) | 21 (16.7%) |
| 3 or 4 Children | 0 (0.0%) | 46 (65.7%) |
| 5 or more Children | 0 (0.0%) | 0 (0.0%) |
| Total | 29 (12.3%) | 80 (17.0%) |
Income Below Poverty Among Married-Couple vs Single-Parent Households in River Falls
The poverty data for River Falls shows that 24 of the married-couple family households (1.0%) and 109 of the single-parent households (15.4%) are living below the poverty level. Within the married-couple family households, those with no children have the highest poverty rate, with 24 households (1.8%) falling below the poverty line. Among the single-parent households, those with 3 or 4 children have the highest poverty rate, with 46 household (33.1%) living below poverty.
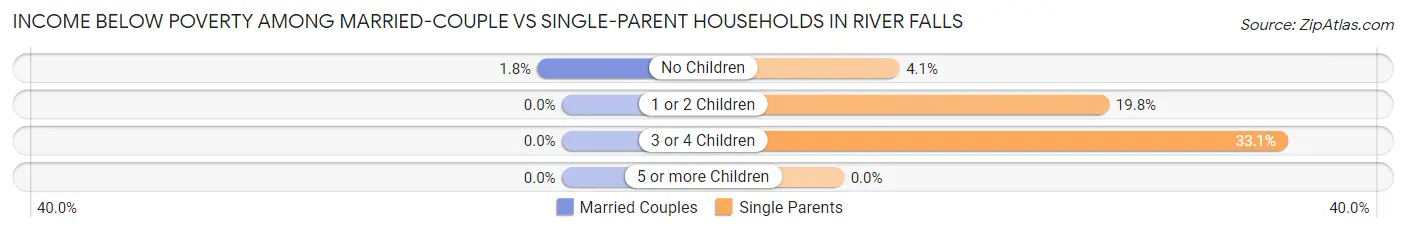
| Children | Married-Couple Families | Single-Parent Households |
| No Children | 24 (1.8%) | 13 (4.1%) |
| 1 or 2 Children | 0 (0.0%) | 50 (19.8%) |
| 3 or 4 Children | 0 (0.0%) | 46 (33.1%) |
| 5 or more Children | 0 (0.0%) | 0 (0.0%) |
| Total | 24 (1.0%) | 109 (15.4%) |
Race in River Falls
The most populous races in River Falls are White / Caucasian (14,889 | 92.1%), Two or more Races (616 | 3.8%), and Hispanic or Latino (373 | 2.3%).
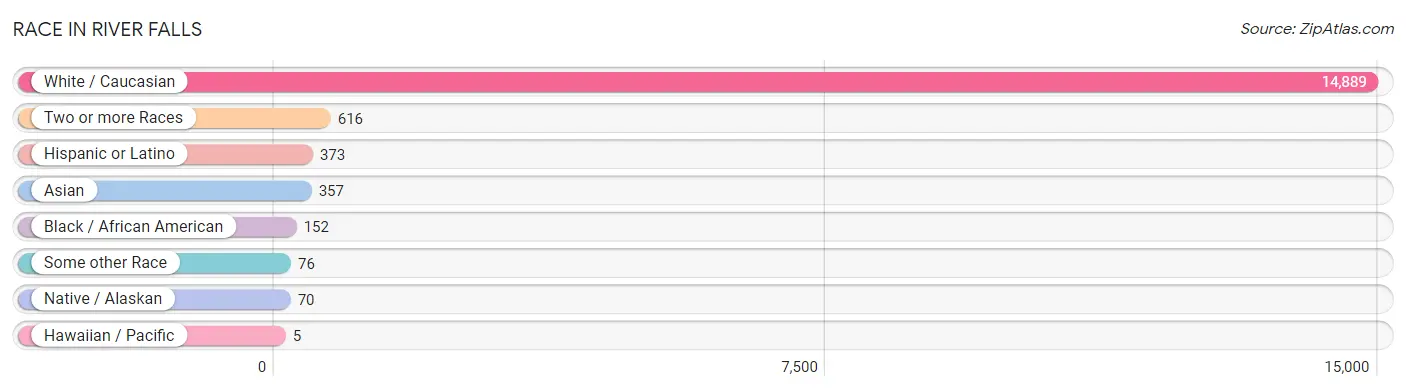
| Race | # Population | % Population |
| Asian | 357 | 2.2% |
| Black / African American | 152 | 0.9% |
| Hawaiian / Pacific | 5 | 0.0% |
| Hispanic or Latino | 373 | 2.3% |
| Native / Alaskan | 70 | 0.4% |
| White / Caucasian | 14,889 | 92.1% |
| Two or more Races | 616 | 3.8% |
| Some other Race | 76 | 0.5% |
| Total | 16,165 | 100.0% |
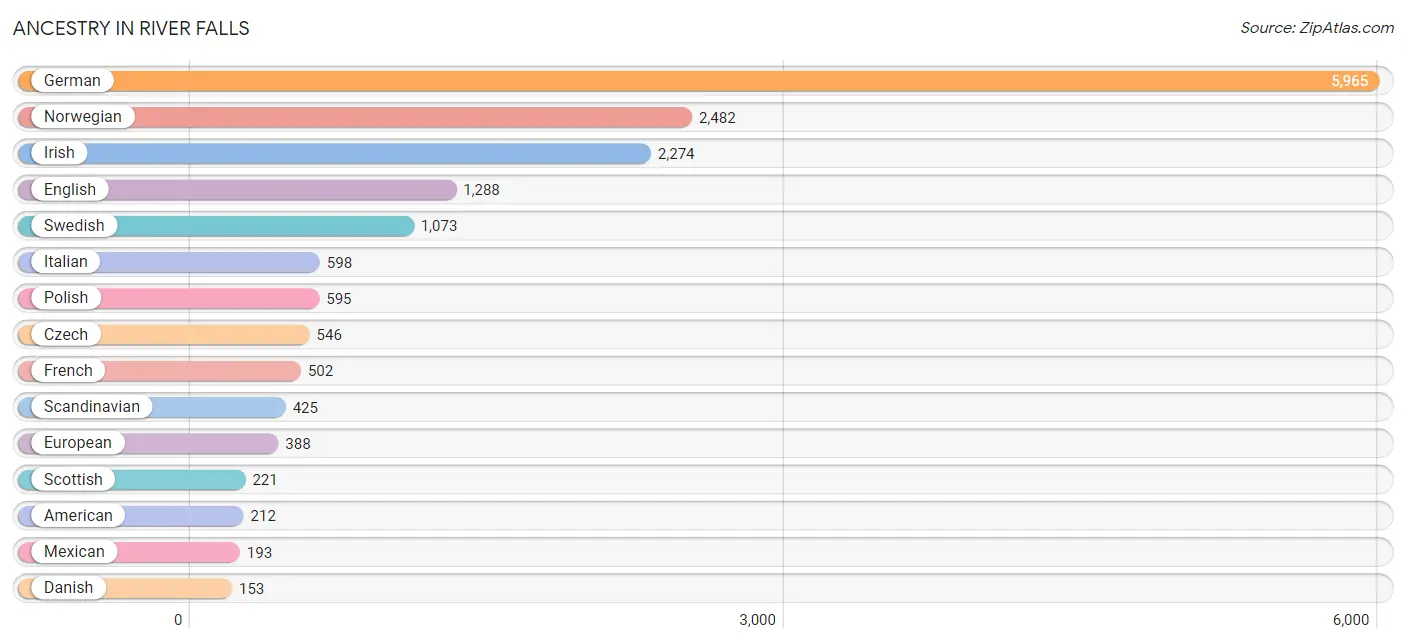
Ancestry in River Falls
The most populous ancestries reported in River Falls are German (5,965 | 36.9%), Norwegian (2,482 | 15.3%), Irish (2,274 | 14.1%), English (1,288 | 8.0%), and Swedish (1,073 | 6.6%), together accounting for 80.9% of all River Falls residents.
| Ancestry | # Population | % Population |
| American | 212 | 1.3% |
| Arab | 77 | 0.5% |
| Austrian | 105 | 0.6% |
| Bangladeshi | 150 | 0.9% |
| Belgian | 41 | 0.3% |
| Bhutanese | 45 | 0.3% |
| British | 107 | 0.7% |
| Burmese | 37 | 0.2% |
| Celtic | 20 | 0.1% |
| Central American | 37 | 0.2% |
| Cherokee | 6 | 0.0% |
| Chippewa | 31 | 0.2% |
| Colombian | 30 | 0.2% |
| Croatian | 23 | 0.1% |
| Czech | 546 | 3.4% |
| Czechoslovakian | 23 | 0.1% |
| Danish | 153 | 0.9% |
| Dutch | 151 | 0.9% |
| English | 1,288 | 8.0% |
| Ethiopian | 7 | 0.0% |
| European | 388 | 2.4% |
| Filipino | 40 | 0.3% |
| Finnish | 46 | 0.3% |
| French | 502 | 3.1% |
| French Canadian | 70 | 0.4% |
| German | 5,965 | 36.9% |
| Guatemalan | 16 | 0.1% |
| Hungarian | 15 | 0.1% |
| Icelander | 9 | 0.1% |
| Indian (Asian) | 32 | 0.2% |
| Indonesian | 7 | 0.0% |
| Iranian | 19 | 0.1% |
| Irish | 2,274 | 14.1% |
| Israeli | 15 | 0.1% |
| Italian | 598 | 3.7% |
| Jamaican | 15 | 0.1% |
| Kenyan | 13 | 0.1% |
| Korean | 10 | 0.1% |
| Lithuanian | 9 | 0.1% |
| Luxembourger | 9 | 0.1% |
| Malaysian | 3 | 0.0% |
| Mexican | 193 | 1.2% |
| Mongolian | 16 | 0.1% |
| Nicaraguan | 3 | 0.0% |
| Northern European | 29 | 0.2% |
| Norwegian | 2,482 | 15.3% |
| Palestinian | 25 | 0.2% |
| Pennsylvania German | 21 | 0.1% |
| Polish | 595 | 3.7% |
| Portuguese | 19 | 0.1% |
| Puerto Rican | 69 | 0.4% |
| Russian | 25 | 0.2% |
| Salvadoran | 18 | 0.1% |
| Scandinavian | 425 | 2.6% |
| Scotch-Irish | 44 | 0.3% |
| Scottish | 221 | 1.4% |
| Slavic | 29 | 0.2% |
| Slovak | 8 | 0.1% |
| Slovene | 14 | 0.1% |
| South American | 36 | 0.2% |
| Spaniard | 4 | 0.0% |
| Sri Lankan | 20 | 0.1% |
| Subsaharan African | 20 | 0.1% |
| Swedish | 1,073 | 6.6% |
| Swiss | 114 | 0.7% |
| Thai | 24 | 0.2% |
| Tongan | 10 | 0.1% |
| U.S. Virgin Islander | 26 | 0.2% |
| Ukrainian | 20 | 0.1% |
| Venezuelan | 6 | 0.0% |
| Welsh | 31 | 0.2% |
| Yugoslavian | 11 | 0.1% | View All 72 Rows |
Immigrants in River Falls
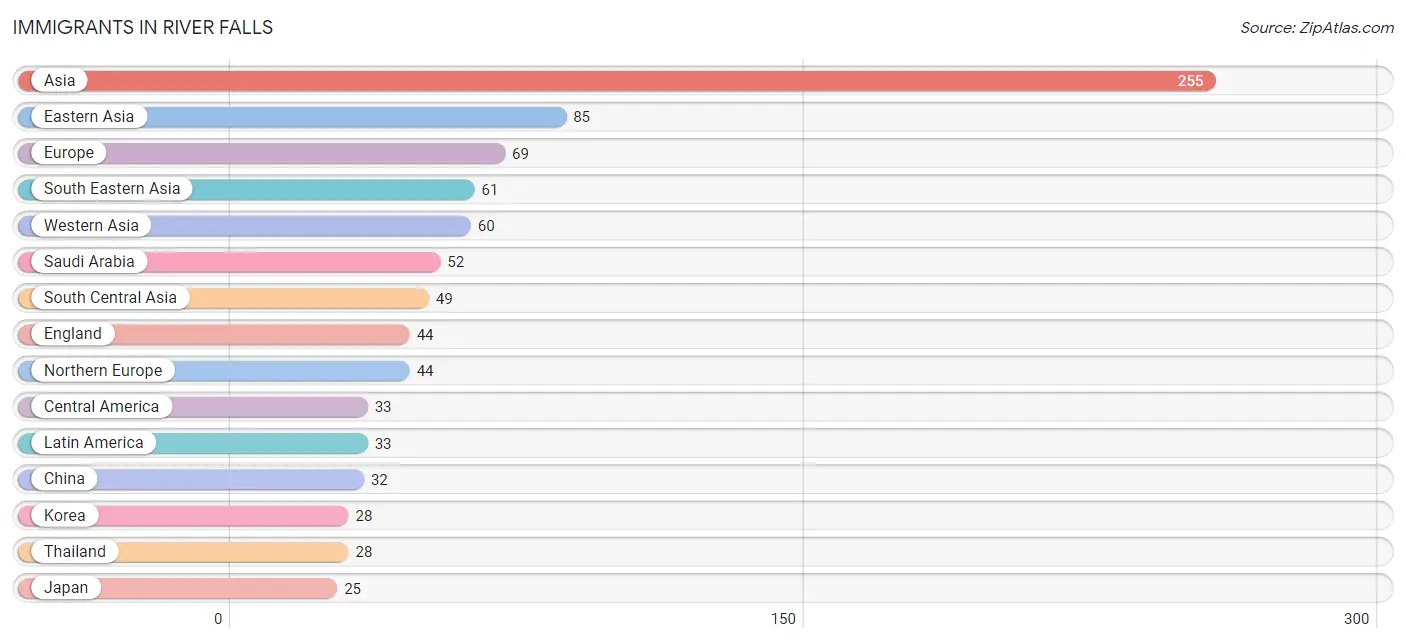
The most numerous immigrant groups reported in River Falls came from Asia (255 | 1.6%), Eastern Asia (85 | 0.5%), Europe (69 | 0.4%), South Eastern Asia (61 | 0.4%), and Western Asia (60 | 0.4%), together accounting for 3.3% of all River Falls residents.
| Immigration Origin | # Population | % Population |
| Africa | 20 | 0.1% |
| Asia | 255 | 1.6% |
| Canada | 6 | 0.0% |
| Central America | 33 | 0.2% |
| China | 32 | 0.2% |
| Eastern Africa | 20 | 0.1% |
| Eastern Asia | 85 | 0.5% |
| Eastern Europe | 13 | 0.1% |
| England | 44 | 0.3% |
| Ethiopia | 7 | 0.0% |
| Europe | 69 | 0.4% |
| Germany | 12 | 0.1% |
| Guatemala | 11 | 0.1% |
| India | 11 | 0.1% |
| Iran | 19 | 0.1% |
| Israel | 8 | 0.1% |
| Japan | 25 | 0.2% |
| Kenya | 13 | 0.1% |
| Korea | 28 | 0.2% |
| Laos | 7 | 0.0% |
| Latin America | 33 | 0.2% |
| Malaysia | 16 | 0.1% |
| Mexico | 22 | 0.1% |
| Northern Europe | 44 | 0.3% |
| Oceania | 2 | 0.0% |
| Pakistan | 19 | 0.1% |
| Philippines | 10 | 0.1% |
| Poland | 13 | 0.1% |
| Saudi Arabia | 52 | 0.3% |
| South Central Asia | 49 | 0.3% |
| South Eastern Asia | 61 | 0.4% |
| Thailand | 28 | 0.2% |
| Western Asia | 60 | 0.4% |
| Western Europe | 12 | 0.1% | View All 34 Rows |
Sex and Age in River Falls
Sex and Age in River Falls
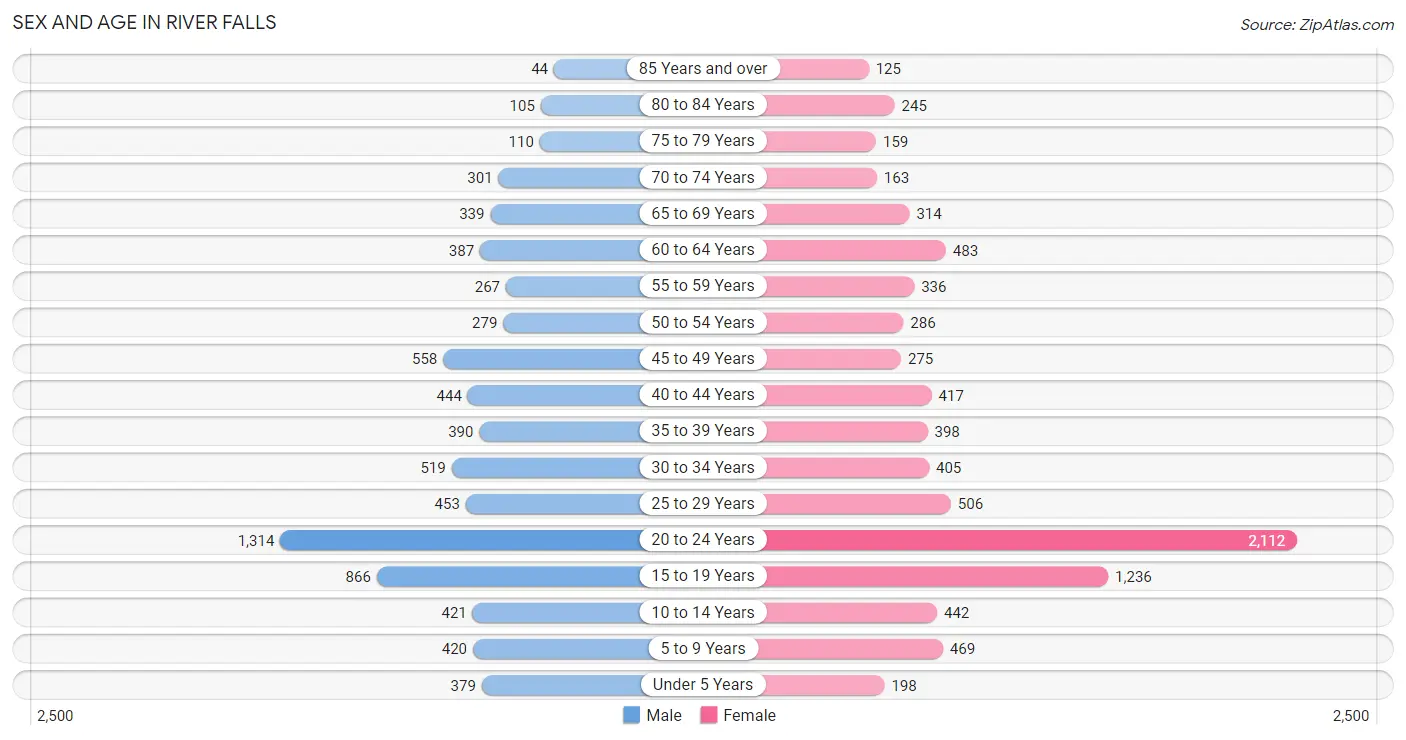
The most populous age groups in River Falls are 20 to 24 Years (1,314 | 17.3%) for men and 20 to 24 Years (2,112 | 24.6%) for women.
| Age Bracket | Male | Female |
| Under 5 Years | 379 (5.0%) | 198 (2.3%) |
| 5 to 9 Years | 420 (5.5%) | 469 (5.5%) |
| 10 to 14 Years | 421 (5.5%) | 442 (5.2%) |
| 15 to 19 Years | 866 (11.4%) | 1,236 (14.4%) |
| 20 to 24 Years | 1,314 (17.3%) | 2,112 (24.6%) |
| 25 to 29 Years | 453 (6.0%) | 506 (5.9%) |
| 30 to 34 Years | 519 (6.8%) | 405 (4.7%) |
| 35 to 39 Years | 390 (5.1%) | 398 (4.6%) |
| 40 to 44 Years | 444 (5.9%) | 417 (4.9%) |
| 45 to 49 Years | 558 (7.3%) | 275 (3.2%) |
| 50 to 54 Years | 279 (3.7%) | 286 (3.3%) |
| 55 to 59 Years | 267 (3.5%) | 336 (3.9%) |
| 60 to 64 Years | 387 (5.1%) | 483 (5.6%) |
| 65 to 69 Years | 339 (4.5%) | 314 (3.7%) |
| 70 to 74 Years | 301 (4.0%) | 163 (1.9%) |
| 75 to 79 Years | 110 (1.5%) | 159 (1.9%) |
| 80 to 84 Years | 105 (1.4%) | 245 (2.9%) |
| 85 Years and over | 44 (0.6%) | 125 (1.5%) |
| Total | 7,596 (100.0%) | 8,569 (100.0%) |
Families and Households in River Falls
Median Family Size in River Falls
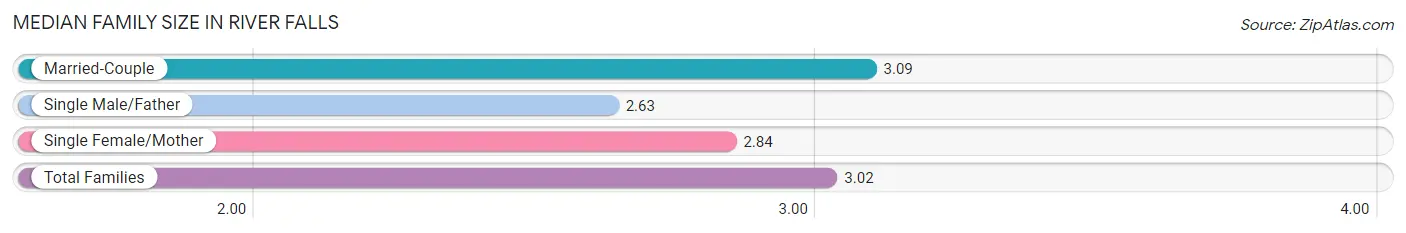
The median family size in River Falls is 3.02 persons per family, with married-couple families (2,350 | 76.9%) accounting for the largest median family size of 3.09 persons per family. On the other hand, single male/father families (235 | 7.7%) represent the smallest median family size with 2.63 persons per family.
| Family Type | # Families | Family Size |
| Married-Couple | 2,350 (76.9%) | 3.09 |
| Single Male/Father | 235 (7.7%) | 2.63 |
| Single Female/Mother | 471 (15.4%) | 2.84 |
| Total Families | 3,056 (100.0%) | 3.02 |
Median Household Size in River Falls
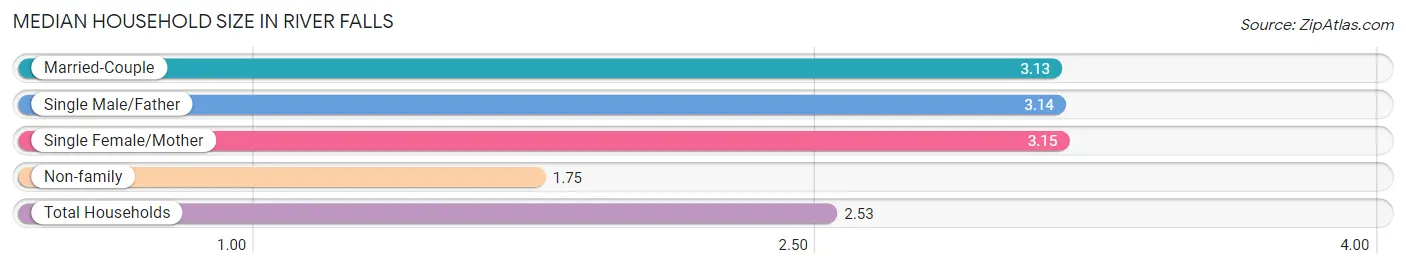
The median household size in River Falls is 2.53 persons per household, with single female/mother households (471 | 8.7%) accounting for the largest median household size of 3.15 persons per household. non-family households (2,360 | 43.6%) represent the smallest median household size with 1.75 persons per household.
| Household Type | # Households | Household Size |
| Married-Couple | 2,350 (43.4%) | 3.13 |
| Single Male/Father | 235 (4.3%) | 3.14 |
| Single Female/Mother | 471 (8.7%) | 3.15 |
| Non-family | 2,360 (43.6%) | 1.75 |
| Total Households | 5,416 (100.0%) | 2.53 |
Household Size by Marriage Status in River Falls
Out of a total of 5,416 households in River Falls, 3,056 (56.4%) are family households, while 2,360 (43.6%) are nonfamily households. The most numerous type of family households are 2-person households, comprising 1,213, and the most common type of nonfamily households are 1-person households, comprising 1,654.
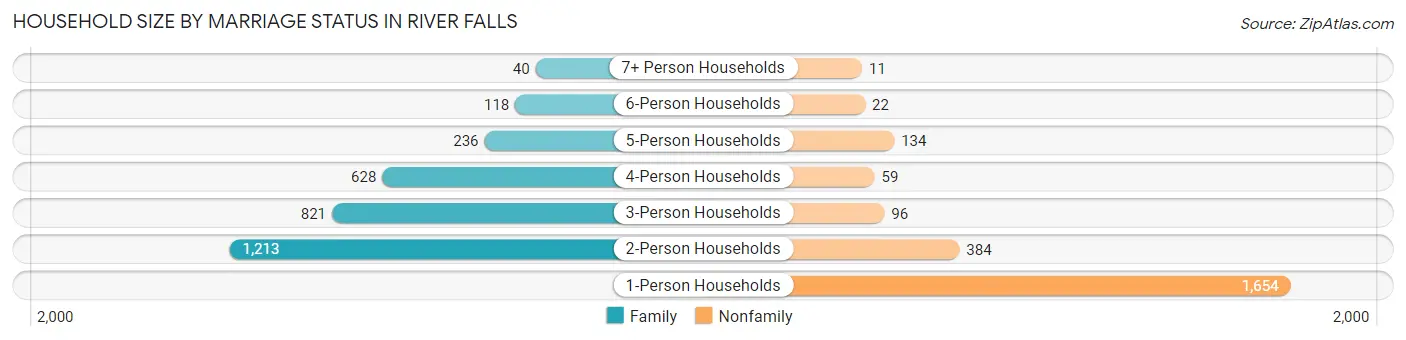
| Household Size | Family Households | Nonfamily Households |
| 1-Person Households | - | 1,654 (30.5%) |
| 2-Person Households | 1,213 (22.4%) | 384 (7.1%) |
| 3-Person Households | 821 (15.2%) | 96 (1.8%) |
| 4-Person Households | 628 (11.6%) | 59 (1.1%) |
| 5-Person Households | 236 (4.4%) | 134 (2.5%) |
| 6-Person Households | 118 (2.2%) | 22 (0.4%) |
| 7+ Person Households | 40 (0.7%) | 11 (0.2%) |
| Total | 3,056 (56.4%) | 2,360 (43.6%) |
Female Fertility in River Falls
Fertility by Age in River Falls
Average fertility rate in River Falls is 25.0 births per 1,000 women. Women in the age bracket of 35 to 50 years have the highest fertility rate with 71.0 births per 1,000 women. Women in the age bracket of 35 to 50 years acount for 58.1% of all women with births.
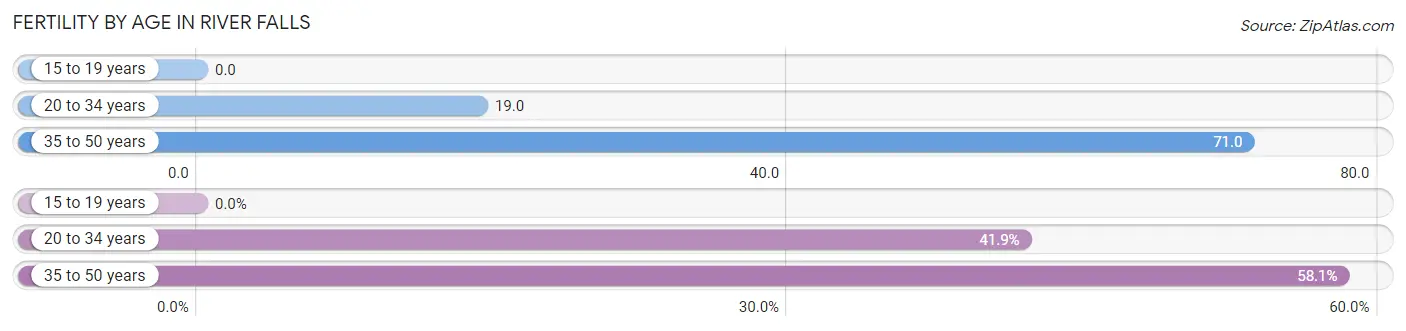
| Age Bracket | Women with Births | Births / 1,000 Women |
| 15 to 19 years | 0 (0.0%) | 0.0 |
| 20 to 34 years | 57 (41.9%) | 19.0 |
| 35 to 50 years | 79 (58.1%) | 71.0 |
| Total | 136 (100.0%) | 25.0 |
Fertility by Age by Marriage Status in River Falls
94.9% of women with births (136) in River Falls are married. The highest percentage of unmarried women with births falls into 20 to 34 years age bracket with 12.3% of them unmarried at the time of birth, while the lowest percentage of unmarried women with births belong to 35 to 50 years age bracket with 0.0% of them unmarried.
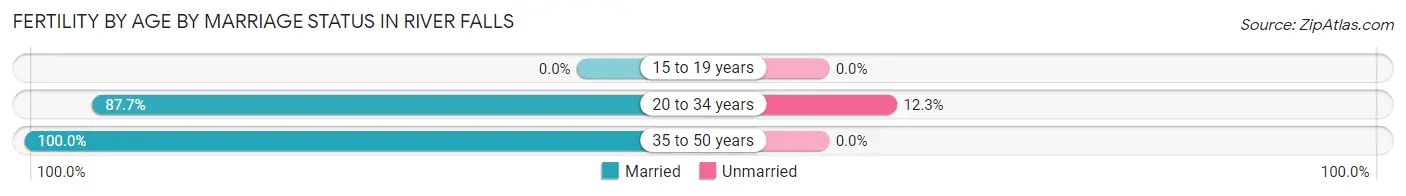
| Age Bracket | Married | Unmarried |
| 15 to 19 years | 0 (0.0%) | 0 (0.0%) |
| 20 to 34 years | 50 (87.7%) | 7 (12.3%) |
| 35 to 50 years | 79 (100.0%) | 0 (0.0%) |
| Total | 129 (94.9%) | 7 (5.1%) |
Fertility by Education in River Falls
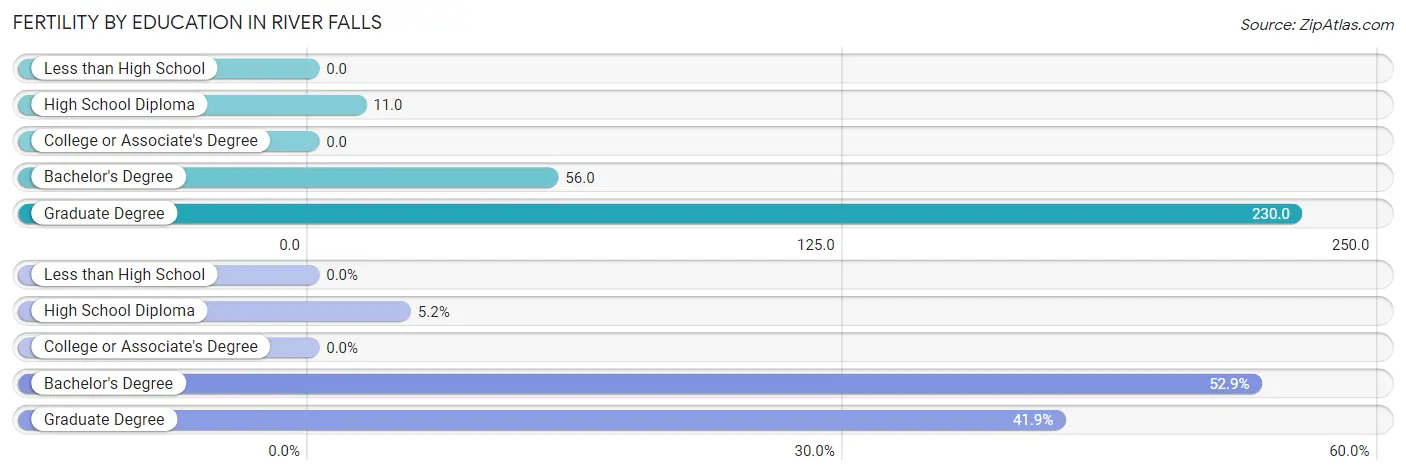
| Educational Attainment | Women with Births | Births / 1,000 Women |
| Less than High School | 0 (0.0%) | 0.0 |
| High School Diploma | 7 (5.1%) | 11.0 |
| College or Associate's Degree | 0 (0.0%) | 0.0 |
| Bachelor's Degree | 72 (52.9%) | 56.0 |
| Graduate Degree | 57 (41.9%) | 230.0 |
| Total | 136 (100.0%) | 25.0 |
Fertility by Education by Marriage Status in River Falls
5.1% of women with births in River Falls are unmarried. Women with the educational attainment of bachelor's degree are most likely to be married with 100.0% of them married at childbirth, while women with the educational attainment of high school diploma are least likely to be married with 100.0% of them unmarried at childbirth.
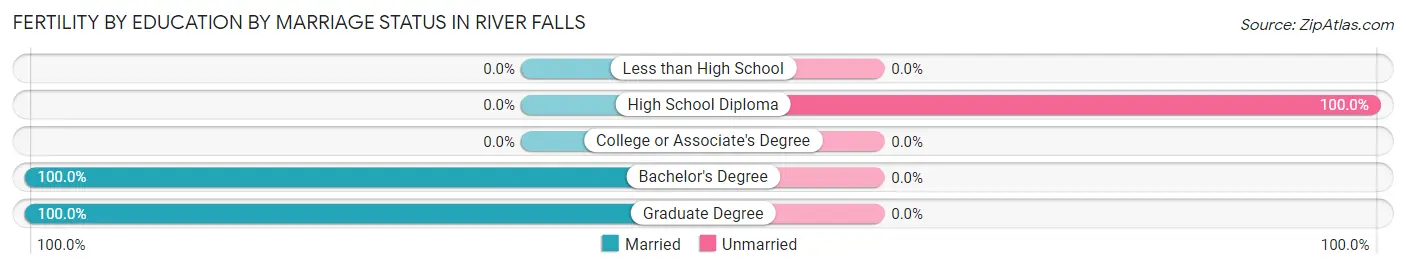
| Educational Attainment | Married | Unmarried |
| Less than High School | 0 (0.0%) | 0 (0.0%) |
| High School Diploma | 0 (0.0%) | 7 (100.0%) |
| College or Associate's Degree | 0 (0.0%) | 0 (0.0%) |
| Bachelor's Degree | 72 (100.0%) | 0 (0.0%) |
| Graduate Degree | 57 (100.0%) | 0 (0.0%) |
| Total | 129 (94.9%) | 7 (5.1%) |
Employment Characteristics in River Falls
Employment by Class of Employer in River Falls
Among the 8,884 employed individuals in River Falls, private company employees (5,903 | 66.4%), not-for-profit organizations (1,030 | 11.6%), and state government employees (665 | 7.5%) make up the most common classes of employment.
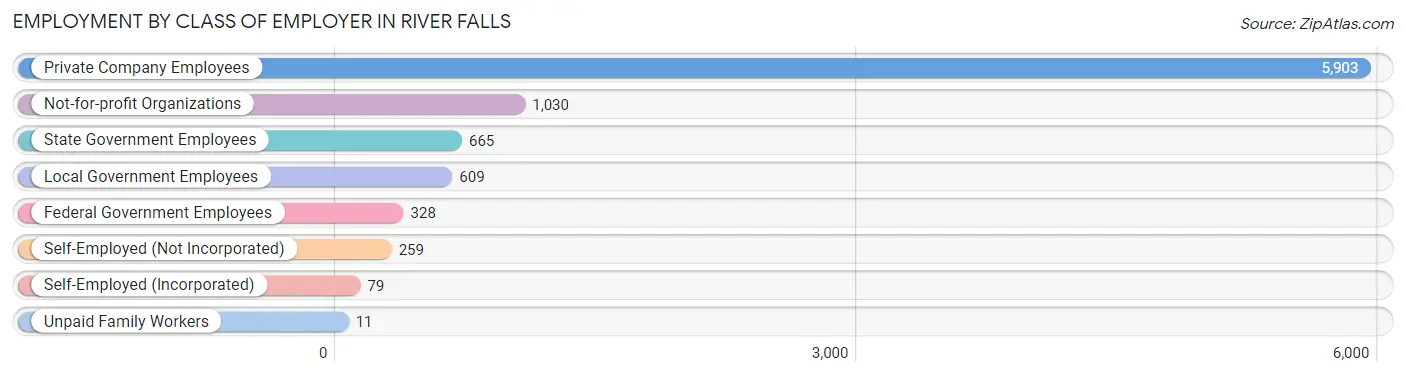
| Employer Class | # Employees | % Employees |
| Private Company Employees | 5,903 | 66.4% |
| Self-Employed (Incorporated) | 79 | 0.9% |
| Self-Employed (Not Incorporated) | 259 | 2.9% |
| Not-for-profit Organizations | 1,030 | 11.6% |
| Local Government Employees | 609 | 6.9% |
| State Government Employees | 665 | 7.5% |
| Federal Government Employees | 328 | 3.7% |
| Unpaid Family Workers | 11 | 0.1% |
| Total | 8,884 | 100.0% |
Employment Status by Age in River Falls
According to the labor force statistics for River Falls, out of the total population over 16 years of age (13,681), 69.2% or 9,467 individuals are in the labor force, with 3.3% or 312 of them unemployed. The age group with the highest labor force participation rate is 35 to 44 years, with 94.2% or 1,553 individuals in the labor force. Within the labor force, the 20 to 24 years age range has the highest percentage of unemployed individuals, with 7.0% or 192 of them being unemployed.
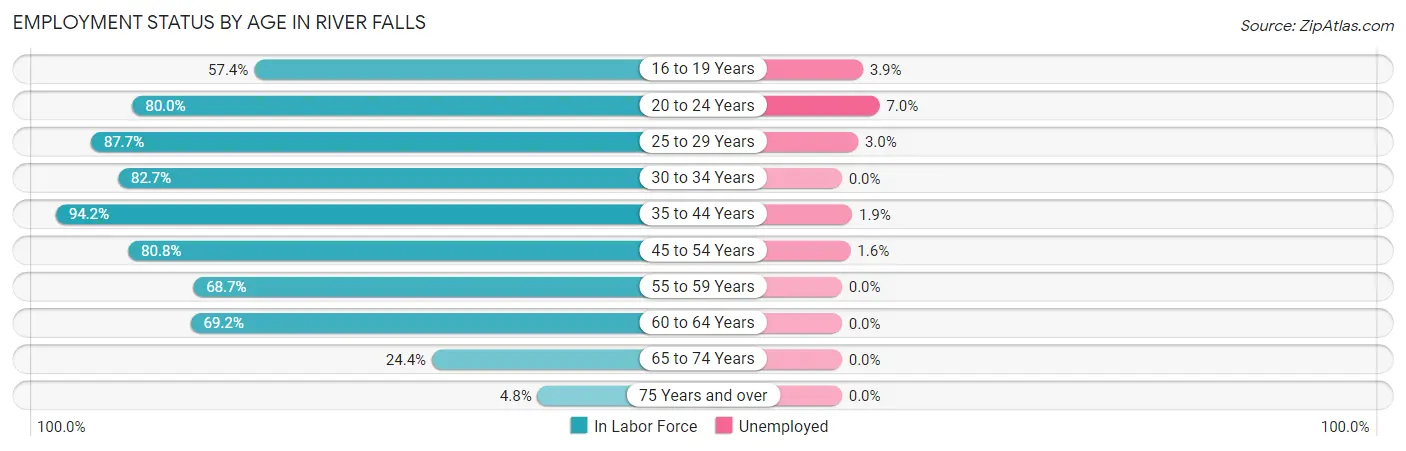
| Age Bracket | In Labor Force | Unemployed |
| 16 to 19 Years | 1,118 (57.4%) | 44 (3.9%) |
| 20 to 24 Years | 2,741 (80.0%) | 192 (7.0%) |
| 25 to 29 Years | 841 (87.7%) | 25 (3.0%) |
| 30 to 34 Years | 764 (82.7%) | 0 (0.0%) |
| 35 to 44 Years | 1,553 (94.2%) | 30 (1.9%) |
| 45 to 54 Years | 1,130 (80.8%) | 18 (1.6%) |
| 55 to 59 Years | 414 (68.7%) | 0 (0.0%) |
| 60 to 64 Years | 602 (69.2%) | 0 (0.0%) |
| 65 to 74 Years | 273 (24.4%) | 0 (0.0%) |
| 75 Years and over | 38 (4.8%) | 0 (0.0%) |
| Total | 9,467 (69.2%) | 312 (3.3%) |
Employment Status by Educational Attainment in River Falls
According to labor force statistics for River Falls, 82.9% of individuals (5,308) out of the total population between 25 and 64 years of age (6,403) are in the labor force, with 1.4% or 74 of them being unemployed. The group with the highest labor force participation rate are those with the educational attainment of bachelor's degree or higher, with 92.4% or 2,605 individuals in the labor force. Within the labor force, individuals with college / associate degree education have the highest percentage of unemployment, with 2.6% or 43 of them being unemployed.
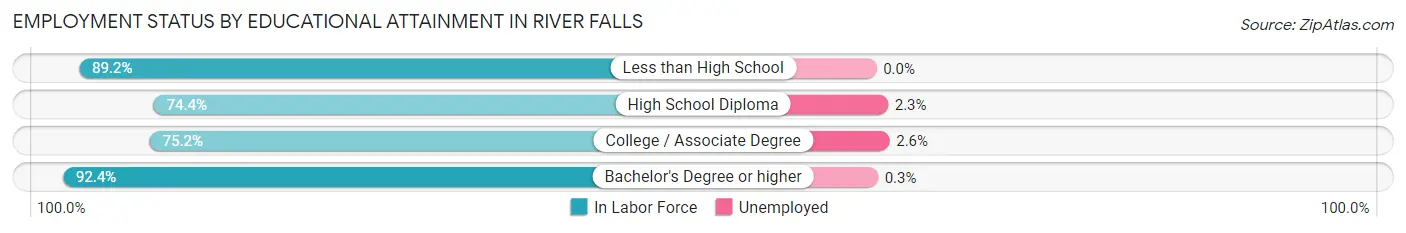
| Educational Attainment | In Labor Force | Unemployed |
| Less than High School | 99 (89.2%) | 0 (0.0%) |
| High School Diploma | 946 (74.4%) | 29 (2.3%) |
| College / Associate Degree | 1,655 (75.2%) | 57 (2.6%) |
| Bachelor's Degree or higher | 2,605 (92.4%) | 8 (0.3%) |
| Total | 5,308 (82.9%) | 90 (1.4%) |
Employment Occupations by Sex in River Falls
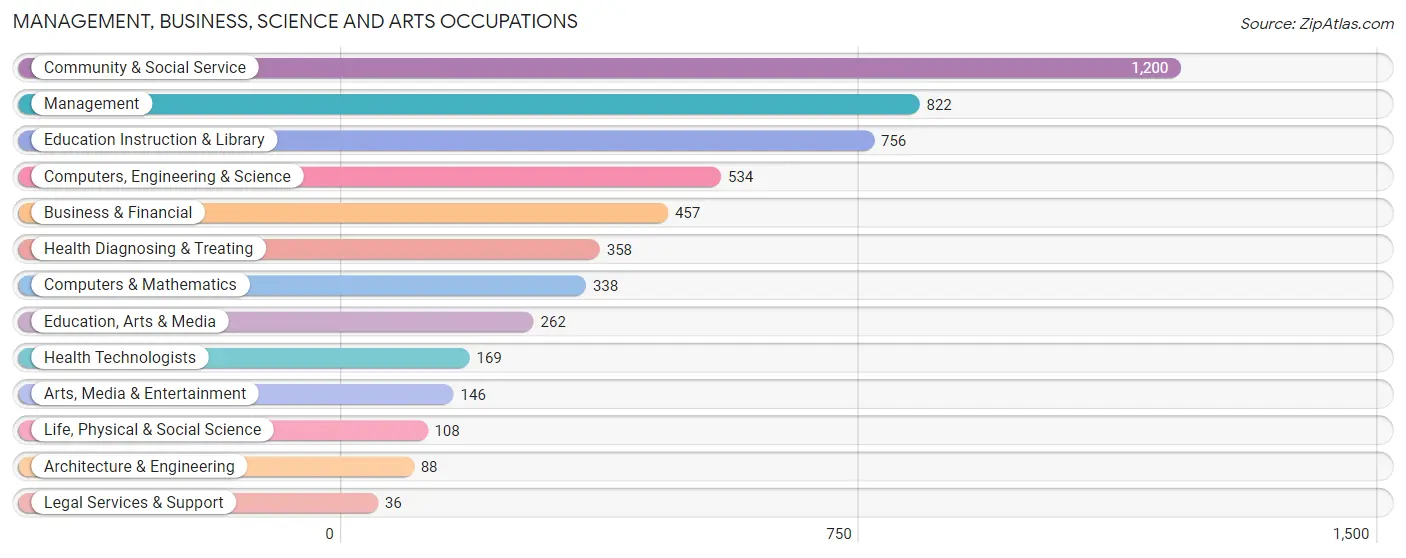
Management, Business, Science and Arts Occupations
The most common Management, Business, Science and Arts occupations in River Falls are Community & Social Service (1,200 | 13.1%), Management (822 | 9.0%), Education Instruction & Library (756 | 8.3%), Computers, Engineering & Science (534 | 5.8%), and Business & Financial (457 | 5.0%).
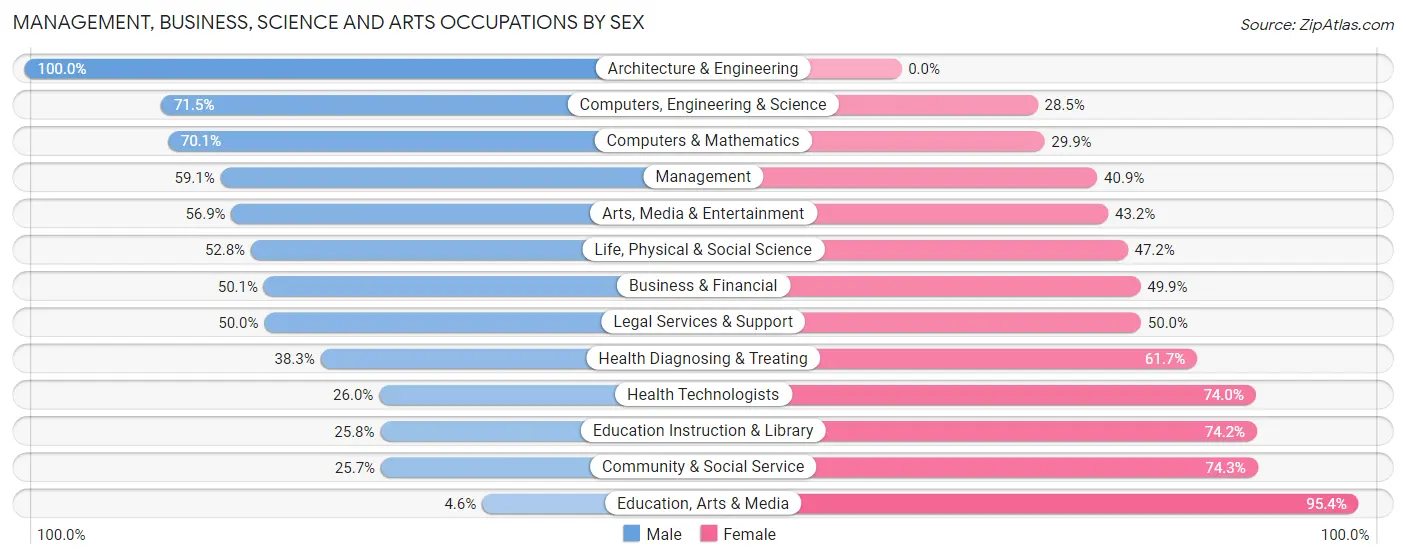
Management, Business, Science and Arts Occupations by Sex
Within the Management, Business, Science and Arts occupations in River Falls, the most male-oriented occupations are Architecture & Engineering (100.0%), Computers, Engineering & Science (71.5%), and Computers & Mathematics (70.1%), while the most female-oriented occupations are Education, Arts & Media (95.4%), Community & Social Service (74.3%), and Education Instruction & Library (74.2%).
| Occupation | Male | Female |
| Management | 486 (59.1%) | 336 (40.9%) |
| Business & Financial | 229 (50.1%) | 228 (49.9%) |
| Computers, Engineering & Science | 382 (71.5%) | 152 (28.5%) |
| Computers & Mathematics | 237 (70.1%) | 101 (29.9%) |
| Architecture & Engineering | 88 (100.0%) | 0 (0.0%) |
| Life, Physical & Social Science | 57 (52.8%) | 51 (47.2%) |
| Community & Social Service | 308 (25.7%) | 892 (74.3%) |
| Education, Arts & Media | 12 (4.6%) | 250 (95.4%) |
| Legal Services & Support | 18 (50.0%) | 18 (50.0%) |
| Education Instruction & Library | 195 (25.8%) | 561 (74.2%) |
| Arts, Media & Entertainment | 83 (56.9%) | 63 (43.1%) |
| Health Diagnosing & Treating | 137 (38.3%) | 221 (61.7%) |
| Health Technologists | 44 (26.0%) | 125 (74.0%) |
| Total (Category) | 1,542 (45.7%) | 1,829 (54.3%) |
| Total (Overall) | 4,235 (46.2%) | 4,929 (53.8%) |
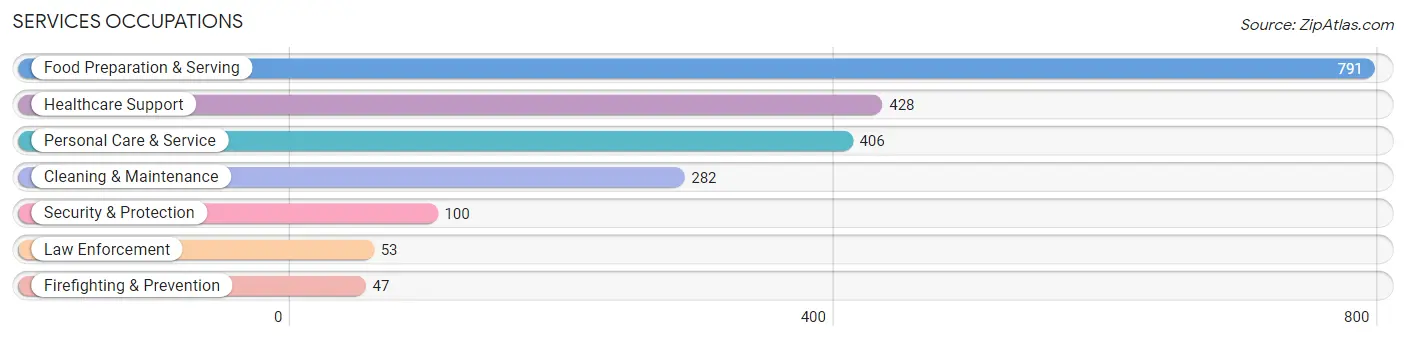
Services Occupations
The most common Services occupations in River Falls are Food Preparation & Serving (791 | 8.6%), Healthcare Support (428 | 4.7%), Personal Care & Service (406 | 4.4%), Cleaning & Maintenance (282 | 3.1%), and Security & Protection (100 | 1.1%).
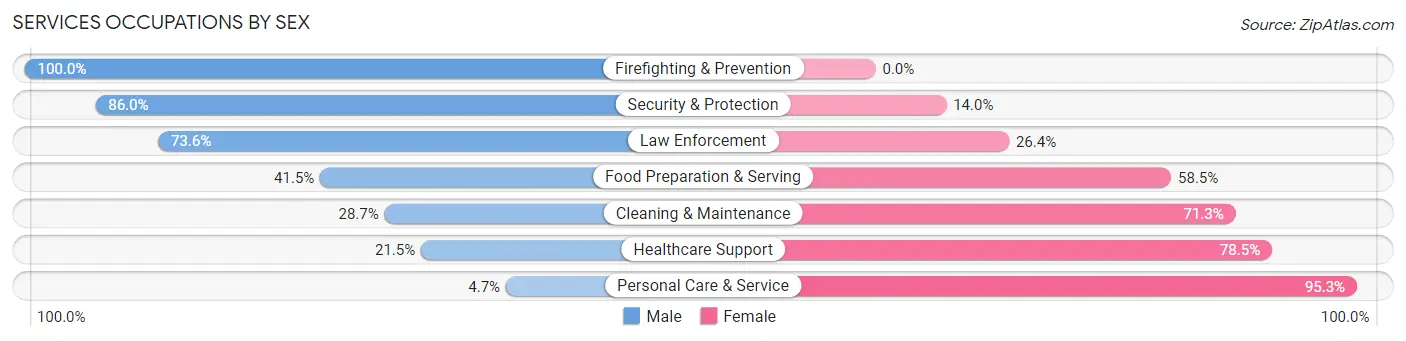
Services Occupations by Sex
Within the Services occupations in River Falls, the most male-oriented occupations are Firefighting & Prevention (100.0%), Security & Protection (86.0%), and Law Enforcement (73.6%), while the most female-oriented occupations are Personal Care & Service (95.3%), Healthcare Support (78.5%), and Cleaning & Maintenance (71.3%).
| Occupation | Male | Female |
| Healthcare Support | 92 (21.5%) | 336 (78.5%) |
| Security & Protection | 86 (86.0%) | 14 (14.0%) |
| Firefighting & Prevention | 47 (100.0%) | 0 (0.0%) |
| Law Enforcement | 39 (73.6%) | 14 (26.4%) |
| Food Preparation & Serving | 328 (41.5%) | 463 (58.5%) |
| Cleaning & Maintenance | 81 (28.7%) | 201 (71.3%) |
| Personal Care & Service | 19 (4.7%) | 387 (95.3%) |
| Total (Category) | 606 (30.2%) | 1,401 (69.8%) |
| Total (Overall) | 4,235 (46.2%) | 4,929 (53.8%) |
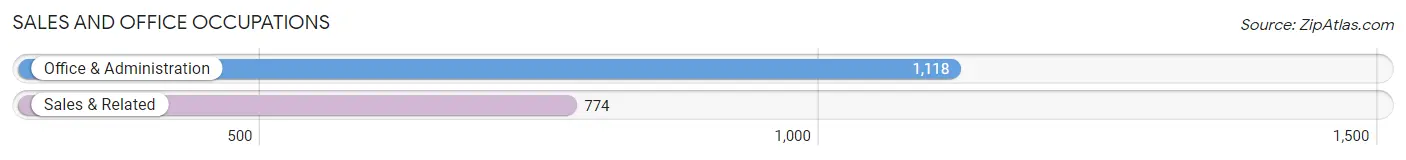
Sales and Office Occupations
The most common Sales and Office occupations in River Falls are Office & Administration (1,118 | 12.2%), and Sales & Related (774 | 8.5%).
Sales and Office Occupations by Sex
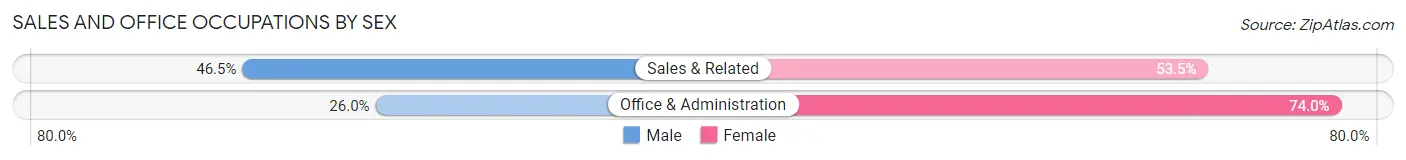
| Occupation | Male | Female |
| Sales & Related | 360 (46.5%) | 414 (53.5%) |
| Office & Administration | 291 (26.0%) | 827 (74.0%) |
| Total (Category) | 651 (34.4%) | 1,241 (65.6%) |
| Total (Overall) | 4,235 (46.2%) | 4,929 (53.8%) |
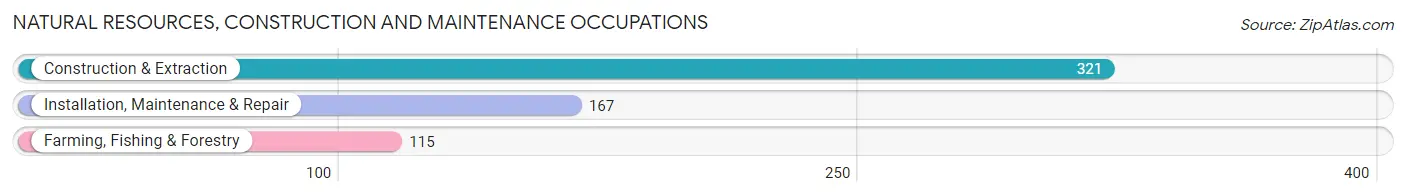
Natural Resources, Construction and Maintenance Occupations
The most common Natural Resources, Construction and Maintenance occupations in River Falls are Construction & Extraction (321 | 3.5%), Installation, Maintenance & Repair (167 | 1.8%), and Farming, Fishing & Forestry (115 | 1.3%).
Natural Resources, Construction and Maintenance Occupations by Sex
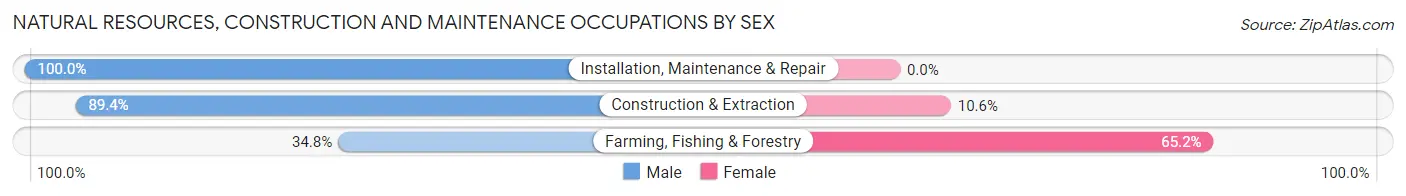
| Occupation | Male | Female |
| Farming, Fishing & Forestry | 40 (34.8%) | 75 (65.2%) |
| Construction & Extraction | 287 (89.4%) | 34 (10.6%) |
| Installation, Maintenance & Repair | 167 (100.0%) | 0 (0.0%) |
| Total (Category) | 494 (81.9%) | 109 (18.1%) |
| Total (Overall) | 4,235 (46.2%) | 4,929 (53.8%) |
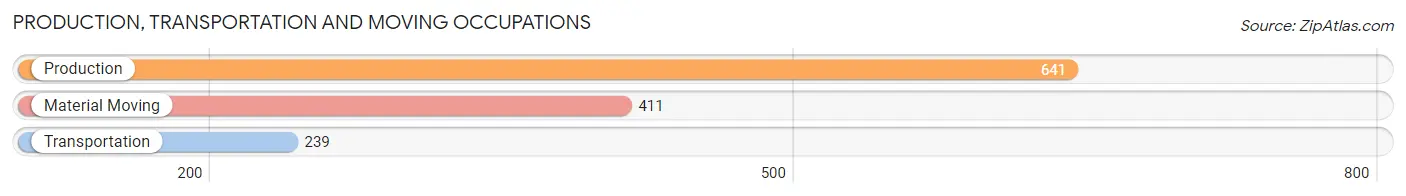
Production, Transportation and Moving Occupations
The most common Production, Transportation and Moving occupations in River Falls are Production (641 | 7.0%), Material Moving (411 | 4.5%), and Transportation (239 | 2.6%).
Production, Transportation and Moving Occupations by Sex
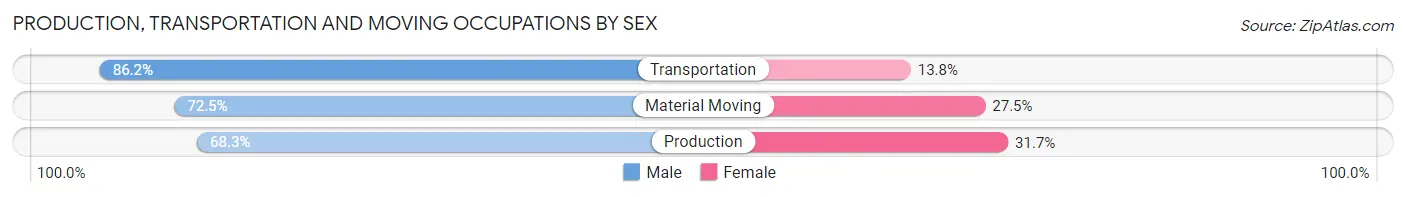
| Occupation | Male | Female |
| Production | 438 (68.3%) | 203 (31.7%) |
| Transportation | 206 (86.2%) | 33 (13.8%) |
| Material Moving | 298 (72.5%) | 113 (27.5%) |
| Total (Category) | 942 (73.0%) | 349 (27.0%) |
| Total (Overall) | 4,235 (46.2%) | 4,929 (53.8%) |
Employment Industries by Sex in River Falls
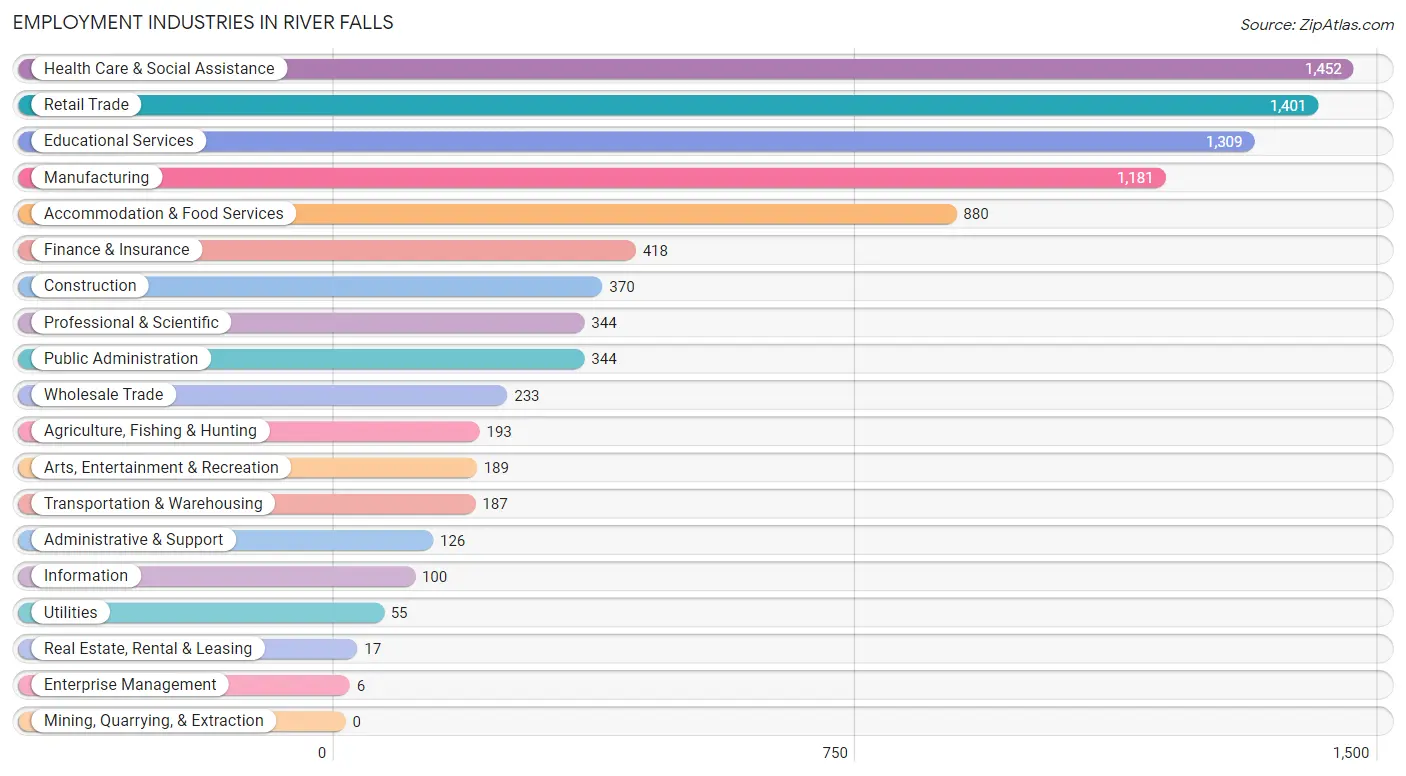
Employment Industries in River Falls
The major employment industries in River Falls include Health Care & Social Assistance (1,452 | 15.8%), Retail Trade (1,401 | 15.3%), Educational Services (1,309 | 14.3%), Manufacturing (1,181 | 12.9%), and Accommodation & Food Services (880 | 9.6%).
Employment Industries by Sex in River Falls
The River Falls industries that see more men than women are Transportation & Warehousing (92.5%), Construction (90.0%), and Utilities (85.5%), whereas the industries that tend to have a higher number of women are Enterprise Management (100.0%), Arts, Entertainment & Recreation (85.2%), and Health Care & Social Assistance (81.0%).
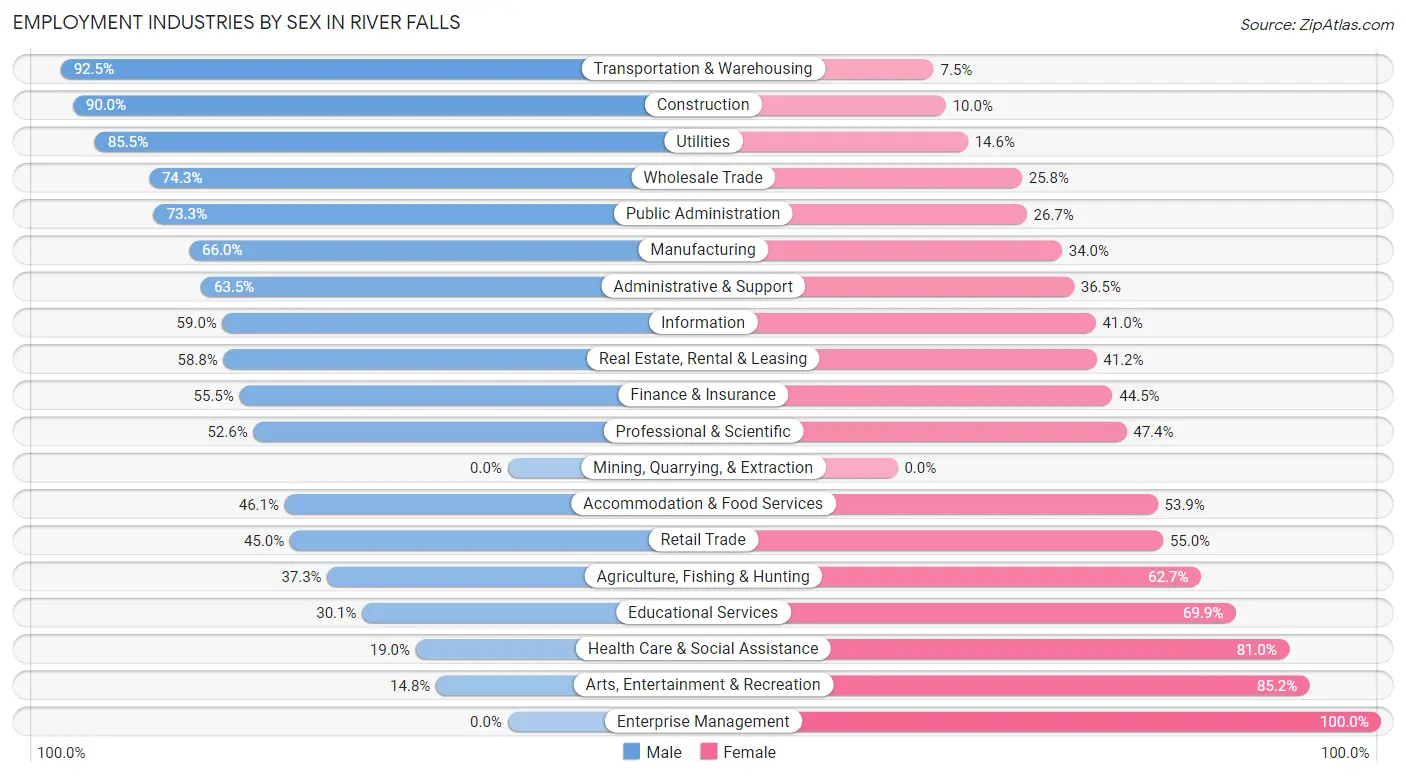
| Industry | Male | Female |
| Agriculture, Fishing & Hunting | 72 (37.3%) | 121 (62.7%) |
| Mining, Quarrying, & Extraction | 0 (0.0%) | 0 (0.0%) |
| Construction | 333 (90.0%) | 37 (10.0%) |
| Manufacturing | 779 (66.0%) | 402 (34.0%) |
| Wholesale Trade | 173 (74.3%) | 60 (25.8%) |
| Retail Trade | 631 (45.0%) | 770 (55.0%) |
| Transportation & Warehousing | 173 (92.5%) | 14 (7.5%) |
| Utilities | 47 (85.5%) | 8 (14.5%) |
| Information | 59 (59.0%) | 41 (41.0%) |
| Finance & Insurance | 232 (55.5%) | 186 (44.5%) |
| Real Estate, Rental & Leasing | 10 (58.8%) | 7 (41.2%) |
| Professional & Scientific | 181 (52.6%) | 163 (47.4%) |
| Enterprise Management | 0 (0.0%) | 6 (100.0%) |
| Administrative & Support | 80 (63.5%) | 46 (36.5%) |
| Educational Services | 394 (30.1%) | 915 (69.9%) |
| Health Care & Social Assistance | 276 (19.0%) | 1,176 (81.0%) |
| Arts, Entertainment & Recreation | 28 (14.8%) | 161 (85.2%) |
| Accommodation & Food Services | 406 (46.1%) | 474 (53.9%) |
| Public Administration | 252 (73.3%) | 92 (26.7%) |
| Total | 4,235 (46.2%) | 4,929 (53.8%) |
Education in River Falls
School Enrollment in River Falls
The most common levels of schooling among the 7,011 students in River Falls are college / undergraduate (4,451 | 63.5%), middle school (691 | 9.9%), and elementary school (600 | 8.6%).
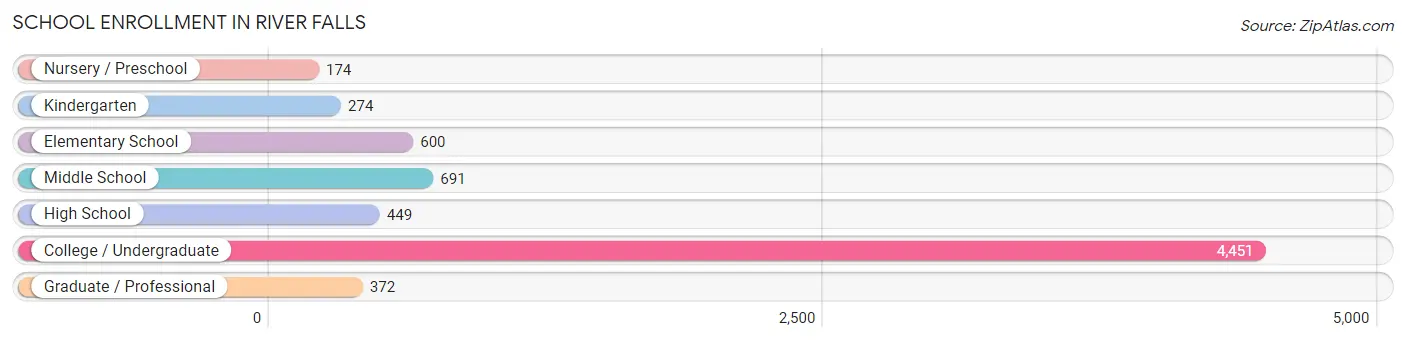
| School Level | # Students | % Students |
| Nursery / Preschool | 174 | 2.5% |
| Kindergarten | 274 | 3.9% |
| Elementary School | 600 | 8.6% |
| Middle School | 691 | 9.9% |
| High School | 449 | 6.4% |
| College / Undergraduate | 4,451 | 63.5% |
| Graduate / Professional | 372 | 5.3% |
| Total | 7,011 | 100.0% |
School Enrollment by Age by Funding Source in River Falls
Out of a total of 7,011 students who are enrolled in schools in River Falls, 442 (6.3%) attend a private institution, while the remaining 6,569 (93.7%) are enrolled in public schools. The age group of 35 years and over has the highest likelihood of being enrolled in private schools, with 86 (43.0% in the age bracket) enrolled. Conversely, the age group of 20 to 24 year olds has the lowest likelihood of being enrolled in a private school, with 2,627 (98.7% in the age bracket) attending a public institution.
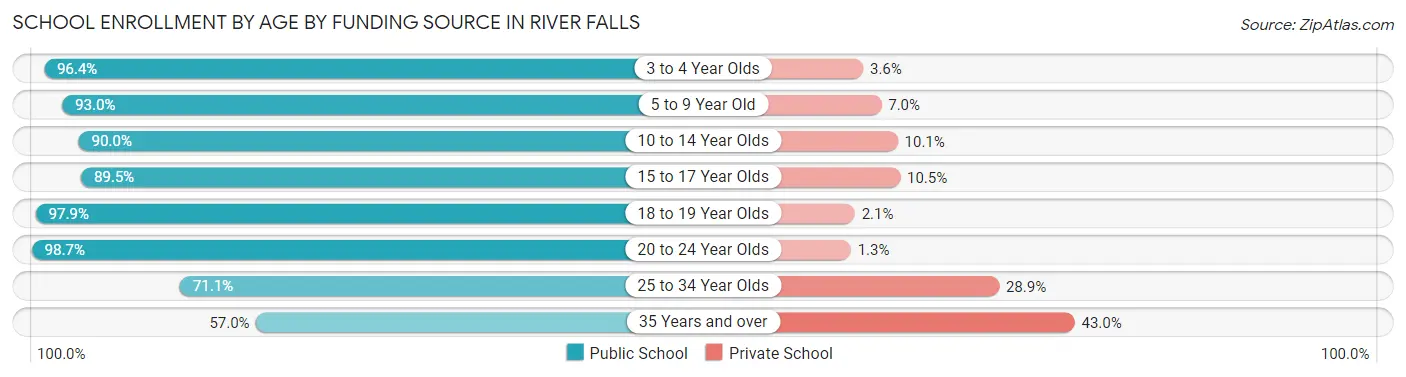
| Age Bracket | Public School | Private School |
| 3 to 4 Year Olds | 80 (96.4%) | 3 (3.6%) |
| 5 to 9 Year Old | 811 (93.0%) | 61 (7.0%) |
| 10 to 14 Year Olds | 752 (89.9%) | 84 (10.1%) |
| 15 to 17 Year Olds | 307 (89.5%) | 36 (10.5%) |
| 18 to 19 Year Olds | 1,618 (97.9%) | 34 (2.1%) |
| 20 to 24 Year Olds | 2,627 (98.7%) | 35 (1.3%) |
| 25 to 34 Year Olds | 258 (71.1%) | 105 (28.9%) |
| 35 Years and over | 114 (57.0%) | 86 (43.0%) |
| Total | 6,569 (93.7%) | 442 (6.3%) |
Educational Attainment by Field of Study in River Falls
Business (767 | 18.6%), education (514 | 12.5%), science & technology (501 | 12.1%), psychology (482 | 11.7%), and social sciences (384 | 9.3%) are the most common fields of study among 4,126 individuals in River Falls who have obtained a bachelor's degree or higher.
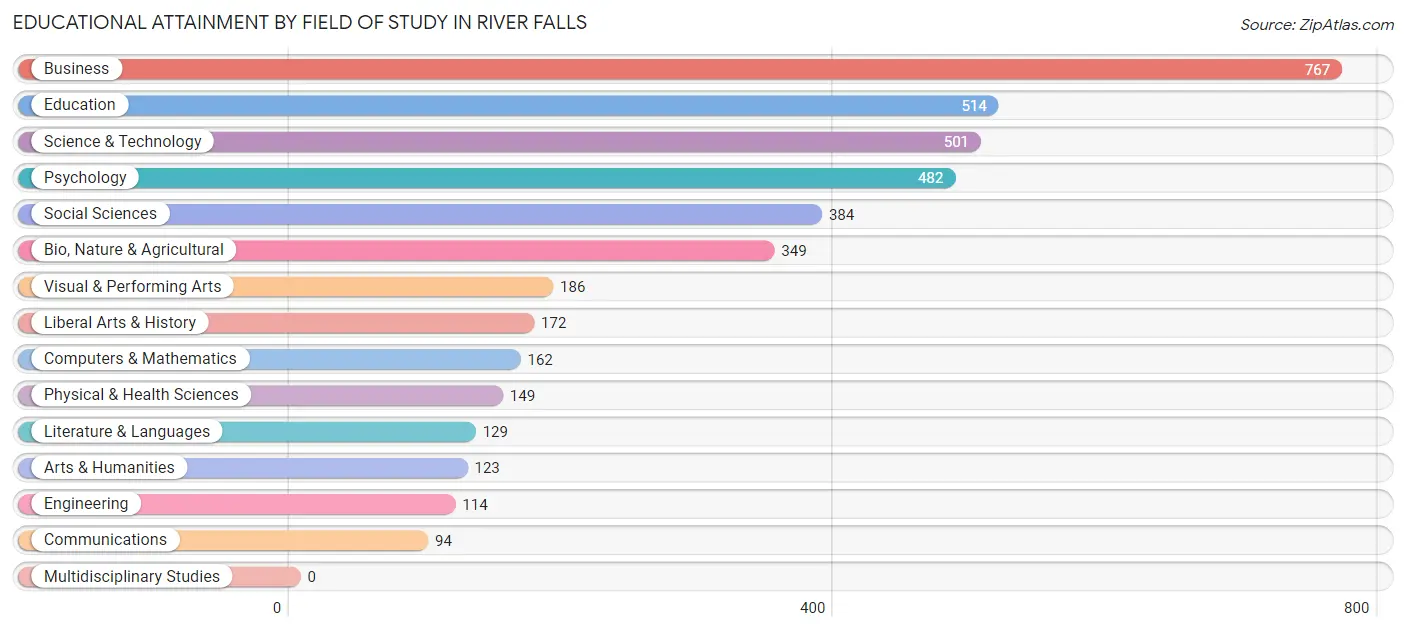
| Field of Study | # Graduates | % Graduates |
| Computers & Mathematics | 162 | 3.9% |
| Bio, Nature & Agricultural | 349 | 8.5% |
| Physical & Health Sciences | 149 | 3.6% |
| Psychology | 482 | 11.7% |
| Social Sciences | 384 | 9.3% |
| Engineering | 114 | 2.8% |
| Multidisciplinary Studies | 0 | 0.0% |
| Science & Technology | 501 | 12.1% |
| Business | 767 | 18.6% |
| Education | 514 | 12.5% |
| Literature & Languages | 129 | 3.1% |
| Liberal Arts & History | 172 | 4.2% |
| Visual & Performing Arts | 186 | 4.5% |
| Communications | 94 | 2.3% |
| Arts & Humanities | 123 | 3.0% |
| Total | 4,126 | 100.0% |
Transportation & Commute in River Falls
Vehicle Availability by Sex in River Falls
The most prevalent vehicle ownership categories in River Falls are males with 2 vehicles (1,806, accounting for 46.5%) and females with 2 vehicles (1,503, making up 46.8%).
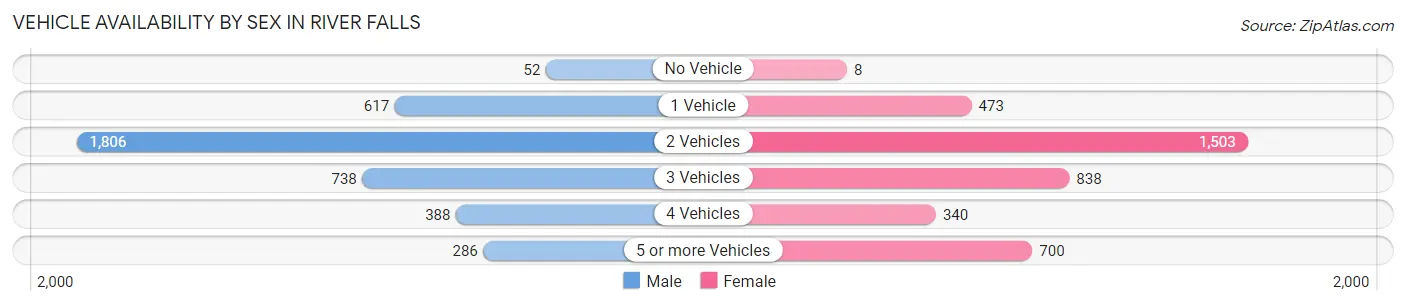
| Vehicles Available | Male | Female |
| No Vehicle | 52 (1.3%) | 8 (0.2%) |
| 1 Vehicle | 617 (15.9%) | 473 (12.2%) |
| 2 Vehicles | 1,806 (46.5%) | 1,503 (38.9%) |
| 3 Vehicles | 738 (19.0%) | 838 (21.7%) |
| 4 Vehicles | 388 (10.0%) | 340 (8.8%) |
| 5 or more Vehicles | 286 (7.4%) | 700 (18.1%) |
| Total | 3,887 (100.0%) | 3,862 (100.0%) |
Commute Time in River Falls
The most frequently occuring commute durations in River Falls are 5 to 9 minutes (1,771 commuters, 22.1%), 15 to 19 minutes (1,056 commuters, 13.2%), and 30 to 34 minutes (1,015 commuters, 12.6%).
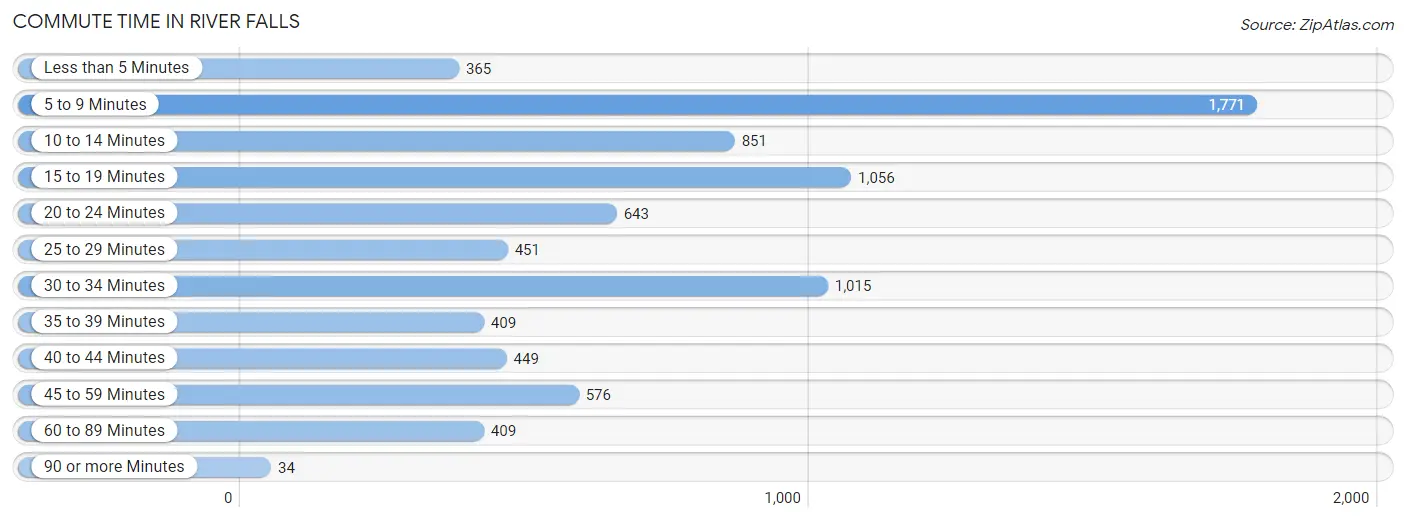
| Commute Time | # Commuters | % Commuters |
| Less than 5 Minutes | 365 | 4.5% |
| 5 to 9 Minutes | 1,771 | 22.1% |
| 10 to 14 Minutes | 851 | 10.6% |
| 15 to 19 Minutes | 1,056 | 13.2% |
| 20 to 24 Minutes | 643 | 8.0% |
| 25 to 29 Minutes | 451 | 5.6% |
| 30 to 34 Minutes | 1,015 | 12.6% |
| 35 to 39 Minutes | 409 | 5.1% |
| 40 to 44 Minutes | 449 | 5.6% |
| 45 to 59 Minutes | 576 | 7.2% |
| 60 to 89 Minutes | 409 | 5.1% |
| 90 or more Minutes | 34 | 0.4% |
Commute Time by Sex in River Falls
The most common commute times in River Falls are 5 to 9 minutes (682 commuters, 18.2%) for males and 5 to 9 minutes (1,089 commuters, 25.4%) for females.
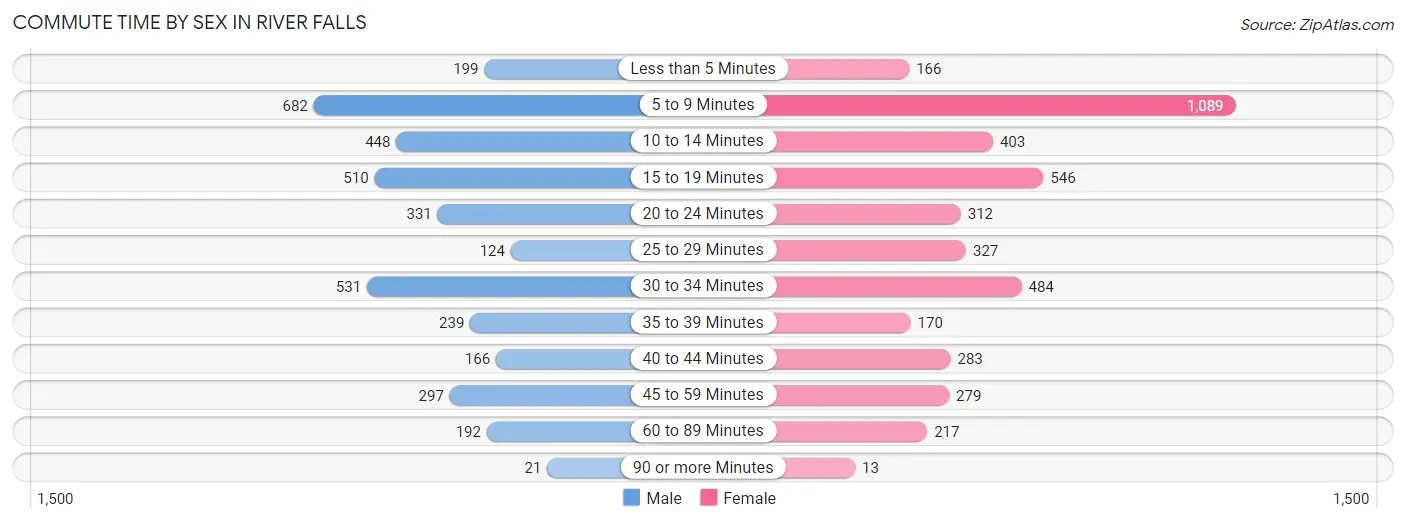
| Commute Time | Male | Female |
| Less than 5 Minutes | 199 (5.3%) | 166 (3.9%) |
| 5 to 9 Minutes | 682 (18.2%) | 1,089 (25.4%) |
| 10 to 14 Minutes | 448 (12.0%) | 403 (9.4%) |
| 15 to 19 Minutes | 510 (13.6%) | 546 (12.7%) |
| 20 to 24 Minutes | 331 (8.8%) | 312 (7.3%) |
| 25 to 29 Minutes | 124 (3.3%) | 327 (7.6%) |
| 30 to 34 Minutes | 531 (14.2%) | 484 (11.3%) |
| 35 to 39 Minutes | 239 (6.4%) | 170 (4.0%) |
| 40 to 44 Minutes | 166 (4.4%) | 283 (6.6%) |
| 45 to 59 Minutes | 297 (7.9%) | 279 (6.5%) |
| 60 to 89 Minutes | 192 (5.1%) | 217 (5.1%) |
| 90 or more Minutes | 21 (0.6%) | 13 (0.3%) |
Time of Departure to Work by Sex in River Falls
The most frequent times of departure to work in River Falls are 12:00 PM to 3:59 PM (645, 17.2%) for males and 6:30 AM to 6:59 AM (744, 17.3%) for females.
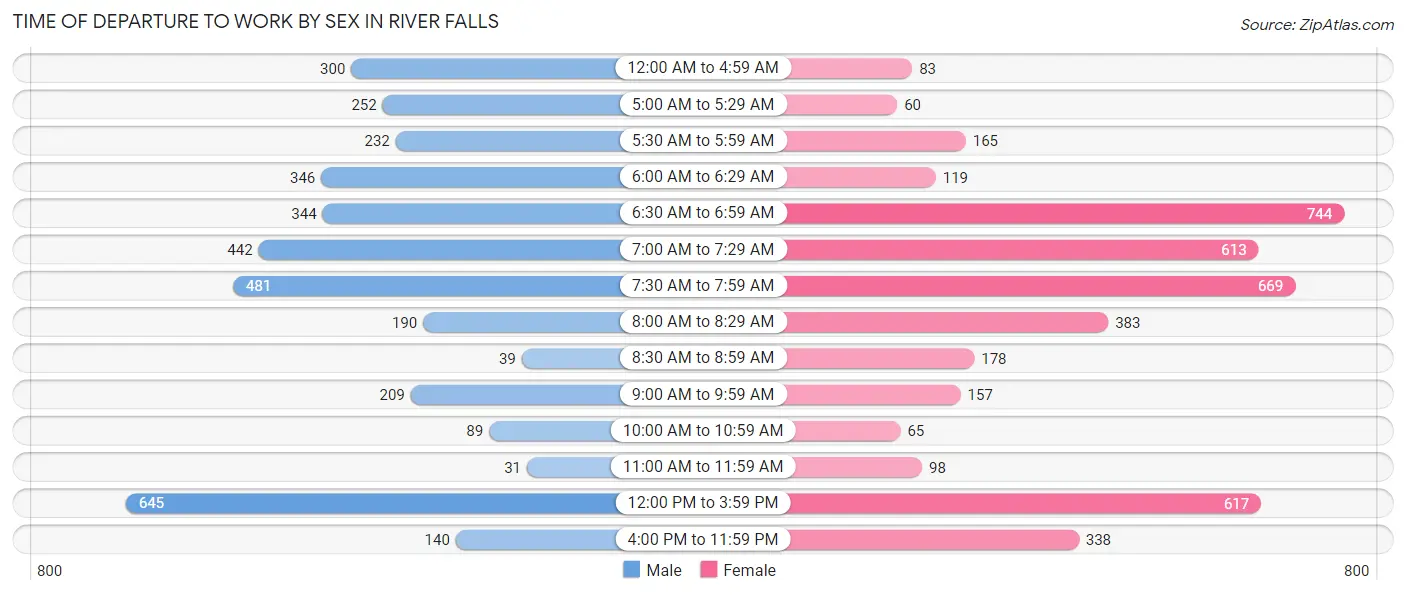
| Time of Departure | Male | Female |
| 12:00 AM to 4:59 AM | 300 (8.0%) | 83 (1.9%) |
| 5:00 AM to 5:29 AM | 252 (6.7%) | 60 (1.4%) |
| 5:30 AM to 5:59 AM | 232 (6.2%) | 165 (3.8%) |
| 6:00 AM to 6:29 AM | 346 (9.2%) | 119 (2.8%) |
| 6:30 AM to 6:59 AM | 344 (9.2%) | 744 (17.3%) |
| 7:00 AM to 7:29 AM | 442 (11.8%) | 613 (14.3%) |
| 7:30 AM to 7:59 AM | 481 (12.9%) | 669 (15.6%) |
| 8:00 AM to 8:29 AM | 190 (5.1%) | 383 (8.9%) |
| 8:30 AM to 8:59 AM | 39 (1.0%) | 178 (4.2%) |
| 9:00 AM to 9:59 AM | 209 (5.6%) | 157 (3.7%) |
| 10:00 AM to 10:59 AM | 89 (2.4%) | 65 (1.5%) |
| 11:00 AM to 11:59 AM | 31 (0.8%) | 98 (2.3%) |
| 12:00 PM to 3:59 PM | 645 (17.2%) | 617 (14.4%) |
| 4:00 PM to 11:59 PM | 140 (3.7%) | 338 (7.9%) |
| Total | 3,740 (100.0%) | 4,289 (100.0%) |
Housing Occupancy in River Falls
Occupancy by Ownership in River Falls
Of the total 5,416 dwellings in River Falls, owner-occupied units account for 3,085 (57.0%), while renter-occupied units make up 2,331 (43.0%).
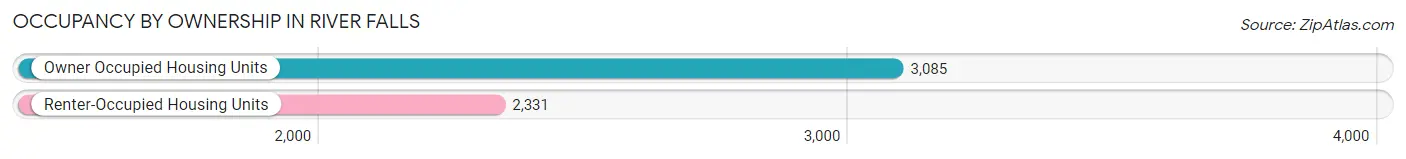
| Occupancy | # Housing Units | % Housing Units |
| Owner Occupied Housing Units | 3,085 | 57.0% |
| Renter-Occupied Housing Units | 2,331 | 43.0% |
| Total Occupied Housing Units | 5,416 | 100.0% |
Occupancy by Household Size in River Falls
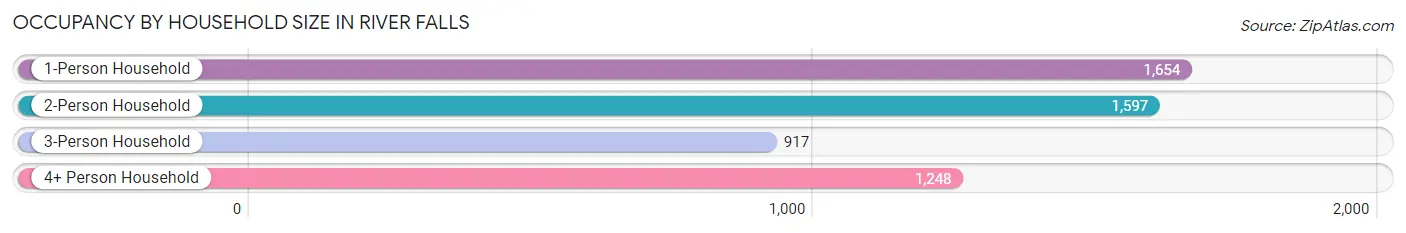
| Household Size | # Housing Units | % Housing Units |
| 1-Person Household | 1,654 | 30.5% |
| 2-Person Household | 1,597 | 29.5% |
| 3-Person Household | 917 | 16.9% |
| 4+ Person Household | 1,248 | 23.0% |
| Total Housing Units | 5,416 | 100.0% |
Occupancy by Ownership by Household Size in River Falls
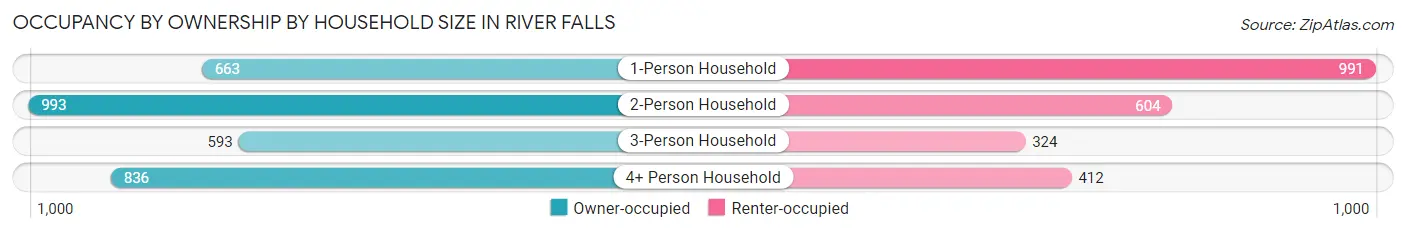
| Household Size | Owner-occupied | Renter-occupied |
| 1-Person Household | 663 (40.1%) | 991 (59.9%) |
| 2-Person Household | 993 (62.2%) | 604 (37.8%) |
| 3-Person Household | 593 (64.7%) | 324 (35.3%) |
| 4+ Person Household | 836 (67.0%) | 412 (33.0%) |
| Total Housing Units | 3,085 (57.0%) | 2,331 (43.0%) |
Occupancy by Educational Attainment in River Falls
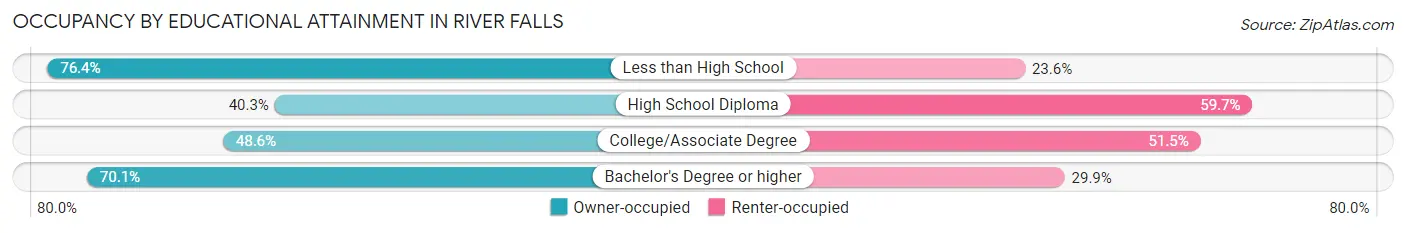
| Household Size | Owner-occupied | Renter-occupied |
| Less than High School | 68 (76.4%) | 21 (23.6%) |
| High School Diploma | 367 (40.3%) | 543 (59.7%) |
| College/Associate Degree | 1,006 (48.5%) | 1,066 (51.4%) |
| Bachelor's Degree or higher | 1,644 (70.1%) | 701 (29.9%) |
Occupancy by Age of Householder in River Falls
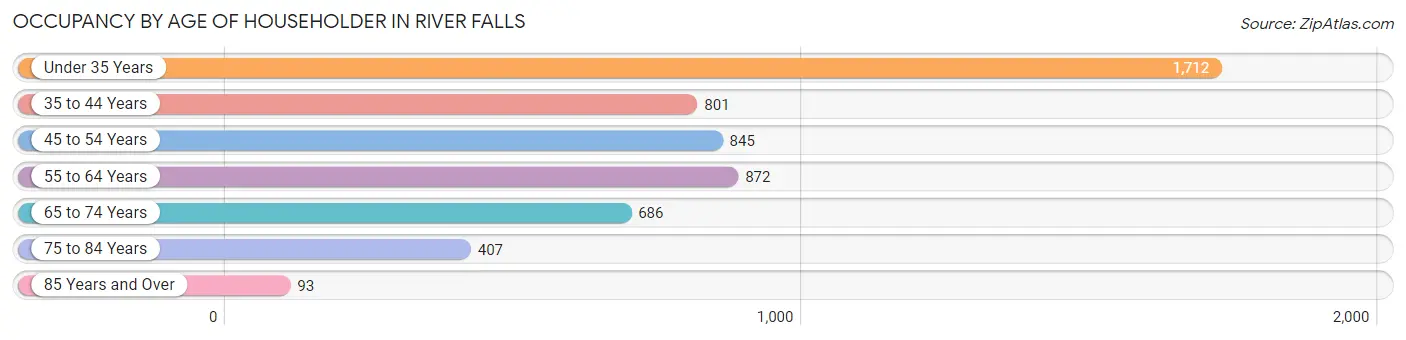
| Age Bracket | # Households | % Households |
| Under 35 Years | 1,712 | 31.6% |
| 35 to 44 Years | 801 | 14.8% |
| 45 to 54 Years | 845 | 15.6% |
| 55 to 64 Years | 872 | 16.1% |
| 65 to 74 Years | 686 | 12.7% |
| 75 to 84 Years | 407 | 7.5% |
| 85 Years and Over | 93 | 1.7% |
| Total | 5,416 | 100.0% |
Housing Finances in River Falls
Median Income by Occupancy in River Falls
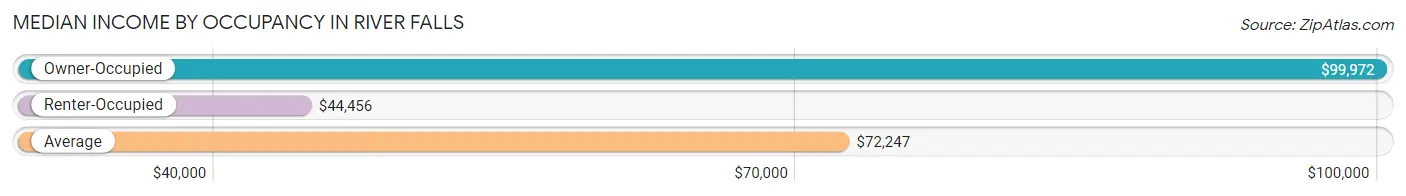
| Occupancy Type | # Households | Median Income |
| Owner-Occupied | 3,085 (57.0%) | $99,972 |
| Renter-Occupied | 2,331 (43.0%) | $44,456 |
| Average | 5,416 (100.0%) | $72,247 |
Occupancy by Householder Income Bracket in River Falls
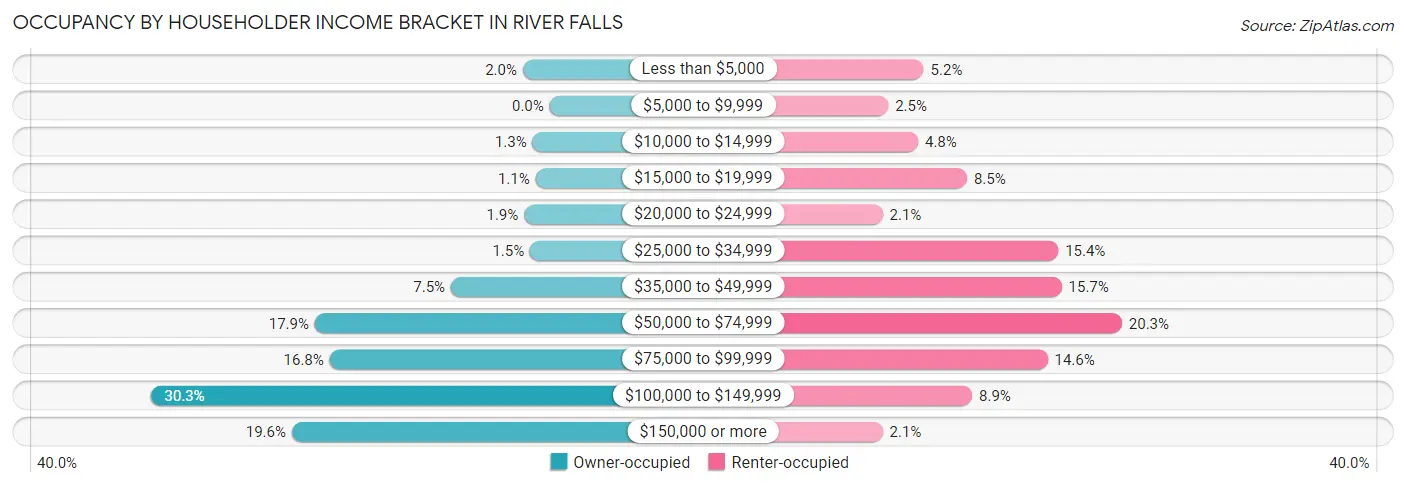
| Income Bracket | Owner-occupied | Renter-occupied |
| Less than $5,000 | 63 (2.0%) | 121 (5.2%) |
| $5,000 to $9,999 | 0 (0.0%) | 58 (2.5%) |
| $10,000 to $14,999 | 40 (1.3%) | 111 (4.8%) |
| $15,000 to $19,999 | 33 (1.1%) | 198 (8.5%) |
| $20,000 to $24,999 | 60 (1.9%) | 48 (2.1%) |
| $25,000 to $34,999 | 46 (1.5%) | 360 (15.4%) |
| $35,000 to $49,999 | 232 (7.5%) | 366 (15.7%) |
| $50,000 to $74,999 | 552 (17.9%) | 473 (20.3%) |
| $75,000 to $99,999 | 517 (16.8%) | 341 (14.6%) |
| $100,000 to $149,999 | 936 (30.3%) | 207 (8.9%) |
| $150,000 or more | 606 (19.6%) | 48 (2.1%) |
| Total | 3,085 (100.0%) | 2,331 (100.0%) |
Monthly Housing Cost Tiers in River Falls
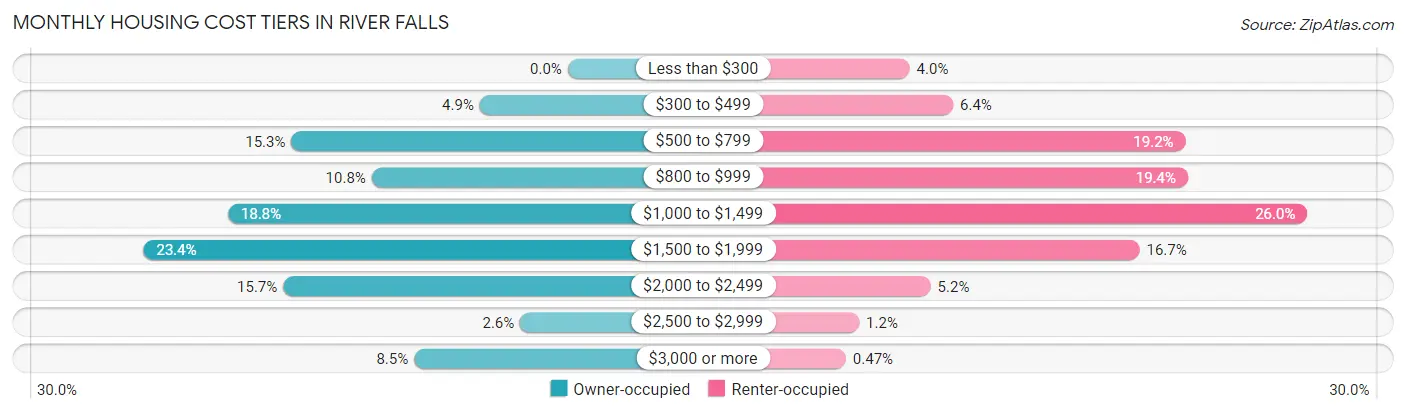
| Monthly Cost | Owner-occupied | Renter-occupied |
| Less than $300 | 0 (0.0%) | 93 (4.0%) |
| $300 to $499 | 150 (4.9%) | 149 (6.4%) |
| $500 to $799 | 471 (15.3%) | 448 (19.2%) |
| $800 to $999 | 334 (10.8%) | 451 (19.4%) |
| $1,000 to $1,499 | 579 (18.8%) | 605 (26.0%) |
| $1,500 to $1,999 | 723 (23.4%) | 389 (16.7%) |
| $2,000 to $2,499 | 485 (15.7%) | 120 (5.1%) |
| $2,500 to $2,999 | 81 (2.6%) | 28 (1.2%) |
| $3,000 or more | 262 (8.5%) | 11 (0.5%) |
| Total | 3,085 (100.0%) | 2,331 (100.0%) |
Physical Housing Characteristics in River Falls
Housing Structures in River Falls
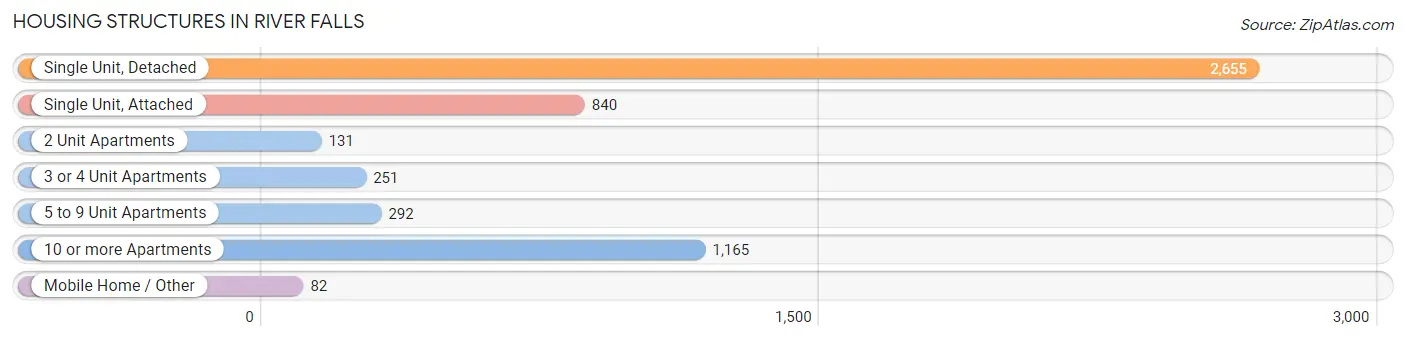
| Structure Type | # Housing Units | % Housing Units |
| Single Unit, Detached | 2,655 | 49.0% |
| Single Unit, Attached | 840 | 15.5% |
| 2 Unit Apartments | 131 | 2.4% |
| 3 or 4 Unit Apartments | 251 | 4.6% |
| 5 to 9 Unit Apartments | 292 | 5.4% |
| 10 or more Apartments | 1,165 | 21.5% |
| Mobile Home / Other | 82 | 1.5% |
| Total | 5,416 | 100.0% |
Housing Structures by Occupancy in River Falls
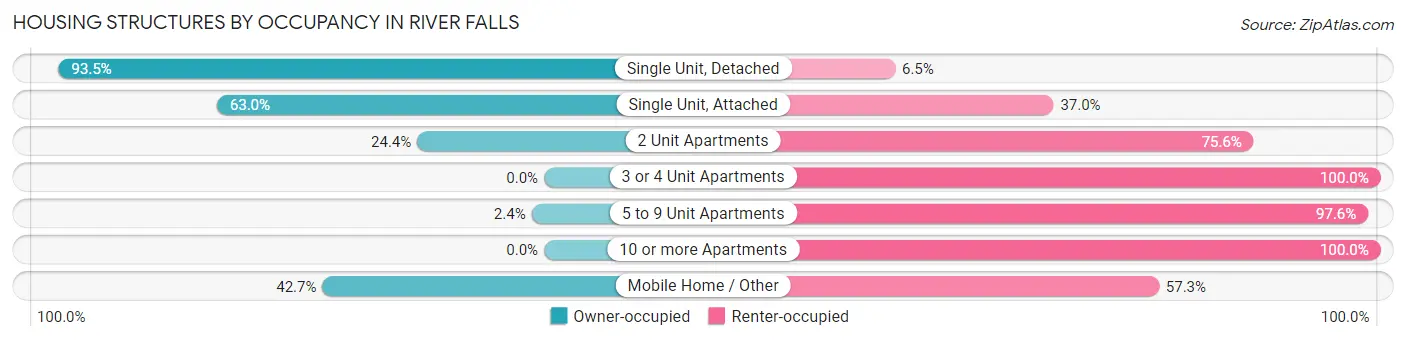
| Structure Type | Owner-occupied | Renter-occupied |
| Single Unit, Detached | 2,482 (93.5%) | 173 (6.5%) |
| Single Unit, Attached | 529 (63.0%) | 311 (37.0%) |
| 2 Unit Apartments | 32 (24.4%) | 99 (75.6%) |
| 3 or 4 Unit Apartments | 0 (0.0%) | 251 (100.0%) |
| 5 to 9 Unit Apartments | 7 (2.4%) | 285 (97.6%) |
| 10 or more Apartments | 0 (0.0%) | 1,165 (100.0%) |
| Mobile Home / Other | 35 (42.7%) | 47 (57.3%) |
| Total | 3,085 (57.0%) | 2,331 (43.0%) |
Housing Structures by Number of Rooms in River Falls
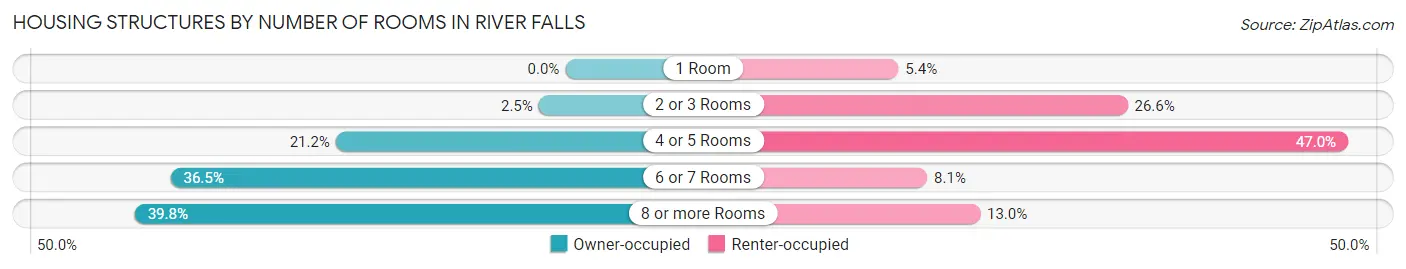
| Number of Rooms | Owner-occupied | Renter-occupied |
| 1 Room | 0 (0.0%) | 126 (5.4%) |
| 2 or 3 Rooms | 76 (2.5%) | 620 (26.6%) |
| 4 or 5 Rooms | 655 (21.2%) | 1,095 (47.0%) |
| 6 or 7 Rooms | 1,126 (36.5%) | 188 (8.1%) |
| 8 or more Rooms | 1,228 (39.8%) | 302 (13.0%) |
| Total | 3,085 (100.0%) | 2,331 (100.0%) |
Housing Structure by Heating Type in River Falls
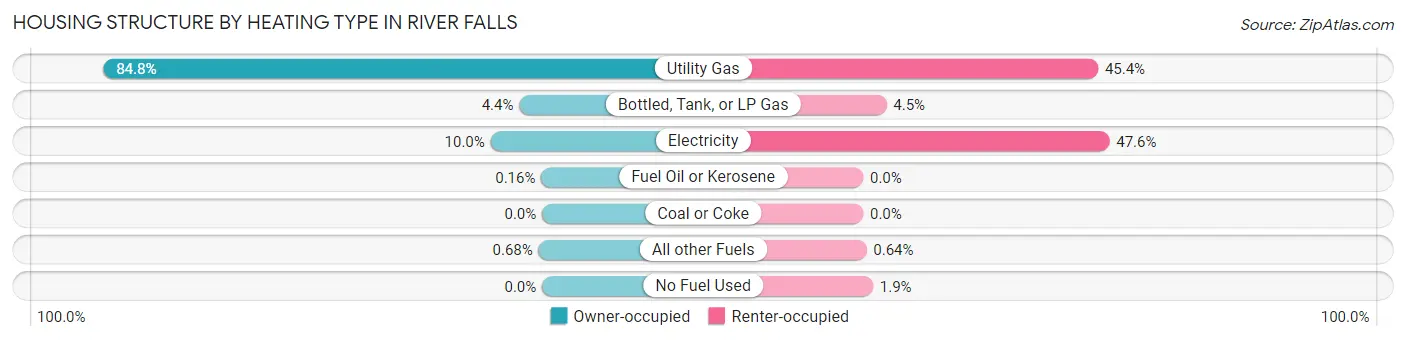
| Heating Type | Owner-occupied | Renter-occupied |
| Utility Gas | 2,616 (84.8%) | 1,058 (45.4%) |
| Bottled, Tank, or LP Gas | 136 (4.4%) | 105 (4.5%) |
| Electricity | 307 (10.0%) | 1,109 (47.6%) |
| Fuel Oil or Kerosene | 5 (0.2%) | 0 (0.0%) |
| Coal or Coke | 0 (0.0%) | 0 (0.0%) |
| All other Fuels | 21 (0.7%) | 15 (0.6%) |
| No Fuel Used | 0 (0.0%) | 44 (1.9%) |
| Total | 3,085 (100.0%) | 2,331 (100.0%) |
Household Vehicle Usage in River Falls
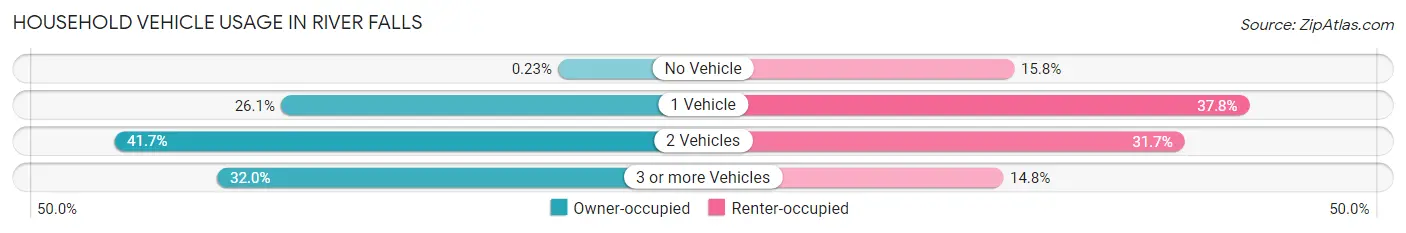
| Vehicles per Household | Owner-occupied | Renter-occupied |
| No Vehicle | 7 (0.2%) | 368 (15.8%) |
| 1 Vehicle | 805 (26.1%) | 880 (37.8%) |
| 2 Vehicles | 1,285 (41.6%) | 739 (31.7%) |
| 3 or more Vehicles | 988 (32.0%) | 344 (14.8%) |
| Total | 3,085 (100.0%) | 2,331 (100.0%) |
Real Estate & Mortgages in River Falls
Real Estate and Mortgage Overview in River Falls
| Characteristic | Without Mortgage | With Mortgage |
| Housing Units | 914 | 2,171 |
| Median Property Value | $272,200 | $276,100 |
| Median Household Income | $71,932 | $489 |
| Monthly Housing Costs | $710 | $248 |
| Real Estate Taxes | $4,425 | $9 |
Property Value by Mortgage Status in River Falls
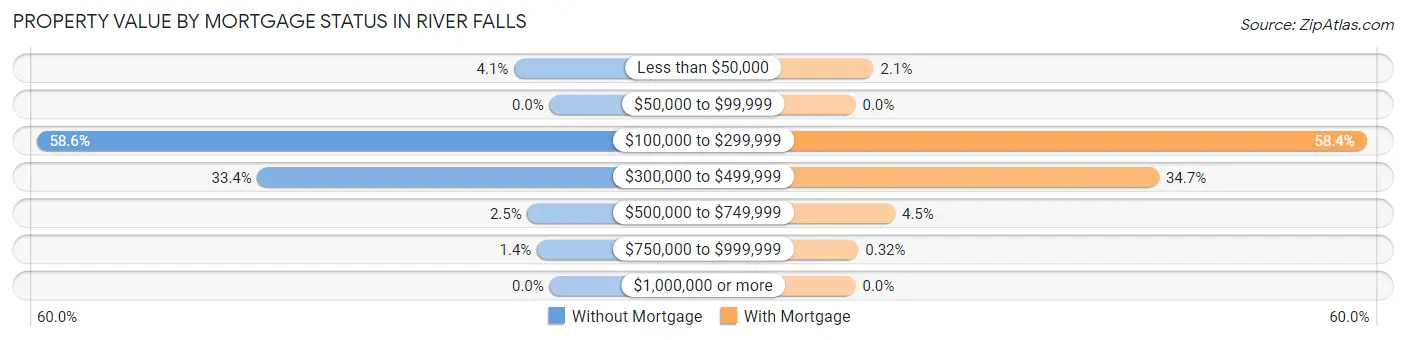
| Property Value | Without Mortgage | With Mortgage |
| Less than $50,000 | 37 (4.1%) | 45 (2.1%) |
| $50,000 to $99,999 | 0 (0.0%) | 0 (0.0%) |
| $100,000 to $299,999 | 536 (58.6%) | 1,268 (58.4%) |
| $300,000 to $499,999 | 305 (33.4%) | 753 (34.7%) |
| $500,000 to $749,999 | 23 (2.5%) | 98 (4.5%) |
| $750,000 to $999,999 | 13 (1.4%) | 7 (0.3%) |
| $1,000,000 or more | 0 (0.0%) | 0 (0.0%) |
| Total | 914 (100.0%) | 2,171 (100.0%) |
Household Income by Mortgage Status in River Falls
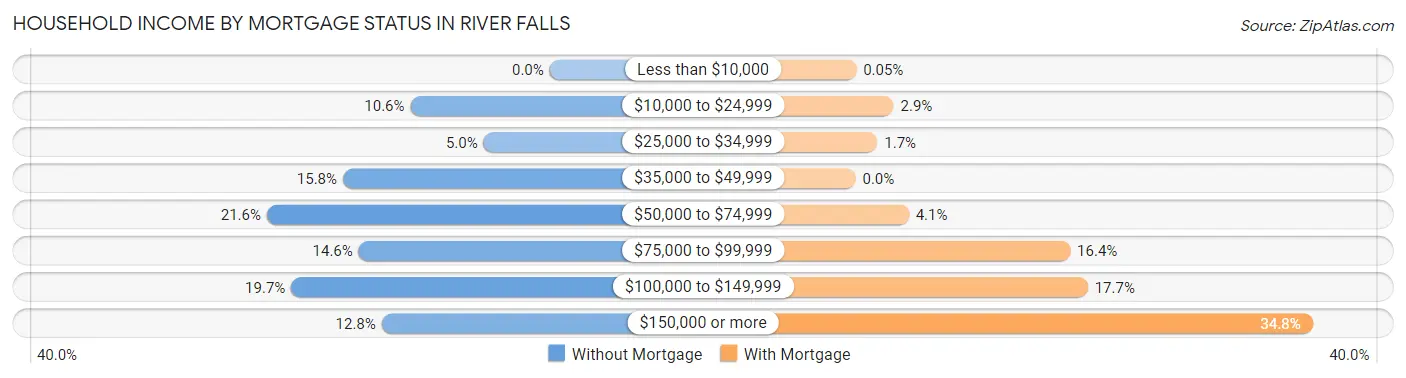
| Household Income | Without Mortgage | With Mortgage |
| Less than $10,000 | 0 (0.0%) | 1 (0.1%) |
| $10,000 to $24,999 | 97 (10.6%) | 63 (2.9%) |
| $25,000 to $34,999 | 46 (5.0%) | 36 (1.7%) |
| $35,000 to $49,999 | 144 (15.8%) | 0 (0.0%) |
| $50,000 to $74,999 | 197 (21.5%) | 88 (4.1%) |
| $75,000 to $99,999 | 133 (14.5%) | 355 (16.4%) |
| $100,000 to $149,999 | 180 (19.7%) | 384 (17.7%) |
| $150,000 or more | 117 (12.8%) | 756 (34.8%) |
| Total | 914 (100.0%) | 2,171 (100.0%) |
Property Value to Household Income Ratio in River Falls
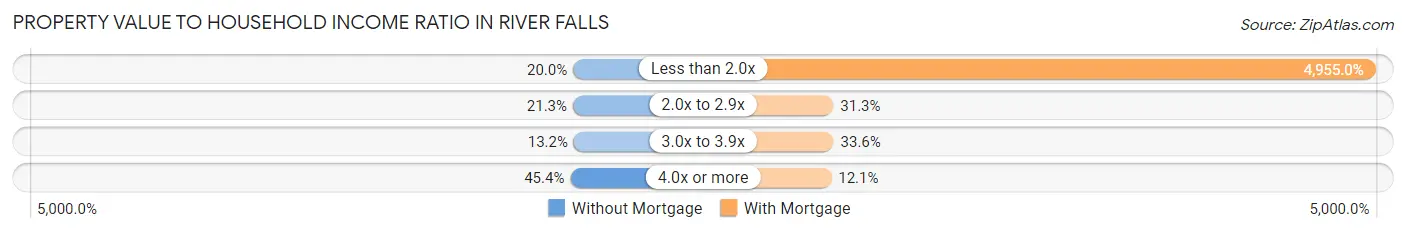
| Value-to-Income Ratio | Without Mortgage | With Mortgage |
| Less than 2.0x | 183 (20.0%) | 107,573 (4,955.0%) |
| 2.0x to 2.9x | 195 (21.3%) | 680 (31.3%) |
| 3.0x to 3.9x | 121 (13.2%) | 730 (33.6%) |
| 4.0x or more | 415 (45.4%) | 262 (12.1%) |
| Total | 914 (100.0%) | 2,171 (100.0%) |
Real Estate Taxes by Mortgage Status in River Falls
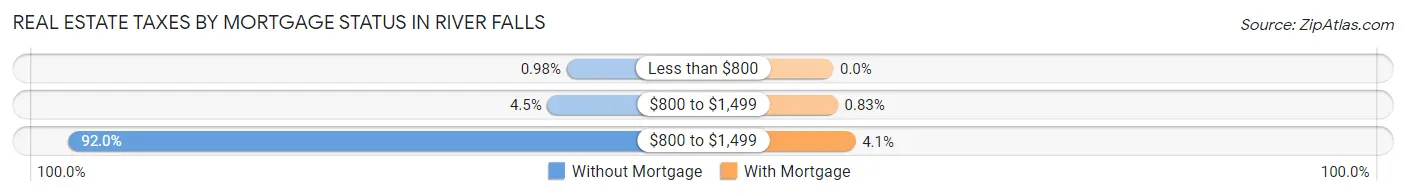
| Property Taxes | Without Mortgage | With Mortgage |
| Less than $800 | 9 (1.0%) | 0 (0.0%) |
| $800 to $1,499 | 41 (4.5%) | 18 (0.8%) |
| $800 to $1,499 | 841 (92.0%) | 88 (4.1%) |
| Total | 914 (100.0%) | 2,171 (100.0%) |
Health & Disability in River Falls
Health Insurance Coverage by Age in River Falls
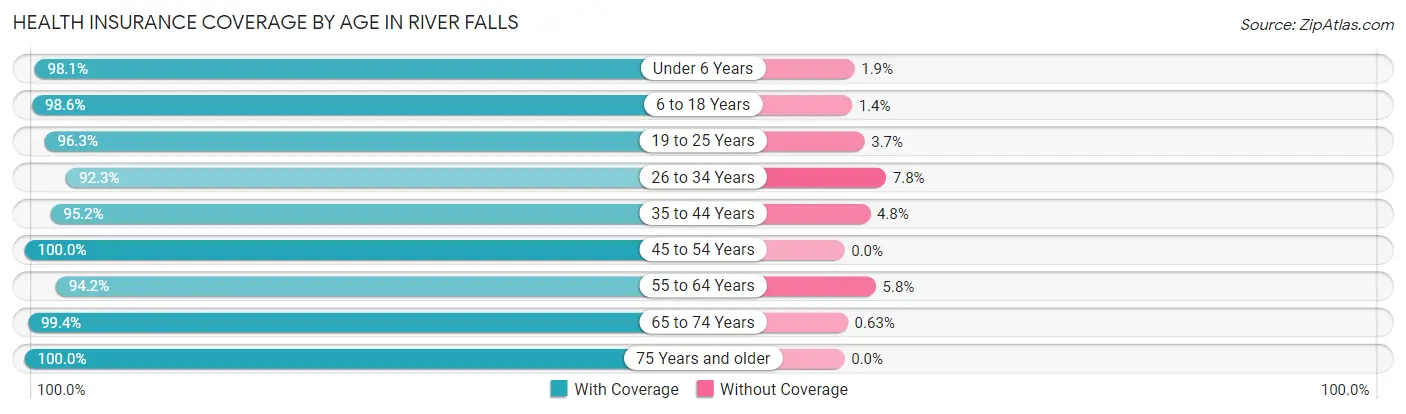
| Age Bracket | With Coverage | Without Coverage |
| Under 6 Years | 738 (98.1%) | 14 (1.9%) |
| 6 to 18 Years | 2,489 (98.6%) | 35 (1.4%) |
| 19 to 25 Years | 4,538 (96.3%) | 176 (3.7%) |
| 26 to 34 Years | 1,608 (92.2%) | 135 (7.7%) |
| 35 to 44 Years | 1,570 (95.2%) | 79 (4.8%) |
| 45 to 54 Years | 1,398 (100.0%) | 0 (0.0%) |
| 55 to 64 Years | 1,387 (94.2%) | 86 (5.8%) |
| 65 to 74 Years | 1,105 (99.4%) | 7 (0.6%) |
| 75 Years and older | 684 (100.0%) | 0 (0.0%) |
| Total | 15,517 (96.7%) | 532 (3.3%) |
Health Insurance Coverage by Citizenship Status in River Falls
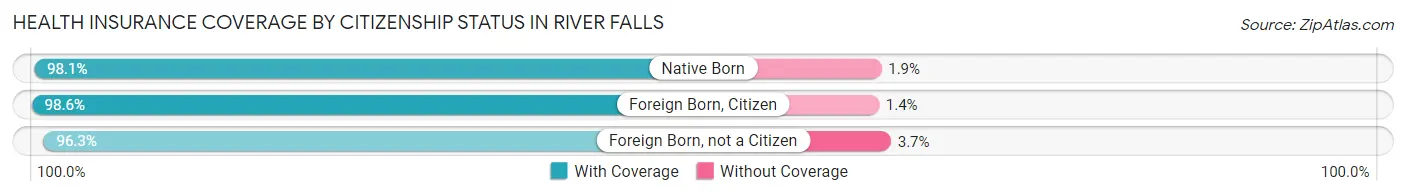
| Citizenship Status | With Coverage | Without Coverage |
| Native Born | 738 (98.1%) | 14 (1.9%) |
| Foreign Born, Citizen | 2,489 (98.6%) | 35 (1.4%) |
| Foreign Born, not a Citizen | 4,538 (96.3%) | 176 (3.7%) |
Health Insurance Coverage by Household Income in River Falls
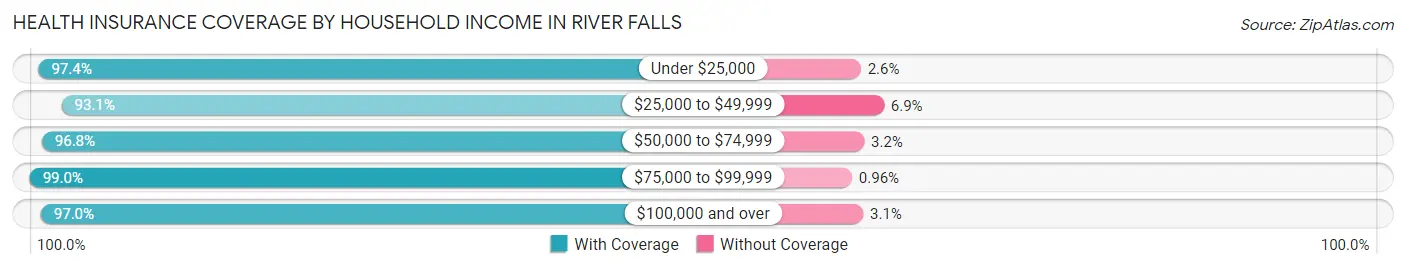
| Household Income | With Coverage | Without Coverage |
| Under $25,000 | 1,081 (97.4%) | 29 (2.6%) |
| $25,000 to $49,999 | 2,093 (93.1%) | 156 (6.9%) |
| $50,000 to $74,999 | 2,361 (96.8%) | 79 (3.2%) |
| $75,000 to $99,999 | 2,269 (99.0%) | 22 (1.0%) |
| $100,000 and over | 5,439 (97.0%) | 171 (3.0%) |
Public vs Private Health Insurance Coverage by Age in River Falls
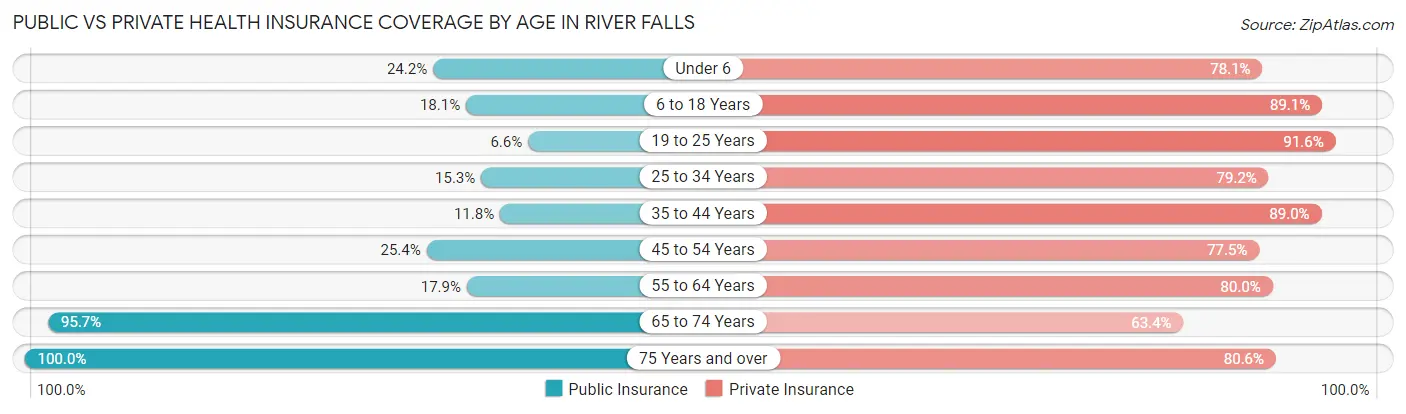
| Age Bracket | Public Insurance | Private Insurance |
| Under 6 | 182 (24.2%) | 587 (78.1%) |
| 6 to 18 Years | 456 (18.1%) | 2,250 (89.1%) |
| 19 to 25 Years | 309 (6.6%) | 4,320 (91.6%) |
| 25 to 34 Years | 266 (15.3%) | 1,381 (79.2%) |
| 35 to 44 Years | 194 (11.8%) | 1,468 (89.0%) |
| 45 to 54 Years | 355 (25.4%) | 1,083 (77.5%) |
| 55 to 64 Years | 264 (17.9%) | 1,178 (80.0%) |
| 65 to 74 Years | 1,064 (95.7%) | 705 (63.4%) |
| 75 Years and over | 684 (100.0%) | 551 (80.6%) |
| Total | 3,774 (23.5%) | 13,523 (84.3%) |
Disability Status by Sex by Age in River Falls
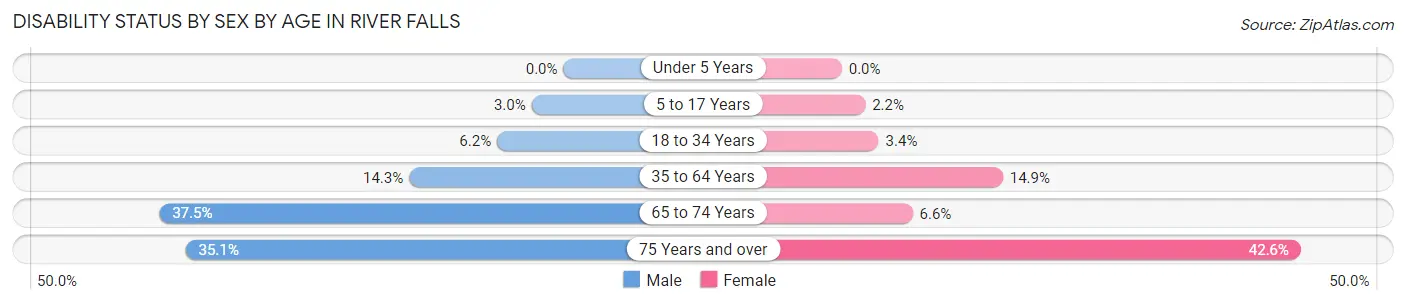
| Age Bracket | Male | Female |
| Under 5 Years | 0 (0.0%) | 0 (0.0%) |
| 5 to 17 Years | 32 (2.9%) | 22 (2.2%) |
| 18 to 34 Years | 179 (6.2%) | 142 (3.4%) |
| 35 to 64 Years | 333 (14.3%) | 328 (14.9%) |
| 65 to 74 Years | 240 (37.5%) | 31 (6.6%) |
| 75 Years and over | 81 (35.1%) | 193 (42.6%) |
Disability Class by Sex by Age in River Falls
Disability Class: Hearing Difficulty
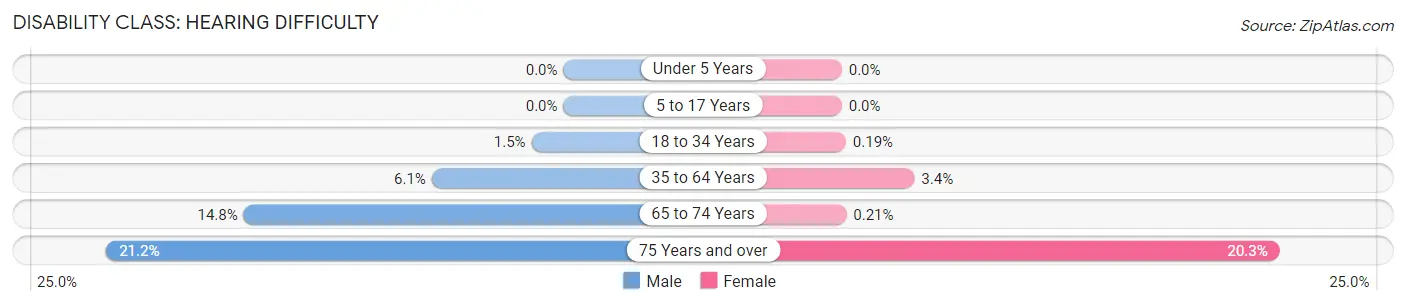
| Age Bracket | Male | Female |
| Under 5 Years | 0 (0.0%) | 0 (0.0%) |
| 5 to 17 Years | 0 (0.0%) | 0 (0.0%) |
| 18 to 34 Years | 43 (1.5%) | 8 (0.2%) |
| 35 to 64 Years | 142 (6.1%) | 74 (3.4%) |
| 65 to 74 Years | 95 (14.8%) | 1 (0.2%) |
| 75 Years and over | 49 (21.2%) | 92 (20.3%) |
Disability Class: Vision Difficulty
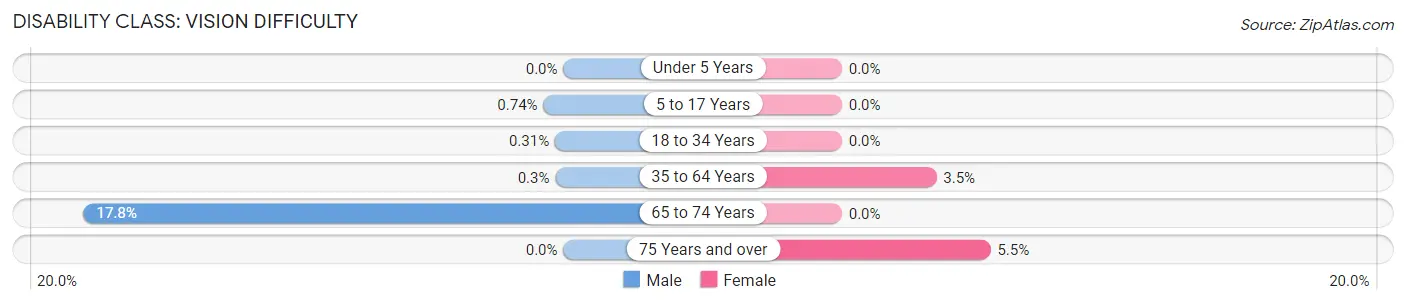
| Age Bracket | Male | Female |
| Under 5 Years | 0 (0.0%) | 0 (0.0%) |
| 5 to 17 Years | 8 (0.7%) | 0 (0.0%) |
| 18 to 34 Years | 9 (0.3%) | 0 (0.0%) |
| 35 to 64 Years | 7 (0.3%) | 77 (3.5%) |
| 65 to 74 Years | 114 (17.8%) | 0 (0.0%) |
| 75 Years and over | 0 (0.0%) | 25 (5.5%) |
Disability Class: Cognitive Difficulty
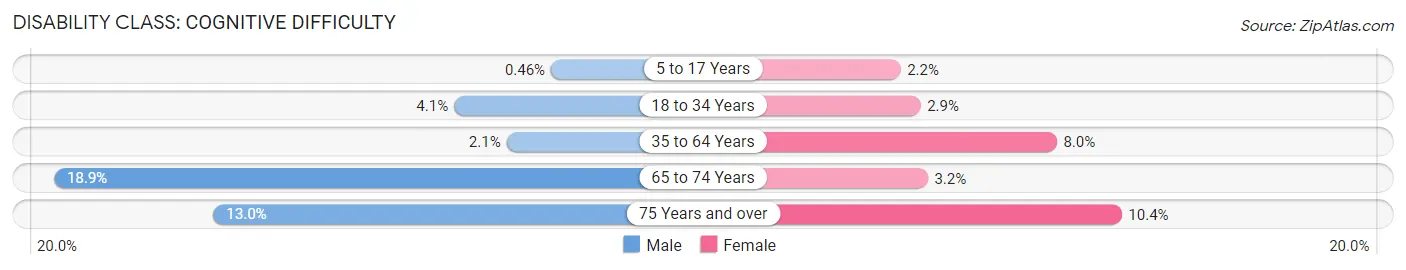
| Age Bracket | Male | Female |
| 5 to 17 Years | 5 (0.5%) | 22 (2.2%) |
| 18 to 34 Years | 118 (4.1%) | 121 (2.9%) |
| 35 to 64 Years | 49 (2.1%) | 175 (8.0%) |
| 65 to 74 Years | 121 (18.9%) | 15 (3.2%) |
| 75 Years and over | 30 (13.0%) | 47 (10.4%) |
Disability Class: Ambulatory Difficulty
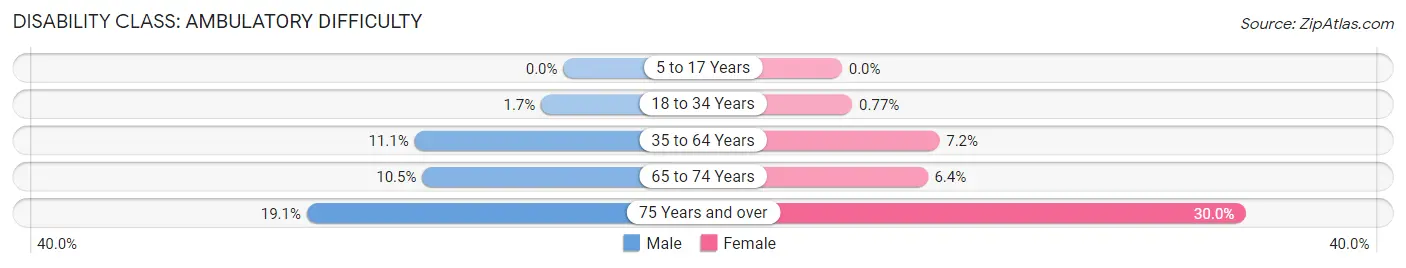
| Age Bracket | Male | Female |
| 5 to 17 Years | 0 (0.0%) | 0 (0.0%) |
| 18 to 34 Years | 48 (1.7%) | 32 (0.8%) |
| 35 to 64 Years | 257 (11.1%) | 159 (7.2%) |
| 65 to 74 Years | 67 (10.5%) | 30 (6.4%) |
| 75 Years and over | 44 (19.1%) | 136 (30.0%) |
Disability Class: Self-Care Difficulty
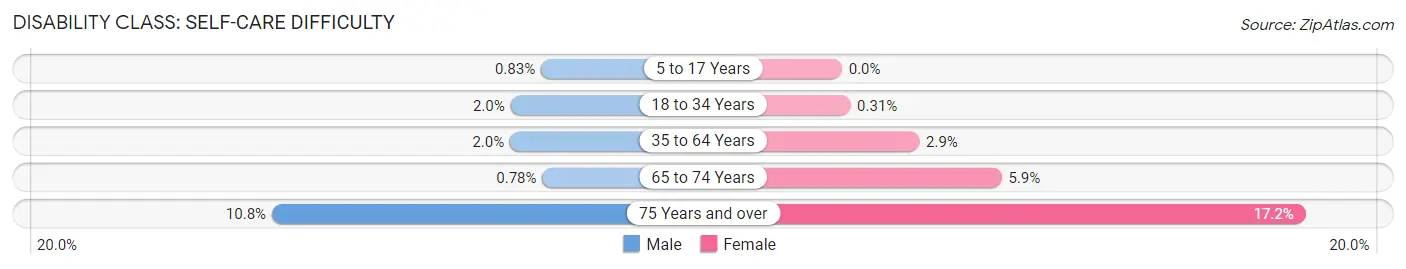
| Age Bracket | Male | Female |
| 5 to 17 Years | 9 (0.8%) | 0 (0.0%) |
| 18 to 34 Years | 57 (2.0%) | 13 (0.3%) |
| 35 to 64 Years | 46 (2.0%) | 63 (2.9%) |
| 65 to 74 Years | 5 (0.8%) | 28 (5.9%) |
| 75 Years and over | 25 (10.8%) | 78 (17.2%) |
Technology Access in River Falls
Computing Device Access in River Falls
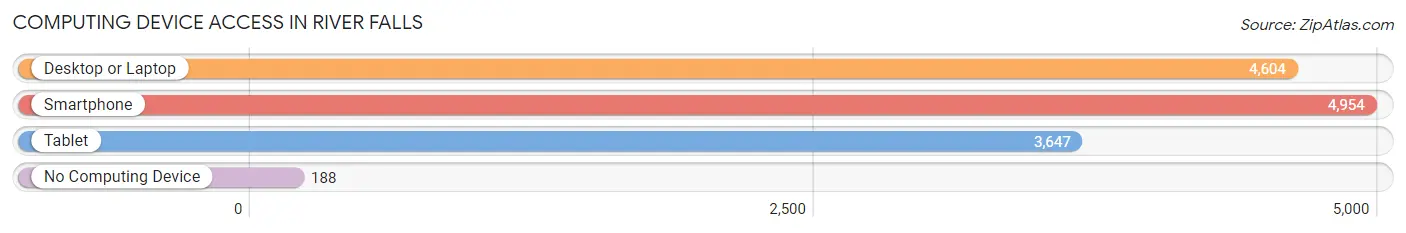
| Device Type | # Households | % Households |
| Desktop or Laptop | 4,604 | 85.0% |
| Smartphone | 4,954 | 91.5% |
| Tablet | 3,647 | 67.3% |
| No Computing Device | 188 | 3.5% |
| Total | 5,416 | 100.0% |
Internet Access in River Falls
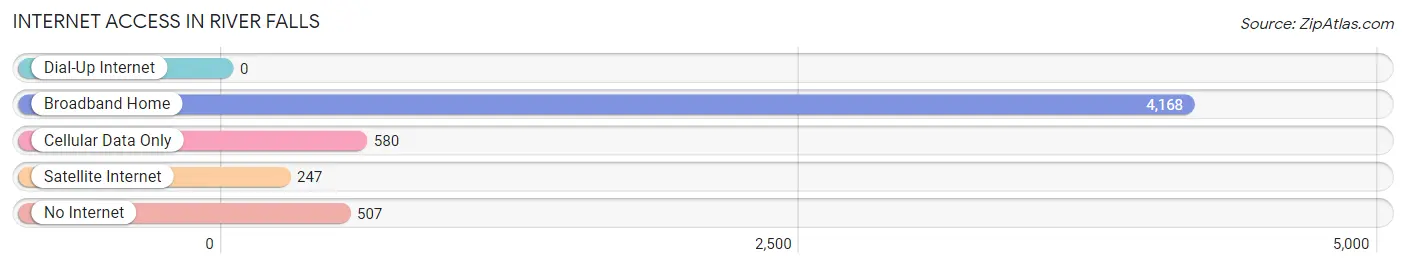
| Internet Type | # Households | % Households |
| Dial-Up Internet | 0 | 0.0% |
| Broadband Home | 4,168 | 77.0% |
| Cellular Data Only | 580 | 10.7% |
| Satellite Internet | 247 | 4.6% |
| No Internet | 507 | 9.4% |
| Total | 5,416 | 100.0% |
River Falls Summary
River Falls, Wisconsin is a city located in Pierce and St. Croix counties in the western part of the state. It is part of the Minneapolis-St. Paul metropolitan area and is located about 25 miles east of the Twin Cities. The city has a population of 15,000 and is the county seat of Pierce County.
History
The area that is now River Falls was first settled in 1848 by a group of settlers from New York. The settlers named the area Kinnickinnic, after the nearby river. The name was later changed to River Falls in 1854. The city was officially incorporated in 1872.
In the late 19th century, River Falls became a center for the lumber industry. The city was also home to a number of manufacturing companies, including a paper mill, a flour mill, and a creamery.
Geography
River Falls is located in western Wisconsin, about 25 miles east of the Twin Cities. The city is situated on the banks of the Kinnickinnic River, which flows through the city. The city is surrounded by rolling hills and is located in a valley.
The city has a total area of 8.3 square miles, of which 8.2 square miles is land and 0.1 square miles is water. The city is located at an elevation of 890 feet above sea level.
Economy
River Falls is a small city with a diverse economy. The city is home to a number of manufacturing companies, including a paper mill, a flour mill, and a creamery. The city is also home to a number of retail stores, restaurants, and other businesses.
The city is also home to the University of Wisconsin-River Falls, which is a public university with an enrollment of over 6,000 students. The university is a major employer in the city and contributes to the local economy.
Demographics
As of the 2010 census, the population of River Falls was 15,000. The racial makeup of the city was 94.3% White, 1.3% African American, 0.7% Native American, 1.2% Asian, 0.1% Pacific Islander, 1.2% from other races, and 1.4% from two or more races. Hispanic or Latino of any race were 3.2% of the population.
The median household income in River Falls was $50,945, and the median family income was $63,917. The per capita income for the city was $24,945. About 8.3% of families and 11.2% of the population were below the poverty line, including 14.2% of those under age 18 and 6.2% of those age 65 or over.
River Falls is a small city with a diverse economy and a rich history. The city is home to a number of manufacturing companies, retail stores, restaurants, and other businesses. The city is also home to the University of Wisconsin-River Falls, which is a major employer in the city and contributes to the local economy. The city has a population of 15,000 and is the county seat of Pierce County.
Common Questions
What is Per Capita Income in River Falls?
Per Capita income in River Falls is $31,811.
What is the Median Family Income in River Falls?
Median Family Income in River Falls is $99,297.
What is the Median Household income in River Falls?
Median Household Income in River Falls is $72,247.
What is Income or Wage Gap in River Falls?
Income or Wage Gap in River Falls is 55.1%.
Women in River Falls earn 44.9 cents for every dollar earned by a man.
What is Inequality or Gini Index in River Falls?
Inequality or Gini Index in River Falls is 0.42.
What is the Total Population of River Falls?
Total Population of River Falls is 16,165.
What is the Total Male Population of River Falls?
Total Male Population of River Falls is 7,596.
What is the Total Female Population of River Falls?
Total Female Population of River Falls is 8,569.
What is the Ratio of Males per 100 Females in River Falls?
There are 88.65 Males per 100 Females in River Falls.
What is the Ratio of Females per 100 Males in River Falls?
There are 112.81 Females per 100 Males in River Falls.
What is the Median Population Age in River Falls?
Median Population Age in River Falls is 26.8 Years.
What is the Average Family Size in River Falls
Average Family Size in River Falls is 3.0 People.
What is the Average Household Size in River Falls
Average Household Size in River Falls is 2.5 People.
How Large is the Labor Force in River Falls?
There are 9,467 People in the Labor Forcein in River Falls.
What is the Percentage of People in the Labor Force in River Falls?
69.2% of People are in the Labor Force in River Falls.
What is the Unemployment Rate in River Falls?
Unemployment Rate in River Falls is 3.3%.