Pepin, WI Map & Demographics
Pepin Map
Pepin Overview
$40,365
PER CAPITA INCOME
$87,386
AVG FAMILY INCOME
$71,136
AVG HOUSEHOLD INCOME
37.1%
WAGE / INCOME GAP [ % ]
62.9¢/ $1
WAGE / INCOME GAP [ $ ]
0.42
INEQUALITY / GINI INDEX
823
TOTAL POPULATION
430
MALE POPULATION
393
FEMALE POPULATION
109.41
MALES / 100 FEMALES
91.40
FEMALES / 100 MALES
51.8
MEDIAN AGE
2.9
AVG FAMILY SIZE
2.3
AVG HOUSEHOLD SIZE
398
LABOR FORCE [ PEOPLE ]
57.7%
PERCENT IN LABOR FORCE
3.0%
UNEMPLOYMENT RATE
Pepin Zip Codes
Pepin Area Codes
Income in Pepin
Income Overview in Pepin
Per Capita Income in Pepin is $40,365, while median incomes of families and households are $87,386 and $71,136 respectively.
| Characteristic | Number | Measure |
| Per Capita Income | 823 | $40,365 |
| Median Family Income | 209 | $87,386 |
| Mean Family Income | 209 | $99,766 |
| Median Household Income | 348 | $71,136 |
| Mean Household Income | 348 | $82,832 |
| Income Deficit | 209 | $0 |
| Wage / Income Gap (%) | 823 | 37.15% |
| Wage / Income Gap ($) | 823 | 62.85¢ per $1 |
| Gini / Inequality Index | 823 | 0.42 |
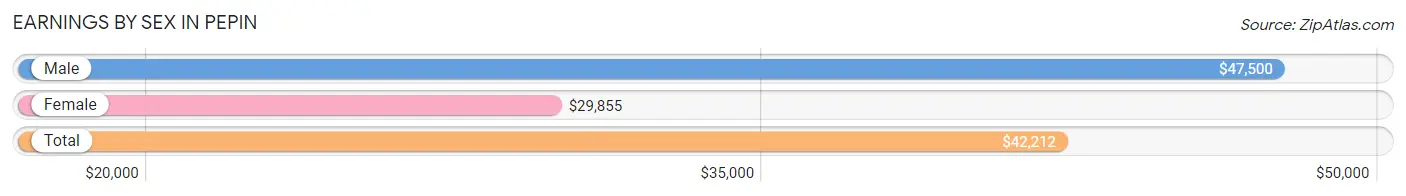
Earnings by Sex in Pepin
Average Earnings in Pepin are $42,212, $47,500 for men and $29,855 for women, a difference of 37.1%.
| Sex | Number | Average Earnings |
| Male | 230 (49.2%) | $47,500 |
| Female | 237 (50.7%) | $29,855 |
| Total | 467 (100.0%) | $42,212 |
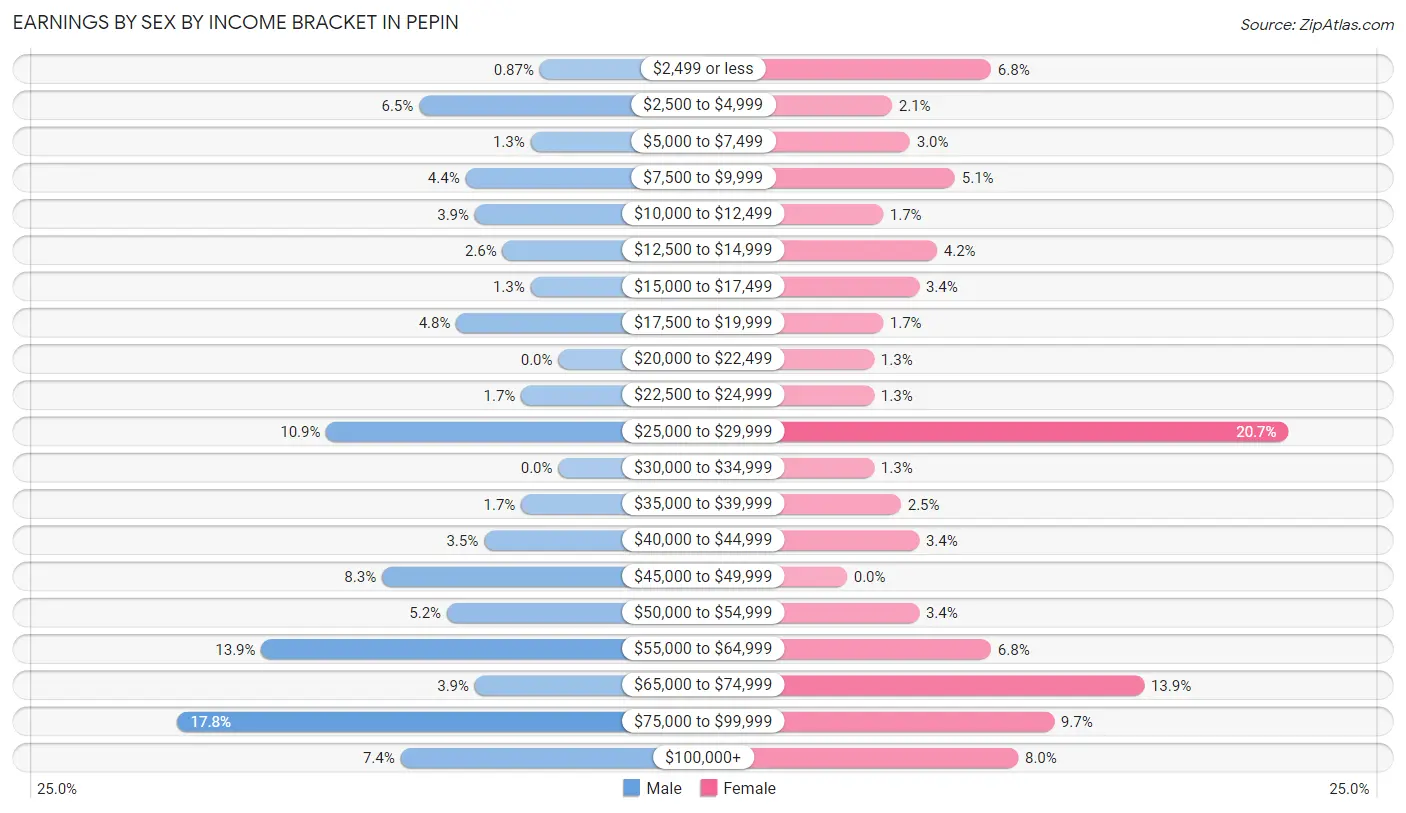
Earnings by Sex by Income Bracket in Pepin
The most common earnings brackets in Pepin are $75,000 to $99,999 for men (41 | 17.8%) and $25,000 to $29,999 for women (49 | 20.7%).
| Income | Male | Female |
| $2,499 or less | 2 (0.9%) | 16 (6.8%) |
| $2,500 to $4,999 | 15 (6.5%) | 5 (2.1%) |
| $5,000 to $7,499 | 3 (1.3%) | 7 (2.9%) |
| $7,500 to $9,999 | 10 (4.3%) | 12 (5.1%) |
| $10,000 to $12,499 | 9 (3.9%) | 4 (1.7%) |
| $12,500 to $14,999 | 6 (2.6%) | 10 (4.2%) |
| $15,000 to $17,499 | 3 (1.3%) | 8 (3.4%) |
| $17,500 to $19,999 | 11 (4.8%) | 4 (1.7%) |
| $20,000 to $22,499 | 0 (0.0%) | 3 (1.3%) |
| $22,500 to $24,999 | 4 (1.7%) | 3 (1.3%) |
| $25,000 to $29,999 | 25 (10.9%) | 49 (20.7%) |
| $30,000 to $34,999 | 0 (0.0%) | 3 (1.3%) |
| $35,000 to $39,999 | 4 (1.7%) | 6 (2.5%) |
| $40,000 to $44,999 | 8 (3.5%) | 8 (3.4%) |
| $45,000 to $49,999 | 19 (8.3%) | 0 (0.0%) |
| $50,000 to $54,999 | 12 (5.2%) | 8 (3.4%) |
| $55,000 to $64,999 | 32 (13.9%) | 16 (6.8%) |
| $65,000 to $74,999 | 9 (3.9%) | 33 (13.9%) |
| $75,000 to $99,999 | 41 (17.8%) | 23 (9.7%) |
| $100,000+ | 17 (7.4%) | 19 (8.0%) |
| Total | 230 (100.0%) | 237 (100.0%) |
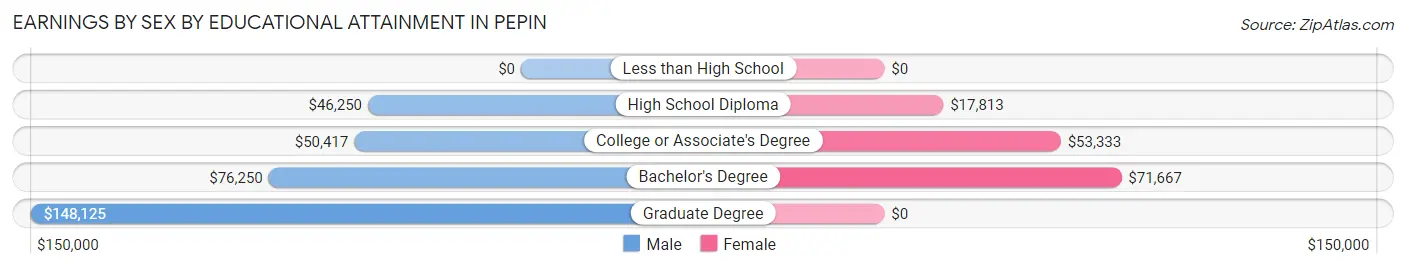
Earnings by Sex by Educational Attainment in Pepin
Average earnings in Pepin are $53,333 for men and $33,750 for women, a difference of 36.7%. Men with an educational attainment of graduate degree enjoy the highest average annual earnings of $148,125, while those with high school diploma education earn the least with $46,250. Women with an educational attainment of bachelor's degree earn the most with the average annual earnings of $71,667, while those with high school diploma education have the smallest earnings of $17,813.
| Educational Attainment | Male Income | Female Income |
| Less than High School | - | - |
| High School Diploma | $46,250 | $17,813 |
| College or Associate's Degree | $50,417 | $53,333 |
| Bachelor's Degree | $76,250 | $71,667 |
| Graduate Degree | $148,125 | $0 |
| Total | $53,333 | $33,750 |
Family Income in Pepin
Family Income Brackets in Pepin
According to the Pepin family income data, there are 57 families falling into the $100,000 to $149,999 income range, which is the most common income bracket and makes up 27.3% of all families. Conversely, the $10,000 to $14,999 income bracket is the least frequent group with only 3 families (1.4%) belonging to this category.
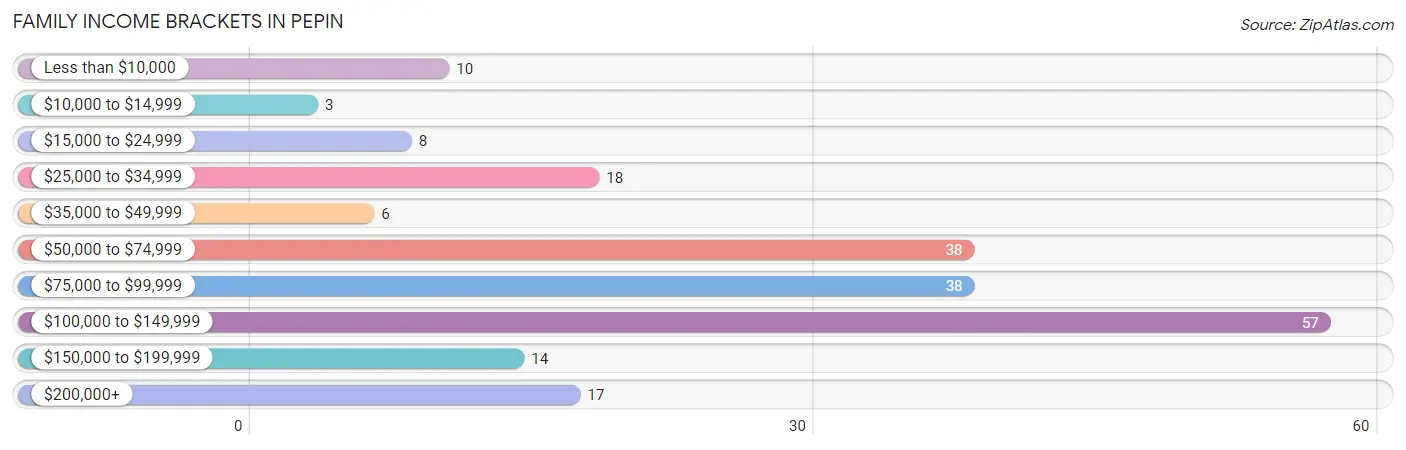
| Income Bracket | # Families | % Families |
| Less than $10,000 | 10 | 4.8% |
| $10,000 to $14,999 | 3 | 1.4% |
| $15,000 to $24,999 | 8 | 3.8% |
| $25,000 to $34,999 | 18 | 8.6% |
| $35,000 to $49,999 | 6 | 2.9% |
| $50,000 to $74,999 | 38 | 18.2% |
| $75,000 to $99,999 | 38 | 18.2% |
| $100,000 to $149,999 | 57 | 27.3% |
| $150,000 to $199,999 | 14 | 6.7% |
| $200,000+ | 17 | 8.1% |
Family Income by Famaliy Size in Pepin
4-person families (23 | 11.0%) account for the highest median family income in Pepin with $150,139 per family, while 2-person families (128 | 61.2%) have the highest median income of $41,562 per family member.
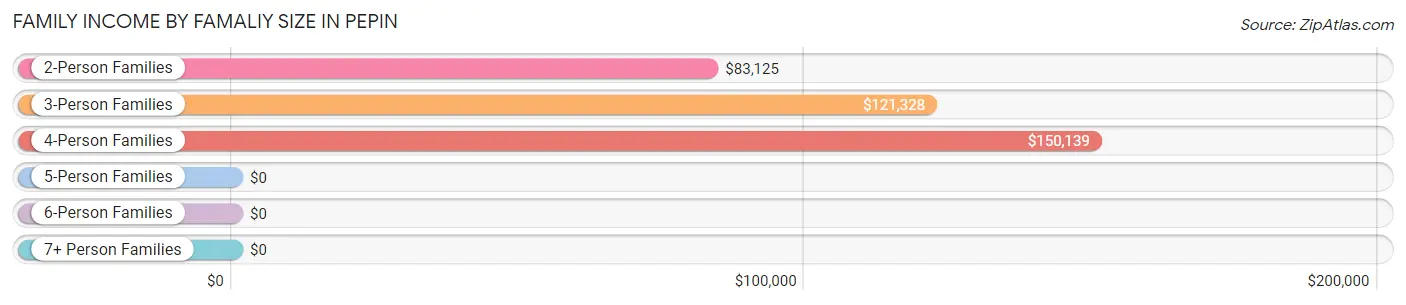
| Income Bracket | # Families | Median Income |
| 2-Person Families | 128 (61.2%) | $83,125 |
| 3-Person Families | 41 (19.6%) | $121,328 |
| 4-Person Families | 23 (11.0%) | $150,139 |
| 5-Person Families | 9 (4.3%) | $0 |
| 6-Person Families | 0 (0.0%) | $0 |
| 7+ Person Families | 8 (3.8%) | $0 |
| Total | 209 (100.0%) | $87,386 |
Family Income by Number of Earners in Pepin
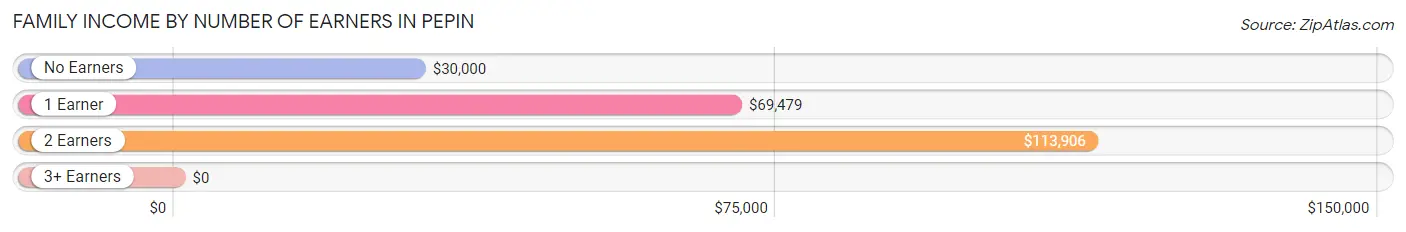
| Number of Earners | # Families | Median Income |
| No Earners | 32 (15.3%) | $30,000 |
| 1 Earner | 65 (31.1%) | $69,479 |
| 2 Earners | 93 (44.5%) | $113,906 |
| 3+ Earners | 19 (9.1%) | $0 |
| Total | 209 (100.0%) | $87,386 |
Household Income in Pepin
Household Income Brackets in Pepin
With 79 households falling in the category, the $100,000 to $149,999 income range is the most frequent in Pepin, accounting for 22.7% of all households. In contrast, only 9 households (2.6%) fall into the $10,000 to $14,999 income bracket, making it the least populous group.
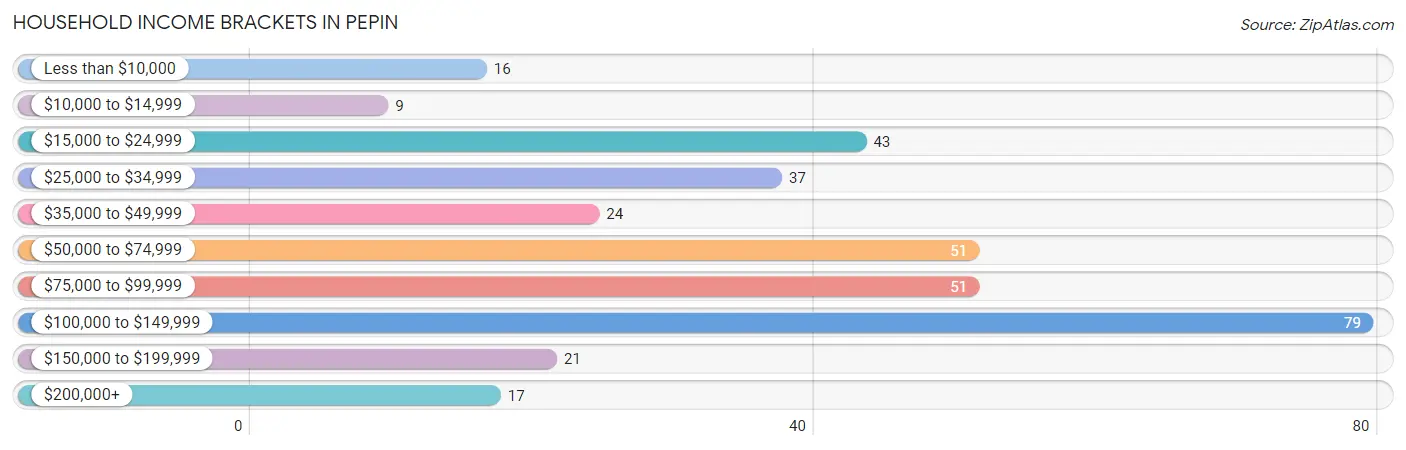
| Income Bracket | # Households | % Households |
| Less than $10,000 | 16 | 4.6% |
| $10,000 to $14,999 | 9 | 2.6% |
| $15,000 to $24,999 | 43 | 12.4% |
| $25,000 to $34,999 | 37 | 10.6% |
| $35,000 to $49,999 | 24 | 6.9% |
| $50,000 to $74,999 | 51 | 14.7% |
| $75,000 to $99,999 | 51 | 14.7% |
| $100,000 to $149,999 | 79 | 22.7% |
| $150,000 to $199,999 | 21 | 6.0% |
| $200,000+ | 17 | 4.9% |
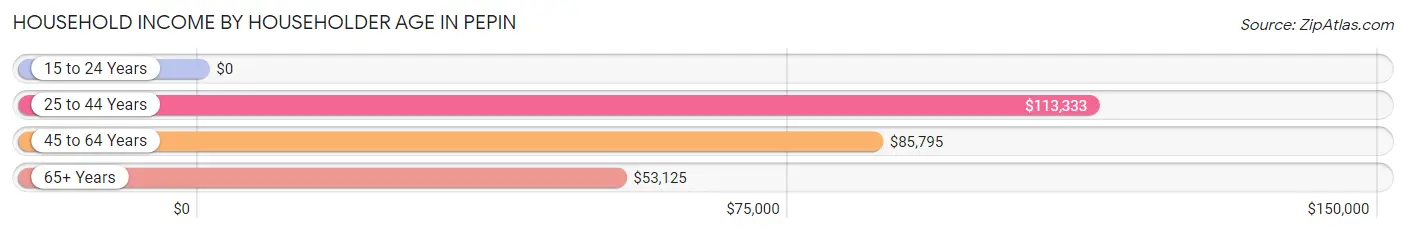
Household Income by Householder Age in Pepin
The median household income in Pepin is $71,136, with the highest median household income of $113,333 found in the 25 to 44 years age bracket for the primary householder. A total of 74 households (21.3%) fall into this category. Meanwhile, the 15 to 24 years age bracket for the primary householder has the lowest median household income of $0, with 12 households (3.5%) in this group.
| Income Bracket | # Households | Median Income |
| 15 to 24 Years | 12 (3.5%) | $0 |
| 25 to 44 Years | 74 (21.3%) | $113,333 |
| 45 to 64 Years | 159 (45.7%) | $85,795 |
| 65+ Years | 103 (29.6%) | $53,125 |
| Total | 348 (100.0%) | $71,136 |
Poverty in Pepin
Income Below Poverty by Sex and Age in Pepin
With 14.7% poverty level for males and 18.5% for females among the residents of Pepin, under 5 year old males and 5 year old females are the most vulnerable to poverty, with 15 males (60.0%) and 6 females (75.0%) in their respective age groups living below the poverty level.
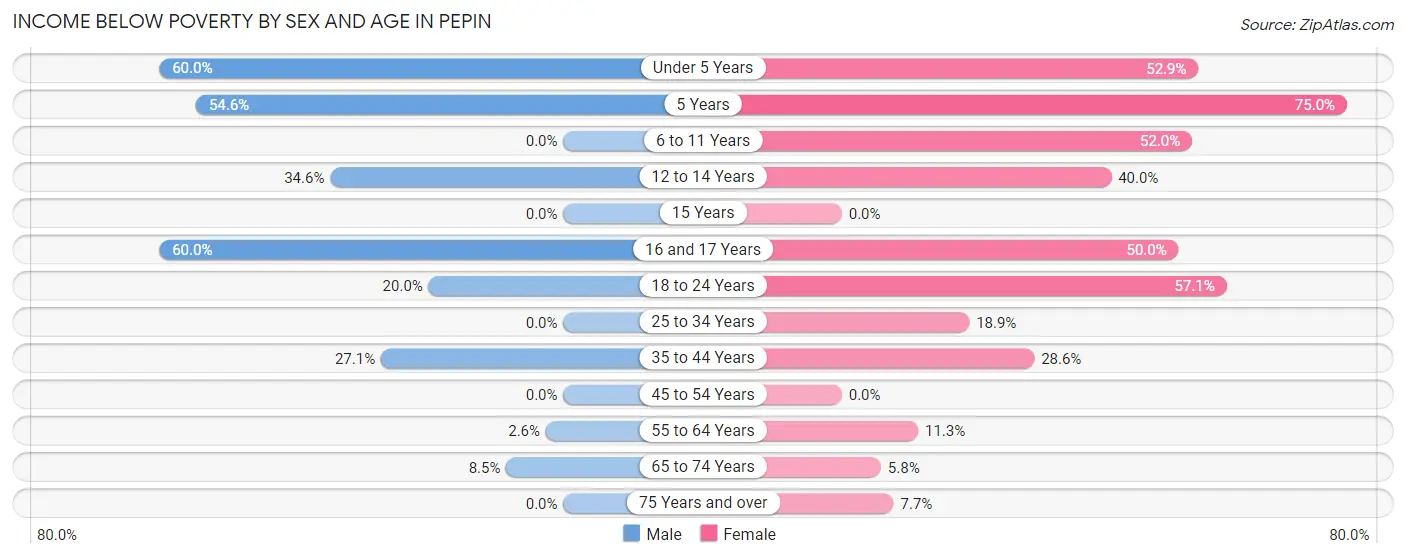
| Age Bracket | Male | Female |
| Under 5 Years | 15 (60.0%) | 9 (52.9%) |
| 5 Years | 6 (54.5%) | 6 (75.0%) |
| 6 to 11 Years | 0 (0.0%) | 13 (52.0%) |
| 12 to 14 Years | 9 (34.6%) | 2 (40.0%) |
| 15 Years | 0 (0.0%) | 0 (0.0%) |
| 16 and 17 Years | 3 (60.0%) | 4 (50.0%) |
| 18 to 24 Years | 7 (20.0%) | 8 (57.1%) |
| 25 to 34 Years | 0 (0.0%) | 7 (18.9%) |
| 35 to 44 Years | 13 (27.1%) | 8 (28.6%) |
| 45 to 54 Years | 0 (0.0%) | 0 (0.0%) |
| 55 to 64 Years | 2 (2.6%) | 6 (11.3%) |
| 65 to 74 Years | 5 (8.5%) | 5 (5.8%) |
| 75 Years and over | 0 (0.0%) | 2 (7.7%) |
| Total | 60 (14.7%) | 70 (18.5%) |
Income Above Poverty by Sex and Age in Pepin
According to the poverty statistics in Pepin, males aged 6 to 11 years and females aged 15 years are the age groups that are most secure financially, with 100.0% of males and 100.0% of females in these age groups living above the poverty line.
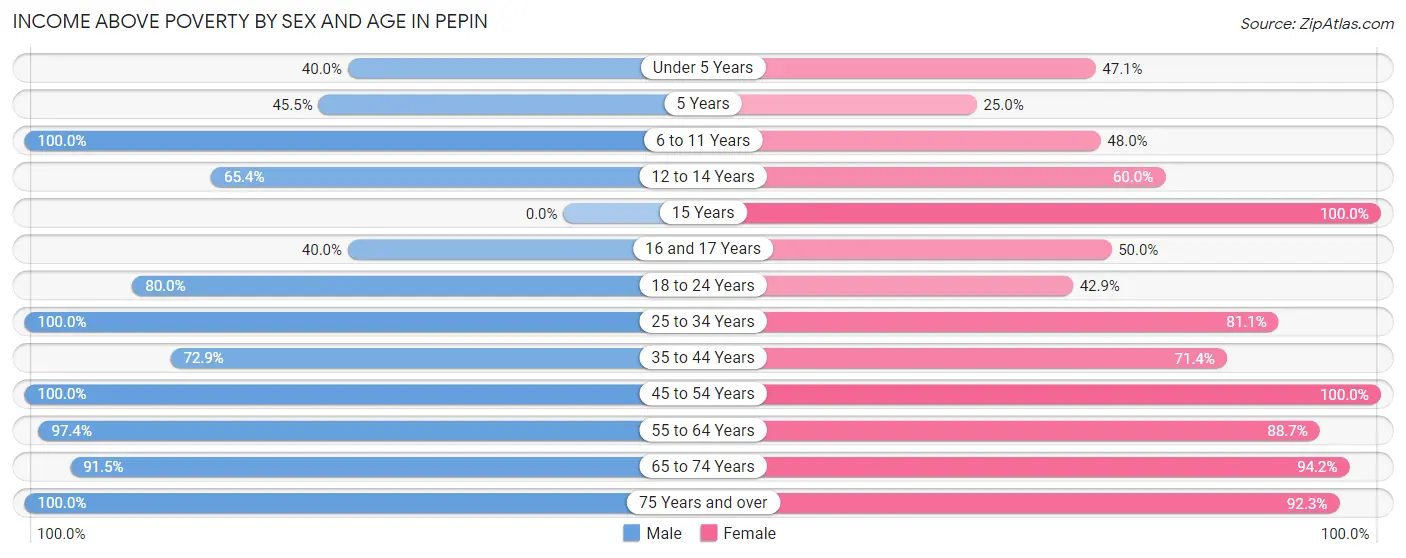
| Age Bracket | Male | Female |
| Under 5 Years | 10 (40.0%) | 8 (47.1%) |
| 5 Years | 5 (45.5%) | 2 (25.0%) |
| 6 to 11 Years | 9 (100.0%) | 12 (48.0%) |
| 12 to 14 Years | 17 (65.4%) | 3 (60.0%) |
| 15 Years | 0 (0.0%) | 7 (100.0%) |
| 16 and 17 Years | 2 (40.0%) | 4 (50.0%) |
| 18 to 24 Years | 28 (80.0%) | 6 (42.9%) |
| 25 to 34 Years | 29 (100.0%) | 30 (81.1%) |
| 35 to 44 Years | 35 (72.9%) | 20 (71.4%) |
| 45 to 54 Years | 59 (100.0%) | 64 (100.0%) |
| 55 to 64 Years | 75 (97.4%) | 47 (88.7%) |
| 65 to 74 Years | 54 (91.5%) | 81 (94.2%) |
| 75 Years and over | 24 (100.0%) | 24 (92.3%) |
| Total | 347 (85.3%) | 308 (81.5%) |
Income Below Poverty Among Married-Couple Families in Pepin
The poverty statistics for married-couple families in Pepin show that 6.8% or 11 of the total 162 families live below the poverty line. Families with 3 or 4 children have the highest poverty rate of 61.5%, comprising of 8 families. On the other hand, families with 1 or 2 children have the lowest poverty rate of 0.0%, which includes 0 families.
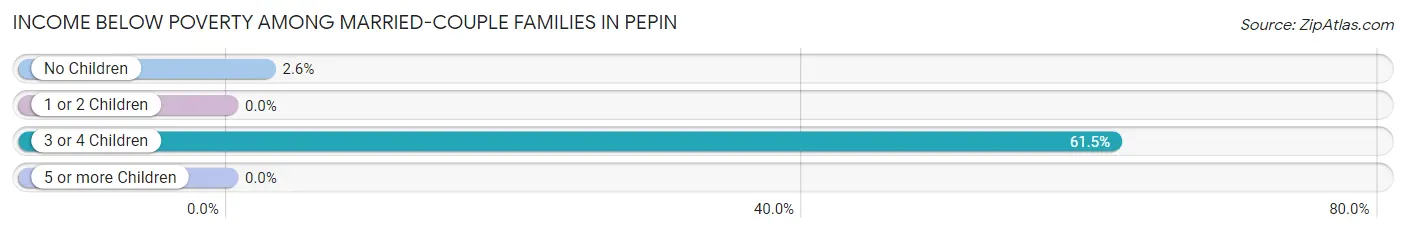
| Children | Above Poverty | Below Poverty |
| No Children | 112 (97.4%) | 3 (2.6%) |
| 1 or 2 Children | 34 (100.0%) | 0 (0.0%) |
| 3 or 4 Children | 5 (38.5%) | 8 (61.5%) |
| 5 or more Children | 0 (0.0%) | 0 (0.0%) |
| Total | 151 (93.2%) | 11 (6.8%) |
Income Below Poverty Among Single-Parent Households in Pepin
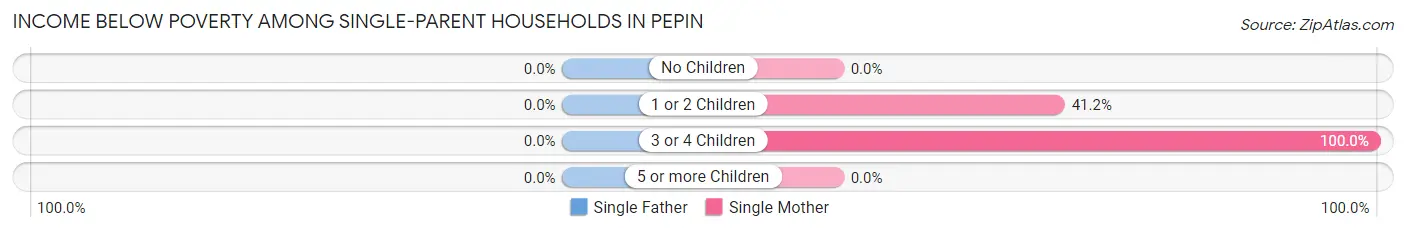
| Children | Single Father | Single Mother |
| No Children | 0 (0.0%) | 0 (0.0%) |
| 1 or 2 Children | 0 (0.0%) | 7 (41.2%) |
| 3 or 4 Children | 0 (0.0%) | 7 (100.0%) |
| 5 or more Children | 0 (0.0%) | 0 (0.0%) |
| Total | 0 (0.0%) | 14 (45.2%) |
Income Below Poverty Among Married-Couple vs Single-Parent Households in Pepin
The poverty data for Pepin shows that 11 of the married-couple family households (6.8%) and 14 of the single-parent households (29.8%) are living below the poverty level. Within the married-couple family households, those with 3 or 4 children have the highest poverty rate, with 8 households (61.5%) falling below the poverty line. Among the single-parent households, those with 3 or 4 children have the highest poverty rate, with 7 household (100.0%) living below poverty.
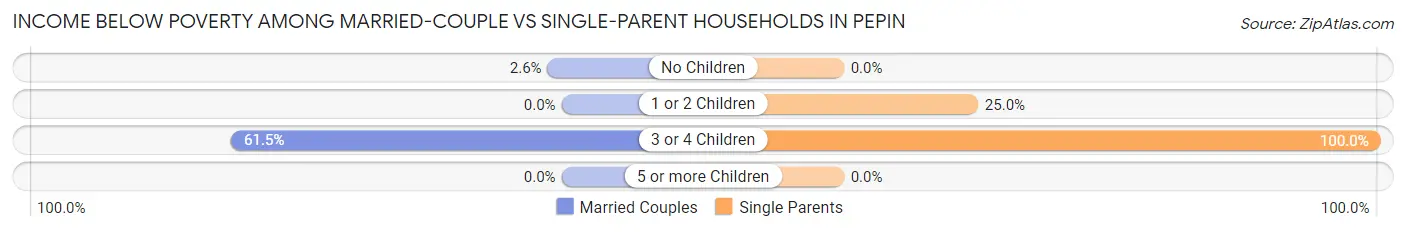
| Children | Married-Couple Families | Single-Parent Households |
| No Children | 3 (2.6%) | 0 (0.0%) |
| 1 or 2 Children | 0 (0.0%) | 7 (25.0%) |
| 3 or 4 Children | 8 (61.5%) | 7 (100.0%) |
| 5 or more Children | 0 (0.0%) | 0 (0.0%) |
| Total | 11 (6.8%) | 14 (29.8%) |
Race in Pepin
The most populous races in Pepin are White / Caucasian (769 | 93.4%), Two or more Races (37 | 4.5%), and Black / African American (11 | 1.3%).
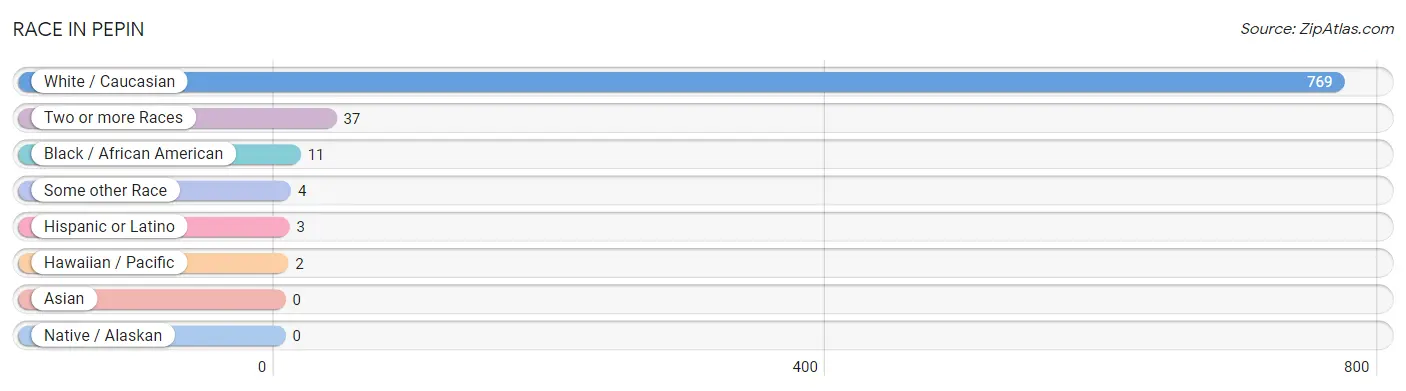
| Race | # Population | % Population |
| Asian | 0 | 0.0% |
| Black / African American | 11 | 1.3% |
| Hawaiian / Pacific | 2 | 0.2% |
| Hispanic or Latino | 3 | 0.4% |
| Native / Alaskan | 0 | 0.0% |
| White / Caucasian | 769 | 93.4% |
| Two or more Races | 37 | 4.5% |
| Some other Race | 4 | 0.5% |
| Total | 823 | 100.0% |
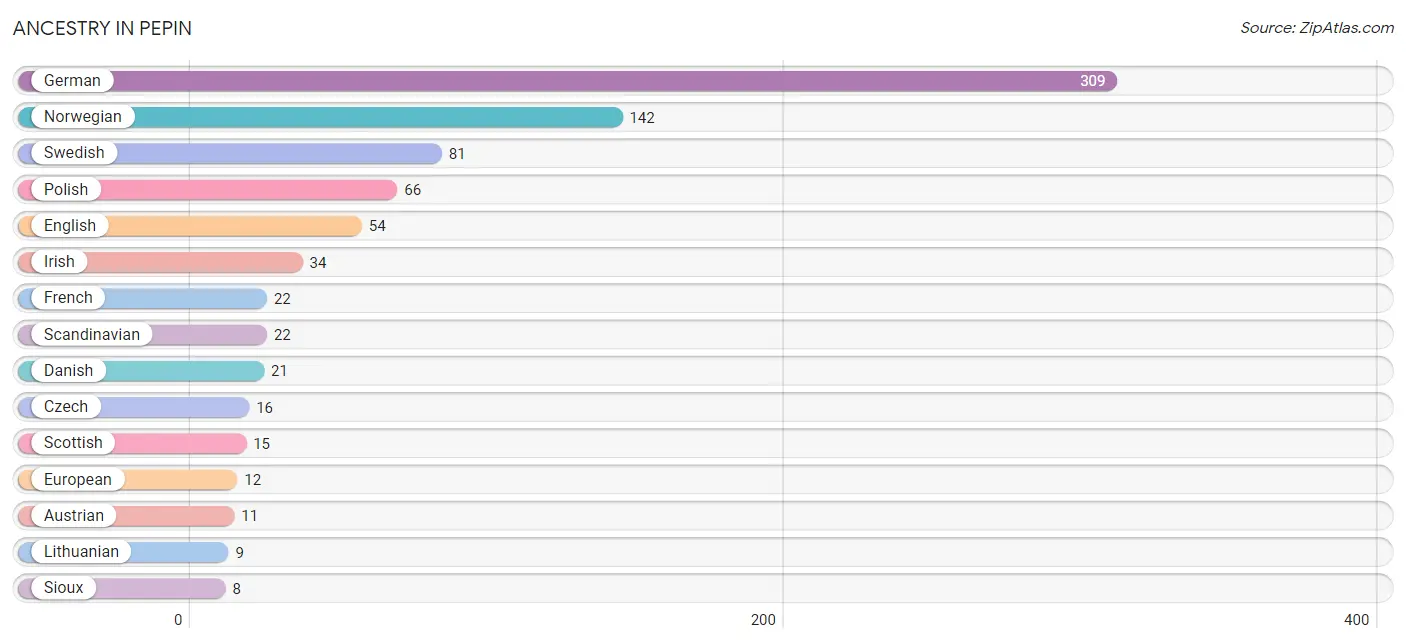
Ancestry in Pepin
The most populous ancestries reported in Pepin are German (309 | 37.6%), Norwegian (142 | 17.2%), Swedish (81 | 9.8%), Polish (66 | 8.0%), and English (54 | 6.6%), together accounting for 79.2% of all Pepin residents.
| Ancestry | # Population | % Population |
| American | 3 | 0.4% |
| Arab | 1 | 0.1% |
| Austrian | 11 | 1.3% |
| Brazilian | 3 | 0.4% |
| Chippewa | 2 | 0.2% |
| Czech | 16 | 1.9% |
| Danish | 21 | 2.5% |
| Dutch | 1 | 0.1% |
| English | 54 | 6.6% |
| Ethiopian | 2 | 0.2% |
| European | 12 | 1.5% |
| Finnish | 7 | 0.9% |
| French | 22 | 2.7% |
| French Canadian | 3 | 0.4% |
| German | 309 | 37.6% |
| Guamanian / Chamorro | 2 | 0.2% |
| Indian (Asian) | 5 | 0.6% |
| Irish | 34 | 4.1% |
| Italian | 2 | 0.2% |
| Jamaican | 7 | 0.9% |
| Lithuanian | 9 | 1.1% |
| Mexican | 3 | 0.4% |
| Moroccan | 1 | 0.1% |
| Norwegian | 142 | 17.2% |
| Polish | 66 | 8.0% |
| Russian | 6 | 0.7% |
| Scandinavian | 22 | 2.7% |
| Scottish | 15 | 1.8% |
| Sioux | 8 | 1.0% |
| Subsaharan African | 2 | 0.2% |
| Swedish | 81 | 9.8% |
| Swiss | 2 | 0.2% | View All 32 Rows |
Immigrants in Pepin
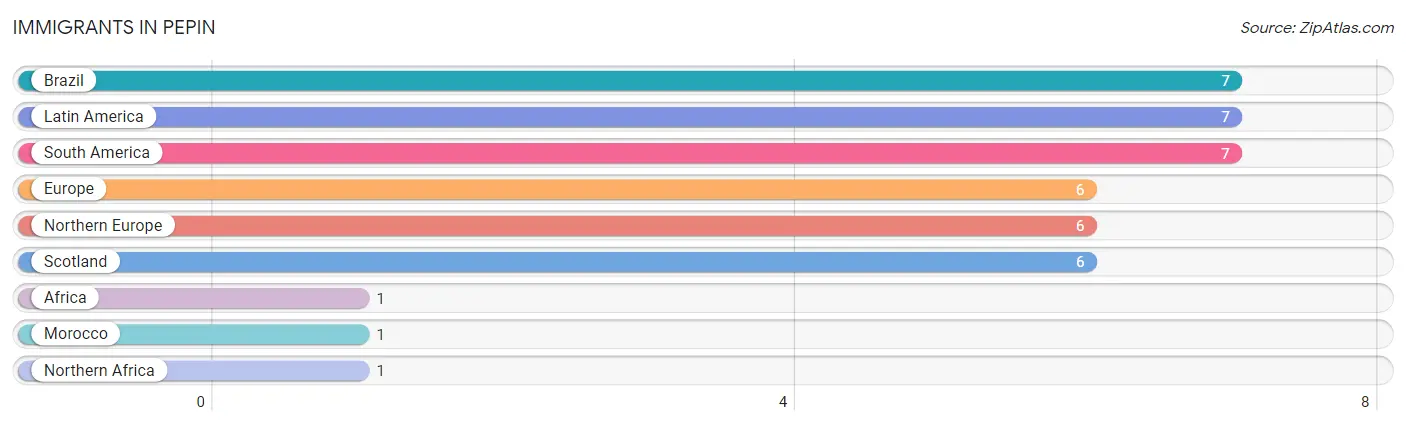
The most numerous immigrant groups reported in Pepin came from Brazil (7 | 0.9%), Latin America (7 | 0.9%), South America (7 | 0.9%), Europe (6 | 0.7%), and Northern Europe (6 | 0.7%), together accounting for 4.0% of all Pepin residents.
| Immigration Origin | # Population | % Population |
| Africa | 1 | 0.1% |
| Brazil | 7 | 0.9% |
| Europe | 6 | 0.7% |
| Latin America | 7 | 0.9% |
| Morocco | 1 | 0.1% |
| Northern Africa | 1 | 0.1% |
| Northern Europe | 6 | 0.7% |
| Scotland | 6 | 0.7% |
| South America | 7 | 0.9% | View All 9 Rows |
Sex and Age in Pepin
Sex and Age in Pepin
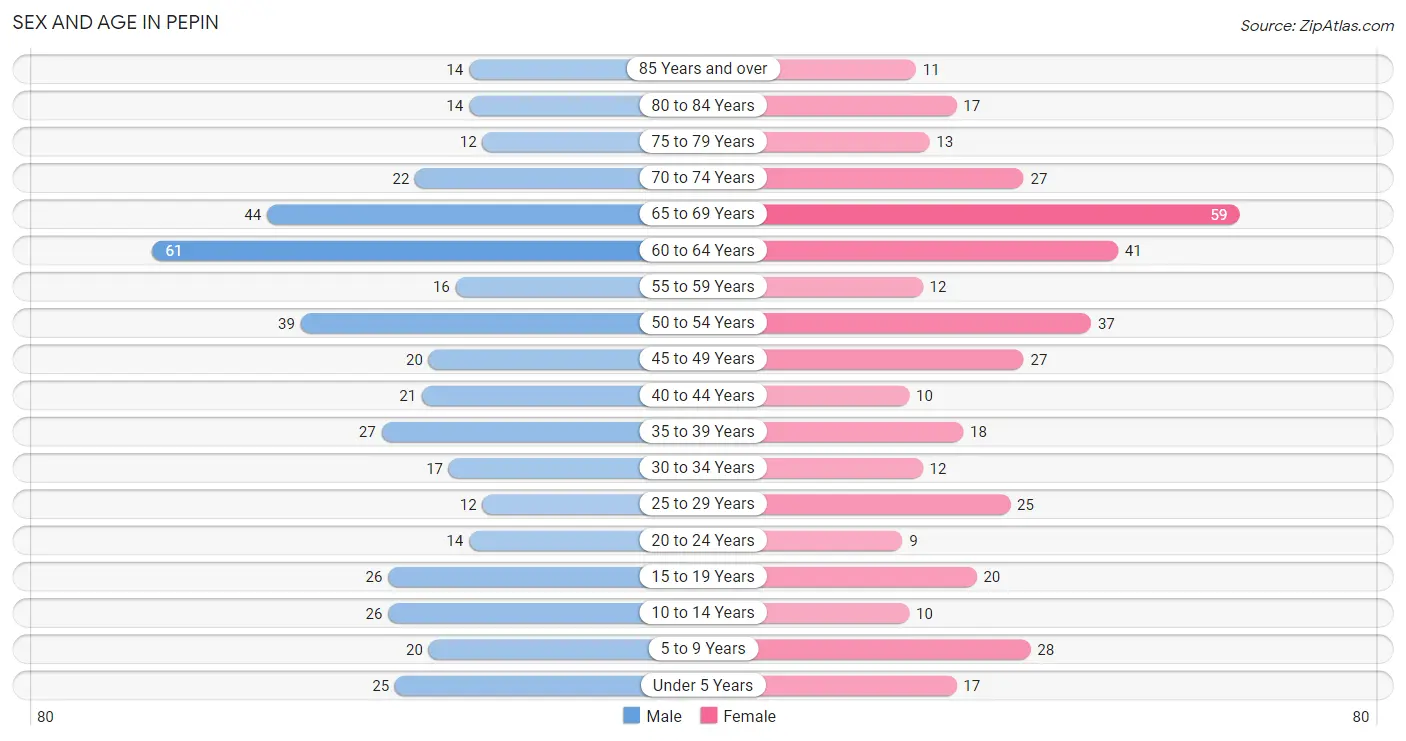
The most populous age groups in Pepin are 60 to 64 Years (61 | 14.2%) for men and 65 to 69 Years (59 | 15.0%) for women.
| Age Bracket | Male | Female |
| Under 5 Years | 25 (5.8%) | 17 (4.3%) |
| 5 to 9 Years | 20 (4.6%) | 28 (7.1%) |
| 10 to 14 Years | 26 (6.0%) | 10 (2.5%) |
| 15 to 19 Years | 26 (6.0%) | 20 (5.1%) |
| 20 to 24 Years | 14 (3.3%) | 9 (2.3%) |
| 25 to 29 Years | 12 (2.8%) | 25 (6.4%) |
| 30 to 34 Years | 17 (4.0%) | 12 (3.0%) |
| 35 to 39 Years | 27 (6.3%) | 18 (4.6%) |
| 40 to 44 Years | 21 (4.9%) | 10 (2.5%) |
| 45 to 49 Years | 20 (4.6%) | 27 (6.9%) |
| 50 to 54 Years | 39 (9.1%) | 37 (9.4%) |
| 55 to 59 Years | 16 (3.7%) | 12 (3.0%) |
| 60 to 64 Years | 61 (14.2%) | 41 (10.4%) |
| 65 to 69 Years | 44 (10.2%) | 59 (15.0%) |
| 70 to 74 Years | 22 (5.1%) | 27 (6.9%) |
| 75 to 79 Years | 12 (2.8%) | 13 (3.3%) |
| 80 to 84 Years | 14 (3.3%) | 17 (4.3%) |
| 85 Years and over | 14 (3.3%) | 11 (2.8%) |
| Total | 430 (100.0%) | 393 (100.0%) |
Families and Households in Pepin
Median Family Size in Pepin
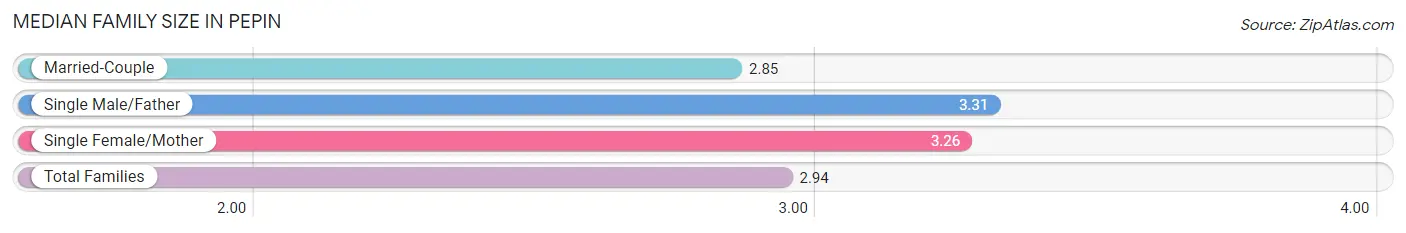
The median family size in Pepin is 2.94 persons per family, with single male/father families (16 | 7.7%) accounting for the largest median family size of 3.31 persons per family. On the other hand, married-couple families (162 | 77.5%) represent the smallest median family size with 2.85 persons per family.
| Family Type | # Families | Family Size |
| Married-Couple | 162 (77.5%) | 2.85 |
| Single Male/Father | 16 (7.7%) | 3.31 |
| Single Female/Mother | 31 (14.8%) | 3.26 |
| Total Families | 209 (100.0%) | 2.94 |
Median Household Size in Pepin
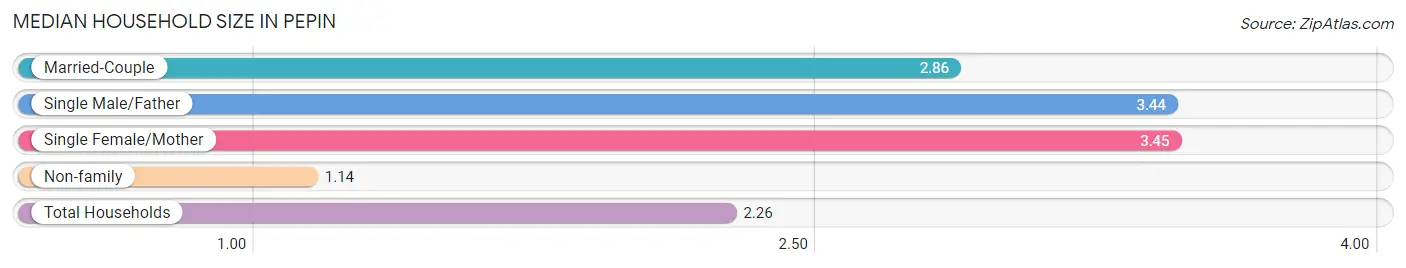
The median household size in Pepin is 2.26 persons per household, with single female/mother households (31 | 8.9%) accounting for the largest median household size of 3.45 persons per household. non-family households (139 | 39.9%) represent the smallest median household size with 1.14 persons per household.
| Household Type | # Households | Household Size |
| Married-Couple | 162 (46.6%) | 2.86 |
| Single Male/Father | 16 (4.6%) | 3.44 |
| Single Female/Mother | 31 (8.9%) | 3.45 |
| Non-family | 139 (39.9%) | 1.14 |
| Total Households | 348 (100.0%) | 2.26 |
Household Size by Marriage Status in Pepin
Out of a total of 348 households in Pepin, 209 (60.1%) are family households, while 139 (39.9%) are nonfamily households. The most numerous type of family households are 2-person households, comprising 123, and the most common type of nonfamily households are 1-person households, comprising 121.
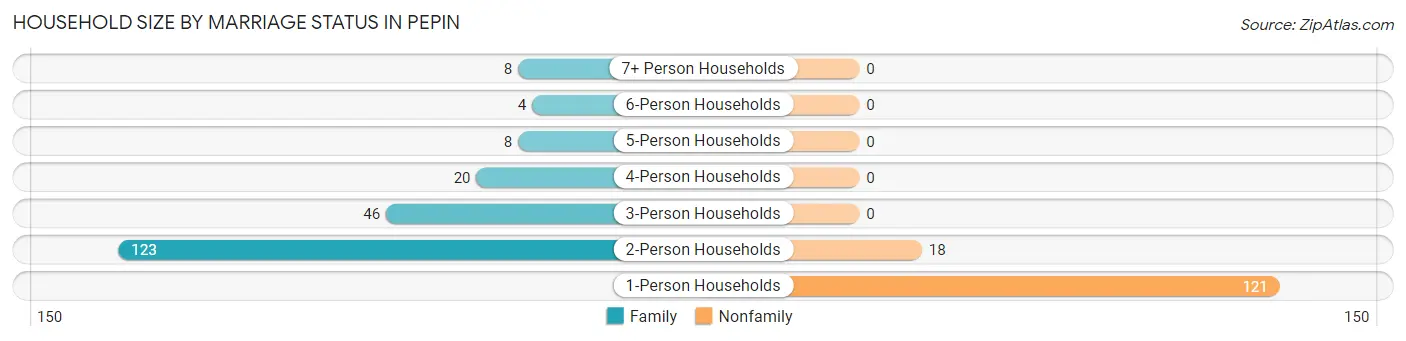
| Household Size | Family Households | Nonfamily Households |
| 1-Person Households | - | 121 (34.8%) |
| 2-Person Households | 123 (35.3%) | 18 (5.2%) |
| 3-Person Households | 46 (13.2%) | 0 (0.0%) |
| 4-Person Households | 20 (5.8%) | 0 (0.0%) |
| 5-Person Households | 8 (2.3%) | 0 (0.0%) |
| 6-Person Households | 4 (1.1%) | 0 (0.0%) |
| 7+ Person Households | 8 (2.3%) | 0 (0.0%) |
| Total | 209 (60.1%) | 139 (39.9%) |
Female Fertility in Pepin
Fertility by Age in Pepin
Average fertility rate in Pepin is 52.0 births per 1,000 women. Women in the age bracket of 20 to 34 years have the highest fertility rate with 152.0 births per 1,000 women. Women in the age bracket of 20 to 34 years acount for 100.0% of all women with births.
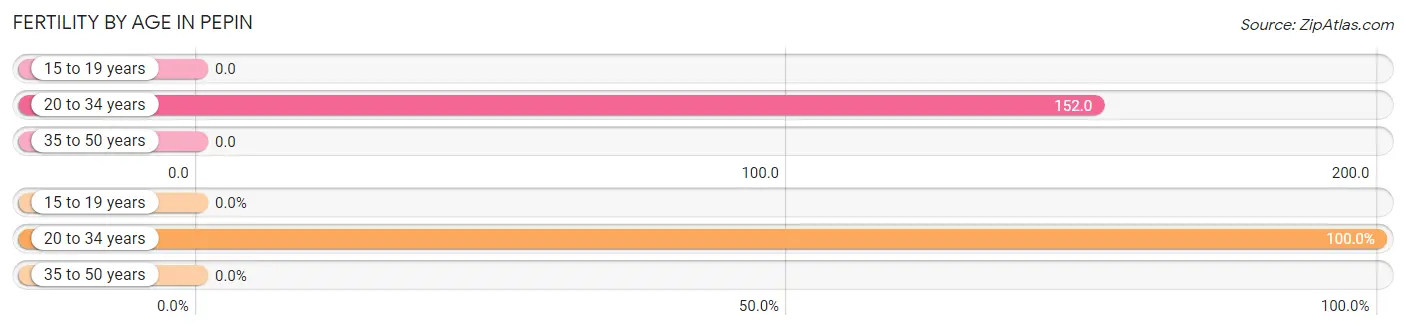
| Age Bracket | Women with Births | Births / 1,000 Women |
| 15 to 19 years | 0 (0.0%) | 0.0 |
| 20 to 34 years | 7 (100.0%) | 152.0 |
| 35 to 50 years | 0 (0.0%) | 0.0 |
| Total | 7 (100.0%) | 52.0 |
Fertility by Age by Marriage Status in Pepin
42.9% of women with births (7) in Pepin are married. The highest percentage of unmarried women with births falls into 20 to 34 years age bracket with 57.1% of them unmarried at the time of birth, while the lowest percentage of unmarried women with births belong to 20 to 34 years age bracket with 57.1% of them unmarried.
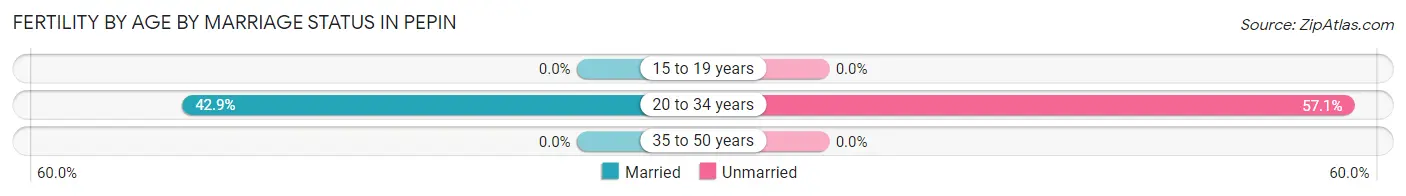
| Age Bracket | Married | Unmarried |
| 15 to 19 years | 0 (0.0%) | 0 (0.0%) |
| 20 to 34 years | 3 (42.9%) | 4 (57.1%) |
| 35 to 50 years | 0 (0.0%) | 0 (0.0%) |
| Total | 3 (42.9%) | 4 (57.1%) |
Fertility by Education in Pepin
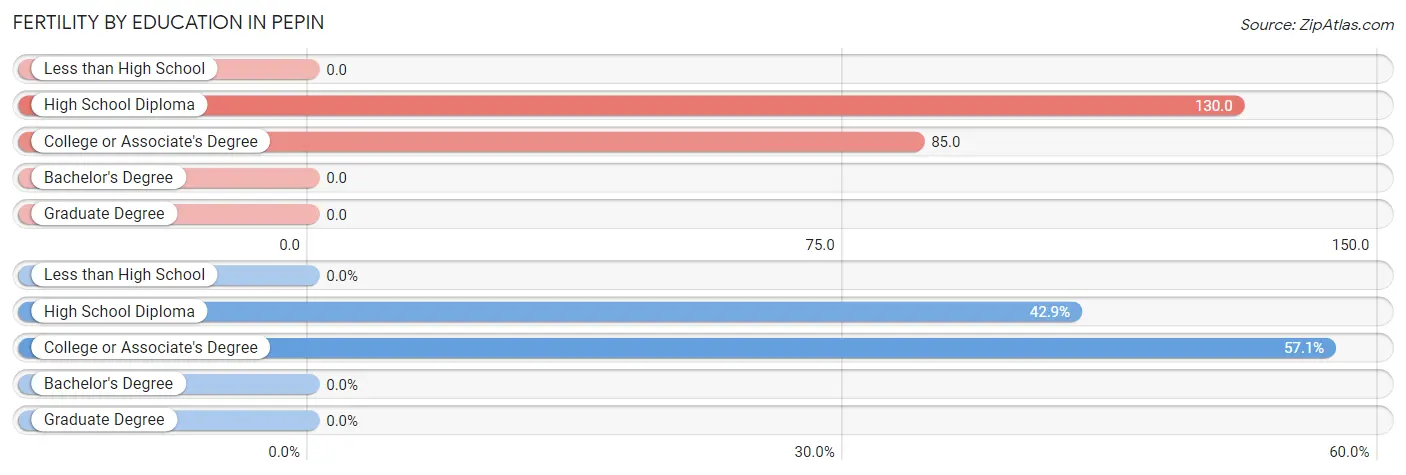
| Educational Attainment | Women with Births | Births / 1,000 Women |
| Less than High School | 0 (0.0%) | 0.0 |
| High School Diploma | 3 (42.9%) | 130.0 |
| College or Associate's Degree | 4 (57.1%) | 85.0 |
| Bachelor's Degree | 0 (0.0%) | 0.0 |
| Graduate Degree | 0 (0.0%) | 0.0 |
| Total | 7 (100.0%) | 52.0 |
Fertility by Education by Marriage Status in Pepin
57.1% of women with births in Pepin are unmarried. Women with the educational attainment of high school diploma are most likely to be married with 100.0% of them married at childbirth, while women with the educational attainment of college or associate's degree are least likely to be married with 100.0% of them unmarried at childbirth.
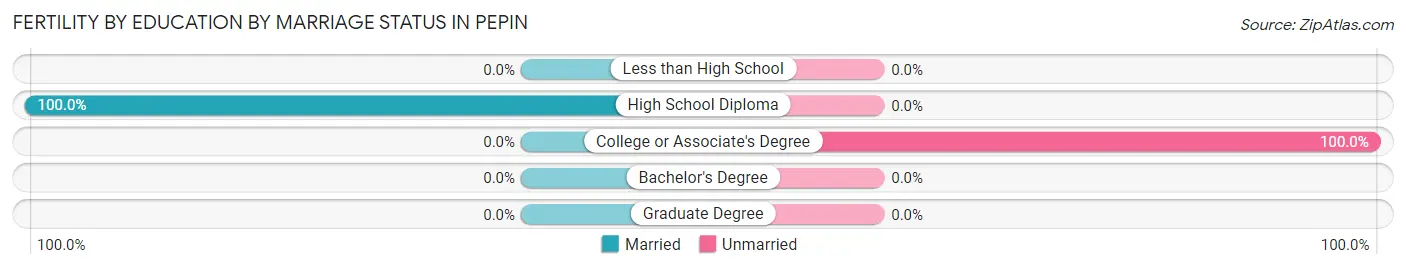
| Educational Attainment | Married | Unmarried |
| Less than High School | 0 (0.0%) | 0 (0.0%) |
| High School Diploma | 3 (100.0%) | 0 (0.0%) |
| College or Associate's Degree | 0 (0.0%) | 4 (100.0%) |
| Bachelor's Degree | 0 (0.0%) | 0 (0.0%) |
| Graduate Degree | 0 (0.0%) | 0 (0.0%) |
| Total | 3 (42.9%) | 4 (57.1%) |
Employment Characteristics in Pepin
Employment by Class of Employer in Pepin
Among the 383 employed individuals in Pepin, private company employees (242 | 63.2%), local government employees (52 | 13.6%), and self-employed (not incorporated) (43 | 11.2%) make up the most common classes of employment.
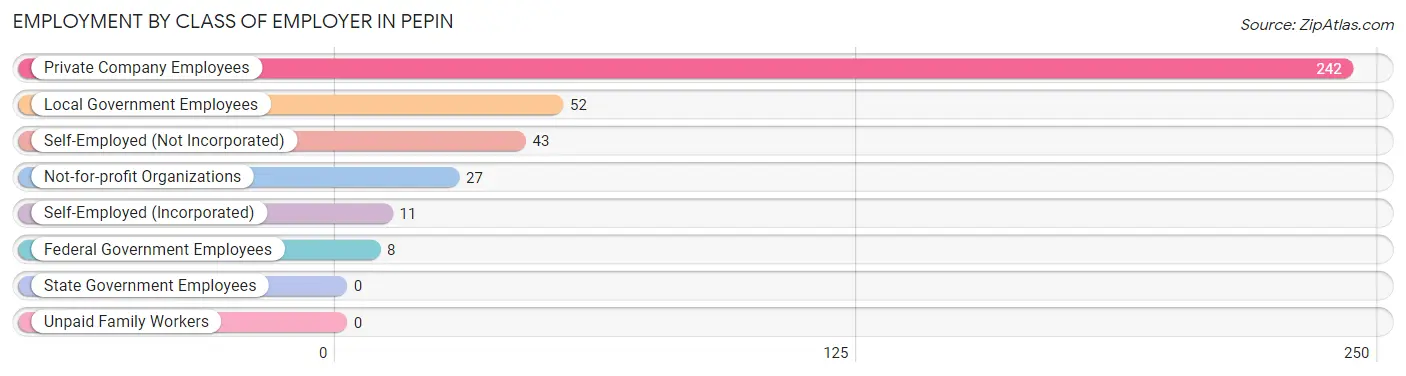
| Employer Class | # Employees | % Employees |
| Private Company Employees | 242 | 63.2% |
| Self-Employed (Incorporated) | 11 | 2.9% |
| Self-Employed (Not Incorporated) | 43 | 11.2% |
| Not-for-profit Organizations | 27 | 7.0% |
| Local Government Employees | 52 | 13.6% |
| State Government Employees | 0 | 0.0% |
| Federal Government Employees | 8 | 2.1% |
| Unpaid Family Workers | 0 | 0.0% |
| Total | 383 | 100.0% |
Employment Status by Age in Pepin
According to the labor force statistics for Pepin, out of the total population over 16 years of age (690), 57.7% or 398 individuals are in the labor force, with 3.0% or 12 of them unemployed. The age group with the highest labor force participation rate is 45 to 54 years, with 100.0% or 123 individuals in the labor force. Within the labor force, the 35 to 44 years age range has the highest percentage of unemployed individuals, with 9.1% or 5 of them being unemployed.
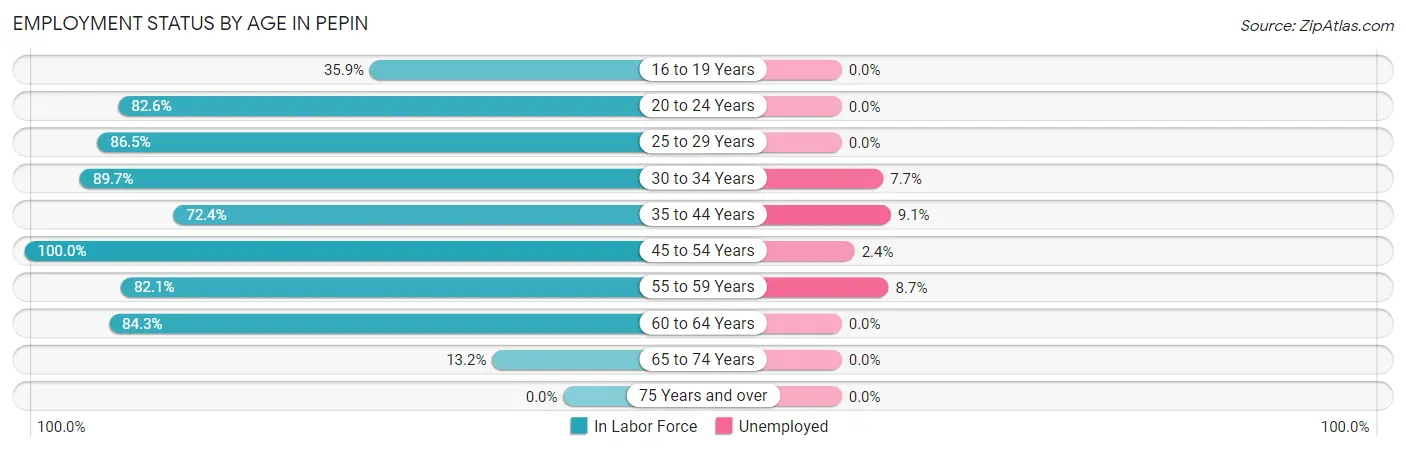
| Age Bracket | In Labor Force | Unemployed |
| 16 to 19 Years | 14 (35.9%) | 0 (0.0%) |
| 20 to 24 Years | 19 (82.6%) | 0 (0.0%) |
| 25 to 29 Years | 32 (86.5%) | 0 (0.0%) |
| 30 to 34 Years | 26 (89.7%) | 2 (7.7%) |
| 35 to 44 Years | 55 (72.4%) | 5 (9.1%) |
| 45 to 54 Years | 123 (100.0%) | 3 (2.4%) |
| 55 to 59 Years | 23 (82.1%) | 2 (8.7%) |
| 60 to 64 Years | 86 (84.3%) | 0 (0.0%) |
| 65 to 74 Years | 20 (13.2%) | 0 (0.0%) |
| 75 Years and over | 0 (0.0%) | 0 (0.0%) |
| Total | 398 (57.7%) | 12 (3.0%) |
Employment Status by Educational Attainment in Pepin
According to labor force statistics for Pepin, 87.3% of individuals (345) out of the total population between 25 and 64 years of age (395) are in the labor force, with 3.5% or 12 of them being unemployed. The group with the highest labor force participation rate are those with the educational attainment of bachelor's degree or higher, with 93.8% or 91 individuals in the labor force. Within the labor force, individuals with college / associate degree education have the highest percentage of unemployment, with 9.5% or 12 of them being unemployed.
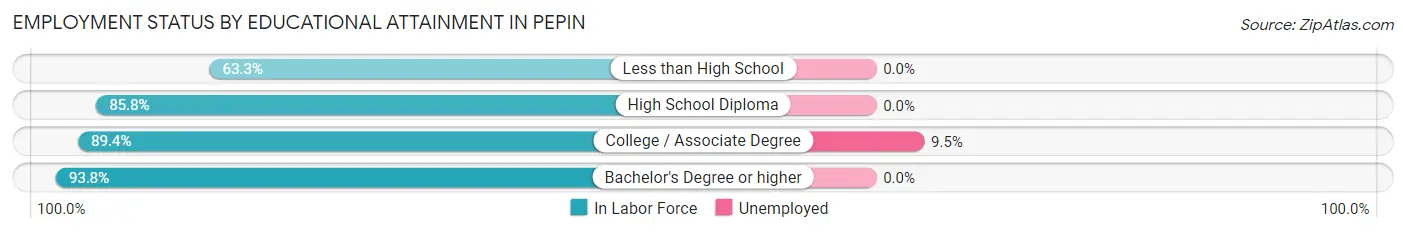
| Educational Attainment | In Labor Force | Unemployed |
| Less than High School | 19 (63.3%) | 0 (0.0%) |
| High School Diploma | 109 (85.8%) | 0 (0.0%) |
| College / Associate Degree | 126 (89.4%) | 13 (9.5%) |
| Bachelor's Degree or higher | 91 (93.8%) | 0 (0.0%) |
| Total | 345 (87.3%) | 14 (3.5%) |
Employment Occupations by Sex in Pepin
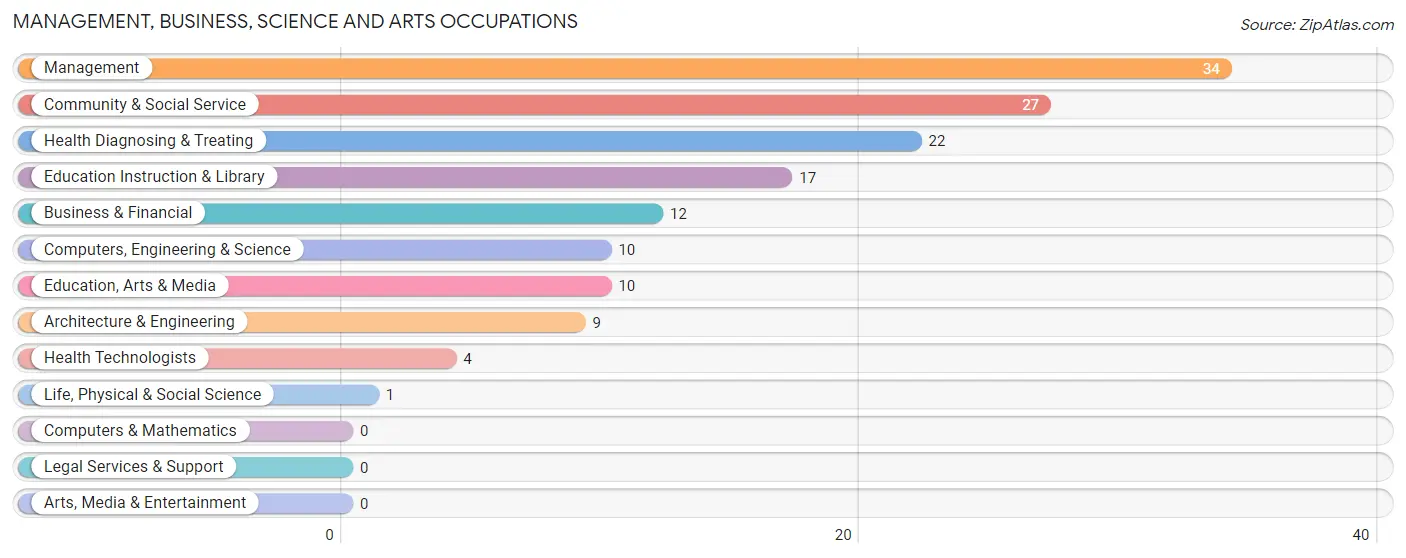
Management, Business, Science and Arts Occupations
The most common Management, Business, Science and Arts occupations in Pepin are Management (34 | 8.8%), Community & Social Service (27 | 7.0%), Health Diagnosing & Treating (22 | 5.7%), Education Instruction & Library (17 | 4.4%), and Business & Financial (12 | 3.1%).
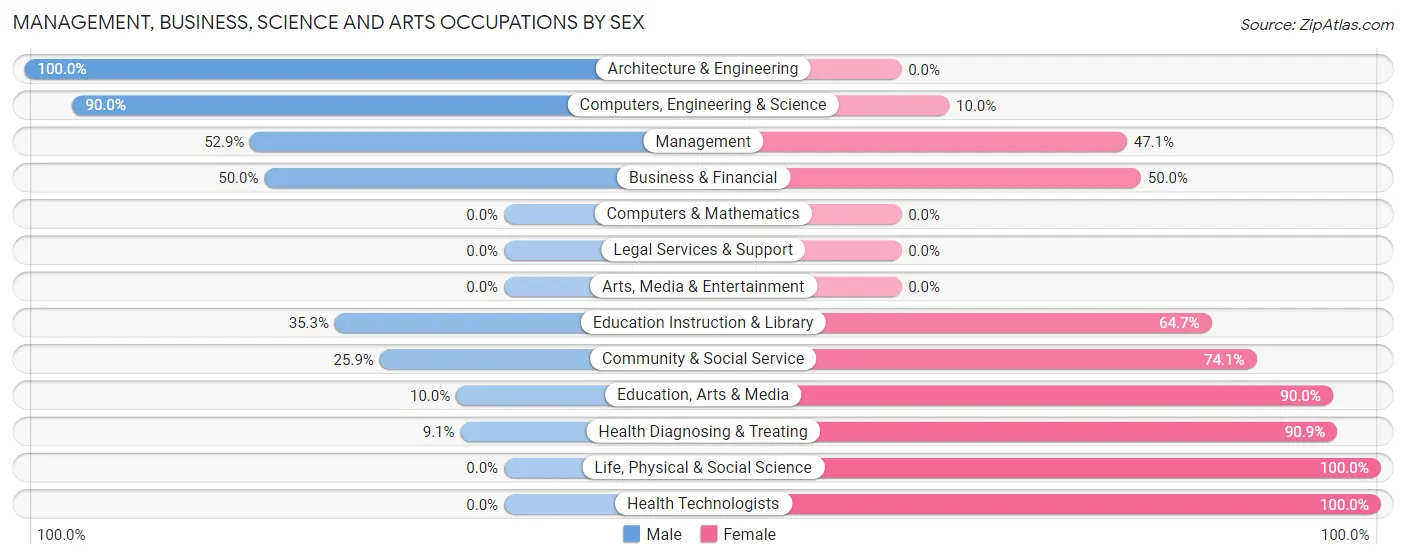
Management, Business, Science and Arts Occupations by Sex
Within the Management, Business, Science and Arts occupations in Pepin, the most male-oriented occupations are Architecture & Engineering (100.0%), Computers, Engineering & Science (90.0%), and Management (52.9%), while the most female-oriented occupations are Life, Physical & Social Science (100.0%), Health Technologists (100.0%), and Health Diagnosing & Treating (90.9%).
| Occupation | Male | Female |
| Management | 18 (52.9%) | 16 (47.1%) |
| Business & Financial | 6 (50.0%) | 6 (50.0%) |
| Computers, Engineering & Science | 9 (90.0%) | 1 (10.0%) |
| Computers & Mathematics | 0 (0.0%) | 0 (0.0%) |
| Architecture & Engineering | 9 (100.0%) | 0 (0.0%) |
| Life, Physical & Social Science | 0 (0.0%) | 1 (100.0%) |
| Community & Social Service | 7 (25.9%) | 20 (74.1%) |
| Education, Arts & Media | 1 (10.0%) | 9 (90.0%) |
| Legal Services & Support | 0 (0.0%) | 0 (0.0%) |
| Education Instruction & Library | 6 (35.3%) | 11 (64.7%) |
| Arts, Media & Entertainment | 0 (0.0%) | 0 (0.0%) |
| Health Diagnosing & Treating | 2 (9.1%) | 20 (90.9%) |
| Health Technologists | 0 (0.0%) | 4 (100.0%) |
| Total (Category) | 42 (40.0%) | 63 (60.0%) |
| Total (Overall) | 205 (53.1%) | 181 (46.9%) |
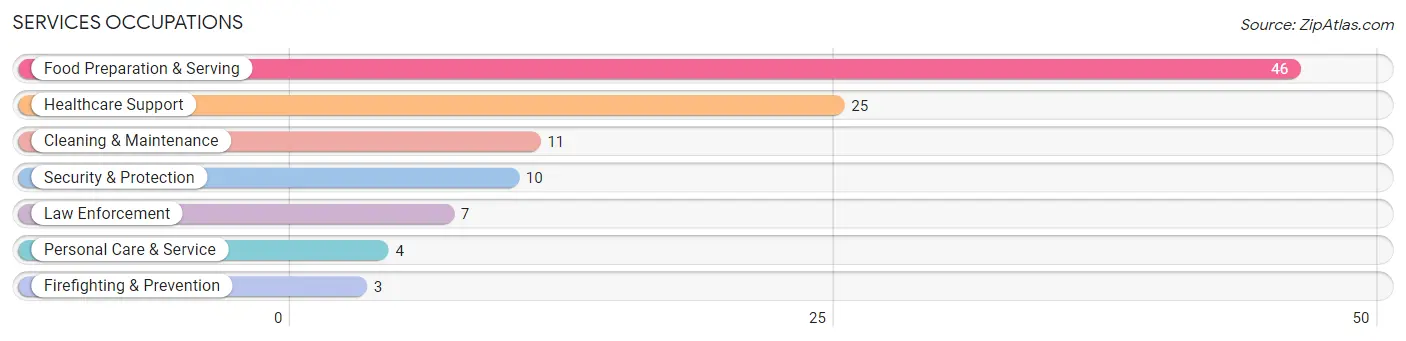
Services Occupations
The most common Services occupations in Pepin are Food Preparation & Serving (46 | 11.9%), Healthcare Support (25 | 6.5%), Cleaning & Maintenance (11 | 2.9%), Security & Protection (10 | 2.6%), and Law Enforcement (7 | 1.8%).
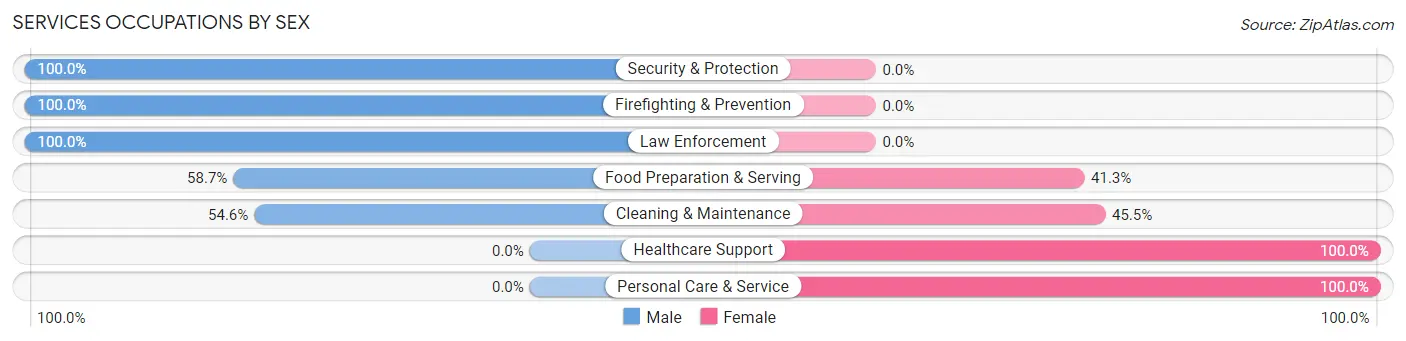
Services Occupations by Sex
Within the Services occupations in Pepin, the most male-oriented occupations are Security & Protection (100.0%), Firefighting & Prevention (100.0%), and Law Enforcement (100.0%), while the most female-oriented occupations are Healthcare Support (100.0%), Personal Care & Service (100.0%), and Cleaning & Maintenance (45.5%).
| Occupation | Male | Female |
| Healthcare Support | 0 (0.0%) | 25 (100.0%) |
| Security & Protection | 10 (100.0%) | 0 (0.0%) |
| Firefighting & Prevention | 3 (100.0%) | 0 (0.0%) |
| Law Enforcement | 7 (100.0%) | 0 (0.0%) |
| Food Preparation & Serving | 27 (58.7%) | 19 (41.3%) |
| Cleaning & Maintenance | 6 (54.5%) | 5 (45.5%) |
| Personal Care & Service | 0 (0.0%) | 4 (100.0%) |
| Total (Category) | 43 (44.8%) | 53 (55.2%) |
| Total (Overall) | 205 (53.1%) | 181 (46.9%) |
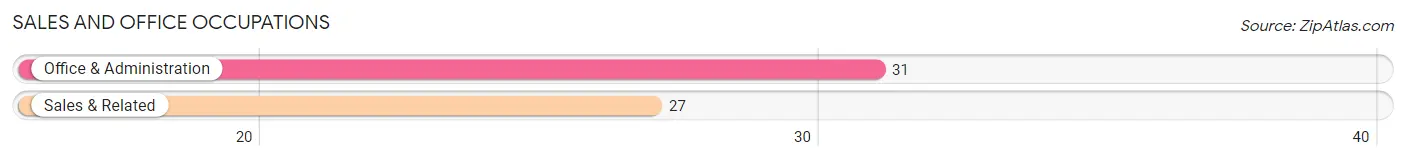
Sales and Office Occupations
The most common Sales and Office occupations in Pepin are Office & Administration (31 | 8.0%), and Sales & Related (27 | 7.0%).
Sales and Office Occupations by Sex
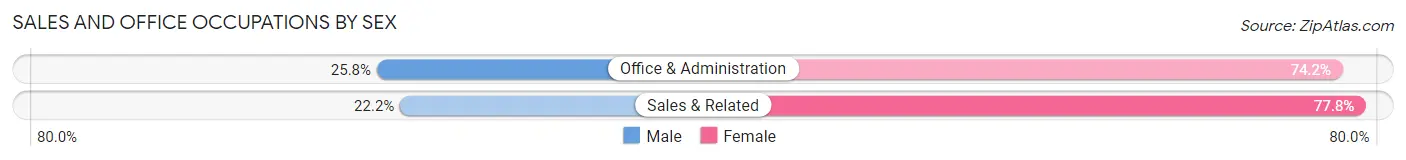
| Occupation | Male | Female |
| Sales & Related | 6 (22.2%) | 21 (77.8%) |
| Office & Administration | 8 (25.8%) | 23 (74.2%) |
| Total (Category) | 14 (24.1%) | 44 (75.9%) |
| Total (Overall) | 205 (53.1%) | 181 (46.9%) |
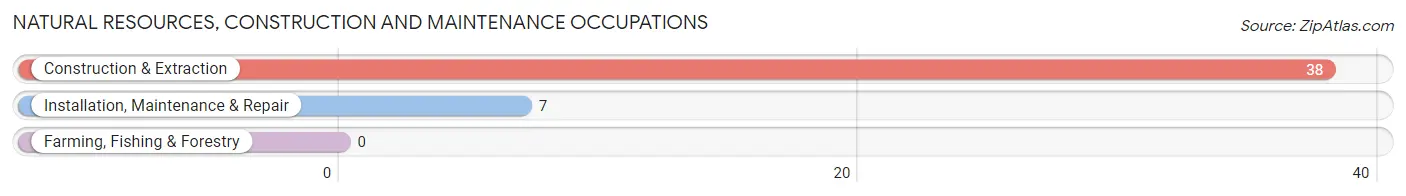
Natural Resources, Construction and Maintenance Occupations
The most common Natural Resources, Construction and Maintenance occupations in Pepin are Construction & Extraction (38 | 9.8%), and Installation, Maintenance & Repair (7 | 1.8%).
Natural Resources, Construction and Maintenance Occupations by Sex
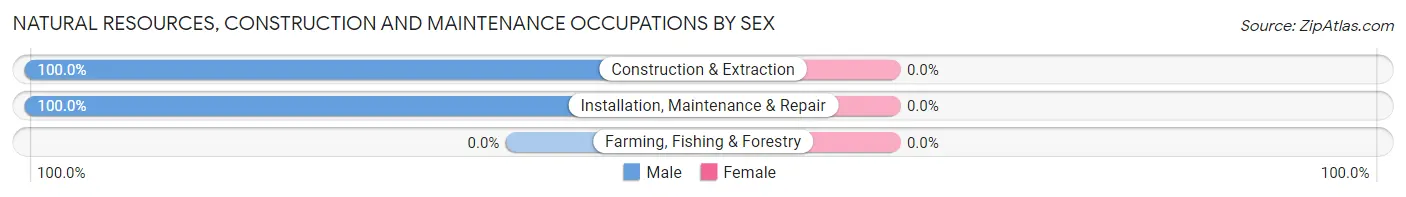
| Occupation | Male | Female |
| Farming, Fishing & Forestry | 0 (0.0%) | 0 (0.0%) |
| Construction & Extraction | 38 (100.0%) | 0 (0.0%) |
| Installation, Maintenance & Repair | 7 (100.0%) | 0 (0.0%) |
| Total (Category) | 45 (100.0%) | 0 (0.0%) |
| Total (Overall) | 205 (53.1%) | 181 (46.9%) |
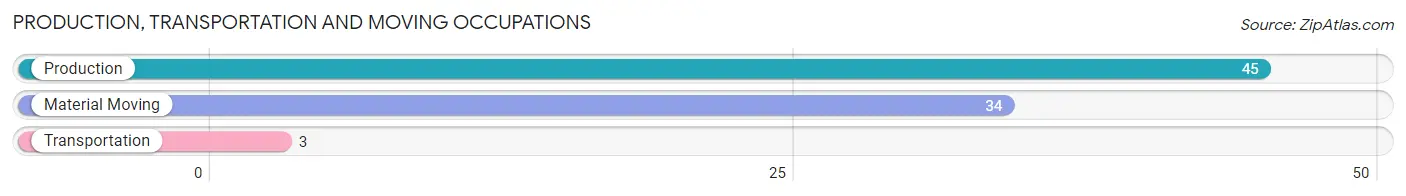
Production, Transportation and Moving Occupations
The most common Production, Transportation and Moving occupations in Pepin are Production (45 | 11.7%), Material Moving (34 | 8.8%), and Transportation (3 | 0.8%).
Production, Transportation and Moving Occupations by Sex
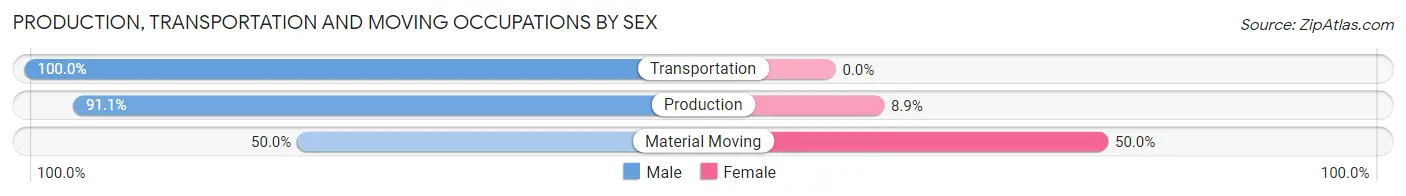
| Occupation | Male | Female |
| Production | 41 (91.1%) | 4 (8.9%) |
| Transportation | 3 (100.0%) | 0 (0.0%) |
| Material Moving | 17 (50.0%) | 17 (50.0%) |
| Total (Category) | 61 (74.4%) | 21 (25.6%) |
| Total (Overall) | 205 (53.1%) | 181 (46.9%) |
Employment Industries by Sex in Pepin
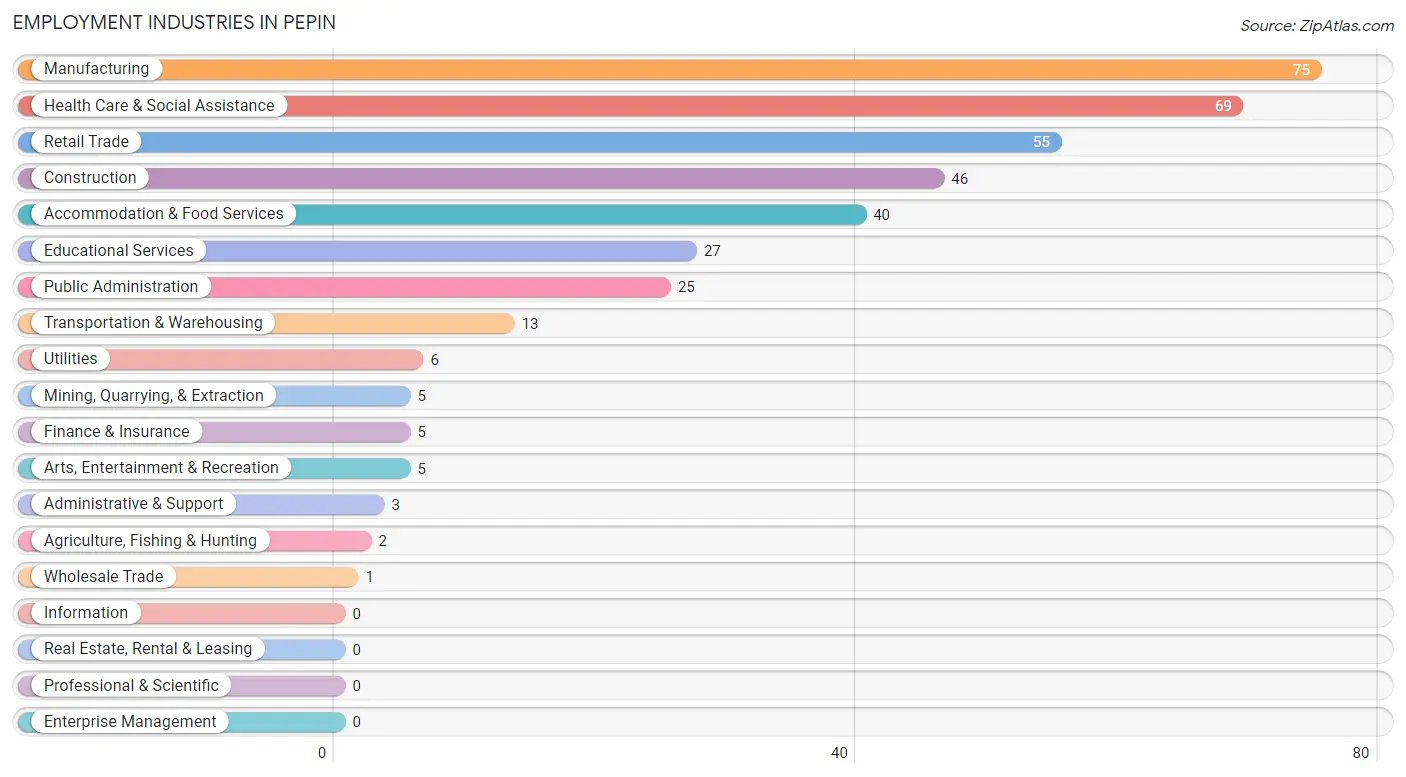
Employment Industries in Pepin
The major employment industries in Pepin include Manufacturing (75 | 19.4%), Health Care & Social Assistance (69 | 17.9%), Retail Trade (55 | 14.2%), Construction (46 | 11.9%), and Accommodation & Food Services (40 | 10.4%).
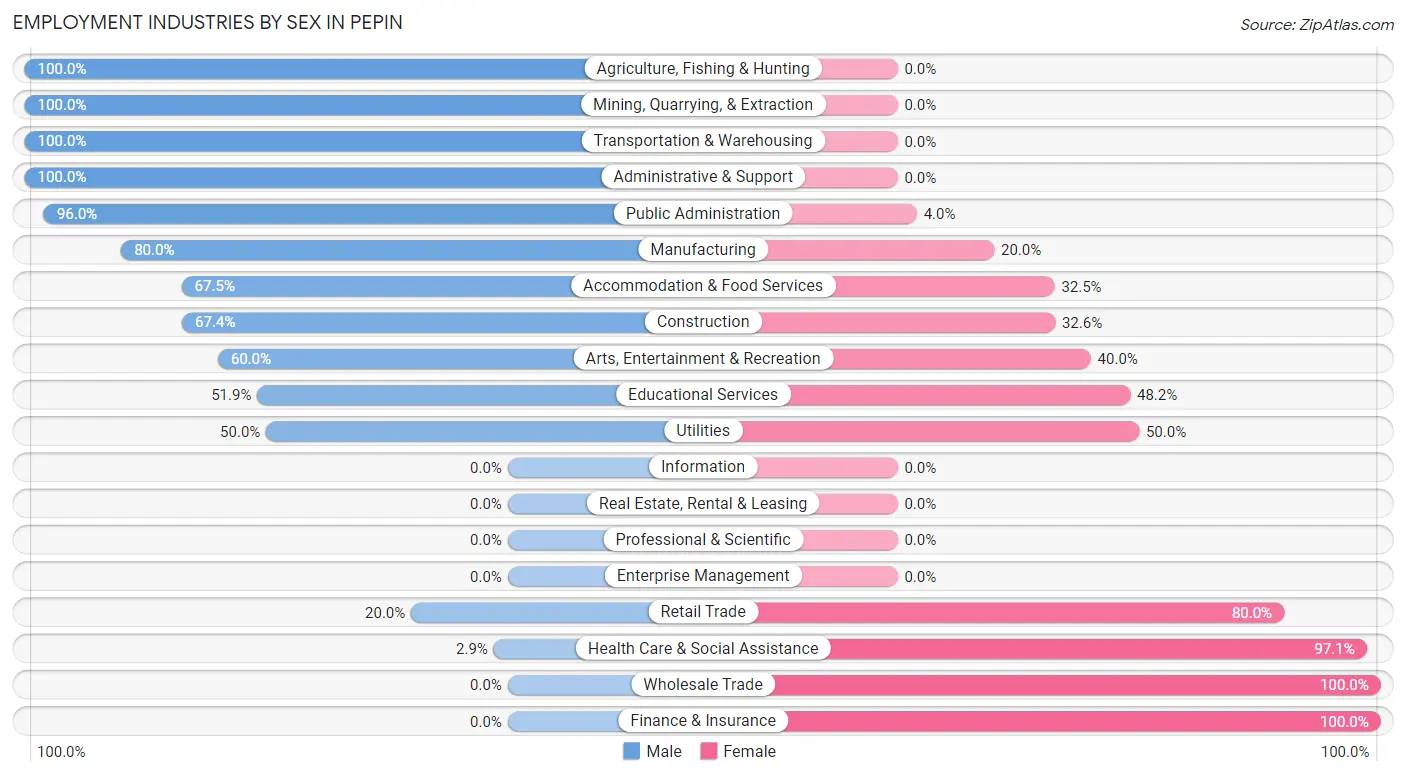
Employment Industries by Sex in Pepin
The Pepin industries that see more men than women are Agriculture, Fishing & Hunting (100.0%), Mining, Quarrying, & Extraction (100.0%), and Transportation & Warehousing (100.0%), whereas the industries that tend to have a higher number of women are Wholesale Trade (100.0%), Finance & Insurance (100.0%), and Health Care & Social Assistance (97.1%).
| Industry | Male | Female |
| Agriculture, Fishing & Hunting | 2 (100.0%) | 0 (0.0%) |
| Mining, Quarrying, & Extraction | 5 (100.0%) | 0 (0.0%) |
| Construction | 31 (67.4%) | 15 (32.6%) |
| Manufacturing | 60 (80.0%) | 15 (20.0%) |
| Wholesale Trade | 0 (0.0%) | 1 (100.0%) |
| Retail Trade | 11 (20.0%) | 44 (80.0%) |
| Transportation & Warehousing | 13 (100.0%) | 0 (0.0%) |
| Utilities | 3 (50.0%) | 3 (50.0%) |
| Information | 0 (0.0%) | 0 (0.0%) |
| Finance & Insurance | 0 (0.0%) | 5 (100.0%) |
| Real Estate, Rental & Leasing | 0 (0.0%) | 0 (0.0%) |
| Professional & Scientific | 0 (0.0%) | 0 (0.0%) |
| Enterprise Management | 0 (0.0%) | 0 (0.0%) |
| Administrative & Support | 3 (100.0%) | 0 (0.0%) |
| Educational Services | 14 (51.8%) | 13 (48.1%) |
| Health Care & Social Assistance | 2 (2.9%) | 67 (97.1%) |
| Arts, Entertainment & Recreation | 3 (60.0%) | 2 (40.0%) |
| Accommodation & Food Services | 27 (67.5%) | 13 (32.5%) |
| Public Administration | 24 (96.0%) | 1 (4.0%) |
| Total | 205 (53.1%) | 181 (46.9%) |
Education in Pepin
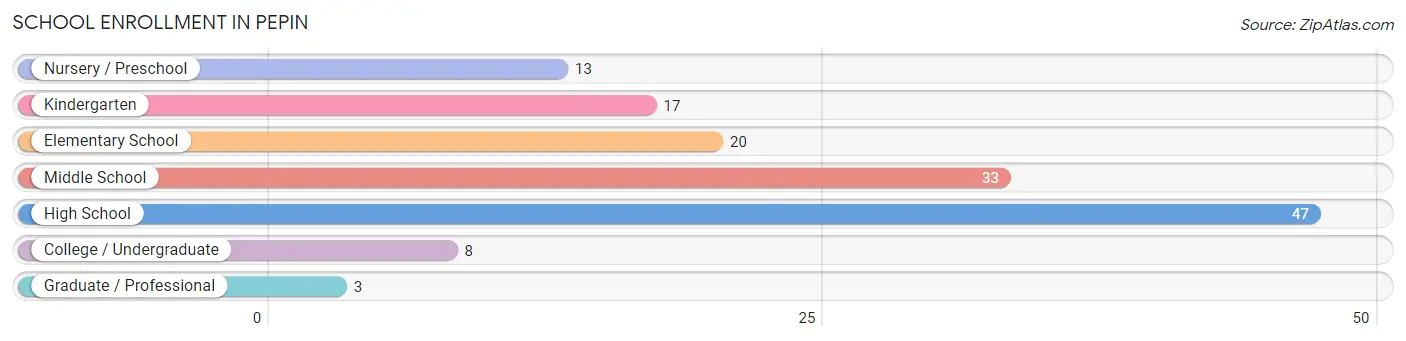
School Enrollment in Pepin
The most common levels of schooling among the 141 students in Pepin are high school (47 | 33.3%), middle school (33 | 23.4%), and elementary school (20 | 14.2%).
| School Level | # Students | % Students |
| Nursery / Preschool | 13 | 9.2% |
| Kindergarten | 17 | 12.1% |
| Elementary School | 20 | 14.2% |
| Middle School | 33 | 23.4% |
| High School | 47 | 33.3% |
| College / Undergraduate | 8 | 5.7% |
| Graduate / Professional | 3 | 2.1% |
| Total | 141 | 100.0% |
School Enrollment by Age by Funding Source in Pepin
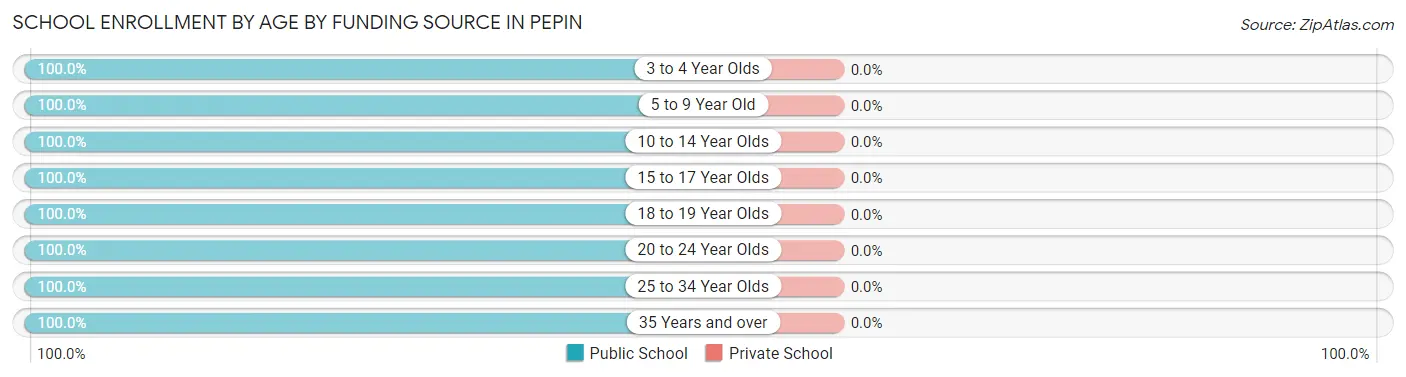
| Age Bracket | Public School | Private School |
| 3 to 4 Year Olds | 2 (100.0%) | 0 (0.0%) |
| 5 to 9 Year Old | 48 (100.0%) | 0 (0.0%) |
| 10 to 14 Year Olds | 36 (100.0%) | 0 (0.0%) |
| 15 to 17 Year Olds | 20 (100.0%) | 0 (0.0%) |
| 18 to 19 Year Olds | 24 (100.0%) | 0 (0.0%) |
| 20 to 24 Year Olds | 4 (100.0%) | 0 (0.0%) |
| 25 to 34 Year Olds | 4 (100.0%) | 0 (0.0%) |
| 35 Years and over | 3 (100.0%) | 0 (0.0%) |
| Total | 141 (100.0%) | 0 (0.0%) |
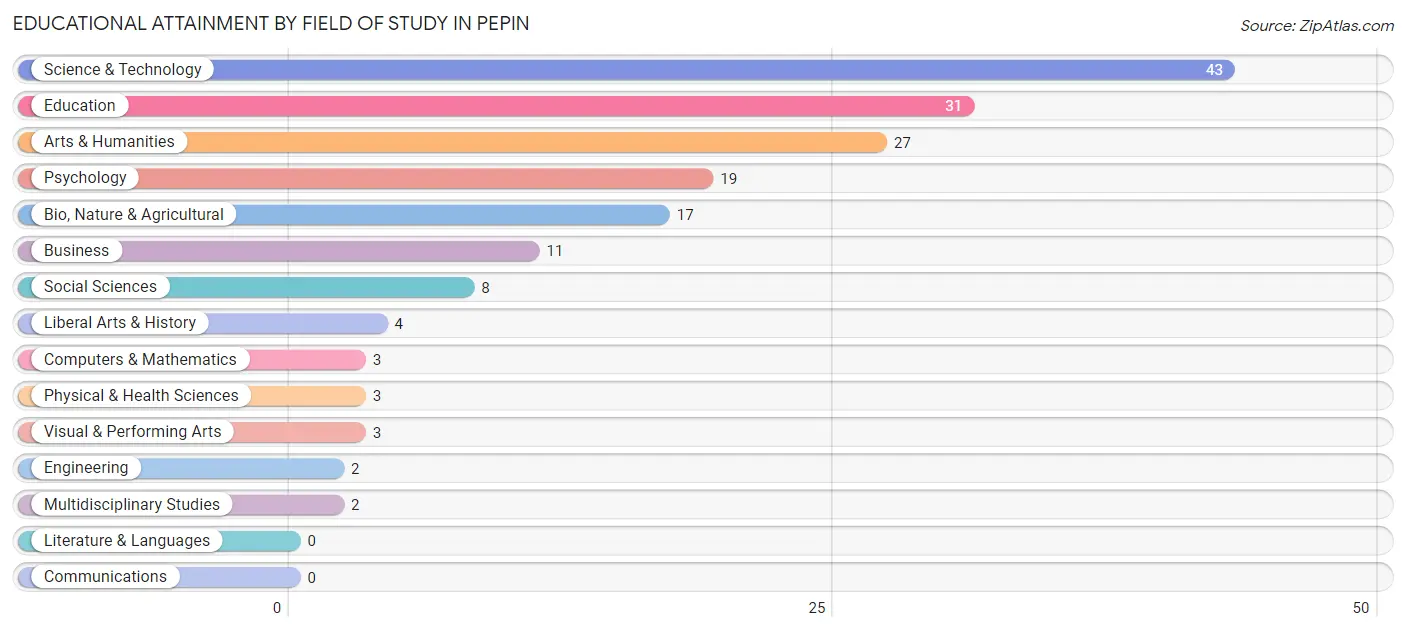
Educational Attainment by Field of Study in Pepin
Science & technology (43 | 24.9%), education (31 | 17.9%), arts & humanities (27 | 15.6%), psychology (19 | 11.0%), and bio, nature & agricultural (17 | 9.8%) are the most common fields of study among 173 individuals in Pepin who have obtained a bachelor's degree or higher.
| Field of Study | # Graduates | % Graduates |
| Computers & Mathematics | 3 | 1.7% |
| Bio, Nature & Agricultural | 17 | 9.8% |
| Physical & Health Sciences | 3 | 1.7% |
| Psychology | 19 | 11.0% |
| Social Sciences | 8 | 4.6% |
| Engineering | 2 | 1.2% |
| Multidisciplinary Studies | 2 | 1.2% |
| Science & Technology | 43 | 24.9% |
| Business | 11 | 6.4% |
| Education | 31 | 17.9% |
| Literature & Languages | 0 | 0.0% |
| Liberal Arts & History | 4 | 2.3% |
| Visual & Performing Arts | 3 | 1.7% |
| Communications | 0 | 0.0% |
| Arts & Humanities | 27 | 15.6% |
| Total | 173 | 100.0% |
Transportation & Commute in Pepin
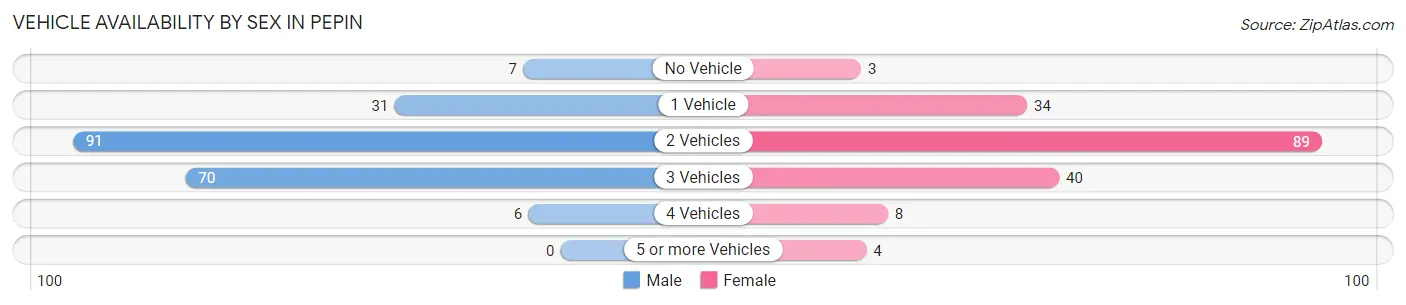
Vehicle Availability by Sex in Pepin
The most prevalent vehicle ownership categories in Pepin are males with 2 vehicles (91, accounting for 44.4%) and females with 2 vehicles (89, making up 51.1%).
| Vehicles Available | Male | Female |
| No Vehicle | 7 (3.4%) | 3 (1.7%) |
| 1 Vehicle | 31 (15.1%) | 34 (19.1%) |
| 2 Vehicles | 91 (44.4%) | 89 (50.0%) |
| 3 Vehicles | 70 (34.2%) | 40 (22.5%) |
| 4 Vehicles | 6 (2.9%) | 8 (4.5%) |
| 5 or more Vehicles | 0 (0.0%) | 4 (2.2%) |
| Total | 205 (100.0%) | 178 (100.0%) |
Commute Time in Pepin
The most frequently occuring commute durations in Pepin are 5 to 9 minutes (58 commuters, 17.6%), 15 to 19 minutes (52 commuters, 15.8%), and 30 to 34 minutes (49 commuters, 14.8%).
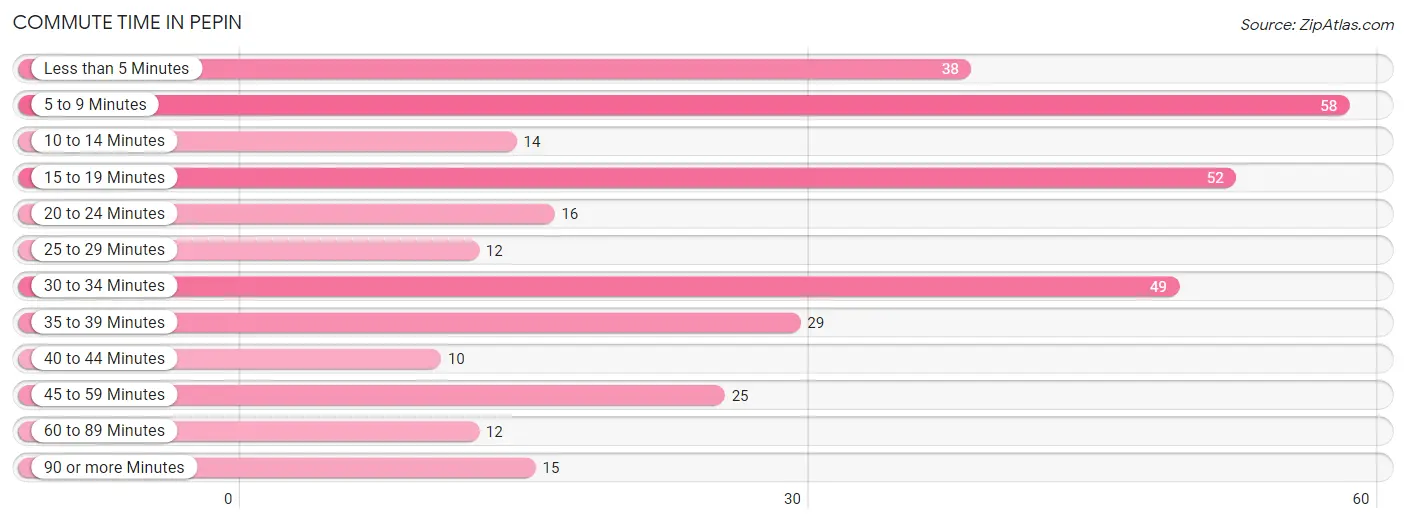
| Commute Time | # Commuters | % Commuters |
| Less than 5 Minutes | 38 | 11.5% |
| 5 to 9 Minutes | 58 | 17.6% |
| 10 to 14 Minutes | 14 | 4.2% |
| 15 to 19 Minutes | 52 | 15.8% |
| 20 to 24 Minutes | 16 | 4.9% |
| 25 to 29 Minutes | 12 | 3.6% |
| 30 to 34 Minutes | 49 | 14.8% |
| 35 to 39 Minutes | 29 | 8.8% |
| 40 to 44 Minutes | 10 | 3.0% |
| 45 to 59 Minutes | 25 | 7.6% |
| 60 to 89 Minutes | 12 | 3.6% |
| 90 or more Minutes | 15 | 4.5% |
Commute Time by Sex in Pepin
The most common commute times in Pepin are 30 to 34 minutes (39 commuters, 20.9%) for males and 15 to 19 minutes (38 commuters, 26.6%) for females.
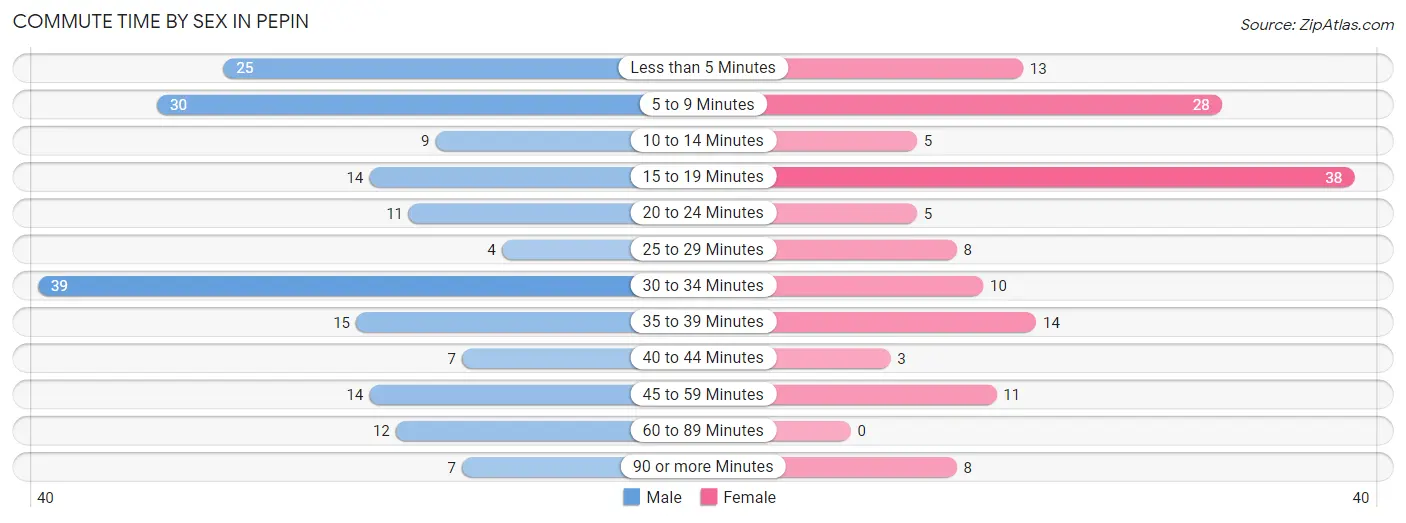
| Commute Time | Male | Female |
| Less than 5 Minutes | 25 (13.4%) | 13 (9.1%) |
| 5 to 9 Minutes | 30 (16.0%) | 28 (19.6%) |
| 10 to 14 Minutes | 9 (4.8%) | 5 (3.5%) |
| 15 to 19 Minutes | 14 (7.5%) | 38 (26.6%) |
| 20 to 24 Minutes | 11 (5.9%) | 5 (3.5%) |
| 25 to 29 Minutes | 4 (2.1%) | 8 (5.6%) |
| 30 to 34 Minutes | 39 (20.9%) | 10 (7.0%) |
| 35 to 39 Minutes | 15 (8.0%) | 14 (9.8%) |
| 40 to 44 Minutes | 7 (3.7%) | 3 (2.1%) |
| 45 to 59 Minutes | 14 (7.5%) | 11 (7.7%) |
| 60 to 89 Minutes | 12 (6.4%) | 0 (0.0%) |
| 90 or more Minutes | 7 (3.7%) | 8 (5.6%) |
Time of Departure to Work by Sex in Pepin
The most frequent times of departure to work in Pepin are 12:00 PM to 3:59 PM (49, 26.2%) for males and 12:00 AM to 4:59 AM (20, 14.0%) for females.
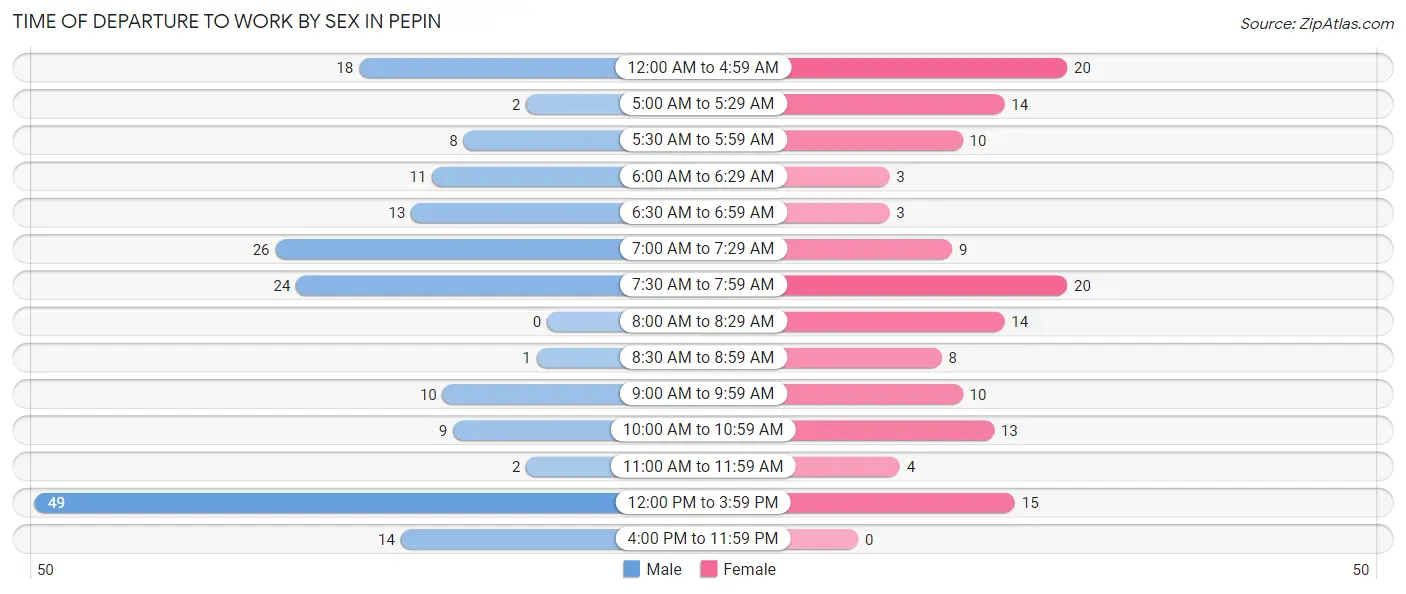
| Time of Departure | Male | Female |
| 12:00 AM to 4:59 AM | 18 (9.6%) | 20 (14.0%) |
| 5:00 AM to 5:29 AM | 2 (1.1%) | 14 (9.8%) |
| 5:30 AM to 5:59 AM | 8 (4.3%) | 10 (7.0%) |
| 6:00 AM to 6:29 AM | 11 (5.9%) | 3 (2.1%) |
| 6:30 AM to 6:59 AM | 13 (7.0%) | 3 (2.1%) |
| 7:00 AM to 7:29 AM | 26 (13.9%) | 9 (6.3%) |
| 7:30 AM to 7:59 AM | 24 (12.8%) | 20 (14.0%) |
| 8:00 AM to 8:29 AM | 0 (0.0%) | 14 (9.8%) |
| 8:30 AM to 8:59 AM | 1 (0.5%) | 8 (5.6%) |
| 9:00 AM to 9:59 AM | 10 (5.3%) | 10 (7.0%) |
| 10:00 AM to 10:59 AM | 9 (4.8%) | 13 (9.1%) |
| 11:00 AM to 11:59 AM | 2 (1.1%) | 4 (2.8%) |
| 12:00 PM to 3:59 PM | 49 (26.2%) | 15 (10.5%) |
| 4:00 PM to 11:59 PM | 14 (7.5%) | 0 (0.0%) |
| Total | 187 (100.0%) | 143 (100.0%) |
Housing Occupancy in Pepin
Occupancy by Ownership in Pepin
Of the total 348 dwellings in Pepin, owner-occupied units account for 250 (71.8%), while renter-occupied units make up 98 (28.2%).
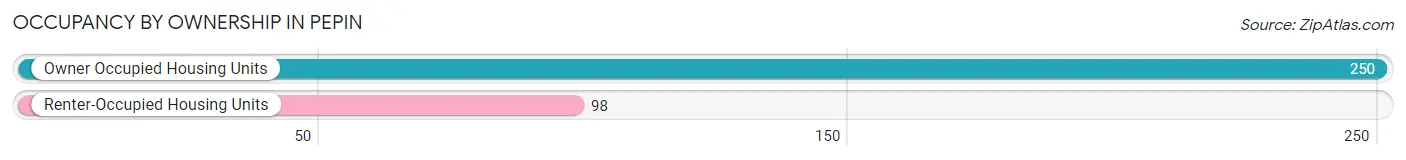
| Occupancy | # Housing Units | % Housing Units |
| Owner Occupied Housing Units | 250 | 71.8% |
| Renter-Occupied Housing Units | 98 | 28.2% |
| Total Occupied Housing Units | 348 | 100.0% |
Occupancy by Household Size in Pepin
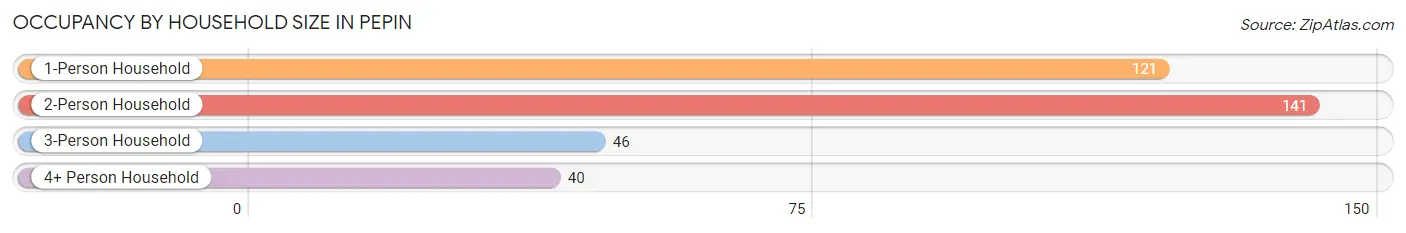
| Household Size | # Housing Units | % Housing Units |
| 1-Person Household | 121 | 34.8% |
| 2-Person Household | 141 | 40.5% |
| 3-Person Household | 46 | 13.2% |
| 4+ Person Household | 40 | 11.5% |
| Total Housing Units | 348 | 100.0% |
Occupancy by Ownership by Household Size in Pepin
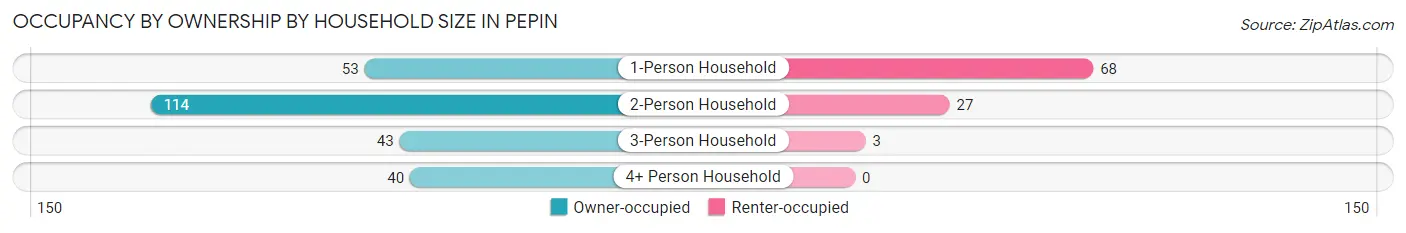
| Household Size | Owner-occupied | Renter-occupied |
| 1-Person Household | 53 (43.8%) | 68 (56.2%) |
| 2-Person Household | 114 (80.8%) | 27 (19.2%) |
| 3-Person Household | 43 (93.5%) | 3 (6.5%) |
| 4+ Person Household | 40 (100.0%) | 0 (0.0%) |
| Total Housing Units | 250 (71.8%) | 98 (28.2%) |
Occupancy by Educational Attainment in Pepin

| Household Size | Owner-occupied | Renter-occupied |
| Less than High School | 10 (50.0%) | 10 (50.0%) |
| High School Diploma | 74 (68.5%) | 34 (31.5%) |
| College/Associate Degree | 88 (68.8%) | 40 (31.2%) |
| Bachelor's Degree or higher | 78 (84.8%) | 14 (15.2%) |
Occupancy by Age of Householder in Pepin
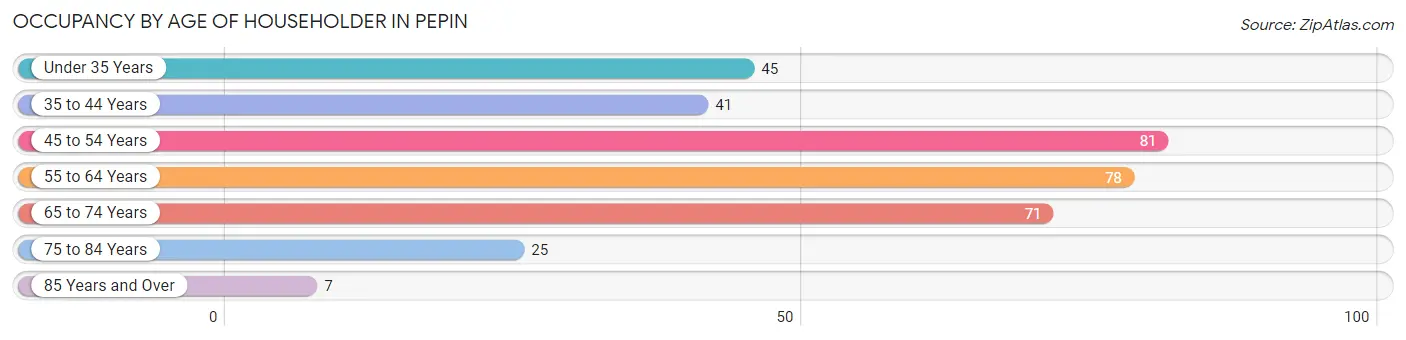
| Age Bracket | # Households | % Households |
| Under 35 Years | 45 | 12.9% |
| 35 to 44 Years | 41 | 11.8% |
| 45 to 54 Years | 81 | 23.3% |
| 55 to 64 Years | 78 | 22.4% |
| 65 to 74 Years | 71 | 20.4% |
| 75 to 84 Years | 25 | 7.2% |
| 85 Years and Over | 7 | 2.0% |
| Total | 348 | 100.0% |
Housing Finances in Pepin
Median Income by Occupancy in Pepin
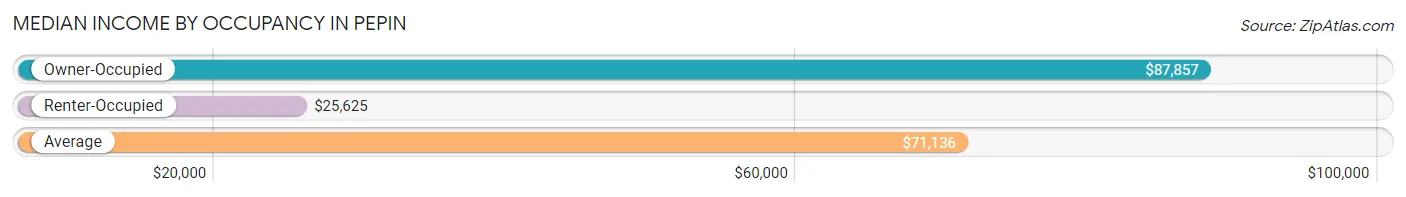
| Occupancy Type | # Households | Median Income |
| Owner-Occupied | 250 (71.8%) | $87,857 |
| Renter-Occupied | 98 (28.2%) | $25,625 |
| Average | 348 (100.0%) | $71,136 |
Occupancy by Householder Income Bracket in Pepin
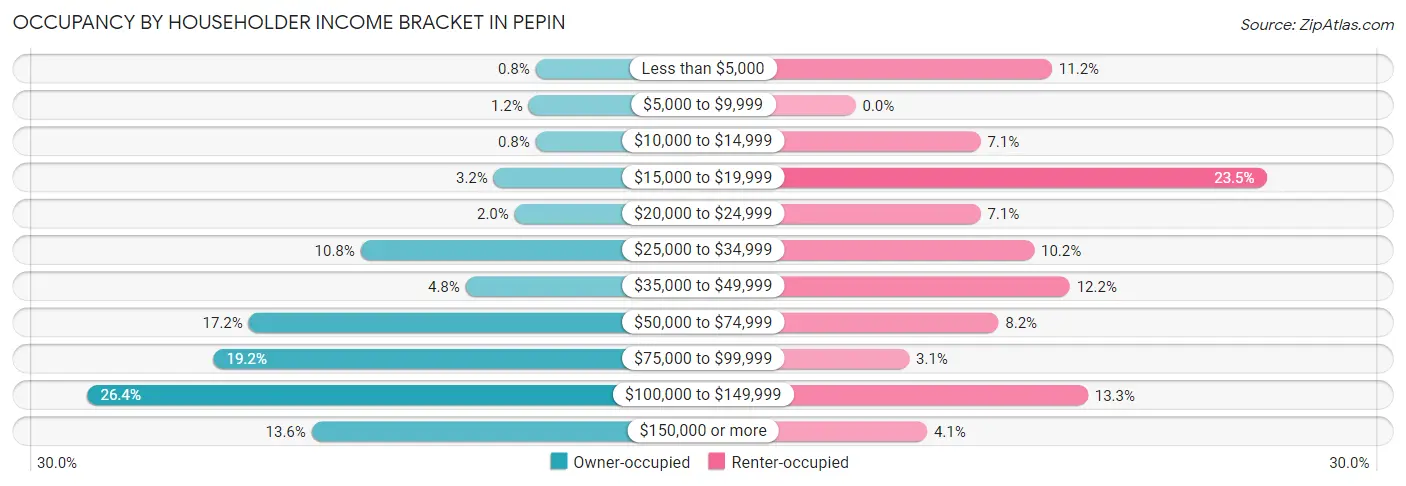
| Income Bracket | Owner-occupied | Renter-occupied |
| Less than $5,000 | 2 (0.8%) | 11 (11.2%) |
| $5,000 to $9,999 | 3 (1.2%) | 0 (0.0%) |
| $10,000 to $14,999 | 2 (0.8%) | 7 (7.1%) |
| $15,000 to $19,999 | 8 (3.2%) | 23 (23.5%) |
| $20,000 to $24,999 | 5 (2.0%) | 7 (7.1%) |
| $25,000 to $34,999 | 27 (10.8%) | 10 (10.2%) |
| $35,000 to $49,999 | 12 (4.8%) | 12 (12.2%) |
| $50,000 to $74,999 | 43 (17.2%) | 8 (8.2%) |
| $75,000 to $99,999 | 48 (19.2%) | 3 (3.1%) |
| $100,000 to $149,999 | 66 (26.4%) | 13 (13.3%) |
| $150,000 or more | 34 (13.6%) | 4 (4.1%) |
| Total | 250 (100.0%) | 98 (100.0%) |
Monthly Housing Cost Tiers in Pepin
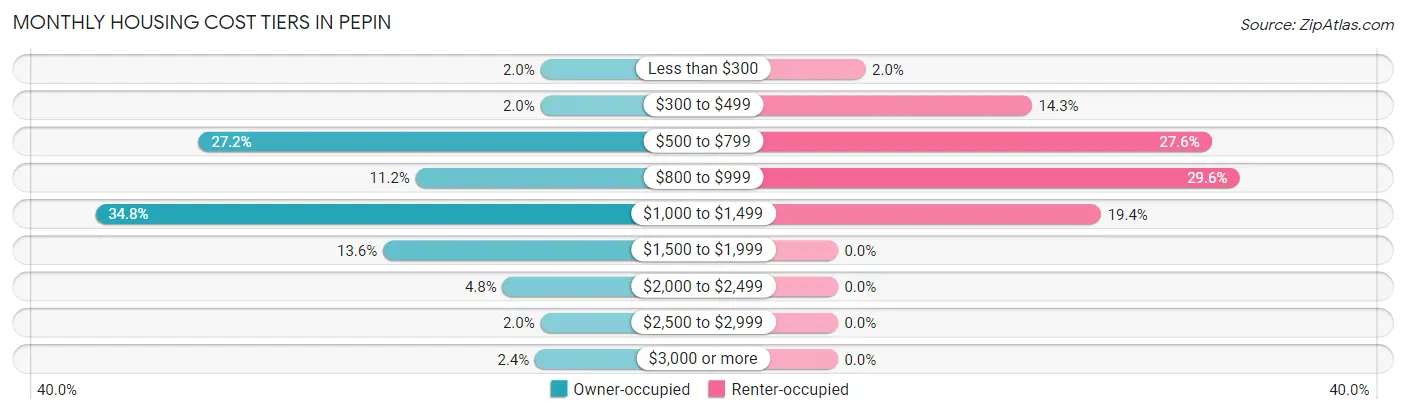
| Monthly Cost | Owner-occupied | Renter-occupied |
| Less than $300 | 5 (2.0%) | 2 (2.0%) |
| $300 to $499 | 5 (2.0%) | 14 (14.3%) |
| $500 to $799 | 68 (27.2%) | 27 (27.6%) |
| $800 to $999 | 28 (11.2%) | 29 (29.6%) |
| $1,000 to $1,499 | 87 (34.8%) | 19 (19.4%) |
| $1,500 to $1,999 | 34 (13.6%) | 0 (0.0%) |
| $2,000 to $2,499 | 12 (4.8%) | 0 (0.0%) |
| $2,500 to $2,999 | 5 (2.0%) | 0 (0.0%) |
| $3,000 or more | 6 (2.4%) | 0 (0.0%) |
| Total | 250 (100.0%) | 98 (100.0%) |
Physical Housing Characteristics in Pepin
Housing Structures in Pepin
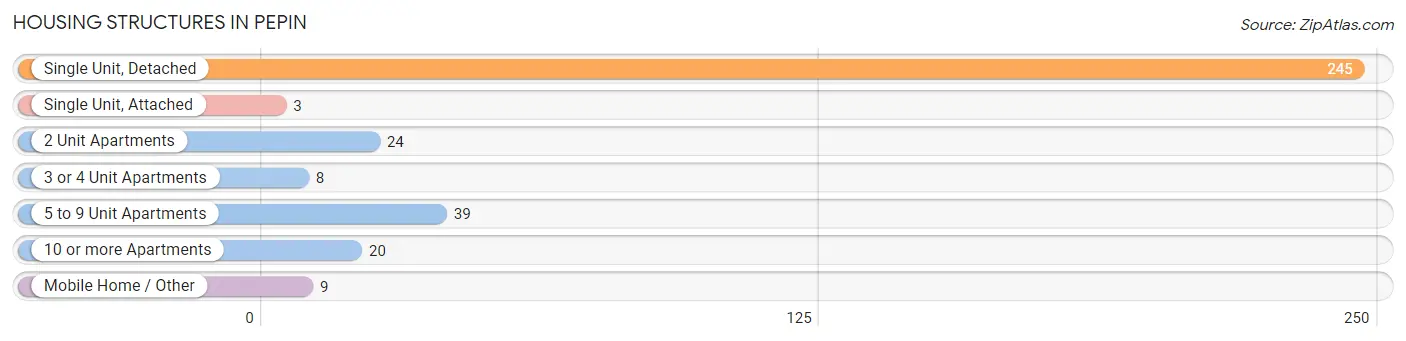
| Structure Type | # Housing Units | % Housing Units |
| Single Unit, Detached | 245 | 70.4% |
| Single Unit, Attached | 3 | 0.9% |
| 2 Unit Apartments | 24 | 6.9% |
| 3 or 4 Unit Apartments | 8 | 2.3% |
| 5 to 9 Unit Apartments | 39 | 11.2% |
| 10 or more Apartments | 20 | 5.8% |
| Mobile Home / Other | 9 | 2.6% |
| Total | 348 | 100.0% |
Housing Structures by Occupancy in Pepin
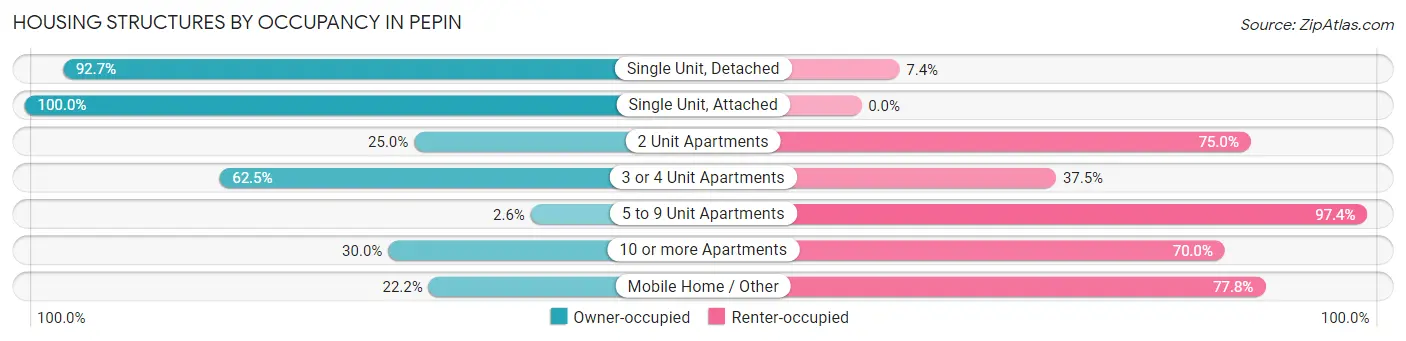
| Structure Type | Owner-occupied | Renter-occupied |
| Single Unit, Detached | 227 (92.6%) | 18 (7.3%) |
| Single Unit, Attached | 3 (100.0%) | 0 (0.0%) |
| 2 Unit Apartments | 6 (25.0%) | 18 (75.0%) |
| 3 or 4 Unit Apartments | 5 (62.5%) | 3 (37.5%) |
| 5 to 9 Unit Apartments | 1 (2.6%) | 38 (97.4%) |
| 10 or more Apartments | 6 (30.0%) | 14 (70.0%) |
| Mobile Home / Other | 2 (22.2%) | 7 (77.8%) |
| Total | 250 (71.8%) | 98 (28.2%) |
Housing Structures by Number of Rooms in Pepin
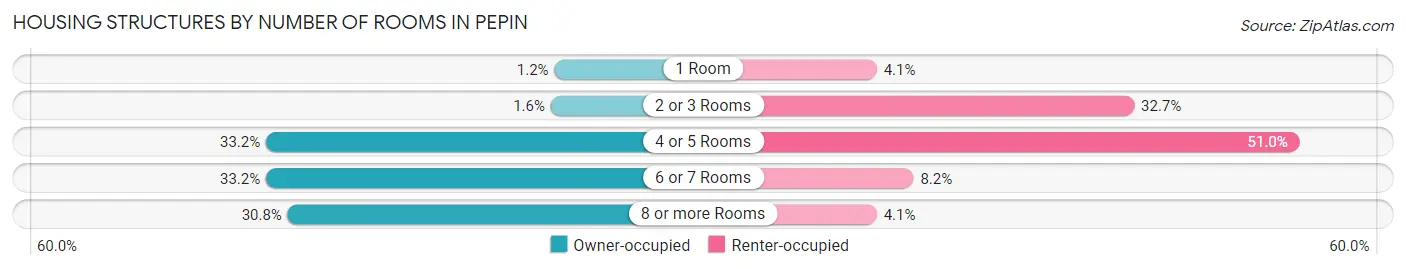
| Number of Rooms | Owner-occupied | Renter-occupied |
| 1 Room | 3 (1.2%) | 4 (4.1%) |
| 2 or 3 Rooms | 4 (1.6%) | 32 (32.7%) |
| 4 or 5 Rooms | 83 (33.2%) | 50 (51.0%) |
| 6 or 7 Rooms | 83 (33.2%) | 8 (8.2%) |
| 8 or more Rooms | 77 (30.8%) | 4 (4.1%) |
| Total | 250 (100.0%) | 98 (100.0%) |
Housing Structure by Heating Type in Pepin
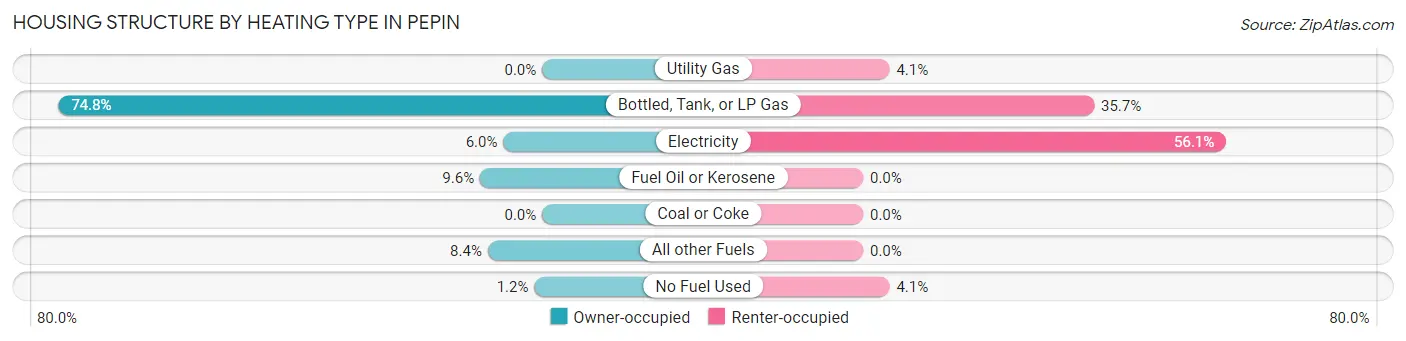
| Heating Type | Owner-occupied | Renter-occupied |
| Utility Gas | 0 (0.0%) | 4 (4.1%) |
| Bottled, Tank, or LP Gas | 187 (74.8%) | 35 (35.7%) |
| Electricity | 15 (6.0%) | 55 (56.1%) |
| Fuel Oil or Kerosene | 24 (9.6%) | 0 (0.0%) |
| Coal or Coke | 0 (0.0%) | 0 (0.0%) |
| All other Fuels | 21 (8.4%) | 0 (0.0%) |
| No Fuel Used | 3 (1.2%) | 4 (4.1%) |
| Total | 250 (100.0%) | 98 (100.0%) |
Household Vehicle Usage in Pepin
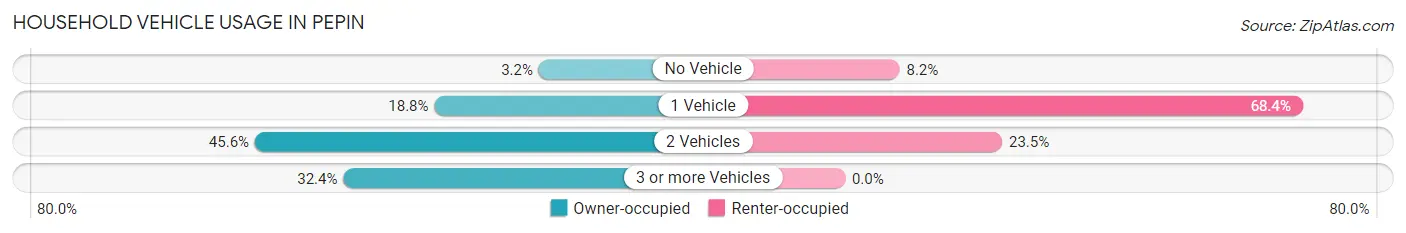
| Vehicles per Household | Owner-occupied | Renter-occupied |
| No Vehicle | 8 (3.2%) | 8 (8.2%) |
| 1 Vehicle | 47 (18.8%) | 67 (68.4%) |
| 2 Vehicles | 114 (45.6%) | 23 (23.5%) |
| 3 or more Vehicles | 81 (32.4%) | 0 (0.0%) |
| Total | 250 (100.0%) | 98 (100.0%) |
Real Estate & Mortgages in Pepin
Real Estate and Mortgage Overview in Pepin
| Characteristic | Without Mortgage | With Mortgage |
| Housing Units | 105 | 145 |
| Median Property Value | $160,500 | $172,100 |
| Median Household Income | $82,813 | $27 |
| Monthly Housing Costs | $681 | $6 |
| Real Estate Taxes | $2,815 | $0 |
Property Value by Mortgage Status in Pepin
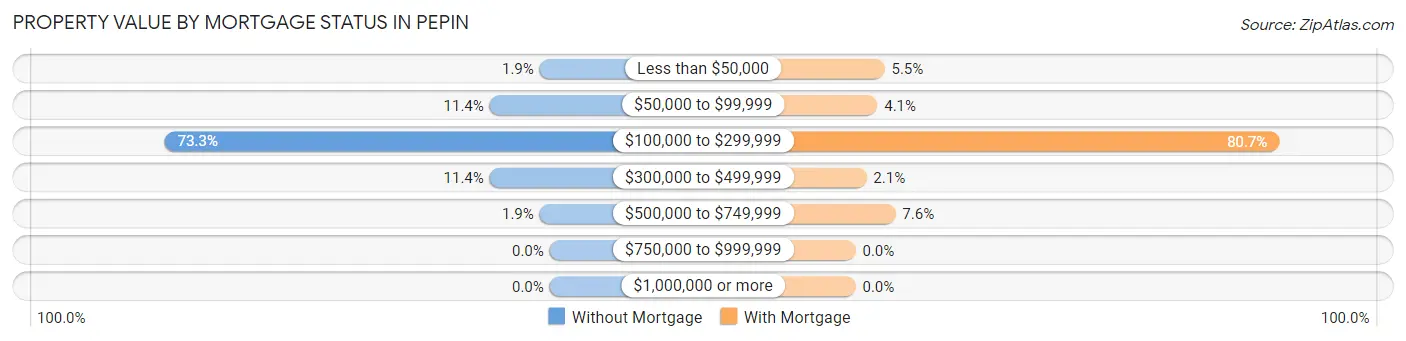
| Property Value | Without Mortgage | With Mortgage |
| Less than $50,000 | 2 (1.9%) | 8 (5.5%) |
| $50,000 to $99,999 | 12 (11.4%) | 6 (4.1%) |
| $100,000 to $299,999 | 77 (73.3%) | 117 (80.7%) |
| $300,000 to $499,999 | 12 (11.4%) | 3 (2.1%) |
| $500,000 to $749,999 | 2 (1.9%) | 11 (7.6%) |
| $750,000 to $999,999 | 0 (0.0%) | 0 (0.0%) |
| $1,000,000 or more | 0 (0.0%) | 0 (0.0%) |
| Total | 105 (100.0%) | 145 (100.0%) |
Household Income by Mortgage Status in Pepin
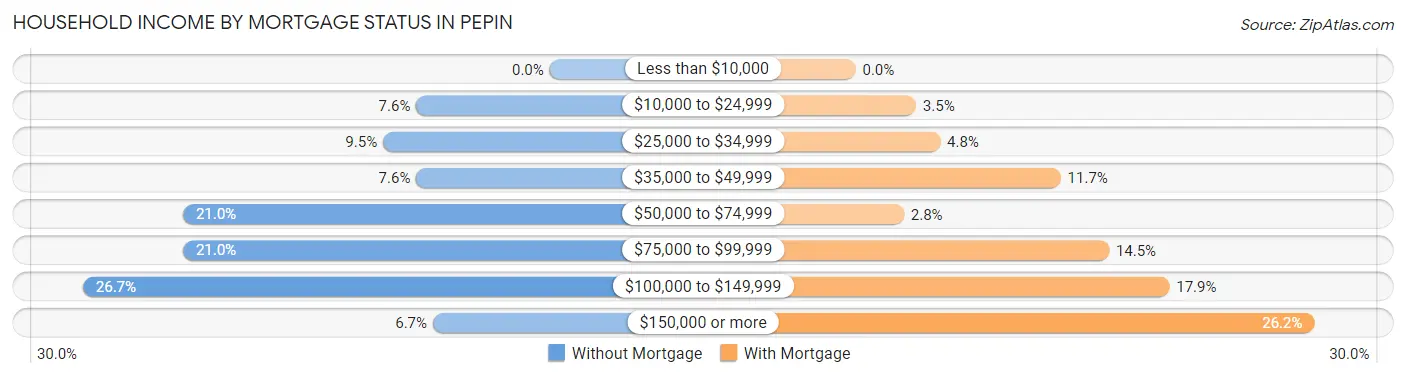
| Household Income | Without Mortgage | With Mortgage |
| Less than $10,000 | 0 (0.0%) | 0 (0.0%) |
| $10,000 to $24,999 | 8 (7.6%) | 5 (3.5%) |
| $25,000 to $34,999 | 10 (9.5%) | 7 (4.8%) |
| $35,000 to $49,999 | 8 (7.6%) | 17 (11.7%) |
| $50,000 to $74,999 | 22 (20.9%) | 4 (2.8%) |
| $75,000 to $99,999 | 22 (20.9%) | 21 (14.5%) |
| $100,000 to $149,999 | 28 (26.7%) | 26 (17.9%) |
| $150,000 or more | 7 (6.7%) | 38 (26.2%) |
| Total | 105 (100.0%) | 145 (100.0%) |
Property Value to Household Income Ratio in Pepin
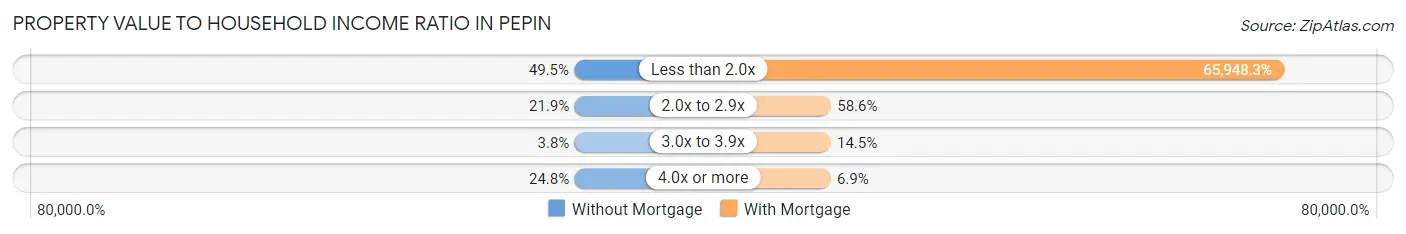
| Value-to-Income Ratio | Without Mortgage | With Mortgage |
| Less than 2.0x | 52 (49.5%) | 95,625 (65,948.3%) |
| 2.0x to 2.9x | 23 (21.9%) | 85 (58.6%) |
| 3.0x to 3.9x | 4 (3.8%) | 21 (14.5%) |
| 4.0x or more | 26 (24.8%) | 10 (6.9%) |
| Total | 105 (100.0%) | 145 (100.0%) |
Real Estate Taxes by Mortgage Status in Pepin
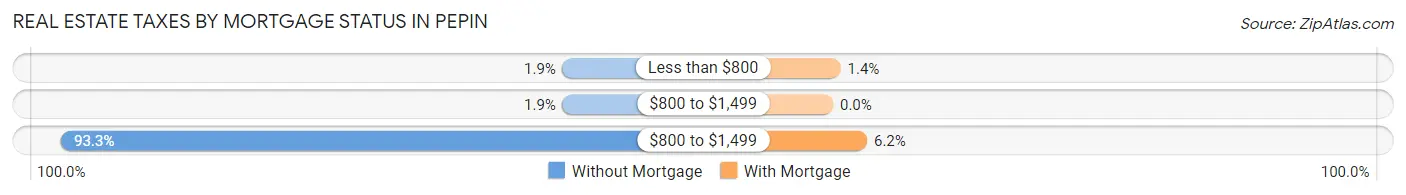
| Property Taxes | Without Mortgage | With Mortgage |
| Less than $800 | 2 (1.9%) | 2 (1.4%) |
| $800 to $1,499 | 2 (1.9%) | 0 (0.0%) |
| $800 to $1,499 | 98 (93.3%) | 9 (6.2%) |
| Total | 105 (100.0%) | 145 (100.0%) |
Health & Disability in Pepin
Health Insurance Coverage by Age in Pepin
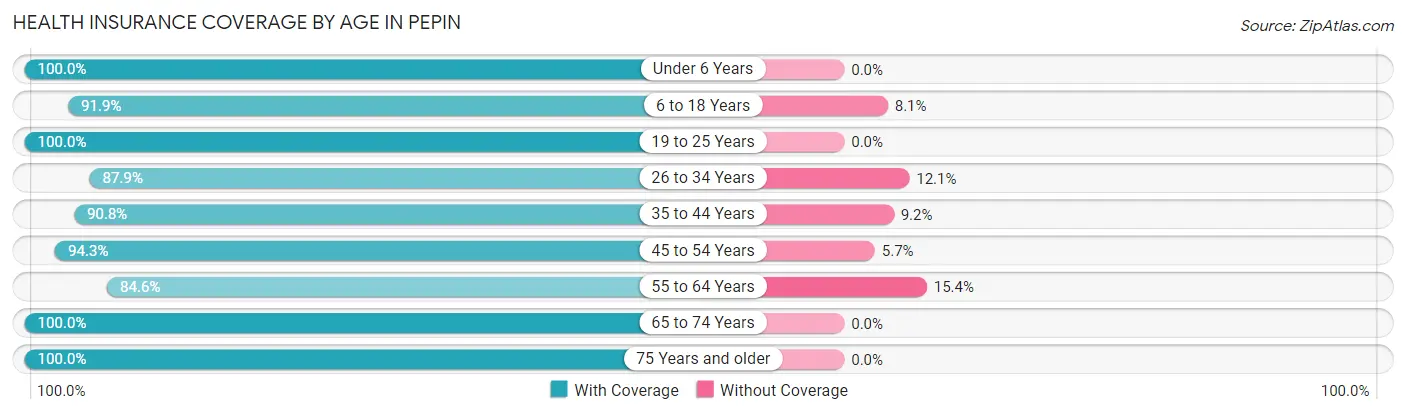
| Age Bracket | With Coverage | Without Coverage |
| Under 6 Years | 61 (100.0%) | 0 (0.0%) |
| 6 to 18 Years | 102 (91.9%) | 9 (8.1%) |
| 19 to 25 Years | 23 (100.0%) | 0 (0.0%) |
| 26 to 34 Years | 58 (87.9%) | 8 (12.1%) |
| 35 to 44 Years | 69 (90.8%) | 7 (9.2%) |
| 45 to 54 Years | 116 (94.3%) | 7 (5.7%) |
| 55 to 64 Years | 110 (84.6%) | 20 (15.4%) |
| 65 to 74 Years | 145 (100.0%) | 0 (0.0%) |
| 75 Years and older | 50 (100.0%) | 0 (0.0%) |
| Total | 734 (93.5%) | 51 (6.5%) |
Health Insurance Coverage by Citizenship Status in Pepin
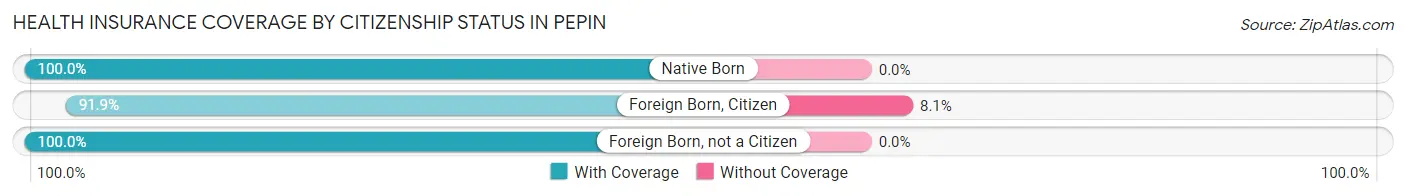
| Citizenship Status | With Coverage | Without Coverage |
| Native Born | 61 (100.0%) | 0 (0.0%) |
| Foreign Born, Citizen | 102 (91.9%) | 9 (8.1%) |
| Foreign Born, not a Citizen | 23 (100.0%) | 0 (0.0%) |
Health Insurance Coverage by Household Income in Pepin
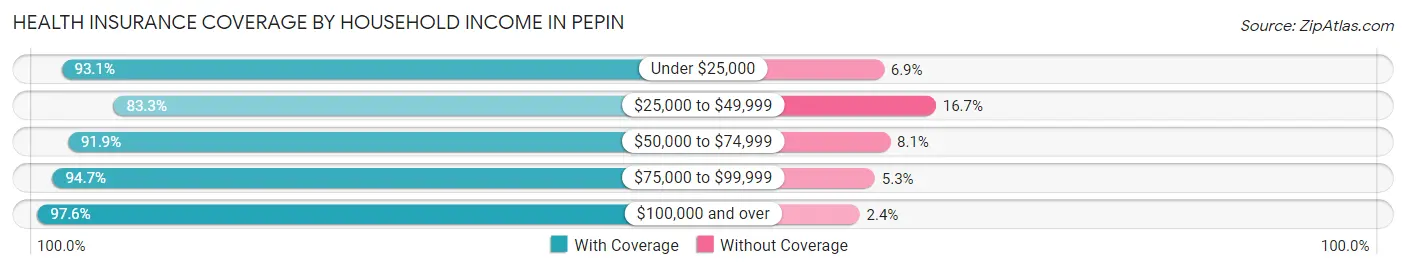
| Household Income | With Coverage | Without Coverage |
| Under $25,000 | 94 (93.1%) | 7 (6.9%) |
| $25,000 to $49,999 | 105 (83.3%) | 21 (16.7%) |
| $50,000 to $74,999 | 102 (91.9%) | 9 (8.1%) |
| $75,000 to $99,999 | 108 (94.7%) | 6 (5.3%) |
| $100,000 and over | 325 (97.6%) | 8 (2.4%) |
Public vs Private Health Insurance Coverage by Age in Pepin
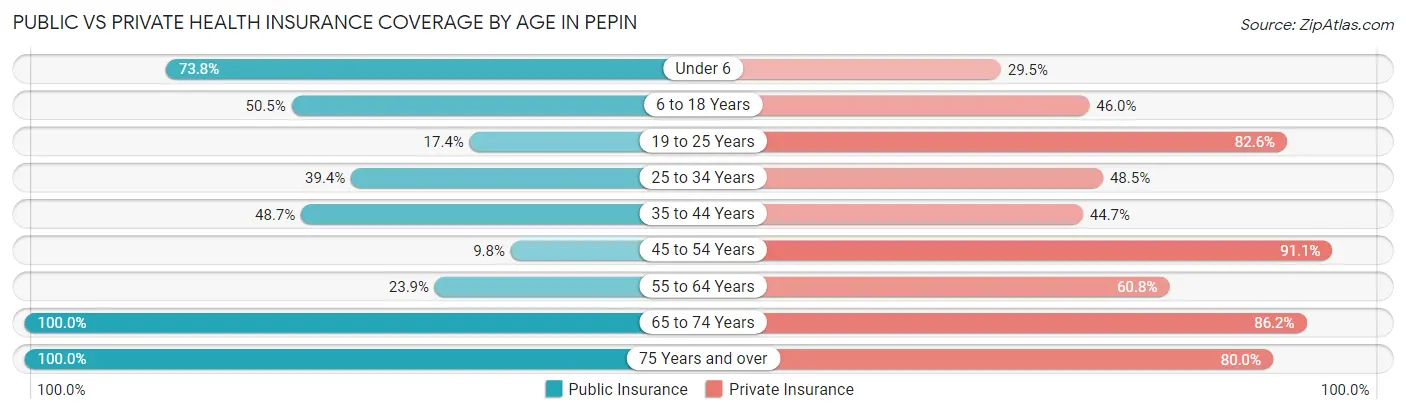
| Age Bracket | Public Insurance | Private Insurance |
| Under 6 | 45 (73.8%) | 18 (29.5%) |
| 6 to 18 Years | 56 (50.4%) | 51 (46.0%) |
| 19 to 25 Years | 4 (17.4%) | 19 (82.6%) |
| 25 to 34 Years | 26 (39.4%) | 32 (48.5%) |
| 35 to 44 Years | 37 (48.7%) | 34 (44.7%) |
| 45 to 54 Years | 12 (9.8%) | 112 (91.1%) |
| 55 to 64 Years | 31 (23.8%) | 79 (60.8%) |
| 65 to 74 Years | 145 (100.0%) | 125 (86.2%) |
| 75 Years and over | 50 (100.0%) | 40 (80.0%) |
| Total | 406 (51.7%) | 510 (65.0%) |
Disability Status by Sex by Age in Pepin
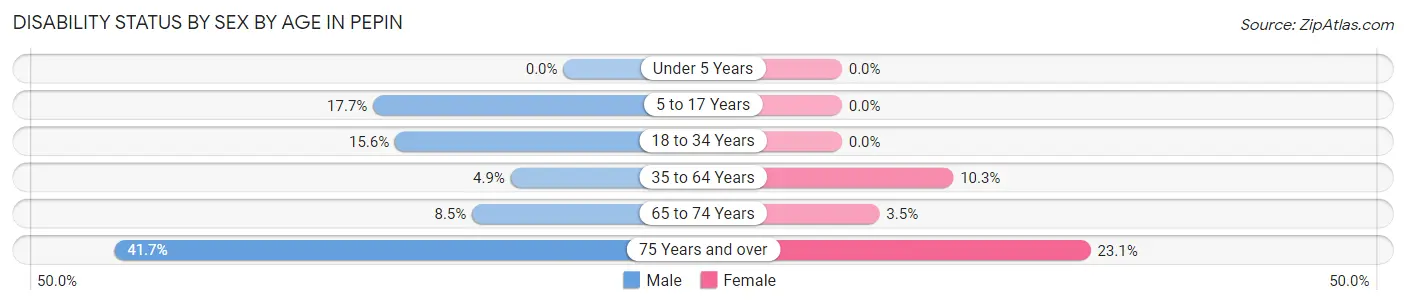
| Age Bracket | Male | Female |
| Under 5 Years | 0 (0.0%) | 0 (0.0%) |
| 5 to 17 Years | 9 (17.6%) | 0 (0.0%) |
| 18 to 34 Years | 10 (15.6%) | 0 (0.0%) |
| 35 to 64 Years | 9 (4.9%) | 15 (10.3%) |
| 65 to 74 Years | 5 (8.5%) | 3 (3.5%) |
| 75 Years and over | 10 (41.7%) | 6 (23.1%) |
Disability Class by Sex by Age in Pepin
Disability Class: Hearing Difficulty
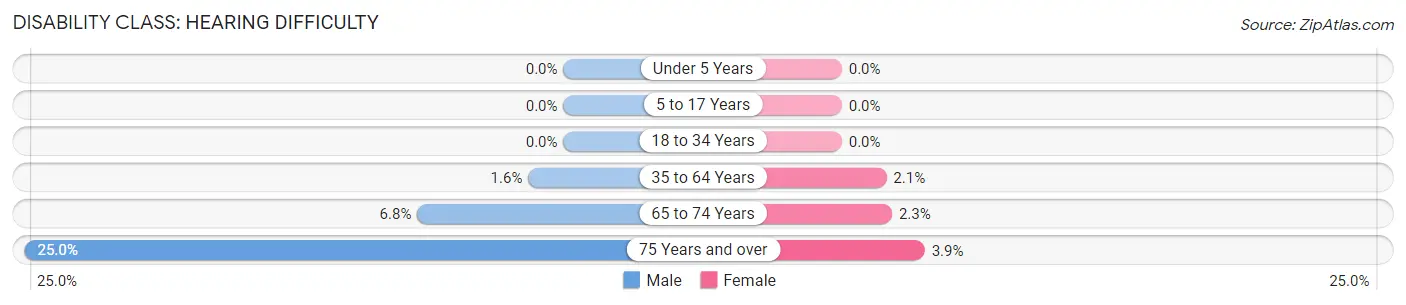
| Age Bracket | Male | Female |
| Under 5 Years | 0 (0.0%) | 0 (0.0%) |
| 5 to 17 Years | 0 (0.0%) | 0 (0.0%) |
| 18 to 34 Years | 0 (0.0%) | 0 (0.0%) |
| 35 to 64 Years | 3 (1.6%) | 3 (2.1%) |
| 65 to 74 Years | 4 (6.8%) | 2 (2.3%) |
| 75 Years and over | 6 (25.0%) | 1 (3.8%) |
Disability Class: Vision Difficulty
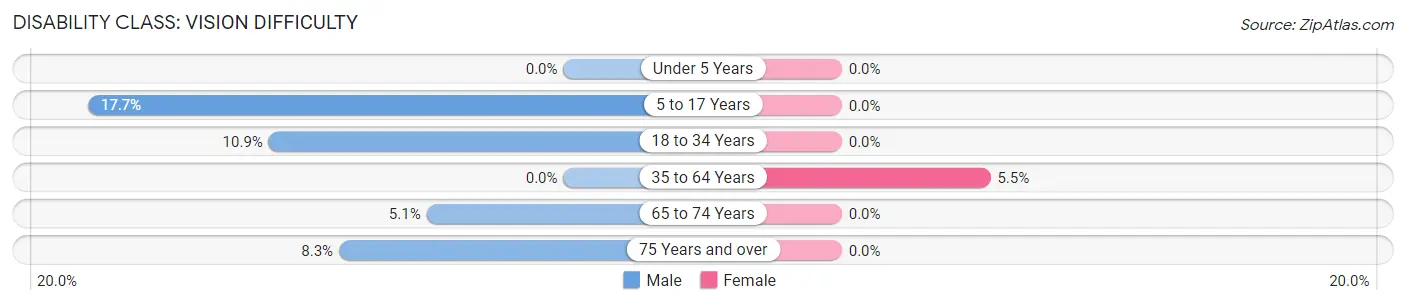
| Age Bracket | Male | Female |
| Under 5 Years | 0 (0.0%) | 0 (0.0%) |
| 5 to 17 Years | 9 (17.6%) | 0 (0.0%) |
| 18 to 34 Years | 7 (10.9%) | 0 (0.0%) |
| 35 to 64 Years | 0 (0.0%) | 8 (5.5%) |
| 65 to 74 Years | 3 (5.1%) | 0 (0.0%) |
| 75 Years and over | 2 (8.3%) | 0 (0.0%) |
Disability Class: Cognitive Difficulty
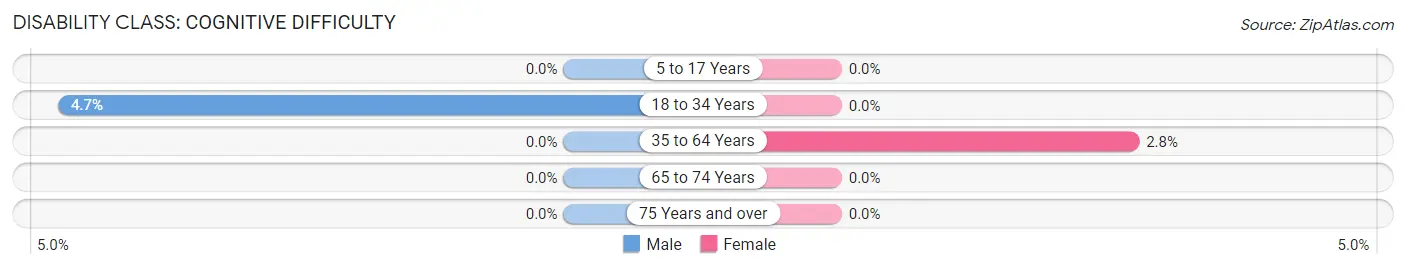
| Age Bracket | Male | Female |
| 5 to 17 Years | 0 (0.0%) | 0 (0.0%) |
| 18 to 34 Years | 3 (4.7%) | 0 (0.0%) |
| 35 to 64 Years | 0 (0.0%) | 4 (2.8%) |
| 65 to 74 Years | 0 (0.0%) | 0 (0.0%) |
| 75 Years and over | 0 (0.0%) | 0 (0.0%) |
Disability Class: Ambulatory Difficulty
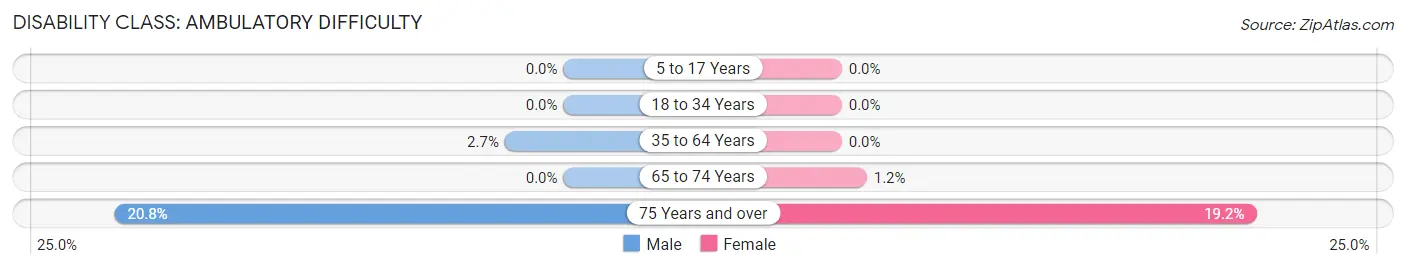
| Age Bracket | Male | Female |
| 5 to 17 Years | 0 (0.0%) | 0 (0.0%) |
| 18 to 34 Years | 0 (0.0%) | 0 (0.0%) |
| 35 to 64 Years | 5 (2.7%) | 0 (0.0%) |
| 65 to 74 Years | 0 (0.0%) | 1 (1.2%) |
| 75 Years and over | 5 (20.8%) | 5 (19.2%) |
Disability Class: Self-Care Difficulty
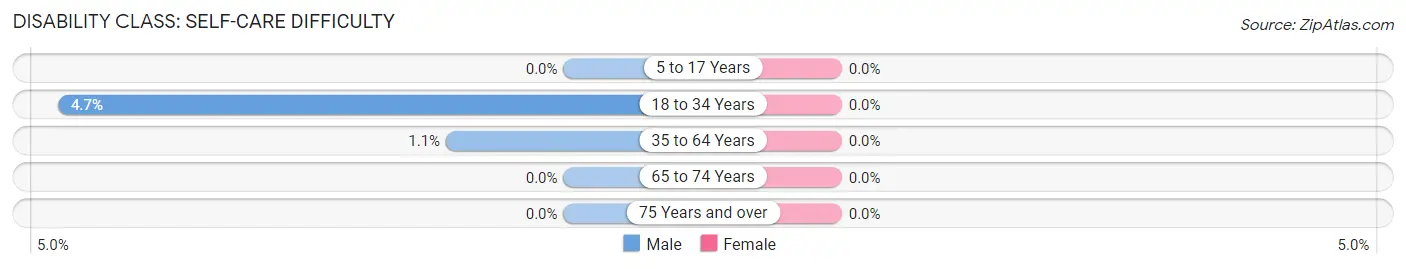
| Age Bracket | Male | Female |
| 5 to 17 Years | 0 (0.0%) | 0 (0.0%) |
| 18 to 34 Years | 3 (4.7%) | 0 (0.0%) |
| 35 to 64 Years | 2 (1.1%) | 0 (0.0%) |
| 65 to 74 Years | 0 (0.0%) | 0 (0.0%) |
| 75 Years and over | 0 (0.0%) | 0 (0.0%) |
Technology Access in Pepin
Computing Device Access in Pepin
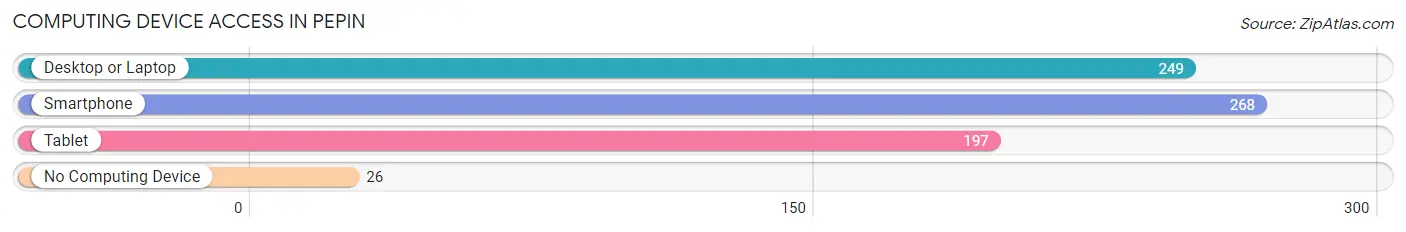
| Device Type | # Households | % Households |
| Desktop or Laptop | 249 | 71.6% |
| Smartphone | 268 | 77.0% |
| Tablet | 197 | 56.6% |
| No Computing Device | 26 | 7.5% |
| Total | 348 | 100.0% |
Internet Access in Pepin
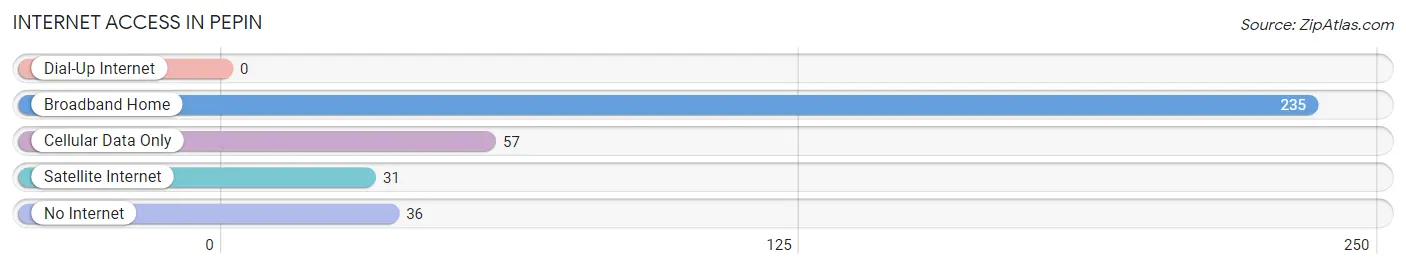
| Internet Type | # Households | % Households |
| Dial-Up Internet | 0 | 0.0% |
| Broadband Home | 235 | 67.5% |
| Cellular Data Only | 57 | 16.4% |
| Satellite Internet | 31 | 8.9% |
| No Internet | 36 | 10.3% |
| Total | 348 | 100.0% |
Pepin Summary
Pepin, Wisconsin is a small town located in the western part of the state, in the county of Pepin. It is situated on the banks of the Mississippi River, and is the birthplace of Laura Ingalls Wilder, author of the Little House on the Prairie series. The town has a population of just over 800 people, and is a popular tourist destination due to its historical significance and its proximity to the Mississippi River.
Geography
Pepin is located in the western part of Wisconsin, in the county of Pepin. It is situated on the banks of the Mississippi River, and is surrounded by rolling hills and wooded areas. The town is located at an elevation of 845 feet above sea level, and has a total area of 1.2 square miles. The climate in Pepin is humid continental, with cold winters and hot summers.
Economy
The economy of Pepin is largely based on tourism, as the town is a popular destination for visitors due to its historical significance and its proximity to the Mississippi River. The town also has a number of small businesses, including restaurants, shops, and a winery. Agriculture is also an important part of the local economy, with dairy farming and crop production being the main industries.
Demographics
As of the 2010 census, the population of Pepin was 809 people. The racial makeup of the town was 97.3% White, 0.4% African American, 0.2% Native American, 0.2% Asian, 0.2% from other races, and 1.9% from two or more races. The median household income was $37,500, and the median family income was $45,000. The per capita income was $19,000.
History
Pepin was founded in 1854 by settlers from New York and Pennsylvania. The town was named after the French explorer, Pierre-Esprit Radisson, who explored the area in the 1600s. The town was an important stop on the Mississippi River, and was a major port for steamboats. In 1867, the town was incorporated, and in 1871, the first school was built. In 1875, the town was the birthplace of Laura Ingalls Wilder, author of the Little House on the Prairie series. The town has remained largely unchanged since then, and is still a popular tourist destination.
Common Questions
What is Per Capita Income in Pepin?
Per Capita income in Pepin is $40,365.
What is the Median Family Income in Pepin?
Median Family Income in Pepin is $87,386.
What is the Median Household income in Pepin?
Median Household Income in Pepin is $71,136.
What is Income or Wage Gap in Pepin?
Income or Wage Gap in Pepin is 37.1%.
Women in Pepin earn 62.9 cents for every dollar earned by a man.
What is Inequality or Gini Index in Pepin?
Inequality or Gini Index in Pepin is 0.42.
What is the Total Population of Pepin?
Total Population of Pepin is 823.
What is the Total Male Population of Pepin?
Total Male Population of Pepin is 430.
What is the Total Female Population of Pepin?
Total Female Population of Pepin is 393.
What is the Ratio of Males per 100 Females in Pepin?
There are 109.41 Males per 100 Females in Pepin.
What is the Ratio of Females per 100 Males in Pepin?
There are 91.40 Females per 100 Males in Pepin.
What is the Median Population Age in Pepin?
Median Population Age in Pepin is 51.8 Years.
What is the Average Family Size in Pepin
Average Family Size in Pepin is 2.9 People.
What is the Average Household Size in Pepin
Average Household Size in Pepin is 2.3 People.
How Large is the Labor Force in Pepin?
There are 398 People in the Labor Forcein in Pepin.
What is the Percentage of People in the Labor Force in Pepin?
57.7% of People are in the Labor Force in Pepin.
What is the Unemployment Rate in Pepin?
Unemployment Rate in Pepin is 3.0%.