Sawyer County, WI Map & Demographics
Sawyer County Map
Sawyer County Overview
$36,167
PER CAPITA INCOME
$76,367
AVG FAMILY INCOME
$57,519
AVG HOUSEHOLD INCOME
21.0%
WAGE / INCOME GAP [ % ]
79.0¢/ $1
WAGE / INCOME GAP [ $ ]
$9,199
FAMILY INCOME DEFICIT
0.45
INEQUALITY / GINI INDEX
18,057
TOTAL POPULATION
9,371
MALE POPULATION
8,686
FEMALE POPULATION
107.89
MALES / 100 FEMALES
92.69
FEMALES / 100 MALES
51.4
MEDIAN AGE
2.7
AVG FAMILY SIZE
2.1
AVG HOUSEHOLD SIZE
8,353
LABOR FORCE [ PEOPLE ]
55.0%
PERCENT IN LABOR FORCE
6.5%
UNEMPLOYMENT RATE
Sawyer County Area Codes
Income in Sawyer County
Income Overview in Sawyer County
Per Capita Income in Sawyer County is $36,167, while median incomes of families and households are $76,367 and $57,519 respectively.
| Characteristic | Number | Measure |
| Per Capita Income | 18,057 | $36,167 |
| Median Family Income | 4,921 | $76,367 |
| Mean Family Income | 4,921 | $91,763 |
| Median Household Income | 8,210 | $57,519 |
| Mean Household Income | 8,210 | $77,748 |
| Income Deficit | 4,921 | $9,199 |
| Wage / Income Gap (%) | 18,057 | 21.05% |
| Wage / Income Gap ($) | 18,057 | 78.95¢ per $1 |
| Gini / Inequality Index | 18,057 | 0.45 |
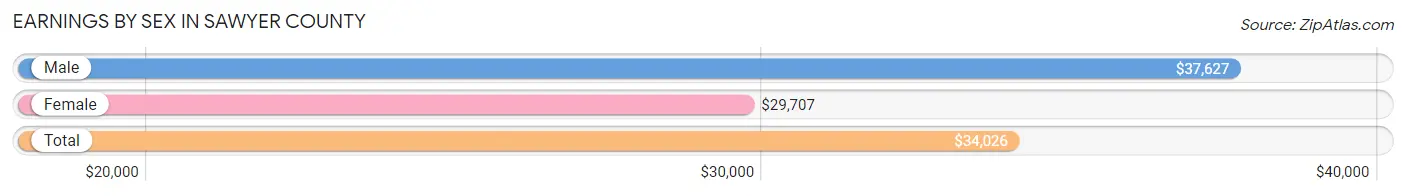
Earnings by Sex in Sawyer County
Average Earnings in Sawyer County are $34,026, $37,627 for men and $29,707 for women, a difference of 21.0%.
| Sex | Number | Average Earnings |
| Male | 4,849 (53.4%) | $37,627 |
| Female | 4,224 (46.6%) | $29,707 |
| Total | 9,073 (100.0%) | $34,026 |
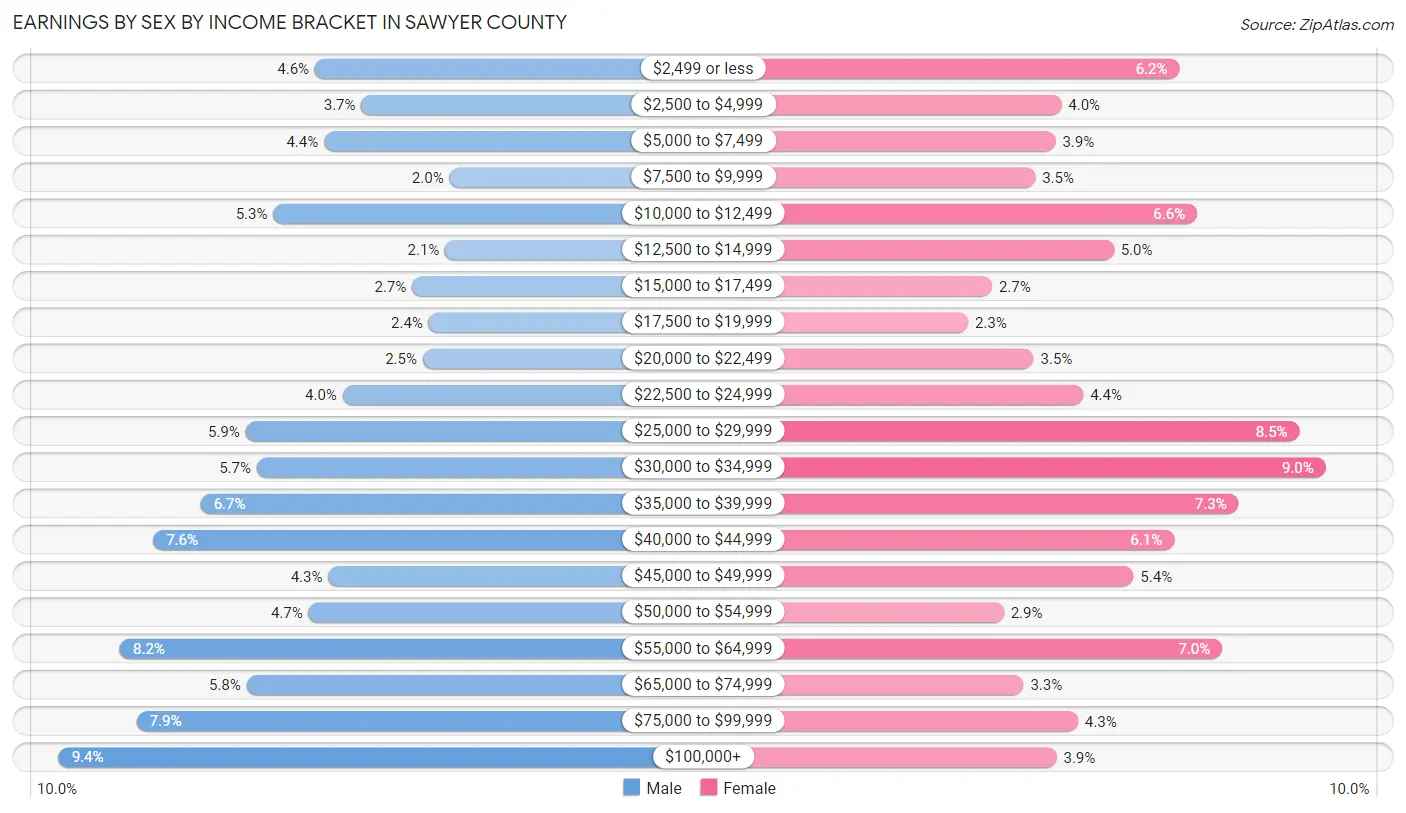
Earnings by Sex by Income Bracket in Sawyer County
The most common earnings brackets in Sawyer County are $100,000+ for men (454 | 9.4%) and $30,000 to $34,999 for women (379 | 9.0%).
| Income | Male | Female |
| $2,499 or less | 221 (4.6%) | 263 (6.2%) |
| $2,500 to $4,999 | 179 (3.7%) | 170 (4.0%) |
| $5,000 to $7,499 | 213 (4.4%) | 165 (3.9%) |
| $7,500 to $9,999 | 99 (2.0%) | 149 (3.5%) |
| $10,000 to $12,499 | 259 (5.3%) | 277 (6.6%) |
| $12,500 to $14,999 | 103 (2.1%) | 211 (5.0%) |
| $15,000 to $17,499 | 133 (2.7%) | 115 (2.7%) |
| $17,500 to $19,999 | 118 (2.4%) | 96 (2.3%) |
| $20,000 to $22,499 | 123 (2.5%) | 148 (3.5%) |
| $22,500 to $24,999 | 196 (4.0%) | 187 (4.4%) |
| $25,000 to $29,999 | 284 (5.9%) | 358 (8.5%) |
| $30,000 to $34,999 | 274 (5.7%) | 379 (9.0%) |
| $35,000 to $39,999 | 325 (6.7%) | 310 (7.3%) |
| $40,000 to $44,999 | 368 (7.6%) | 259 (6.1%) |
| $45,000 to $49,999 | 209 (4.3%) | 227 (5.4%) |
| $50,000 to $54,999 | 227 (4.7%) | 124 (2.9%) |
| $55,000 to $64,999 | 398 (8.2%) | 297 (7.0%) |
| $65,000 to $74,999 | 283 (5.8%) | 140 (3.3%) |
| $75,000 to $99,999 | 383 (7.9%) | 183 (4.3%) |
| $100,000+ | 454 (9.4%) | 166 (3.9%) |
| Total | 4,849 (100.0%) | 4,224 (100.0%) |
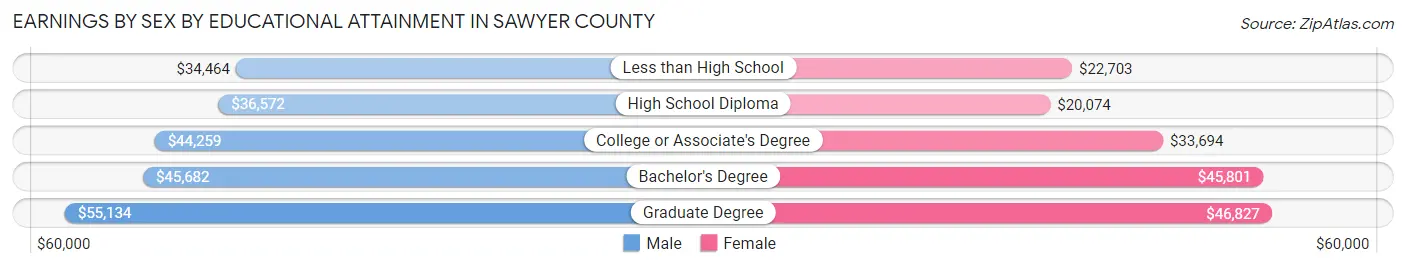
Earnings by Sex by Educational Attainment in Sawyer County
Average earnings in Sawyer County are $41,438 for men and $33,043 for women, a difference of 20.3%. Men with an educational attainment of graduate degree enjoy the highest average annual earnings of $55,134, while those with less than high school education earn the least with $34,464. Women with an educational attainment of graduate degree earn the most with the average annual earnings of $46,827, while those with high school diploma education have the smallest earnings of $20,074.
| Educational Attainment | Male Income | Female Income |
| Less than High School | $34,464 | $22,703 |
| High School Diploma | $36,572 | $20,074 |
| College or Associate's Degree | $44,259 | $33,694 |
| Bachelor's Degree | $45,682 | $45,801 |
| Graduate Degree | $55,134 | $46,827 |
| Total | $41,438 | $33,043 |
Family Income in Sawyer County
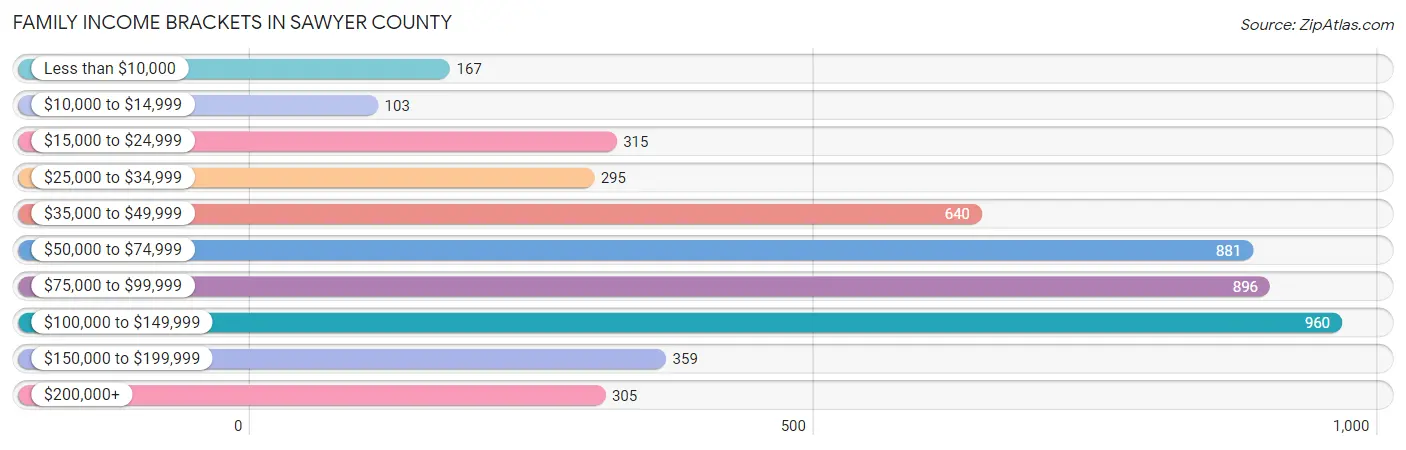
Family Income Brackets in Sawyer County
According to the Sawyer County family income data, there are 960 families falling into the $100,000 to $149,999 income range, which is the most common income bracket and makes up 19.5% of all families. Conversely, the $10,000 to $14,999 income bracket is the least frequent group with only 103 families (2.1%) belonging to this category.
| Income Bracket | # Families | % Families |
| Less than $10,000 | 167 | 3.4% |
| $10,000 to $14,999 | 103 | 2.1% |
| $15,000 to $24,999 | 315 | 6.4% |
| $25,000 to $34,999 | 295 | 6.0% |
| $35,000 to $49,999 | 640 | 13.0% |
| $50,000 to $74,999 | 881 | 17.9% |
| $75,000 to $99,999 | 896 | 18.2% |
| $100,000 to $149,999 | 960 | 19.5% |
| $150,000 to $199,999 | 359 | 7.3% |
| $200,000+ | 305 | 6.2% |
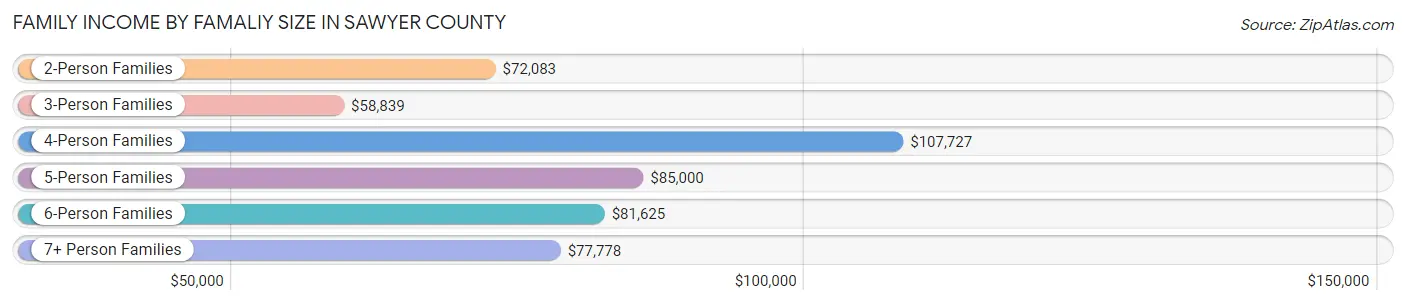
Family Income by Famaliy Size in Sawyer County
4-person families (646 | 13.1%) account for the highest median family income in Sawyer County with $107,727 per family, while 2-person families (3,140 | 63.8%) have the highest median income of $36,042 per family member.
| Income Bracket | # Families | Median Income |
| 2-Person Families | 3,140 (63.8%) | $72,083 |
| 3-Person Families | 742 (15.1%) | $58,839 |
| 4-Person Families | 646 (13.1%) | $107,727 |
| 5-Person Families | 218 (4.4%) | $85,000 |
| 6-Person Families | 129 (2.6%) | $81,625 |
| 7+ Person Families | 46 (0.9%) | $77,778 |
| Total | 4,921 (100.0%) | $76,367 |
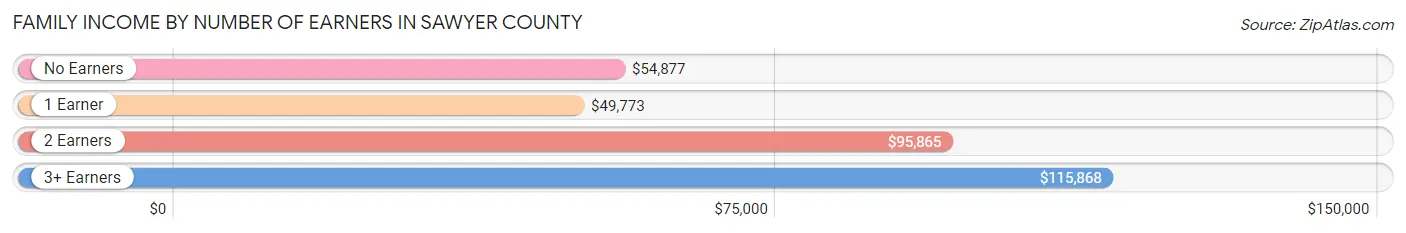
Family Income by Number of Earners in Sawyer County
The median family income in Sawyer County is $76,367, with families comprising 3+ earners (365) having the highest median family income of $115,868, while families with 1 earner (1,504) have the lowest median family income of $49,773, accounting for 7.4% and 30.6% of families, respectively.
| Number of Earners | # Families | Median Income |
| No Earners | 1,263 (25.7%) | $54,877 |
| 1 Earner | 1,504 (30.6%) | $49,773 |
| 2 Earners | 1,789 (36.3%) | $95,865 |
| 3+ Earners | 365 (7.4%) | $115,868 |
| Total | 4,921 (100.0%) | $76,367 |
Household Income in Sawyer County
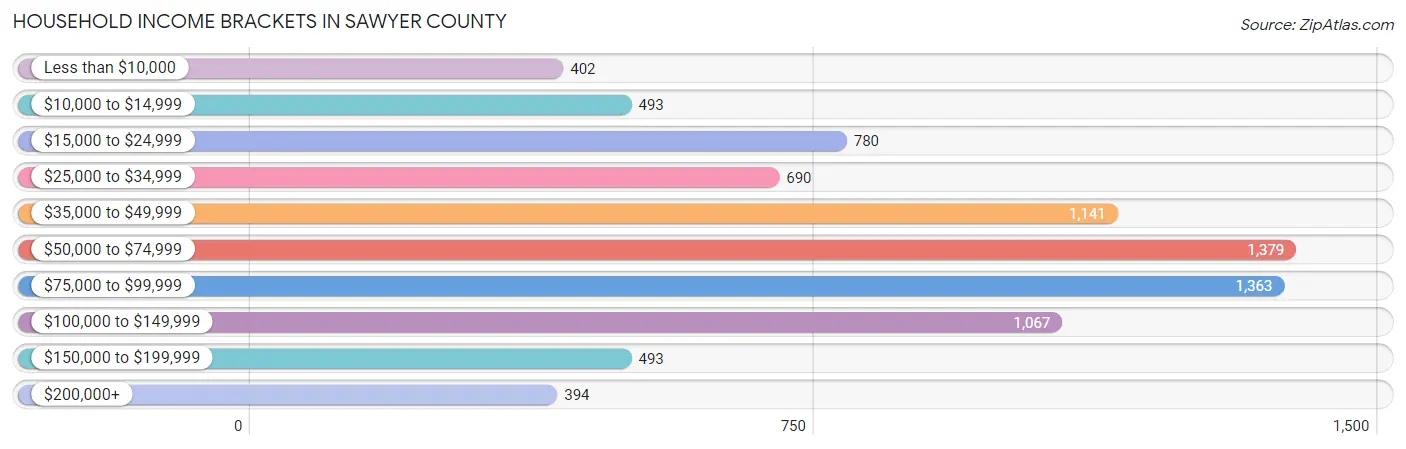
Household Income Brackets in Sawyer County
With 1,379 households falling in the category, the $50,000 to $74,999 income range is the most frequent in Sawyer County, accounting for 16.8% of all households. In contrast, only 394 households (4.8%) fall into the $200,000+ income bracket, making it the least populous group.
| Income Bracket | # Households | % Households |
| Less than $10,000 | 402 | 4.9% |
| $10,000 to $14,999 | 493 | 6.0% |
| $15,000 to $24,999 | 780 | 9.5% |
| $25,000 to $34,999 | 690 | 8.4% |
| $35,000 to $49,999 | 1,141 | 13.9% |
| $50,000 to $74,999 | 1,379 | 16.8% |
| $75,000 to $99,999 | 1,363 | 16.6% |
| $100,000 to $149,999 | 1,067 | 13.0% |
| $150,000 to $199,999 | 493 | 6.0% |
| $200,000+ | 394 | 4.8% |
Household Income by Householder Age in Sawyer County
The median household income in Sawyer County is $57,519, with the highest median household income of $75,462 found in the 45 to 64 years age bracket for the primary householder. A total of 3,128 households (38.1%) fall into this category. Meanwhile, the 15 to 24 years age bracket for the primary householder has the lowest median household income of $0, with 170 households (2.1%) in this group.
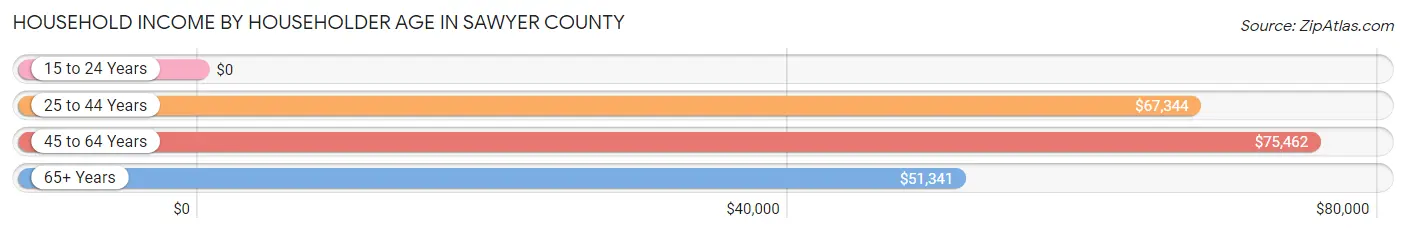
| Income Bracket | # Households | Median Income |
| 15 to 24 Years | 170 (2.1%) | $0 |
| 25 to 44 Years | 1,634 (19.9%) | $67,344 |
| 45 to 64 Years | 3,128 (38.1%) | $75,462 |
| 65+ Years | 3,278 (39.9%) | $51,341 |
| Total | 8,210 (100.0%) | $57,519 |
Poverty in Sawyer County
Income Below Poverty by Sex and Age in Sawyer County
With 12.1% poverty level for males and 14.4% for females among the residents of Sawyer County, 15 year old males and 16 and 17 year old females are the most vulnerable to poverty, with 24 males (44.4%) and 37 females (28.9%) in their respective age groups living below the poverty level.
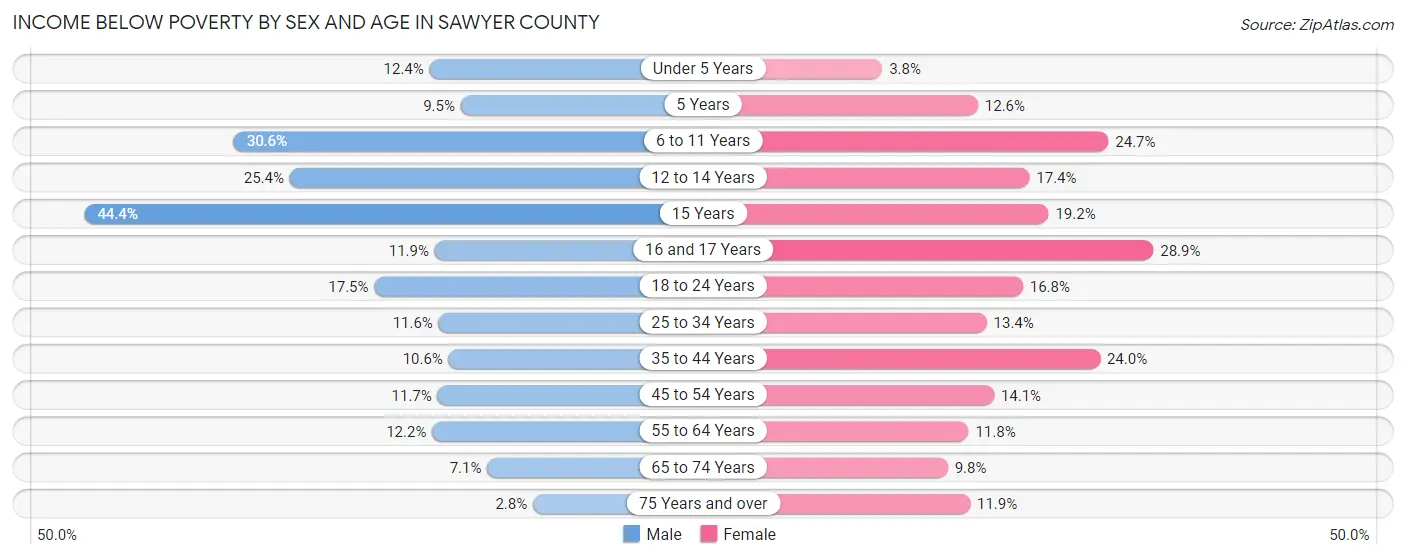
| Age Bracket | Male | Female |
| Under 5 Years | 52 (12.4%) | 13 (3.7%) |
| 5 Years | 8 (9.5%) | 12 (12.6%) |
| 6 to 11 Years | 148 (30.6%) | 143 (24.7%) |
| 12 to 14 Years | 82 (25.4%) | 43 (17.4%) |
| 15 Years | 24 (44.4%) | 28 (19.2%) |
| 16 and 17 Years | 29 (11.9%) | 37 (28.9%) |
| 18 to 24 Years | 104 (17.5%) | 85 (16.8%) |
| 25 to 34 Years | 111 (11.6%) | 98 (13.4%) |
| 35 to 44 Years | 81 (10.6%) | 190 (24.0%) |
| 45 to 54 Years | 124 (11.7%) | 143 (14.1%) |
| 55 to 64 Years | 205 (12.2%) | 190 (11.8%) |
| 65 to 74 Years | 110 (7.1%) | 140 (9.8%) |
| 75 Years and over | 24 (2.8%) | 109 (11.9%) |
| Total | 1,102 (12.1%) | 1,231 (14.4%) |
Income Above Poverty by Sex and Age in Sawyer County
According to the poverty statistics in Sawyer County, males aged 75 years and over and females aged under 5 years are the age groups that are most secure financially, with 97.2% of males and 96.3% of females in these age groups living above the poverty line.
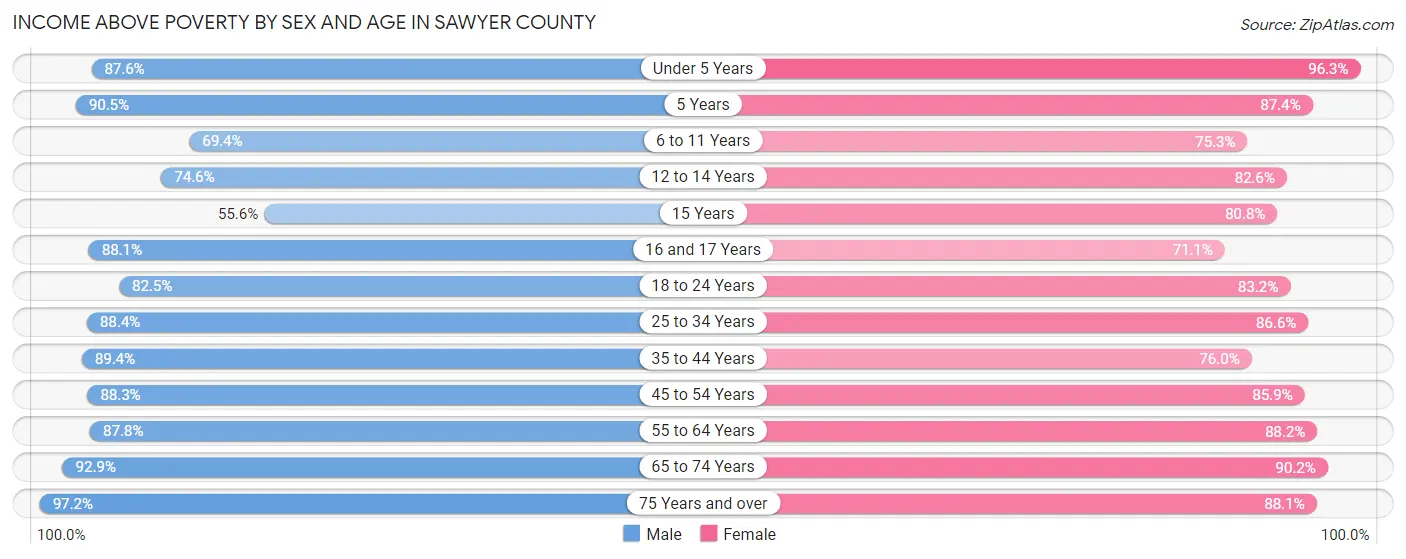
| Age Bracket | Male | Female |
| Under 5 Years | 367 (87.6%) | 334 (96.3%) |
| 5 Years | 76 (90.5%) | 83 (87.4%) |
| 6 to 11 Years | 336 (69.4%) | 435 (75.3%) |
| 12 to 14 Years | 241 (74.6%) | 204 (82.6%) |
| 15 Years | 30 (55.6%) | 118 (80.8%) |
| 16 and 17 Years | 214 (88.1%) | 91 (71.1%) |
| 18 to 24 Years | 489 (82.5%) | 421 (83.2%) |
| 25 to 34 Years | 848 (88.4%) | 631 (86.6%) |
| 35 to 44 Years | 680 (89.4%) | 603 (76.0%) |
| 45 to 54 Years | 939 (88.3%) | 870 (85.9%) |
| 55 to 64 Years | 1,479 (87.8%) | 1,426 (88.2%) |
| 65 to 74 Years | 1,449 (92.9%) | 1,284 (90.2%) |
| 75 Years and over | 831 (97.2%) | 807 (88.1%) |
| Total | 7,979 (87.9%) | 7,307 (85.6%) |
Income Below Poverty Among Married-Couple Families in Sawyer County
The poverty statistics for married-couple families in Sawyer County show that 4.2% or 160 of the total 3,801 families live below the poverty line. Families with 5 or more children have the highest poverty rate of 26.8%, comprising of 11 families. On the other hand, families with 1 or 2 children have the lowest poverty rate of 2.6%, which includes 19 families.
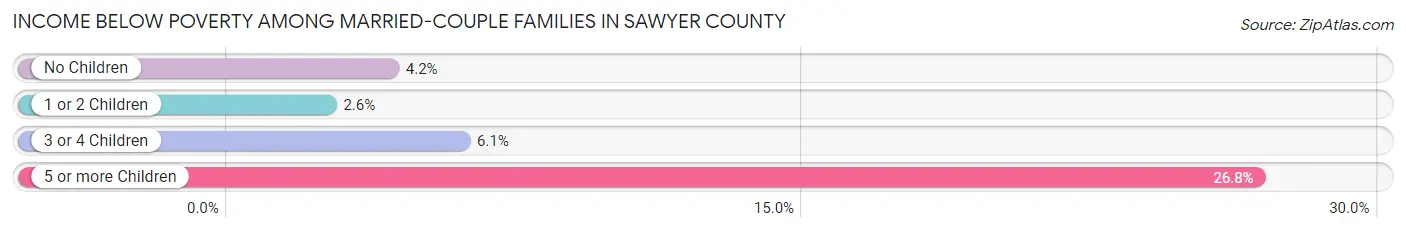
| Children | Above Poverty | Below Poverty |
| No Children | 2,736 (95.8%) | 120 (4.2%) |
| 1 or 2 Children | 720 (97.4%) | 19 (2.6%) |
| 3 or 4 Children | 155 (93.9%) | 10 (6.1%) |
| 5 or more Children | 30 (73.2%) | 11 (26.8%) |
| Total | 3,641 (95.8%) | 160 (4.2%) |
Income Below Poverty Among Single-Parent Households in Sawyer County
According to the poverty data in Sawyer County, 21.6% or 79 single-father households and 33.4% or 252 single-mother households are living below the poverty line. Among single-father households, those with 3 or 4 children have the highest poverty rate, with 39 households (100.0%) experiencing poverty. Likewise, among single-mother households, those with 5 or more children have the highest poverty rate, with 4 households (100.0%) falling below the poverty line.
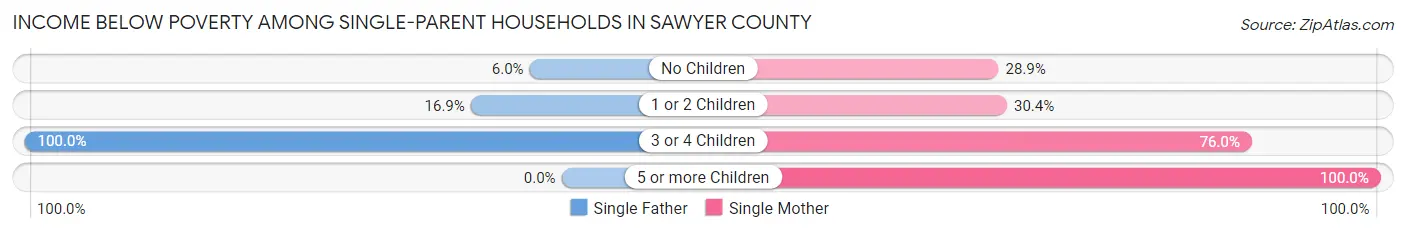
| Children | Single Father | Single Mother |
| No Children | 8 (6.0%) | 60 (28.8%) |
| 1 or 2 Children | 32 (16.9%) | 150 (30.4%) |
| 3 or 4 Children | 39 (100.0%) | 38 (76.0%) |
| 5 or more Children | 0 (0.0%) | 4 (100.0%) |
| Total | 79 (21.6%) | 252 (33.4%) |
Income Below Poverty Among Married-Couple vs Single-Parent Households in Sawyer County
The poverty data for Sawyer County shows that 160 of the married-couple family households (4.2%) and 331 of the single-parent households (29.5%) are living below the poverty level. Within the married-couple family households, those with 5 or more children have the highest poverty rate, with 11 households (26.8%) falling below the poverty line. Among the single-parent households, those with 3 or 4 children have the highest poverty rate, with 77 household (86.5%) living below poverty.
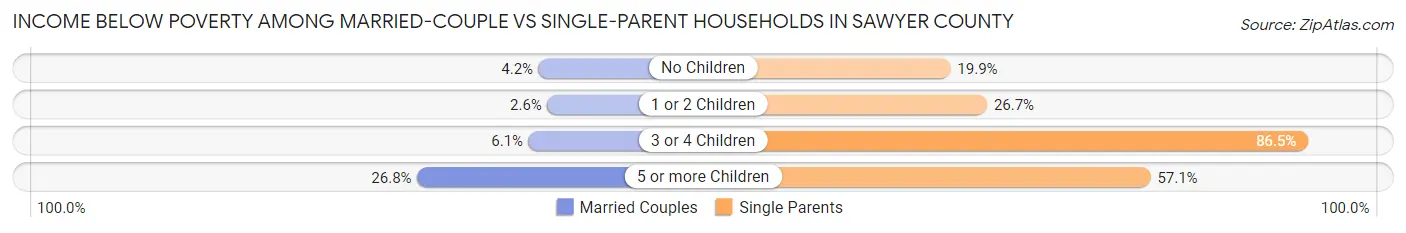
| Children | Married-Couple Families | Single-Parent Households |
| No Children | 120 (4.2%) | 68 (19.9%) |
| 1 or 2 Children | 19 (2.6%) | 182 (26.7%) |
| 3 or 4 Children | 10 (6.1%) | 77 (86.5%) |
| 5 or more Children | 11 (26.8%) | 4 (57.1%) |
| Total | 160 (4.2%) | 331 (29.5%) |
Race in Sawyer County
The most populous races in Sawyer County are White / Caucasian (14,007 | 77.6%), Native / Alaskan (2,692 | 14.9%), and Two or more Races (958 | 5.3%).
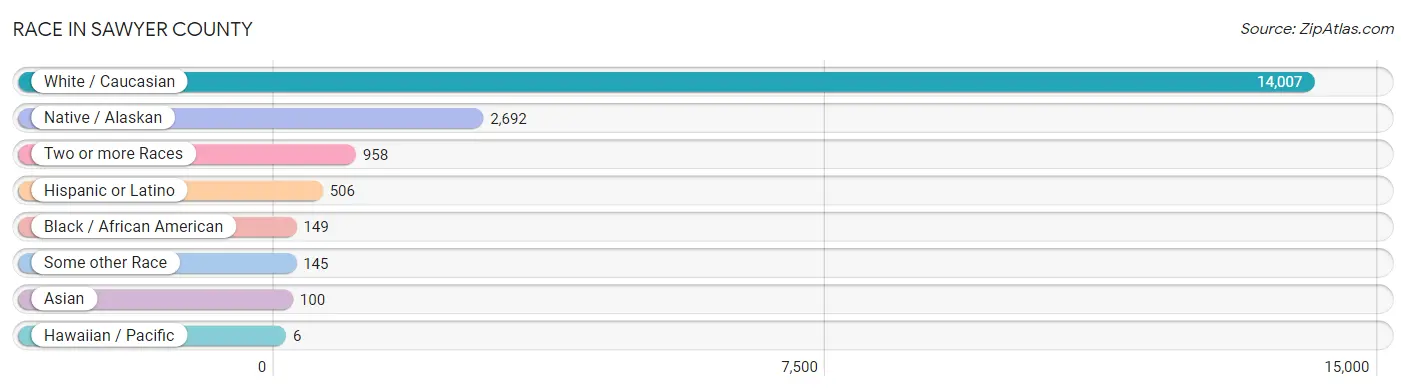
| Race | # Population | % Population |
| Asian | 100 | 0.5% |
| Black / African American | 149 | 0.8% |
| Hawaiian / Pacific | 6 | 0.0% |
| Hispanic or Latino | 506 | 2.8% |
| Native / Alaskan | 2,692 | 14.9% |
| White / Caucasian | 14,007 | 77.6% |
| Two or more Races | 958 | 5.3% |
| Some other Race | 145 | 0.8% |
| Total | 18,057 | 100.0% |
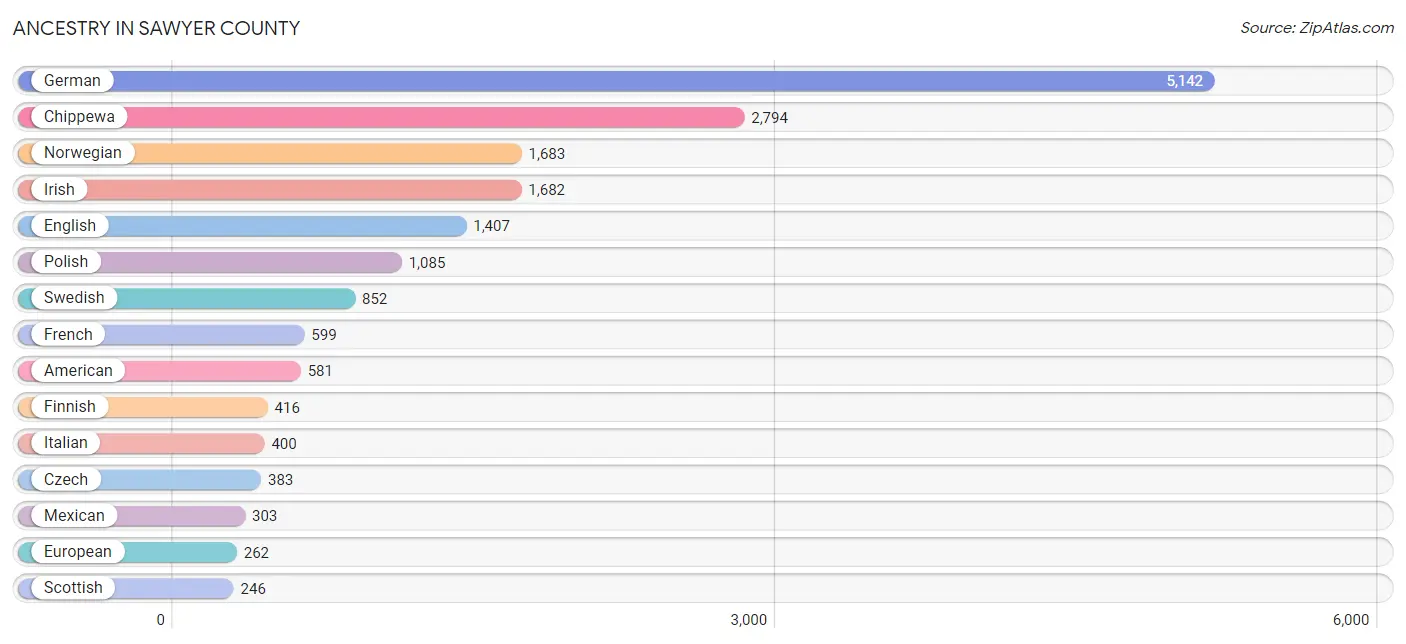
Ancestry in Sawyer County
The most populous ancestries reported in Sawyer County are German (5,142 | 28.5%), Chippewa (2,794 | 15.5%), Norwegian (1,683 | 9.3%), Irish (1,682 | 9.3%), and English (1,407 | 7.8%), together accounting for 70.4% of all Sawyer County residents.
| Ancestry | # Population | % Population |
| African | 8 | 0.0% |
| American | 581 | 3.2% |
| Arab | 3 | 0.0% |
| Argentinean | 12 | 0.1% |
| Australian | 2 | 0.0% |
| Austrian | 17 | 0.1% |
| Bangladeshi | 23 | 0.1% |
| Belgian | 14 | 0.1% |
| Bermudan | 3 | 0.0% |
| British | 75 | 0.4% |
| British West Indian | 1 | 0.0% |
| Bulgarian | 7 | 0.0% |
| Burmese | 1 | 0.0% |
| Canadian | 28 | 0.2% |
| Celtic | 6 | 0.0% |
| Central American | 6 | 0.0% |
| Cherokee | 19 | 0.1% |
| Cheyenne | 5 | 0.0% |
| Chippewa | 2,794 | 15.5% |
| Comanche | 4 | 0.0% |
| Creek | 4 | 0.0% |
| Croatian | 26 | 0.1% |
| Cuban | 26 | 0.1% |
| Czech | 383 | 2.1% |
| Czechoslovakian | 46 | 0.3% |
| Danish | 190 | 1.1% |
| Delaware | 1 | 0.0% |
| Dominican | 17 | 0.1% |
| Dutch | 195 | 1.1% |
| Eastern European | 13 | 0.1% |
| English | 1,407 | 7.8% |
| Estonian | 2 | 0.0% |
| European | 262 | 1.5% |
| Finnish | 416 | 2.3% |
| French | 599 | 3.3% |
| French American Indian | 92 | 0.5% |
| French Canadian | 230 | 1.3% |
| German | 5,142 | 28.5% |
| Greek | 55 | 0.3% |
| Hungarian | 108 | 0.6% |
| Icelander | 10 | 0.1% |
| Indian (Asian) | 2 | 0.0% |
| Indonesian | 10 | 0.1% |
| Irish | 1,682 | 9.3% |
| Iroquois | 55 | 0.3% |
| Italian | 400 | 2.2% |
| Japanese | 1 | 0.0% |
| Korean | 20 | 0.1% |
| Lebanese | 3 | 0.0% |
| Lithuanian | 101 | 0.6% |
| Luxembourger | 24 | 0.1% |
| Malaysian | 15 | 0.1% |
| Menominee | 4 | 0.0% |
| Mexican | 303 | 1.7% |
| Mexican American Indian | 6 | 0.0% |
| Navajo | 1 | 0.0% |
| Northern European | 23 | 0.1% |
| Norwegian | 1,683 | 9.3% |
| Ottawa | 25 | 0.1% |
| Pakistani | 4 | 0.0% |
| Panamanian | 6 | 0.0% |
| Pennsylvania German | 7 | 0.0% |
| Polish | 1,085 | 6.0% |
| Portuguese | 1 | 0.0% |
| Potawatomi | 4 | 0.0% |
| Pueblo | 1 | 0.0% |
| Puerto Rican | 57 | 0.3% |
| Romanian | 2 | 0.0% |
| Russian | 79 | 0.4% |
| Scandinavian | 153 | 0.9% |
| Scotch-Irish | 57 | 0.3% |
| Scottish | 246 | 1.4% |
| Seminole | 1 | 0.0% |
| Serbian | 7 | 0.0% |
| Sioux | 10 | 0.1% |
| Slavic | 21 | 0.1% |
| Slovak | 19 | 0.1% |
| Slovene | 28 | 0.2% |
| South American | 12 | 0.1% |
| Spanish | 67 | 0.4% |
| Sri Lankan | 1 | 0.0% |
| Subsaharan African | 8 | 0.0% |
| Swedish | 852 | 4.7% |
| Swiss | 185 | 1.0% |
| Thai | 19 | 0.1% |
| Ukrainian | 50 | 0.3% |
| Vietnamese | 14 | 0.1% |
| Welsh | 46 | 0.3% | View All 88 Rows |
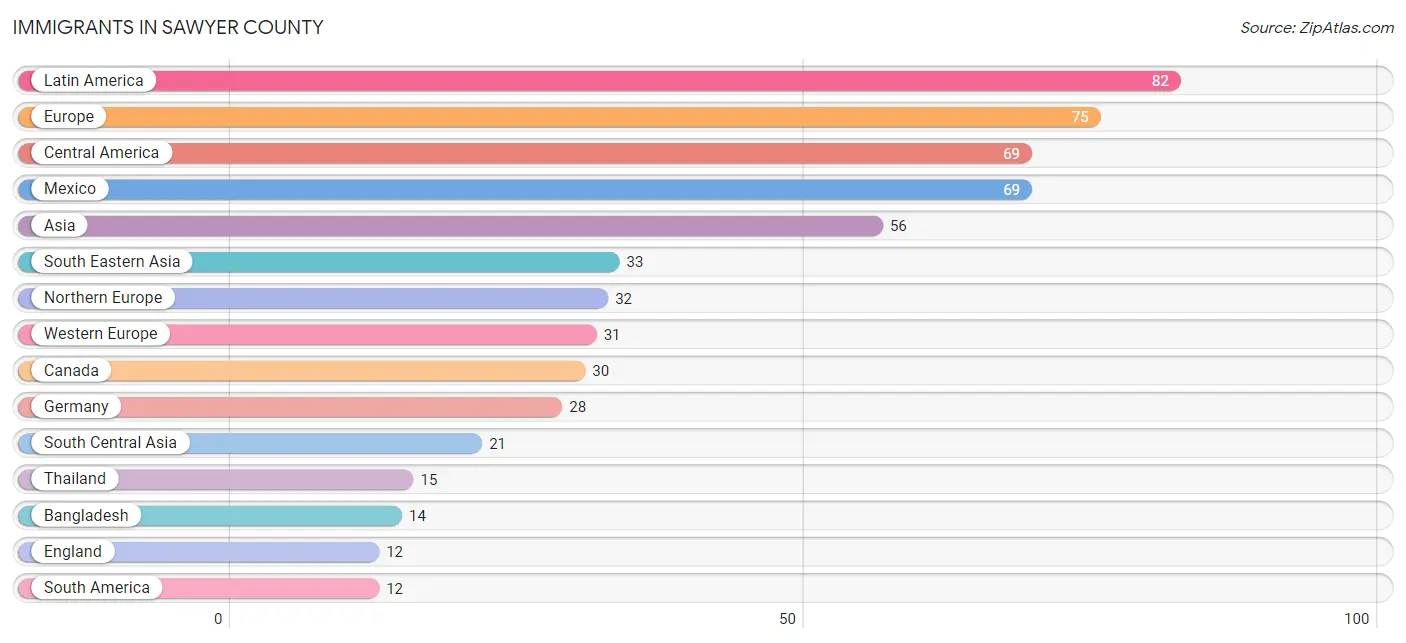
Immigrants in Sawyer County
The most numerous immigrant groups reported in Sawyer County came from Latin America (82 | 0.4%), Europe (75 | 0.4%), Central America (69 | 0.4%), Mexico (69 | 0.4%), and Asia (56 | 0.3%), together accounting for 1.9% of all Sawyer County residents.
| Immigration Origin | # Population | % Population |
| Asia | 56 | 0.3% |
| Azores | 1 | 0.0% |
| Bangladesh | 14 | 0.1% |
| Cambodia | 1 | 0.0% |
| Canada | 30 | 0.2% |
| Caribbean | 1 | 0.0% |
| Central America | 69 | 0.4% |
| China | 2 | 0.0% |
| Denmark | 10 | 0.1% |
| Eastern Asia | 2 | 0.0% |
| Eastern Europe | 8 | 0.0% |
| England | 12 | 0.1% |
| Europe | 75 | 0.4% |
| Germany | 28 | 0.2% |
| Greece | 3 | 0.0% |
| Grenada | 1 | 0.0% |
| India | 7 | 0.0% |
| Laos | 2 | 0.0% |
| Latin America | 82 | 0.4% |
| Mexico | 69 | 0.4% |
| Netherlands | 1 | 0.0% |
| Northern Europe | 32 | 0.2% |
| Philippines | 10 | 0.1% |
| Portugal | 1 | 0.0% |
| Scotland | 4 | 0.0% |
| South America | 12 | 0.1% |
| South Central Asia | 21 | 0.1% |
| South Eastern Asia | 33 | 0.2% |
| Southern Europe | 4 | 0.0% |
| Switzerland | 2 | 0.0% |
| Thailand | 15 | 0.1% |
| Ukraine | 8 | 0.0% |
| Vietnam | 1 | 0.0% |
| Western Europe | 31 | 0.2% | View All 34 Rows |
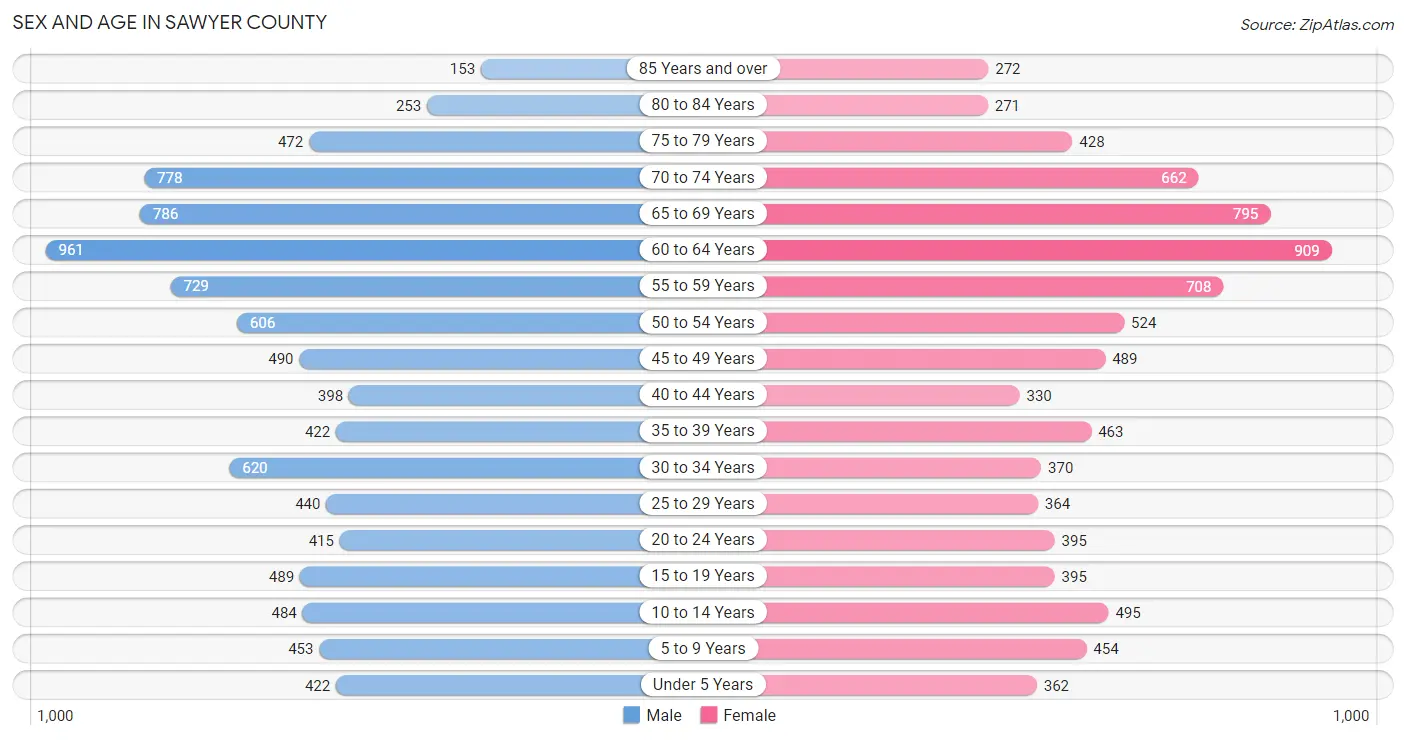
Sex and Age in Sawyer County
Sex and Age in Sawyer County
The most populous age groups in Sawyer County are 60 to 64 Years (961 | 10.3%) for men and 60 to 64 Years (909 | 10.5%) for women.
| Age Bracket | Male | Female |
| Under 5 Years | 422 (4.5%) | 362 (4.2%) |
| 5 to 9 Years | 453 (4.8%) | 454 (5.2%) |
| 10 to 14 Years | 484 (5.2%) | 495 (5.7%) |
| 15 to 19 Years | 489 (5.2%) | 395 (4.5%) |
| 20 to 24 Years | 415 (4.4%) | 395 (4.5%) |
| 25 to 29 Years | 440 (4.7%) | 364 (4.2%) |
| 30 to 34 Years | 620 (6.6%) | 370 (4.3%) |
| 35 to 39 Years | 422 (4.5%) | 463 (5.3%) |
| 40 to 44 Years | 398 (4.3%) | 330 (3.8%) |
| 45 to 49 Years | 490 (5.2%) | 489 (5.6%) |
| 50 to 54 Years | 606 (6.5%) | 524 (6.0%) |
| 55 to 59 Years | 729 (7.8%) | 708 (8.2%) |
| 60 to 64 Years | 961 (10.3%) | 909 (10.5%) |
| 65 to 69 Years | 786 (8.4%) | 795 (9.1%) |
| 70 to 74 Years | 778 (8.3%) | 662 (7.6%) |
| 75 to 79 Years | 472 (5.0%) | 428 (4.9%) |
| 80 to 84 Years | 253 (2.7%) | 271 (3.1%) |
| 85 Years and over | 153 (1.6%) | 272 (3.1%) |
| Total | 9,371 (100.0%) | 8,686 (100.0%) |
Families and Households in Sawyer County
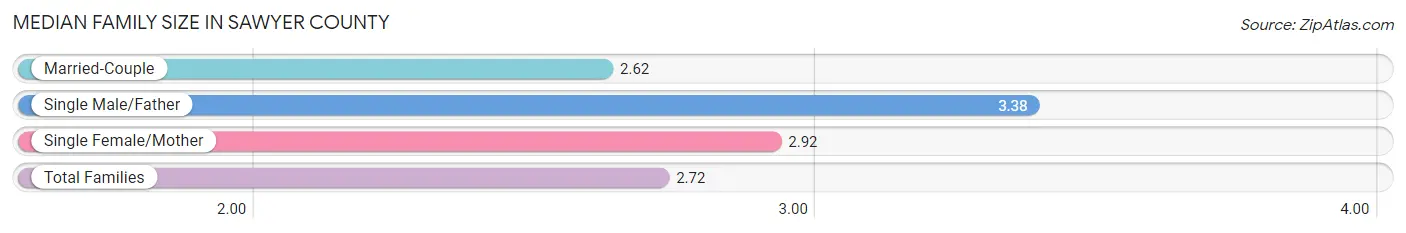
Median Family Size in Sawyer County
The median family size in Sawyer County is 2.72 persons per family, with single male/father families (365 | 7.4%) accounting for the largest median family size of 3.38 persons per family. On the other hand, married-couple families (3,801 | 77.2%) represent the smallest median family size with 2.62 persons per family.
| Family Type | # Families | Family Size |
| Married-Couple | 3,801 (77.2%) | 2.62 |
| Single Male/Father | 365 (7.4%) | 3.38 |
| Single Female/Mother | 755 (15.3%) | 2.92 |
| Total Families | 4,921 (100.0%) | 2.72 |
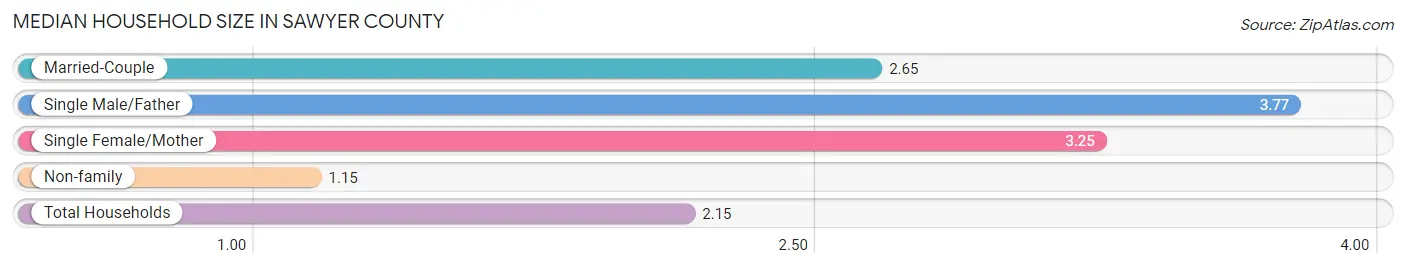
Median Household Size in Sawyer County
The median household size in Sawyer County is 2.15 persons per household, with single male/father households (365 | 4.4%) accounting for the largest median household size of 3.77 persons per household. non-family households (3,289 | 40.1%) represent the smallest median household size with 1.15 persons per household.
| Household Type | # Households | Household Size |
| Married-Couple | 3,801 (46.3%) | 2.65 |
| Single Male/Father | 365 (4.4%) | 3.77 |
| Single Female/Mother | 755 (9.2%) | 3.25 |
| Non-family | 3,289 (40.1%) | 1.15 |
| Total Households | 8,210 (100.0%) | 2.15 |
Household Size by Marriage Status in Sawyer County
Out of a total of 8,210 households in Sawyer County, 4,921 (59.9%) are family households, while 3,289 (40.1%) are nonfamily households. The most numerous type of family households are 2-person households, comprising 2,977, and the most common type of nonfamily households are 1-person households, comprising 2,761.
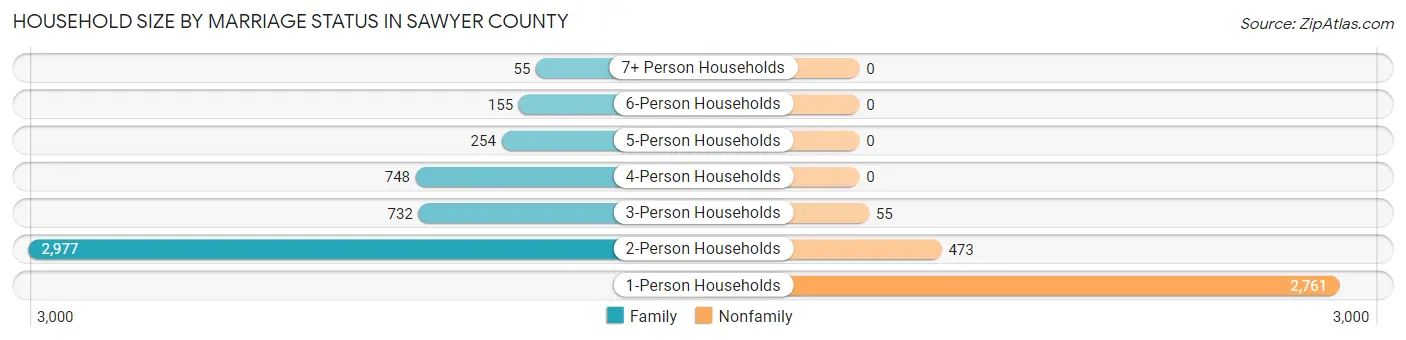
| Household Size | Family Households | Nonfamily Households |
| 1-Person Households | - | 2,761 (33.6%) |
| 2-Person Households | 2,977 (36.3%) | 473 (5.8%) |
| 3-Person Households | 732 (8.9%) | 55 (0.7%) |
| 4-Person Households | 748 (9.1%) | 0 (0.0%) |
| 5-Person Households | 254 (3.1%) | 0 (0.0%) |
| 6-Person Households | 155 (1.9%) | 0 (0.0%) |
| 7+ Person Households | 55 (0.7%) | 0 (0.0%) |
| Total | 4,921 (59.9%) | 3,289 (40.1%) |
Female Fertility in Sawyer County
Fertility by Age in Sawyer County
Average fertility rate in Sawyer County is 48.0 births per 1,000 women. Women in the age bracket of 20 to 34 years have the highest fertility rate with 106.0 births per 1,000 women. Women in the age bracket of 20 to 34 years acount for 85.7% of all women with births.
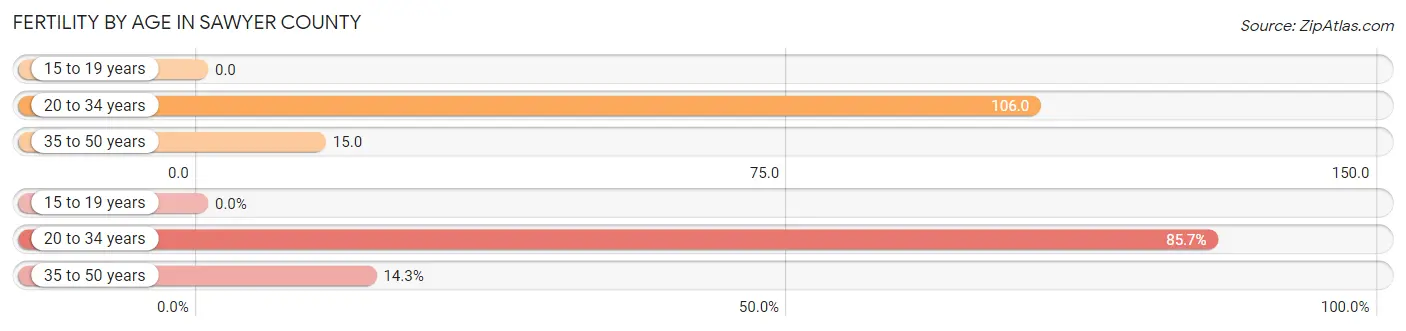
| Age Bracket | Women with Births | Births / 1,000 Women |
| 15 to 19 years | 0 (0.0%) | 0.0 |
| 20 to 34 years | 120 (85.7%) | 106.0 |
| 35 to 50 years | 20 (14.3%) | 15.0 |
| Total | 140 (100.0%) | 48.0 |
Fertility by Age by Marriage Status in Sawyer County
57.1% of women with births (140) in Sawyer County are married. The highest percentage of unmarried women with births falls into 20 to 34 years age bracket with 43.3% of them unmarried at the time of birth, while the lowest percentage of unmarried women with births belong to 35 to 50 years age bracket with 40.0% of them unmarried.
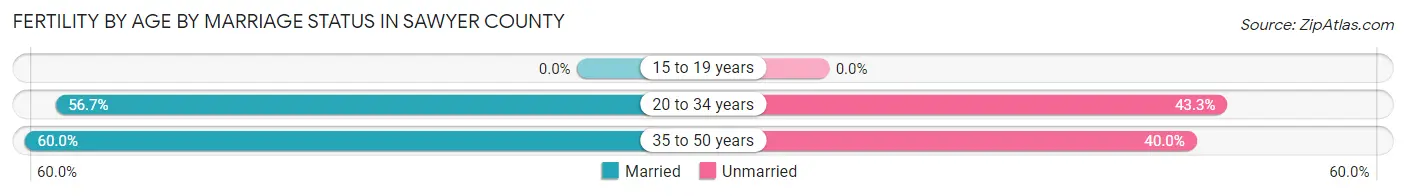
| Age Bracket | Married | Unmarried |
| 15 to 19 years | 0 (0.0%) | 0 (0.0%) |
| 20 to 34 years | 68 (56.7%) | 52 (43.3%) |
| 35 to 50 years | 12 (60.0%) | 8 (40.0%) |
| Total | 80 (57.1%) | 60 (42.9%) |
Fertility by Education in Sawyer County
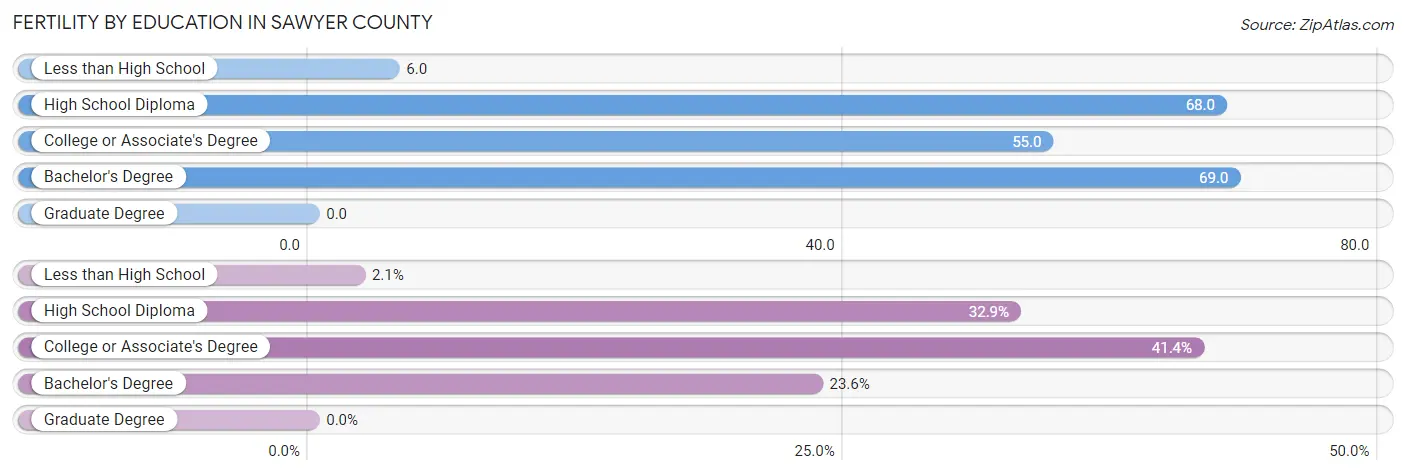
| Educational Attainment | Women with Births | Births / 1,000 Women |
| Less than High School | 3 (2.1%) | 6.0 |
| High School Diploma | 46 (32.9%) | 68.0 |
| College or Associate's Degree | 58 (41.4%) | 55.0 |
| Bachelor's Degree | 33 (23.6%) | 69.0 |
| Graduate Degree | 0 (0.0%) | 0.0 |
| Total | 140 (100.0%) | 48.0 |
Fertility by Education by Marriage Status in Sawyer County
42.9% of women with births in Sawyer County are unmarried. Women with the educational attainment of bachelor's degree are most likely to be married with 100.0% of them married at childbirth, while women with the educational attainment of less than high school are least likely to be married with 100.0% of them unmarried at childbirth.
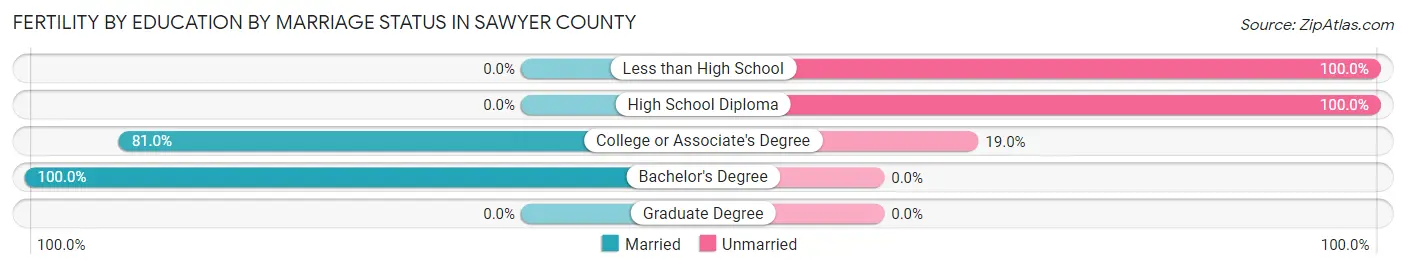
| Educational Attainment | Married | Unmarried |
| Less than High School | 0 (0.0%) | 3 (100.0%) |
| High School Diploma | 0 (0.0%) | 46 (100.0%) |
| College or Associate's Degree | 47 (81.0%) | 11 (19.0%) |
| Bachelor's Degree | 33 (100.0%) | 0 (0.0%) |
| Graduate Degree | 0 (0.0%) | 0 (0.0%) |
| Total | 80 (57.1%) | 60 (42.9%) |
Employment Characteristics in Sawyer County
Employment by Class of Employer in Sawyer County
Among the 7,703 employed individuals in Sawyer County, private company employees (4,190 | 54.4%), local government employees (953 | 12.4%), and not-for-profit organizations (775 | 10.1%) make up the most common classes of employment.
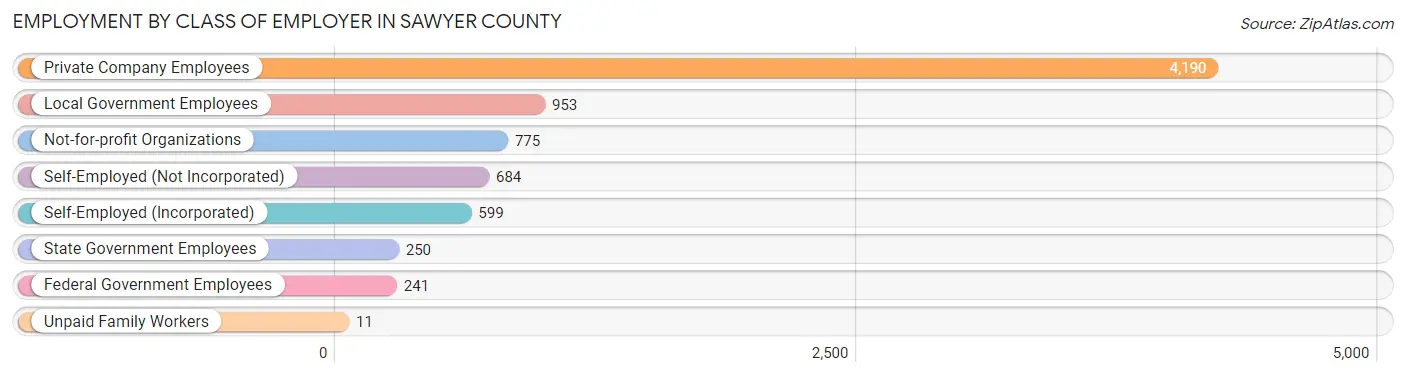
| Employer Class | # Employees | % Employees |
| Private Company Employees | 4,190 | 54.4% |
| Self-Employed (Incorporated) | 599 | 7.8% |
| Self-Employed (Not Incorporated) | 684 | 8.9% |
| Not-for-profit Organizations | 775 | 10.1% |
| Local Government Employees | 953 | 12.4% |
| State Government Employees | 250 | 3.3% |
| Federal Government Employees | 241 | 3.1% |
| Unpaid Family Workers | 11 | 0.1% |
| Total | 7,703 | 100.0% |
Employment Status by Age in Sawyer County
According to the labor force statistics for Sawyer County, out of the total population over 16 years of age (15,187), 55.0% or 8,353 individuals are in the labor force, with 6.5% or 543 of them unemployed. The age group with the highest labor force participation rate is 30 to 34 years, with 86.6% or 857 individuals in the labor force. Within the labor force, the 30 to 34 years age range has the highest percentage of unemployed individuals, with 21.0% or 180 of them being unemployed.
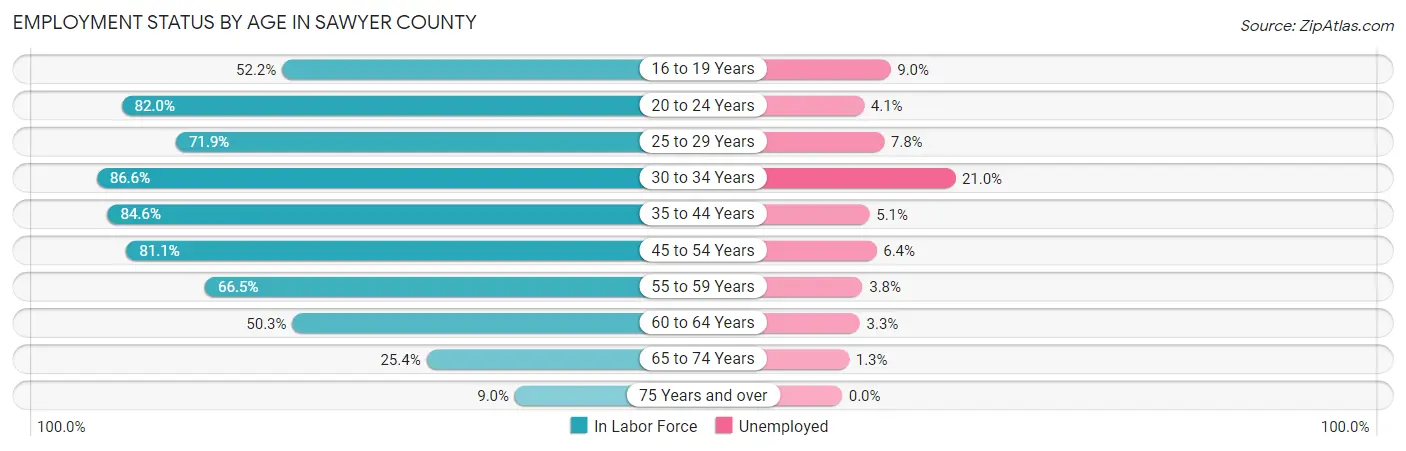
| Age Bracket | In Labor Force | Unemployed |
| 16 to 19 Years | 357 (52.2%) | 32 (9.0%) |
| 20 to 24 Years | 664 (82.0%) | 27 (4.1%) |
| 25 to 29 Years | 578 (71.9%) | 45 (7.8%) |
| 30 to 34 Years | 857 (86.6%) | 180 (21.0%) |
| 35 to 44 Years | 1,365 (84.6%) | 70 (5.1%) |
| 45 to 54 Years | 1,710 (81.1%) | 109 (6.4%) |
| 55 to 59 Years | 956 (66.5%) | 36 (3.8%) |
| 60 to 64 Years | 941 (50.3%) | 31 (3.3%) |
| 65 to 74 Years | 767 (25.4%) | 10 (1.3%) |
| 75 Years and over | 166 (9.0%) | 0 (0.0%) |
| Total | 8,353 (55.0%) | 543 (6.5%) |
Employment Status by Educational Attainment in Sawyer County
According to labor force statistics for Sawyer County, 72.6% of individuals (6,405) out of the total population between 25 and 64 years of age (8,823) are in the labor force, with 7.4% or 474 of them being unemployed. The group with the highest labor force participation rate are those with the educational attainment of bachelor's degree or higher, with 79.1% or 1,826 individuals in the labor force. Within the labor force, individuals with high school diploma education have the highest percentage of unemployment, with 10.2% or 178 of them being unemployed.
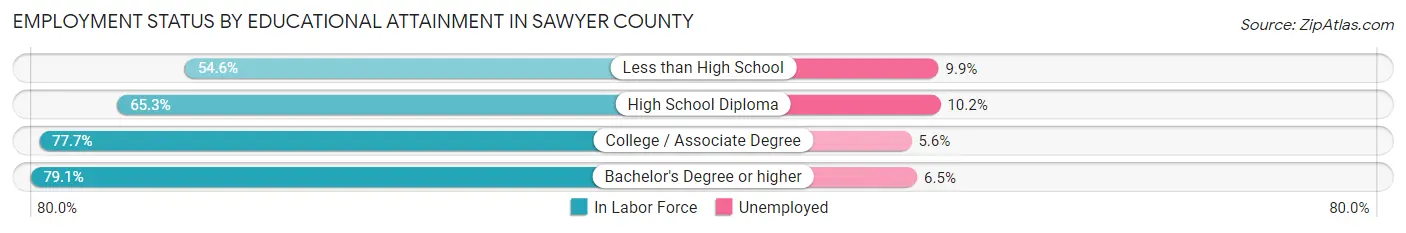
| Educational Attainment | In Labor Force | Unemployed |
| Less than High School | 352 (54.6%) | 64 (9.9%) |
| High School Diploma | 1,749 (65.3%) | 273 (10.2%) |
| College / Associate Degree | 2,479 (77.7%) | 179 (5.6%) |
| Bachelor's Degree or higher | 1,826 (79.1%) | 150 (6.5%) |
| Total | 6,405 (72.6%) | 653 (7.4%) |
Employment Occupations by Sex in Sawyer County
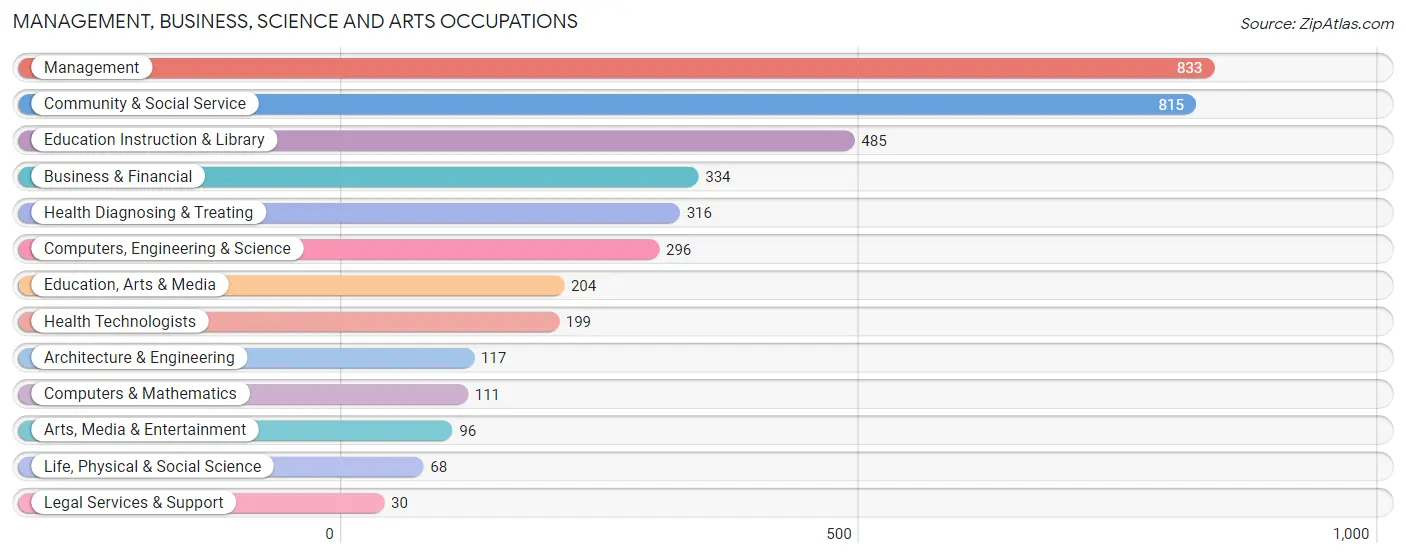
Management, Business, Science and Arts Occupations
The most common Management, Business, Science and Arts occupations in Sawyer County are Management (833 | 10.6%), Community & Social Service (815 | 10.4%), Education Instruction & Library (485 | 6.2%), Business & Financial (334 | 4.3%), and Health Diagnosing & Treating (316 | 4.0%).
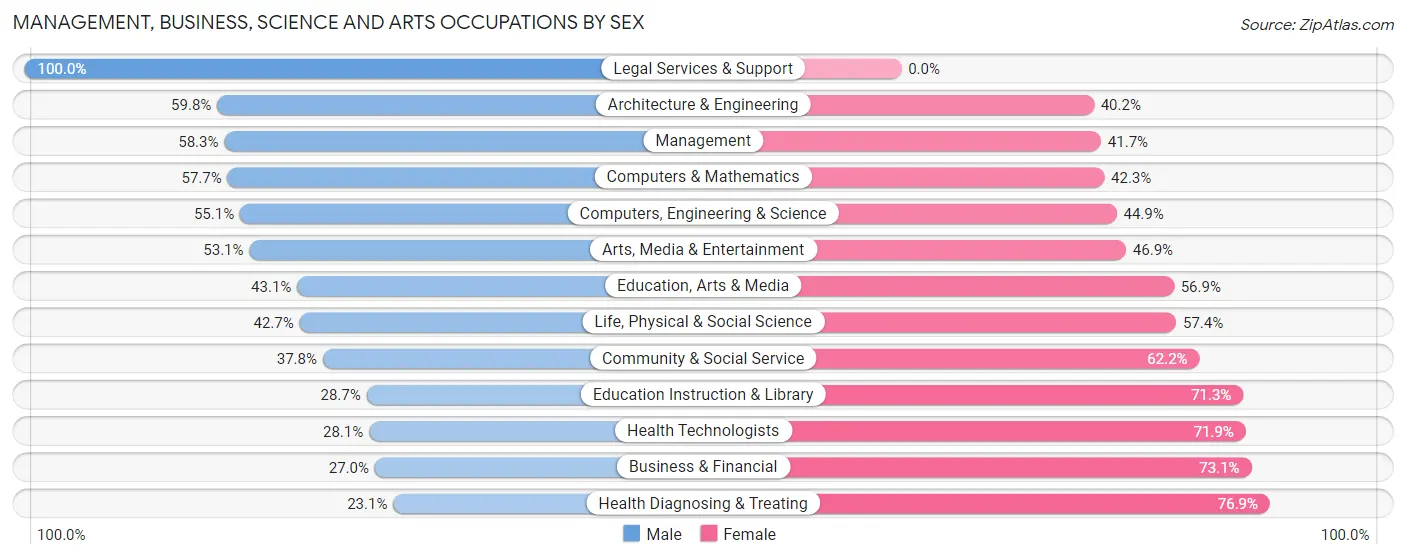
Management, Business, Science and Arts Occupations by Sex
Within the Management, Business, Science and Arts occupations in Sawyer County, the most male-oriented occupations are Legal Services & Support (100.0%), Architecture & Engineering (59.8%), and Management (58.3%), while the most female-oriented occupations are Health Diagnosing & Treating (76.9%), Business & Financial (73.1%), and Health Technologists (71.9%).
| Occupation | Male | Female |
| Management | 486 (58.3%) | 347 (41.7%) |
| Business & Financial | 90 (27.0%) | 244 (73.1%) |
| Computers, Engineering & Science | 163 (55.1%) | 133 (44.9%) |
| Computers & Mathematics | 64 (57.7%) | 47 (42.3%) |
| Architecture & Engineering | 70 (59.8%) | 47 (40.2%) |
| Life, Physical & Social Science | 29 (42.6%) | 39 (57.4%) |
| Community & Social Service | 308 (37.8%) | 507 (62.2%) |
| Education, Arts & Media | 88 (43.1%) | 116 (56.9%) |
| Legal Services & Support | 30 (100.0%) | 0 (0.0%) |
| Education Instruction & Library | 139 (28.7%) | 346 (71.3%) |
| Arts, Media & Entertainment | 51 (53.1%) | 45 (46.9%) |
| Health Diagnosing & Treating | 73 (23.1%) | 243 (76.9%) |
| Health Technologists | 56 (28.1%) | 143 (71.9%) |
| Total (Category) | 1,120 (43.2%) | 1,474 (56.8%) |
| Total (Overall) | 4,104 (52.5%) | 3,715 (47.5%) |
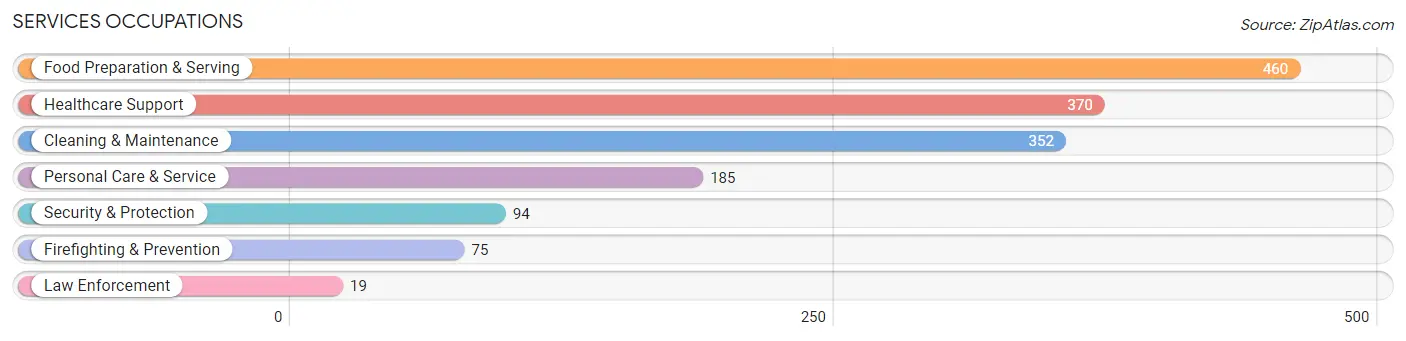
Services Occupations
The most common Services occupations in Sawyer County are Food Preparation & Serving (460 | 5.9%), Healthcare Support (370 | 4.7%), Cleaning & Maintenance (352 | 4.5%), Personal Care & Service (185 | 2.4%), and Security & Protection (94 | 1.2%).
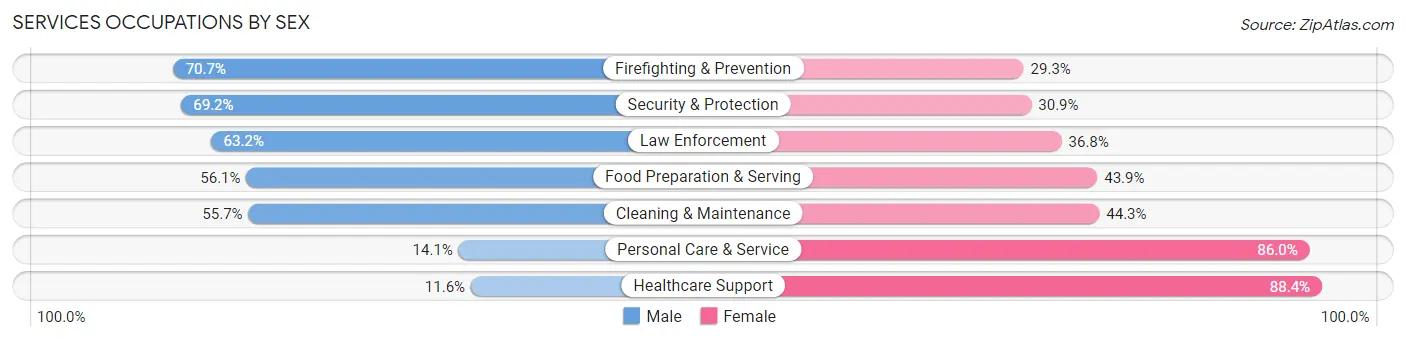
Services Occupations by Sex
Within the Services occupations in Sawyer County, the most male-oriented occupations are Firefighting & Prevention (70.7%), Security & Protection (69.2%), and Law Enforcement (63.2%), while the most female-oriented occupations are Healthcare Support (88.4%), Personal Care & Service (86.0%), and Cleaning & Maintenance (44.3%).
| Occupation | Male | Female |
| Healthcare Support | 43 (11.6%) | 327 (88.4%) |
| Security & Protection | 65 (69.2%) | 29 (30.8%) |
| Firefighting & Prevention | 53 (70.7%) | 22 (29.3%) |
| Law Enforcement | 12 (63.2%) | 7 (36.8%) |
| Food Preparation & Serving | 258 (56.1%) | 202 (43.9%) |
| Cleaning & Maintenance | 196 (55.7%) | 156 (44.3%) |
| Personal Care & Service | 26 (14.1%) | 159 (86.0%) |
| Total (Category) | 588 (40.3%) | 873 (59.8%) |
| Total (Overall) | 4,104 (52.5%) | 3,715 (47.5%) |
Sales and Office Occupations
The most common Sales and Office occupations in Sawyer County are Sales & Related (826 | 10.6%), and Office & Administration (824 | 10.5%).
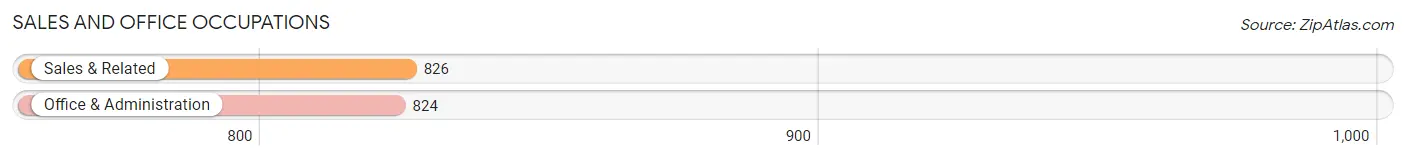
Sales and Office Occupations by Sex
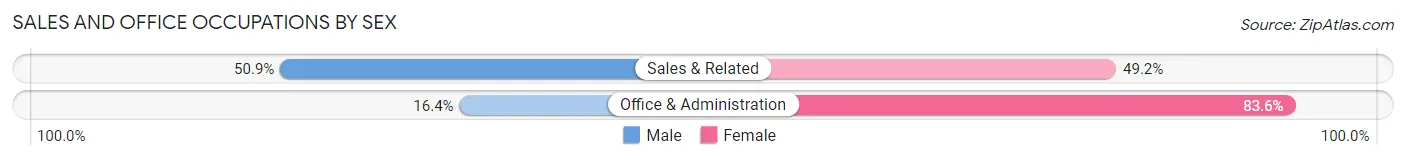
| Occupation | Male | Female |
| Sales & Related | 420 (50.8%) | 406 (49.1%) |
| Office & Administration | 135 (16.4%) | 689 (83.6%) |
| Total (Category) | 555 (33.6%) | 1,095 (66.4%) |
| Total (Overall) | 4,104 (52.5%) | 3,715 (47.5%) |
Natural Resources, Construction and Maintenance Occupations
The most common Natural Resources, Construction and Maintenance occupations in Sawyer County are Construction & Extraction (428 | 5.5%), Installation, Maintenance & Repair (249 | 3.2%), and Farming, Fishing & Forestry (126 | 1.6%).
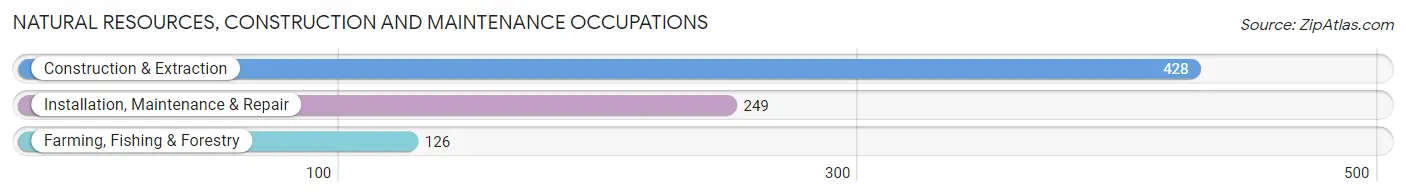
Natural Resources, Construction and Maintenance Occupations by Sex
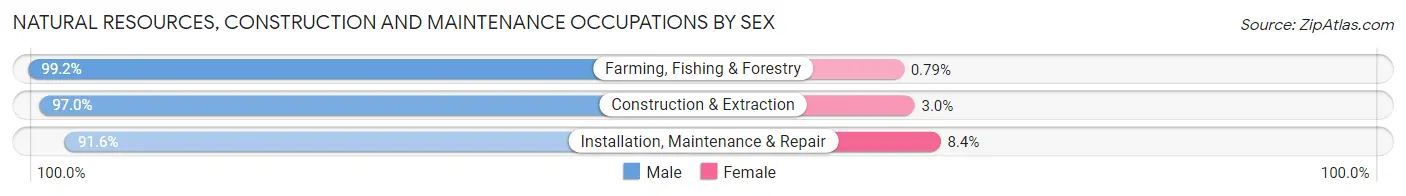
| Occupation | Male | Female |
| Farming, Fishing & Forestry | 125 (99.2%) | 1 (0.8%) |
| Construction & Extraction | 415 (97.0%) | 13 (3.0%) |
| Installation, Maintenance & Repair | 228 (91.6%) | 21 (8.4%) |
| Total (Category) | 768 (95.6%) | 35 (4.4%) |
| Total (Overall) | 4,104 (52.5%) | 3,715 (47.5%) |
Production, Transportation and Moving Occupations
The most common Production, Transportation and Moving occupations in Sawyer County are Production (555 | 7.1%), Material Moving (379 | 4.9%), and Transportation (377 | 4.8%).
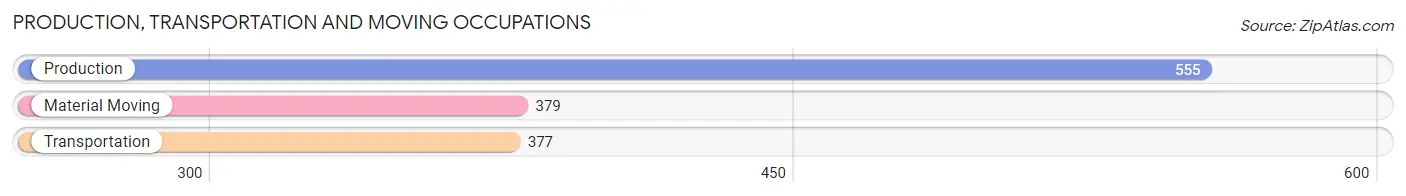
Production, Transportation and Moving Occupations by Sex
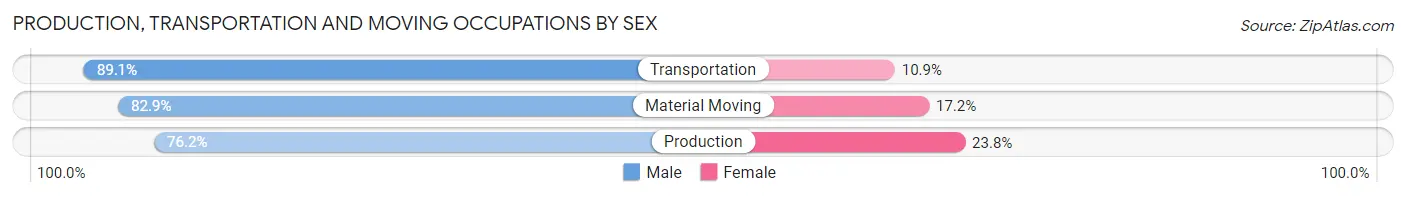
| Occupation | Male | Female |
| Production | 423 (76.2%) | 132 (23.8%) |
| Transportation | 336 (89.1%) | 41 (10.9%) |
| Material Moving | 314 (82.9%) | 65 (17.2%) |
| Total (Category) | 1,073 (81.9%) | 238 (18.1%) |
| Total (Overall) | 4,104 (52.5%) | 3,715 (47.5%) |
Employment Industries by Sex in Sawyer County
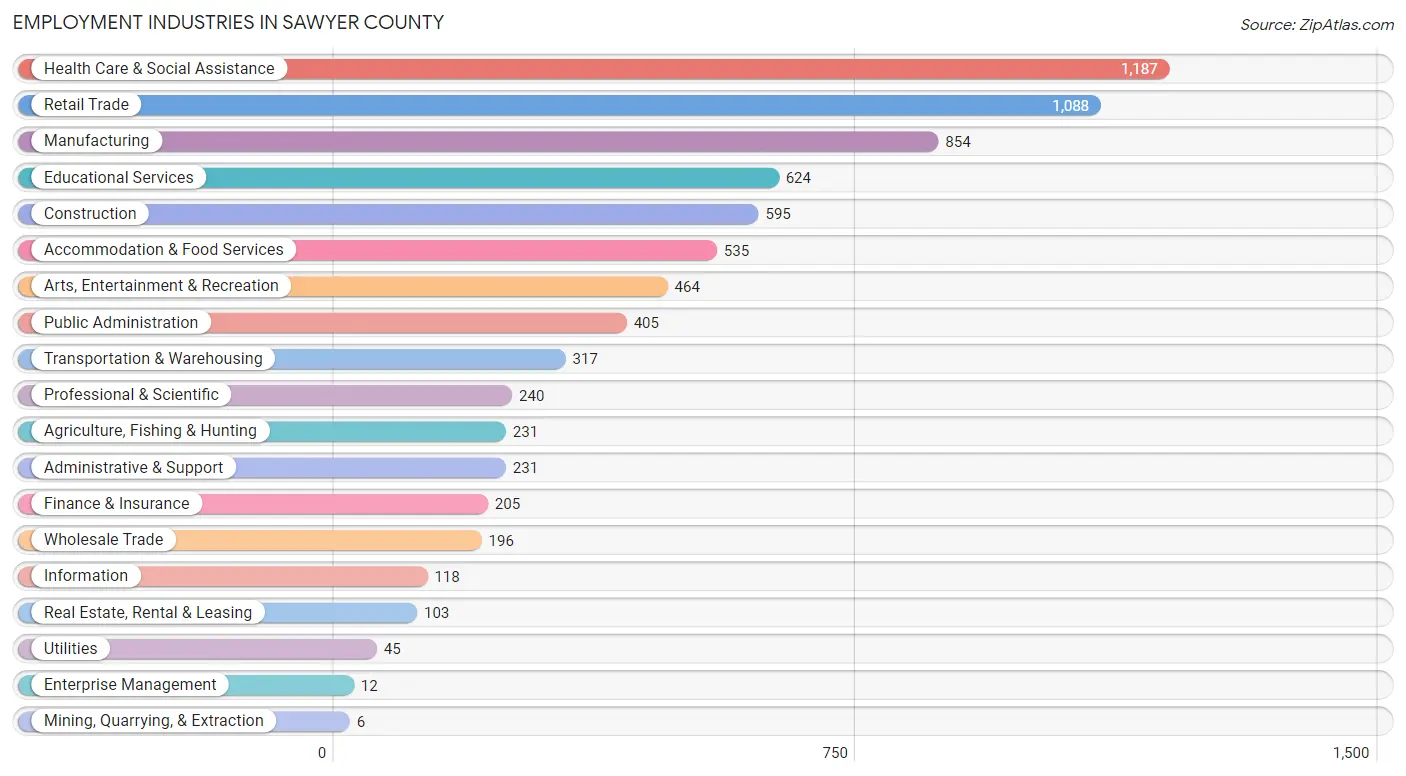
Employment Industries in Sawyer County
The major employment industries in Sawyer County include Health Care & Social Assistance (1,187 | 15.2%), Retail Trade (1,088 | 13.9%), Manufacturing (854 | 10.9%), Educational Services (624 | 8.0%), and Construction (595 | 7.6%).
Employment Industries by Sex in Sawyer County
The Sawyer County industries that see more men than women are Mining, Quarrying, & Extraction (100.0%), Construction (93.6%), and Utilities (93.3%), whereas the industries that tend to have a higher number of women are Health Care & Social Assistance (87.5%), Finance & Insurance (84.4%), and Enterprise Management (75.0%).
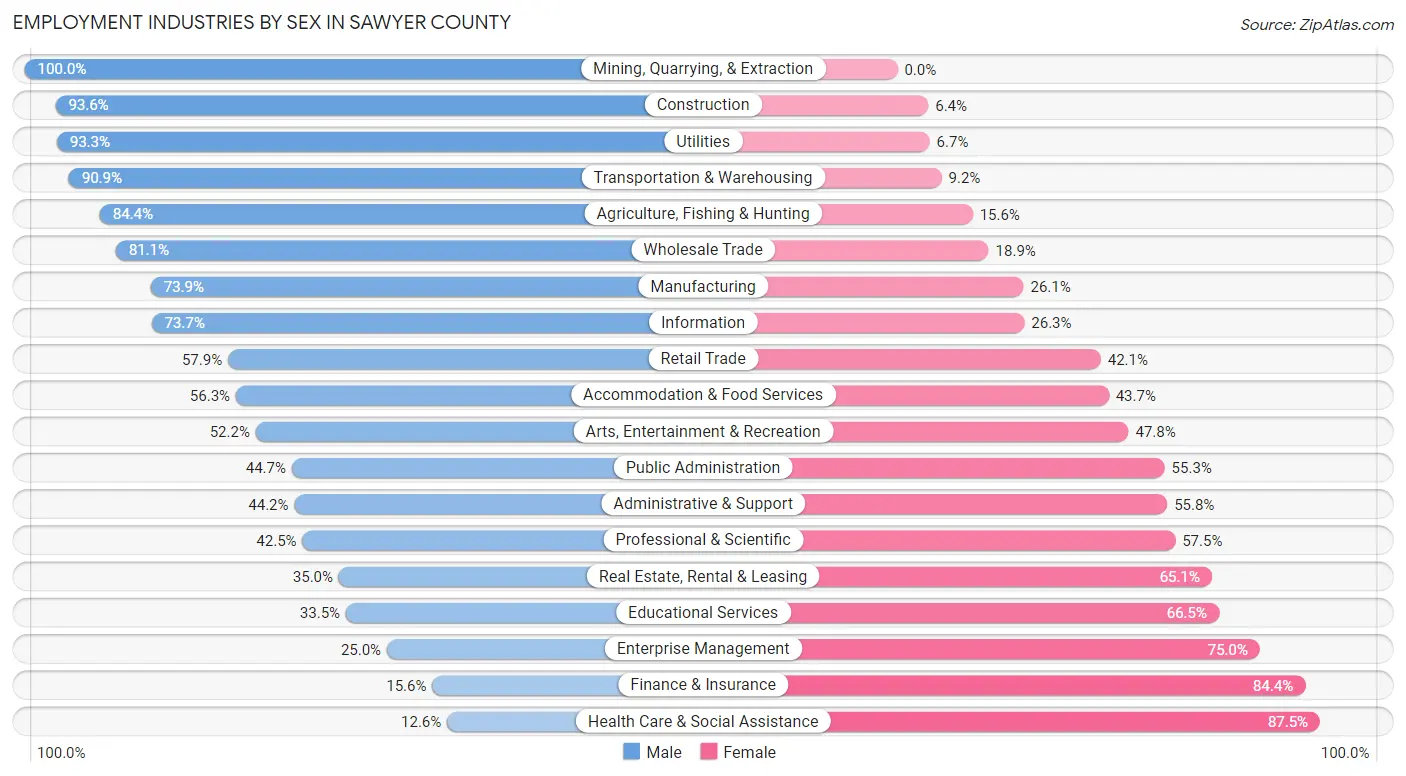
| Industry | Male | Female |
| Agriculture, Fishing & Hunting | 195 (84.4%) | 36 (15.6%) |
| Mining, Quarrying, & Extraction | 6 (100.0%) | 0 (0.0%) |
| Construction | 557 (93.6%) | 38 (6.4%) |
| Manufacturing | 631 (73.9%) | 223 (26.1%) |
| Wholesale Trade | 159 (81.1%) | 37 (18.9%) |
| Retail Trade | 630 (57.9%) | 458 (42.1%) |
| Transportation & Warehousing | 288 (90.8%) | 29 (9.1%) |
| Utilities | 42 (93.3%) | 3 (6.7%) |
| Information | 87 (73.7%) | 31 (26.3%) |
| Finance & Insurance | 32 (15.6%) | 173 (84.4%) |
| Real Estate, Rental & Leasing | 36 (34.9%) | 67 (65.0%) |
| Professional & Scientific | 102 (42.5%) | 138 (57.5%) |
| Enterprise Management | 3 (25.0%) | 9 (75.0%) |
| Administrative & Support | 102 (44.2%) | 129 (55.8%) |
| Educational Services | 209 (33.5%) | 415 (66.5%) |
| Health Care & Social Assistance | 149 (12.6%) | 1,038 (87.5%) |
| Arts, Entertainment & Recreation | 242 (52.2%) | 222 (47.8%) |
| Accommodation & Food Services | 301 (56.3%) | 234 (43.7%) |
| Public Administration | 181 (44.7%) | 224 (55.3%) |
| Total | 4,104 (52.5%) | 3,715 (47.5%) |
Education in Sawyer County
School Enrollment in Sawyer County
The most common levels of schooling among the 3,240 students in Sawyer County are middle school (828 | 25.6%), high school (780 | 24.1%), and elementary school (744 | 23.0%).
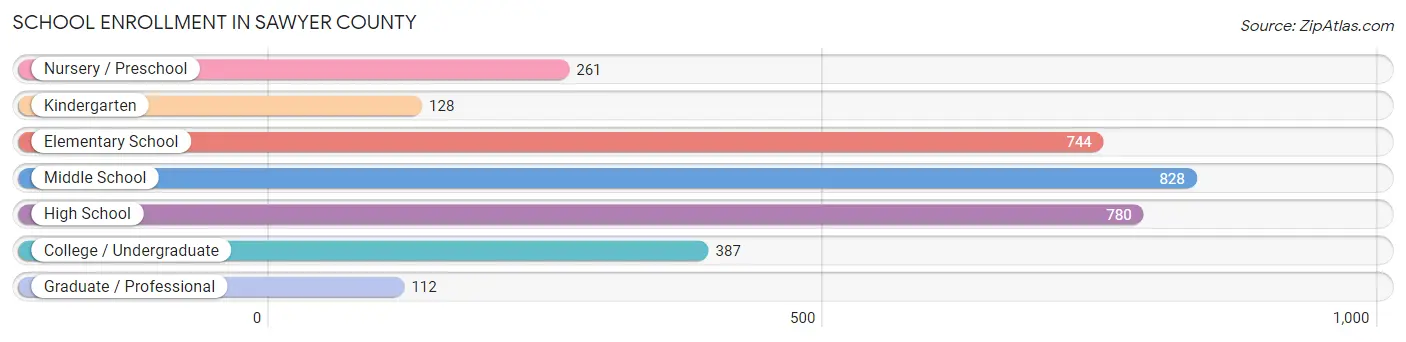
| School Level | # Students | % Students |
| Nursery / Preschool | 261 | 8.1% |
| Kindergarten | 128 | 4.0% |
| Elementary School | 744 | 23.0% |
| Middle School | 828 | 25.6% |
| High School | 780 | 24.1% |
| College / Undergraduate | 387 | 11.9% |
| Graduate / Professional | 112 | 3.5% |
| Total | 3,240 | 100.0% |
School Enrollment by Age by Funding Source in Sawyer County
Out of a total of 3,240 students who are enrolled in schools in Sawyer County, 434 (13.4%) attend a private institution, while the remaining 2,806 (86.6%) are enrolled in public schools. The age group of 25 to 34 year olds has the highest likelihood of being enrolled in private schools, with 71 (44.1% in the age bracket) enrolled. Conversely, the age group of 15 to 17 year olds has the lowest likelihood of being enrolled in a private school, with 497 (96.0% in the age bracket) attending a public institution.
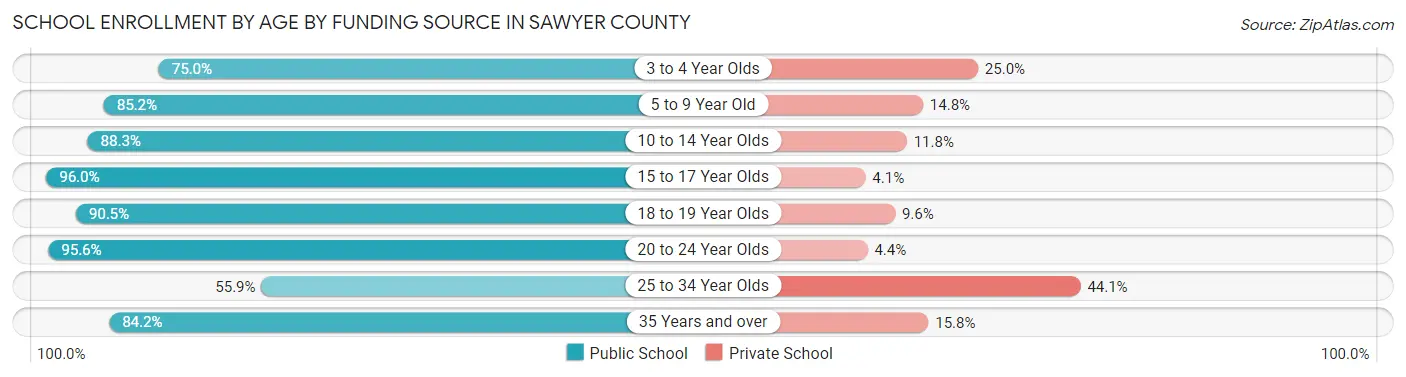
| Age Bracket | Public School | Private School |
| 3 to 4 Year Olds | 138 (75.0%) | 46 (25.0%) |
| 5 to 9 Year Old | 745 (85.2%) | 129 (14.8%) |
| 10 to 14 Year Olds | 849 (88.2%) | 113 (11.7%) |
| 15 to 17 Year Olds | 497 (96.0%) | 21 (4.1%) |
| 18 to 19 Year Olds | 180 (90.4%) | 19 (9.6%) |
| 20 to 24 Year Olds | 151 (95.6%) | 7 (4.4%) |
| 25 to 34 Year Olds | 90 (55.9%) | 71 (44.1%) |
| 35 Years and over | 155 (84.2%) | 29 (15.8%) |
| Total | 2,806 (86.6%) | 434 (13.4%) |
Educational Attainment by Field of Study in Sawyer County
Education (881 | 21.2%), business (647 | 15.6%), science & technology (513 | 12.3%), bio, nature & agricultural (418 | 10.1%), and arts & humanities (359 | 8.6%) are the most common fields of study among 4,153 individuals in Sawyer County who have obtained a bachelor's degree or higher.
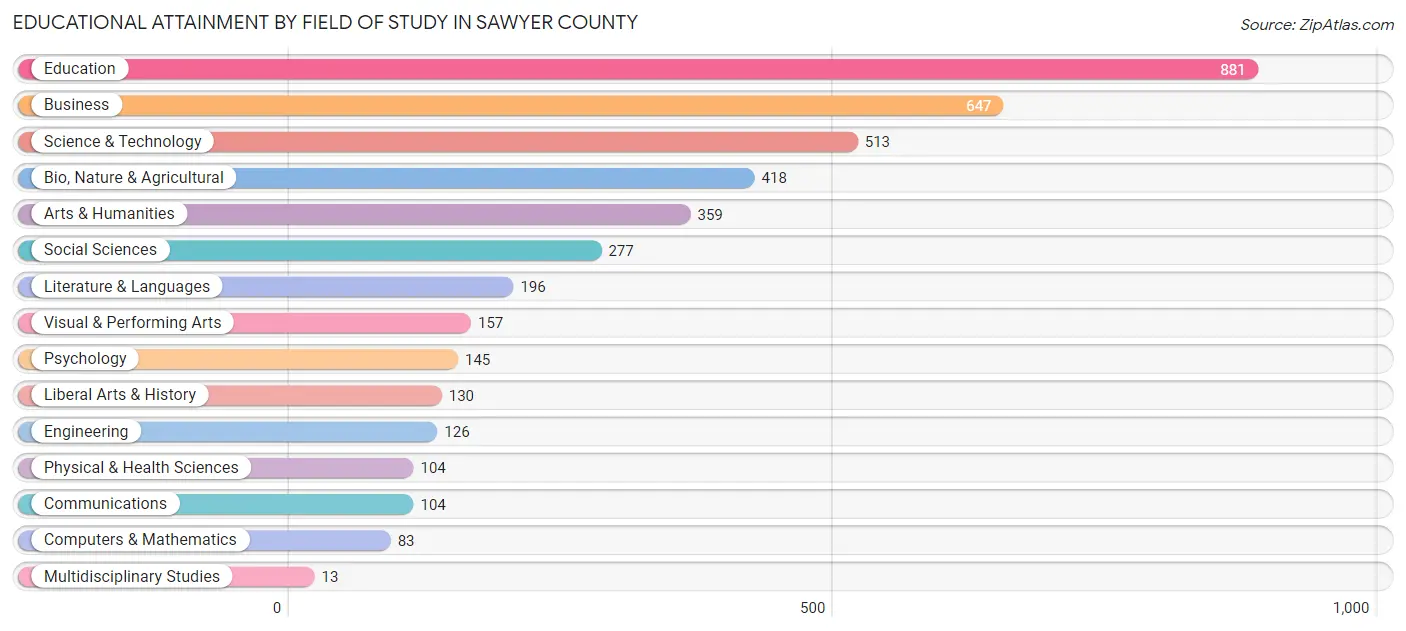
| Field of Study | # Graduates | % Graduates |
| Computers & Mathematics | 83 | 2.0% |
| Bio, Nature & Agricultural | 418 | 10.1% |
| Physical & Health Sciences | 104 | 2.5% |
| Psychology | 145 | 3.5% |
| Social Sciences | 277 | 6.7% |
| Engineering | 126 | 3.0% |
| Multidisciplinary Studies | 13 | 0.3% |
| Science & Technology | 513 | 12.3% |
| Business | 647 | 15.6% |
| Education | 881 | 21.2% |
| Literature & Languages | 196 | 4.7% |
| Liberal Arts & History | 130 | 3.1% |
| Visual & Performing Arts | 157 | 3.8% |
| Communications | 104 | 2.5% |
| Arts & Humanities | 359 | 8.6% |
| Total | 4,153 | 100.0% |
Transportation & Commute in Sawyer County
Vehicle Availability by Sex in Sawyer County
The most prevalent vehicle ownership categories in Sawyer County are males with 2 vehicles (1,715, accounting for 42.6%) and females with 2 vehicles (1,528, making up 47.1%).
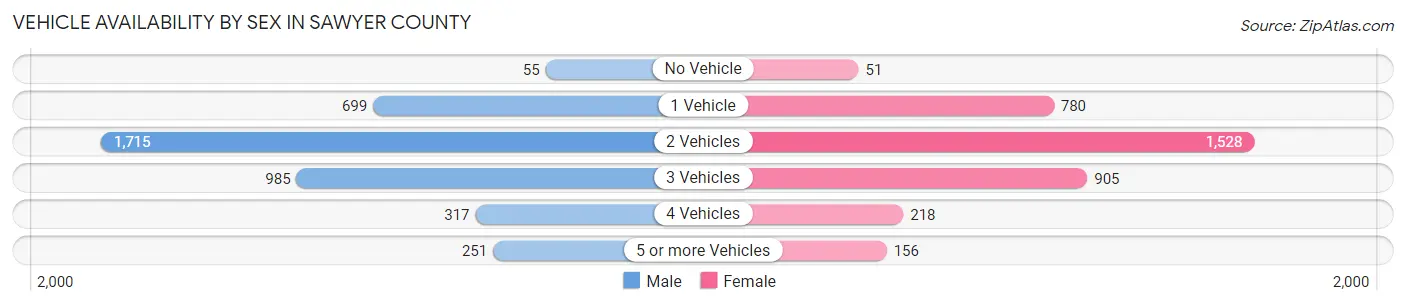
| Vehicles Available | Male | Female |
| No Vehicle | 55 (1.4%) | 51 (1.4%) |
| 1 Vehicle | 699 (17.4%) | 780 (21.4%) |
| 2 Vehicles | 1,715 (42.6%) | 1,528 (42.0%) |
| 3 Vehicles | 985 (24.5%) | 905 (24.9%) |
| 4 Vehicles | 317 (7.9%) | 218 (6.0%) |
| 5 or more Vehicles | 251 (6.2%) | 156 (4.3%) |
| Total | 4,022 (100.0%) | 3,638 (100.0%) |
Commute Time in Sawyer County
The most frequently occuring commute durations in Sawyer County are 10 to 14 minutes (1,310 commuters, 18.9%), 5 to 9 minutes (1,191 commuters, 17.2%), and 15 to 19 minutes (915 commuters, 13.2%).
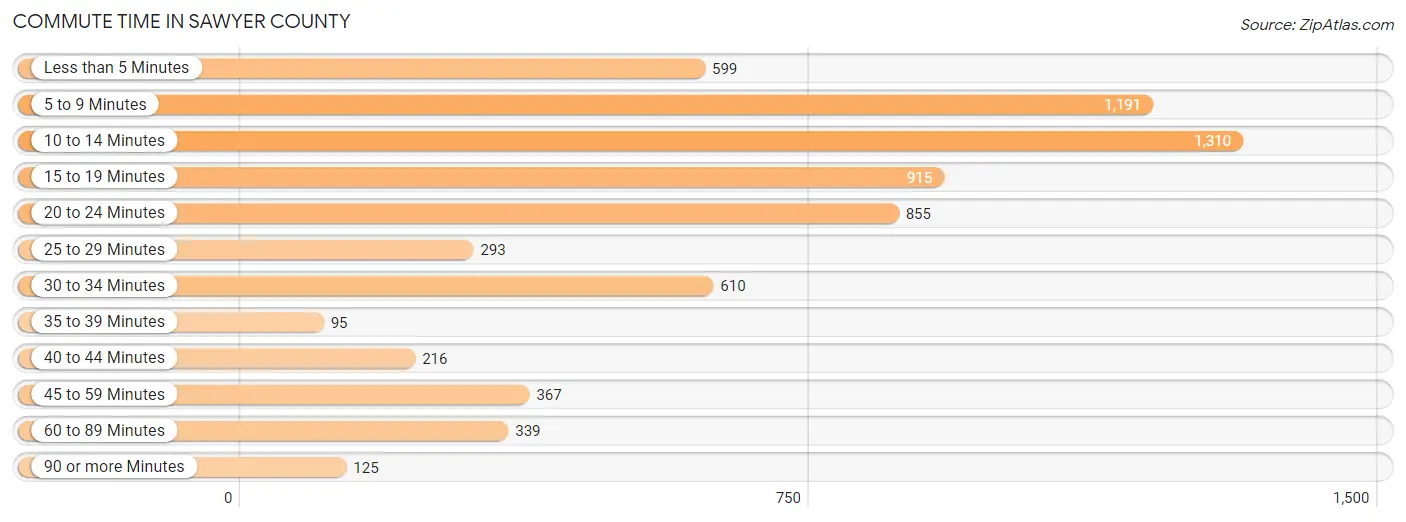
| Commute Time | # Commuters | % Commuters |
| Less than 5 Minutes | 599 | 8.7% |
| 5 to 9 Minutes | 1,191 | 17.2% |
| 10 to 14 Minutes | 1,310 | 18.9% |
| 15 to 19 Minutes | 915 | 13.2% |
| 20 to 24 Minutes | 855 | 12.4% |
| 25 to 29 Minutes | 293 | 4.2% |
| 30 to 34 Minutes | 610 | 8.8% |
| 35 to 39 Minutes | 95 | 1.4% |
| 40 to 44 Minutes | 216 | 3.1% |
| 45 to 59 Minutes | 367 | 5.3% |
| 60 to 89 Minutes | 339 | 4.9% |
| 90 or more Minutes | 125 | 1.8% |
Commute Time by Sex in Sawyer County
The most common commute times in Sawyer County are 10 to 14 minutes (669 commuters, 18.1%) for males and 10 to 14 minutes (641 commuters, 19.9%) for females.
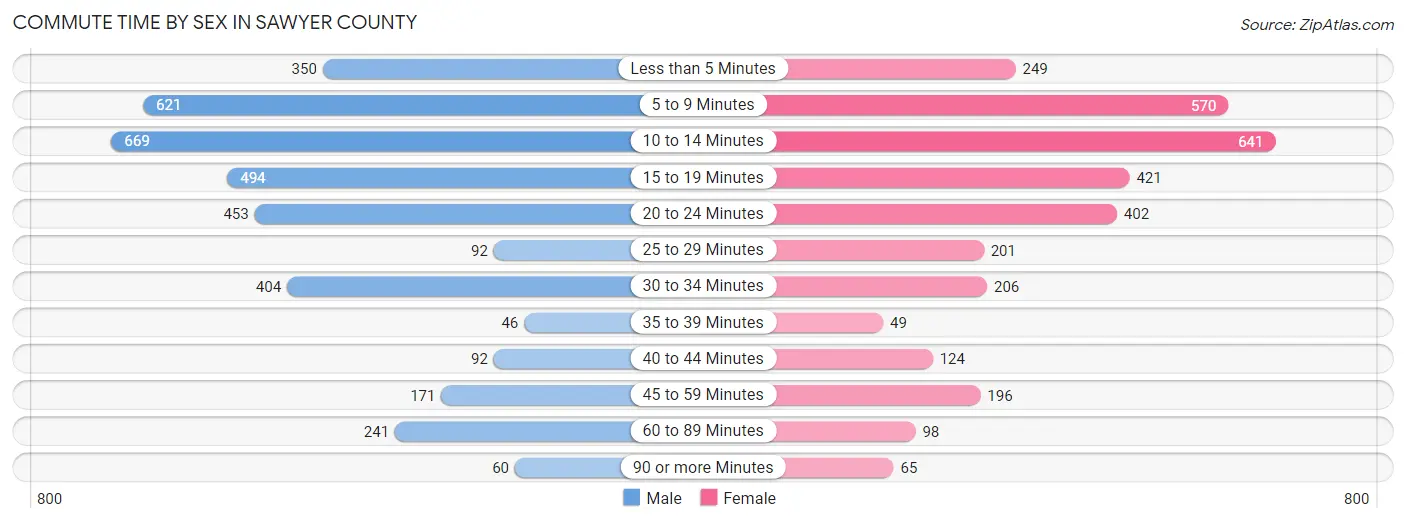
| Commute Time | Male | Female |
| Less than 5 Minutes | 350 (9.5%) | 249 (7.7%) |
| 5 to 9 Minutes | 621 (16.8%) | 570 (17.7%) |
| 10 to 14 Minutes | 669 (18.1%) | 641 (19.9%) |
| 15 to 19 Minutes | 494 (13.4%) | 421 (13.1%) |
| 20 to 24 Minutes | 453 (12.3%) | 402 (12.5%) |
| 25 to 29 Minutes | 92 (2.5%) | 201 (6.2%) |
| 30 to 34 Minutes | 404 (10.9%) | 206 (6.4%) |
| 35 to 39 Minutes | 46 (1.3%) | 49 (1.5%) |
| 40 to 44 Minutes | 92 (2.5%) | 124 (3.8%) |
| 45 to 59 Minutes | 171 (4.6%) | 196 (6.1%) |
| 60 to 89 Minutes | 241 (6.5%) | 98 (3.0%) |
| 90 or more Minutes | 60 (1.6%) | 65 (2.0%) |
Time of Departure to Work by Sex in Sawyer County
The most frequent times of departure to work in Sawyer County are 7:30 AM to 7:59 AM (670, 18.1%) for males and 7:30 AM to 7:59 AM (708, 22.0%) for females.
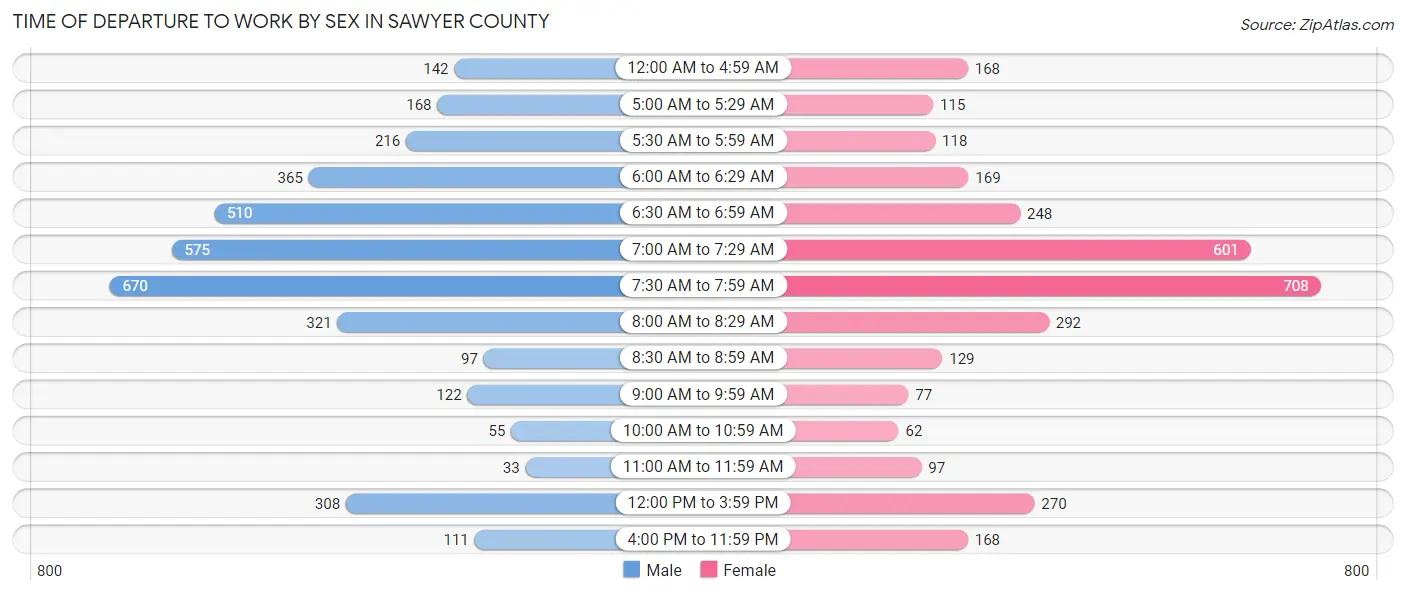
| Time of Departure | Male | Female |
| 12:00 AM to 4:59 AM | 142 (3.8%) | 168 (5.2%) |
| 5:00 AM to 5:29 AM | 168 (4.5%) | 115 (3.6%) |
| 5:30 AM to 5:59 AM | 216 (5.9%) | 118 (3.7%) |
| 6:00 AM to 6:29 AM | 365 (9.9%) | 169 (5.2%) |
| 6:30 AM to 6:59 AM | 510 (13.8%) | 248 (7.7%) |
| 7:00 AM to 7:29 AM | 575 (15.6%) | 601 (18.6%) |
| 7:30 AM to 7:59 AM | 670 (18.1%) | 708 (22.0%) |
| 8:00 AM to 8:29 AM | 321 (8.7%) | 292 (9.1%) |
| 8:30 AM to 8:59 AM | 97 (2.6%) | 129 (4.0%) |
| 9:00 AM to 9:59 AM | 122 (3.3%) | 77 (2.4%) |
| 10:00 AM to 10:59 AM | 55 (1.5%) | 62 (1.9%) |
| 11:00 AM to 11:59 AM | 33 (0.9%) | 97 (3.0%) |
| 12:00 PM to 3:59 PM | 308 (8.3%) | 270 (8.4%) |
| 4:00 PM to 11:59 PM | 111 (3.0%) | 168 (5.2%) |
| Total | 3,693 (100.0%) | 3,222 (100.0%) |
Housing Occupancy in Sawyer County
Occupancy by Ownership in Sawyer County
Of the total 8,210 dwellings in Sawyer County, owner-occupied units account for 6,233 (75.9%), while renter-occupied units make up 1,977 (24.1%).
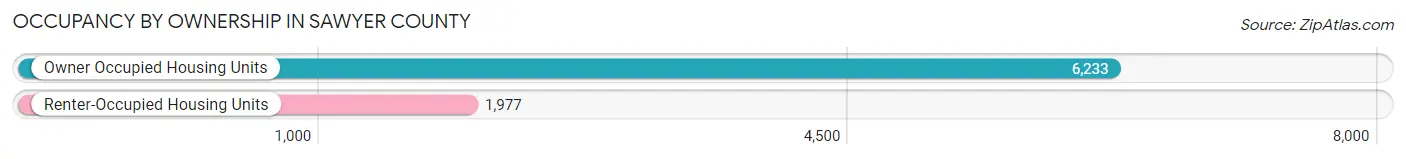
| Occupancy | # Housing Units | % Housing Units |
| Owner Occupied Housing Units | 6,233 | 75.9% |
| Renter-Occupied Housing Units | 1,977 | 24.1% |
| Total Occupied Housing Units | 8,210 | 100.0% |
Occupancy by Household Size in Sawyer County
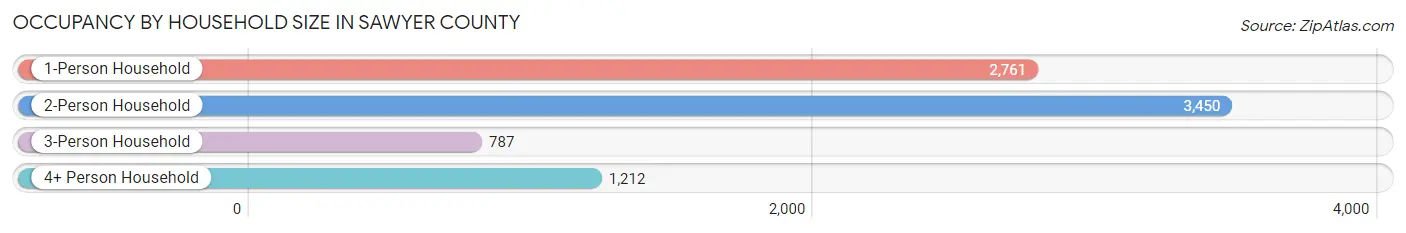
| Household Size | # Housing Units | % Housing Units |
| 1-Person Household | 2,761 | 33.6% |
| 2-Person Household | 3,450 | 42.0% |
| 3-Person Household | 787 | 9.6% |
| 4+ Person Household | 1,212 | 14.8% |
| Total Housing Units | 8,210 | 100.0% |
Occupancy by Ownership by Household Size in Sawyer County
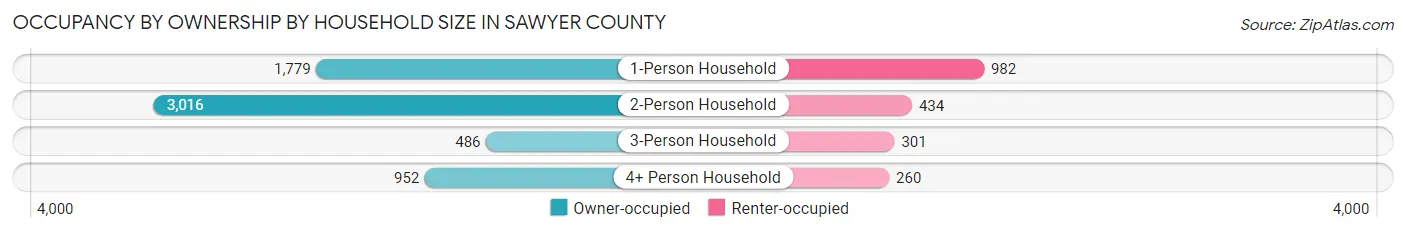
| Household Size | Owner-occupied | Renter-occupied |
| 1-Person Household | 1,779 (64.4%) | 982 (35.6%) |
| 2-Person Household | 3,016 (87.4%) | 434 (12.6%) |
| 3-Person Household | 486 (61.8%) | 301 (38.3%) |
| 4+ Person Household | 952 (78.5%) | 260 (21.4%) |
| Total Housing Units | 6,233 (75.9%) | 1,977 (24.1%) |
Occupancy by Educational Attainment in Sawyer County
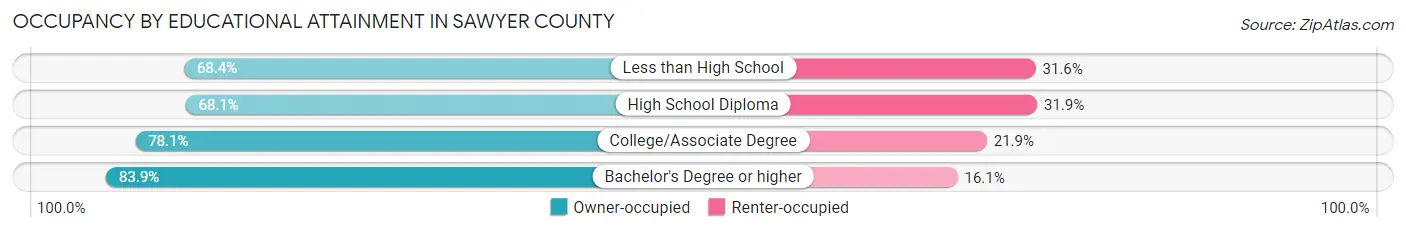
| Household Size | Owner-occupied | Renter-occupied |
| Less than High School | 368 (68.4%) | 170 (31.6%) |
| High School Diploma | 1,772 (68.1%) | 830 (31.9%) |
| College/Associate Degree | 2,143 (78.1%) | 602 (21.9%) |
| Bachelor's Degree or higher | 1,950 (83.9%) | 375 (16.1%) |
Occupancy by Age of Householder in Sawyer County
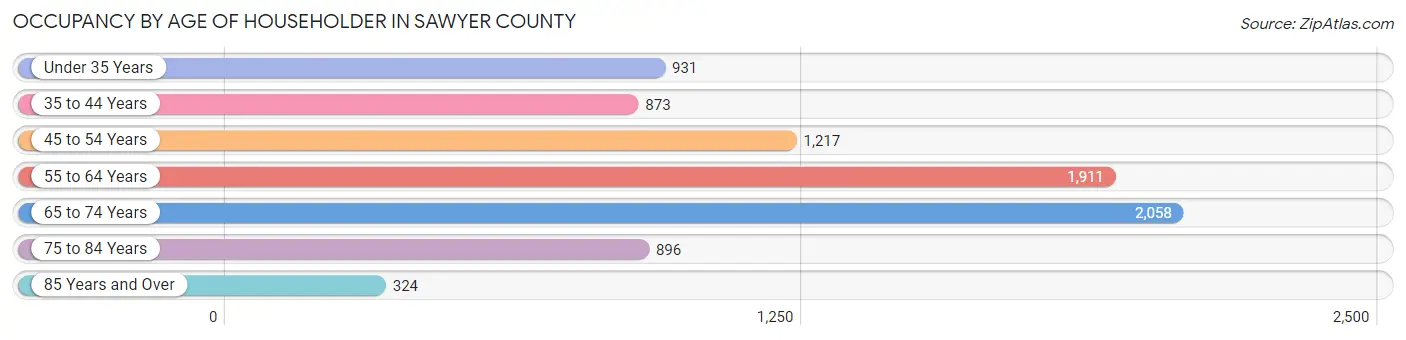
| Age Bracket | # Households | % Households |
| Under 35 Years | 931 | 11.3% |
| 35 to 44 Years | 873 | 10.6% |
| 45 to 54 Years | 1,217 | 14.8% |
| 55 to 64 Years | 1,911 | 23.3% |
| 65 to 74 Years | 2,058 | 25.1% |
| 75 to 84 Years | 896 | 10.9% |
| 85 Years and Over | 324 | 4.0% |
| Total | 8,210 | 100.0% |
Housing Finances in Sawyer County
Median Income by Occupancy in Sawyer County
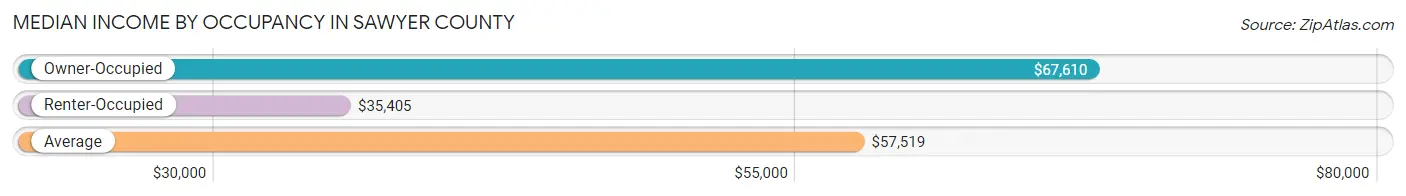
| Occupancy Type | # Households | Median Income |
| Owner-Occupied | 6,233 (75.9%) | $67,610 |
| Renter-Occupied | 1,977 (24.1%) | $35,405 |
| Average | 8,210 (100.0%) | $57,519 |
Occupancy by Householder Income Bracket in Sawyer County
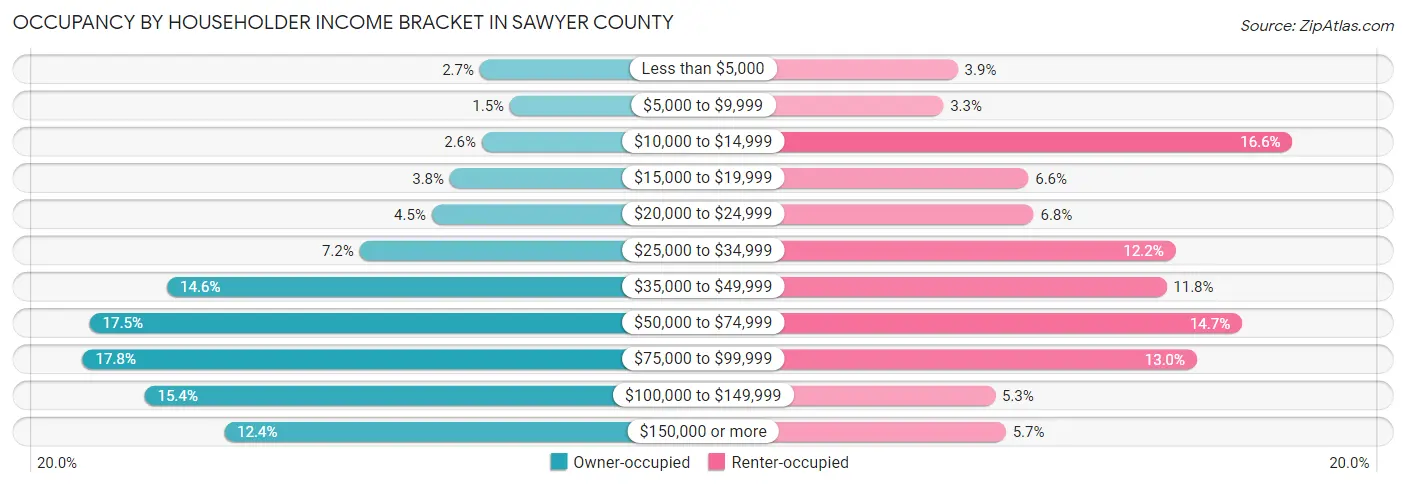
| Income Bracket | Owner-occupied | Renter-occupied |
| Less than $5,000 | 166 (2.7%) | 77 (3.9%) |
| $5,000 to $9,999 | 94 (1.5%) | 66 (3.3%) |
| $10,000 to $14,999 | 161 (2.6%) | 329 (16.6%) |
| $15,000 to $19,999 | 237 (3.8%) | 130 (6.6%) |
| $20,000 to $24,999 | 280 (4.5%) | 134 (6.8%) |
| $25,000 to $34,999 | 451 (7.2%) | 241 (12.2%) |
| $35,000 to $49,999 | 908 (14.6%) | 234 (11.8%) |
| $50,000 to $74,999 | 1,092 (17.5%) | 291 (14.7%) |
| $75,000 to $99,999 | 1,109 (17.8%) | 257 (13.0%) |
| $100,000 to $149,999 | 962 (15.4%) | 105 (5.3%) |
| $150,000 or more | 773 (12.4%) | 113 (5.7%) |
| Total | 6,233 (100.0%) | 1,977 (100.0%) |
Monthly Housing Cost Tiers in Sawyer County
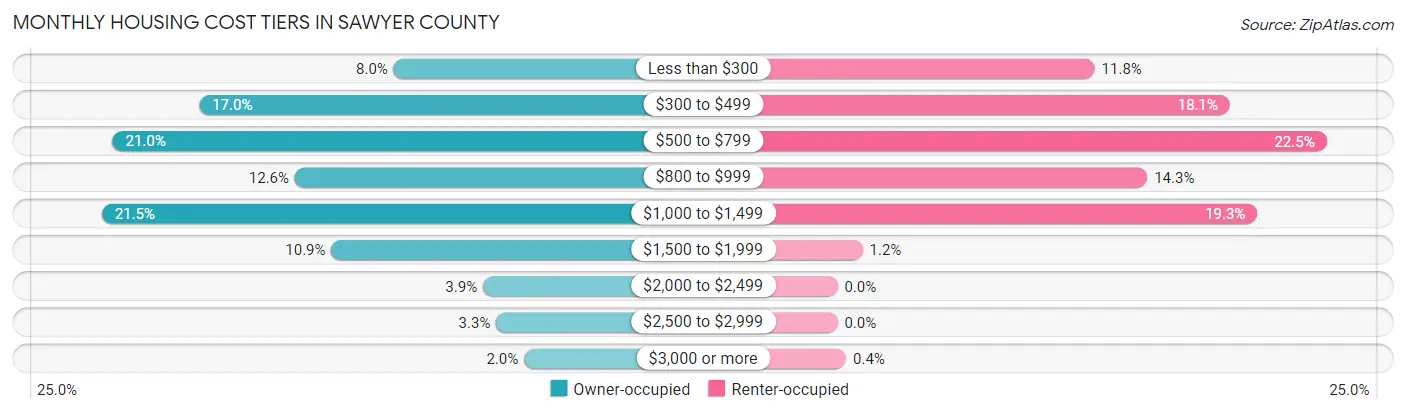
| Monthly Cost | Owner-occupied | Renter-occupied |
| Less than $300 | 499 (8.0%) | 234 (11.8%) |
| $300 to $499 | 1,057 (17.0%) | 357 (18.1%) |
| $500 to $799 | 1,306 (20.9%) | 445 (22.5%) |
| $800 to $999 | 783 (12.6%) | 282 (14.3%) |
| $1,000 to $1,499 | 1,337 (21.4%) | 382 (19.3%) |
| $1,500 to $1,999 | 678 (10.9%) | 23 (1.2%) |
| $2,000 to $2,499 | 243 (3.9%) | 0 (0.0%) |
| $2,500 to $2,999 | 205 (3.3%) | 0 (0.0%) |
| $3,000 or more | 125 (2.0%) | 8 (0.4%) |
| Total | 6,233 (100.0%) | 1,977 (100.0%) |
Physical Housing Characteristics in Sawyer County
Housing Structures in Sawyer County
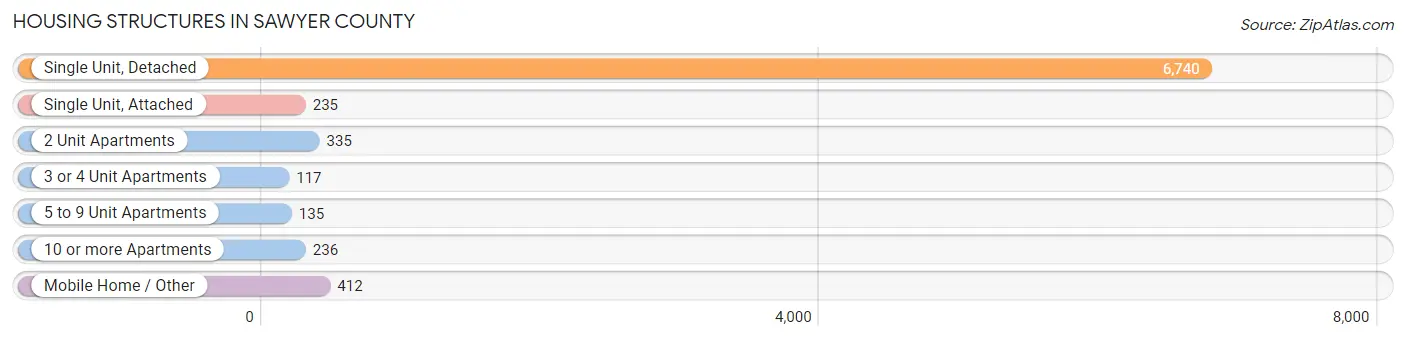
| Structure Type | # Housing Units | % Housing Units |
| Single Unit, Detached | 6,740 | 82.1% |
| Single Unit, Attached | 235 | 2.9% |
| 2 Unit Apartments | 335 | 4.1% |
| 3 or 4 Unit Apartments | 117 | 1.4% |
| 5 to 9 Unit Apartments | 135 | 1.6% |
| 10 or more Apartments | 236 | 2.9% |
| Mobile Home / Other | 412 | 5.0% |
| Total | 8,210 | 100.0% |
Housing Structures by Occupancy in Sawyer County
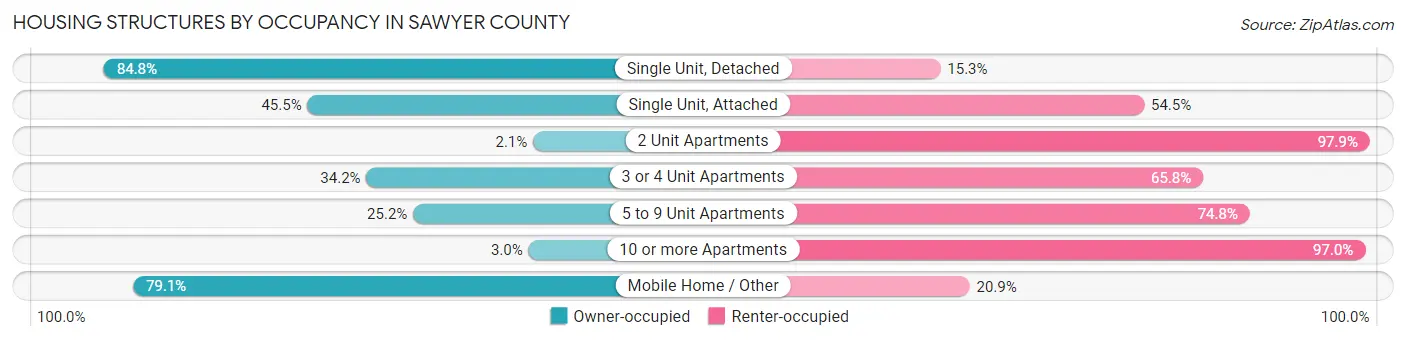
| Structure Type | Owner-occupied | Renter-occupied |
| Single Unit, Detached | 5,712 (84.8%) | 1,028 (15.2%) |
| Single Unit, Attached | 107 (45.5%) | 128 (54.5%) |
| 2 Unit Apartments | 7 (2.1%) | 328 (97.9%) |
| 3 or 4 Unit Apartments | 40 (34.2%) | 77 (65.8%) |
| 5 to 9 Unit Apartments | 34 (25.2%) | 101 (74.8%) |
| 10 or more Apartments | 7 (3.0%) | 229 (97.0%) |
| Mobile Home / Other | 326 (79.1%) | 86 (20.9%) |
| Total | 6,233 (75.9%) | 1,977 (24.1%) |
Housing Structures by Number of Rooms in Sawyer County
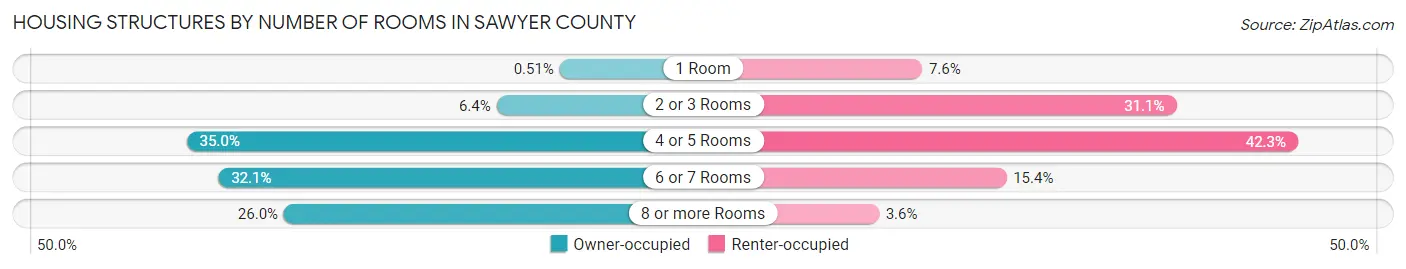
| Number of Rooms | Owner-occupied | Renter-occupied |
| 1 Room | 32 (0.5%) | 150 (7.6%) |
| 2 or 3 Rooms | 396 (6.4%) | 615 (31.1%) |
| 4 or 5 Rooms | 2,183 (35.0%) | 837 (42.3%) |
| 6 or 7 Rooms | 2,000 (32.1%) | 304 (15.4%) |
| 8 or more Rooms | 1,622 (26.0%) | 71 (3.6%) |
| Total | 6,233 (100.0%) | 1,977 (100.0%) |
Housing Structure by Heating Type in Sawyer County
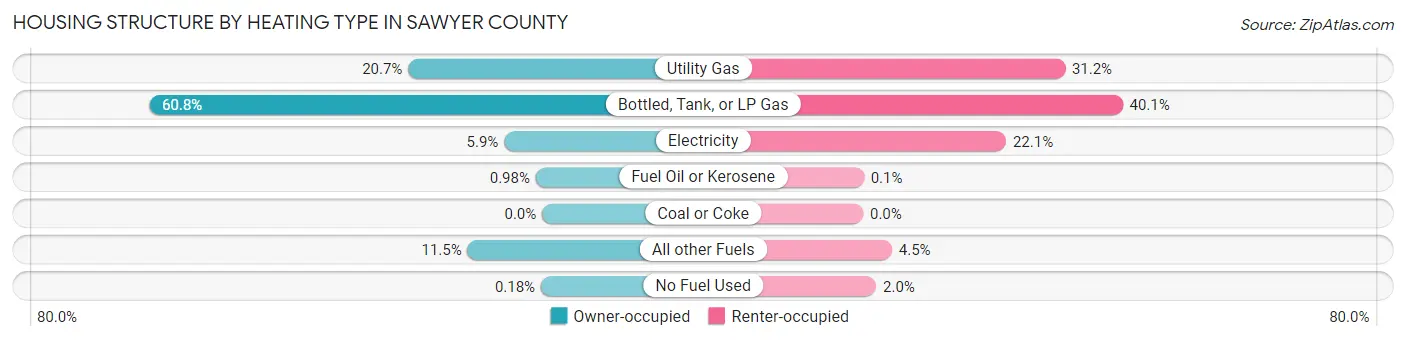
| Heating Type | Owner-occupied | Renter-occupied |
| Utility Gas | 1,290 (20.7%) | 617 (31.2%) |
| Bottled, Tank, or LP Gas | 3,788 (60.8%) | 793 (40.1%) |
| Electricity | 365 (5.9%) | 437 (22.1%) |
| Fuel Oil or Kerosene | 61 (1.0%) | 2 (0.1%) |
| Coal or Coke | 0 (0.0%) | 0 (0.0%) |
| All other Fuels | 718 (11.5%) | 88 (4.4%) |
| No Fuel Used | 11 (0.2%) | 40 (2.0%) |
| Total | 6,233 (100.0%) | 1,977 (100.0%) |
Household Vehicle Usage in Sawyer County
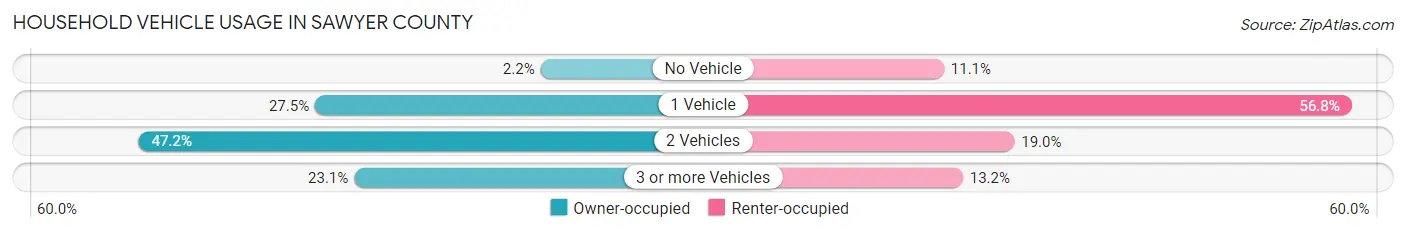
| Vehicles per Household | Owner-occupied | Renter-occupied |
| No Vehicle | 138 (2.2%) | 219 (11.1%) |
| 1 Vehicle | 1,712 (27.5%) | 1,122 (56.8%) |
| 2 Vehicles | 2,944 (47.2%) | 375 (19.0%) |
| 3 or more Vehicles | 1,439 (23.1%) | 261 (13.2%) |
| Total | 6,233 (100.0%) | 1,977 (100.0%) |
Real Estate & Mortgages in Sawyer County
Real Estate and Mortgage Overview in Sawyer County
| Characteristic | Without Mortgage | With Mortgage |
| Housing Units | 2,860 | 3,373 |
| Median Property Value | $201,400 | $217,300 |
| Median Household Income | $55,595 | $491 |
| Monthly Housing Costs | $486 | $123 |
| Real Estate Taxes | $1,865 | $128 |
Property Value by Mortgage Status in Sawyer County
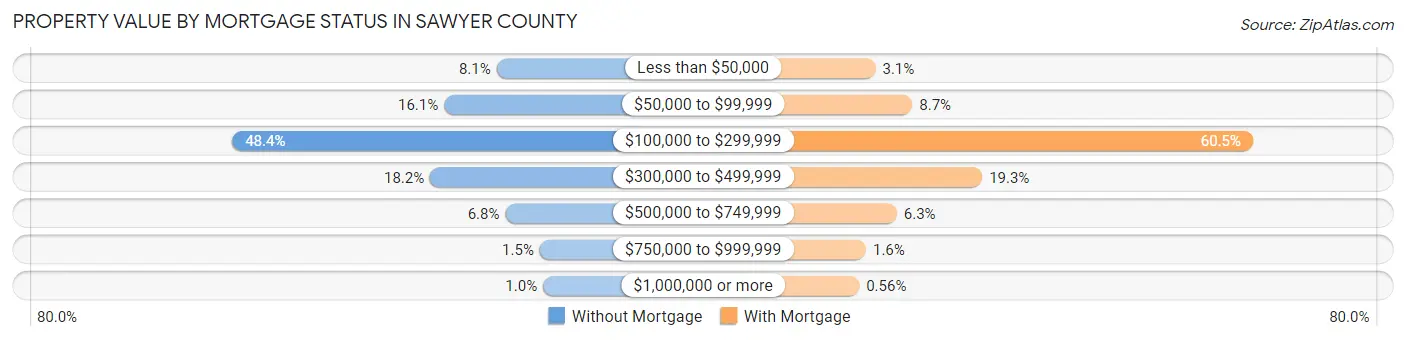
| Property Value | Without Mortgage | With Mortgage |
| Less than $50,000 | 231 (8.1%) | 103 (3.0%) |
| $50,000 to $99,999 | 460 (16.1%) | 292 (8.7%) |
| $100,000 to $299,999 | 1,383 (48.4%) | 2,042 (60.5%) |
| $300,000 to $499,999 | 521 (18.2%) | 651 (19.3%) |
| $500,000 to $749,999 | 193 (6.8%) | 212 (6.3%) |
| $750,000 to $999,999 | 43 (1.5%) | 54 (1.6%) |
| $1,000,000 or more | 29 (1.0%) | 19 (0.6%) |
| Total | 2,860 (100.0%) | 3,373 (100.0%) |
Household Income by Mortgage Status in Sawyer County
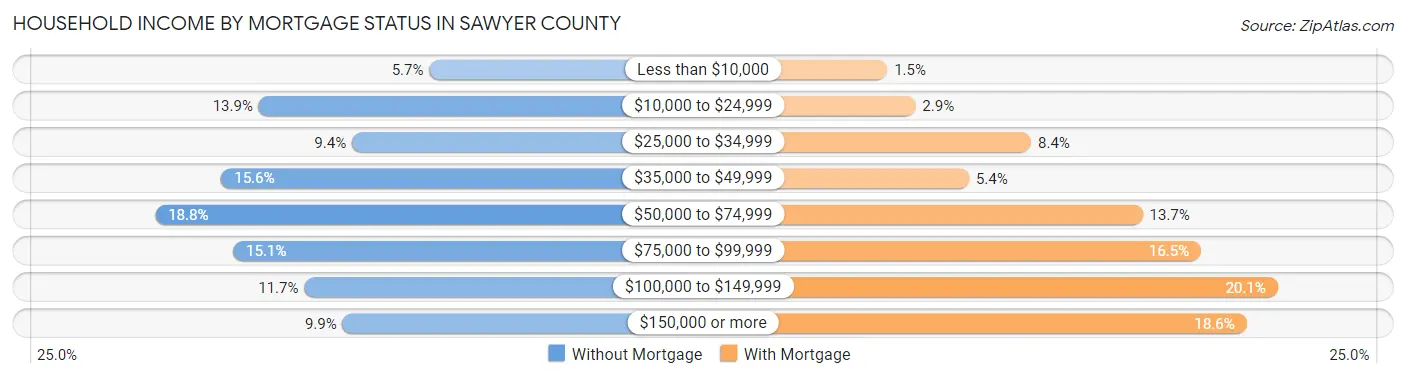
| Household Income | Without Mortgage | With Mortgage |
| Less than $10,000 | 164 (5.7%) | 51 (1.5%) |
| $10,000 to $24,999 | 396 (13.9%) | 96 (2.9%) |
| $25,000 to $34,999 | 269 (9.4%) | 282 (8.4%) |
| $35,000 to $49,999 | 447 (15.6%) | 182 (5.4%) |
| $50,000 to $74,999 | 537 (18.8%) | 461 (13.7%) |
| $75,000 to $99,999 | 431 (15.1%) | 555 (16.5%) |
| $100,000 to $149,999 | 334 (11.7%) | 678 (20.1%) |
| $150,000 or more | 282 (9.9%) | 628 (18.6%) |
| Total | 2,860 (100.0%) | 3,373 (100.0%) |
Property Value to Household Income Ratio in Sawyer County
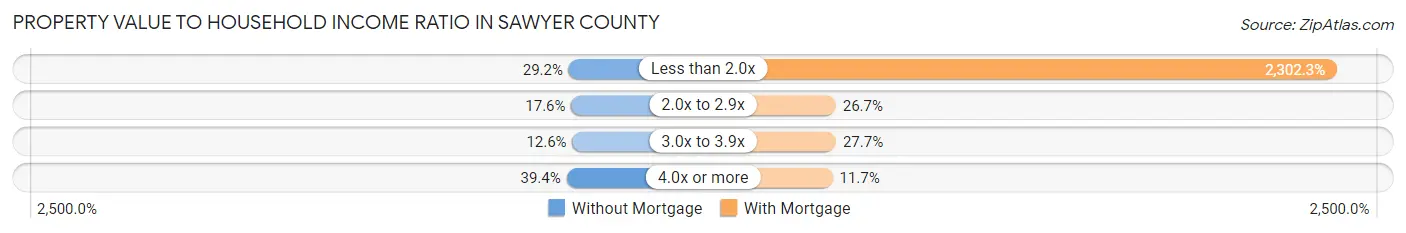
| Value-to-Income Ratio | Without Mortgage | With Mortgage |
| Less than 2.0x | 834 (29.2%) | 77,656 (2,302.3%) |
| 2.0x to 2.9x | 503 (17.6%) | 902 (26.7%) |
| 3.0x to 3.9x | 360 (12.6%) | 933 (27.7%) |
| 4.0x or more | 1,126 (39.4%) | 396 (11.7%) |
| Total | 2,860 (100.0%) | 3,373 (100.0%) |
Real Estate Taxes by Mortgage Status in Sawyer County
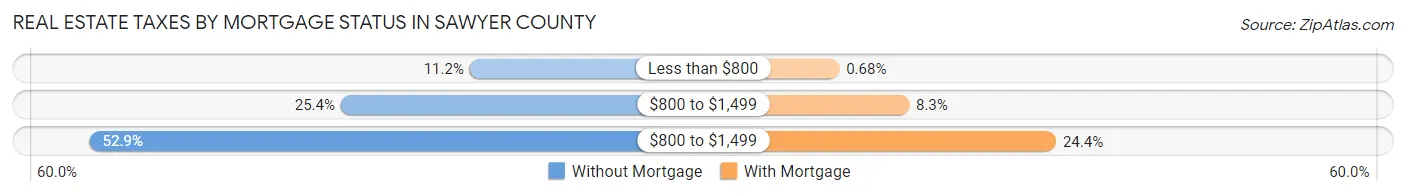
| Property Taxes | Without Mortgage | With Mortgage |
| Less than $800 | 321 (11.2%) | 23 (0.7%) |
| $800 to $1,499 | 725 (25.4%) | 281 (8.3%) |
| $800 to $1,499 | 1,512 (52.9%) | 824 (24.4%) |
| Total | 2,860 (100.0%) | 3,373 (100.0%) |
Health & Disability in Sawyer County
Health Insurance Coverage by Age in Sawyer County
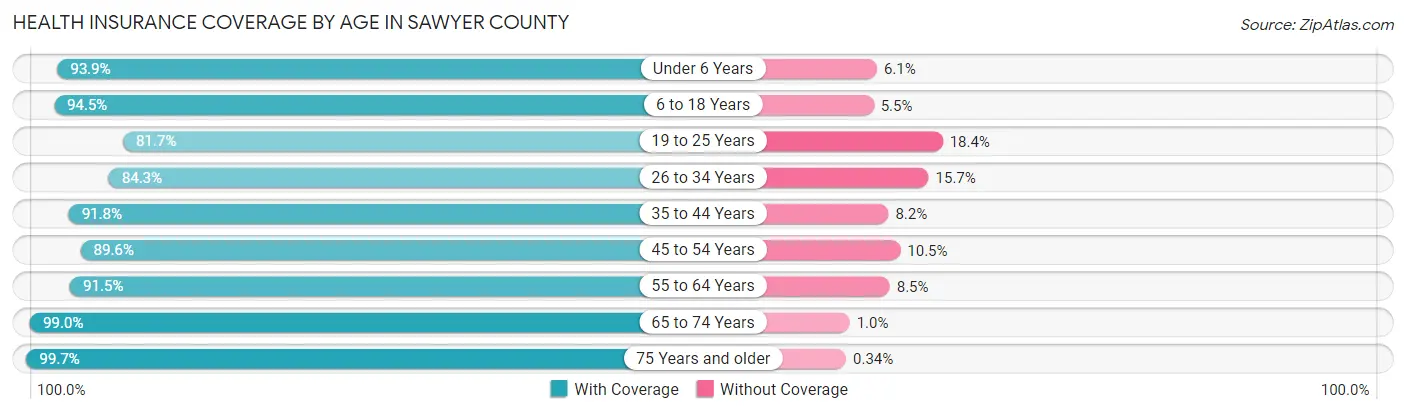
| Age Bracket | With Coverage | Without Coverage |
| Under 6 Years | 909 (93.9%) | 59 (6.1%) |
| 6 to 18 Years | 2,363 (94.5%) | 137 (5.5%) |
| 19 to 25 Years | 859 (81.7%) | 193 (18.3%) |
| 26 to 34 Years | 1,281 (84.3%) | 239 (15.7%) |
| 35 to 44 Years | 1,426 (91.8%) | 128 (8.2%) |
| 45 to 54 Years | 1,859 (89.5%) | 217 (10.4%) |
| 55 to 64 Years | 3,020 (91.5%) | 280 (8.5%) |
| 65 to 74 Years | 2,953 (99.0%) | 30 (1.0%) |
| 75 Years and older | 1,765 (99.7%) | 6 (0.3%) |
| Total | 16,435 (92.7%) | 1,289 (7.3%) |
Health Insurance Coverage by Citizenship Status in Sawyer County
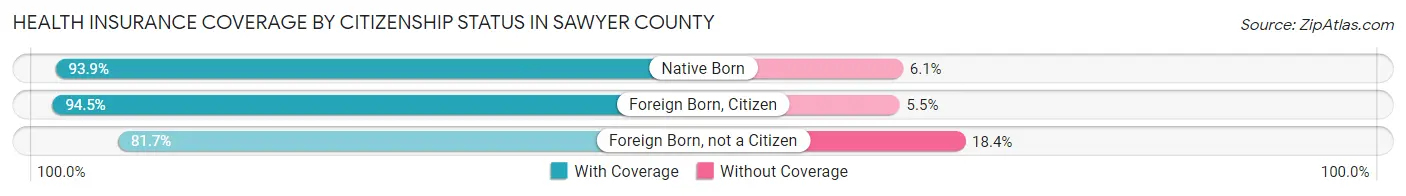
| Citizenship Status | With Coverage | Without Coverage |
| Native Born | 909 (93.9%) | 59 (6.1%) |
| Foreign Born, Citizen | 2,363 (94.5%) | 137 (5.5%) |
| Foreign Born, not a Citizen | 859 (81.7%) | 193 (18.3%) |
Health Insurance Coverage by Household Income in Sawyer County
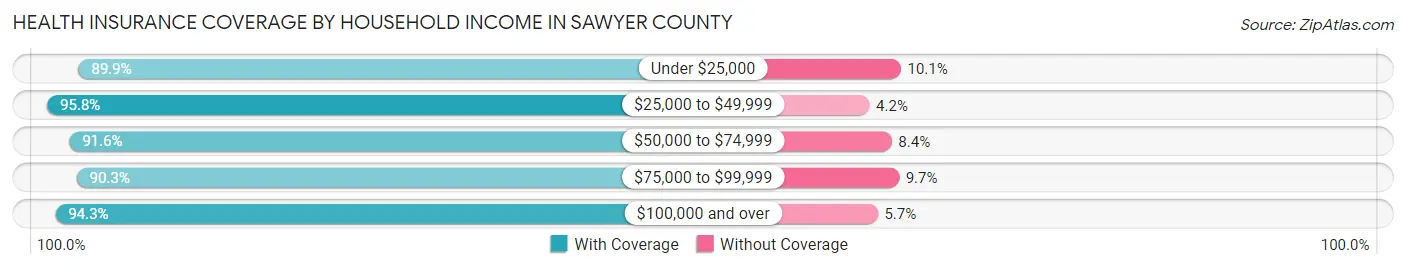
| Household Income | With Coverage | Without Coverage |
| Under $25,000 | 2,278 (89.9%) | 255 (10.1%) |
| $25,000 to $49,999 | 3,200 (95.8%) | 140 (4.2%) |
| $50,000 to $74,999 | 2,762 (91.6%) | 252 (8.4%) |
| $75,000 to $99,999 | 3,005 (90.3%) | 324 (9.7%) |
| $100,000 and over | 5,122 (94.3%) | 312 (5.7%) |
Public vs Private Health Insurance Coverage by Age in Sawyer County
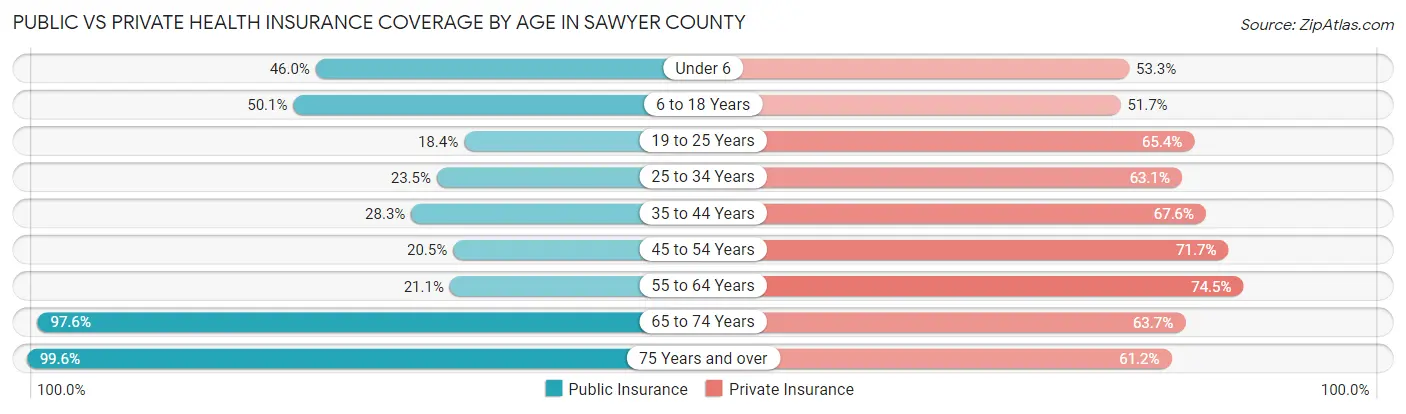
| Age Bracket | Public Insurance | Private Insurance |
| Under 6 | 445 (46.0%) | 516 (53.3%) |
| 6 to 18 Years | 1,253 (50.1%) | 1,293 (51.7%) |
| 19 to 25 Years | 194 (18.4%) | 688 (65.4%) |
| 25 to 34 Years | 357 (23.5%) | 959 (63.1%) |
| 35 to 44 Years | 439 (28.2%) | 1,050 (67.6%) |
| 45 to 54 Years | 425 (20.5%) | 1,489 (71.7%) |
| 55 to 64 Years | 696 (21.1%) | 2,459 (74.5%) |
| 65 to 74 Years | 2,911 (97.6%) | 1,900 (63.7%) |
| 75 Years and over | 1,764 (99.6%) | 1,083 (61.2%) |
| Total | 8,484 (47.9%) | 11,437 (64.5%) |
Disability Status by Sex by Age in Sawyer County
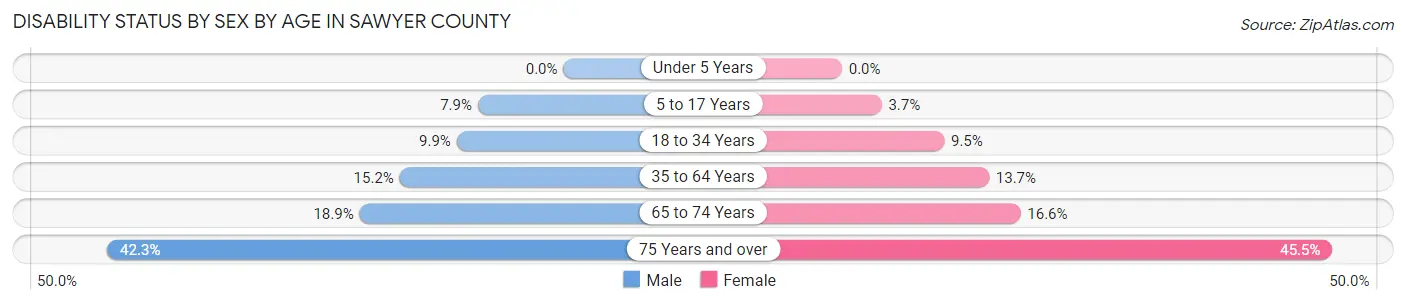
| Age Bracket | Male | Female |
| Under 5 Years | 0 (0.0%) | 0 (0.0%) |
| 5 to 17 Years | 98 (7.9%) | 45 (3.7%) |
| 18 to 34 Years | 154 (9.9%) | 118 (9.5%) |
| 35 to 64 Years | 533 (15.2%) | 467 (13.7%) |
| 65 to 74 Years | 295 (18.9%) | 236 (16.6%) |
| 75 Years and over | 362 (42.3%) | 417 (45.5%) |
Disability Class by Sex by Age in Sawyer County
Disability Class: Hearing Difficulty
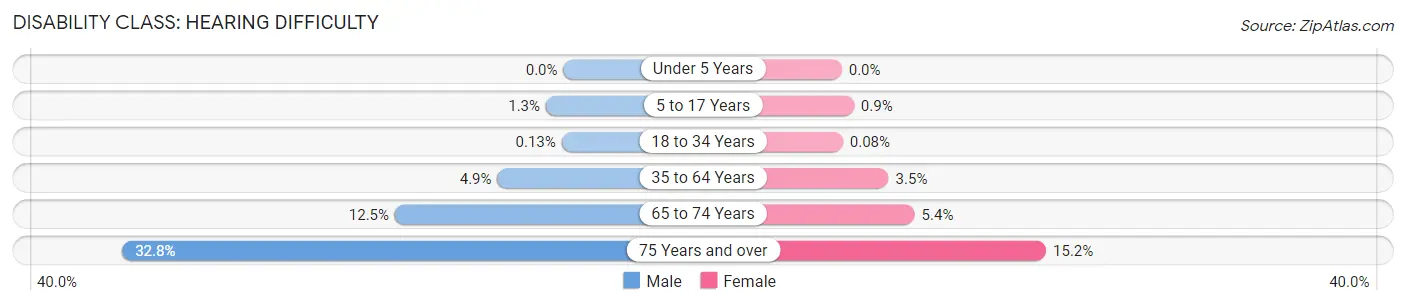
| Age Bracket | Male | Female |
| Under 5 Years | 0 (0.0%) | 0 (0.0%) |
| 5 to 17 Years | 16 (1.3%) | 11 (0.9%) |
| 18 to 34 Years | 2 (0.1%) | 1 (0.1%) |
| 35 to 64 Years | 172 (4.9%) | 119 (3.5%) |
| 65 to 74 Years | 195 (12.5%) | 77 (5.4%) |
| 75 Years and over | 280 (32.8%) | 139 (15.2%) |
Disability Class: Vision Difficulty
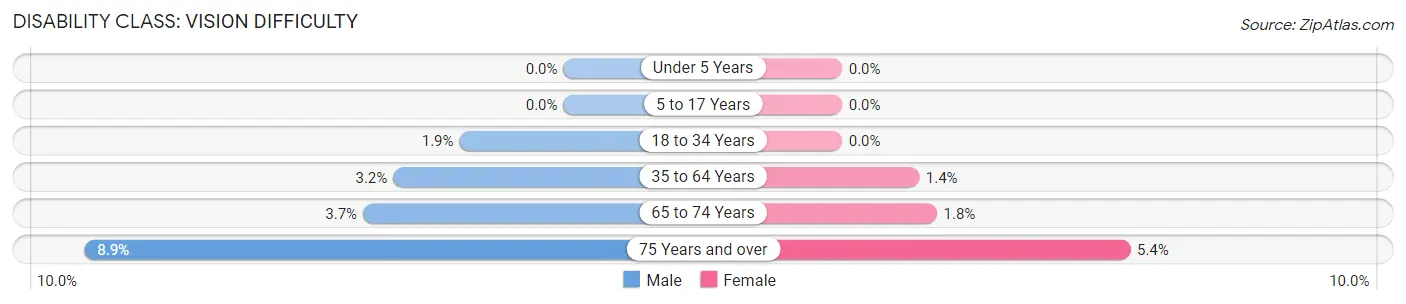
| Age Bracket | Male | Female |
| Under 5 Years | 0 (0.0%) | 0 (0.0%) |
| 5 to 17 Years | 0 (0.0%) | 0 (0.0%) |
| 18 to 34 Years | 30 (1.9%) | 0 (0.0%) |
| 35 to 64 Years | 111 (3.2%) | 49 (1.4%) |
| 65 to 74 Years | 58 (3.7%) | 25 (1.8%) |
| 75 Years and over | 76 (8.9%) | 49 (5.3%) |
Disability Class: Cognitive Difficulty
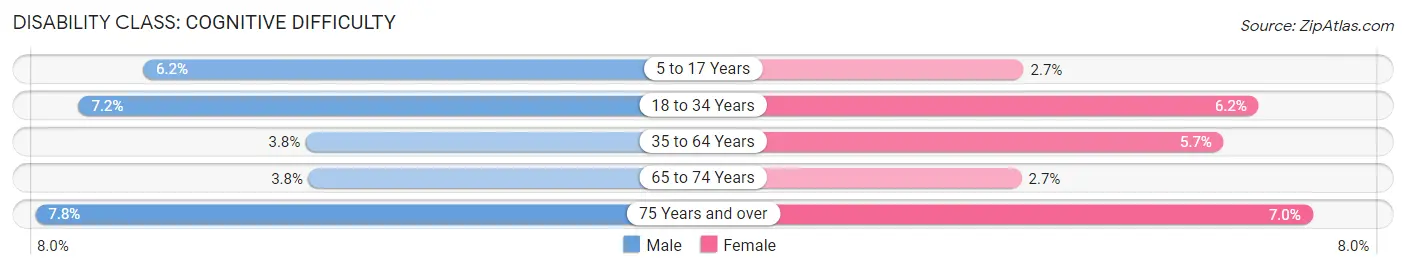
| Age Bracket | Male | Female |
| 5 to 17 Years | 77 (6.2%) | 33 (2.7%) |
| 18 to 34 Years | 112 (7.2%) | 77 (6.2%) |
| 35 to 64 Years | 134 (3.8%) | 194 (5.7%) |
| 65 to 74 Years | 59 (3.8%) | 38 (2.7%) |
| 75 Years and over | 67 (7.8%) | 64 (7.0%) |
Disability Class: Ambulatory Difficulty
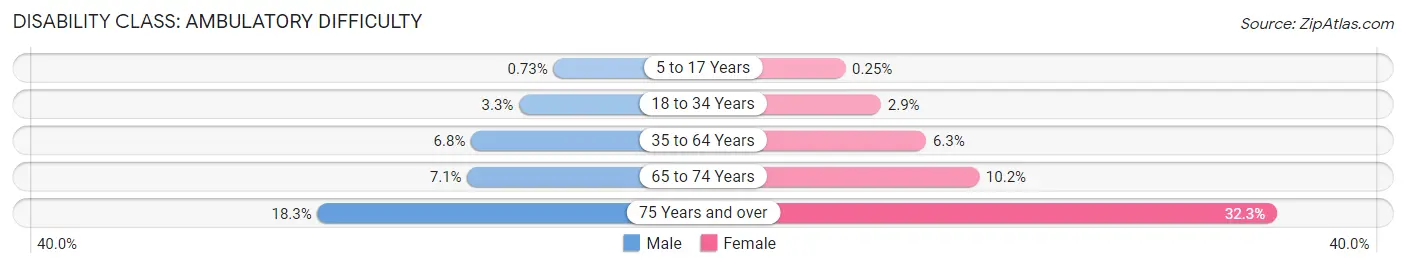
| Age Bracket | Male | Female |
| 5 to 17 Years | 9 (0.7%) | 3 (0.3%) |
| 18 to 34 Years | 51 (3.3%) | 36 (2.9%) |
| 35 to 64 Years | 240 (6.8%) | 214 (6.2%) |
| 65 to 74 Years | 111 (7.1%) | 145 (10.2%) |
| 75 Years and over | 156 (18.2%) | 296 (32.3%) |
Disability Class: Self-Care Difficulty
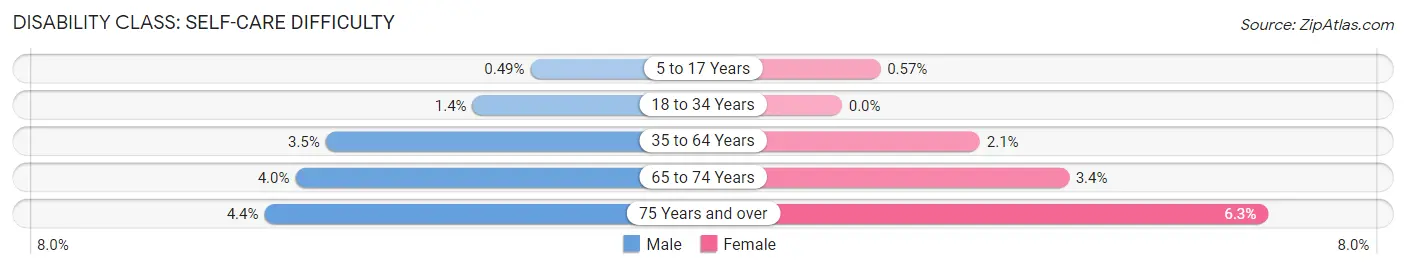
| Age Bracket | Male | Female |
| 5 to 17 Years | 6 (0.5%) | 7 (0.6%) |
| 18 to 34 Years | 21 (1.3%) | 0 (0.0%) |
| 35 to 64 Years | 124 (3.5%) | 70 (2.1%) |
| 65 to 74 Years | 62 (4.0%) | 48 (3.4%) |
| 75 Years and over | 38 (4.4%) | 58 (6.3%) |
Technology Access in Sawyer County
Computing Device Access in Sawyer County
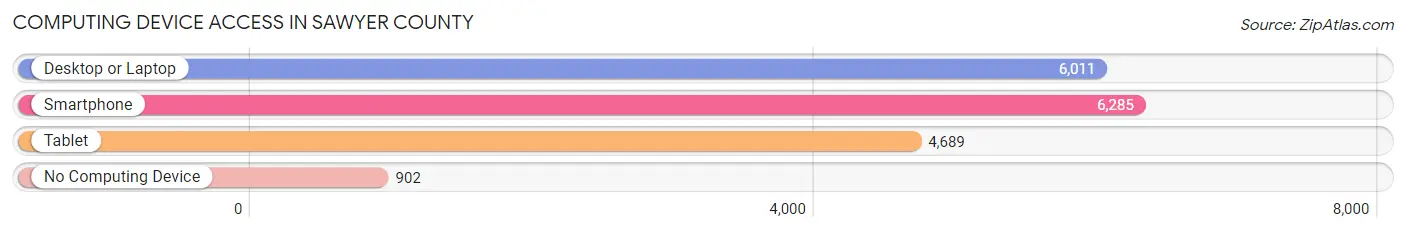
| Device Type | # Households | % Households |
| Desktop or Laptop | 6,011 | 73.2% |
| Smartphone | 6,285 | 76.5% |
| Tablet | 4,689 | 57.1% |
| No Computing Device | 902 | 11.0% |
| Total | 8,210 | 100.0% |
Internet Access in Sawyer County
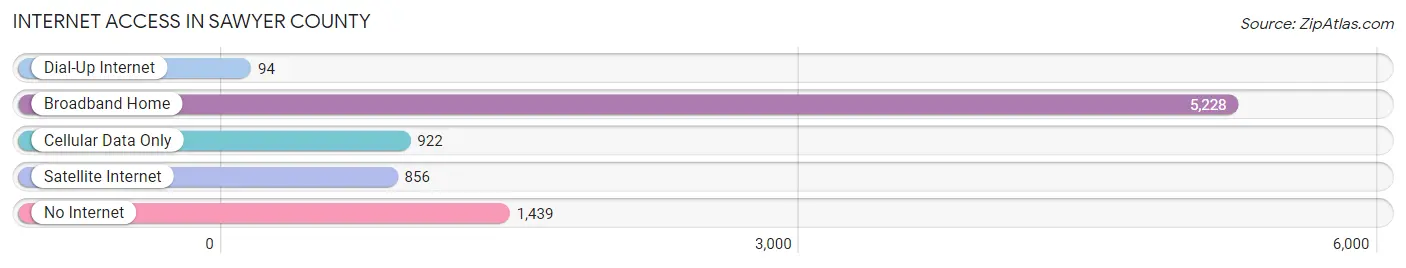
| Internet Type | # Households | % Households |
| Dial-Up Internet | 94 | 1.1% |
| Broadband Home | 5,228 | 63.7% |
| Cellular Data Only | 922 | 11.2% |
| Satellite Internet | 856 | 10.4% |
| No Internet | 1,439 | 17.5% |
| Total | 8,210 | 100.0% |
Sawyer County Summary
Sawyer County is located in the northwest corner of Wisconsin, and is part of the Chippewa Valley region. It is bordered by Barron, Washburn, and Rusk counties to the east, Price County to the south, and Bayfield and Douglas counties to the west. The county seat is Hayward, and the largest city is also Hayward. The county was established in 1883 and named after Philetus Sawyer, a U.S. Congressman from Wisconsin.
Geography
Sawyer County covers an area of 1,541 square miles, making it the fourth largest county in Wisconsin. The county is mostly forested, with the majority of the land being part of the Chequamegon-Nicolet National Forest. The county is also home to numerous lakes, including the Chippewa Flowage, Lac Courte Oreilles, and Grindstone Lake. The county is also home to the Namekagon River, which is part of the St. Croix National Scenic Riverway.
The county has a humid continental climate, with cold winters and warm summers. The average annual temperature is 40°F, and the average annual precipitation is 33 inches.
Economy
The economy of Sawyer County is largely based on tourism and forestry. The county is home to numerous resorts, campgrounds, and recreational areas, including the Chequamegon-Nicolet National Forest, the Namekagon River, and the Chippewa Flowage. The county is also home to numerous logging and timber companies, as well as paper mills.
Demographics
As of the 2010 census, the population of Sawyer County was 16,557. The population is largely white (96.2%), with small percentages of Native American (1.2%), African American (0.5%), Asian (0.3%), and Hispanic or Latino (1.2%) populations. The median household income is $41,945, and the median family income is $50,945. The per capita income is $22,845.
Conclusion
Sawyer County is a large, rural county located in the northwest corner of Wisconsin. The county is largely forested, and the economy is based on tourism and forestry. The population is largely white, with small percentages of other racial and ethnic groups. The median household and family incomes are slightly below the state average, and the per capita income is slightly above the state average.
Common Questions
What is Per Capita Income in Sawyer County?
Per Capita income in Sawyer County is $36,167.
What is the Median Family Income in Sawyer County?
Median Family Income in Sawyer County is $76,367.
What is the Median Household income in Sawyer County?
Median Household Income in Sawyer County is $57,519.
What is Income or Wage Gap in Sawyer County?
Income or Wage Gap in Sawyer County is 21.0%.
Women in Sawyer County earn 79.0 cents for every dollar earned by a man.
What is Family Income Deficit in Sawyer County?
Family Income Deficit in Sawyer County is $9,199.
Families that are below poverty line in Sawyer County earn $9,199 less on average than the poverty threshold level.
What is Inequality or Gini Index in Sawyer County?
Inequality or Gini Index in Sawyer County is 0.45.
What is the Total Population of Sawyer County?
Total Population of Sawyer County is 18,057.
What is the Total Male Population of Sawyer County?
Total Male Population of Sawyer County is 9,371.
What is the Total Female Population of Sawyer County?
Total Female Population of Sawyer County is 8,686.
What is the Ratio of Males per 100 Females in Sawyer County?
There are 107.89 Males per 100 Females in Sawyer County.
What is the Ratio of Females per 100 Males in Sawyer County?
There are 92.69 Females per 100 Males in Sawyer County.
What is the Median Population Age in Sawyer County?
Median Population Age in Sawyer County is 51.4 Years.
What is the Average Family Size in Sawyer County
Average Family Size in Sawyer County is 2.7 People.
What is the Average Household Size in Sawyer County
Average Household Size in Sawyer County is 2.1 People.
How Large is the Labor Force in Sawyer County?
There are 8,353 People in the Labor Forcein in Sawyer County.
What is the Percentage of People in the Labor Force in Sawyer County?
55.0% of People are in the Labor Force in Sawyer County.
What is the Unemployment Rate in Sawyer County?
Unemployment Rate in Sawyer County is 6.5%.