Rusk County, WI Map & Demographics
Rusk County Overview
$31,329
PER CAPITA INCOME
$70,774
AVG FAMILY INCOME
$57,473
AVG HOUSEHOLD INCOME
34.2%
WAGE / INCOME GAP [ % ]
65.8¢/ $1
WAGE / INCOME GAP [ $ ]
$7,808
FAMILY INCOME DEFICIT
0.40
INEQUALITY / GINI INDEX
14,179
TOTAL POPULATION
7,221
MALE POPULATION
6,958
FEMALE POPULATION
103.78
MALES / 100 FEMALES
96.36
FEMALES / 100 MALES
49.0
MEDIAN AGE
2.8
AVG FAMILY SIZE
2.3
AVG HOUSEHOLD SIZE
6,689
LABOR FORCE [ PEOPLE ]
57.6%
PERCENT IN LABOR FORCE
4.7%
UNEMPLOYMENT RATE
Rusk County Area Codes
Income in Rusk County
Income Overview in Rusk County
Per Capita Income in Rusk County is $31,329, while median incomes of families and households are $70,774 and $57,473 respectively.
| Characteristic | Number | Measure |
| Per Capita Income | 14,179 | $31,329 |
| Median Family Income | 3,819 | $70,774 |
| Mean Family Income | 3,819 | $81,276 |
| Median Household Income | 6,190 | $57,473 |
| Mean Household Income | 6,190 | $70,178 |
| Income Deficit | 3,819 | $7,808 |
| Wage / Income Gap (%) | 14,179 | 34.18% |
| Wage / Income Gap ($) | 14,179 | 65.82¢ per $1 |
| Gini / Inequality Index | 14,179 | 0.40 |
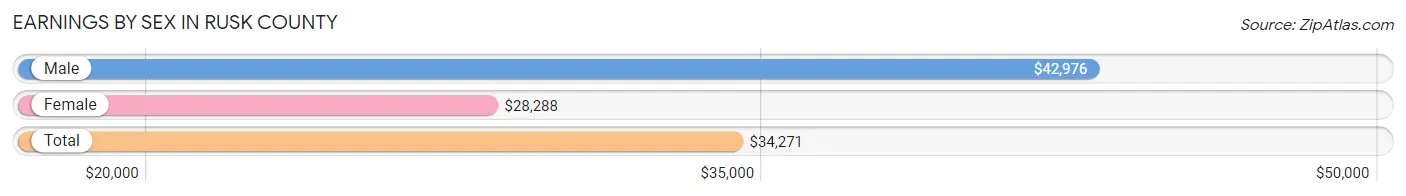
Earnings by Sex in Rusk County
Average Earnings in Rusk County are $34,271, $42,976 for men and $28,288 for women, a difference of 34.2%.
| Sex | Number | Average Earnings |
| Male | 3,938 (54.8%) | $42,976 |
| Female | 3,241 (45.2%) | $28,288 |
| Total | 7,179 (100.0%) | $34,271 |
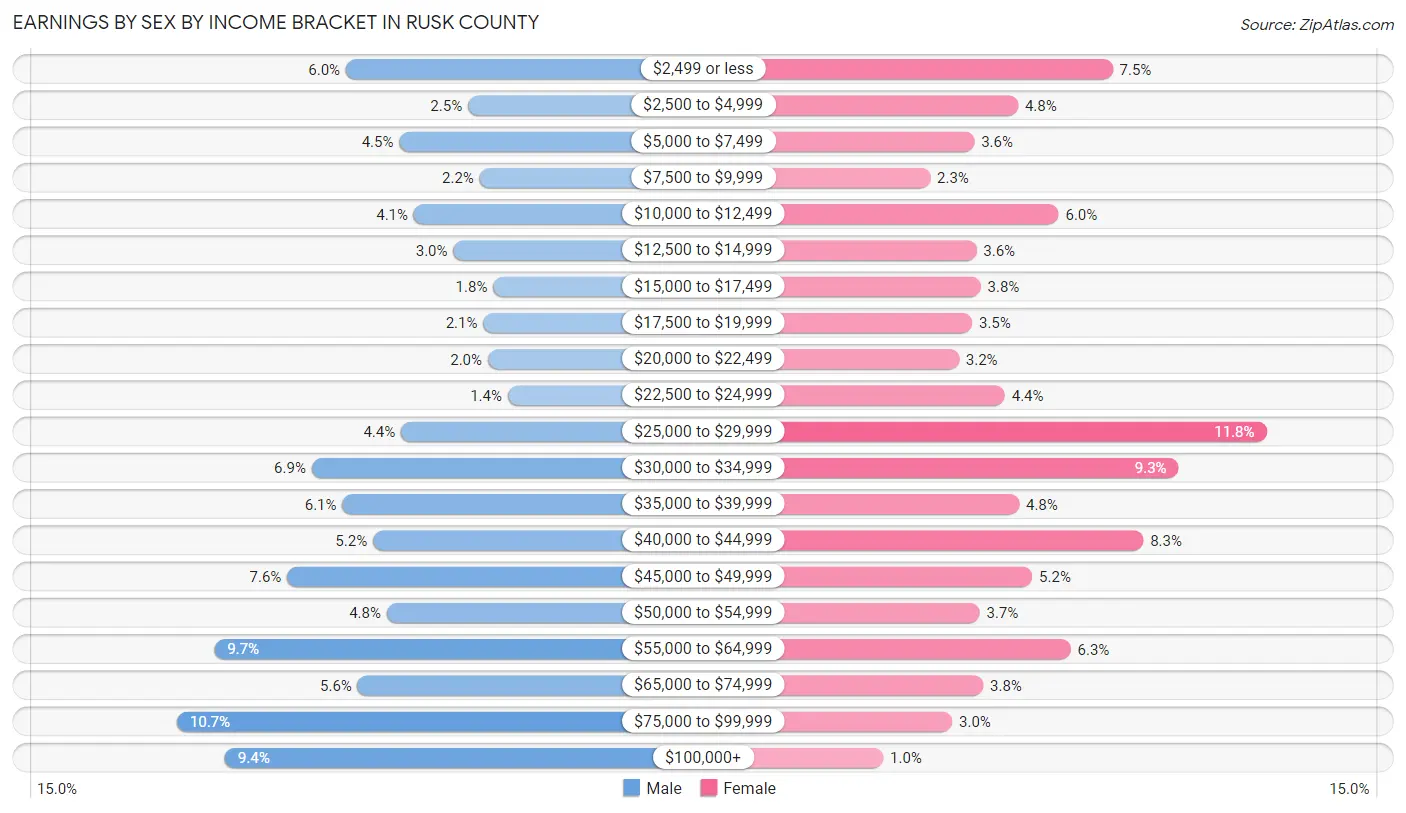
Earnings by Sex by Income Bracket in Rusk County
The most common earnings brackets in Rusk County are $75,000 to $99,999 for men (422 | 10.7%) and $25,000 to $29,999 for women (382 | 11.8%).
| Income | Male | Female |
| $2,499 or less | 235 (6.0%) | 242 (7.5%) |
| $2,500 to $4,999 | 100 (2.5%) | 156 (4.8%) |
| $5,000 to $7,499 | 176 (4.5%) | 116 (3.6%) |
| $7,500 to $9,999 | 87 (2.2%) | 76 (2.3%) |
| $10,000 to $12,499 | 160 (4.1%) | 193 (5.9%) |
| $12,500 to $14,999 | 116 (2.9%) | 118 (3.6%) |
| $15,000 to $17,499 | 72 (1.8%) | 122 (3.8%) |
| $17,500 to $19,999 | 83 (2.1%) | 114 (3.5%) |
| $20,000 to $22,499 | 78 (2.0%) | 102 (3.2%) |
| $22,500 to $24,999 | 56 (1.4%) | 144 (4.4%) |
| $25,000 to $29,999 | 174 (4.4%) | 382 (11.8%) |
| $30,000 to $34,999 | 273 (6.9%) | 302 (9.3%) |
| $35,000 to $39,999 | 239 (6.1%) | 157 (4.8%) |
| $40,000 to $44,999 | 205 (5.2%) | 270 (8.3%) |
| $45,000 to $49,999 | 300 (7.6%) | 169 (5.2%) |
| $50,000 to $54,999 | 190 (4.8%) | 121 (3.7%) |
| $55,000 to $64,999 | 381 (9.7%) | 204 (6.3%) |
| $65,000 to $74,999 | 222 (5.6%) | 124 (3.8%) |
| $75,000 to $99,999 | 422 (10.7%) | 96 (3.0%) |
| $100,000+ | 369 (9.4%) | 33 (1.0%) |
| Total | 3,938 (100.0%) | 3,241 (100.0%) |
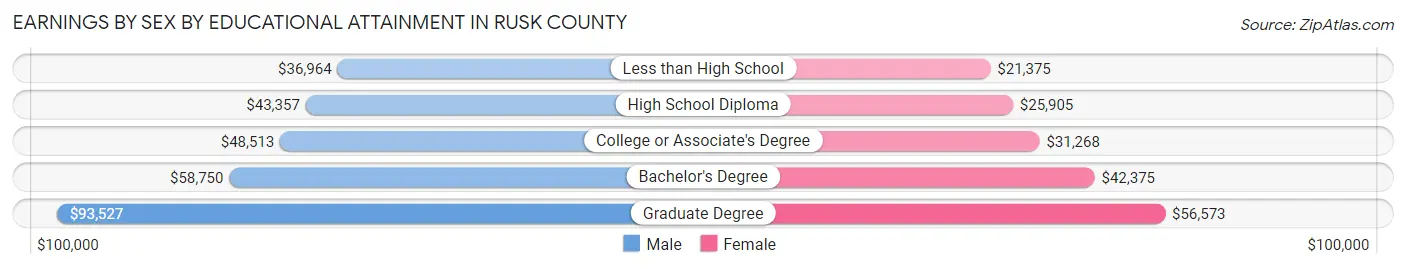
Earnings by Sex by Educational Attainment in Rusk County
Average earnings in Rusk County are $46,438 for men and $30,448 for women, a difference of 34.4%. Men with an educational attainment of graduate degree enjoy the highest average annual earnings of $93,527, while those with less than high school education earn the least with $36,964. Women with an educational attainment of graduate degree earn the most with the average annual earnings of $56,573, while those with less than high school education have the smallest earnings of $21,375.
| Educational Attainment | Male Income | Female Income |
| Less than High School | $36,964 | $21,375 |
| High School Diploma | $43,357 | $25,905 |
| College or Associate's Degree | $48,513 | $31,268 |
| Bachelor's Degree | $58,750 | $42,375 |
| Graduate Degree | $93,527 | $56,573 |
| Total | $46,438 | $30,448 |
Family Income in Rusk County
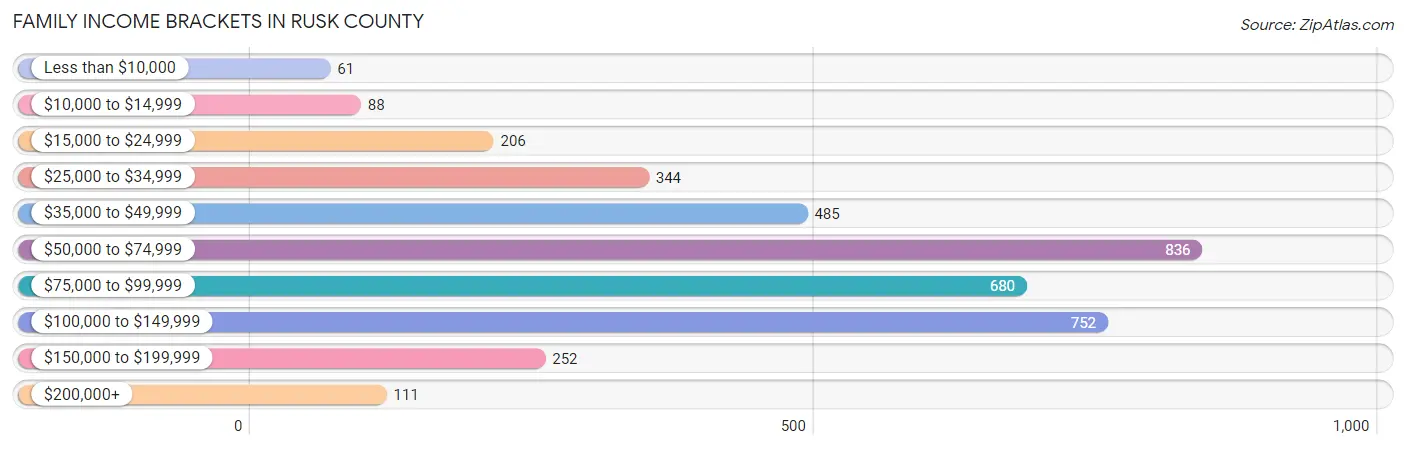
Family Income Brackets in Rusk County
According to the Rusk County family income data, there are 836 families falling into the $50,000 to $74,999 income range, which is the most common income bracket and makes up 21.9% of all families. Conversely, the less than $10,000 income bracket is the least frequent group with only 61 families (1.6%) belonging to this category.
| Income Bracket | # Families | % Families |
| Less than $10,000 | 61 | 1.6% |
| $10,000 to $14,999 | 88 | 2.3% |
| $15,000 to $24,999 | 206 | 5.4% |
| $25,000 to $34,999 | 344 | 9.0% |
| $35,000 to $49,999 | 485 | 12.7% |
| $50,000 to $74,999 | 836 | 21.9% |
| $75,000 to $99,999 | 680 | 17.8% |
| $100,000 to $149,999 | 752 | 19.7% |
| $150,000 to $199,999 | 252 | 6.6% |
| $200,000+ | 111 | 2.9% |
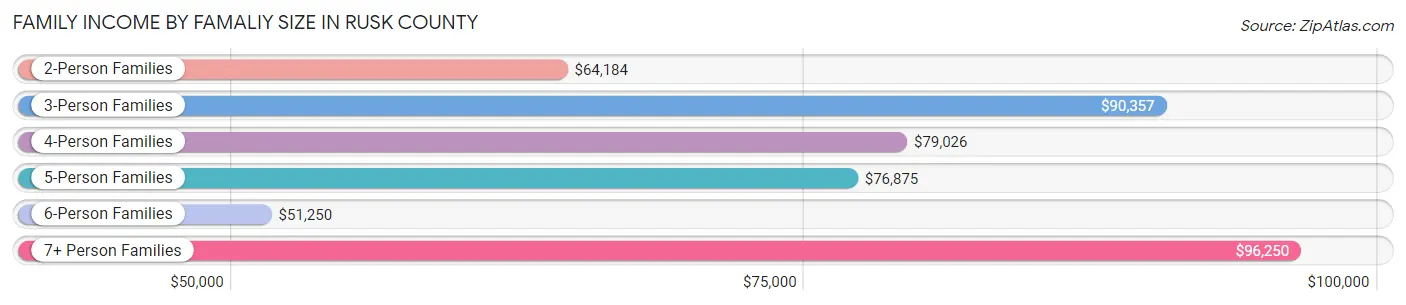
Family Income by Famaliy Size in Rusk County
7+ person families (50 | 1.3%) account for the highest median family income in Rusk County with $96,250 per family, while 2-person families (2,363 | 61.9%) have the highest median income of $32,092 per family member.
| Income Bracket | # Families | Median Income |
| 2-Person Families | 2,363 (61.9%) | $64,184 |
| 3-Person Families | 676 (17.7%) | $90,357 |
| 4-Person Families | 463 (12.1%) | $79,026 |
| 5-Person Families | 181 (4.7%) | $76,875 |
| 6-Person Families | 86 (2.2%) | $51,250 |
| 7+ Person Families | 50 (1.3%) | $96,250 |
| Total | 3,819 (100.0%) | $70,774 |
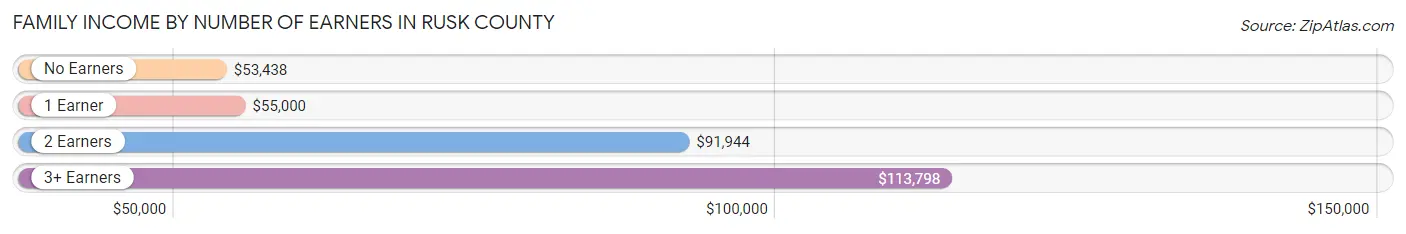
Family Income by Number of Earners in Rusk County
The median family income in Rusk County is $70,774, with families comprising 3+ earners (267) having the highest median family income of $113,798, while families with no earners (836) have the lowest median family income of $53,438, accounting for 7.0% and 21.9% of families, respectively.
| Number of Earners | # Families | Median Income |
| No Earners | 836 (21.9%) | $53,438 |
| 1 Earner | 1,228 (32.2%) | $55,000 |
| 2 Earners | 1,488 (39.0%) | $91,944 |
| 3+ Earners | 267 (7.0%) | $113,798 |
| Total | 3,819 (100.0%) | $70,774 |
Household Income in Rusk County
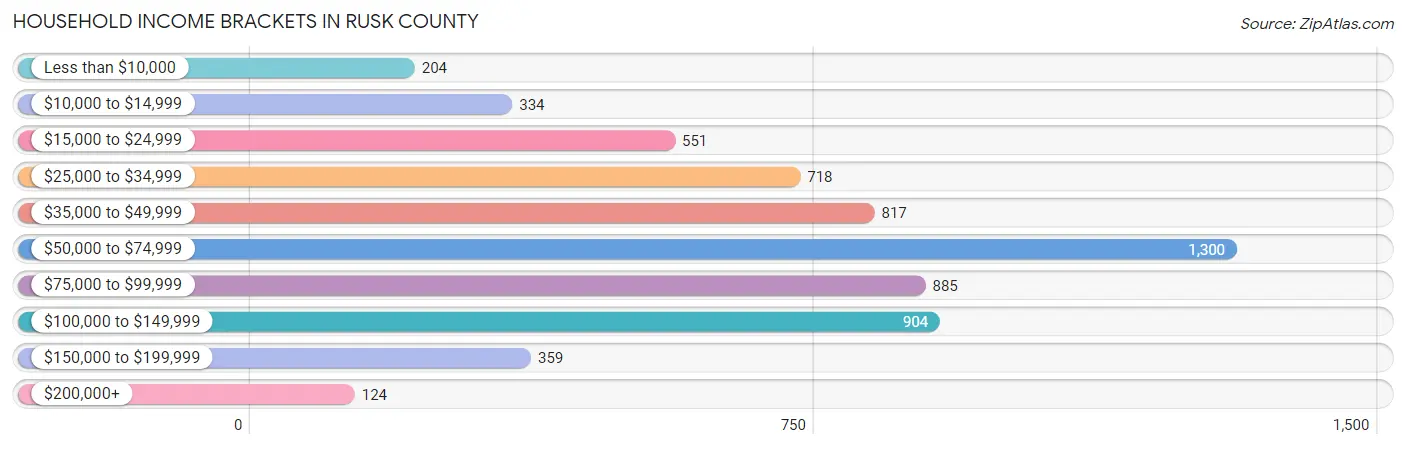
Household Income Brackets in Rusk County
With 1,300 households falling in the category, the $50,000 to $74,999 income range is the most frequent in Rusk County, accounting for 21.0% of all households. In contrast, only 124 households (2.0%) fall into the $200,000+ income bracket, making it the least populous group.
| Income Bracket | # Households | % Households |
| Less than $10,000 | 204 | 3.3% |
| $10,000 to $14,999 | 334 | 5.4% |
| $15,000 to $24,999 | 551 | 8.9% |
| $25,000 to $34,999 | 718 | 11.6% |
| $35,000 to $49,999 | 817 | 13.2% |
| $50,000 to $74,999 | 1,300 | 21.0% |
| $75,000 to $99,999 | 885 | 14.3% |
| $100,000 to $149,999 | 904 | 14.6% |
| $150,000 to $199,999 | 359 | 5.8% |
| $200,000+ | 124 | 2.0% |
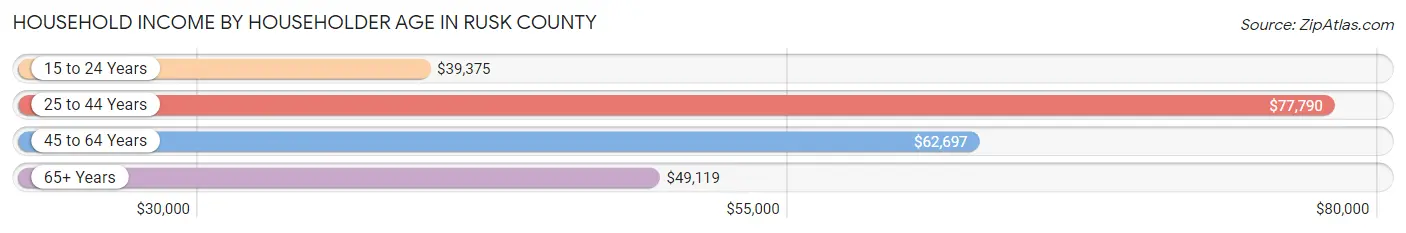
Household Income by Householder Age in Rusk County
The median household income in Rusk County is $57,473, with the highest median household income of $77,790 found in the 25 to 44 years age bracket for the primary householder. A total of 1,346 households (21.7%) fall into this category. Meanwhile, the 15 to 24 years age bracket for the primary householder has the lowest median household income of $39,375, with 206 households (3.3%) in this group.
| Income Bracket | # Households | Median Income |
| 15 to 24 Years | 206 (3.3%) | $39,375 |
| 25 to 44 Years | 1,346 (21.7%) | $77,790 |
| 45 to 64 Years | 2,315 (37.4%) | $62,697 |
| 65+ Years | 2,323 (37.5%) | $49,119 |
| Total | 6,190 (100.0%) | $57,473 |
Poverty in Rusk County
Income Below Poverty by Sex and Age in Rusk County
With 10.0% poverty level for males and 12.8% for females among the residents of Rusk County, 5 year old males and 15 year old females are the most vulnerable to poverty, with 36 males (37.1%) and 67 females (49.3%) in their respective age groups living below the poverty level.
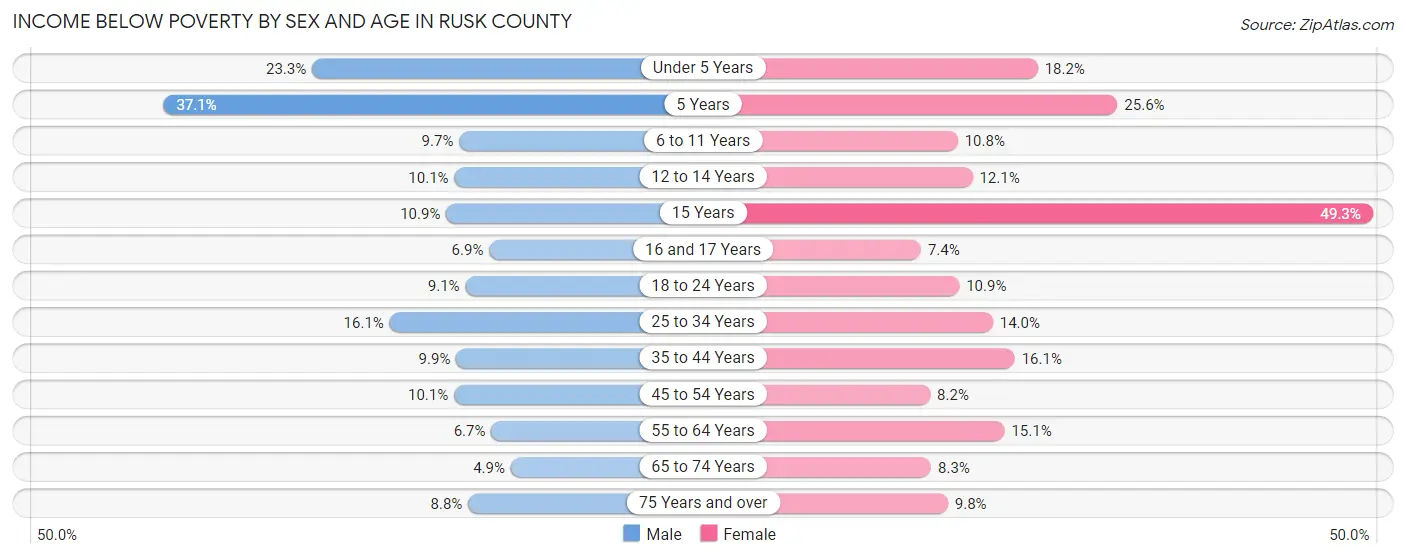
| Age Bracket | Male | Female |
| Under 5 Years | 87 (23.3%) | 70 (18.2%) |
| 5 Years | 36 (37.1%) | 11 (25.6%) |
| 6 to 11 Years | 49 (9.7%) | 48 (10.8%) |
| 12 to 14 Years | 18 (10.1%) | 29 (12.1%) |
| 15 Years | 10 (10.9%) | 67 (49.3%) |
| 16 and 17 Years | 11 (6.9%) | 10 (7.3%) |
| 18 to 24 Years | 44 (9.1%) | 45 (10.9%) |
| 25 to 34 Years | 103 (16.1%) | 86 (14.0%) |
| 35 to 44 Years | 71 (9.9%) | 112 (16.1%) |
| 45 to 54 Years | 95 (10.1%) | 66 (8.2%) |
| 55 to 64 Years | 83 (6.7%) | 173 (15.1%) |
| 65 to 74 Years | 53 (4.9%) | 85 (8.3%) |
| 75 Years and over | 53 (8.8%) | 73 (9.8%) |
| Total | 713 (10.0%) | 875 (12.8%) |
Income Above Poverty by Sex and Age in Rusk County
According to the poverty statistics in Rusk County, males aged 65 to 74 years and females aged 16 and 17 years are the age groups that are most secure financially, with 95.1% of males and 92.6% of females in these age groups living above the poverty line.
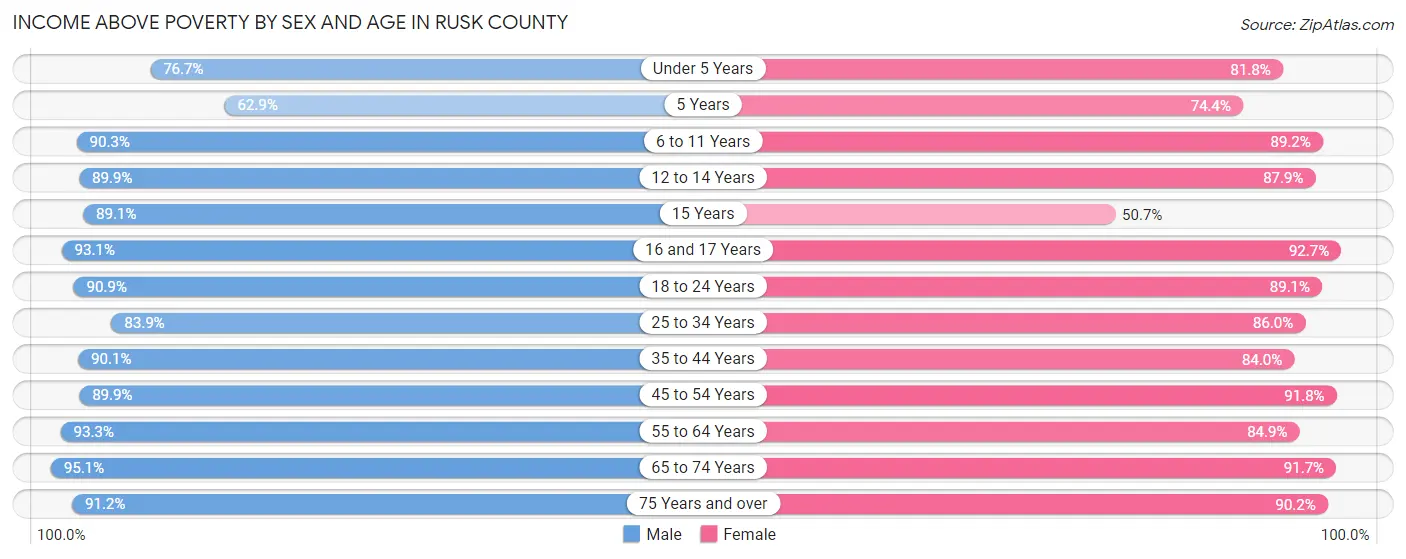
| Age Bracket | Male | Female |
| Under 5 Years | 286 (76.7%) | 315 (81.8%) |
| 5 Years | 61 (62.9%) | 32 (74.4%) |
| 6 to 11 Years | 458 (90.3%) | 398 (89.2%) |
| 12 to 14 Years | 160 (89.9%) | 210 (87.9%) |
| 15 Years | 82 (89.1%) | 69 (50.7%) |
| 16 and 17 Years | 149 (93.1%) | 126 (92.6%) |
| 18 to 24 Years | 440 (90.9%) | 368 (89.1%) |
| 25 to 34 Years | 536 (83.9%) | 528 (86.0%) |
| 35 to 44 Years | 643 (90.1%) | 586 (84.0%) |
| 45 to 54 Years | 842 (89.9%) | 739 (91.8%) |
| 55 to 64 Years | 1,157 (93.3%) | 973 (84.9%) |
| 65 to 74 Years | 1,033 (95.1%) | 940 (91.7%) |
| 75 Years and over | 547 (91.2%) | 669 (90.2%) |
| Total | 6,394 (90.0%) | 5,953 (87.2%) |
Income Below Poverty Among Married-Couple Families in Rusk County
The poverty statistics for married-couple families in Rusk County show that 5.1% or 157 of the total 3,111 families live below the poverty line. Families with 5 or more children have the highest poverty rate of 16.2%, comprising of 6 families. On the other hand, families with 1 or 2 children have the lowest poverty rate of 4.0%, which includes 24 families.
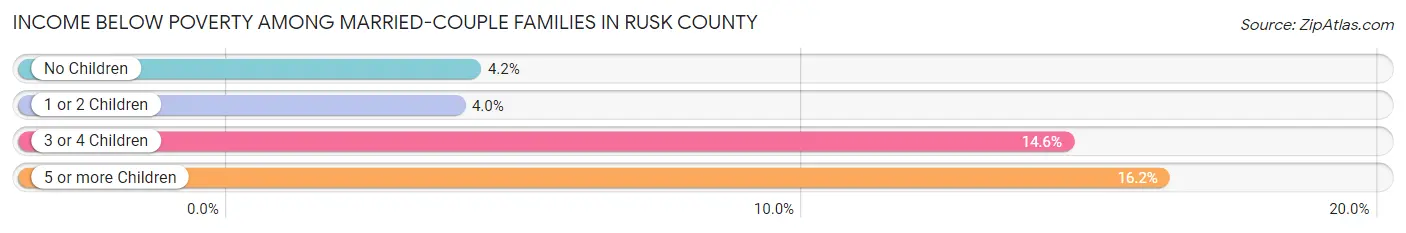
| Children | Above Poverty | Below Poverty |
| No Children | 2,151 (95.8%) | 95 (4.2%) |
| 1 or 2 Children | 584 (96.1%) | 24 (4.0%) |
| 3 or 4 Children | 188 (85.5%) | 32 (14.5%) |
| 5 or more Children | 31 (83.8%) | 6 (16.2%) |
| Total | 2,954 (95.0%) | 157 (5.1%) |
Income Below Poverty Among Single-Parent Households in Rusk County
According to the poverty data in Rusk County, 17.0% or 48 single-father households and 20.2% or 86 single-mother households are living below the poverty line. Among single-father households, those with 1 or 2 children have the highest poverty rate, with 36 households (24.8%) experiencing poverty. Likewise, among single-mother households, those with 3 or 4 children have the highest poverty rate, with 10 households (40.0%) falling below the poverty line.
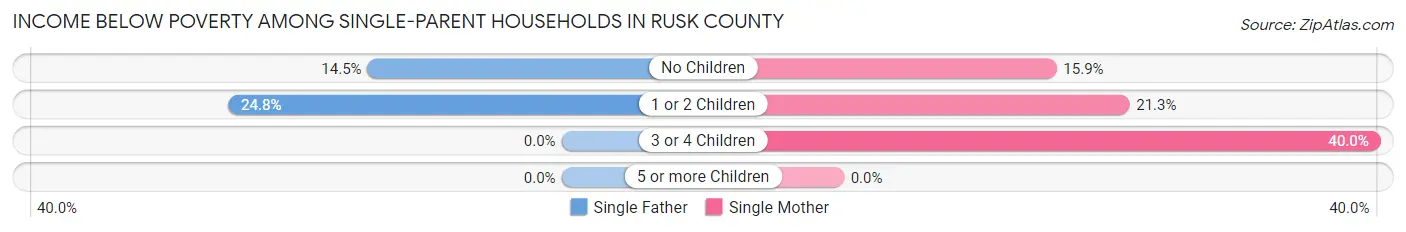
| Children | Single Father | Single Mother |
| No Children | 12 (14.5%) | 26 (15.9%) |
| 1 or 2 Children | 36 (24.8%) | 50 (21.3%) |
| 3 or 4 Children | 0 (0.0%) | 10 (40.0%) |
| 5 or more Children | 0 (0.0%) | 0 (0.0%) |
| Total | 48 (17.0%) | 86 (20.2%) |
Income Below Poverty Among Married-Couple vs Single-Parent Households in Rusk County
The poverty data for Rusk County shows that 157 of the married-couple family households (5.1%) and 134 of the single-parent households (18.9%) are living below the poverty level. Within the married-couple family households, those with 5 or more children have the highest poverty rate, with 6 households (16.2%) falling below the poverty line. Among the single-parent households, those with 1 or 2 children have the highest poverty rate, with 86 household (22.6%) living below poverty.
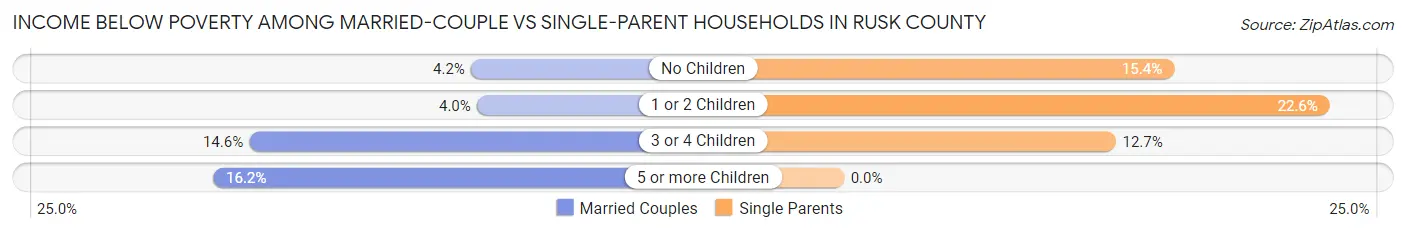
| Children | Married-Couple Families | Single-Parent Households |
| No Children | 95 (4.2%) | 38 (15.4%) |
| 1 or 2 Children | 24 (4.0%) | 86 (22.6%) |
| 3 or 4 Children | 32 (14.5%) | 10 (12.7%) |
| 5 or more Children | 6 (16.2%) | 0 (0.0%) |
| Total | 157 (5.1%) | 134 (18.9%) |
Race in Rusk County
The most populous races in Rusk County are White / Caucasian (13,531 | 95.4%), Two or more Races (400 | 2.8%), and Hispanic or Latino (300 | 2.1%).
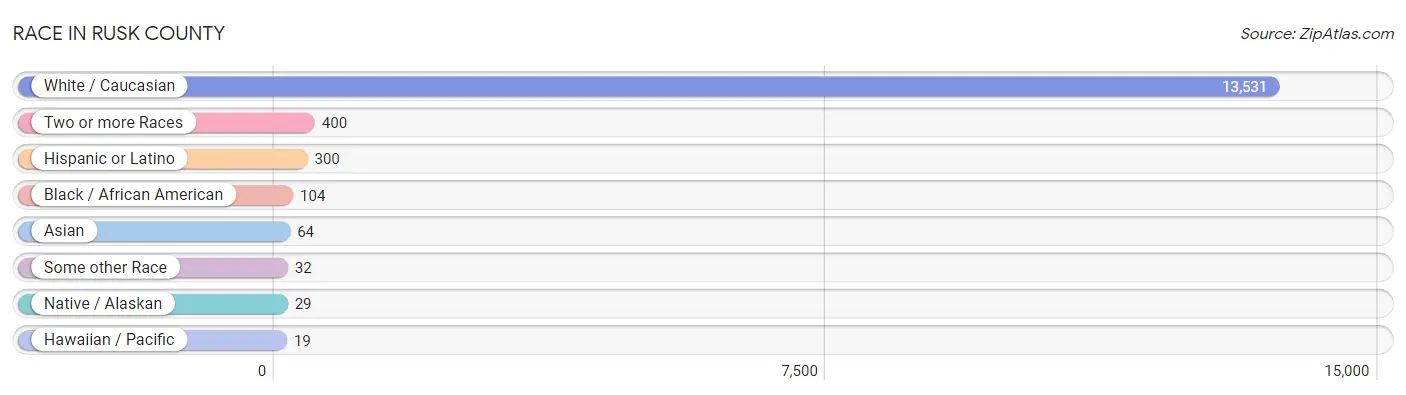
| Race | # Population | % Population |
| Asian | 64 | 0.4% |
| Black / African American | 104 | 0.7% |
| Hawaiian / Pacific | 19 | 0.1% |
| Hispanic or Latino | 300 | 2.1% |
| Native / Alaskan | 29 | 0.2% |
| White / Caucasian | 13,531 | 95.4% |
| Two or more Races | 400 | 2.8% |
| Some other Race | 32 | 0.2% |
| Total | 14,179 | 100.0% |
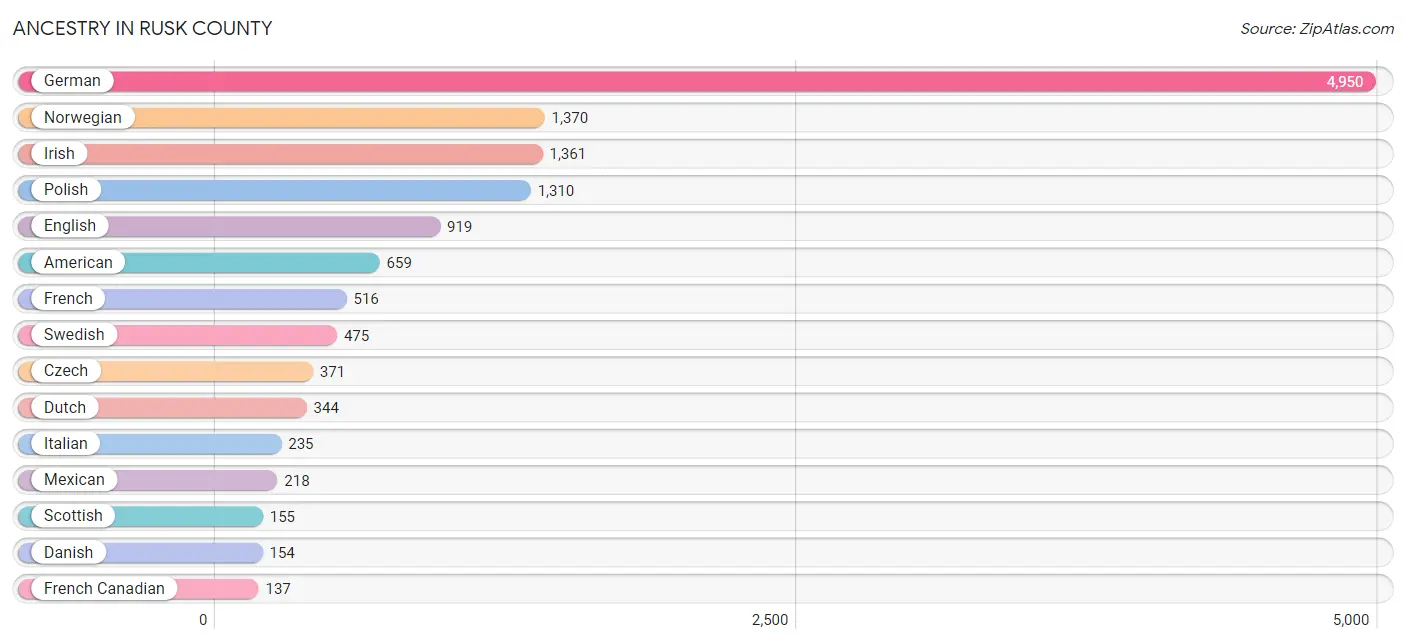
Ancestry in Rusk County
The most populous ancestries reported in Rusk County are German (4,950 | 34.9%), Norwegian (1,370 | 9.7%), Irish (1,361 | 9.6%), Polish (1,310 | 9.2%), and English (919 | 6.5%), together accounting for 69.9% of all Rusk County residents.
| Ancestry | # Population | % Population |
| African | 14 | 0.1% |
| Albanian | 2 | 0.0% |
| American | 659 | 4.6% |
| Arab | 5 | 0.0% |
| Australian | 10 | 0.1% |
| Austrian | 31 | 0.2% |
| Bangladeshi | 11 | 0.1% |
| Belgian | 65 | 0.5% |
| Bhutanese | 11 | 0.1% |
| Blackfeet | 20 | 0.1% |
| British | 18 | 0.1% |
| Bulgarian | 9 | 0.1% |
| Burmese | 14 | 0.1% |
| Cajun | 3 | 0.0% |
| Canadian | 2 | 0.0% |
| Celtic | 21 | 0.2% |
| Central American | 10 | 0.1% |
| Cherokee | 17 | 0.1% |
| Chippewa | 35 | 0.3% |
| Croatian | 18 | 0.1% |
| Cuban | 8 | 0.1% |
| Czech | 371 | 2.6% |
| Czechoslovakian | 59 | 0.4% |
| Danish | 154 | 1.1% |
| Dominican | 3 | 0.0% |
| Dutch | 344 | 2.4% |
| Eastern European | 27 | 0.2% |
| English | 919 | 6.5% |
| European | 86 | 0.6% |
| Finnish | 67 | 0.5% |
| French | 516 | 3.6% |
| French American Indian | 2 | 0.0% |
| French Canadian | 137 | 1.0% |
| German | 4,950 | 34.9% |
| Greek | 7 | 0.1% |
| Guamanian / Chamorro | 2 | 0.0% |
| Guatemalan | 7 | 0.1% |
| Honduran | 3 | 0.0% |
| Hungarian | 33 | 0.2% |
| Indian (Asian) | 26 | 0.2% |
| Iranian | 1 | 0.0% |
| Iraqi | 5 | 0.0% |
| Irish | 1,361 | 9.6% |
| Italian | 235 | 1.7% |
| Kenyan | 7 | 0.1% |
| Korean | 47 | 0.3% |
| Lithuanian | 29 | 0.2% |
| Lumbee | 12 | 0.1% |
| Luxembourger | 9 | 0.1% |
| Mexican | 218 | 1.5% |
| Native Hawaiian | 11 | 0.1% |
| New Zealander | 13 | 0.1% |
| Nigerian | 2 | 0.0% |
| Northern European | 9 | 0.1% |
| Norwegian | 1,370 | 9.7% |
| Ottawa | 2 | 0.0% |
| Pennsylvania German | 86 | 0.6% |
| Polish | 1,310 | 9.2% |
| Potawatomi | 2 | 0.0% |
| Puerto Rican | 12 | 0.1% |
| Russian | 31 | 0.2% |
| Scandinavian | 90 | 0.6% |
| Scotch-Irish | 60 | 0.4% |
| Scottish | 155 | 1.1% |
| Serbian | 8 | 0.1% |
| Sioux | 8 | 0.1% |
| Slavic | 20 | 0.1% |
| Slovak | 32 | 0.2% |
| Slovene | 12 | 0.1% |
| Spanish | 32 | 0.2% |
| Subsaharan African | 24 | 0.2% |
| Swedish | 475 | 3.4% |
| Swiss | 113 | 0.8% |
| Thai | 5 | 0.0% |
| Tohono O'Odham | 2 | 0.0% |
| Turkish | 1 | 0.0% |
| Ukrainian | 25 | 0.2% |
| Welsh | 70 | 0.5% |
| Yugoslavian | 6 | 0.0% | View All 79 Rows |
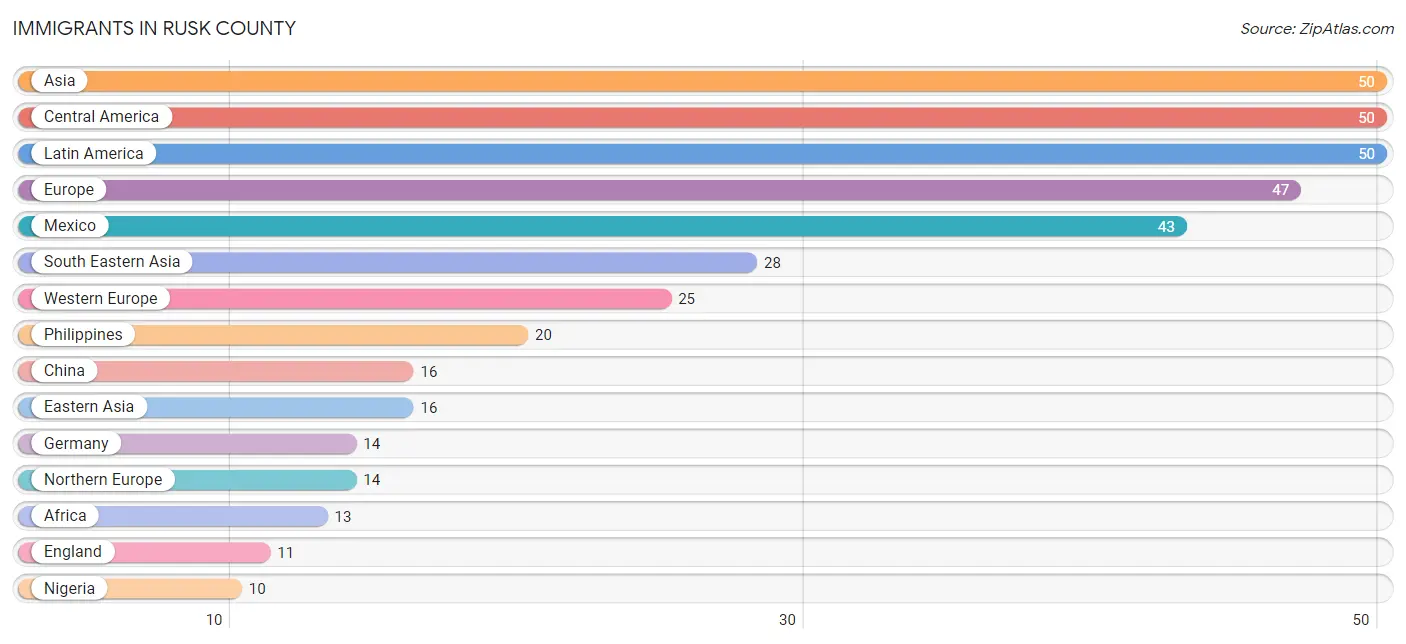
Immigrants in Rusk County
The most numerous immigrant groups reported in Rusk County came from Asia (50 | 0.4%), Central America (50 | 0.4%), Latin America (50 | 0.4%), Europe (47 | 0.3%), and Mexico (43 | 0.3%), together accounting for 1.7% of all Rusk County residents.
| Immigration Origin | # Population | % Population |
| Africa | 13 | 0.1% |
| Asia | 50 | 0.4% |
| Australia | 4 | 0.0% |
| Central America | 50 | 0.4% |
| China | 16 | 0.1% |
| Eastern Africa | 3 | 0.0% |
| Eastern Asia | 16 | 0.1% |
| Eastern Europe | 8 | 0.1% |
| England | 11 | 0.1% |
| Europe | 47 | 0.3% |
| France | 3 | 0.0% |
| Germany | 14 | 0.1% |
| Guatemala | 7 | 0.1% |
| Iran | 1 | 0.0% |
| Iraq | 5 | 0.0% |
| Kenya | 3 | 0.0% |
| Laos | 8 | 0.1% |
| Latin America | 50 | 0.4% |
| Mexico | 43 | 0.3% |
| Netherlands | 8 | 0.1% |
| Nigeria | 10 | 0.1% |
| Northern Europe | 14 | 0.1% |
| Norway | 2 | 0.0% |
| Oceania | 4 | 0.0% |
| Philippines | 20 | 0.1% |
| Poland | 5 | 0.0% |
| South Central Asia | 1 | 0.0% |
| South Eastern Asia | 28 | 0.2% |
| Western Africa | 10 | 0.1% |
| Western Asia | 5 | 0.0% |
| Western Europe | 25 | 0.2% | View All 31 Rows |
Sex and Age in Rusk County
Sex and Age in Rusk County
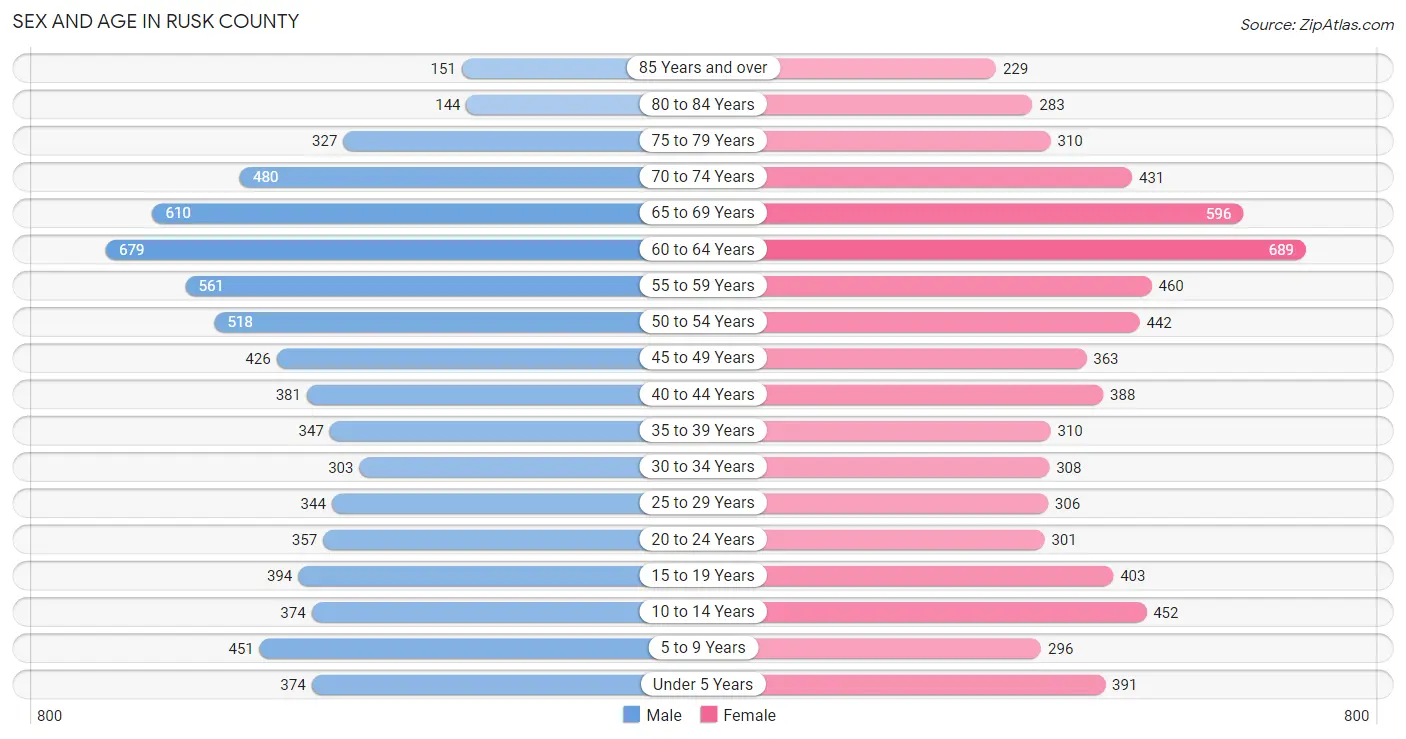
The most populous age groups in Rusk County are 60 to 64 Years (679 | 9.4%) for men and 60 to 64 Years (689 | 9.9%) for women.
| Age Bracket | Male | Female |
| Under 5 Years | 374 (5.2%) | 391 (5.6%) |
| 5 to 9 Years | 451 (6.2%) | 296 (4.3%) |
| 10 to 14 Years | 374 (5.2%) | 452 (6.5%) |
| 15 to 19 Years | 394 (5.5%) | 403 (5.8%) |
| 20 to 24 Years | 357 (4.9%) | 301 (4.3%) |
| 25 to 29 Years | 344 (4.8%) | 306 (4.4%) |
| 30 to 34 Years | 303 (4.2%) | 308 (4.4%) |
| 35 to 39 Years | 347 (4.8%) | 310 (4.5%) |
| 40 to 44 Years | 381 (5.3%) | 388 (5.6%) |
| 45 to 49 Years | 426 (5.9%) | 363 (5.2%) |
| 50 to 54 Years | 518 (7.2%) | 442 (6.4%) |
| 55 to 59 Years | 561 (7.8%) | 460 (6.6%) |
| 60 to 64 Years | 679 (9.4%) | 689 (9.9%) |
| 65 to 69 Years | 610 (8.5%) | 596 (8.6%) |
| 70 to 74 Years | 480 (6.7%) | 431 (6.2%) |
| 75 to 79 Years | 327 (4.5%) | 310 (4.5%) |
| 80 to 84 Years | 144 (2.0%) | 283 (4.1%) |
| 85 Years and over | 151 (2.1%) | 229 (3.3%) |
| Total | 7,221 (100.0%) | 6,958 (100.0%) |
Families and Households in Rusk County
Median Family Size in Rusk County
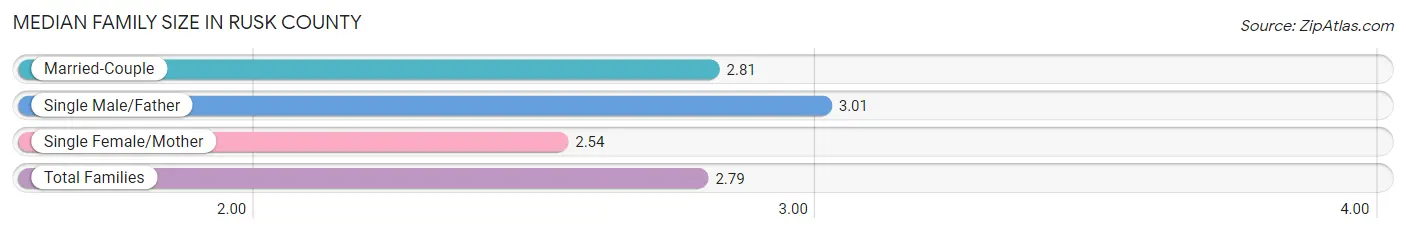
The median family size in Rusk County is 2.79 persons per family, with single male/father families (283 | 7.4%) accounting for the largest median family size of 3.01 persons per family. On the other hand, single female/mother families (425 | 11.1%) represent the smallest median family size with 2.54 persons per family.
| Family Type | # Families | Family Size |
| Married-Couple | 3,111 (81.5%) | 2.81 |
| Single Male/Father | 283 (7.4%) | 3.01 |
| Single Female/Mother | 425 (11.1%) | 2.54 |
| Total Families | 3,819 (100.0%) | 2.79 |
Median Household Size in Rusk County
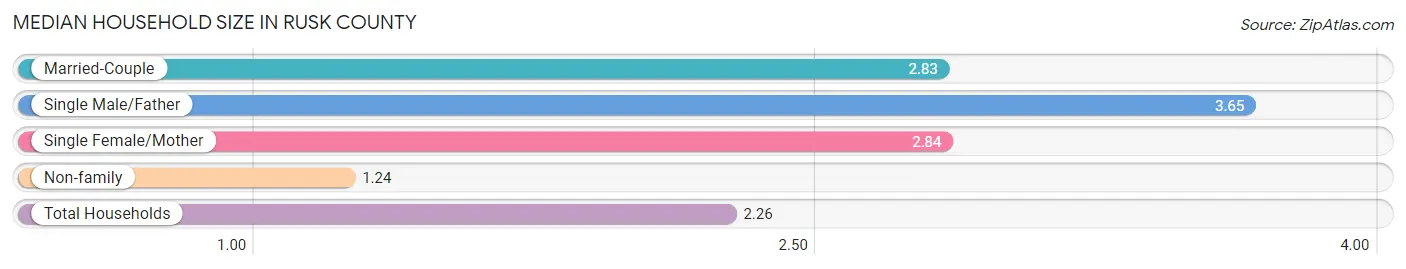
The median household size in Rusk County is 2.26 persons per household, with single male/father households (283 | 4.6%) accounting for the largest median household size of 3.65 persons per household. non-family households (2,371 | 38.3%) represent the smallest median household size with 1.24 persons per household.
| Household Type | # Households | Household Size |
| Married-Couple | 3,111 (50.3%) | 2.83 |
| Single Male/Father | 283 (4.6%) | 3.65 |
| Single Female/Mother | 425 (6.9%) | 2.84 |
| Non-family | 2,371 (38.3%) | 1.24 |
| Total Households | 6,190 (100.0%) | 2.26 |
Household Size by Marriage Status in Rusk County
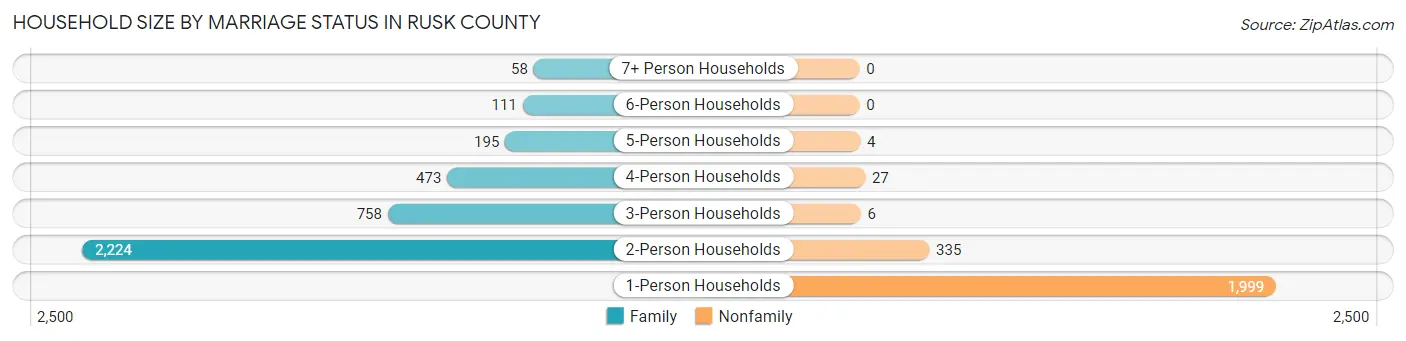
Out of a total of 6,190 households in Rusk County, 3,819 (61.7%) are family households, while 2,371 (38.3%) are nonfamily households. The most numerous type of family households are 2-person households, comprising 2,224, and the most common type of nonfamily households are 1-person households, comprising 1,999.
| Household Size | Family Households | Nonfamily Households |
| 1-Person Households | - | 1,999 (32.3%) |
| 2-Person Households | 2,224 (35.9%) | 335 (5.4%) |
| 3-Person Households | 758 (12.2%) | 6 (0.1%) |
| 4-Person Households | 473 (7.6%) | 27 (0.4%) |
| 5-Person Households | 195 (3.2%) | 4 (0.1%) |
| 6-Person Households | 111 (1.8%) | 0 (0.0%) |
| 7+ Person Households | 58 (0.9%) | 0 (0.0%) |
| Total | 3,819 (61.7%) | 2,371 (38.3%) |
Female Fertility in Rusk County
Fertility by Age in Rusk County
Average fertility rate in Rusk County is 71.0 births per 1,000 women. Women in the age bracket of 20 to 34 years have the highest fertility rate with 131.0 births per 1,000 women. Women in the age bracket of 20 to 34 years acount for 68.6% of all women with births.
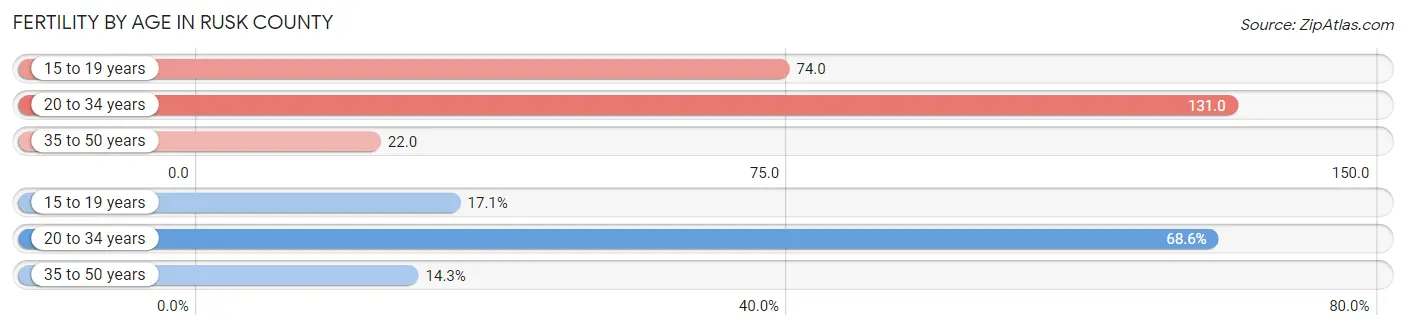
| Age Bracket | Women with Births | Births / 1,000 Women |
| 15 to 19 years | 30 (17.1%) | 74.0 |
| 20 to 34 years | 120 (68.6%) | 131.0 |
| 35 to 50 years | 25 (14.3%) | 22.0 |
| Total | 175 (100.0%) | 71.0 |
Fertility by Age by Marriage Status in Rusk County
76.6% of women with births (175) in Rusk County are married. The highest percentage of unmarried women with births falls into 20 to 34 years age bracket with 32.5% of them unmarried at the time of birth, while the lowest percentage of unmarried women with births belong to 15 to 19 years age bracket with 0.0% of them unmarried.
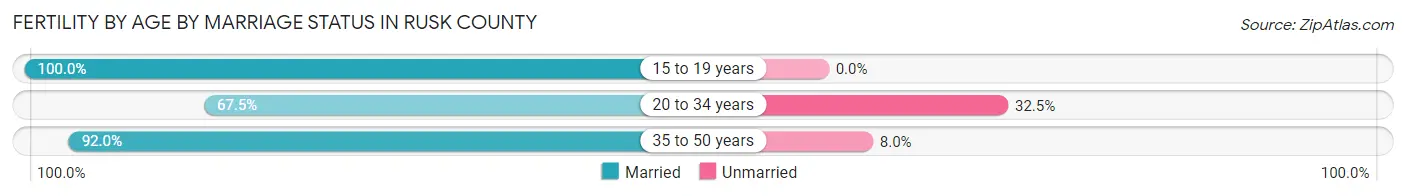
| Age Bracket | Married | Unmarried |
| 15 to 19 years | 30 (100.0%) | 0 (0.0%) |
| 20 to 34 years | 81 (67.5%) | 39 (32.5%) |
| 35 to 50 years | 23 (92.0%) | 2 (8.0%) |
| Total | 134 (76.6%) | 41 (23.4%) |
Fertility by Education in Rusk County
Average fertility rate in Rusk County is 71.0 births per 1,000 women. Women with the education attainment of less than high school have the highest fertility rate of 110.0 births per 1,000 women, while women with the education attainment of graduate degree have the lowest fertility at 26.0 births per 1,000 women. Women with the education attainment of high school diploma represent 34.9% of all women with births.
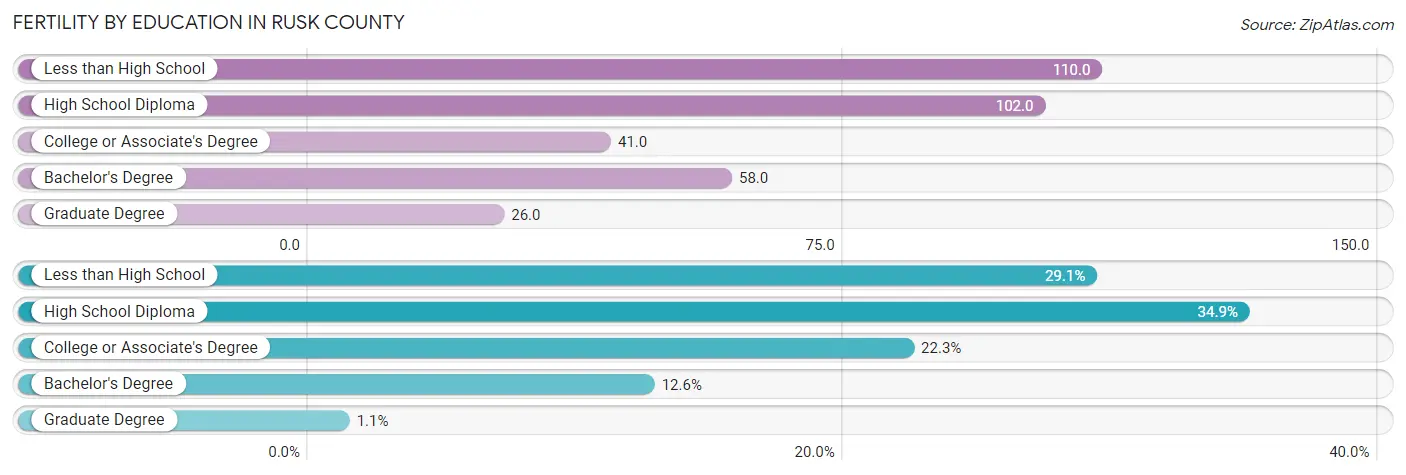
| Educational Attainment | Women with Births | Births / 1,000 Women |
| Less than High School | 51 (29.1%) | 110.0 |
| High School Diploma | 61 (34.9%) | 102.0 |
| College or Associate's Degree | 39 (22.3%) | 41.0 |
| Bachelor's Degree | 22 (12.6%) | 58.0 |
| Graduate Degree | 2 (1.1%) | 26.0 |
| Total | 175 (100.0%) | 71.0 |
Fertility by Education by Marriage Status in Rusk County
23.4% of women with births in Rusk County are unmarried. Women with the educational attainment of graduate degree are most likely to be married with 100.0% of them married at childbirth, while women with the educational attainment of less than high school are least likely to be married with 52.9% of them unmarried at childbirth.
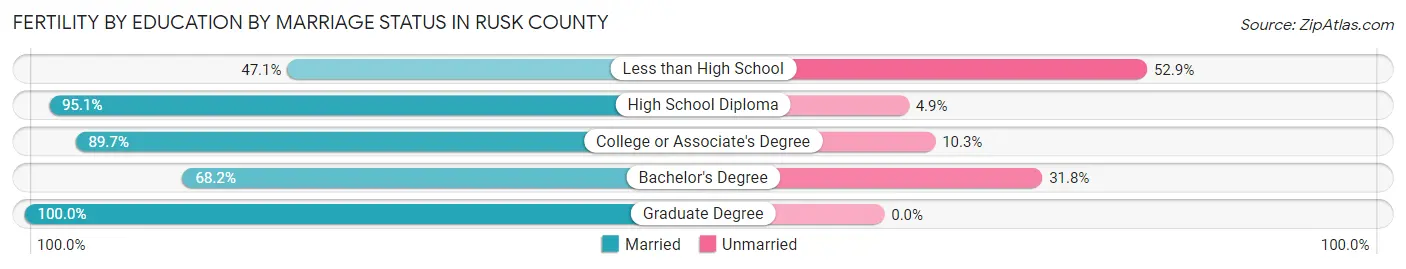
| Educational Attainment | Married | Unmarried |
| Less than High School | 24 (47.1%) | 27 (52.9%) |
| High School Diploma | 58 (95.1%) | 3 (4.9%) |
| College or Associate's Degree | 35 (89.7%) | 4 (10.3%) |
| Bachelor's Degree | 15 (68.2%) | 7 (31.8%) |
| Graduate Degree | 2 (100.0%) | 0 (0.0%) |
| Total | 134 (76.6%) | 41 (23.4%) |
Employment Characteristics in Rusk County
Employment by Class of Employer in Rusk County
Among the 6,111 employed individuals in Rusk County, private company employees (4,071 | 66.6%), local government employees (512 | 8.4%), and self-employed (not incorporated) (493 | 8.1%) make up the most common classes of employment.
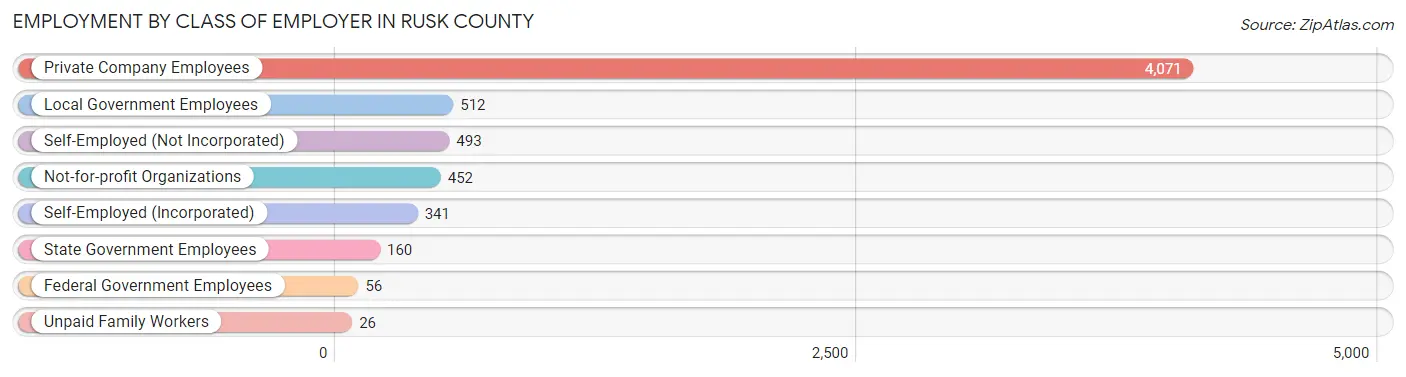
| Employer Class | # Employees | % Employees |
| Private Company Employees | 4,071 | 66.6% |
| Self-Employed (Incorporated) | 341 | 5.6% |
| Self-Employed (Not Incorporated) | 493 | 8.1% |
| Not-for-profit Organizations | 452 | 7.4% |
| Local Government Employees | 512 | 8.4% |
| State Government Employees | 160 | 2.6% |
| Federal Government Employees | 56 | 0.9% |
| Unpaid Family Workers | 26 | 0.4% |
| Total | 6,111 | 100.0% |
Employment Status by Age in Rusk County
According to the labor force statistics for Rusk County, out of the total population over 16 years of age (11,613), 57.6% or 6,689 individuals are in the labor force, with 4.7% or 314 of them unemployed. The age group with the highest labor force participation rate is 35 to 44 years, with 84.1% or 1,199 individuals in the labor force. Within the labor force, the 20 to 24 years age range has the highest percentage of unemployed individuals, with 10.2% or 55 of them being unemployed.
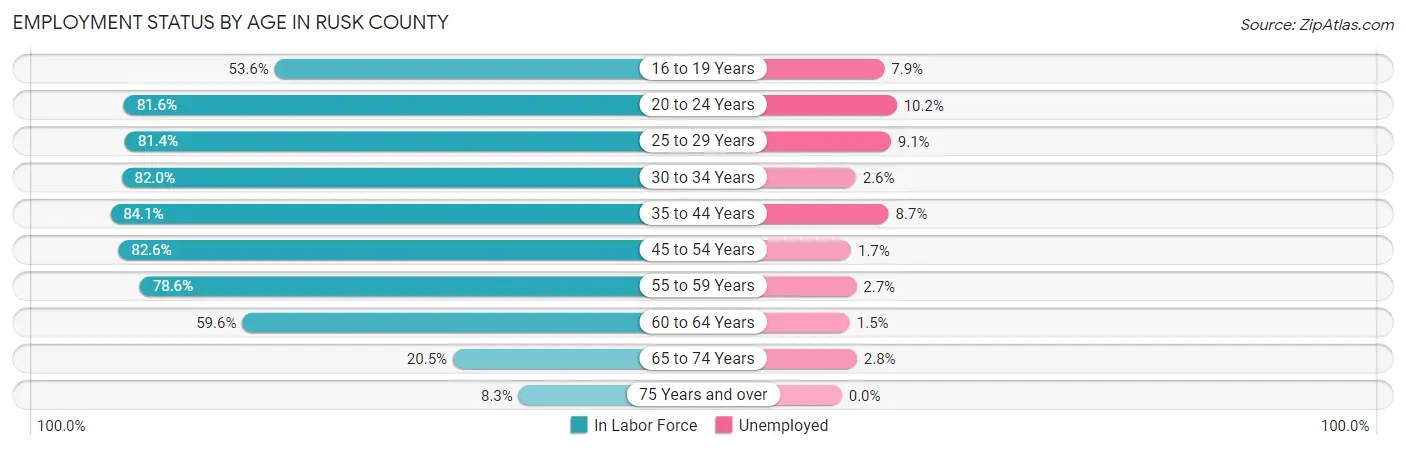
| Age Bracket | In Labor Force | Unemployed |
| 16 to 19 Years | 305 (53.6%) | 24 (7.9%) |
| 20 to 24 Years | 537 (81.6%) | 55 (10.2%) |
| 25 to 29 Years | 529 (81.4%) | 48 (9.1%) |
| 30 to 34 Years | 501 (82.0%) | 13 (2.6%) |
| 35 to 44 Years | 1,199 (84.1%) | 104 (8.7%) |
| 45 to 54 Years | 1,445 (82.6%) | 25 (1.7%) |
| 55 to 59 Years | 803 (78.6%) | 22 (2.7%) |
| 60 to 64 Years | 815 (59.6%) | 12 (1.5%) |
| 65 to 74 Years | 434 (20.5%) | 12 (2.8%) |
| 75 Years and over | 120 (8.3%) | 0 (0.0%) |
| Total | 6,689 (57.6%) | 314 (4.7%) |
Employment Status by Educational Attainment in Rusk County
According to labor force statistics for Rusk County, 77.5% of individuals (5,289) out of the total population between 25 and 64 years of age (6,825) are in the labor force, with 4.2% or 222 of them being unemployed. The group with the highest labor force participation rate are those with the educational attainment of bachelor's degree or higher, with 85.2% or 1,016 individuals in the labor force. Within the labor force, individuals with college / associate degree education have the highest percentage of unemployment, with 4.6% or 92 of them being unemployed.
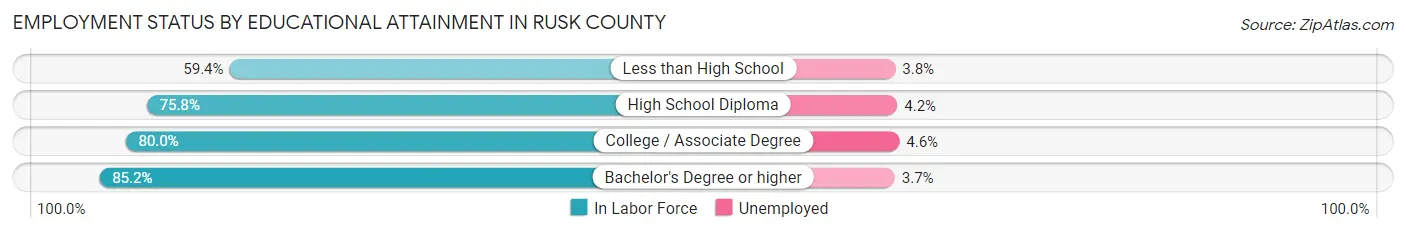
| Educational Attainment | In Labor Force | Unemployed |
| Less than High School | 364 (59.4%) | 23 (3.8%) |
| High School Diploma | 1,908 (75.8%) | 106 (4.2%) |
| College / Associate Degree | 2,002 (80.0%) | 115 (4.6%) |
| Bachelor's Degree or higher | 1,016 (85.2%) | 44 (3.7%) |
| Total | 5,289 (77.5%) | 287 (4.2%) |
Employment Occupations by Sex in Rusk County
Management, Business, Science and Arts Occupations
The most common Management, Business, Science and Arts occupations in Rusk County are Management (559 | 8.8%), Community & Social Service (503 | 7.9%), Education Instruction & Library (343 | 5.4%), Health Diagnosing & Treating (259 | 4.1%), and Computers, Engineering & Science (196 | 3.1%).
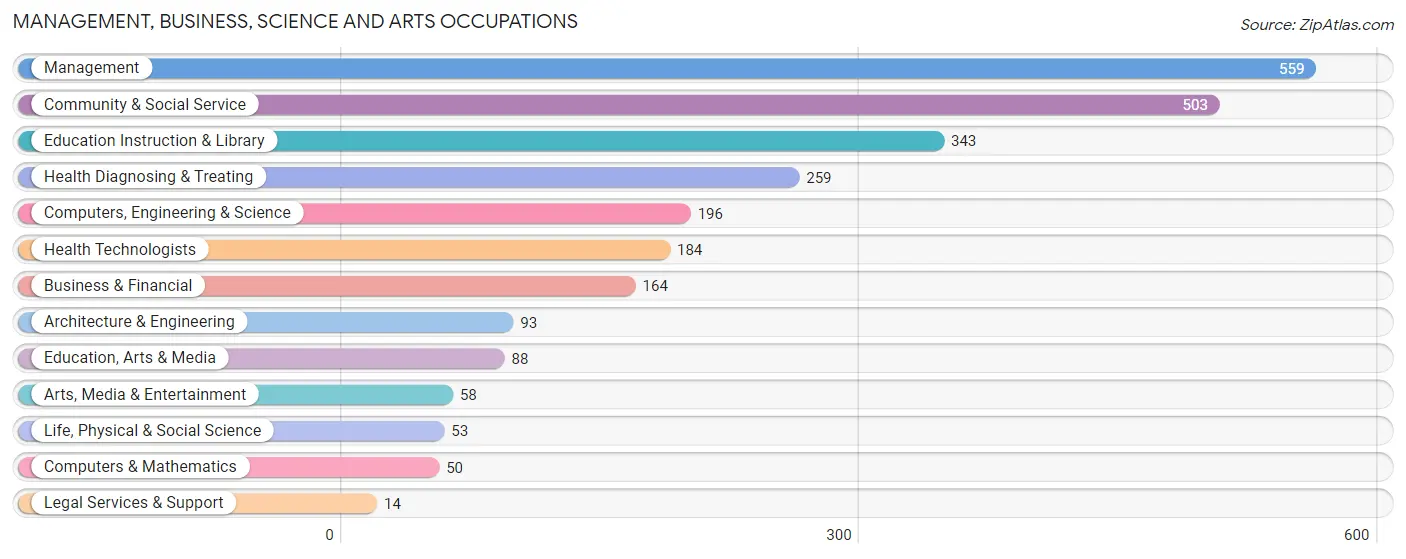
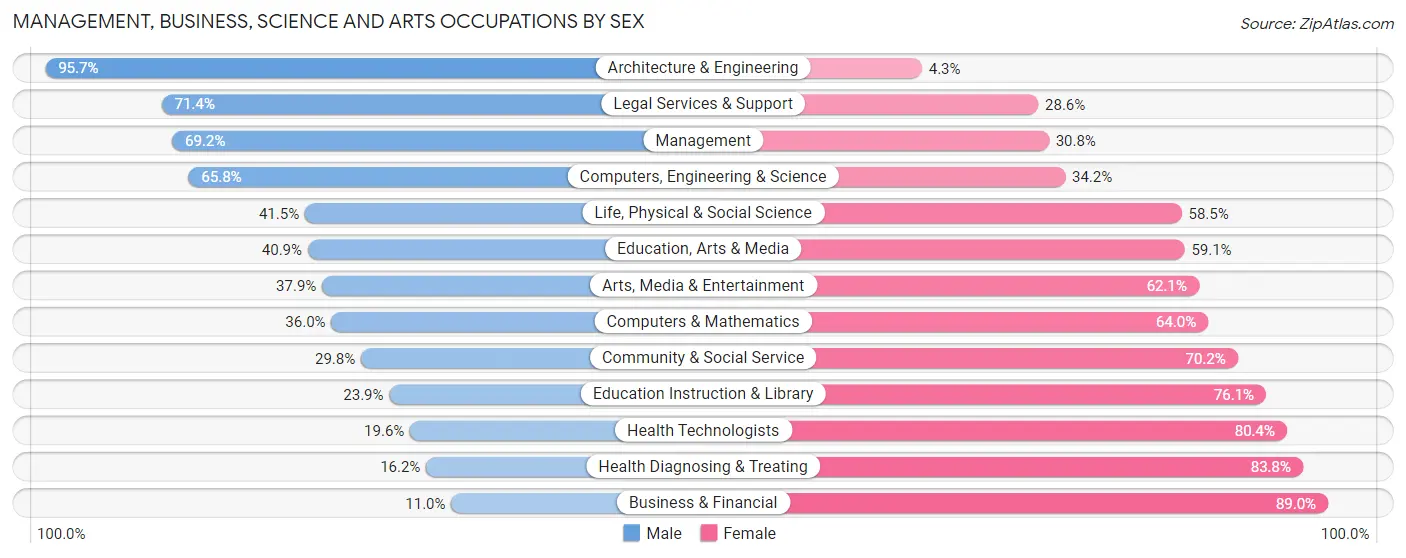
Management, Business, Science and Arts Occupations by Sex
Within the Management, Business, Science and Arts occupations in Rusk County, the most male-oriented occupations are Architecture & Engineering (95.7%), Legal Services & Support (71.4%), and Management (69.2%), while the most female-oriented occupations are Business & Financial (89.0%), Health Diagnosing & Treating (83.8%), and Health Technologists (80.4%).
| Occupation | Male | Female |
| Management | 387 (69.2%) | 172 (30.8%) |
| Business & Financial | 18 (11.0%) | 146 (89.0%) |
| Computers, Engineering & Science | 129 (65.8%) | 67 (34.2%) |
| Computers & Mathematics | 18 (36.0%) | 32 (64.0%) |
| Architecture & Engineering | 89 (95.7%) | 4 (4.3%) |
| Life, Physical & Social Science | 22 (41.5%) | 31 (58.5%) |
| Community & Social Service | 150 (29.8%) | 353 (70.2%) |
| Education, Arts & Media | 36 (40.9%) | 52 (59.1%) |
| Legal Services & Support | 10 (71.4%) | 4 (28.6%) |
| Education Instruction & Library | 82 (23.9%) | 261 (76.1%) |
| Arts, Media & Entertainment | 22 (37.9%) | 36 (62.1%) |
| Health Diagnosing & Treating | 42 (16.2%) | 217 (83.8%) |
| Health Technologists | 36 (19.6%) | 148 (80.4%) |
| Total (Category) | 726 (43.2%) | 955 (56.8%) |
| Total (Overall) | 3,524 (55.3%) | 2,846 (44.7%) |
Services Occupations
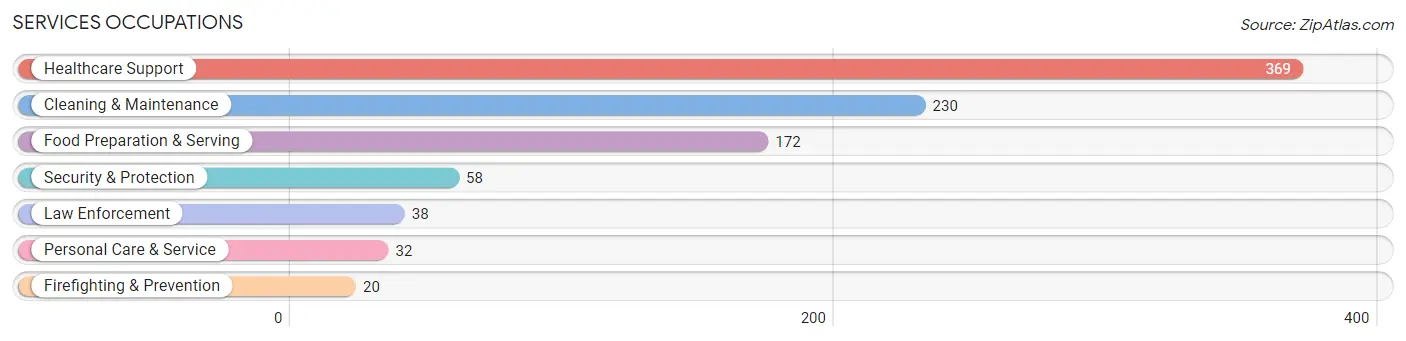
The most common Services occupations in Rusk County are Healthcare Support (369 | 5.8%), Cleaning & Maintenance (230 | 3.6%), Food Preparation & Serving (172 | 2.7%), Security & Protection (58 | 0.9%), and Law Enforcement (38 | 0.6%).
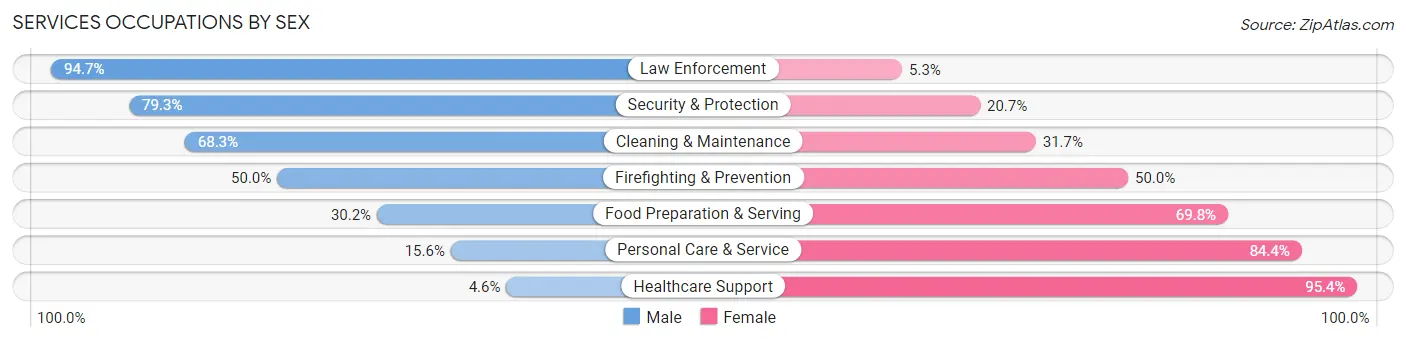
Services Occupations by Sex
Within the Services occupations in Rusk County, the most male-oriented occupations are Law Enforcement (94.7%), Security & Protection (79.3%), and Cleaning & Maintenance (68.3%), while the most female-oriented occupations are Healthcare Support (95.4%), Personal Care & Service (84.4%), and Food Preparation & Serving (69.8%).
| Occupation | Male | Female |
| Healthcare Support | 17 (4.6%) | 352 (95.4%) |
| Security & Protection | 46 (79.3%) | 12 (20.7%) |
| Firefighting & Prevention | 10 (50.0%) | 10 (50.0%) |
| Law Enforcement | 36 (94.7%) | 2 (5.3%) |
| Food Preparation & Serving | 52 (30.2%) | 120 (69.8%) |
| Cleaning & Maintenance | 157 (68.3%) | 73 (31.7%) |
| Personal Care & Service | 5 (15.6%) | 27 (84.4%) |
| Total (Category) | 277 (32.2%) | 584 (67.8%) |
| Total (Overall) | 3,524 (55.3%) | 2,846 (44.7%) |
Sales and Office Occupations
The most common Sales and Office occupations in Rusk County are Office & Administration (621 | 9.8%), and Sales & Related (479 | 7.5%).

Sales and Office Occupations by Sex

| Occupation | Male | Female |
| Sales & Related | 215 (44.9%) | 264 (55.1%) |
| Office & Administration | 100 (16.1%) | 521 (83.9%) |
| Total (Category) | 315 (28.6%) | 785 (71.4%) |
| Total (Overall) | 3,524 (55.3%) | 2,846 (44.7%) |
Natural Resources, Construction and Maintenance Occupations
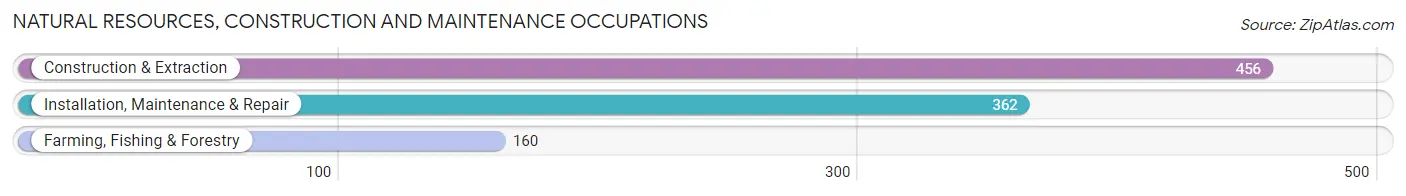
The most common Natural Resources, Construction and Maintenance occupations in Rusk County are Construction & Extraction (456 | 7.2%), Installation, Maintenance & Repair (362 | 5.7%), and Farming, Fishing & Forestry (160 | 2.5%).
Natural Resources, Construction and Maintenance Occupations by Sex
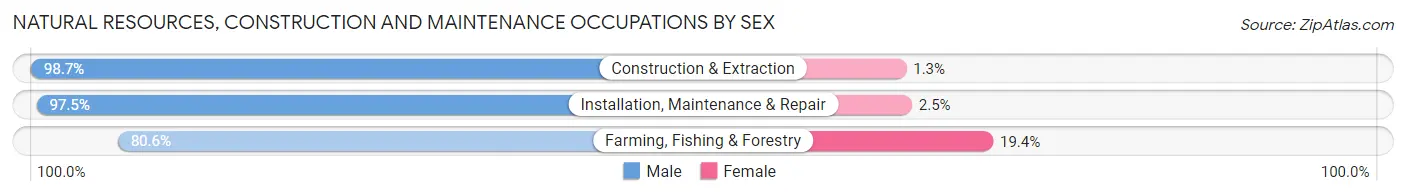
| Occupation | Male | Female |
| Farming, Fishing & Forestry | 129 (80.6%) | 31 (19.4%) |
| Construction & Extraction | 450 (98.7%) | 6 (1.3%) |
| Installation, Maintenance & Repair | 353 (97.5%) | 9 (2.5%) |
| Total (Category) | 932 (95.3%) | 46 (4.7%) |
| Total (Overall) | 3,524 (55.3%) | 2,846 (44.7%) |
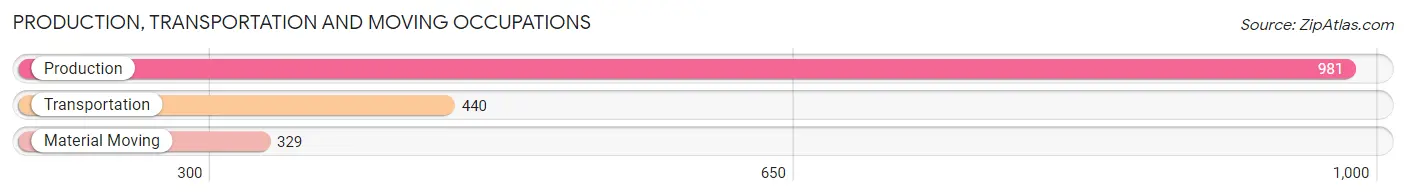
Production, Transportation and Moving Occupations
The most common Production, Transportation and Moving occupations in Rusk County are Production (981 | 15.4%), Transportation (440 | 6.9%), and Material Moving (329 | 5.2%).
Production, Transportation and Moving Occupations by Sex
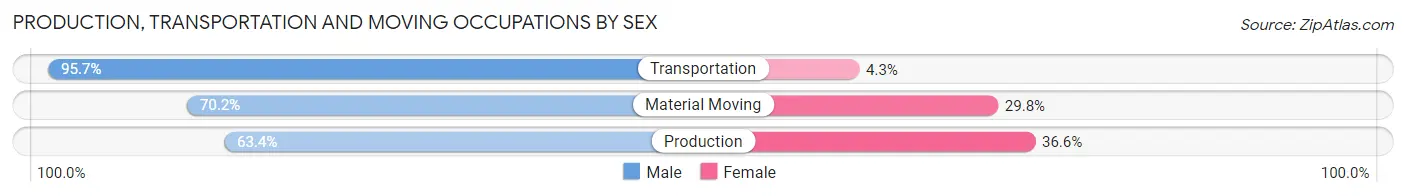
| Occupation | Male | Female |
| Production | 622 (63.4%) | 359 (36.6%) |
| Transportation | 421 (95.7%) | 19 (4.3%) |
| Material Moving | 231 (70.2%) | 98 (29.8%) |
| Total (Category) | 1,274 (72.8%) | 476 (27.2%) |
| Total (Overall) | 3,524 (55.3%) | 2,846 (44.7%) |
Employment Industries by Sex in Rusk County
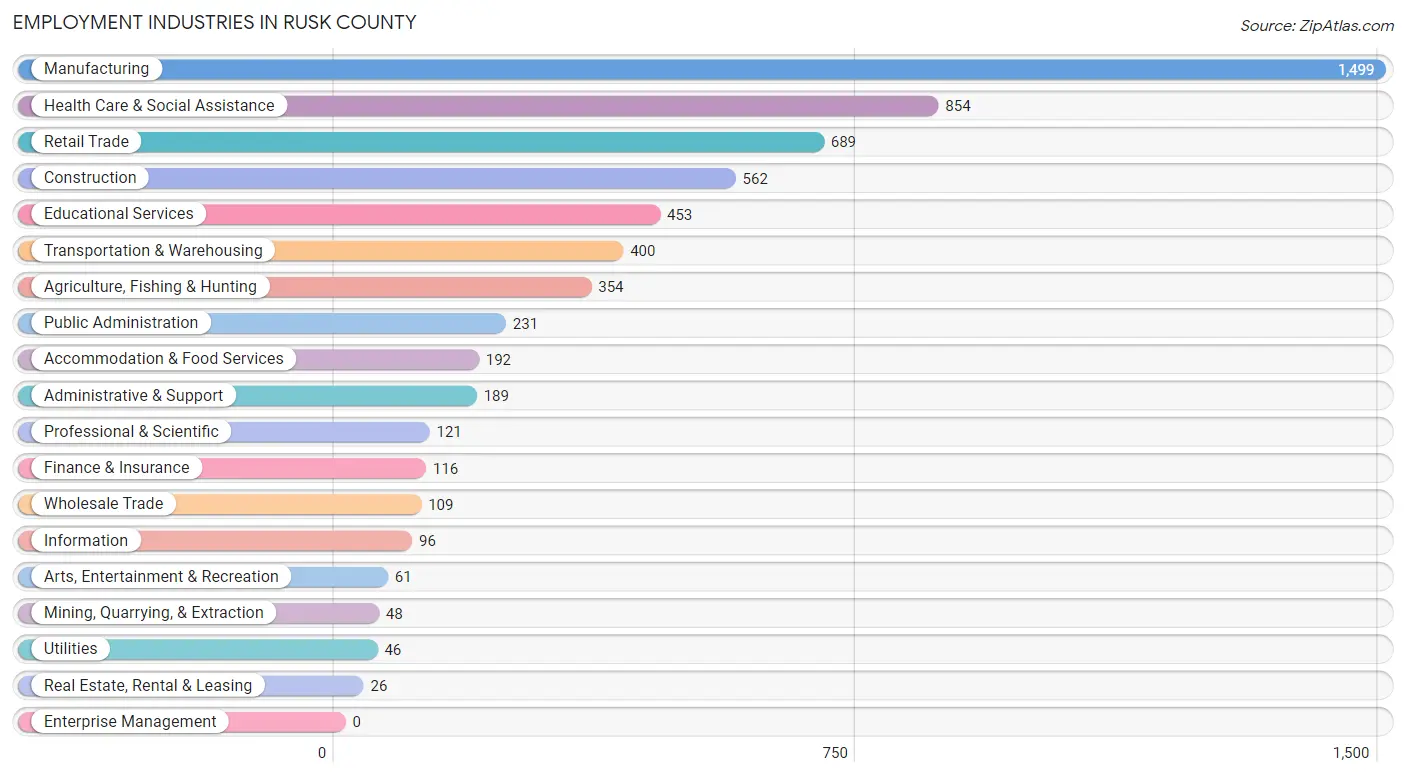
Employment Industries in Rusk County
The major employment industries in Rusk County include Manufacturing (1,499 | 23.5%), Health Care & Social Assistance (854 | 13.4%), Retail Trade (689 | 10.8%), Construction (562 | 8.8%), and Educational Services (453 | 7.1%).
Employment Industries by Sex in Rusk County
The Rusk County industries that see more men than women are Construction (94.7%), Mining, Quarrying, & Extraction (93.8%), and Utilities (84.8%), whereas the industries that tend to have a higher number of women are Health Care & Social Assistance (83.7%), Finance & Insurance (76.7%), and Educational Services (69.1%).
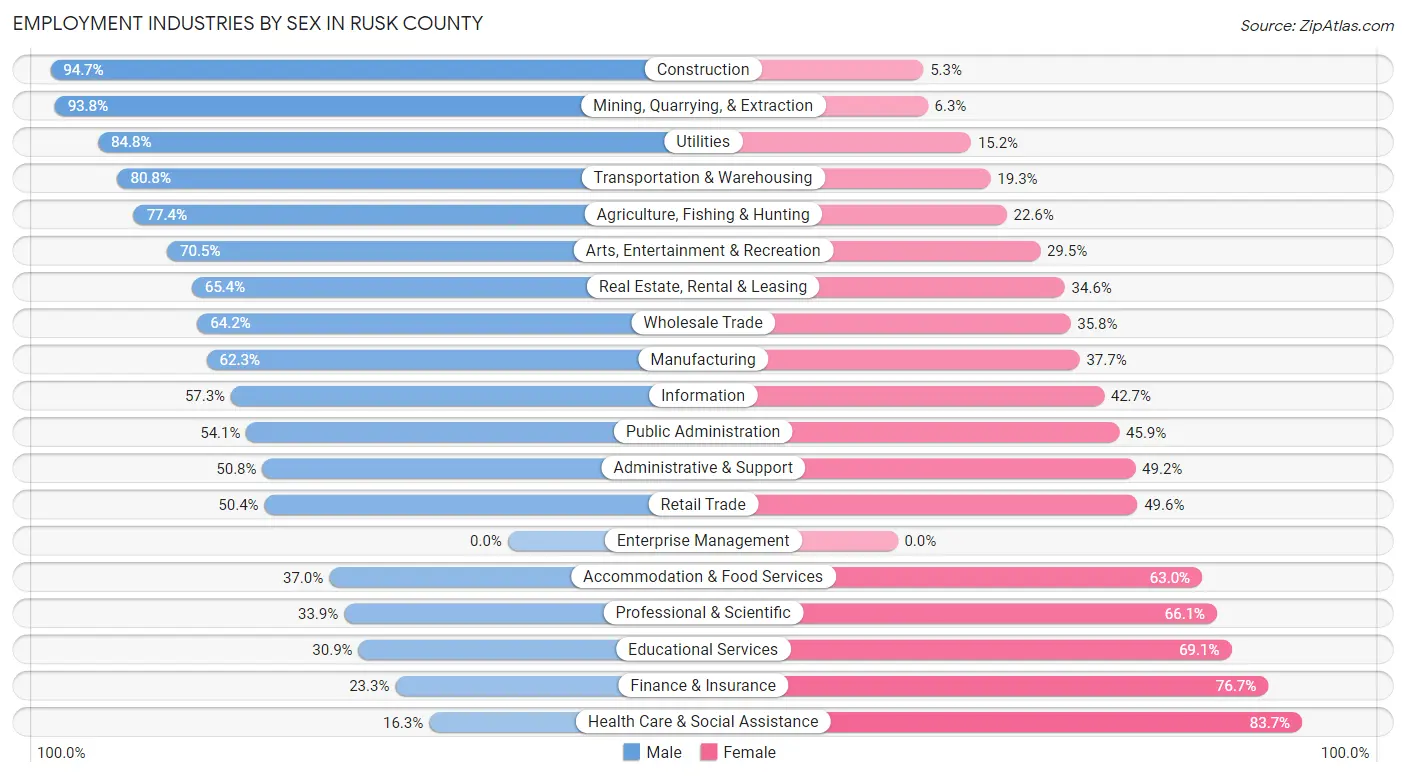
| Industry | Male | Female |
| Agriculture, Fishing & Hunting | 274 (77.4%) | 80 (22.6%) |
| Mining, Quarrying, & Extraction | 45 (93.8%) | 3 (6.2%) |
| Construction | 532 (94.7%) | 30 (5.3%) |
| Manufacturing | 934 (62.3%) | 565 (37.7%) |
| Wholesale Trade | 70 (64.2%) | 39 (35.8%) |
| Retail Trade | 347 (50.4%) | 342 (49.6%) |
| Transportation & Warehousing | 323 (80.7%) | 77 (19.3%) |
| Utilities | 39 (84.8%) | 7 (15.2%) |
| Information | 55 (57.3%) | 41 (42.7%) |
| Finance & Insurance | 27 (23.3%) | 89 (76.7%) |
| Real Estate, Rental & Leasing | 17 (65.4%) | 9 (34.6%) |
| Professional & Scientific | 41 (33.9%) | 80 (66.1%) |
| Enterprise Management | 0 (0.0%) | 0 (0.0%) |
| Administrative & Support | 96 (50.8%) | 93 (49.2%) |
| Educational Services | 140 (30.9%) | 313 (69.1%) |
| Health Care & Social Assistance | 139 (16.3%) | 715 (83.7%) |
| Arts, Entertainment & Recreation | 43 (70.5%) | 18 (29.5%) |
| Accommodation & Food Services | 71 (37.0%) | 121 (63.0%) |
| Public Administration | 125 (54.1%) | 106 (45.9%) |
| Total | 3,524 (55.3%) | 2,846 (44.7%) |
Education in Rusk County
School Enrollment in Rusk County
The most common levels of schooling among the 2,429 students in Rusk County are elementary school (656 | 27.0%), middle school (595 | 24.5%), and high school (591 | 24.3%).

| School Level | # Students | % Students |
| Nursery / Preschool | 107 | 4.4% |
| Kindergarten | 147 | 6.0% |
| Elementary School | 656 | 27.0% |
| Middle School | 595 | 24.5% |
| High School | 591 | 24.3% |
| College / Undergraduate | 270 | 11.1% |
| Graduate / Professional | 63 | 2.6% |
| Total | 2,429 | 100.0% |
School Enrollment by Age by Funding Source in Rusk County
Out of a total of 2,429 students who are enrolled in schools in Rusk County, 406 (16.7%) attend a private institution, while the remaining 2,023 (83.3%) are enrolled in public schools. The age group of 35 years and over has the highest likelihood of being enrolled in private schools, with 33 (35.1% in the age bracket) enrolled. Conversely, the age group of 20 to 24 year olds has the lowest likelihood of being enrolled in a private school, with 96 (98.0% in the age bracket) attending a public institution.
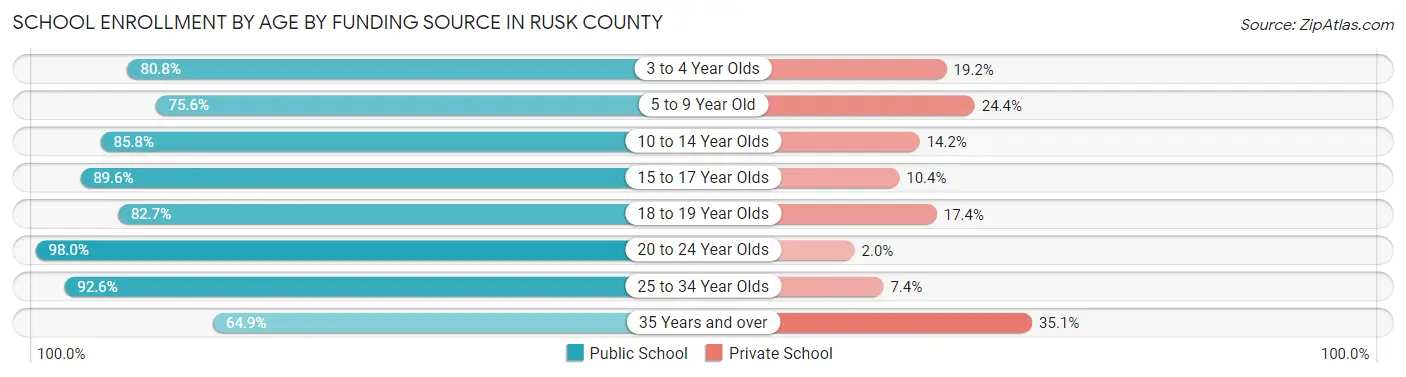
| Age Bracket | Public School | Private School |
| 3 to 4 Year Olds | 59 (80.8%) | 14 (19.2%) |
| 5 to 9 Year Old | 523 (75.6%) | 169 (24.4%) |
| 10 to 14 Year Olds | 679 (85.8%) | 112 (14.2%) |
| 15 to 17 Year Olds | 450 (89.6%) | 52 (10.4%) |
| 18 to 19 Year Olds | 81 (82.7%) | 17 (17.3%) |
| 20 to 24 Year Olds | 96 (98.0%) | 2 (2.0%) |
| 25 to 34 Year Olds | 75 (92.6%) | 6 (7.4%) |
| 35 Years and over | 61 (64.9%) | 33 (35.1%) |
| Total | 2,023 (83.3%) | 406 (16.7%) |
Educational Attainment by Field of Study in Rusk County
Education (513 | 26.2%), business (279 | 14.2%), bio, nature & agricultural (205 | 10.4%), science & technology (203 | 10.3%), and arts & humanities (127 | 6.5%) are the most common fields of study among 1,962 individuals in Rusk County who have obtained a bachelor's degree or higher.
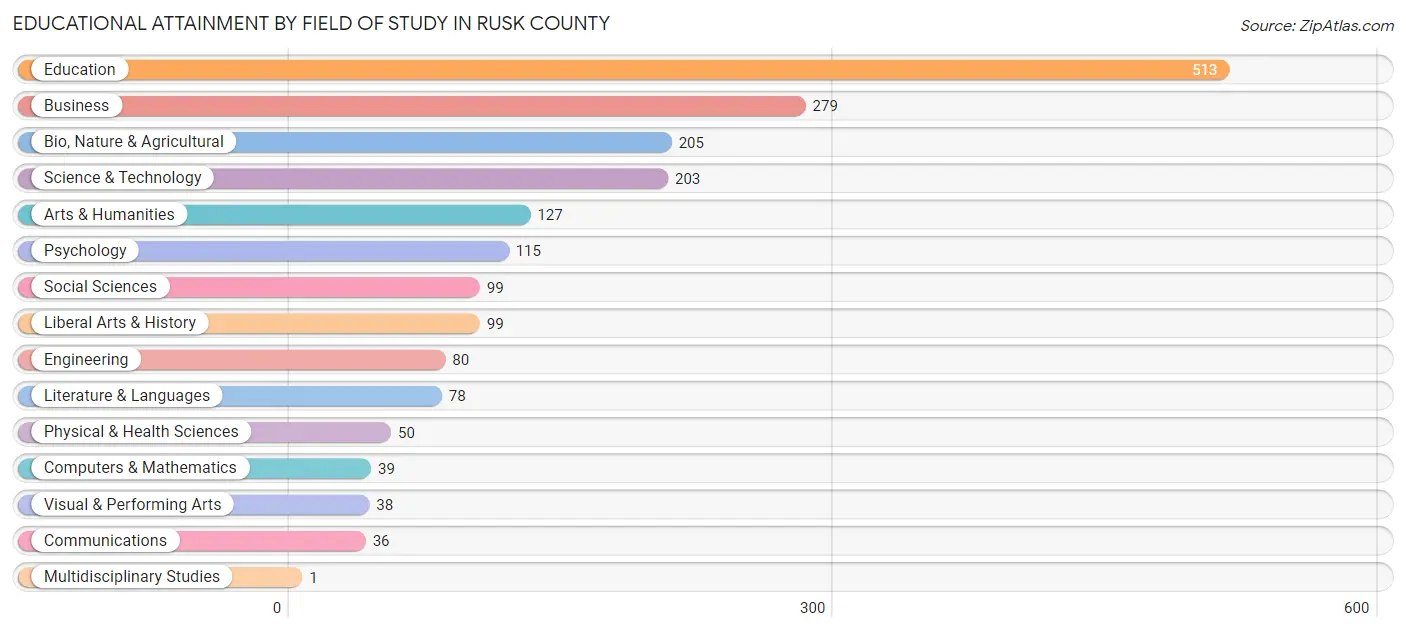
| Field of Study | # Graduates | % Graduates |
| Computers & Mathematics | 39 | 2.0% |
| Bio, Nature & Agricultural | 205 | 10.4% |
| Physical & Health Sciences | 50 | 2.5% |
| Psychology | 115 | 5.9% |
| Social Sciences | 99 | 5.1% |
| Engineering | 80 | 4.1% |
| Multidisciplinary Studies | 1 | 0.1% |
| Science & Technology | 203 | 10.3% |
| Business | 279 | 14.2% |
| Education | 513 | 26.2% |
| Literature & Languages | 78 | 4.0% |
| Liberal Arts & History | 99 | 5.1% |
| Visual & Performing Arts | 38 | 1.9% |
| Communications | 36 | 1.8% |
| Arts & Humanities | 127 | 6.5% |
| Total | 1,962 | 100.0% |
Transportation & Commute in Rusk County
Vehicle Availability by Sex in Rusk County
The most prevalent vehicle ownership categories in Rusk County are males with 2 vehicles (1,343, accounting for 39.2%) and females with 2 vehicles (1,039, making up 50.2%).
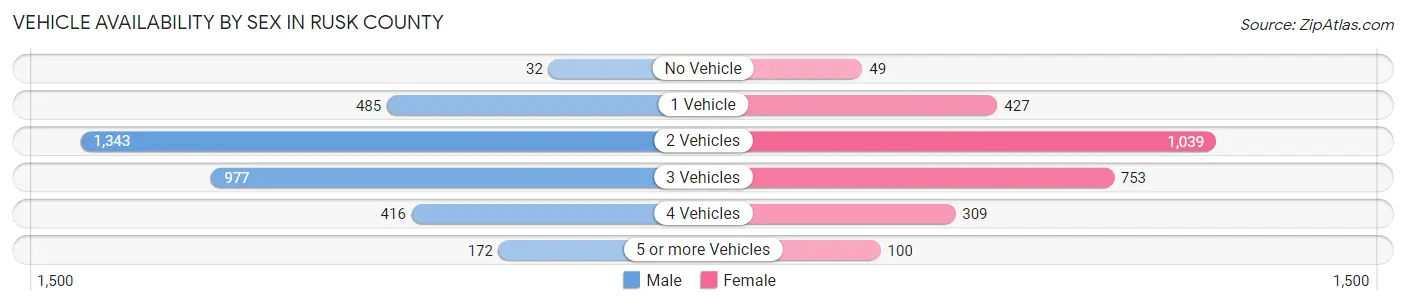
| Vehicles Available | Male | Female |
| No Vehicle | 32 (0.9%) | 49 (1.8%) |
| 1 Vehicle | 485 (14.2%) | 427 (16.0%) |
| 2 Vehicles | 1,343 (39.2%) | 1,039 (38.8%) |
| 3 Vehicles | 977 (28.5%) | 753 (28.1%) |
| 4 Vehicles | 416 (12.1%) | 309 (11.5%) |
| 5 or more Vehicles | 172 (5.0%) | 100 (3.7%) |
| Total | 3,425 (100.0%) | 2,677 (100.0%) |
Commute Time in Rusk County
The most frequently occuring commute durations in Rusk County are 5 to 9 minutes (997 commuters, 17.8%), 15 to 19 minutes (742 commuters, 13.3%), and 10 to 14 minutes (716 commuters, 12.8%).
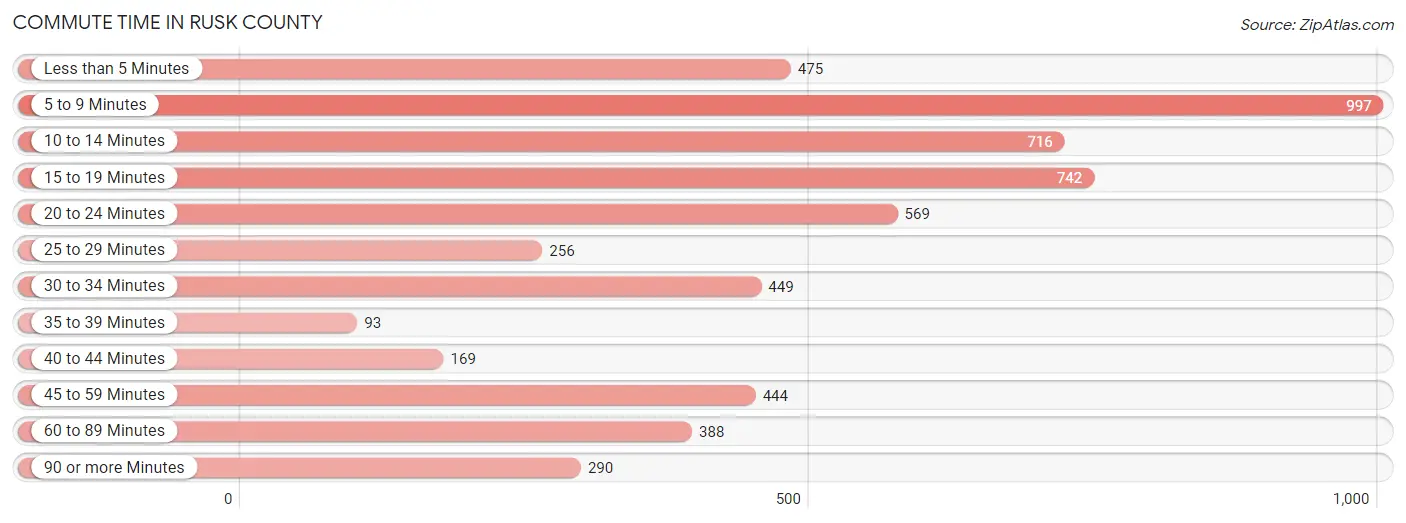
| Commute Time | # Commuters | % Commuters |
| Less than 5 Minutes | 475 | 8.5% |
| 5 to 9 Minutes | 997 | 17.8% |
| 10 to 14 Minutes | 716 | 12.8% |
| 15 to 19 Minutes | 742 | 13.3% |
| 20 to 24 Minutes | 569 | 10.2% |
| 25 to 29 Minutes | 256 | 4.6% |
| 30 to 34 Minutes | 449 | 8.0% |
| 35 to 39 Minutes | 93 | 1.7% |
| 40 to 44 Minutes | 169 | 3.0% |
| 45 to 59 Minutes | 444 | 8.0% |
| 60 to 89 Minutes | 388 | 6.9% |
| 90 or more Minutes | 290 | 5.2% |
Commute Time by Sex in Rusk County
The most common commute times in Rusk County are 5 to 9 minutes (450 commuters, 14.3%) for males and 5 to 9 minutes (547 commuters, 22.4%) for females.
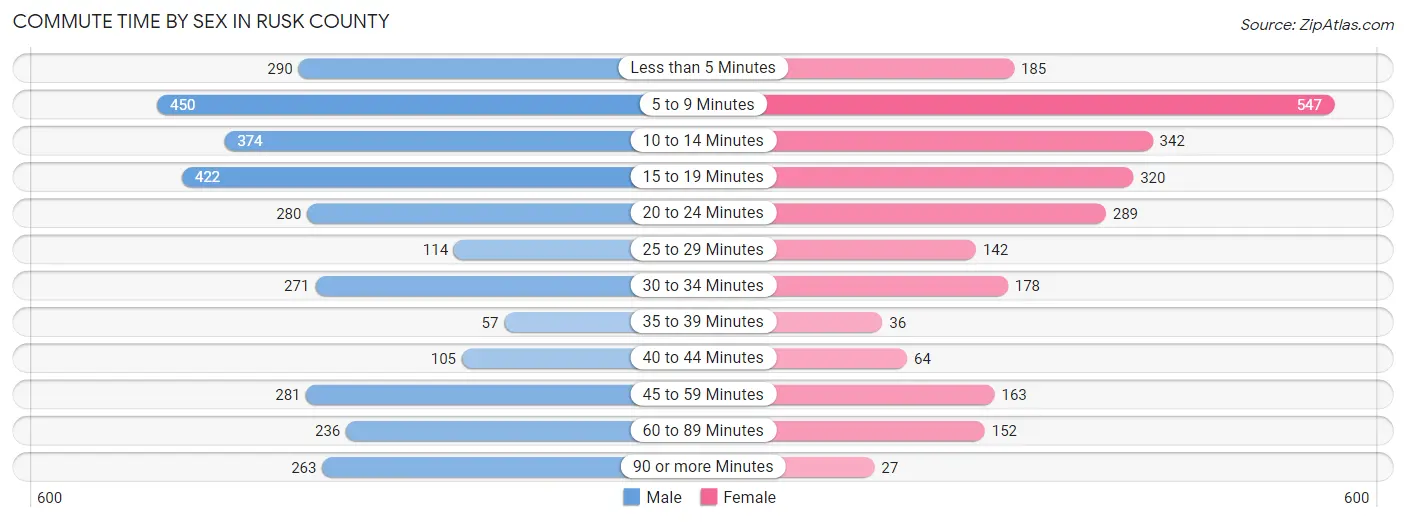
| Commute Time | Male | Female |
| Less than 5 Minutes | 290 (9.2%) | 185 (7.6%) |
| 5 to 9 Minutes | 450 (14.3%) | 547 (22.4%) |
| 10 to 14 Minutes | 374 (11.9%) | 342 (14.0%) |
| 15 to 19 Minutes | 422 (13.4%) | 320 (13.1%) |
| 20 to 24 Minutes | 280 (8.9%) | 289 (11.8%) |
| 25 to 29 Minutes | 114 (3.6%) | 142 (5.8%) |
| 30 to 34 Minutes | 271 (8.6%) | 178 (7.3%) |
| 35 to 39 Minutes | 57 (1.8%) | 36 (1.5%) |
| 40 to 44 Minutes | 105 (3.3%) | 64 (2.6%) |
| 45 to 59 Minutes | 281 (8.9%) | 163 (6.7%) |
| 60 to 89 Minutes | 236 (7.5%) | 152 (6.2%) |
| 90 or more Minutes | 263 (8.4%) | 27 (1.1%) |
Time of Departure to Work by Sex in Rusk County
The most frequent times of departure to work in Rusk County are 6:30 AM to 6:59 AM (427, 13.6%) for males and 7:30 AM to 7:59 AM (309, 12.6%) for females.
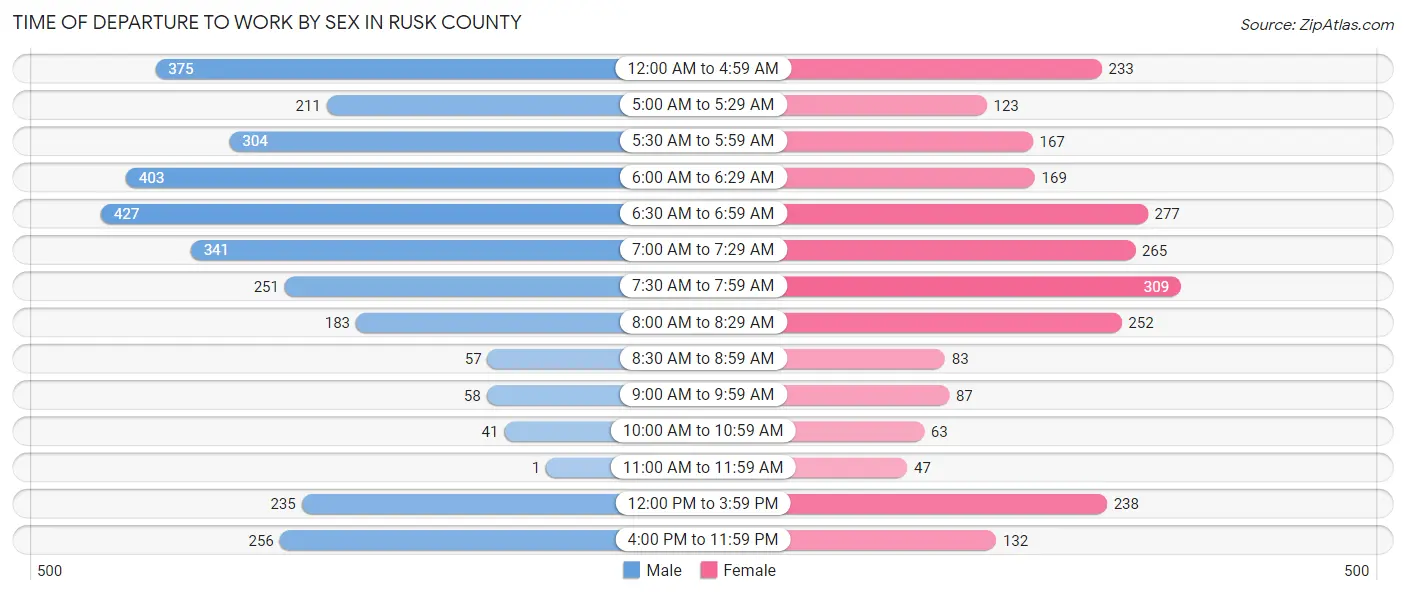
| Time of Departure | Male | Female |
| 12:00 AM to 4:59 AM | 375 (11.9%) | 233 (9.5%) |
| 5:00 AM to 5:29 AM | 211 (6.7%) | 123 (5.0%) |
| 5:30 AM to 5:59 AM | 304 (9.7%) | 167 (6.8%) |
| 6:00 AM to 6:29 AM | 403 (12.8%) | 169 (6.9%) |
| 6:30 AM to 6:59 AM | 427 (13.6%) | 277 (11.3%) |
| 7:00 AM to 7:29 AM | 341 (10.8%) | 265 (10.8%) |
| 7:30 AM to 7:59 AM | 251 (8.0%) | 309 (12.6%) |
| 8:00 AM to 8:29 AM | 183 (5.8%) | 252 (10.3%) |
| 8:30 AM to 8:59 AM | 57 (1.8%) | 83 (3.4%) |
| 9:00 AM to 9:59 AM | 58 (1.8%) | 87 (3.6%) |
| 10:00 AM to 10:59 AM | 41 (1.3%) | 63 (2.6%) |
| 11:00 AM to 11:59 AM | 1 (0.0%) | 47 (1.9%) |
| 12:00 PM to 3:59 PM | 235 (7.5%) | 238 (9.7%) |
| 4:00 PM to 11:59 PM | 256 (8.2%) | 132 (5.4%) |
| Total | 3,143 (100.0%) | 2,445 (100.0%) |
Housing Occupancy in Rusk County
Occupancy by Ownership in Rusk County
Of the total 6,190 dwellings in Rusk County, owner-occupied units account for 4,884 (78.9%), while renter-occupied units make up 1,306 (21.1%).
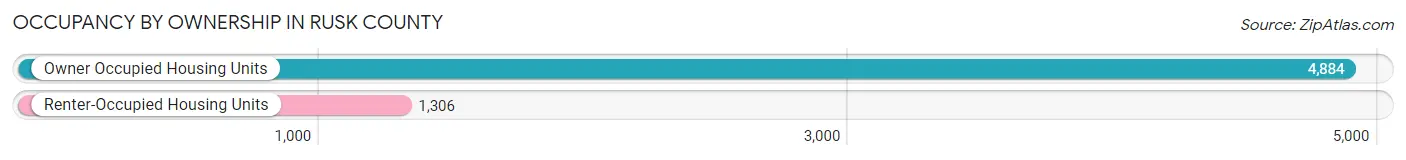
| Occupancy | # Housing Units | % Housing Units |
| Owner Occupied Housing Units | 4,884 | 78.9% |
| Renter-Occupied Housing Units | 1,306 | 21.1% |
| Total Occupied Housing Units | 6,190 | 100.0% |
Occupancy by Household Size in Rusk County
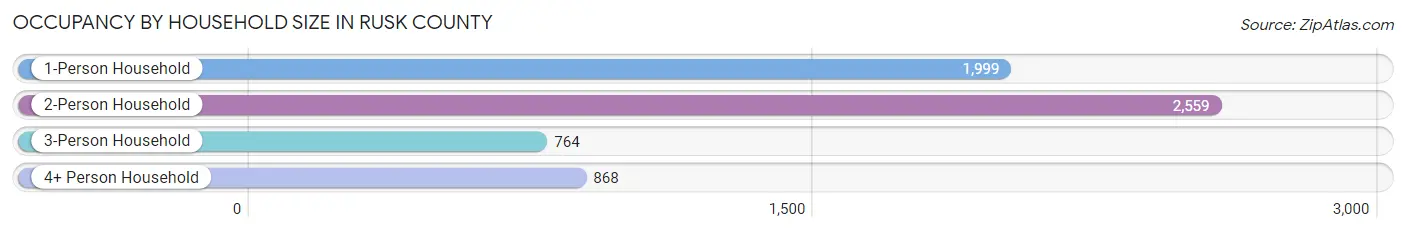
| Household Size | # Housing Units | % Housing Units |
| 1-Person Household | 1,999 | 32.3% |
| 2-Person Household | 2,559 | 41.3% |
| 3-Person Household | 764 | 12.3% |
| 4+ Person Household | 868 | 14.0% |
| Total Housing Units | 6,190 | 100.0% |
Occupancy by Ownership by Household Size in Rusk County
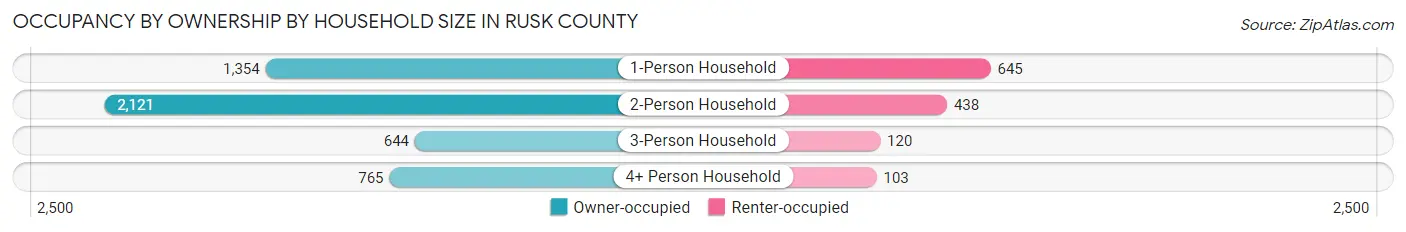
| Household Size | Owner-occupied | Renter-occupied |
| 1-Person Household | 1,354 (67.7%) | 645 (32.3%) |
| 2-Person Household | 2,121 (82.9%) | 438 (17.1%) |
| 3-Person Household | 644 (84.3%) | 120 (15.7%) |
| 4+ Person Household | 765 (88.1%) | 103 (11.9%) |
| Total Housing Units | 4,884 (78.9%) | 1,306 (21.1%) |
Occupancy by Educational Attainment in Rusk County
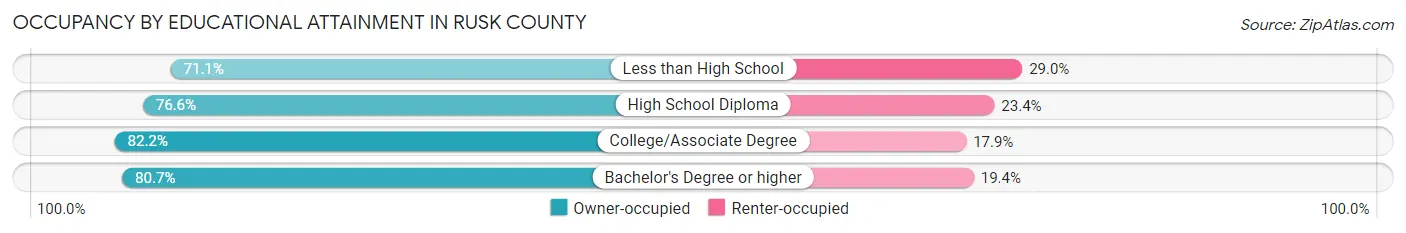
| Household Size | Owner-occupied | Renter-occupied |
| Less than High School | 292 (71.1%) | 119 (28.9%) |
| High School Diploma | 1,891 (76.6%) | 579 (23.4%) |
| College/Associate Degree | 1,776 (82.2%) | 386 (17.8%) |
| Bachelor's Degree or higher | 925 (80.6%) | 222 (19.4%) |
Occupancy by Age of Householder in Rusk County
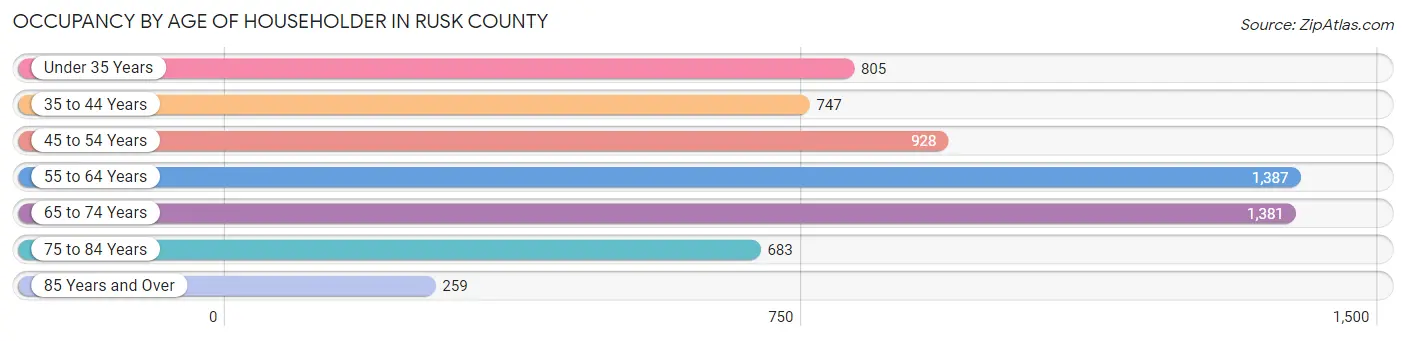
| Age Bracket | # Households | % Households |
| Under 35 Years | 805 | 13.0% |
| 35 to 44 Years | 747 | 12.1% |
| 45 to 54 Years | 928 | 15.0% |
| 55 to 64 Years | 1,387 | 22.4% |
| 65 to 74 Years | 1,381 | 22.3% |
| 75 to 84 Years | 683 | 11.0% |
| 85 Years and Over | 259 | 4.2% |
| Total | 6,190 | 100.0% |
Housing Finances in Rusk County
Median Income by Occupancy in Rusk County
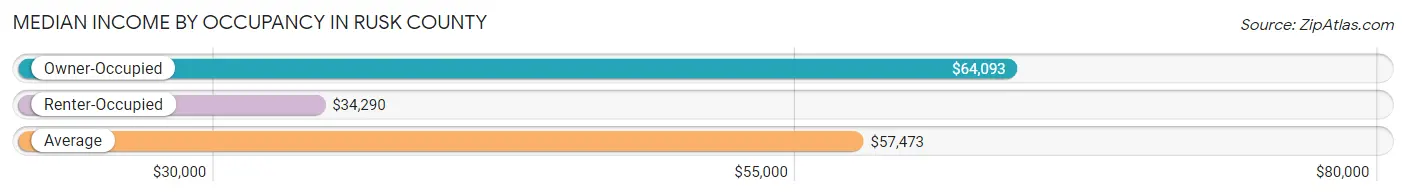
| Occupancy Type | # Households | Median Income |
| Owner-Occupied | 4,884 (78.9%) | $64,093 |
| Renter-Occupied | 1,306 (21.1%) | $34,290 |
| Average | 6,190 (100.0%) | $57,473 |
Occupancy by Householder Income Bracket in Rusk County
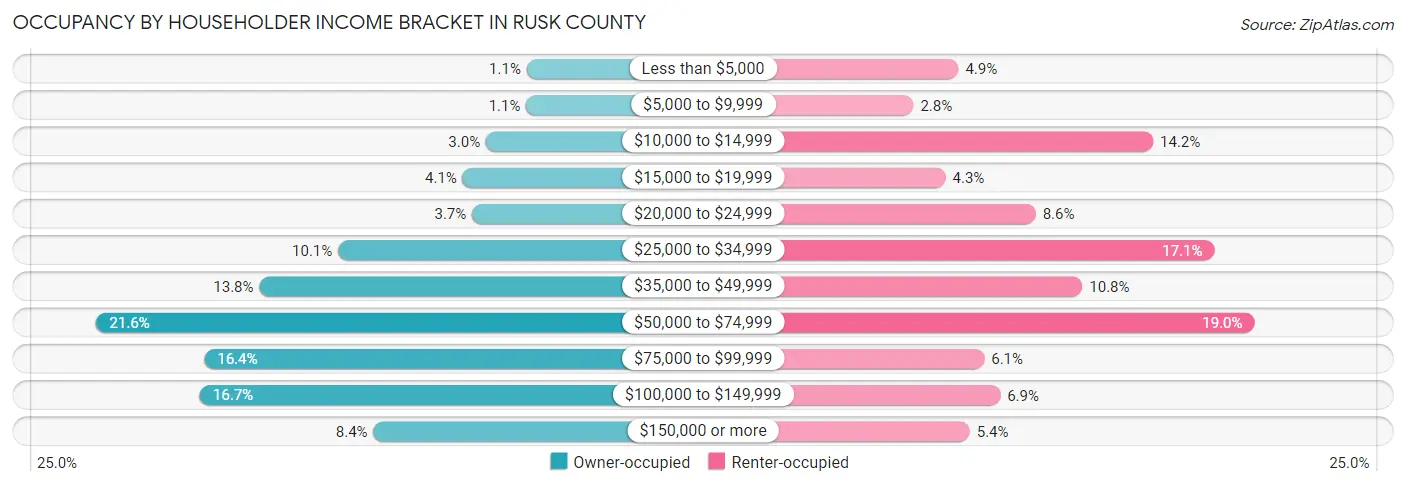
| Income Bracket | Owner-occupied | Renter-occupied |
| Less than $5,000 | 53 (1.1%) | 64 (4.9%) |
| $5,000 to $9,999 | 54 (1.1%) | 36 (2.8%) |
| $10,000 to $14,999 | 148 (3.0%) | 185 (14.2%) |
| $15,000 to $19,999 | 202 (4.1%) | 56 (4.3%) |
| $20,000 to $24,999 | 180 (3.7%) | 112 (8.6%) |
| $25,000 to $34,999 | 492 (10.1%) | 223 (17.1%) |
| $35,000 to $49,999 | 675 (13.8%) | 141 (10.8%) |
| $50,000 to $74,999 | 1,054 (21.6%) | 248 (19.0%) |
| $75,000 to $99,999 | 803 (16.4%) | 80 (6.1%) |
| $100,000 to $149,999 | 813 (16.7%) | 90 (6.9%) |
| $150,000 or more | 410 (8.4%) | 71 (5.4%) |
| Total | 4,884 (100.0%) | 1,306 (100.0%) |
Monthly Housing Cost Tiers in Rusk County
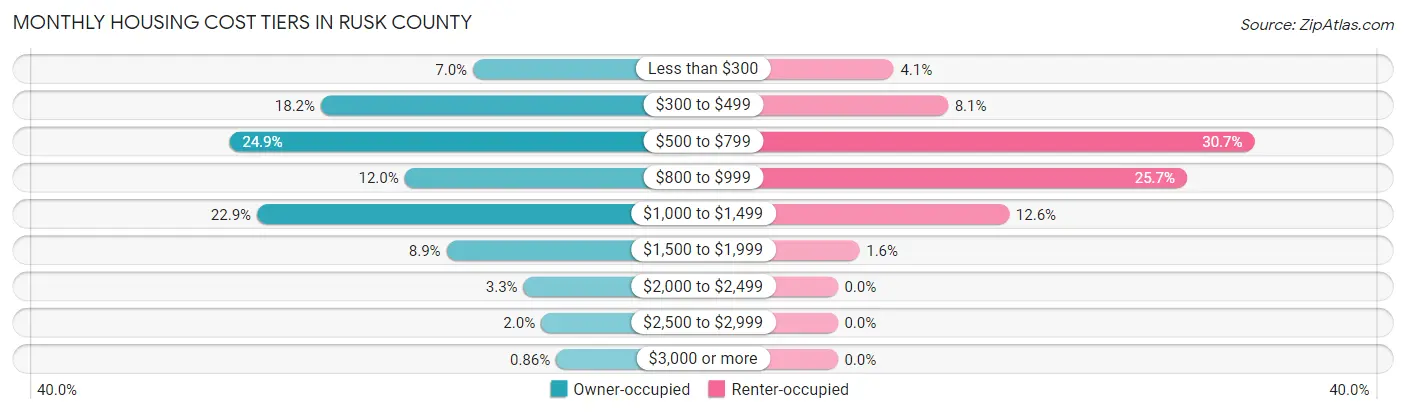
| Monthly Cost | Owner-occupied | Renter-occupied |
| Less than $300 | 341 (7.0%) | 54 (4.1%) |
| $300 to $499 | 888 (18.2%) | 106 (8.1%) |
| $500 to $799 | 1,217 (24.9%) | 401 (30.7%) |
| $800 to $999 | 587 (12.0%) | 336 (25.7%) |
| $1,000 to $1,499 | 1,118 (22.9%) | 165 (12.6%) |
| $1,500 to $1,999 | 436 (8.9%) | 21 (1.6%) |
| $2,000 to $2,499 | 159 (3.3%) | 0 (0.0%) |
| $2,500 to $2,999 | 96 (2.0%) | 0 (0.0%) |
| $3,000 or more | 42 (0.9%) | 0 (0.0%) |
| Total | 4,884 (100.0%) | 1,306 (100.0%) |
Physical Housing Characteristics in Rusk County
Housing Structures in Rusk County
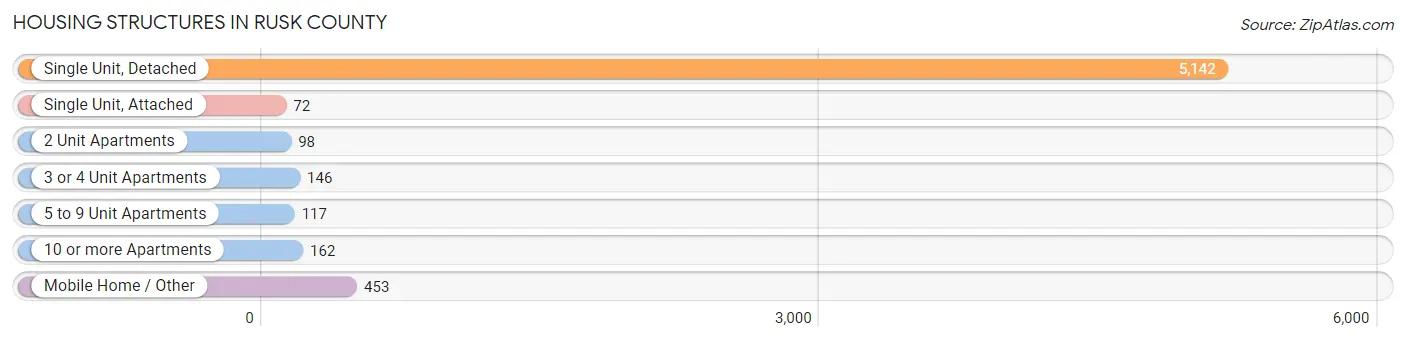
| Structure Type | # Housing Units | % Housing Units |
| Single Unit, Detached | 5,142 | 83.1% |
| Single Unit, Attached | 72 | 1.2% |
| 2 Unit Apartments | 98 | 1.6% |
| 3 or 4 Unit Apartments | 146 | 2.4% |
| 5 to 9 Unit Apartments | 117 | 1.9% |
| 10 or more Apartments | 162 | 2.6% |
| Mobile Home / Other | 453 | 7.3% |
| Total | 6,190 | 100.0% |
Housing Structures by Occupancy in Rusk County
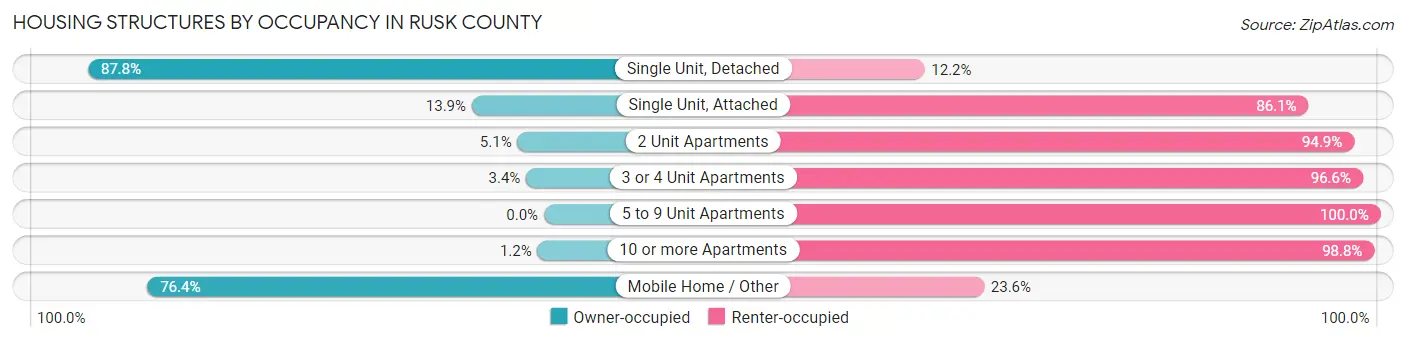
| Structure Type | Owner-occupied | Renter-occupied |
| Single Unit, Detached | 4,516 (87.8%) | 626 (12.2%) |
| Single Unit, Attached | 10 (13.9%) | 62 (86.1%) |
| 2 Unit Apartments | 5 (5.1%) | 93 (94.9%) |
| 3 or 4 Unit Apartments | 5 (3.4%) | 141 (96.6%) |
| 5 to 9 Unit Apartments | 0 (0.0%) | 117 (100.0%) |
| 10 or more Apartments | 2 (1.2%) | 160 (98.8%) |
| Mobile Home / Other | 346 (76.4%) | 107 (23.6%) |
| Total | 4,884 (78.9%) | 1,306 (21.1%) |
Housing Structures by Number of Rooms in Rusk County
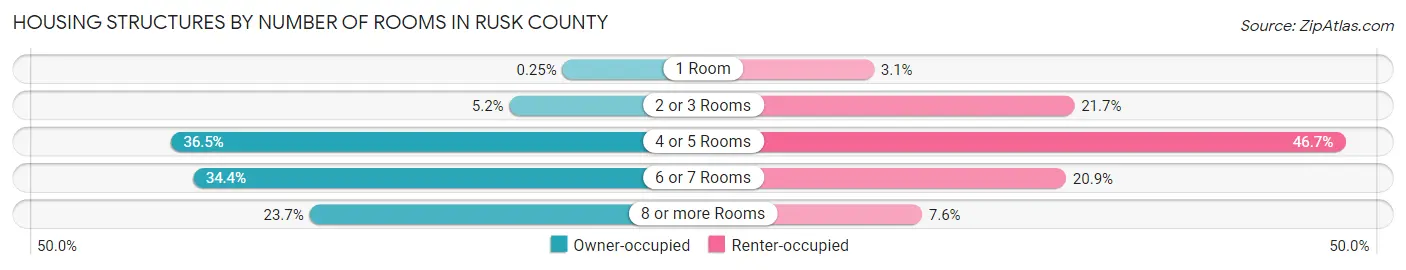
| Number of Rooms | Owner-occupied | Renter-occupied |
| 1 Room | 12 (0.3%) | 41 (3.1%) |
| 2 or 3 Rooms | 252 (5.2%) | 283 (21.7%) |
| 4 or 5 Rooms | 1,783 (36.5%) | 610 (46.7%) |
| 6 or 7 Rooms | 1,682 (34.4%) | 273 (20.9%) |
| 8 or more Rooms | 1,155 (23.6%) | 99 (7.6%) |
| Total | 4,884 (100.0%) | 1,306 (100.0%) |
Housing Structure by Heating Type in Rusk County
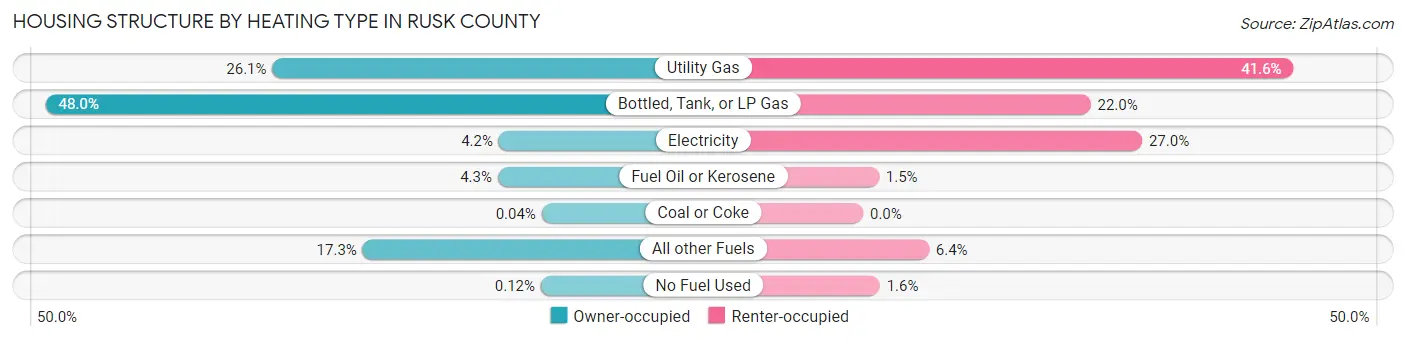
| Heating Type | Owner-occupied | Renter-occupied |
| Utility Gas | 1,273 (26.1%) | 543 (41.6%) |
| Bottled, Tank, or LP Gas | 2,343 (48.0%) | 287 (22.0%) |
| Electricity | 204 (4.2%) | 352 (27.0%) |
| Fuel Oil or Kerosene | 209 (4.3%) | 20 (1.5%) |
| Coal or Coke | 2 (0.0%) | 0 (0.0%) |
| All other Fuels | 847 (17.3%) | 83 (6.4%) |
| No Fuel Used | 6 (0.1%) | 21 (1.6%) |
| Total | 4,884 (100.0%) | 1,306 (100.0%) |
Household Vehicle Usage in Rusk County
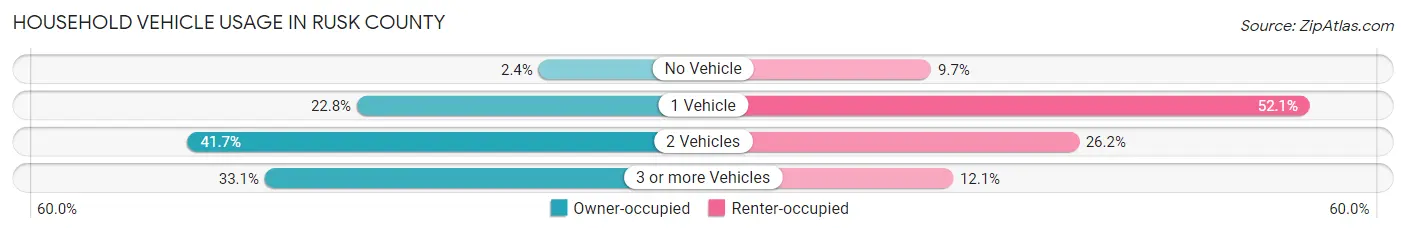
| Vehicles per Household | Owner-occupied | Renter-occupied |
| No Vehicle | 118 (2.4%) | 126 (9.7%) |
| 1 Vehicle | 1,112 (22.8%) | 680 (52.1%) |
| 2 Vehicles | 2,038 (41.7%) | 342 (26.2%) |
| 3 or more Vehicles | 1,616 (33.1%) | 158 (12.1%) |
| Total | 4,884 (100.0%) | 1,306 (100.0%) |
Real Estate & Mortgages in Rusk County
Real Estate and Mortgage Overview in Rusk County
| Characteristic | Without Mortgage | With Mortgage |
| Housing Units | 2,311 | 2,573 |
| Median Property Value | $130,200 | $152,400 |
| Median Household Income | $53,686 | $250 |
| Monthly Housing Costs | $492 | $40 |
| Real Estate Taxes | $1,730 | $13 |
Property Value by Mortgage Status in Rusk County
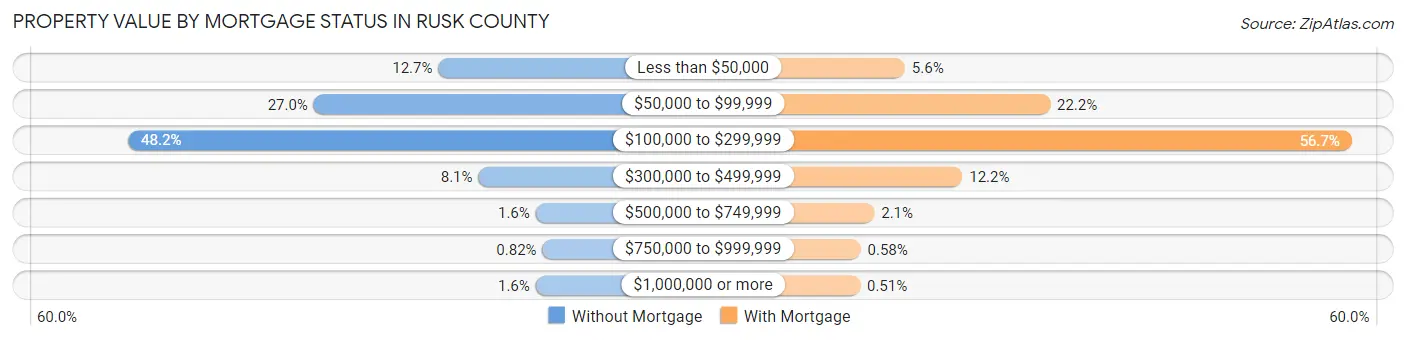
| Property Value | Without Mortgage | With Mortgage |
| Less than $50,000 | 294 (12.7%) | 145 (5.6%) |
| $50,000 to $99,999 | 623 (27.0%) | 572 (22.2%) |
| $100,000 to $299,999 | 1,113 (48.2%) | 1,459 (56.7%) |
| $300,000 to $499,999 | 188 (8.1%) | 314 (12.2%) |
| $500,000 to $749,999 | 37 (1.6%) | 55 (2.1%) |
| $750,000 to $999,999 | 19 (0.8%) | 15 (0.6%) |
| $1,000,000 or more | 37 (1.6%) | 13 (0.5%) |
| Total | 2,311 (100.0%) | 2,573 (100.0%) |
Household Income by Mortgage Status in Rusk County
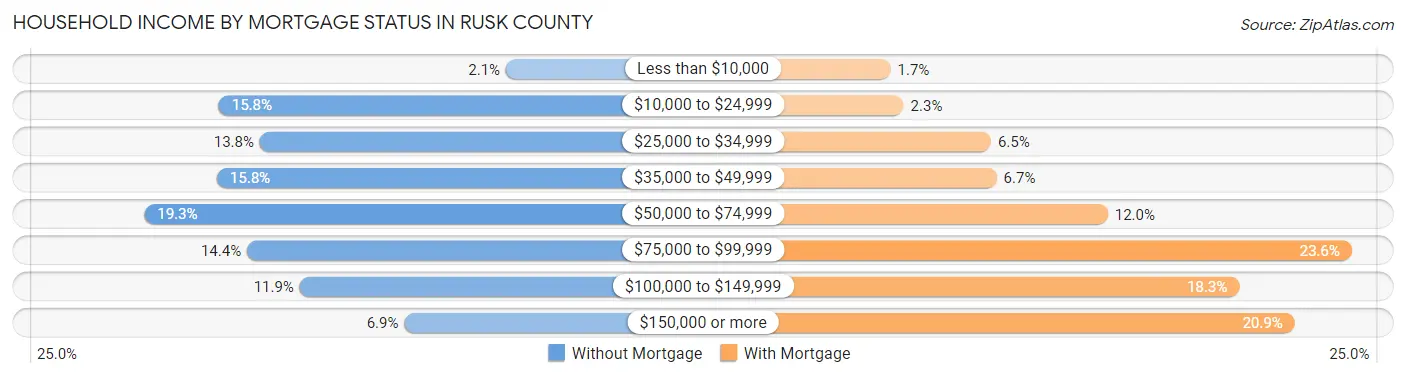
| Household Income | Without Mortgage | With Mortgage |
| Less than $10,000 | 48 (2.1%) | 43 (1.7%) |
| $10,000 to $24,999 | 364 (15.8%) | 59 (2.3%) |
| $25,000 to $34,999 | 319 (13.8%) | 166 (6.5%) |
| $35,000 to $49,999 | 366 (15.8%) | 173 (6.7%) |
| $50,000 to $74,999 | 446 (19.3%) | 309 (12.0%) |
| $75,000 to $99,999 | 333 (14.4%) | 608 (23.6%) |
| $100,000 to $149,999 | 275 (11.9%) | 470 (18.3%) |
| $150,000 or more | 160 (6.9%) | 538 (20.9%) |
| Total | 2,311 (100.0%) | 2,573 (100.0%) |
Property Value to Household Income Ratio in Rusk County
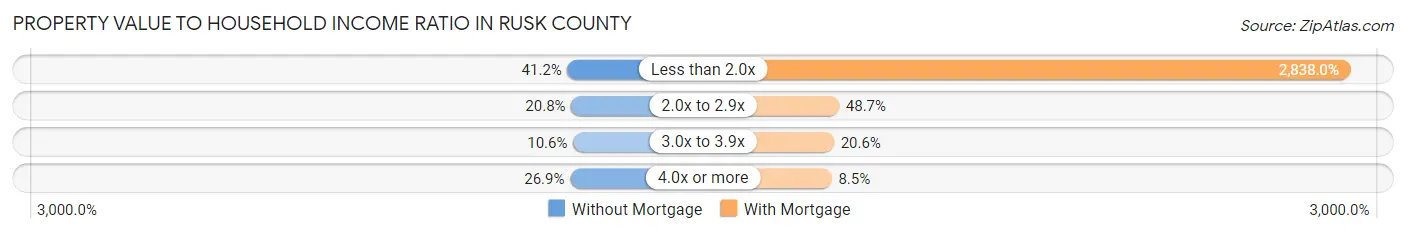
| Value-to-Income Ratio | Without Mortgage | With Mortgage |
| Less than 2.0x | 951 (41.1%) | 73,021 (2,838.0%) |
| 2.0x to 2.9x | 480 (20.8%) | 1,254 (48.7%) |
| 3.0x to 3.9x | 246 (10.6%) | 530 (20.6%) |
| 4.0x or more | 622 (26.9%) | 219 (8.5%) |
| Total | 2,311 (100.0%) | 2,573 (100.0%) |
Real Estate Taxes by Mortgage Status in Rusk County
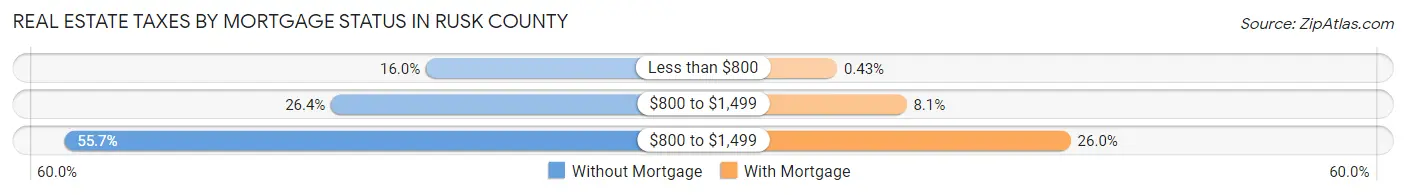
| Property Taxes | Without Mortgage | With Mortgage |
| Less than $800 | 370 (16.0%) | 11 (0.4%) |
| $800 to $1,499 | 610 (26.4%) | 207 (8.1%) |
| $800 to $1,499 | 1,286 (55.6%) | 670 (26.0%) |
| Total | 2,311 (100.0%) | 2,573 (100.0%) |
Health & Disability in Rusk County
Health Insurance Coverage by Age in Rusk County
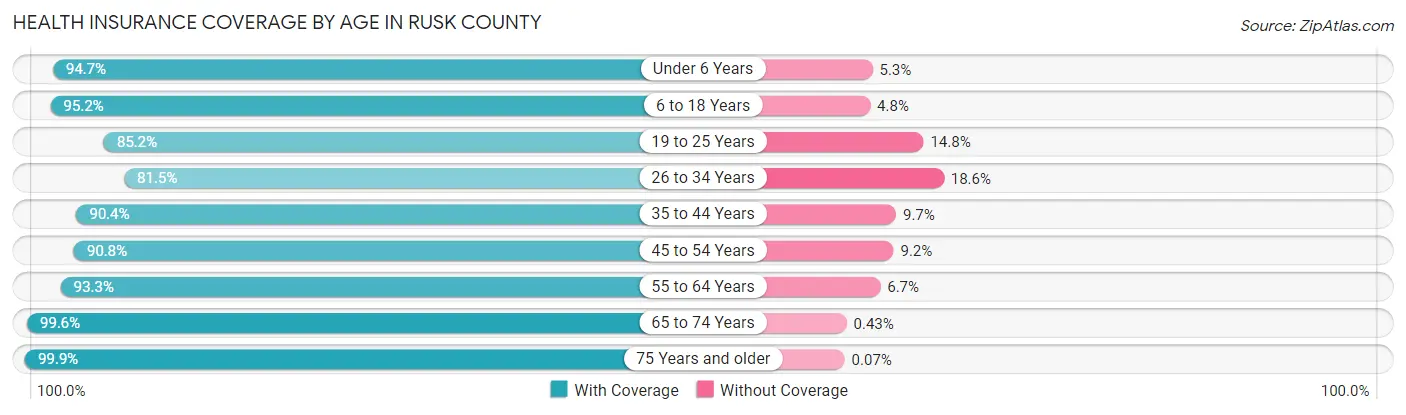
| Age Bracket | With Coverage | Without Coverage |
| Under 6 Years | 863 (94.7%) | 48 (5.3%) |
| 6 to 18 Years | 1,956 (95.2%) | 99 (4.8%) |
| 19 to 25 Years | 808 (85.2%) | 140 (14.8%) |
| 26 to 34 Years | 922 (81.5%) | 210 (18.5%) |
| 35 to 44 Years | 1,273 (90.3%) | 136 (9.7%) |
| 45 to 54 Years | 1,582 (90.8%) | 160 (9.2%) |
| 55 to 64 Years | 2,226 (93.3%) | 160 (6.7%) |
| 65 to 74 Years | 2,102 (99.6%) | 9 (0.4%) |
| 75 Years and older | 1,341 (99.9%) | 1 (0.1%) |
| Total | 13,073 (93.1%) | 963 (6.9%) |
Health Insurance Coverage by Citizenship Status in Rusk County
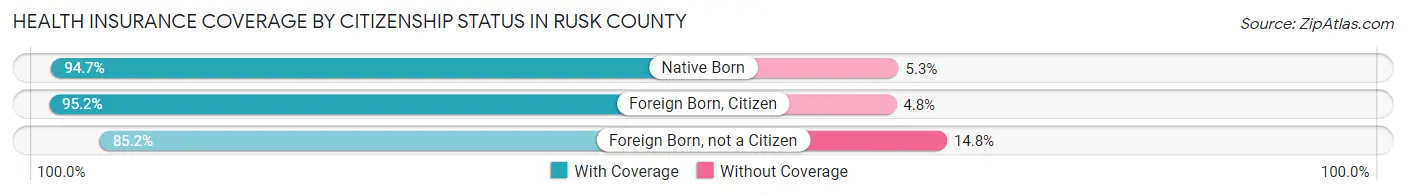
| Citizenship Status | With Coverage | Without Coverage |
| Native Born | 863 (94.7%) | 48 (5.3%) |
| Foreign Born, Citizen | 1,956 (95.2%) | 99 (4.8%) |
| Foreign Born, not a Citizen | 808 (85.2%) | 140 (14.8%) |
Health Insurance Coverage by Household Income in Rusk County
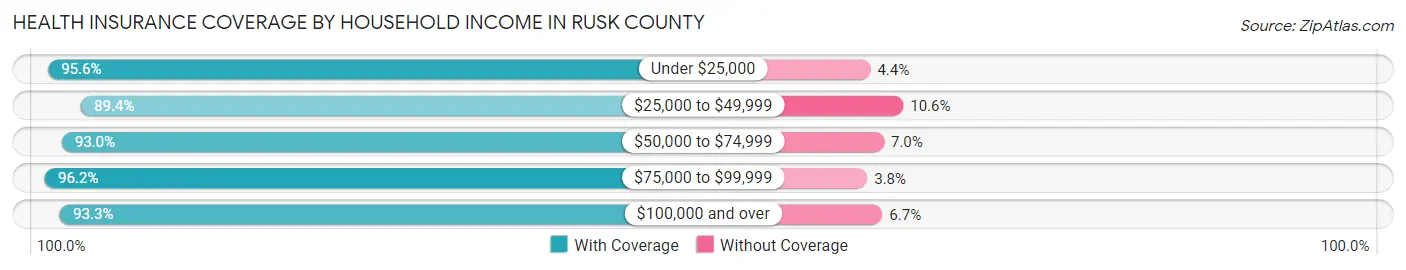
| Household Income | With Coverage | Without Coverage |
| Under $25,000 | 1,574 (95.6%) | 73 (4.4%) |
| $25,000 to $49,999 | 2,672 (89.4%) | 316 (10.6%) |
| $50,000 to $74,999 | 2,827 (93.0%) | 212 (7.0%) |
| $75,000 to $99,999 | 2,255 (96.2%) | 90 (3.8%) |
| $100,000 and over | 3,706 (93.3%) | 265 (6.7%) |
Public vs Private Health Insurance Coverage by Age in Rusk County
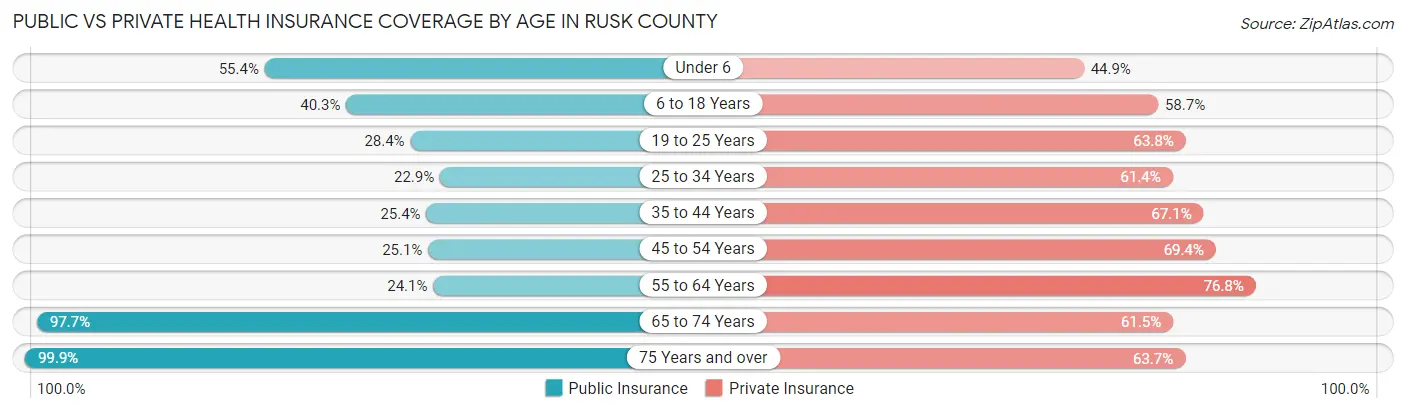
| Age Bracket | Public Insurance | Private Insurance |
| Under 6 | 505 (55.4%) | 409 (44.9%) |
| 6 to 18 Years | 828 (40.3%) | 1,206 (58.7%) |
| 19 to 25 Years | 269 (28.4%) | 605 (63.8%) |
| 25 to 34 Years | 259 (22.9%) | 695 (61.4%) |
| 35 to 44 Years | 358 (25.4%) | 946 (67.1%) |
| 45 to 54 Years | 437 (25.1%) | 1,209 (69.4%) |
| 55 to 64 Years | 576 (24.1%) | 1,833 (76.8%) |
| 65 to 74 Years | 2,063 (97.7%) | 1,298 (61.5%) |
| 75 Years and over | 1,341 (99.9%) | 855 (63.7%) |
| Total | 6,636 (47.3%) | 9,056 (64.5%) |
Disability Status by Sex by Age in Rusk County
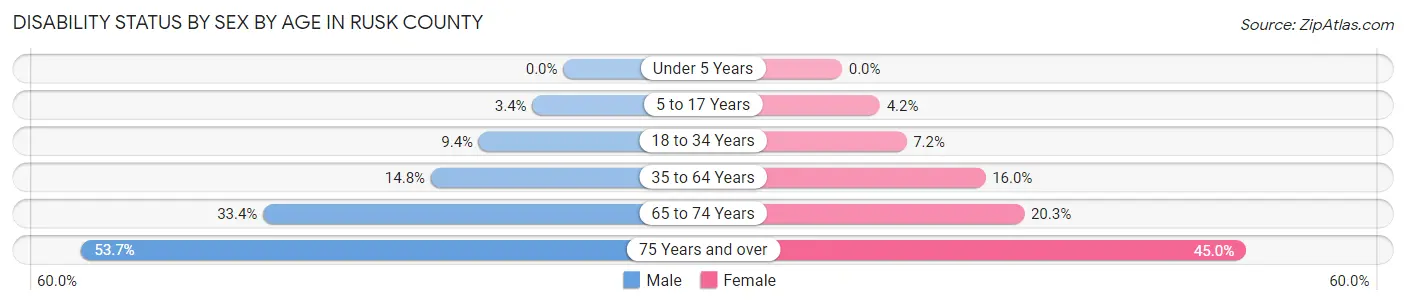
| Age Bracket | Male | Female |
| Under 5 Years | 0 (0.0%) | 0 (0.0%) |
| 5 to 17 Years | 37 (3.4%) | 43 (4.2%) |
| 18 to 34 Years | 107 (9.4%) | 75 (7.2%) |
| 35 to 64 Years | 426 (14.7%) | 423 (16.0%) |
| 65 to 74 Years | 363 (33.4%) | 208 (20.3%) |
| 75 Years and over | 322 (53.7%) | 334 (45.0%) |
Disability Class by Sex by Age in Rusk County
Disability Class: Hearing Difficulty
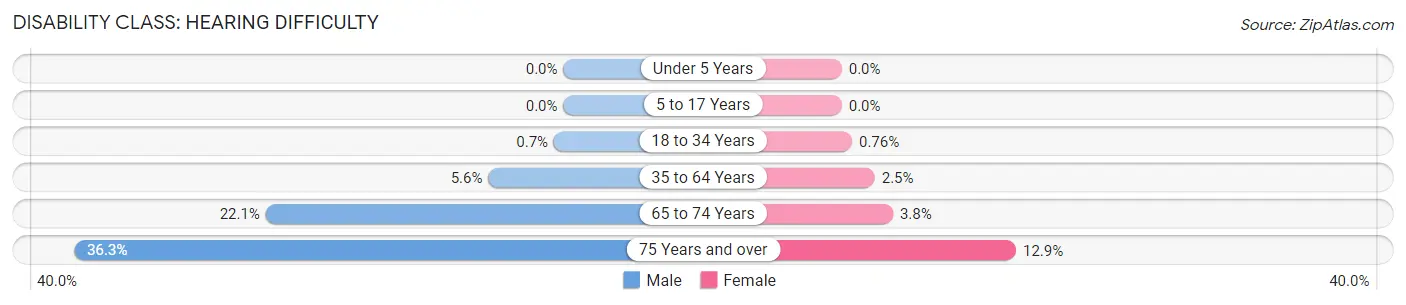
| Age Bracket | Male | Female |
| Under 5 Years | 0 (0.0%) | 0 (0.0%) |
| 5 to 17 Years | 0 (0.0%) | 0 (0.0%) |
| 18 to 34 Years | 8 (0.7%) | 8 (0.8%) |
| 35 to 64 Years | 161 (5.6%) | 65 (2.5%) |
| 65 to 74 Years | 240 (22.1%) | 39 (3.8%) |
| 75 Years and over | 218 (36.3%) | 96 (12.9%) |
Disability Class: Vision Difficulty
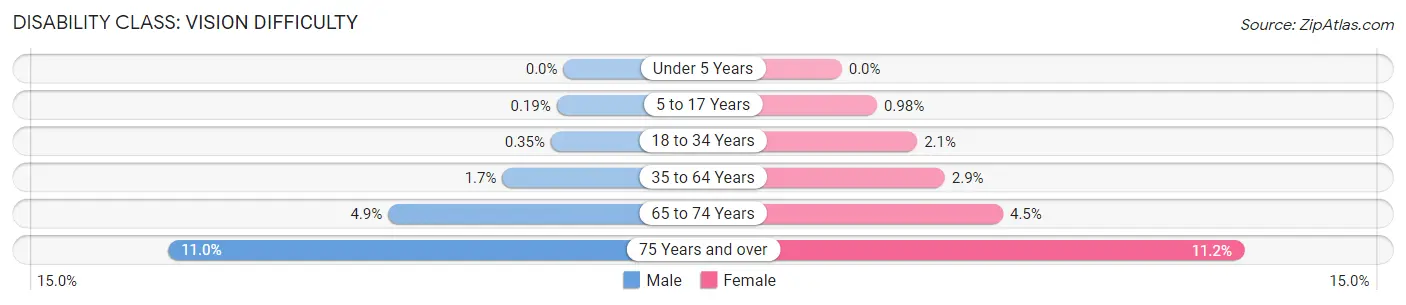
| Age Bracket | Male | Female |
| Under 5 Years | 0 (0.0%) | 0 (0.0%) |
| 5 to 17 Years | 2 (0.2%) | 10 (1.0%) |
| 18 to 34 Years | 4 (0.4%) | 22 (2.1%) |
| 35 to 64 Years | 49 (1.7%) | 76 (2.9%) |
| 65 to 74 Years | 53 (4.9%) | 46 (4.5%) |
| 75 Years and over | 66 (11.0%) | 83 (11.2%) |
Disability Class: Cognitive Difficulty
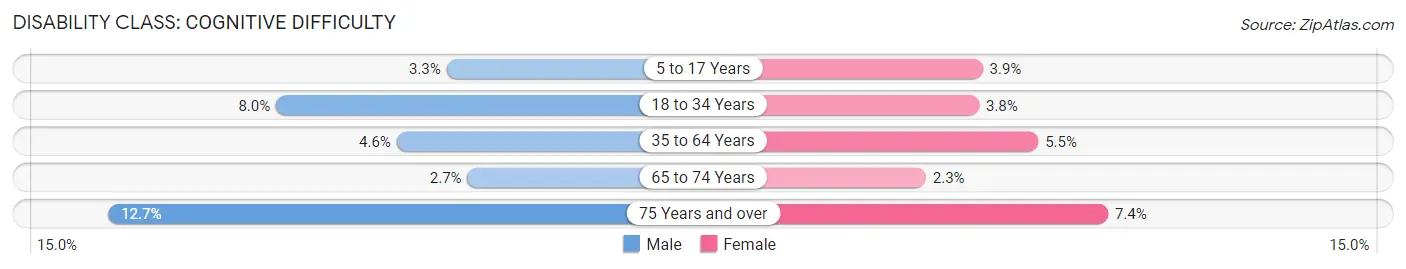
| Age Bracket | Male | Female |
| 5 to 17 Years | 35 (3.3%) | 40 (3.9%) |
| 18 to 34 Years | 91 (8.0%) | 40 (3.8%) |
| 35 to 64 Years | 134 (4.6%) | 145 (5.5%) |
| 65 to 74 Years | 29 (2.7%) | 24 (2.3%) |
| 75 Years and over | 76 (12.7%) | 55 (7.4%) |
Disability Class: Ambulatory Difficulty
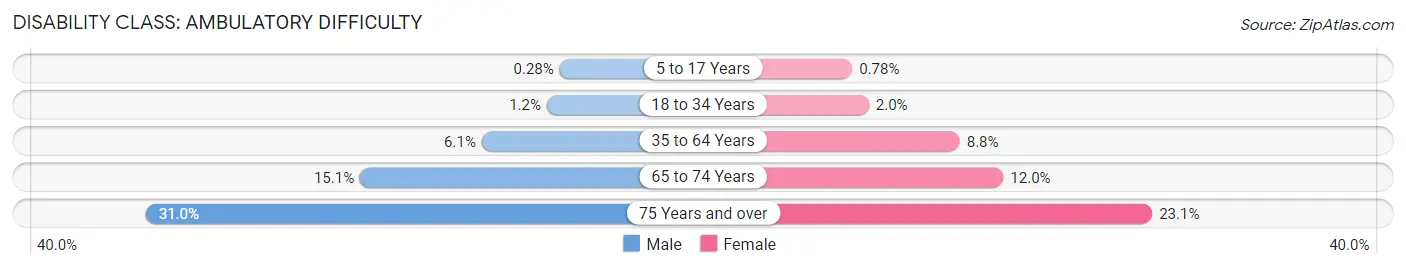
| Age Bracket | Male | Female |
| 5 to 17 Years | 3 (0.3%) | 8 (0.8%) |
| 18 to 34 Years | 14 (1.2%) | 21 (2.0%) |
| 35 to 64 Years | 175 (6.1%) | 232 (8.8%) |
| 65 to 74 Years | 164 (15.1%) | 123 (12.0%) |
| 75 Years and over | 186 (31.0%) | 171 (23.1%) |
Disability Class: Self-Care Difficulty
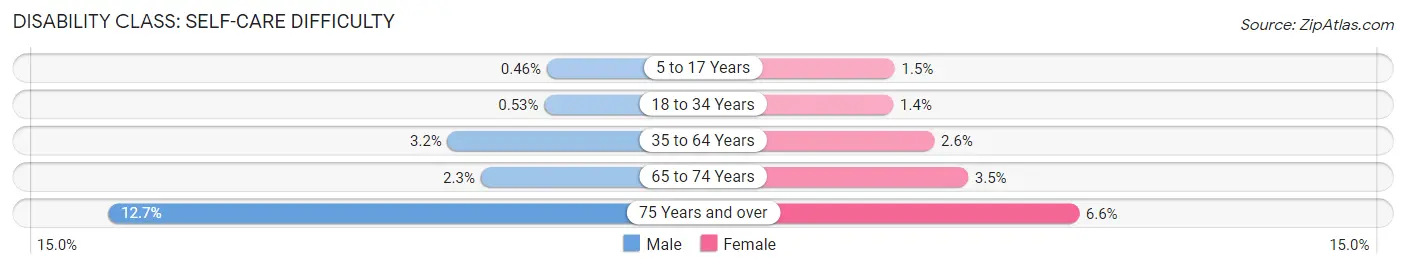
| Age Bracket | Male | Female |
| 5 to 17 Years | 5 (0.5%) | 15 (1.5%) |
| 18 to 34 Years | 6 (0.5%) | 15 (1.4%) |
| 35 to 64 Years | 93 (3.2%) | 68 (2.6%) |
| 65 to 74 Years | 25 (2.3%) | 36 (3.5%) |
| 75 Years and over | 76 (12.7%) | 49 (6.6%) |
Technology Access in Rusk County
Computing Device Access in Rusk County
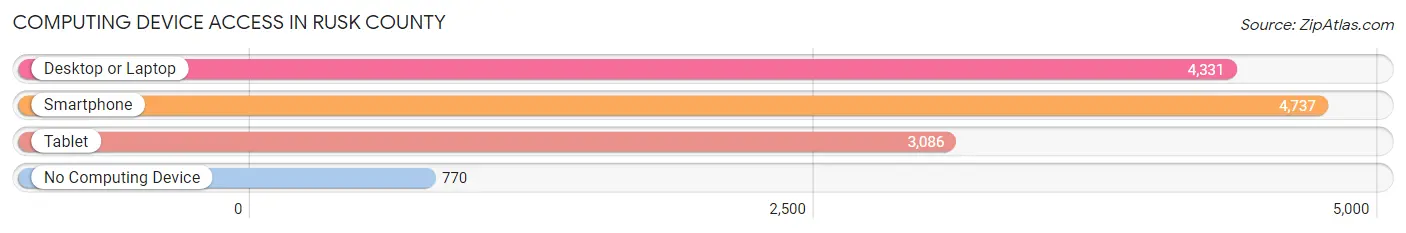
| Device Type | # Households | % Households |
| Desktop or Laptop | 4,331 | 70.0% |
| Smartphone | 4,737 | 76.5% |
| Tablet | 3,086 | 49.8% |
| No Computing Device | 770 | 12.4% |
| Total | 6,190 | 100.0% |
Internet Access in Rusk County
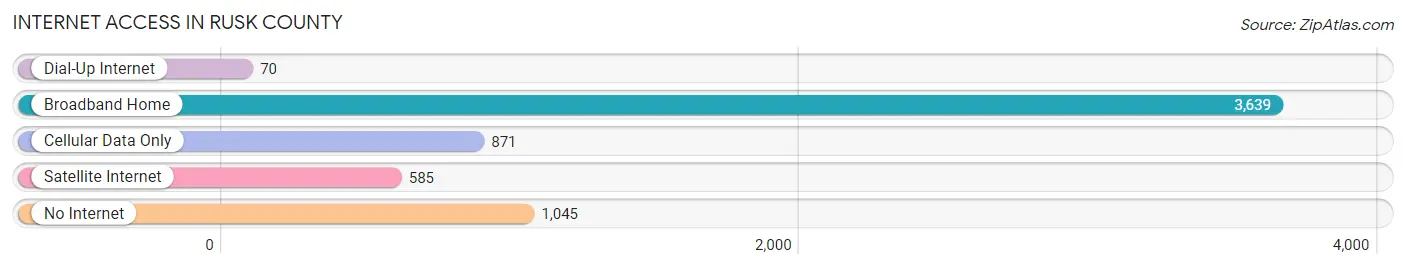
| Internet Type | # Households | % Households |
| Dial-Up Internet | 70 | 1.1% |
| Broadband Home | 3,639 | 58.8% |
| Cellular Data Only | 871 | 14.1% |
| Satellite Internet | 585 | 9.5% |
| No Internet | 1,045 | 16.9% |
| Total | 6,190 | 100.0% |
Rusk County Summary
Rusk County is located in the northwestern part of Wisconsin, and is bordered by Barron, Sawyer, Washburn, and Chippewa counties. It is named after Jeremiah Rusk, the former Governor of Wisconsin. The county seat is Ladysmith, and the largest city is Ladysmith. As of the 2010 census, the population was 14,755.
Geography
Rusk County is located in the northwest corner of Wisconsin, and is bordered by Barron, Sawyer, Washburn, and Chippewa counties. It is part of the Chippewa Valley region, and is located in the Central Plain physiographic region. The county has a total area of 845 square miles, of which 837 square miles is land and 8 square miles is water. The highest point in the county is located in the town of Hawkins, at 1,717 feet above sea level. The county is drained by the Flambeau River, which flows through the county from east to west.
History
Rusk County was established in 1885, and was named after Jeremiah Rusk, the former Governor of Wisconsin. The county was originally part of Chippewa County, and was created from parts of Barron, Sawyer, and Washburn counties. The county seat was originally located in the town of Bruce, but was moved to Ladysmith in 1895.
Economy
Rusk County is primarily an agricultural county, with the majority of the land being used for farming. The county is home to several large dairy farms, as well as a number of smaller farms. The county is also home to several large lumber mills, which provide jobs for many of the county's residents. The county is also home to several small businesses, including restaurants, retail stores, and service providers.
Demographics
As of the 2010 census, there were 14,755 people, 5,845 households, and 3,945 families living in the county. The population density was 17.6 people per square mile. The racial makeup of the county was 97.2% White, 0.4% Black or African American, 0.4% Native American, 0.3% Asian, 0.1% Pacific Islander, 0.6% from other races, and 0.9% from two or more races. 1.7% of the population were Hispanic or Latino of any race.
The median income for a household in the county was $41,945, and the median income for a family was $50,945. The per capita income for the county was $20,945. About 10.2% of families and 13.2% of the population were below the poverty line, including 17.2% of those under age 18 and 8.2% of those age 65 or over.
Conclusion
Rusk County is a rural county located in the northwestern part of Wisconsin. It is primarily an agricultural county, with the majority of the land being used for farming. The county is also home to several large lumber mills, which provide jobs for many of the county's residents. The population of the county is predominantly white, with a small percentage of other races. The median income for a household in the county is slightly above the state average, and the poverty rate is slightly below the state average.
Common Questions
What is Per Capita Income in Rusk County?
Per Capita income in Rusk County is $31,329.
What is the Median Family Income in Rusk County?
Median Family Income in Rusk County is $70,774.
What is the Median Household income in Rusk County?
Median Household Income in Rusk County is $57,473.
What is Income or Wage Gap in Rusk County?
Income or Wage Gap in Rusk County is 34.2%.
Women in Rusk County earn 65.8 cents for every dollar earned by a man.
What is Family Income Deficit in Rusk County?
Family Income Deficit in Rusk County is $7,808.
Families that are below poverty line in Rusk County earn $7,808 less on average than the poverty threshold level.
What is Inequality or Gini Index in Rusk County?
Inequality or Gini Index in Rusk County is 0.40.
What is the Total Population of Rusk County?
Total Population of Rusk County is 14,179.
What is the Total Male Population of Rusk County?
Total Male Population of Rusk County is 7,221.
What is the Total Female Population of Rusk County?
Total Female Population of Rusk County is 6,958.
What is the Ratio of Males per 100 Females in Rusk County?
There are 103.78 Males per 100 Females in Rusk County.
What is the Ratio of Females per 100 Males in Rusk County?
There are 96.36 Females per 100 Males in Rusk County.
What is the Median Population Age in Rusk County?
Median Population Age in Rusk County is 49.0 Years.
What is the Average Family Size in Rusk County
Average Family Size in Rusk County is 2.8 People.
What is the Average Household Size in Rusk County
Average Household Size in Rusk County is 2.3 People.
How Large is the Labor Force in Rusk County?
There are 6,689 People in the Labor Forcein in Rusk County.
What is the Percentage of People in the Labor Force in Rusk County?
57.6% of People are in the Labor Force in Rusk County.
What is the Unemployment Rate in Rusk County?
Unemployment Rate in Rusk County is 4.7%.