Oneida County, WI Map & Demographics
Oneida County Map
Oneida County Overview
$40,086
PER CAPITA INCOME
$83,980
AVG FAMILY INCOME
$66,111
AVG HOUSEHOLD INCOME
29.1%
WAGE / INCOME GAP [ % ]
70.9¢/ $1
WAGE / INCOME GAP [ $ ]
$9,407
FAMILY INCOME DEFICIT
0.45
INEQUALITY / GINI INDEX
37,799
TOTAL POPULATION
19,161
MALE POPULATION
18,638
FEMALE POPULATION
102.81
MALES / 100 FEMALES
97.27
FEMALES / 100 MALES
51.8
MEDIAN AGE
2.9
AVG FAMILY SIZE
2.3
AVG HOUSEHOLD SIZE
17,199
LABOR FORCE [ PEOPLE ]
53.5%
PERCENT IN LABOR FORCE
2.2%
UNEMPLOYMENT RATE
Oneida County Area Codes
Income in Oneida County
Income Overview in Oneida County
Per Capita Income in Oneida County is $40,086, while median incomes of families and households are $83,980 and $66,111 respectively.
| Characteristic | Number | Measure |
| Per Capita Income | 37,799 | $40,086 |
| Median Family Income | 9,947 | $83,980 |
| Mean Family Income | 9,947 | $107,082 |
| Median Household Income | 16,417 | $66,111 |
| Mean Household Income | 16,417 | $88,384 |
| Income Deficit | 9,947 | $9,407 |
| Wage / Income Gap (%) | 37,799 | 29.12% |
| Wage / Income Gap ($) | 37,799 | 70.88¢ per $1 |
| Gini / Inequality Index | 37,799 | 0.45 |
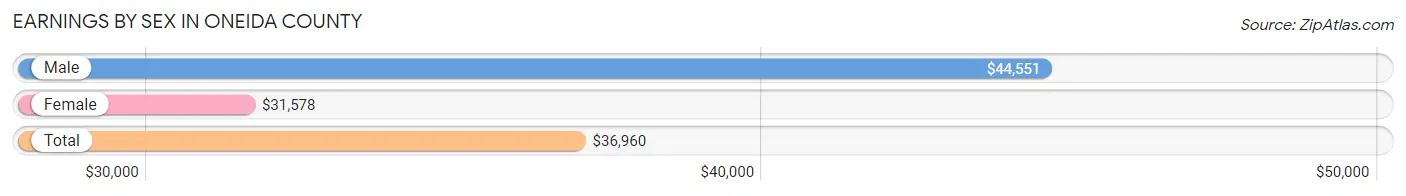
Earnings by Sex in Oneida County
Average Earnings in Oneida County are $36,960, $44,551 for men and $31,578 for women, a difference of 29.1%.
| Sex | Number | Average Earnings |
| Male | 9,987 (52.4%) | $44,551 |
| Female | 9,064 (47.6%) | $31,578 |
| Total | 19,051 (100.0%) | $36,960 |
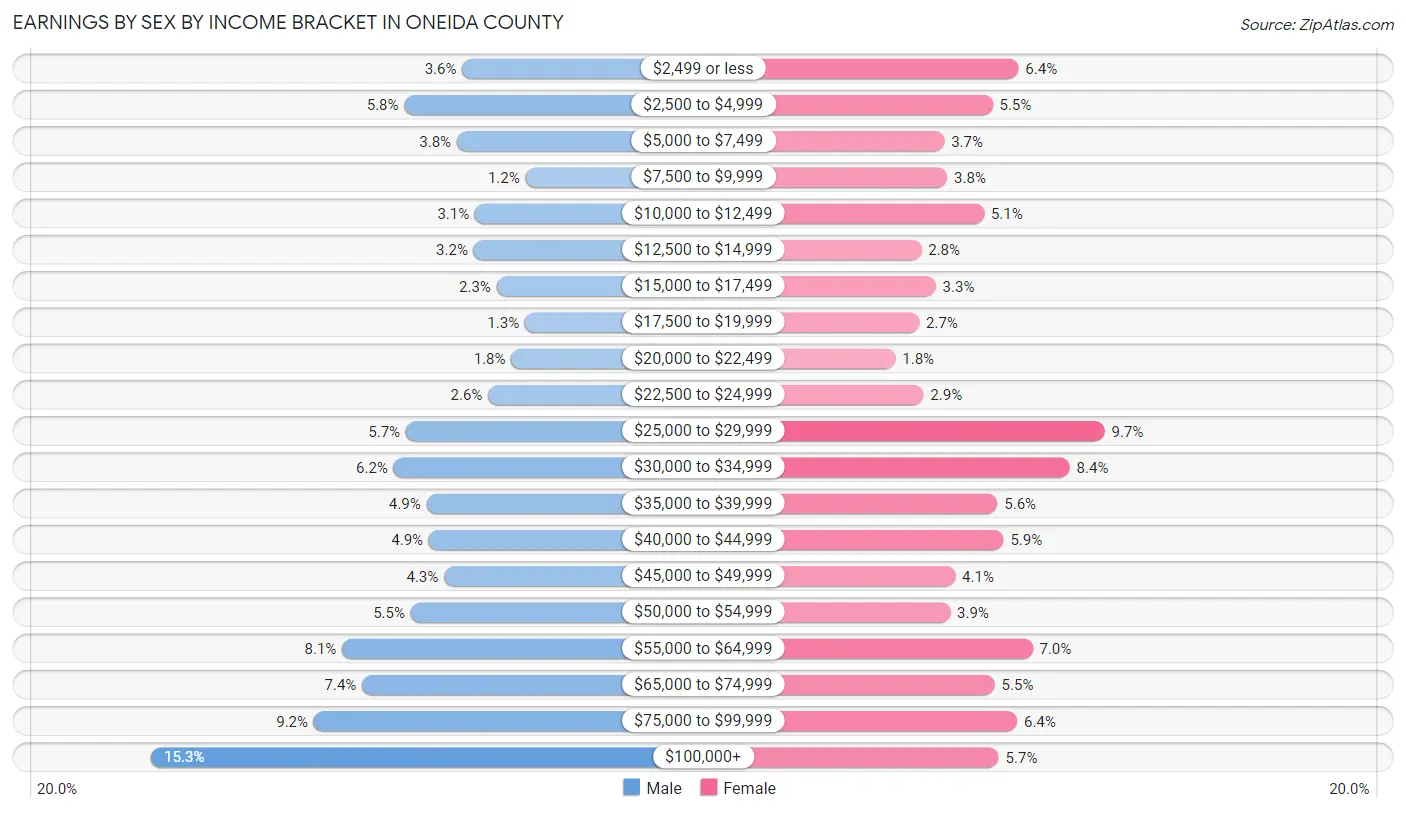
Earnings by Sex by Income Bracket in Oneida County
The most common earnings brackets in Oneida County are $100,000+ for men (1,524 | 15.3%) and $25,000 to $29,999 for women (876 | 9.7%).
| Income | Male | Female |
| $2,499 or less | 360 (3.6%) | 583 (6.4%) |
| $2,500 to $4,999 | 576 (5.8%) | 495 (5.5%) |
| $5,000 to $7,499 | 380 (3.8%) | 331 (3.6%) |
| $7,500 to $9,999 | 123 (1.2%) | 341 (3.8%) |
| $10,000 to $12,499 | 312 (3.1%) | 466 (5.1%) |
| $12,500 to $14,999 | 317 (3.2%) | 253 (2.8%) |
| $15,000 to $17,499 | 231 (2.3%) | 302 (3.3%) |
| $17,500 to $19,999 | 125 (1.3%) | 246 (2.7%) |
| $20,000 to $22,499 | 176 (1.8%) | 165 (1.8%) |
| $22,500 to $24,999 | 263 (2.6%) | 260 (2.9%) |
| $25,000 to $29,999 | 570 (5.7%) | 876 (9.7%) |
| $30,000 to $34,999 | 616 (6.2%) | 757 (8.4%) |
| $35,000 to $39,999 | 493 (4.9%) | 511 (5.6%) |
| $40,000 to $44,999 | 484 (4.9%) | 532 (5.9%) |
| $45,000 to $49,999 | 427 (4.3%) | 368 (4.1%) |
| $50,000 to $54,999 | 552 (5.5%) | 351 (3.9%) |
| $55,000 to $64,999 | 809 (8.1%) | 631 (7.0%) |
| $65,000 to $74,999 | 734 (7.3%) | 502 (5.5%) |
| $75,000 to $99,999 | 915 (9.2%) | 578 (6.4%) |
| $100,000+ | 1,524 (15.3%) | 516 (5.7%) |
| Total | 9,987 (100.0%) | 9,064 (100.0%) |
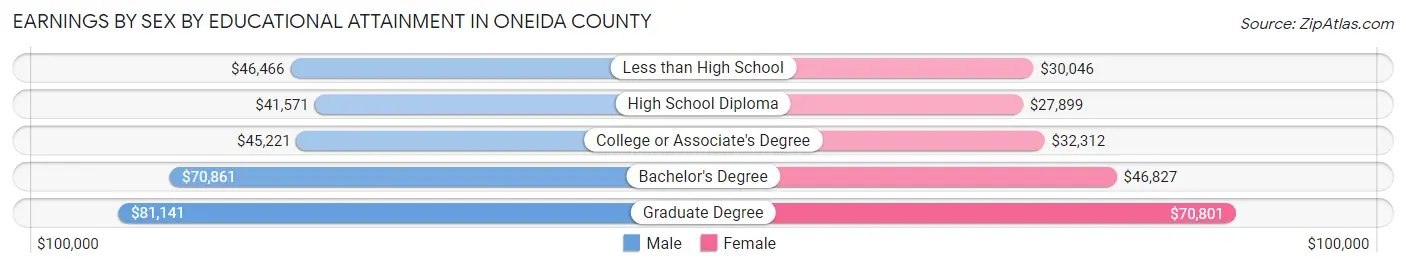
Earnings by Sex by Educational Attainment in Oneida County
Average earnings in Oneida County are $50,664 for men and $34,692 for women, a difference of 31.5%. Men with an educational attainment of graduate degree enjoy the highest average annual earnings of $81,141, while those with high school diploma education earn the least with $41,571. Women with an educational attainment of graduate degree earn the most with the average annual earnings of $70,801, while those with high school diploma education have the smallest earnings of $27,899.
| Educational Attainment | Male Income | Female Income |
| Less than High School | $46,466 | $30,046 |
| High School Diploma | $41,571 | $27,899 |
| College or Associate's Degree | $45,221 | $32,312 |
| Bachelor's Degree | $70,861 | $46,827 |
| Graduate Degree | $81,141 | $70,801 |
| Total | $50,664 | $34,692 |
Family Income in Oneida County
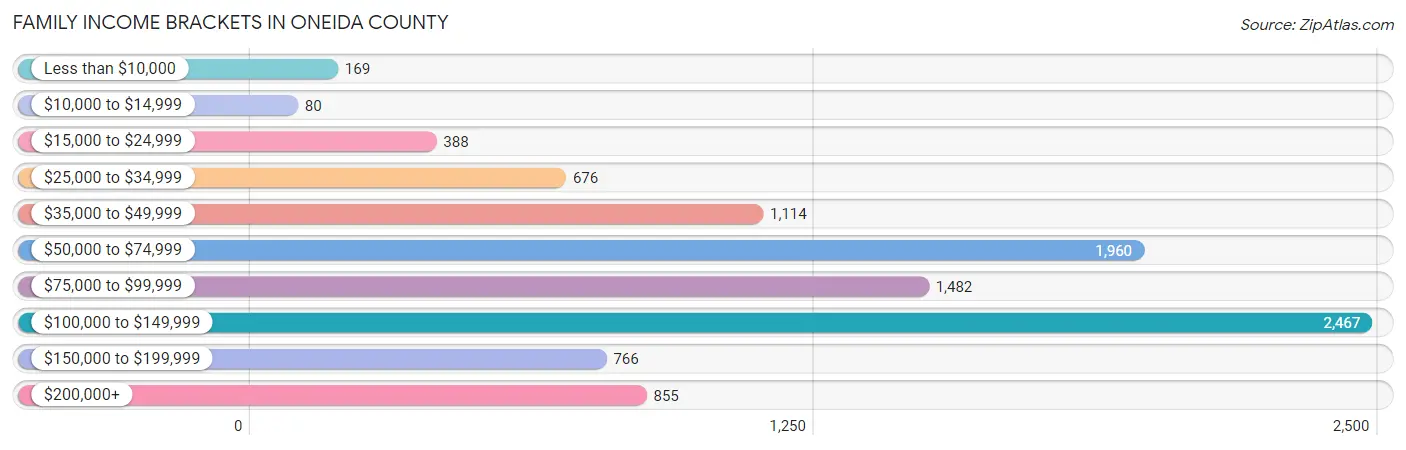
Family Income Brackets in Oneida County
According to the Oneida County family income data, there are 2,467 families falling into the $100,000 to $149,999 income range, which is the most common income bracket and makes up 24.8% of all families. Conversely, the $10,000 to $14,999 income bracket is the least frequent group with only 80 families (0.8%) belonging to this category.
| Income Bracket | # Families | % Families |
| Less than $10,000 | 169 | 1.7% |
| $10,000 to $14,999 | 80 | 0.8% |
| $15,000 to $24,999 | 388 | 3.9% |
| $25,000 to $34,999 | 676 | 6.8% |
| $35,000 to $49,999 | 1,114 | 11.2% |
| $50,000 to $74,999 | 1,960 | 19.7% |
| $75,000 to $99,999 | 1,482 | 14.9% |
| $100,000 to $149,999 | 2,467 | 24.8% |
| $150,000 to $199,999 | 766 | 7.7% |
| $200,000+ | 855 | 8.6% |
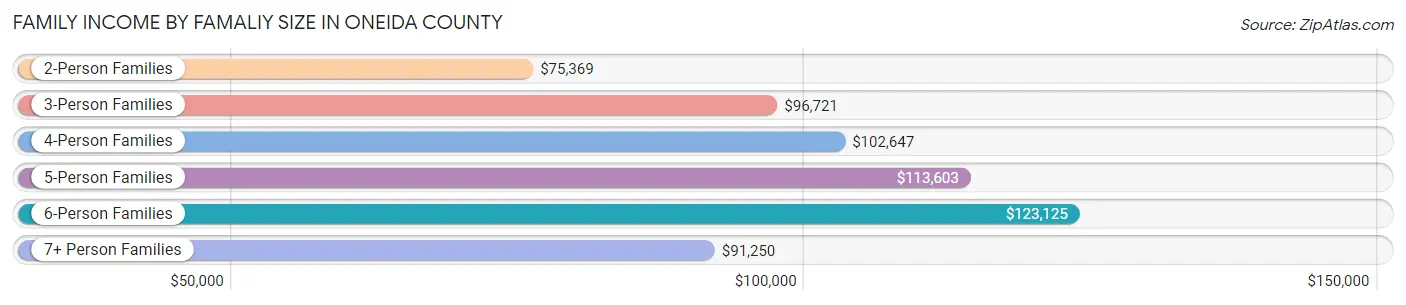
Family Income by Famaliy Size in Oneida County
6-person families (94 | 0.9%) account for the highest median family income in Oneida County with $123,125 per family, while 2-person families (6,536 | 65.7%) have the highest median income of $37,684 per family member.
| Income Bracket | # Families | Median Income |
| 2-Person Families | 6,536 (65.7%) | $75,369 |
| 3-Person Families | 1,482 (14.9%) | $96,721 |
| 4-Person Families | 1,410 (14.2%) | $102,647 |
| 5-Person Families | 329 (3.3%) | $113,603 |
| 6-Person Families | 94 (0.9%) | $123,125 |
| 7+ Person Families | 96 (1.0%) | $91,250 |
| Total | 9,947 (100.0%) | $83,980 |
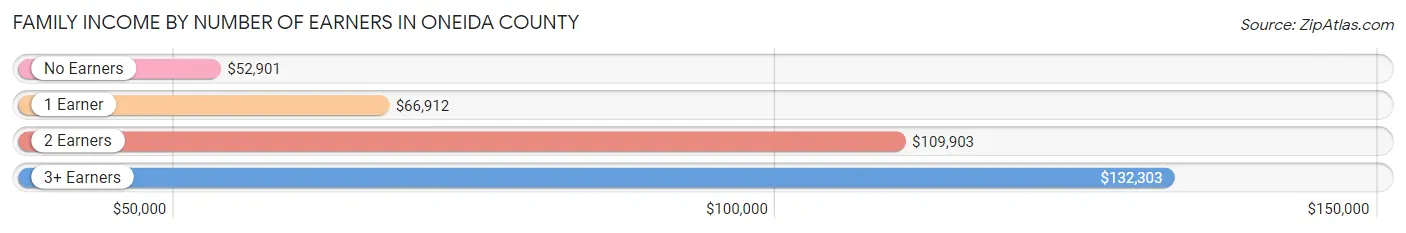
Family Income by Number of Earners in Oneida County
The median family income in Oneida County is $83,980, with families comprising 3+ earners (767) having the highest median family income of $132,303, while families with no earners (2,643) have the lowest median family income of $52,901, accounting for 7.7% and 26.6% of families, respectively.
| Number of Earners | # Families | Median Income |
| No Earners | 2,643 (26.6%) | $52,901 |
| 1 Earner | 2,722 (27.4%) | $66,912 |
| 2 Earners | 3,815 (38.4%) | $109,903 |
| 3+ Earners | 767 (7.7%) | $132,303 |
| Total | 9,947 (100.0%) | $83,980 |
Household Income in Oneida County
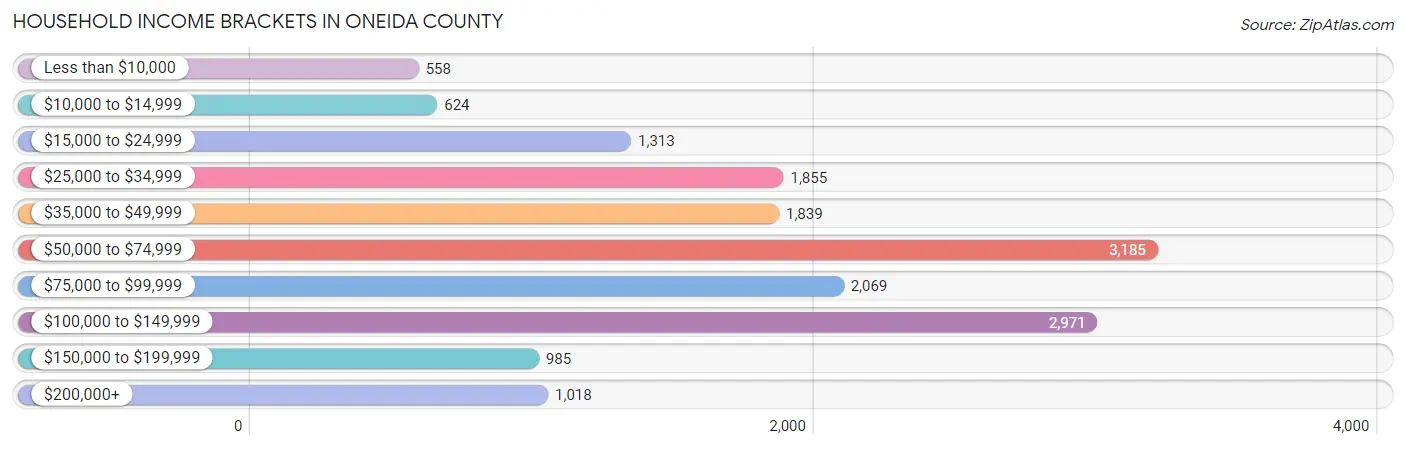
Household Income Brackets in Oneida County
With 3,185 households falling in the category, the $50,000 to $74,999 income range is the most frequent in Oneida County, accounting for 19.4% of all households. In contrast, only 558 households (3.4%) fall into the less than $10,000 income bracket, making it the least populous group.
| Income Bracket | # Households | % Households |
| Less than $10,000 | 558 | 3.4% |
| $10,000 to $14,999 | 624 | 3.8% |
| $15,000 to $24,999 | 1,313 | 8.0% |
| $25,000 to $34,999 | 1,855 | 11.3% |
| $35,000 to $49,999 | 1,839 | 11.2% |
| $50,000 to $74,999 | 3,185 | 19.4% |
| $75,000 to $99,999 | 2,069 | 12.6% |
| $100,000 to $149,999 | 2,971 | 18.1% |
| $150,000 to $199,999 | 985 | 6.0% |
| $200,000+ | 1,018 | 6.2% |
Household Income by Householder Age in Oneida County
The median household income in Oneida County is $66,111, with the highest median household income of $80,620 found in the 45 to 64 years age bracket for the primary householder. A total of 6,340 households (38.6%) fall into this category. Meanwhile, the 15 to 24 years age bracket for the primary householder has the lowest median household income of $44,231, with 362 households (2.2%) in this group.
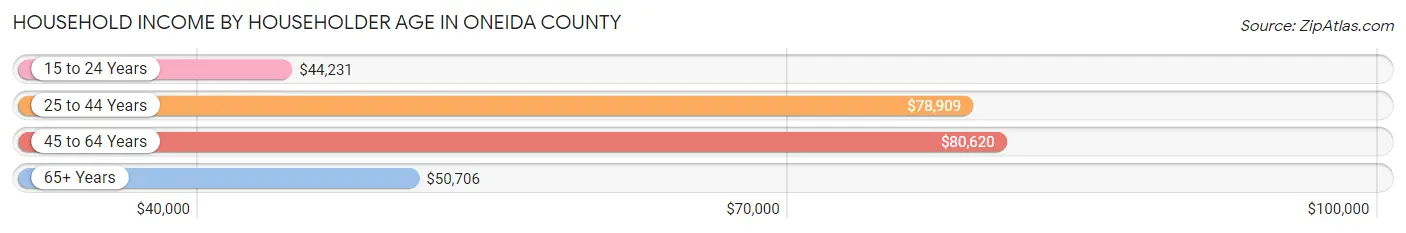
| Income Bracket | # Households | Median Income |
| 15 to 24 Years | 362 (2.2%) | $44,231 |
| 25 to 44 Years | 3,358 (20.4%) | $78,909 |
| 45 to 64 Years | 6,340 (38.6%) | $80,620 |
| 65+ Years | 6,357 (38.7%) | $50,706 |
| Total | 16,417 (100.0%) | $66,111 |
Poverty in Oneida County
Income Below Poverty by Sex and Age in Oneida County
With 9.9% poverty level for males and 9.2% for females among the residents of Oneida County, under 5 year old males and 5 year old females are the most vulnerable to poverty, with 163 males (19.6%) and 61 females (44.2%) in their respective age groups living below the poverty level.
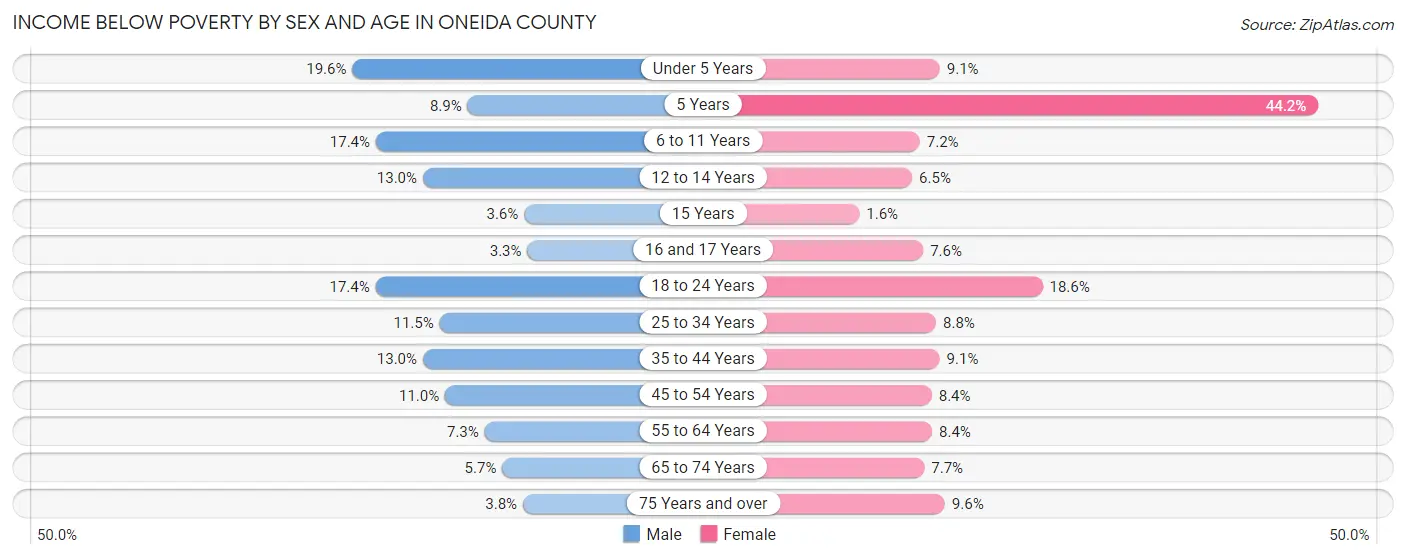
| Age Bracket | Male | Female |
| Under 5 Years | 163 (19.6%) | 69 (9.1%) |
| 5 Years | 12 (8.9%) | 61 (44.2%) |
| 6 to 11 Years | 182 (17.4%) | 74 (7.2%) |
| 12 to 14 Years | 94 (13.0%) | 34 (6.5%) |
| 15 Years | 8 (3.6%) | 3 (1.6%) |
| 16 and 17 Years | 13 (3.3%) | 34 (7.6%) |
| 18 to 24 Years | 195 (17.4%) | 201 (18.6%) |
| 25 to 34 Years | 202 (11.5%) | 146 (8.7%) |
| 35 to 44 Years | 246 (13.0%) | 161 (9.1%) |
| 45 to 54 Years | 249 (11.0%) | 181 (8.4%) |
| 55 to 64 Years | 258 (7.3%) | 303 (8.4%) |
| 65 to 74 Years | 176 (5.7%) | 222 (7.7%) |
| 75 Years and over | 69 (3.7%) | 196 (9.6%) |
| Total | 1,867 (9.9%) | 1,685 (9.2%) |
Income Above Poverty by Sex and Age in Oneida County
According to the poverty statistics in Oneida County, males aged 16 and 17 years and females aged 15 years are the age groups that are most secure financially, with 96.7% of males and 98.4% of females in these age groups living above the poverty line.
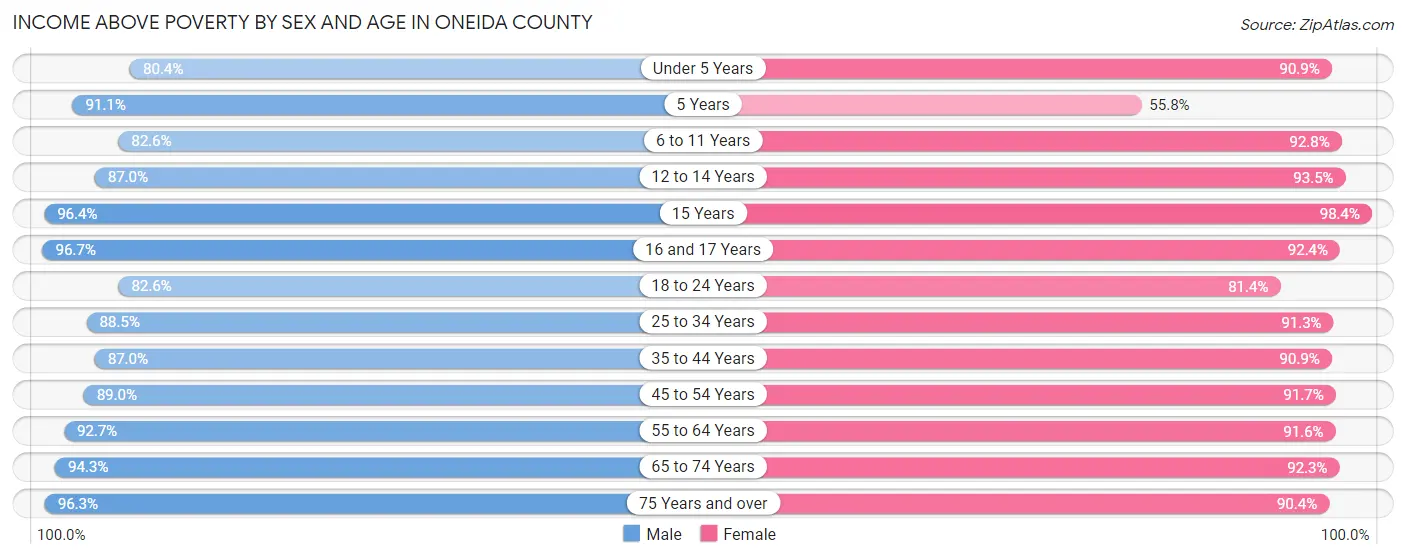
| Age Bracket | Male | Female |
| Under 5 Years | 669 (80.4%) | 689 (90.9%) |
| 5 Years | 123 (91.1%) | 77 (55.8%) |
| 6 to 11 Years | 864 (82.6%) | 948 (92.8%) |
| 12 to 14 Years | 627 (87.0%) | 487 (93.5%) |
| 15 Years | 212 (96.4%) | 181 (98.4%) |
| 16 and 17 Years | 376 (96.7%) | 416 (92.4%) |
| 18 to 24 Years | 924 (82.6%) | 878 (81.4%) |
| 25 to 34 Years | 1,556 (88.5%) | 1,522 (91.2%) |
| 35 to 44 Years | 1,640 (87.0%) | 1,612 (90.9%) |
| 45 to 54 Years | 2,018 (89.0%) | 1,986 (91.6%) |
| 55 to 64 Years | 3,272 (92.7%) | 3,312 (91.6%) |
| 65 to 74 Years | 2,927 (94.3%) | 2,678 (92.3%) |
| 75 Years and over | 1,771 (96.3%) | 1,851 (90.4%) |
| Total | 16,979 (90.1%) | 16,637 (90.8%) |
Income Below Poverty Among Married-Couple Families in Oneida County
The poverty statistics for married-couple families in Oneida County show that 2.9% or 247 of the total 8,655 families live below the poverty line. Families with 5 or more children have the highest poverty rate of 12.1%, comprising of 8 families. On the other hand, families with 3 or 4 children have the lowest poverty rate of 0.0%, which includes 0 families.
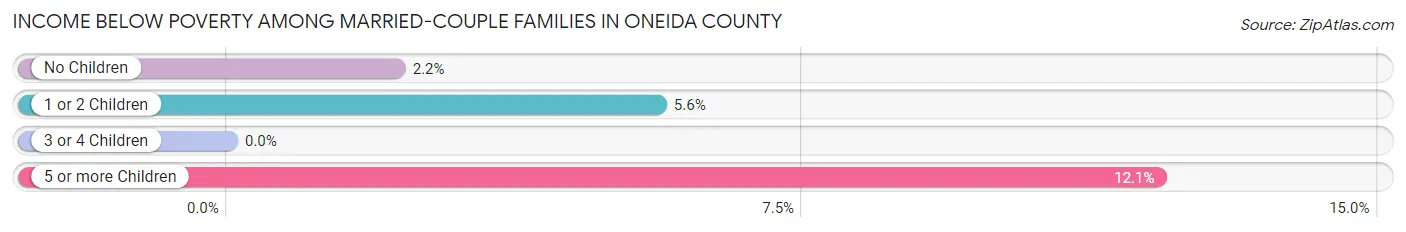
| Children | Above Poverty | Below Poverty |
| No Children | 6,423 (97.8%) | 144 (2.2%) |
| 1 or 2 Children | 1,602 (94.4%) | 95 (5.6%) |
| 3 or 4 Children | 325 (100.0%) | 0 (0.0%) |
| 5 or more Children | 58 (87.9%) | 8 (12.1%) |
| Total | 8,408 (97.2%) | 247 (2.9%) |
Income Below Poverty Among Single-Parent Households in Oneida County
According to the poverty data in Oneida County, 27.7% or 101 single-father households and 21.0% or 195 single-mother households are living below the poverty line. Among single-father households, those with 5 or more children have the highest poverty rate, with 12 households (100.0%) experiencing poverty. Likewise, among single-mother households, those with 3 or 4 children have the highest poverty rate, with 32 households (37.2%) falling below the poverty line.
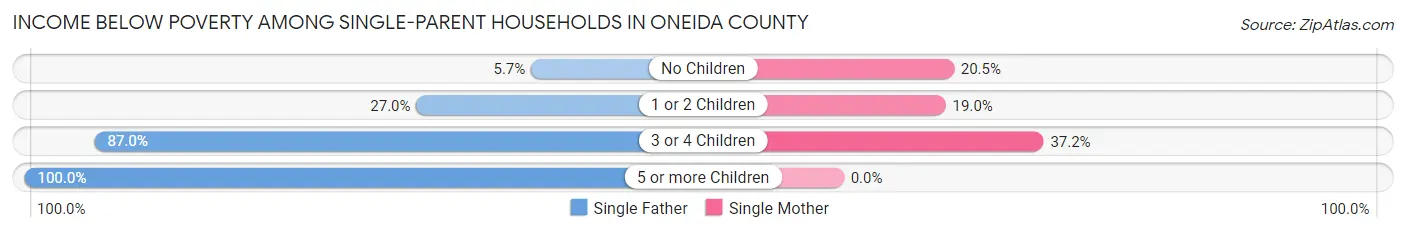
| Children | Single Father | Single Mother |
| No Children | 9 (5.7%) | 72 (20.5%) |
| 1 or 2 Children | 40 (27.0%) | 91 (19.0%) |
| 3 or 4 Children | 40 (87.0%) | 32 (37.2%) |
| 5 or more Children | 12 (100.0%) | 0 (0.0%) |
| Total | 101 (27.7%) | 195 (21.0%) |
Income Below Poverty Among Married-Couple vs Single-Parent Households in Oneida County
The poverty data for Oneida County shows that 247 of the married-couple family households (2.9%) and 296 of the single-parent households (22.9%) are living below the poverty level. Within the married-couple family households, those with 5 or more children have the highest poverty rate, with 8 households (12.1%) falling below the poverty line. Among the single-parent households, those with 3 or 4 children have the highest poverty rate, with 72 household (54.5%) living below poverty.
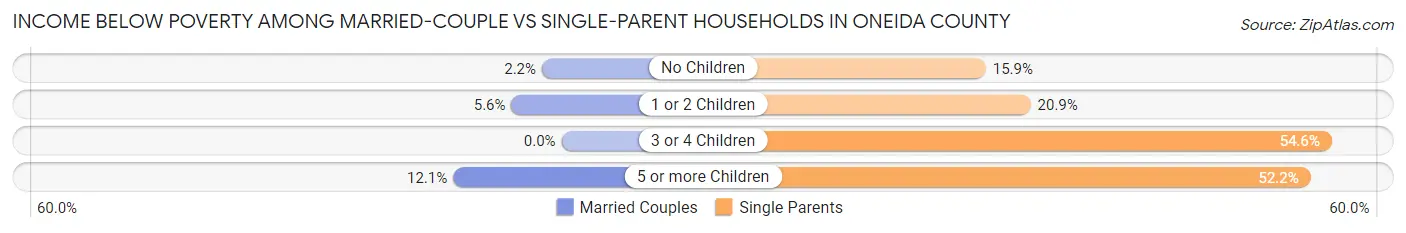
| Children | Married-Couple Families | Single-Parent Households |
| No Children | 144 (2.2%) | 81 (15.9%) |
| 1 or 2 Children | 95 (5.6%) | 131 (20.9%) |
| 3 or 4 Children | 0 (0.0%) | 72 (54.5%) |
| 5 or more Children | 8 (12.1%) | 12 (52.2%) |
| Total | 247 (2.9%) | 296 (22.9%) |
Race in Oneida County
The most populous races in Oneida County are White / Caucasian (35,804 | 94.7%), Two or more Races (882 | 2.3%), and Hispanic or Latino (647 | 1.7%).
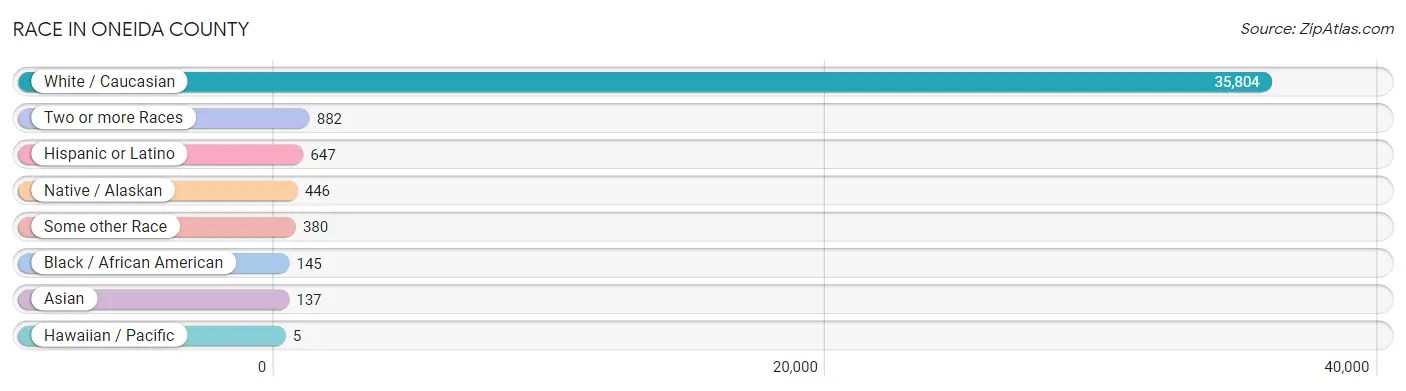
| Race | # Population | % Population |
| Asian | 137 | 0.4% |
| Black / African American | 145 | 0.4% |
| Hawaiian / Pacific | 5 | 0.0% |
| Hispanic or Latino | 647 | 1.7% |
| Native / Alaskan | 446 | 1.2% |
| White / Caucasian | 35,804 | 94.7% |
| Two or more Races | 882 | 2.3% |
| Some other Race | 380 | 1.0% |
| Total | 37,799 | 100.0% |
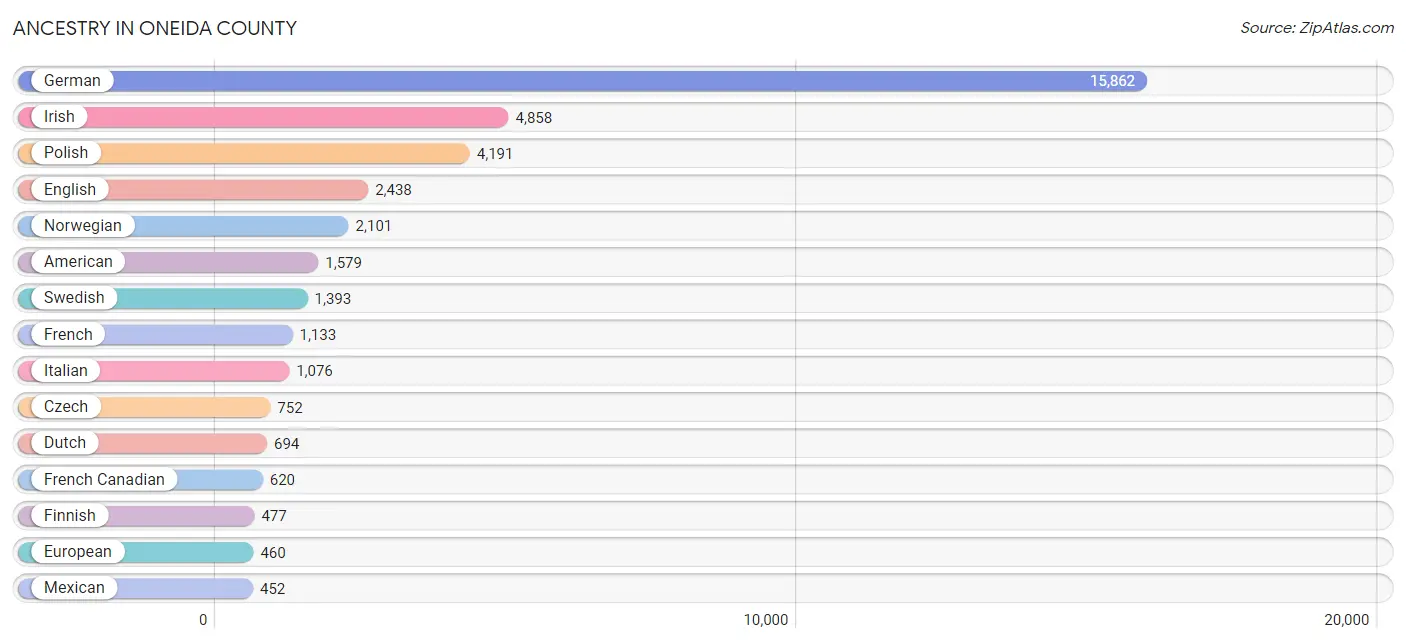
Ancestry in Oneida County
The most populous ancestries reported in Oneida County are German (15,862 | 42.0%), Irish (4,858 | 12.9%), Polish (4,191 | 11.1%), English (2,438 | 6.5%), and Norwegian (2,101 | 5.6%), together accounting for 77.9% of all Oneida County residents.
| Ancestry | # Population | % Population |
| African | 113 | 0.3% |
| American | 1,579 | 4.2% |
| Apache | 1 | 0.0% |
| Arab | 46 | 0.1% |
| Austrian | 127 | 0.3% |
| Bangladeshi | 44 | 0.1% |
| Belgian | 260 | 0.7% |
| Bhutanese | 30 | 0.1% |
| Blackfeet | 57 | 0.2% |
| Brazilian | 2 | 0.0% |
| British | 180 | 0.5% |
| Burmese | 22 | 0.1% |
| Canadian | 29 | 0.1% |
| Celtic | 10 | 0.0% |
| Cherokee | 57 | 0.2% |
| Cheyenne | 2 | 0.0% |
| Chilean | 1 | 0.0% |
| Chippewa | 363 | 1.0% |
| Creek | 2 | 0.0% |
| Croatian | 75 | 0.2% |
| Cuban | 22 | 0.1% |
| Czech | 752 | 2.0% |
| Czechoslovakian | 92 | 0.2% |
| Danish | 380 | 1.0% |
| Dominican | 6 | 0.0% |
| Dutch | 694 | 1.8% |
| Eastern European | 48 | 0.1% |
| English | 2,438 | 6.5% |
| Estonian | 1 | 0.0% |
| European | 460 | 1.2% |
| Finnish | 477 | 1.3% |
| French | 1,133 | 3.0% |
| French American Indian | 5 | 0.0% |
| French Canadian | 620 | 1.6% |
| German | 15,862 | 42.0% |
| Greek | 220 | 0.6% |
| Haitian | 13 | 0.0% |
| Hungarian | 229 | 0.6% |
| Icelander | 1 | 0.0% |
| Indian (Asian) | 57 | 0.2% |
| Irish | 4,858 | 12.9% |
| Iroquois | 49 | 0.1% |
| Italian | 1,076 | 2.9% |
| Jamaican | 6 | 0.0% |
| Korean | 43 | 0.1% |
| Latvian | 22 | 0.1% |
| Lithuanian | 135 | 0.4% |
| Luxembourger | 40 | 0.1% |
| Macedonian | 3 | 0.0% |
| Menominee | 15 | 0.0% |
| Mexican | 452 | 1.2% |
| Mexican American Indian | 8 | 0.0% |
| Native Hawaiian | 7 | 0.0% |
| Northern European | 92 | 0.2% |
| Norwegian | 2,101 | 5.6% |
| Osage | 2 | 0.0% |
| Pennsylvania German | 8 | 0.0% |
| Polish | 4,191 | 11.1% |
| Portuguese | 30 | 0.1% |
| Potawatomi | 92 | 0.2% |
| Puerto Rican | 95 | 0.3% |
| Romanian | 11 | 0.0% |
| Russian | 228 | 0.6% |
| Samoan | 5 | 0.0% |
| Scandinavian | 405 | 1.1% |
| Scotch-Irish | 191 | 0.5% |
| Scottish | 403 | 1.1% |
| Serbian | 20 | 0.1% |
| Sioux | 1 | 0.0% |
| Slavic | 7 | 0.0% |
| Slovak | 118 | 0.3% |
| Slovene | 23 | 0.1% |
| South African | 3 | 0.0% |
| South American | 1 | 0.0% |
| Spaniard | 39 | 0.1% |
| Spanish | 9 | 0.0% |
| Sri Lankan | 18 | 0.1% |
| Subsaharan African | 116 | 0.3% |
| Swedish | 1,393 | 3.7% |
| Swiss | 222 | 0.6% |
| Syrian | 6 | 0.0% |
| Thai | 32 | 0.1% |
| Turkish | 1 | 0.0% |
| Ukrainian | 69 | 0.2% |
| Vietnamese | 19 | 0.1% |
| Welsh | 190 | 0.5% |
| Yugoslavian | 43 | 0.1% | View All 87 Rows |
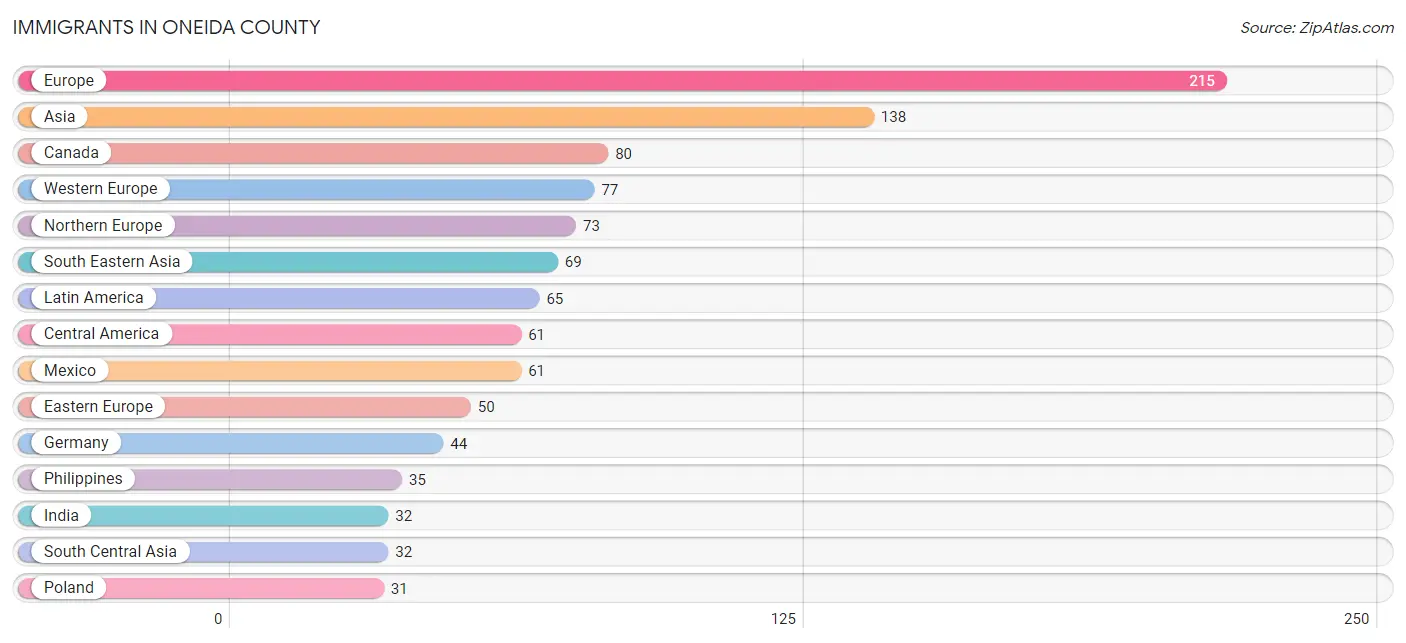
Immigrants in Oneida County
The most numerous immigrant groups reported in Oneida County came from Europe (215 | 0.6%), Asia (138 | 0.4%), Canada (80 | 0.2%), Western Europe (77 | 0.2%), and Northern Europe (73 | 0.2%), together accounting for 1.5% of all Oneida County residents.
| Immigration Origin | # Population | % Population |
| Africa | 20 | 0.1% |
| Asia | 138 | 0.4% |
| Brazil | 2 | 0.0% |
| Canada | 80 | 0.2% |
| Caribbean | 2 | 0.0% |
| Central America | 61 | 0.2% |
| Cuba | 2 | 0.0% |
| Czechoslovakia | 5 | 0.0% |
| Eastern Asia | 9 | 0.0% |
| Eastern Europe | 50 | 0.1% |
| England | 28 | 0.1% |
| Europe | 215 | 0.6% |
| France | 12 | 0.0% |
| Germany | 44 | 0.1% |
| Hungary | 3 | 0.0% |
| India | 32 | 0.1% |
| Korea | 9 | 0.0% |
| Laos | 23 | 0.1% |
| Latin America | 65 | 0.2% |
| Mexico | 61 | 0.2% |
| Netherlands | 21 | 0.1% |
| Northern Africa | 13 | 0.0% |
| Northern Europe | 73 | 0.2% |
| Oceania | 4 | 0.0% |
| Philippines | 35 | 0.1% |
| Poland | 31 | 0.1% |
| Russia | 3 | 0.0% |
| Saudi Arabia | 27 | 0.1% |
| Serbia | 3 | 0.0% |
| South Africa | 3 | 0.0% |
| South America | 2 | 0.0% |
| South Central Asia | 32 | 0.1% |
| South Eastern Asia | 69 | 0.2% |
| Southern Europe | 15 | 0.0% |
| Spain | 15 | 0.0% |
| Sudan | 13 | 0.0% |
| Sweden | 13 | 0.0% |
| Turkey | 1 | 0.0% |
| Ukraine | 5 | 0.0% |
| Vietnam | 11 | 0.0% |
| Western Africa | 4 | 0.0% |
| Western Asia | 28 | 0.1% |
| Western Europe | 77 | 0.2% | View All 43 Rows |
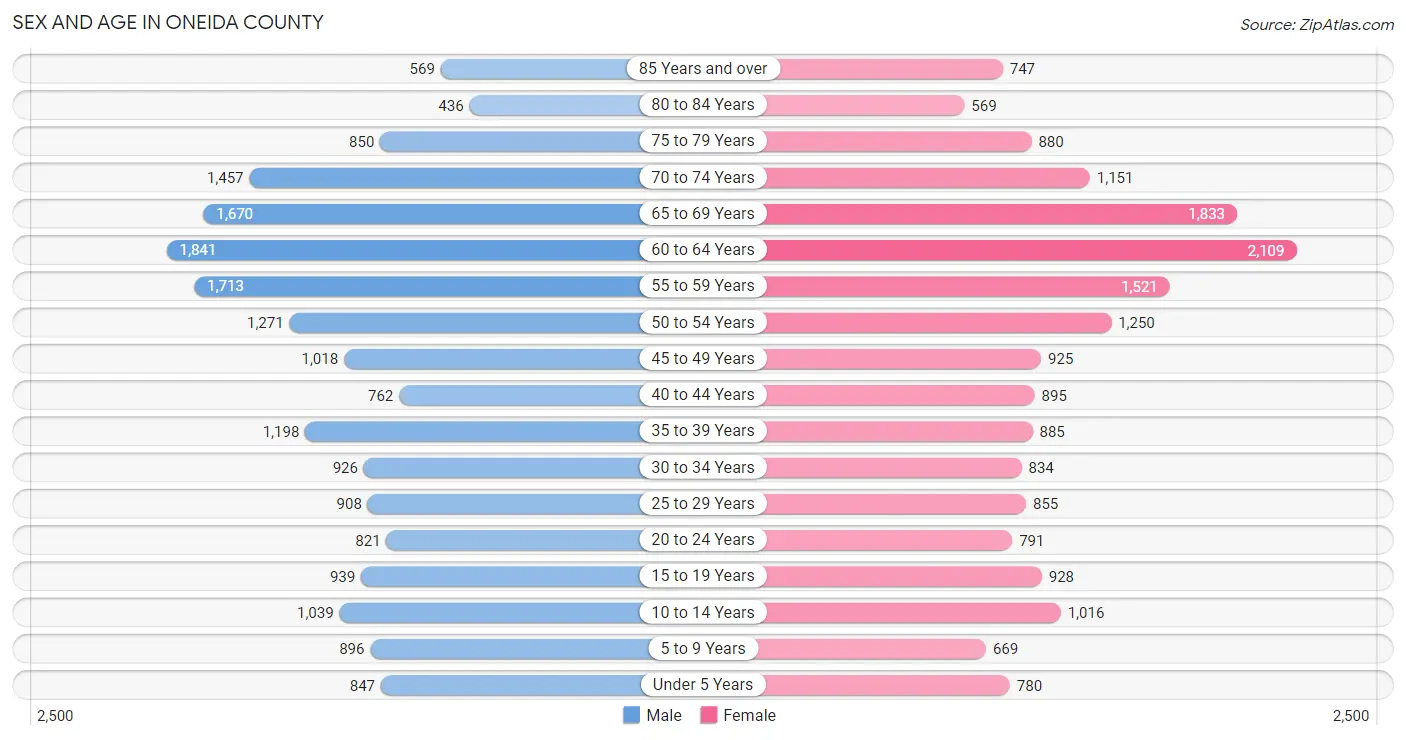
Sex and Age in Oneida County
Sex and Age in Oneida County
The most populous age groups in Oneida County are 60 to 64 Years (1,841 | 9.6%) for men and 60 to 64 Years (2,109 | 11.3%) for women.
| Age Bracket | Male | Female |
| Under 5 Years | 847 (4.4%) | 780 (4.2%) |
| 5 to 9 Years | 896 (4.7%) | 669 (3.6%) |
| 10 to 14 Years | 1,039 (5.4%) | 1,016 (5.4%) |
| 15 to 19 Years | 939 (4.9%) | 928 (5.0%) |
| 20 to 24 Years | 821 (4.3%) | 791 (4.2%) |
| 25 to 29 Years | 908 (4.7%) | 855 (4.6%) |
| 30 to 34 Years | 926 (4.8%) | 834 (4.5%) |
| 35 to 39 Years | 1,198 (6.2%) | 885 (4.8%) |
| 40 to 44 Years | 762 (4.0%) | 895 (4.8%) |
| 45 to 49 Years | 1,018 (5.3%) | 925 (5.0%) |
| 50 to 54 Years | 1,271 (6.6%) | 1,250 (6.7%) |
| 55 to 59 Years | 1,713 (8.9%) | 1,521 (8.2%) |
| 60 to 64 Years | 1,841 (9.6%) | 2,109 (11.3%) |
| 65 to 69 Years | 1,670 (8.7%) | 1,833 (9.8%) |
| 70 to 74 Years | 1,457 (7.6%) | 1,151 (6.2%) |
| 75 to 79 Years | 850 (4.4%) | 880 (4.7%) |
| 80 to 84 Years | 436 (2.3%) | 569 (3.0%) |
| 85 Years and over | 569 (3.0%) | 747 (4.0%) |
| Total | 19,161 (100.0%) | 18,638 (100.0%) |
Families and Households in Oneida County
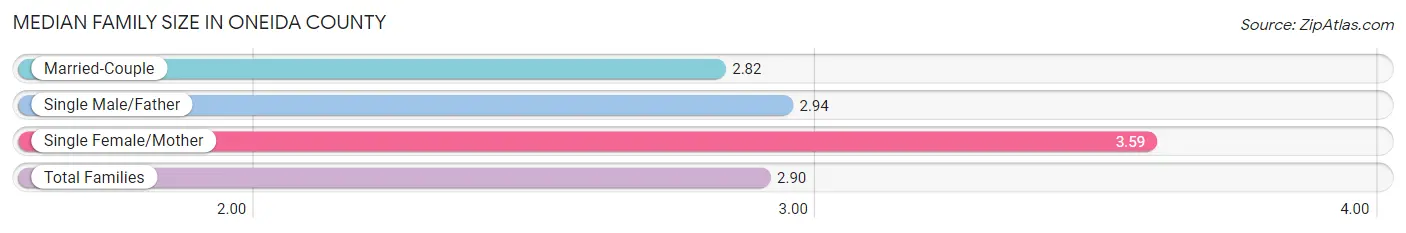
Median Family Size in Oneida County
The median family size in Oneida County is 2.90 persons per family, with single female/mother families (927 | 9.3%) accounting for the largest median family size of 3.59 persons per family. On the other hand, married-couple families (8,655 | 87.0%) represent the smallest median family size with 2.82 persons per family.
| Family Type | # Families | Family Size |
| Married-Couple | 8,655 (87.0%) | 2.82 |
| Single Male/Father | 365 (3.7%) | 2.94 |
| Single Female/Mother | 927 (9.3%) | 3.59 |
| Total Families | 9,947 (100.0%) | 2.90 |
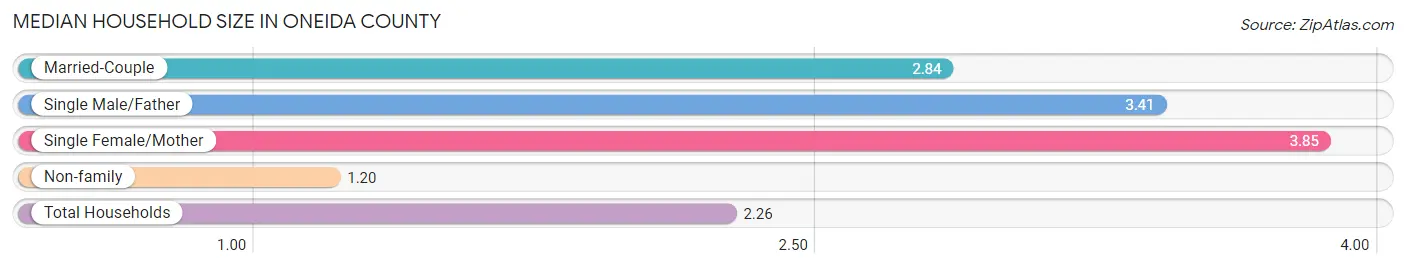
Median Household Size in Oneida County
The median household size in Oneida County is 2.26 persons per household, with single female/mother households (927 | 5.7%) accounting for the largest median household size of 3.85 persons per household. non-family households (6,470 | 39.4%) represent the smallest median household size with 1.20 persons per household.
| Household Type | # Households | Household Size |
| Married-Couple | 8,655 (52.7%) | 2.84 |
| Single Male/Father | 365 (2.2%) | 3.41 |
| Single Female/Mother | 927 (5.7%) | 3.85 |
| Non-family | 6,470 (39.4%) | 1.20 |
| Total Households | 16,417 (100.0%) | 2.26 |
Household Size by Marriage Status in Oneida County
Out of a total of 16,417 households in Oneida County, 9,947 (60.6%) are family households, while 6,470 (39.4%) are nonfamily households. The most numerous type of family households are 2-person households, comprising 6,327, and the most common type of nonfamily households are 1-person households, comprising 5,368.
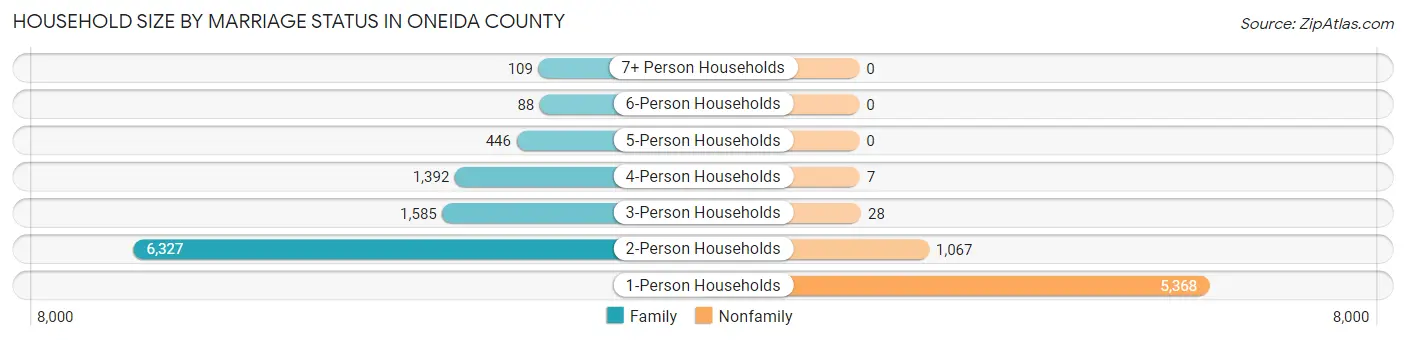
| Household Size | Family Households | Nonfamily Households |
| 1-Person Households | - | 5,368 (32.7%) |
| 2-Person Households | 6,327 (38.5%) | 1,067 (6.5%) |
| 3-Person Households | 1,585 (9.7%) | 28 (0.2%) |
| 4-Person Households | 1,392 (8.5%) | 7 (0.0%) |
| 5-Person Households | 446 (2.7%) | 0 (0.0%) |
| 6-Person Households | 88 (0.5%) | 0 (0.0%) |
| 7+ Person Households | 109 (0.7%) | 0 (0.0%) |
| Total | 9,947 (60.6%) | 6,470 (39.4%) |
Female Fertility in Oneida County
Fertility by Age in Oneida County
Average fertility rate in Oneida County is 36.0 births per 1,000 women. Women in the age bracket of 20 to 34 years have the highest fertility rate with 81.0 births per 1,000 women. Women in the age bracket of 20 to 34 years acount for 88.6% of all women with births.
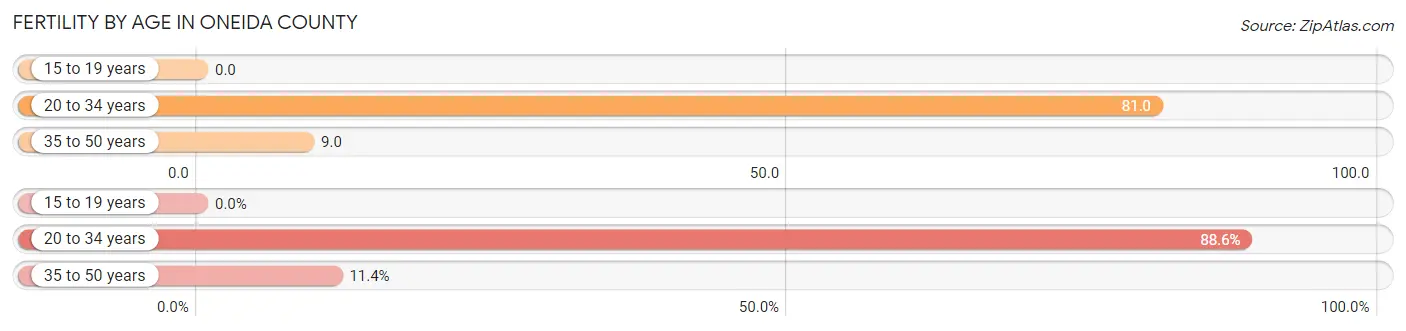
| Age Bracket | Women with Births | Births / 1,000 Women |
| 15 to 19 years | 0 (0.0%) | 0.0 |
| 20 to 34 years | 202 (88.6%) | 81.0 |
| 35 to 50 years | 26 (11.4%) | 9.0 |
| Total | 228 (100.0%) | 36.0 |
Fertility by Age by Marriage Status in Oneida County
88.6% of women with births (228) in Oneida County are married. The highest percentage of unmarried women with births falls into 20 to 34 years age bracket with 12.9% of them unmarried at the time of birth, while the lowest percentage of unmarried women with births belong to 35 to 50 years age bracket with 0.0% of them unmarried.
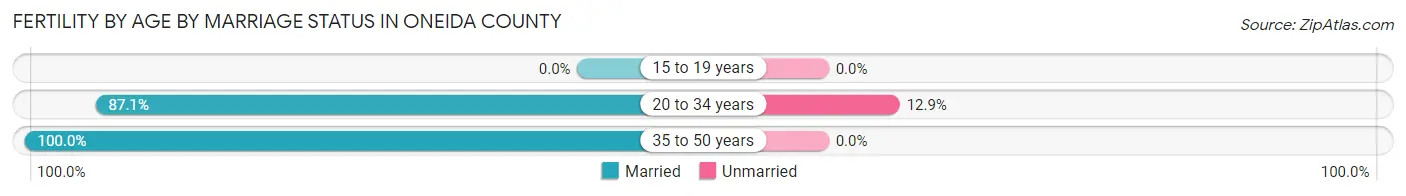
| Age Bracket | Married | Unmarried |
| 15 to 19 years | 0 (0.0%) | 0 (0.0%) |
| 20 to 34 years | 176 (87.1%) | 26 (12.9%) |
| 35 to 50 years | 26 (100.0%) | 0 (0.0%) |
| Total | 202 (88.6%) | 26 (11.4%) |
Fertility by Education in Oneida County
Average fertility rate in Oneida County is 36.0 births per 1,000 women. Women with the education attainment of graduate degree have the highest fertility rate of 73.0 births per 1,000 women, while women with the education attainment of less than high school have the lowest fertility at 7.0 births per 1,000 women. Women with the education attainment of college or associate's degree represent 48.2% of all women with births.
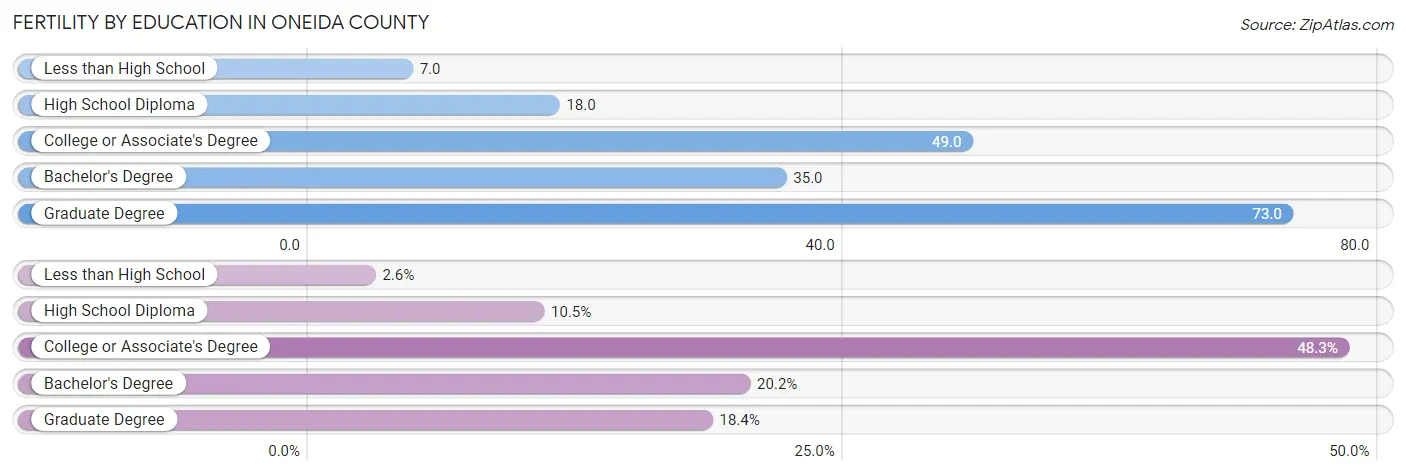
| Educational Attainment | Women with Births | Births / 1,000 Women |
| Less than High School | 6 (2.6%) | 7.0 |
| High School Diploma | 24 (10.5%) | 18.0 |
| College or Associate's Degree | 110 (48.2%) | 49.0 |
| Bachelor's Degree | 46 (20.2%) | 35.0 |
| Graduate Degree | 42 (18.4%) | 73.0 |
| Total | 228 (100.0%) | 36.0 |
Fertility by Education by Marriage Status in Oneida County
11.4% of women with births in Oneida County are unmarried. Women with the educational attainment of high school diploma are most likely to be married with 100.0% of them married at childbirth, while women with the educational attainment of less than high school are least likely to be married with 66.7% of them unmarried at childbirth.
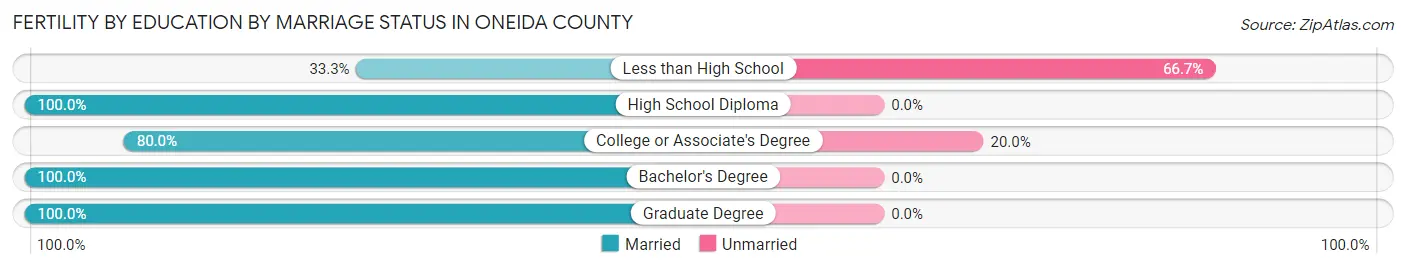
| Educational Attainment | Married | Unmarried |
| Less than High School | 2 (33.3%) | 4 (66.7%) |
| High School Diploma | 24 (100.0%) | 0 (0.0%) |
| College or Associate's Degree | 88 (80.0%) | 22 (20.0%) |
| Bachelor's Degree | 46 (100.0%) | 0 (0.0%) |
| Graduate Degree | 42 (100.0%) | 0 (0.0%) |
| Total | 202 (88.6%) | 26 (11.4%) |
Employment Characteristics in Oneida County
Employment by Class of Employer in Oneida County
Among the 16,525 employed individuals in Oneida County, private company employees (10,791 | 65.3%), not-for-profit organizations (1,419 | 8.6%), and self-employed (not incorporated) (1,387 | 8.4%) make up the most common classes of employment.
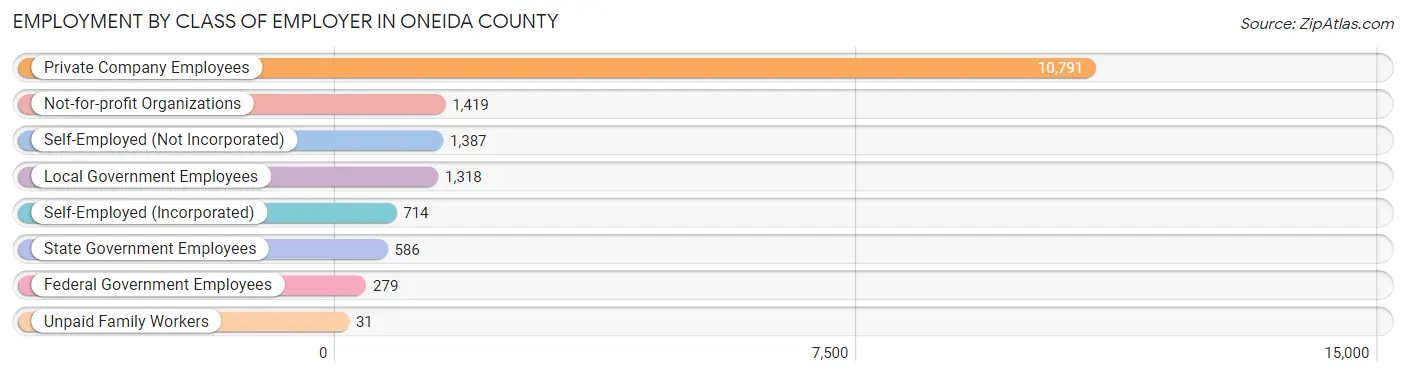
| Employer Class | # Employees | % Employees |
| Private Company Employees | 10,791 | 65.3% |
| Self-Employed (Incorporated) | 714 | 4.3% |
| Self-Employed (Not Incorporated) | 1,387 | 8.4% |
| Not-for-profit Organizations | 1,419 | 8.6% |
| Local Government Employees | 1,318 | 8.0% |
| State Government Employees | 586 | 3.5% |
| Federal Government Employees | 279 | 1.7% |
| Unpaid Family Workers | 31 | 0.2% |
| Total | 16,525 | 100.0% |
Employment Status by Age in Oneida County
According to the labor force statistics for Oneida County, out of the total population over 16 years of age (32,148), 53.5% or 17,199 individuals are in the labor force, with 2.2% or 378 of them unemployed. The age group with the highest labor force participation rate is 30 to 34 years, with 89.0% or 1,566 individuals in the labor force. Within the labor force, the 20 to 24 years age range has the highest percentage of unemployed individuals, with 6.5% or 78 of them being unemployed.
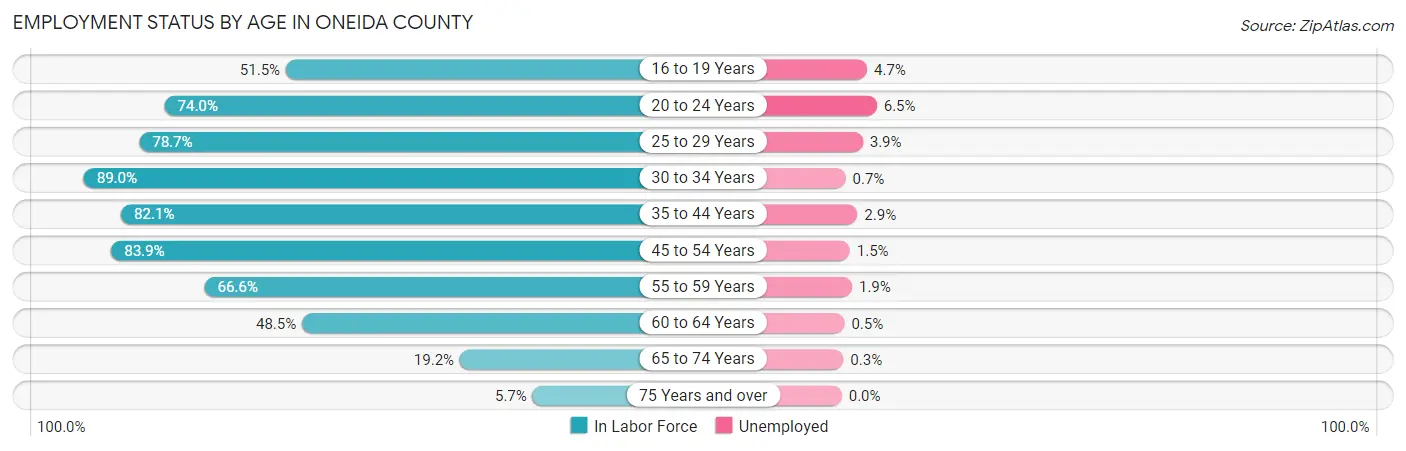
| Age Bracket | In Labor Force | Unemployed |
| 16 to 19 Years | 753 (51.5%) | 35 (4.7%) |
| 20 to 24 Years | 1,193 (74.0%) | 78 (6.5%) |
| 25 to 29 Years | 1,387 (78.7%) | 54 (3.9%) |
| 30 to 34 Years | 1,566 (89.0%) | 11 (0.7%) |
| 35 to 44 Years | 3,071 (82.1%) | 89 (2.9%) |
| 45 to 54 Years | 3,745 (83.9%) | 56 (1.5%) |
| 55 to 59 Years | 2,154 (66.6%) | 41 (1.9%) |
| 60 to 64 Years | 1,916 (48.5%) | 10 (0.5%) |
| 65 to 74 Years | 1,173 (19.2%) | 4 (0.3%) |
| 75 Years and over | 231 (5.7%) | 0 (0.0%) |
| Total | 17,199 (53.5%) | 378 (2.2%) |
Employment Status by Educational Attainment in Oneida County
According to labor force statistics for Oneida County, 73.2% of individuals (13,843) out of the total population between 25 and 64 years of age (18,911) are in the labor force, with 1.9% or 263 of them being unemployed. The group with the highest labor force participation rate are those with the educational attainment of bachelor's degree or higher, with 83.1% or 4,255 individuals in the labor force. Within the labor force, individuals with high school diploma education have the highest percentage of unemployment, with 2.3% or 84 of them being unemployed.
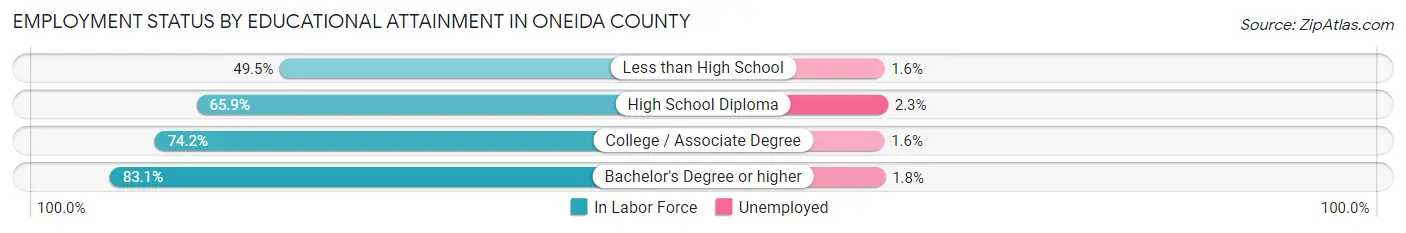
| Educational Attainment | In Labor Force | Unemployed |
| Less than High School | 385 (49.5%) | 12 (1.6%) |
| High School Diploma | 3,662 (65.9%) | 128 (2.3%) |
| College / Associate Degree | 5,533 (74.2%) | 119 (1.6%) |
| Bachelor's Degree or higher | 4,255 (83.1%) | 92 (1.8%) |
| Total | 13,843 (73.2%) | 359 (1.9%) |
Employment Occupations by Sex in Oneida County
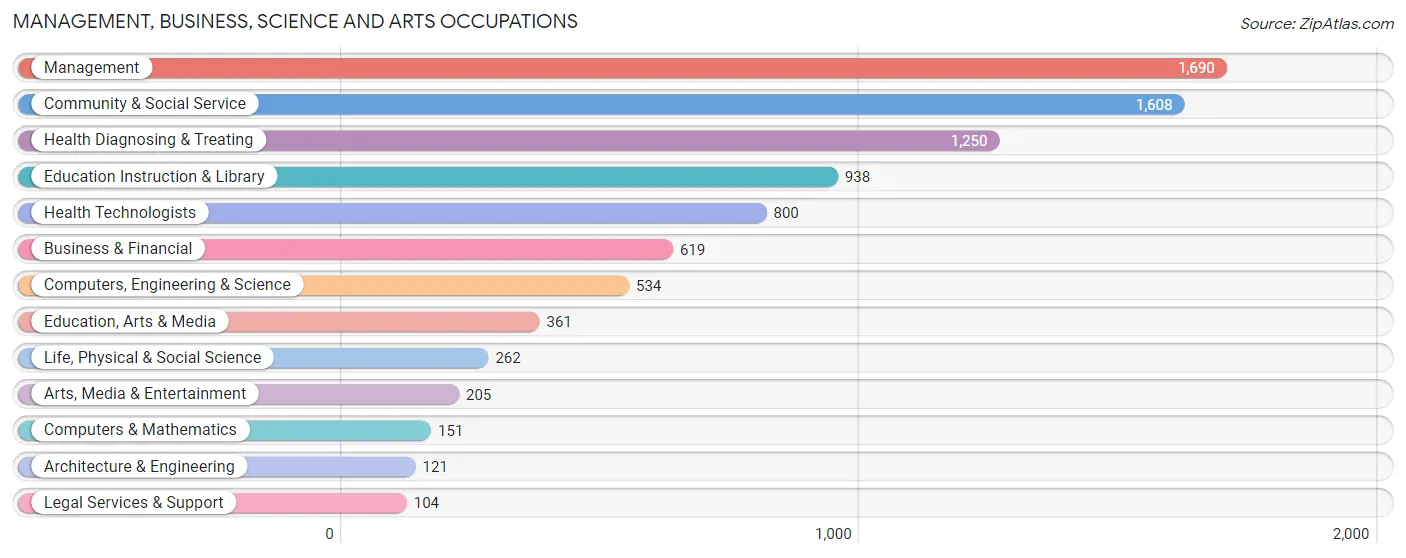
Management, Business, Science and Arts Occupations
The most common Management, Business, Science and Arts occupations in Oneida County are Management (1,690 | 10.1%), Community & Social Service (1,608 | 9.6%), Health Diagnosing & Treating (1,250 | 7.4%), Education Instruction & Library (938 | 5.6%), and Health Technologists (800 | 4.8%).
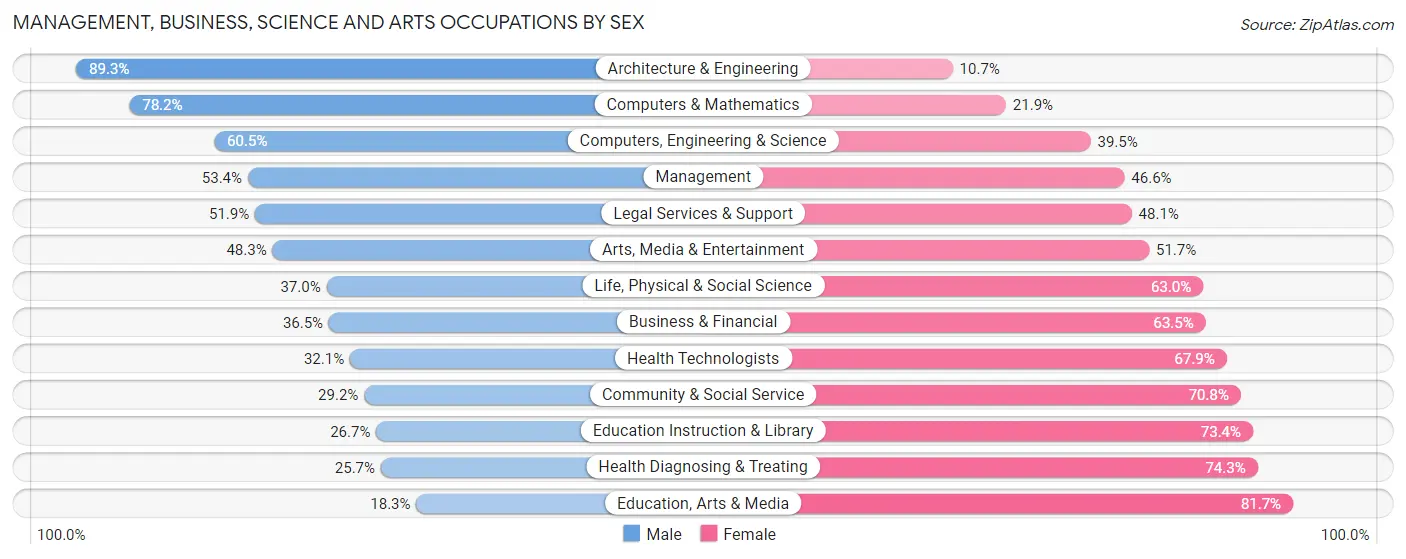
Management, Business, Science and Arts Occupations by Sex
Within the Management, Business, Science and Arts occupations in Oneida County, the most male-oriented occupations are Architecture & Engineering (89.3%), Computers & Mathematics (78.1%), and Computers, Engineering & Science (60.5%), while the most female-oriented occupations are Education, Arts & Media (81.7%), Health Diagnosing & Treating (74.3%), and Education Instruction & Library (73.4%).
| Occupation | Male | Female |
| Management | 903 (53.4%) | 787 (46.6%) |
| Business & Financial | 226 (36.5%) | 393 (63.5%) |
| Computers, Engineering & Science | 323 (60.5%) | 211 (39.5%) |
| Computers & Mathematics | 118 (78.1%) | 33 (21.8%) |
| Architecture & Engineering | 108 (89.3%) | 13 (10.7%) |
| Life, Physical & Social Science | 97 (37.0%) | 165 (63.0%) |
| Community & Social Service | 469 (29.2%) | 1,139 (70.8%) |
| Education, Arts & Media | 66 (18.3%) | 295 (81.7%) |
| Legal Services & Support | 54 (51.9%) | 50 (48.1%) |
| Education Instruction & Library | 250 (26.7%) | 688 (73.4%) |
| Arts, Media & Entertainment | 99 (48.3%) | 106 (51.7%) |
| Health Diagnosing & Treating | 321 (25.7%) | 929 (74.3%) |
| Health Technologists | 257 (32.1%) | 543 (67.9%) |
| Total (Category) | 2,242 (39.3%) | 3,459 (60.7%) |
| Total (Overall) | 8,688 (51.7%) | 8,121 (48.3%) |
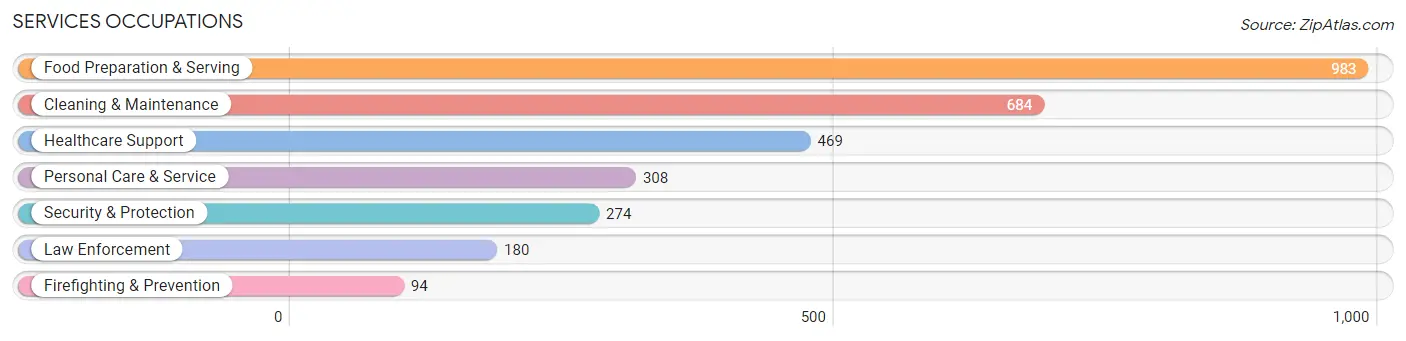
Services Occupations
The most common Services occupations in Oneida County are Food Preparation & Serving (983 | 5.9%), Cleaning & Maintenance (684 | 4.1%), Healthcare Support (469 | 2.8%), Personal Care & Service (308 | 1.8%), and Security & Protection (274 | 1.6%).
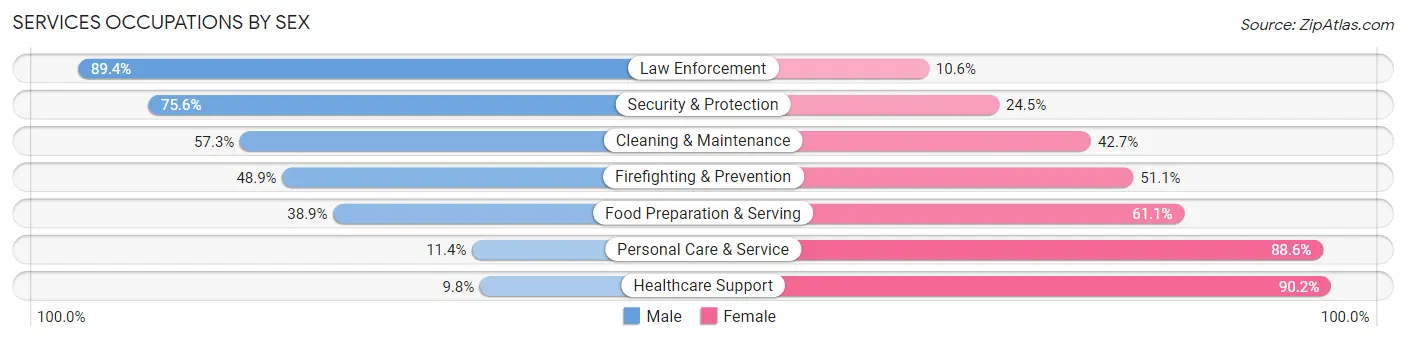
Services Occupations by Sex
Within the Services occupations in Oneida County, the most male-oriented occupations are Law Enforcement (89.4%), Security & Protection (75.5%), and Cleaning & Maintenance (57.3%), while the most female-oriented occupations are Healthcare Support (90.2%), Personal Care & Service (88.6%), and Food Preparation & Serving (61.1%).
| Occupation | Male | Female |
| Healthcare Support | 46 (9.8%) | 423 (90.2%) |
| Security & Protection | 207 (75.5%) | 67 (24.4%) |
| Firefighting & Prevention | 46 (48.9%) | 48 (51.1%) |
| Law Enforcement | 161 (89.4%) | 19 (10.6%) |
| Food Preparation & Serving | 382 (38.9%) | 601 (61.1%) |
| Cleaning & Maintenance | 392 (57.3%) | 292 (42.7%) |
| Personal Care & Service | 35 (11.4%) | 273 (88.6%) |
| Total (Category) | 1,062 (39.1%) | 1,656 (60.9%) |
| Total (Overall) | 8,688 (51.7%) | 8,121 (48.3%) |
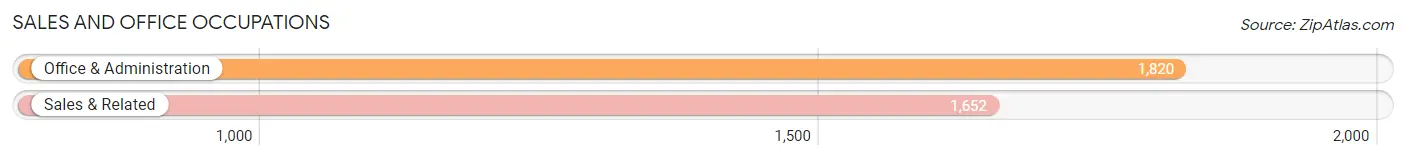
Sales and Office Occupations
The most common Sales and Office occupations in Oneida County are Office & Administration (1,820 | 10.8%), and Sales & Related (1,652 | 9.8%).
Sales and Office Occupations by Sex
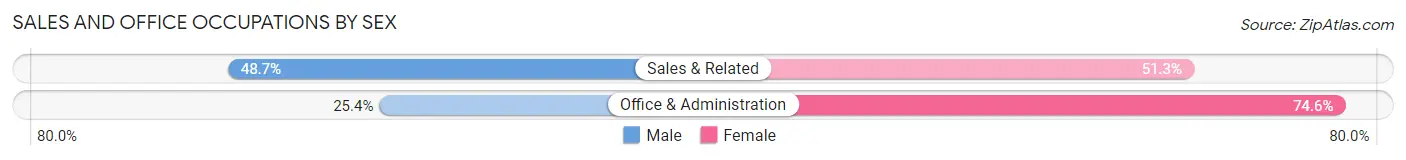
| Occupation | Male | Female |
| Sales & Related | 805 (48.7%) | 847 (51.3%) |
| Office & Administration | 463 (25.4%) | 1,357 (74.6%) |
| Total (Category) | 1,268 (36.5%) | 2,204 (63.5%) |
| Total (Overall) | 8,688 (51.7%) | 8,121 (48.3%) |
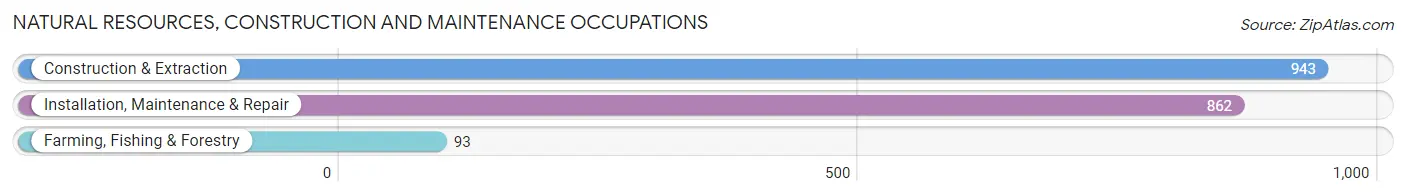
Natural Resources, Construction and Maintenance Occupations
The most common Natural Resources, Construction and Maintenance occupations in Oneida County are Construction & Extraction (943 | 5.6%), Installation, Maintenance & Repair (862 | 5.1%), and Farming, Fishing & Forestry (93 | 0.5%).
Natural Resources, Construction and Maintenance Occupations by Sex
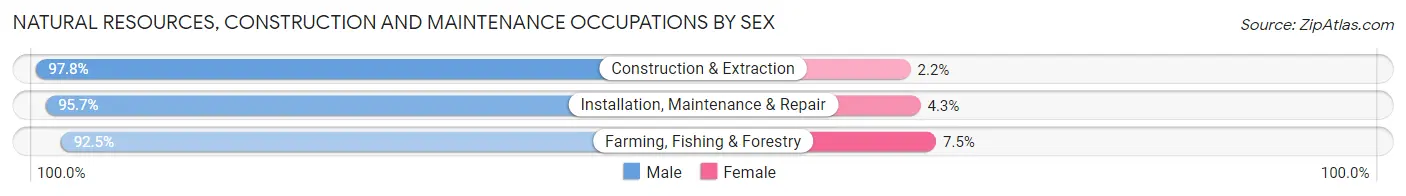
| Occupation | Male | Female |
| Farming, Fishing & Forestry | 86 (92.5%) | 7 (7.5%) |
| Construction & Extraction | 922 (97.8%) | 21 (2.2%) |
| Installation, Maintenance & Repair | 825 (95.7%) | 37 (4.3%) |
| Total (Category) | 1,833 (96.6%) | 65 (3.4%) |
| Total (Overall) | 8,688 (51.7%) | 8,121 (48.3%) |
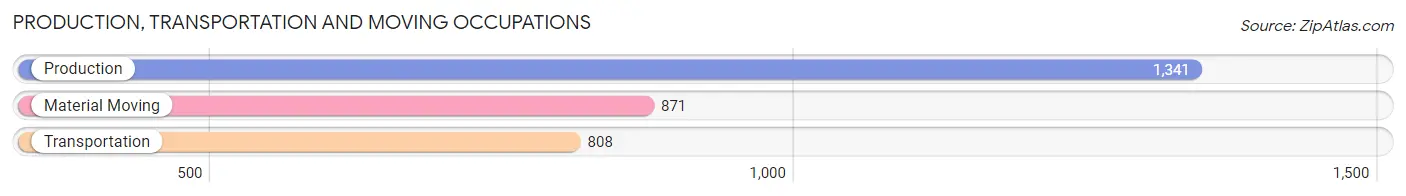
Production, Transportation and Moving Occupations
The most common Production, Transportation and Moving occupations in Oneida County are Production (1,341 | 8.0%), Material Moving (871 | 5.2%), and Transportation (808 | 4.8%).
Production, Transportation and Moving Occupations by Sex
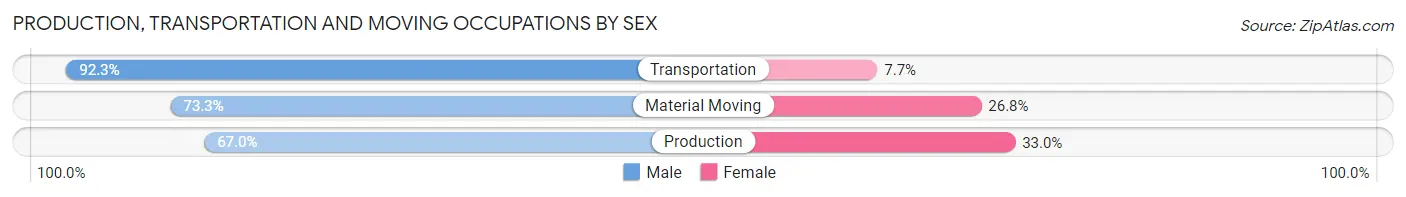
| Occupation | Male | Female |
| Production | 899 (67.0%) | 442 (33.0%) |
| Transportation | 746 (92.3%) | 62 (7.7%) |
| Material Moving | 638 (73.3%) | 233 (26.8%) |
| Total (Category) | 2,283 (75.6%) | 737 (24.4%) |
| Total (Overall) | 8,688 (51.7%) | 8,121 (48.3%) |
Employment Industries by Sex in Oneida County
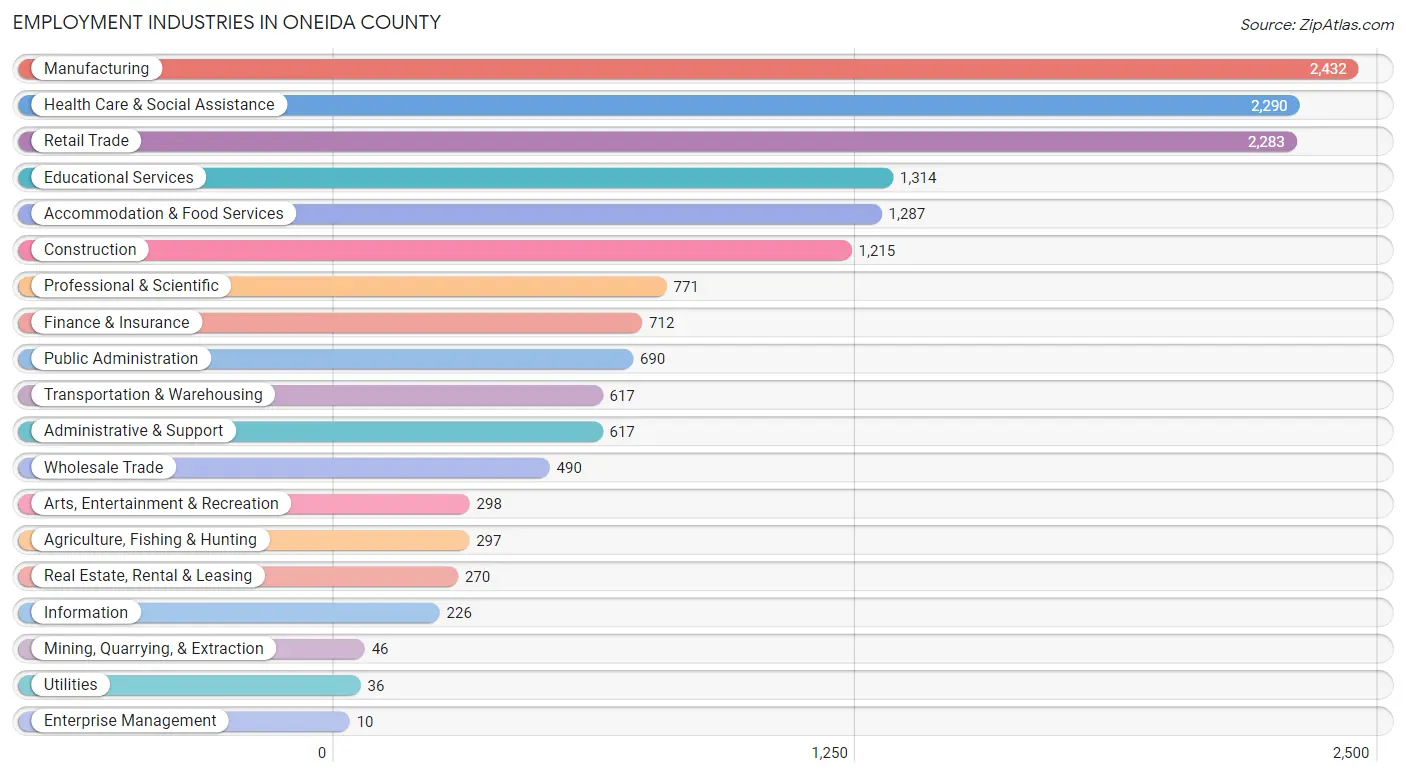
Employment Industries in Oneida County
The major employment industries in Oneida County include Manufacturing (2,432 | 14.5%), Health Care & Social Assistance (2,290 | 13.6%), Retail Trade (2,283 | 13.6%), Educational Services (1,314 | 7.8%), and Accommodation & Food Services (1,287 | 7.7%).
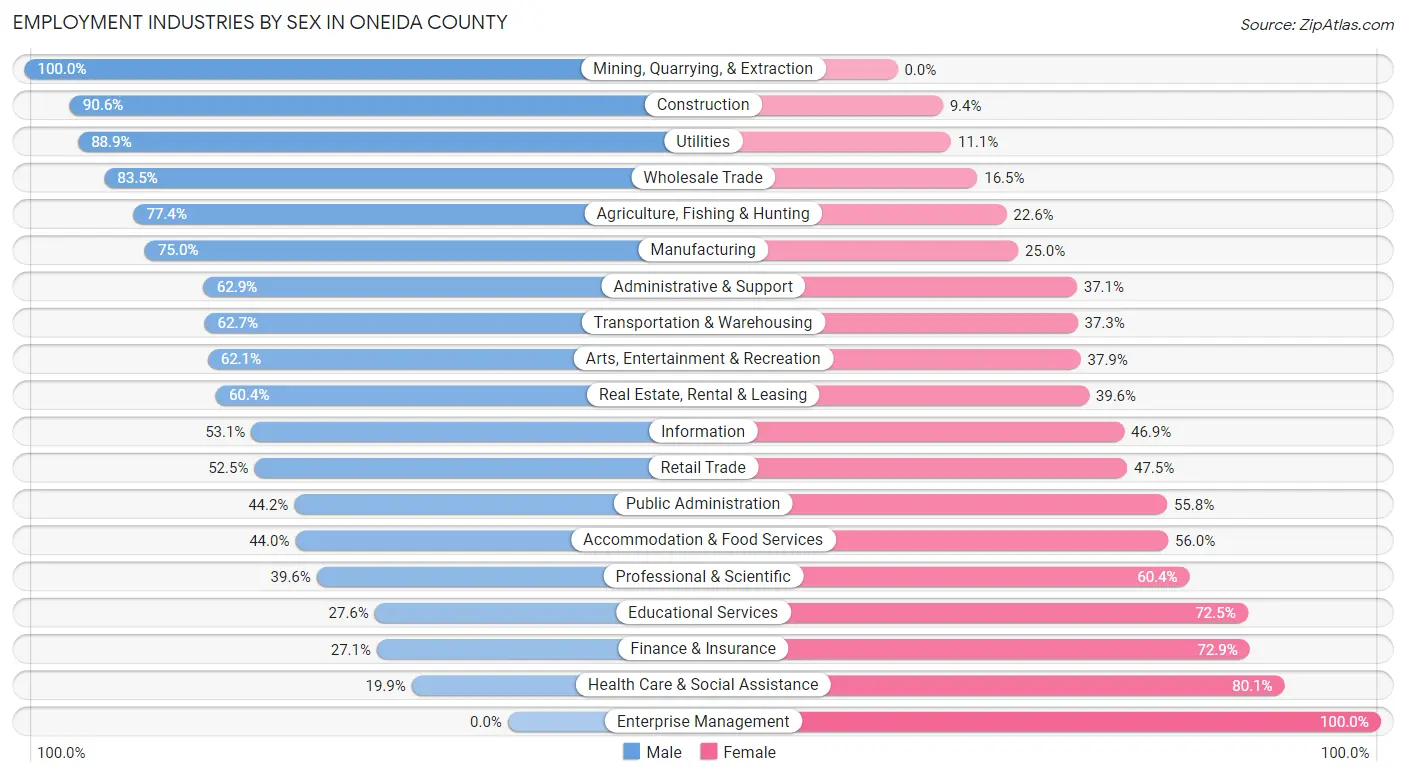
Employment Industries by Sex in Oneida County
The Oneida County industries that see more men than women are Mining, Quarrying, & Extraction (100.0%), Construction (90.6%), and Utilities (88.9%), whereas the industries that tend to have a higher number of women are Enterprise Management (100.0%), Health Care & Social Assistance (80.1%), and Finance & Insurance (72.9%).
| Industry | Male | Female |
| Agriculture, Fishing & Hunting | 230 (77.4%) | 67 (22.6%) |
| Mining, Quarrying, & Extraction | 46 (100.0%) | 0 (0.0%) |
| Construction | 1,101 (90.6%) | 114 (9.4%) |
| Manufacturing | 1,825 (75.0%) | 607 (25.0%) |
| Wholesale Trade | 409 (83.5%) | 81 (16.5%) |
| Retail Trade | 1,198 (52.5%) | 1,085 (47.5%) |
| Transportation & Warehousing | 387 (62.7%) | 230 (37.3%) |
| Utilities | 32 (88.9%) | 4 (11.1%) |
| Information | 120 (53.1%) | 106 (46.9%) |
| Finance & Insurance | 193 (27.1%) | 519 (72.9%) |
| Real Estate, Rental & Leasing | 163 (60.4%) | 107 (39.6%) |
| Professional & Scientific | 305 (39.6%) | 466 (60.4%) |
| Enterprise Management | 0 (0.0%) | 10 (100.0%) |
| Administrative & Support | 388 (62.9%) | 229 (37.1%) |
| Educational Services | 362 (27.6%) | 952 (72.5%) |
| Health Care & Social Assistance | 456 (19.9%) | 1,834 (80.1%) |
| Arts, Entertainment & Recreation | 185 (62.1%) | 113 (37.9%) |
| Accommodation & Food Services | 566 (44.0%) | 721 (56.0%) |
| Public Administration | 305 (44.2%) | 385 (55.8%) |
| Total | 8,688 (51.7%) | 8,121 (48.3%) |
Education in Oneida County
School Enrollment in Oneida County
The most common levels of schooling among the 6,319 students in Oneida County are high school (1,845 | 29.2%), middle school (1,657 | 26.2%), and elementary school (1,157 | 18.3%).
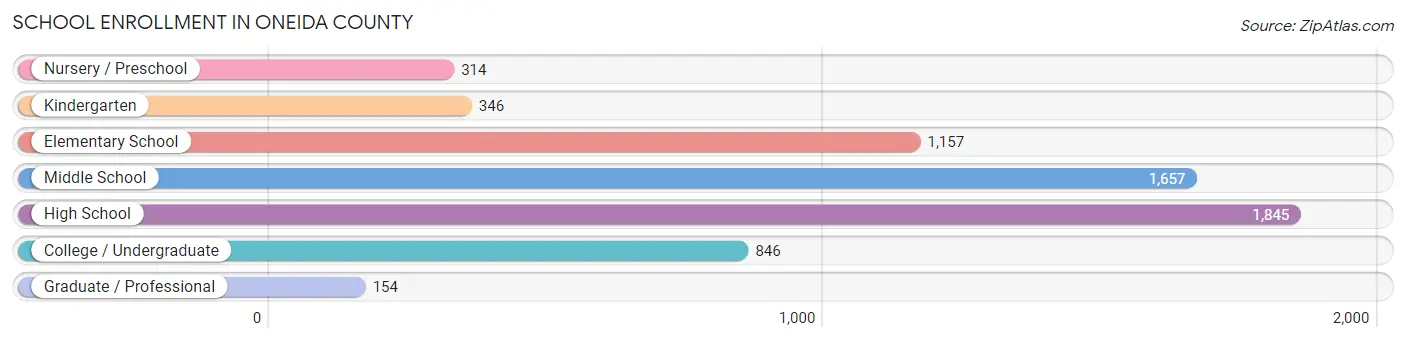
| School Level | # Students | % Students |
| Nursery / Preschool | 314 | 5.0% |
| Kindergarten | 346 | 5.5% |
| Elementary School | 1,157 | 18.3% |
| Middle School | 1,657 | 26.2% |
| High School | 1,845 | 29.2% |
| College / Undergraduate | 846 | 13.4% |
| Graduate / Professional | 154 | 2.4% |
| Total | 6,319 | 100.0% |
School Enrollment by Age by Funding Source in Oneida County
Out of a total of 6,319 students who are enrolled in schools in Oneida County, 916 (14.5%) attend a private institution, while the remaining 5,403 (85.5%) are enrolled in public schools. The age group of 10 to 14 year olds has the highest likelihood of being enrolled in private schools, with 377 (18.6% in the age bracket) enrolled. Conversely, the age group of 15 to 17 year olds has the lowest likelihood of being enrolled in a private school, with 1,157 (94.5% in the age bracket) attending a public institution.
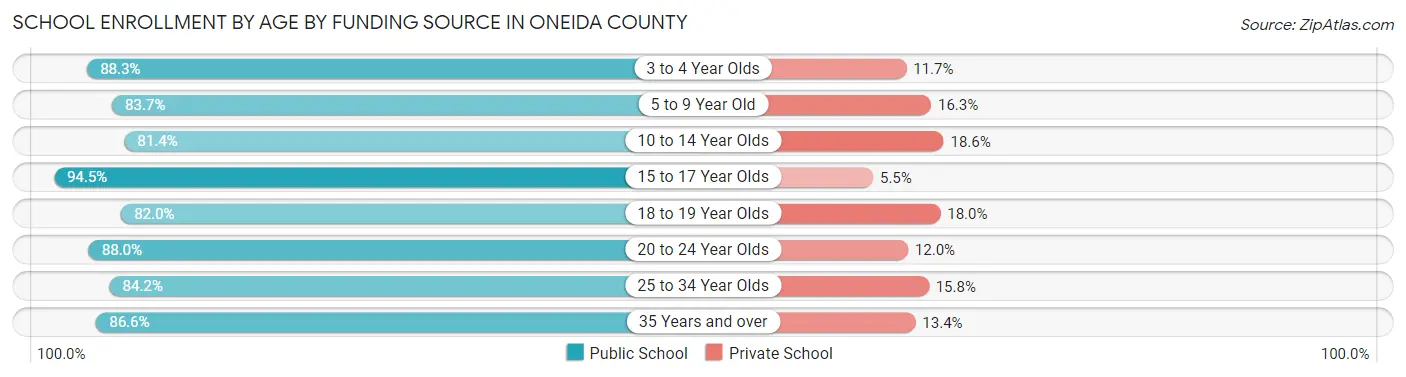
| Age Bracket | Public School | Private School |
| 3 to 4 Year Olds | 212 (88.3%) | 28 (11.7%) |
| 5 to 9 Year Old | 1,234 (83.7%) | 240 (16.3%) |
| 10 to 14 Year Olds | 1,650 (81.4%) | 377 (18.6%) |
| 15 to 17 Year Olds | 1,157 (94.5%) | 67 (5.5%) |
| 18 to 19 Year Olds | 442 (82.0%) | 97 (18.0%) |
| 20 to 24 Year Olds | 309 (88.0%) | 42 (12.0%) |
| 25 to 34 Year Olds | 170 (84.2%) | 32 (15.8%) |
| 35 Years and over | 227 (86.6%) | 35 (13.4%) |
| Total | 5,403 (85.5%) | 916 (14.5%) |
Educational Attainment by Field of Study in Oneida County
Education (1,814 | 21.1%), business (1,293 | 15.1%), bio, nature & agricultural (1,139 | 13.3%), science & technology (969 | 11.3%), and social sciences (509 | 5.9%) are the most common fields of study among 8,575 individuals in Oneida County who have obtained a bachelor's degree or higher.
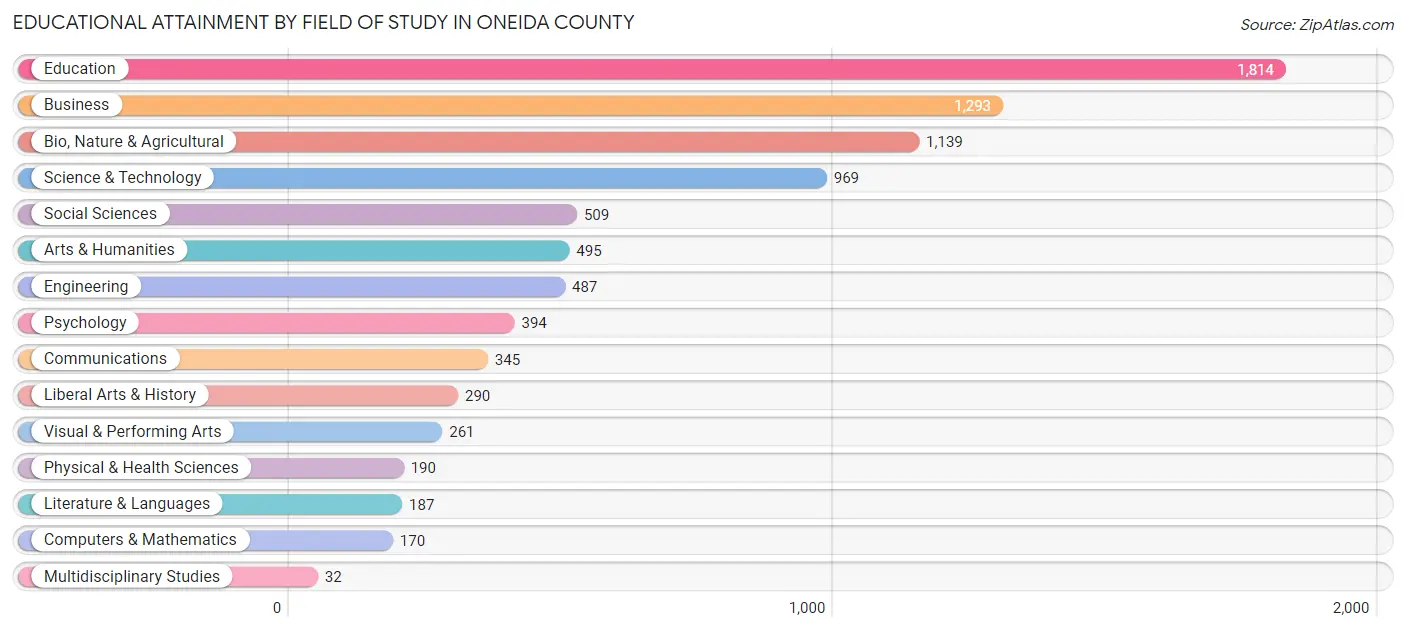
| Field of Study | # Graduates | % Graduates |
| Computers & Mathematics | 170 | 2.0% |
| Bio, Nature & Agricultural | 1,139 | 13.3% |
| Physical & Health Sciences | 190 | 2.2% |
| Psychology | 394 | 4.6% |
| Social Sciences | 509 | 5.9% |
| Engineering | 487 | 5.7% |
| Multidisciplinary Studies | 32 | 0.4% |
| Science & Technology | 969 | 11.3% |
| Business | 1,293 | 15.1% |
| Education | 1,814 | 21.1% |
| Literature & Languages | 187 | 2.2% |
| Liberal Arts & History | 290 | 3.4% |
| Visual & Performing Arts | 261 | 3.0% |
| Communications | 345 | 4.0% |
| Arts & Humanities | 495 | 5.8% |
| Total | 8,575 | 100.0% |
Transportation & Commute in Oneida County
Vehicle Availability by Sex in Oneida County
The most prevalent vehicle ownership categories in Oneida County are males with 2 vehicles (4,215, accounting for 49.3%) and females with 2 vehicles (4,024, making up 53.0%).
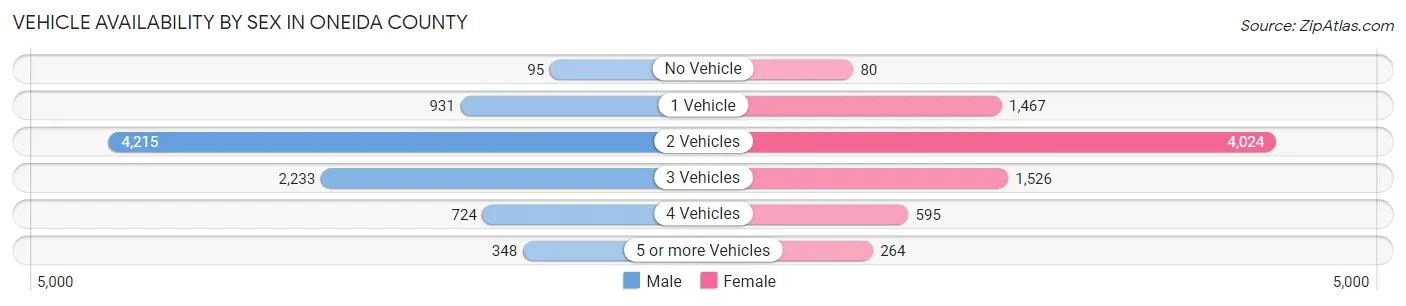
| Vehicles Available | Male | Female |
| No Vehicle | 95 (1.1%) | 80 (1.0%) |
| 1 Vehicle | 931 (10.9%) | 1,467 (18.4%) |
| 2 Vehicles | 4,215 (49.3%) | 4,024 (50.6%) |
| 3 Vehicles | 2,233 (26.1%) | 1,526 (19.2%) |
| 4 Vehicles | 724 (8.5%) | 595 (7.5%) |
| 5 or more Vehicles | 348 (4.1%) | 264 (3.3%) |
| Total | 8,546 (100.0%) | 7,956 (100.0%) |
Commute Time in Oneida County
The most frequently occuring commute durations in Oneida County are 10 to 14 minutes (3,208 commuters, 21.1%), 15 to 19 minutes (2,666 commuters, 17.5%), and 5 to 9 minutes (2,649 commuters, 17.4%).
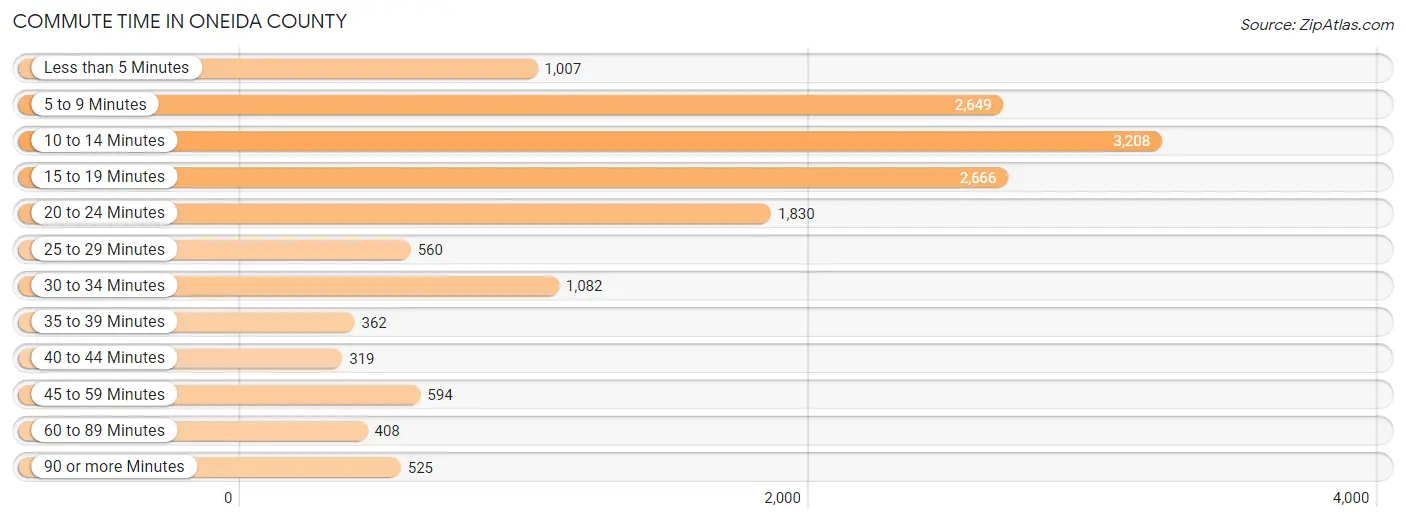
| Commute Time | # Commuters | % Commuters |
| Less than 5 Minutes | 1,007 | 6.6% |
| 5 to 9 Minutes | 2,649 | 17.4% |
| 10 to 14 Minutes | 3,208 | 21.1% |
| 15 to 19 Minutes | 2,666 | 17.5% |
| 20 to 24 Minutes | 1,830 | 12.0% |
| 25 to 29 Minutes | 560 | 3.7% |
| 30 to 34 Minutes | 1,082 | 7.1% |
| 35 to 39 Minutes | 362 | 2.4% |
| 40 to 44 Minutes | 319 | 2.1% |
| 45 to 59 Minutes | 594 | 3.9% |
| 60 to 89 Minutes | 408 | 2.7% |
| 90 or more Minutes | 525 | 3.5% |
Commute Time by Sex in Oneida County
The most common commute times in Oneida County are 10 to 14 minutes (1,514 commuters, 19.1%) for males and 10 to 14 minutes (1,694 commuters, 23.3%) for females.
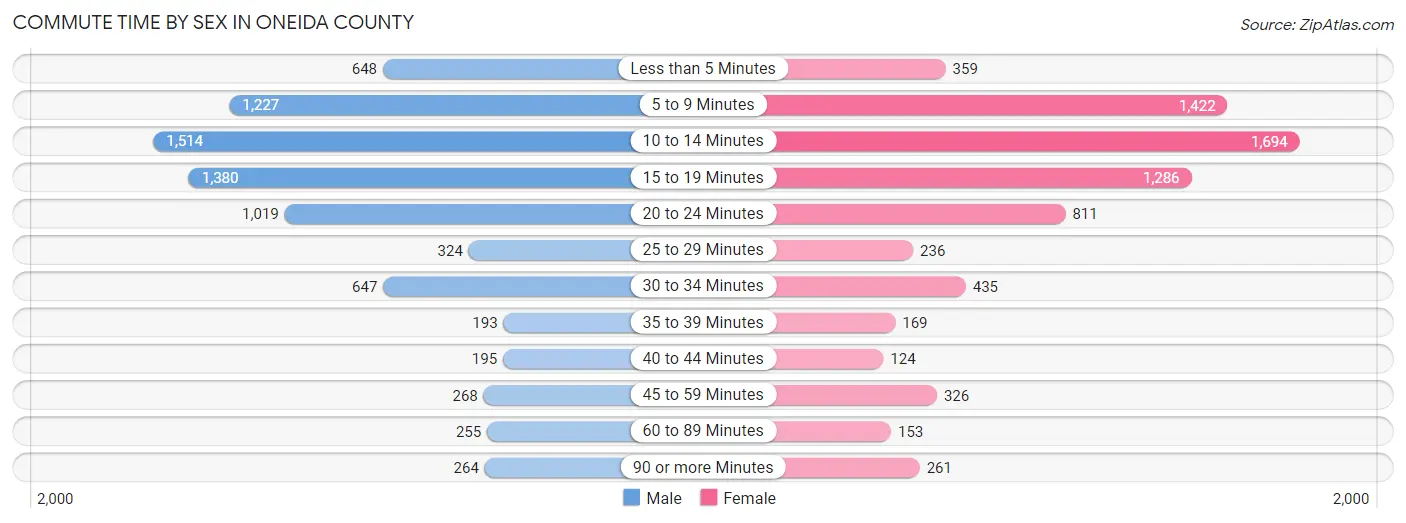
| Commute Time | Male | Female |
| Less than 5 Minutes | 648 (8.2%) | 359 (4.9%) |
| 5 to 9 Minutes | 1,227 (15.5%) | 1,422 (19.5%) |
| 10 to 14 Minutes | 1,514 (19.1%) | 1,694 (23.3%) |
| 15 to 19 Minutes | 1,380 (17.4%) | 1,286 (17.7%) |
| 20 to 24 Minutes | 1,019 (12.8%) | 811 (11.2%) |
| 25 to 29 Minutes | 324 (4.1%) | 236 (3.2%) |
| 30 to 34 Minutes | 647 (8.2%) | 435 (6.0%) |
| 35 to 39 Minutes | 193 (2.4%) | 169 (2.3%) |
| 40 to 44 Minutes | 195 (2.5%) | 124 (1.7%) |
| 45 to 59 Minutes | 268 (3.4%) | 326 (4.5%) |
| 60 to 89 Minutes | 255 (3.2%) | 153 (2.1%) |
| 90 or more Minutes | 264 (3.3%) | 261 (3.6%) |
Time of Departure to Work by Sex in Oneida County
The most frequent times of departure to work in Oneida County are 7:00 AM to 7:29 AM (1,253, 15.8%) for males and 7:30 AM to 7:59 AM (1,185, 16.3%) for females.
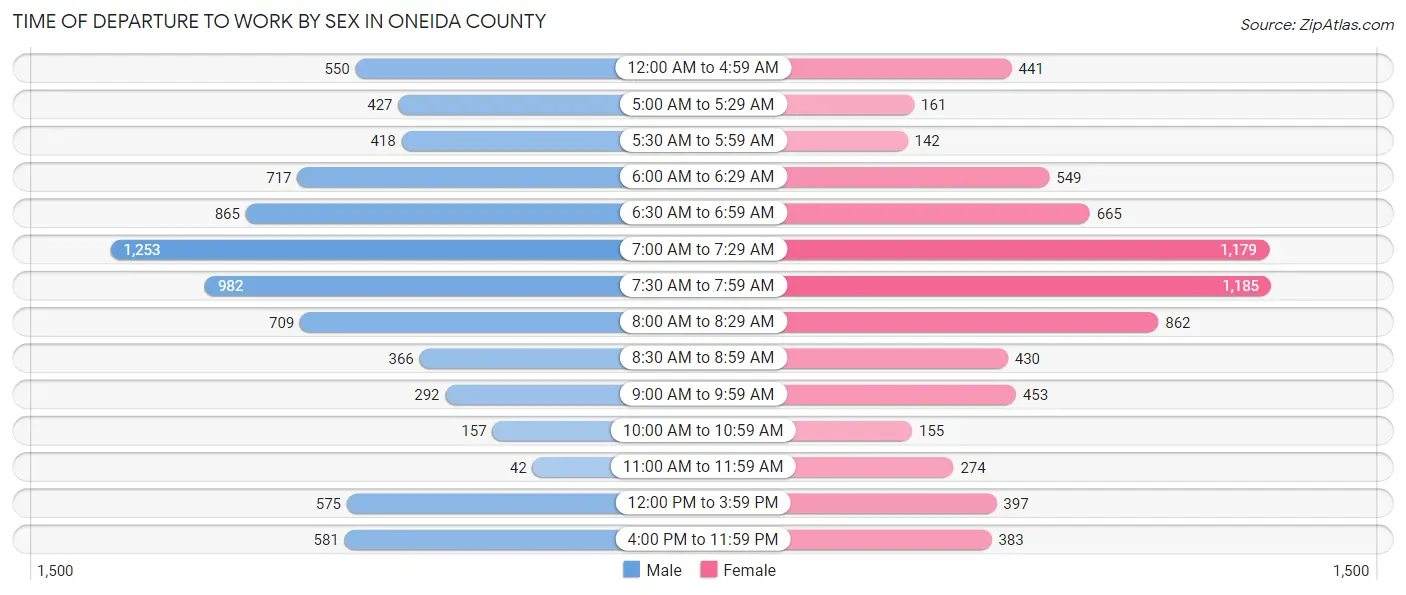
| Time of Departure | Male | Female |
| 12:00 AM to 4:59 AM | 550 (6.9%) | 441 (6.1%) |
| 5:00 AM to 5:29 AM | 427 (5.4%) | 161 (2.2%) |
| 5:30 AM to 5:59 AM | 418 (5.3%) | 142 (1.9%) |
| 6:00 AM to 6:29 AM | 717 (9.0%) | 549 (7.5%) |
| 6:30 AM to 6:59 AM | 865 (10.9%) | 665 (9.1%) |
| 7:00 AM to 7:29 AM | 1,253 (15.8%) | 1,179 (16.2%) |
| 7:30 AM to 7:59 AM | 982 (12.4%) | 1,185 (16.3%) |
| 8:00 AM to 8:29 AM | 709 (8.9%) | 862 (11.8%) |
| 8:30 AM to 8:59 AM | 366 (4.6%) | 430 (5.9%) |
| 9:00 AM to 9:59 AM | 292 (3.7%) | 453 (6.2%) |
| 10:00 AM to 10:59 AM | 157 (2.0%) | 155 (2.1%) |
| 11:00 AM to 11:59 AM | 42 (0.5%) | 274 (3.8%) |
| 12:00 PM to 3:59 PM | 575 (7.2%) | 397 (5.5%) |
| 4:00 PM to 11:59 PM | 581 (7.3%) | 383 (5.3%) |
| Total | 7,934 (100.0%) | 7,276 (100.0%) |
Housing Occupancy in Oneida County
Occupancy by Ownership in Oneida County
Of the total 16,417 dwellings in Oneida County, owner-occupied units account for 13,558 (82.6%), while renter-occupied units make up 2,859 (17.4%).
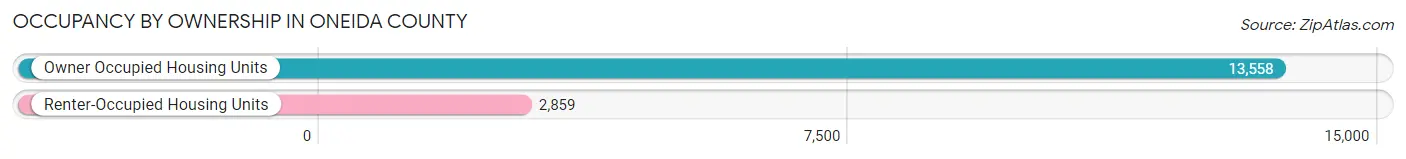
| Occupancy | # Housing Units | % Housing Units |
| Owner Occupied Housing Units | 13,558 | 82.6% |
| Renter-Occupied Housing Units | 2,859 | 17.4% |
| Total Occupied Housing Units | 16,417 | 100.0% |
Occupancy by Household Size in Oneida County
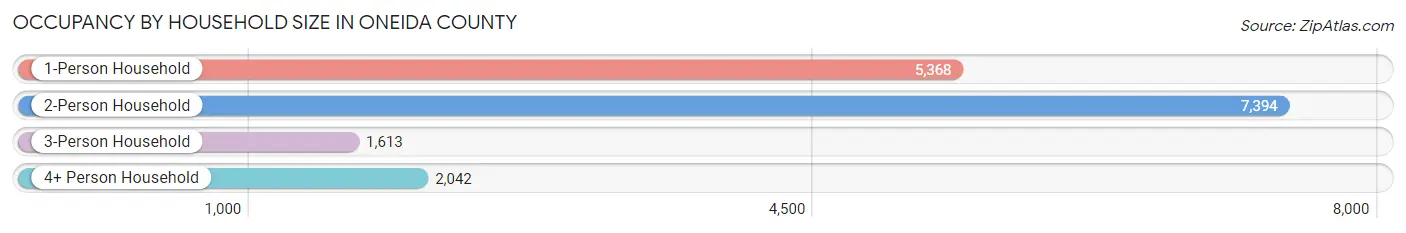
| Household Size | # Housing Units | % Housing Units |
| 1-Person Household | 5,368 | 32.7% |
| 2-Person Household | 7,394 | 45.0% |
| 3-Person Household | 1,613 | 9.8% |
| 4+ Person Household | 2,042 | 12.4% |
| Total Housing Units | 16,417 | 100.0% |
Occupancy by Ownership by Household Size in Oneida County
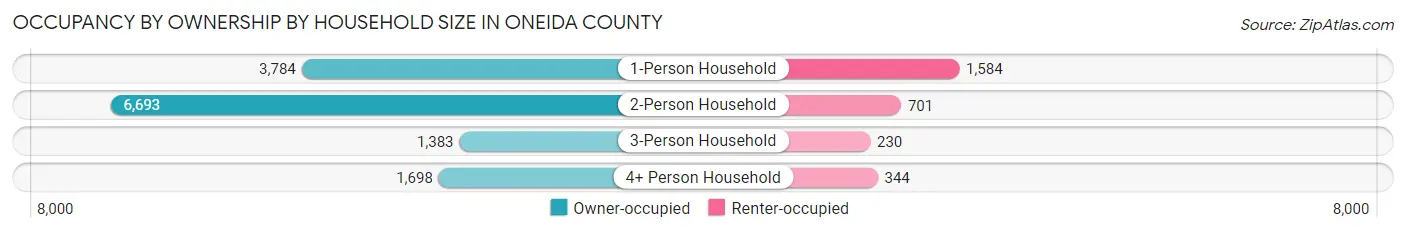
| Household Size | Owner-occupied | Renter-occupied |
| 1-Person Household | 3,784 (70.5%) | 1,584 (29.5%) |
| 2-Person Household | 6,693 (90.5%) | 701 (9.5%) |
| 3-Person Household | 1,383 (85.7%) | 230 (14.3%) |
| 4+ Person Household | 1,698 (83.2%) | 344 (16.9%) |
| Total Housing Units | 13,558 (82.6%) | 2,859 (17.4%) |
Occupancy by Educational Attainment in Oneida County
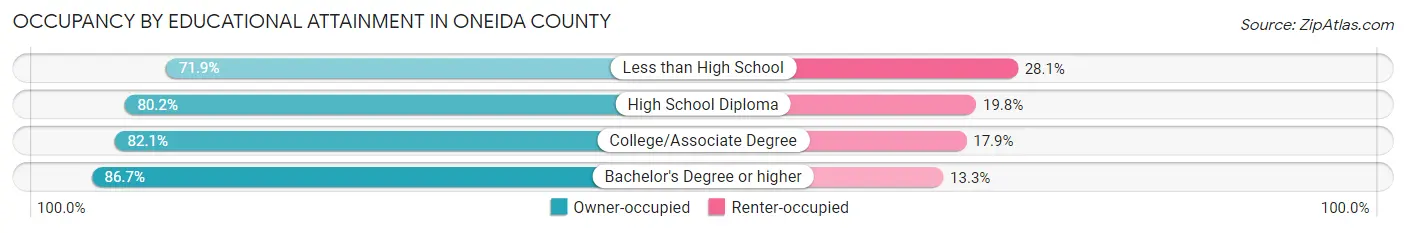
| Household Size | Owner-occupied | Renter-occupied |
| Less than High School | 518 (71.9%) | 202 (28.1%) |
| High School Diploma | 3,640 (80.2%) | 899 (19.8%) |
| College/Associate Degree | 4,954 (82.1%) | 1,077 (17.9%) |
| Bachelor's Degree or higher | 4,446 (86.7%) | 681 (13.3%) |
Occupancy by Age of Householder in Oneida County
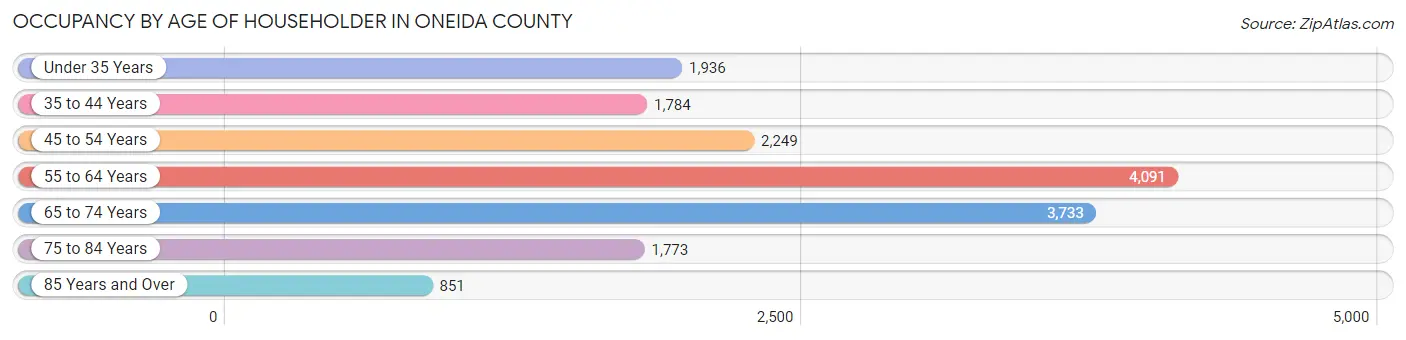
| Age Bracket | # Households | % Households |
| Under 35 Years | 1,936 | 11.8% |
| 35 to 44 Years | 1,784 | 10.9% |
| 45 to 54 Years | 2,249 | 13.7% |
| 55 to 64 Years | 4,091 | 24.9% |
| 65 to 74 Years | 3,733 | 22.7% |
| 75 to 84 Years | 1,773 | 10.8% |
| 85 Years and Over | 851 | 5.2% |
| Total | 16,417 | 100.0% |
Housing Finances in Oneida County
Median Income by Occupancy in Oneida County
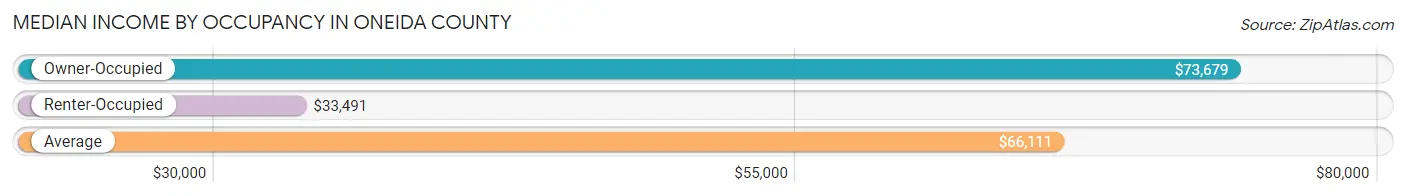
| Occupancy Type | # Households | Median Income |
| Owner-Occupied | 13,558 (82.6%) | $73,679 |
| Renter-Occupied | 2,859 (17.4%) | $33,491 |
| Average | 16,417 (100.0%) | $66,111 |
Occupancy by Householder Income Bracket in Oneida County
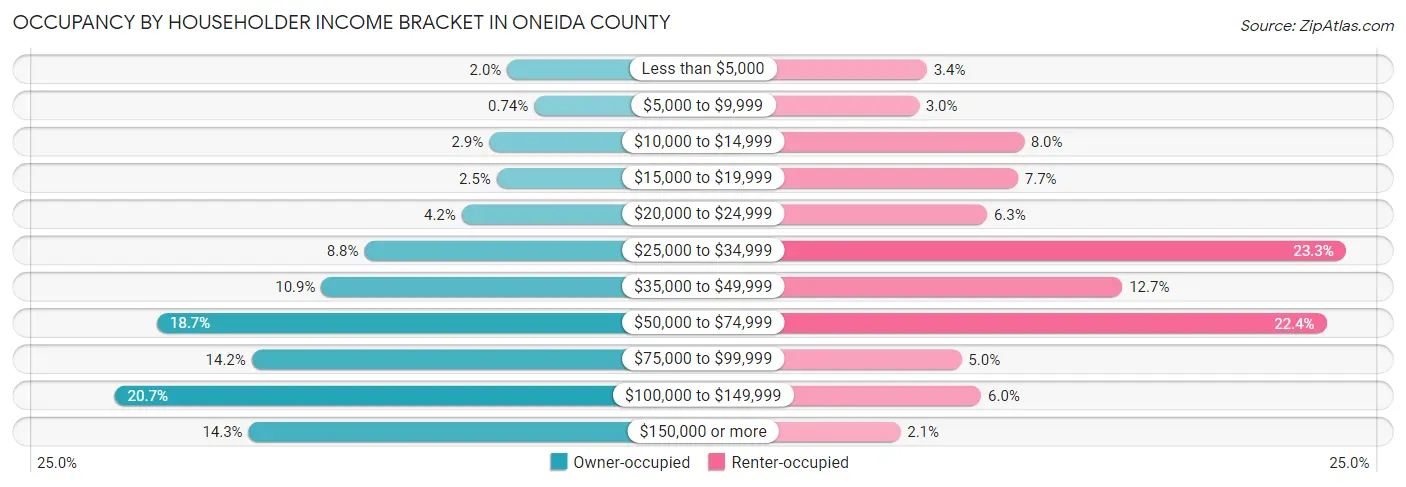
| Income Bracket | Owner-occupied | Renter-occupied |
| Less than $5,000 | 274 (2.0%) | 97 (3.4%) |
| $5,000 to $9,999 | 101 (0.7%) | 86 (3.0%) |
| $10,000 to $14,999 | 391 (2.9%) | 229 (8.0%) |
| $15,000 to $19,999 | 342 (2.5%) | 221 (7.7%) |
| $20,000 to $24,999 | 568 (4.2%) | 179 (6.3%) |
| $25,000 to $34,999 | 1,196 (8.8%) | 667 (23.3%) |
| $35,000 to $49,999 | 1,474 (10.9%) | 363 (12.7%) |
| $50,000 to $74,999 | 2,536 (18.7%) | 641 (22.4%) |
| $75,000 to $99,999 | 1,924 (14.2%) | 144 (5.0%) |
| $100,000 to $149,999 | 2,808 (20.7%) | 171 (6.0%) |
| $150,000 or more | 1,944 (14.3%) | 61 (2.1%) |
| Total | 13,558 (100.0%) | 2,859 (100.0%) |
Monthly Housing Cost Tiers in Oneida County
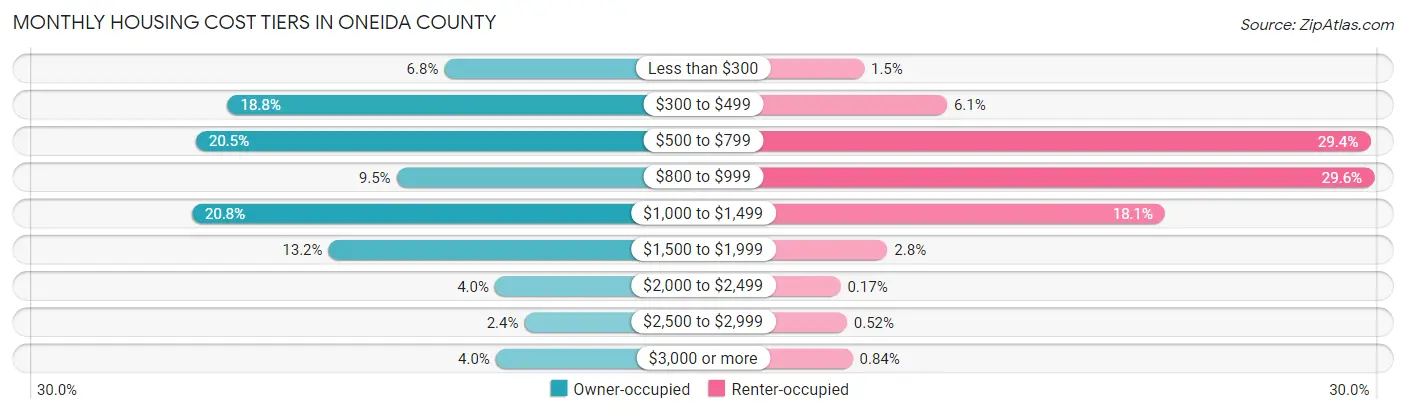
| Monthly Cost | Owner-occupied | Renter-occupied |
| Less than $300 | 925 (6.8%) | 42 (1.5%) |
| $300 to $499 | 2,547 (18.8%) | 173 (6.0%) |
| $500 to $799 | 2,785 (20.5%) | 841 (29.4%) |
| $800 to $999 | 1,282 (9.5%) | 847 (29.6%) |
| $1,000 to $1,499 | 2,815 (20.8%) | 517 (18.1%) |
| $1,500 to $1,999 | 1,792 (13.2%) | 79 (2.8%) |
| $2,000 to $2,499 | 547 (4.0%) | 5 (0.2%) |
| $2,500 to $2,999 | 326 (2.4%) | 15 (0.5%) |
| $3,000 or more | 539 (4.0%) | 24 (0.8%) |
| Total | 13,558 (100.0%) | 2,859 (100.0%) |
Physical Housing Characteristics in Oneida County
Housing Structures in Oneida County
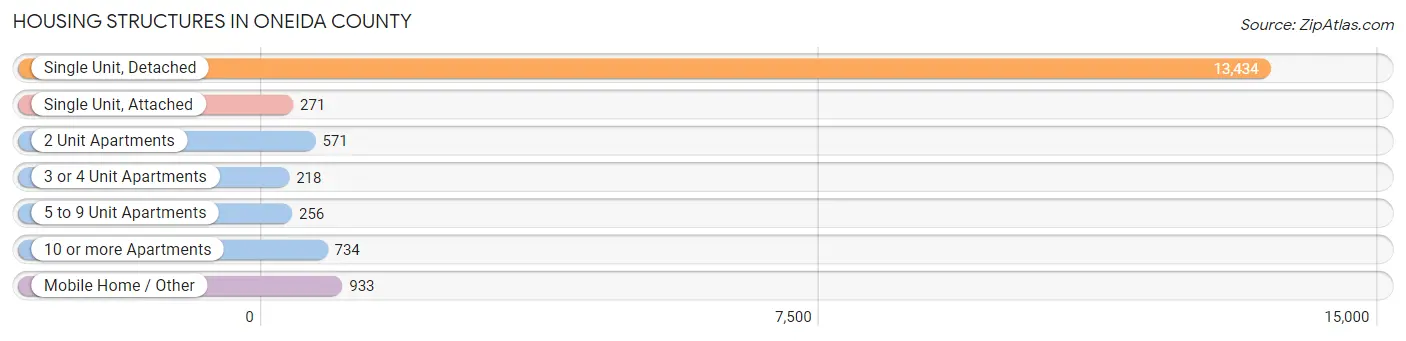
| Structure Type | # Housing Units | % Housing Units |
| Single Unit, Detached | 13,434 | 81.8% |
| Single Unit, Attached | 271 | 1.7% |
| 2 Unit Apartments | 571 | 3.5% |
| 3 or 4 Unit Apartments | 218 | 1.3% |
| 5 to 9 Unit Apartments | 256 | 1.6% |
| 10 or more Apartments | 734 | 4.5% |
| Mobile Home / Other | 933 | 5.7% |
| Total | 16,417 | 100.0% |
Housing Structures by Occupancy in Oneida County
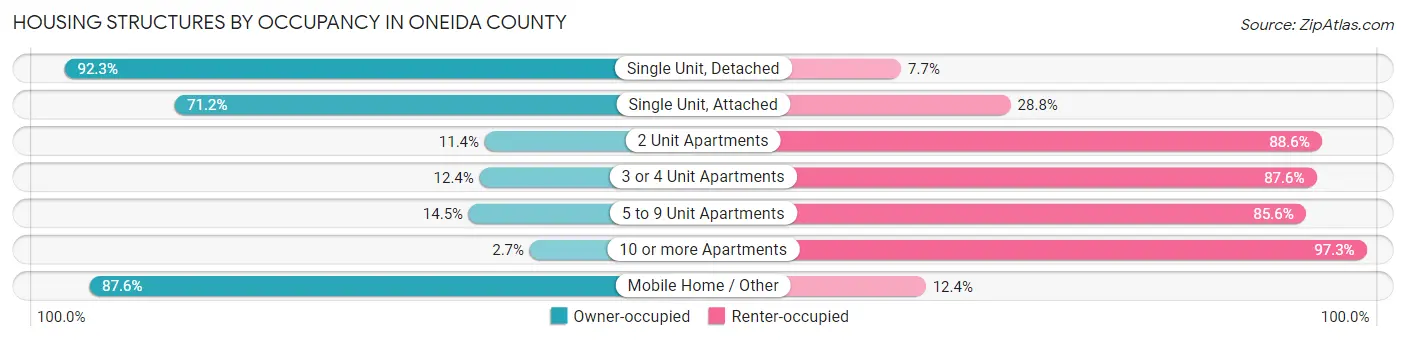
| Structure Type | Owner-occupied | Renter-occupied |
| Single Unit, Detached | 12,399 (92.3%) | 1,035 (7.7%) |
| Single Unit, Attached | 193 (71.2%) | 78 (28.8%) |
| 2 Unit Apartments | 65 (11.4%) | 506 (88.6%) |
| 3 or 4 Unit Apartments | 27 (12.4%) | 191 (87.6%) |
| 5 to 9 Unit Apartments | 37 (14.4%) | 219 (85.6%) |
| 10 or more Apartments | 20 (2.7%) | 714 (97.3%) |
| Mobile Home / Other | 817 (87.6%) | 116 (12.4%) |
| Total | 13,558 (82.6%) | 2,859 (17.4%) |
Housing Structures by Number of Rooms in Oneida County
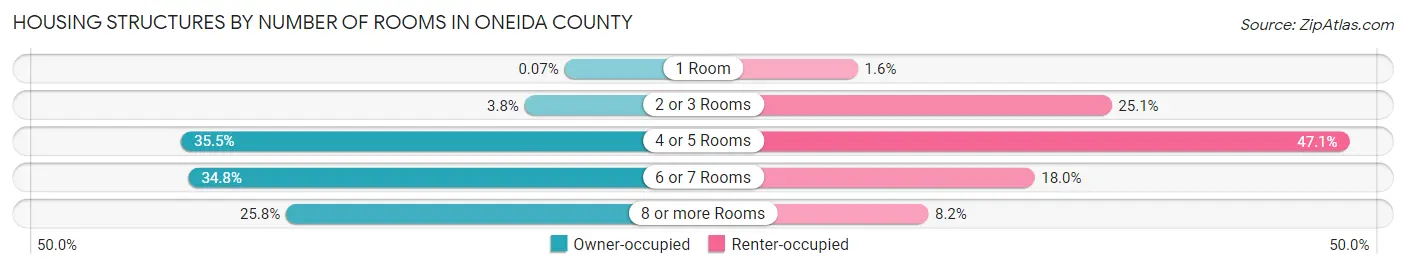
| Number of Rooms | Owner-occupied | Renter-occupied |
| 1 Room | 9 (0.1%) | 47 (1.6%) |
| 2 or 3 Rooms | 508 (3.7%) | 718 (25.1%) |
| 4 or 5 Rooms | 4,816 (35.5%) | 1,347 (47.1%) |
| 6 or 7 Rooms | 4,724 (34.8%) | 514 (18.0%) |
| 8 or more Rooms | 3,501 (25.8%) | 233 (8.2%) |
| Total | 13,558 (100.0%) | 2,859 (100.0%) |
Housing Structure by Heating Type in Oneida County
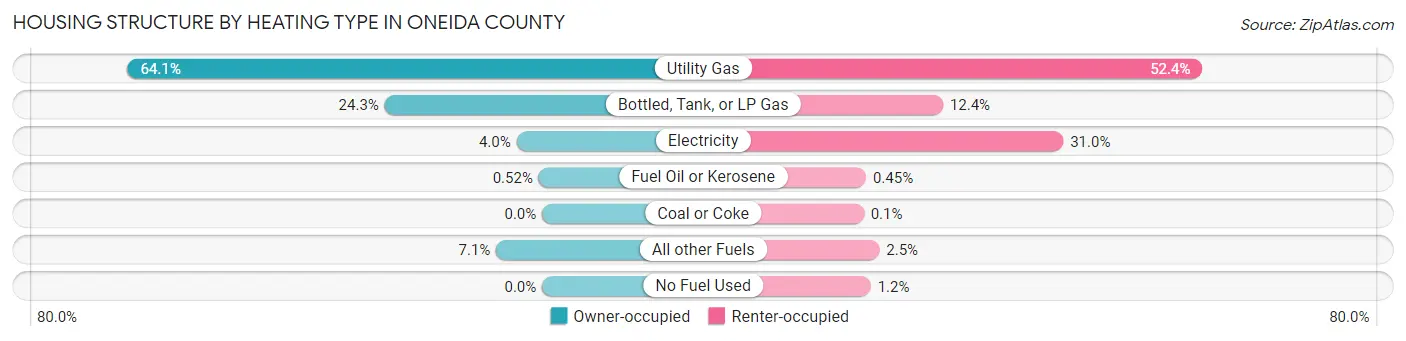
| Heating Type | Owner-occupied | Renter-occupied |
| Utility Gas | 8,690 (64.1%) | 1,499 (52.4%) |
| Bottled, Tank, or LP Gas | 3,300 (24.3%) | 353 (12.3%) |
| Electricity | 536 (4.0%) | 885 (30.9%) |
| Fuel Oil or Kerosene | 70 (0.5%) | 13 (0.4%) |
| Coal or Coke | 0 (0.0%) | 3 (0.1%) |
| All other Fuels | 962 (7.1%) | 72 (2.5%) |
| No Fuel Used | 0 (0.0%) | 34 (1.2%) |
| Total | 13,558 (100.0%) | 2,859 (100.0%) |
Household Vehicle Usage in Oneida County
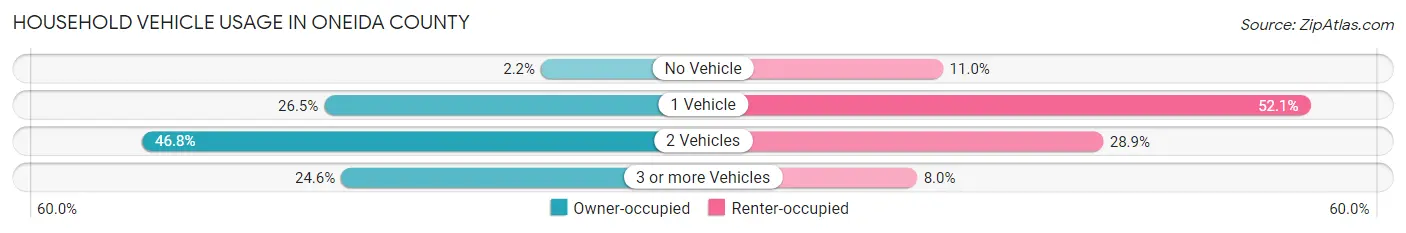
| Vehicles per Household | Owner-occupied | Renter-occupied |
| No Vehicle | 294 (2.2%) | 313 (11.0%) |
| 1 Vehicle | 3,586 (26.5%) | 1,490 (52.1%) |
| 2 Vehicles | 6,349 (46.8%) | 826 (28.9%) |
| 3 or more Vehicles | 3,329 (24.5%) | 230 (8.0%) |
| Total | 13,558 (100.0%) | 2,859 (100.0%) |
Real Estate & Mortgages in Oneida County
Real Estate and Mortgage Overview in Oneida County
| Characteristic | Without Mortgage | With Mortgage |
| Housing Units | 6,229 | 7,329 |
| Median Property Value | $206,800 | $220,500 |
| Median Household Income | $56,911 | $1,277 |
| Monthly Housing Costs | $481 | $522 |
| Real Estate Taxes | $1,987 | $27 |
Property Value by Mortgage Status in Oneida County
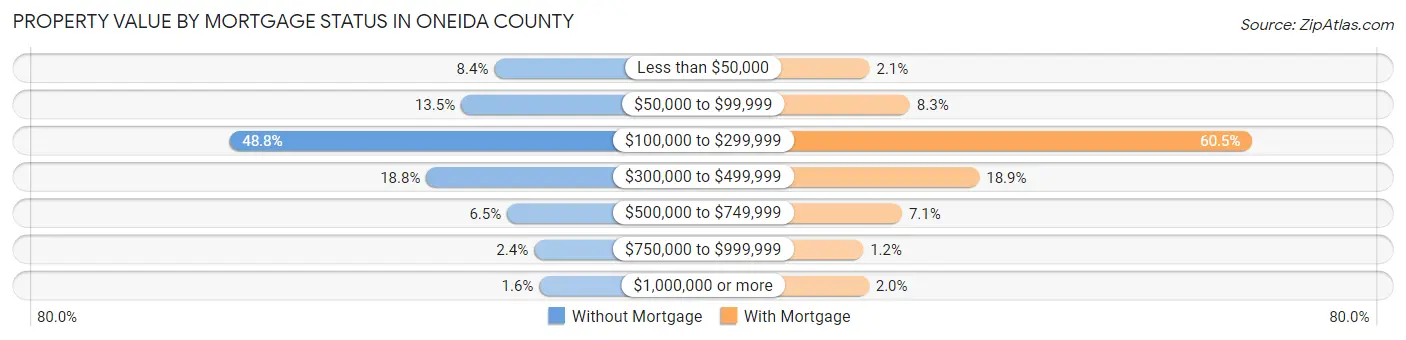
| Property Value | Without Mortgage | With Mortgage |
| Less than $50,000 | 526 (8.4%) | 156 (2.1%) |
| $50,000 to $99,999 | 841 (13.5%) | 607 (8.3%) |
| $100,000 to $299,999 | 3,040 (48.8%) | 4,431 (60.5%) |
| $300,000 to $499,999 | 1,171 (18.8%) | 1,382 (18.9%) |
| $500,000 to $749,999 | 404 (6.5%) | 519 (7.1%) |
| $750,000 to $999,999 | 148 (2.4%) | 86 (1.2%) |
| $1,000,000 or more | 99 (1.6%) | 148 (2.0%) |
| Total | 6,229 (100.0%) | 7,329 (100.0%) |
Household Income by Mortgage Status in Oneida County
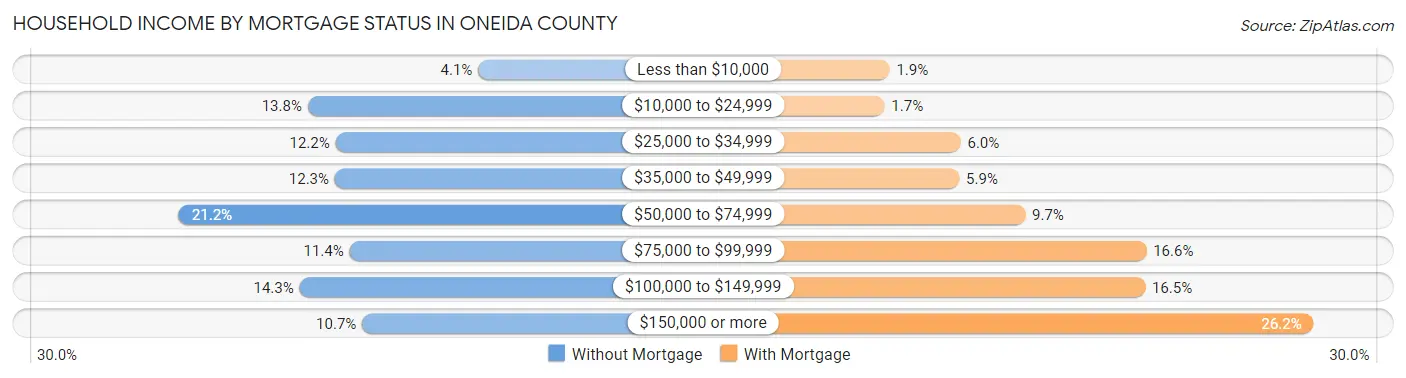
| Household Income | Without Mortgage | With Mortgage |
| Less than $10,000 | 254 (4.1%) | 142 (1.9%) |
| $10,000 to $24,999 | 861 (13.8%) | 121 (1.7%) |
| $25,000 to $34,999 | 762 (12.2%) | 440 (6.0%) |
| $35,000 to $49,999 | 764 (12.3%) | 434 (5.9%) |
| $50,000 to $74,999 | 1,319 (21.2%) | 710 (9.7%) |
| $75,000 to $99,999 | 712 (11.4%) | 1,217 (16.6%) |
| $100,000 to $149,999 | 890 (14.3%) | 1,212 (16.5%) |
| $150,000 or more | 667 (10.7%) | 1,918 (26.2%) |
| Total | 6,229 (100.0%) | 7,329 (100.0%) |
Property Value to Household Income Ratio in Oneida County
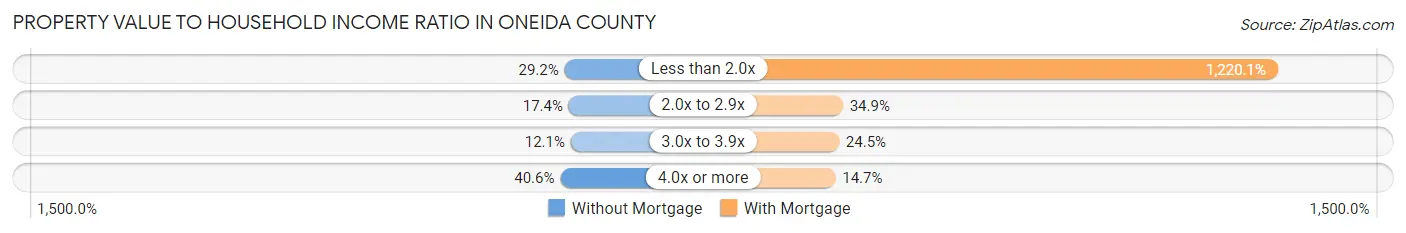
| Value-to-Income Ratio | Without Mortgage | With Mortgage |
| Less than 2.0x | 1,819 (29.2%) | 89,419 (1,220.1%) |
| 2.0x to 2.9x | 1,085 (17.4%) | 2,555 (34.9%) |
| 3.0x to 3.9x | 752 (12.1%) | 1,795 (24.5%) |
| 4.0x or more | 2,527 (40.6%) | 1,074 (14.6%) |
| Total | 6,229 (100.0%) | 7,329 (100.0%) |
Real Estate Taxes by Mortgage Status in Oneida County
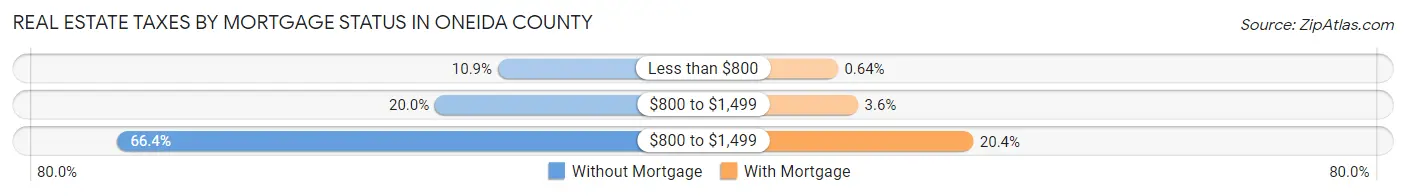
| Property Taxes | Without Mortgage | With Mortgage |
| Less than $800 | 676 (10.8%) | 47 (0.6%) |
| $800 to $1,499 | 1,247 (20.0%) | 263 (3.6%) |
| $800 to $1,499 | 4,137 (66.4%) | 1,497 (20.4%) |
| Total | 6,229 (100.0%) | 7,329 (100.0%) |
Health & Disability in Oneida County
Health Insurance Coverage by Age in Oneida County
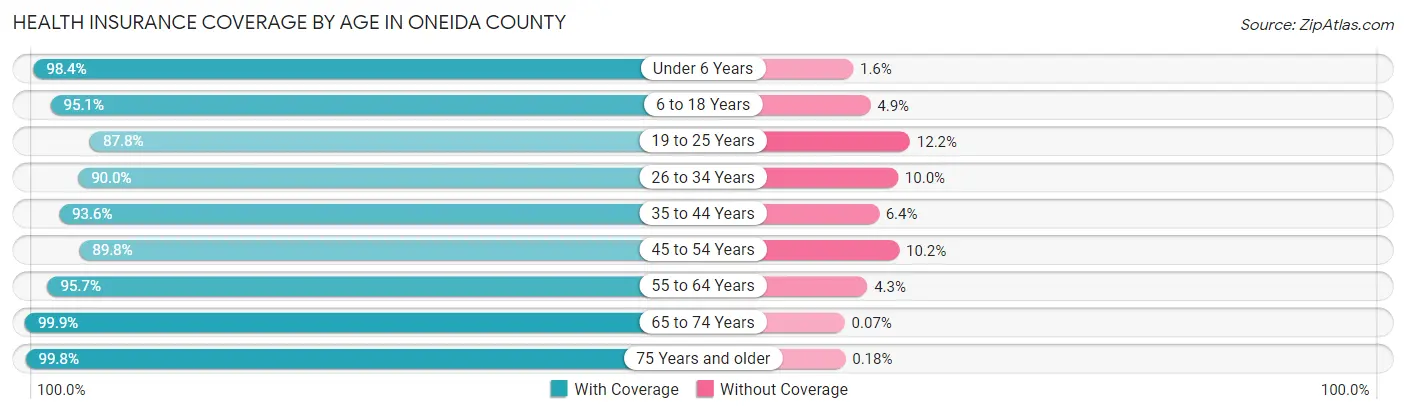
| Age Bracket | With Coverage | Without Coverage |
| Under 6 Years | 1,869 (98.4%) | 31 (1.6%) |
| 6 to 18 Years | 4,717 (95.1%) | 241 (4.9%) |
| 19 to 25 Years | 1,859 (87.8%) | 259 (12.2%) |
| 26 to 34 Years | 2,843 (90.0%) | 316 (10.0%) |
| 35 to 44 Years | 3,424 (93.6%) | 235 (6.4%) |
| 45 to 54 Years | 3,981 (89.8%) | 453 (10.2%) |
| 55 to 64 Years | 6,840 (95.7%) | 305 (4.3%) |
| 65 to 74 Years | 5,999 (99.9%) | 4 (0.1%) |
| 75 Years and older | 3,880 (99.8%) | 7 (0.2%) |
| Total | 35,412 (95.0%) | 1,851 (5.0%) |
Health Insurance Coverage by Citizenship Status in Oneida County
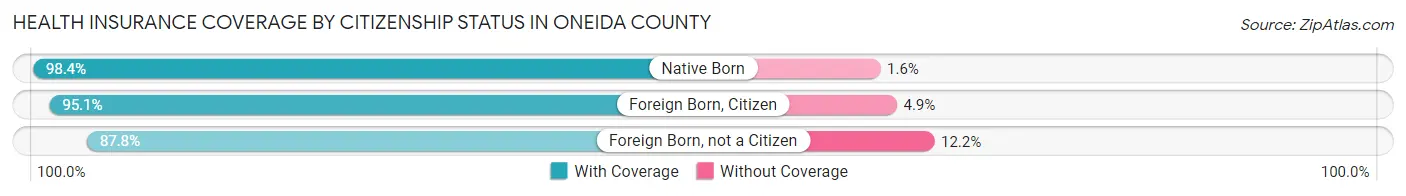
| Citizenship Status | With Coverage | Without Coverage |
| Native Born | 1,869 (98.4%) | 31 (1.6%) |
| Foreign Born, Citizen | 4,717 (95.1%) | 241 (4.9%) |
| Foreign Born, not a Citizen | 1,859 (87.8%) | 259 (12.2%) |
Health Insurance Coverage by Household Income in Oneida County
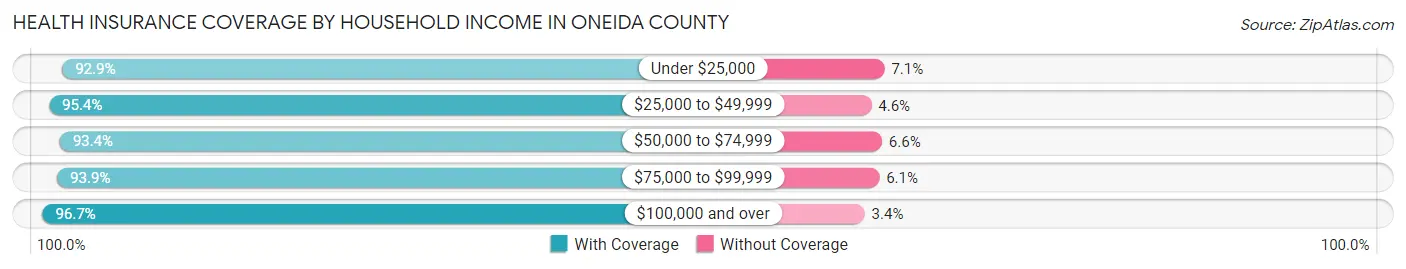
| Household Income | With Coverage | Without Coverage |
| Under $25,000 | 3,344 (92.9%) | 254 (7.1%) |
| $25,000 to $49,999 | 6,779 (95.4%) | 327 (4.6%) |
| $50,000 to $74,999 | 6,388 (93.4%) | 450 (6.6%) |
| $75,000 to $99,999 | 5,132 (93.9%) | 332 (6.1%) |
| $100,000 and over | 13,669 (96.7%) | 474 (3.4%) |
Public vs Private Health Insurance Coverage by Age in Oneida County
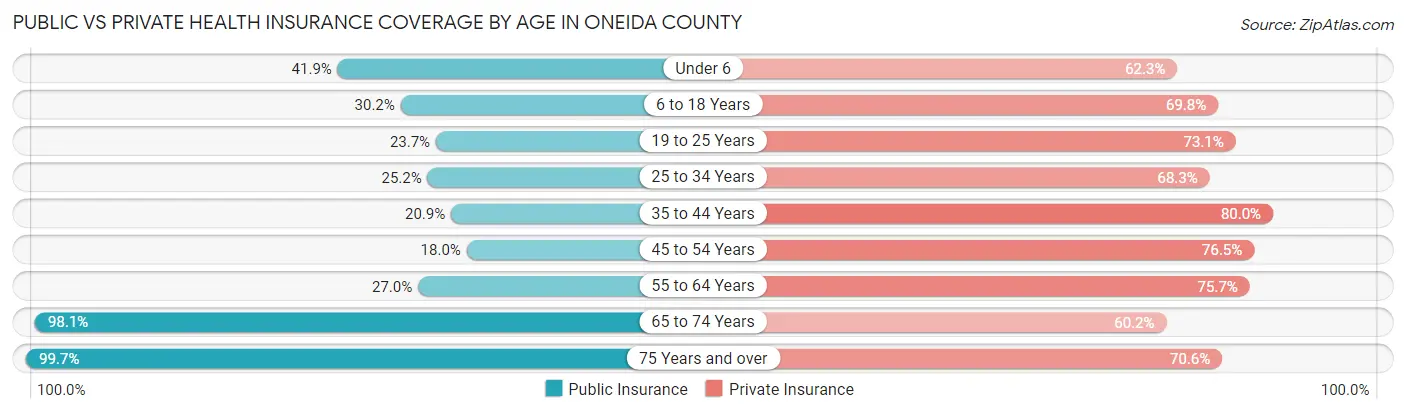
| Age Bracket | Public Insurance | Private Insurance |
| Under 6 | 796 (41.9%) | 1,183 (62.3%) |
| 6 to 18 Years | 1,498 (30.2%) | 3,462 (69.8%) |
| 19 to 25 Years | 501 (23.6%) | 1,548 (73.1%) |
| 25 to 34 Years | 796 (25.2%) | 2,156 (68.2%) |
| 35 to 44 Years | 763 (20.8%) | 2,928 (80.0%) |
| 45 to 54 Years | 796 (17.9%) | 3,393 (76.5%) |
| 55 to 64 Years | 1,927 (27.0%) | 5,409 (75.7%) |
| 65 to 74 Years | 5,888 (98.1%) | 3,616 (60.2%) |
| 75 Years and over | 3,876 (99.7%) | 2,744 (70.6%) |
| Total | 16,841 (45.2%) | 26,439 (71.0%) |
Disability Status by Sex by Age in Oneida County
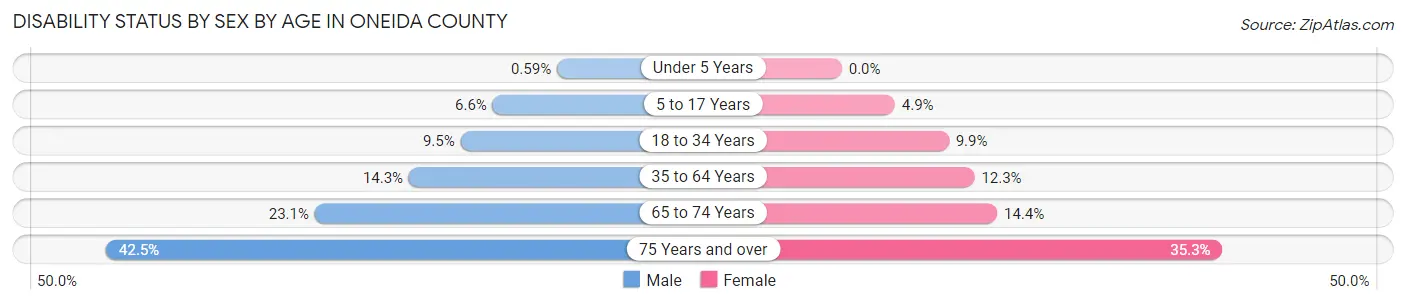
| Age Bracket | Male | Female |
| Under 5 Years | 5 (0.6%) | 0 (0.0%) |
| 5 to 17 Years | 167 (6.6%) | 114 (4.9%) |
| 18 to 34 Years | 276 (9.5%) | 273 (9.9%) |
| 35 to 64 Years | 1,101 (14.3%) | 930 (12.3%) |
| 65 to 74 Years | 716 (23.1%) | 418 (14.4%) |
| 75 Years and over | 781 (42.4%) | 723 (35.3%) |
Disability Class by Sex by Age in Oneida County
Disability Class: Hearing Difficulty
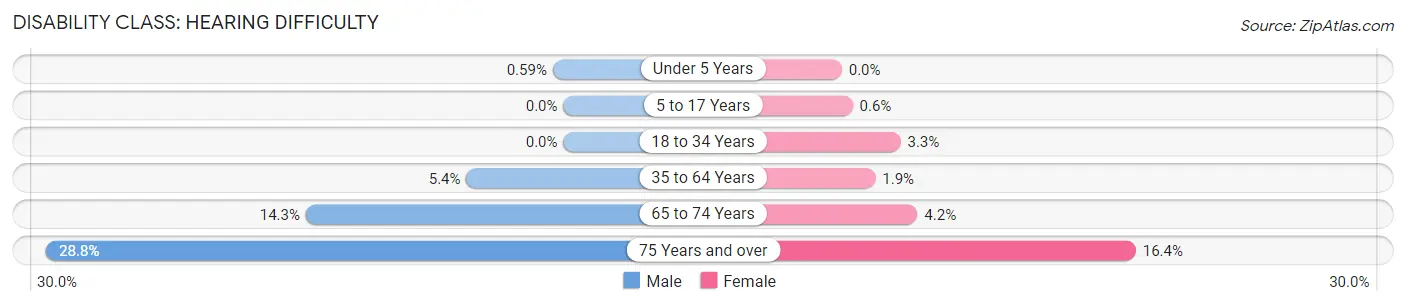
| Age Bracket | Male | Female |
| Under 5 Years | 5 (0.6%) | 0 (0.0%) |
| 5 to 17 Years | 0 (0.0%) | 14 (0.6%) |
| 18 to 34 Years | 0 (0.0%) | 90 (3.3%) |
| 35 to 64 Years | 415 (5.4%) | 141 (1.9%) |
| 65 to 74 Years | 445 (14.3%) | 122 (4.2%) |
| 75 Years and over | 530 (28.8%) | 335 (16.4%) |
Disability Class: Vision Difficulty
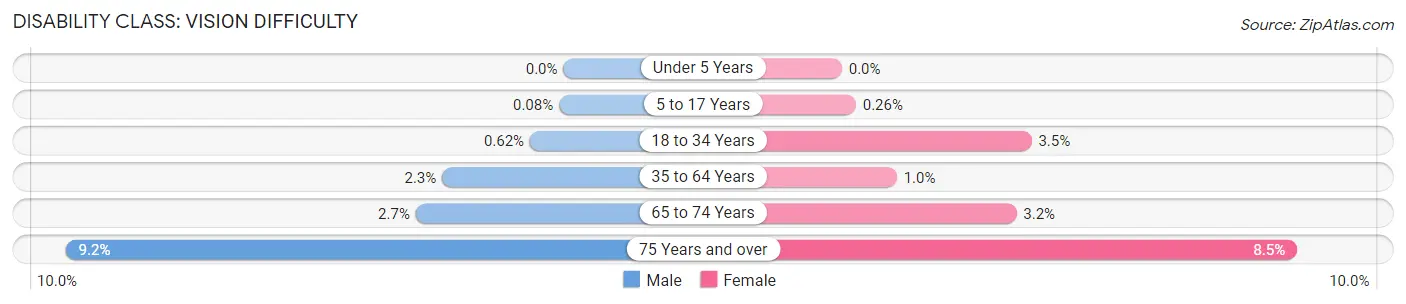
| Age Bracket | Male | Female |
| Under 5 Years | 0 (0.0%) | 0 (0.0%) |
| 5 to 17 Years | 2 (0.1%) | 6 (0.3%) |
| 18 to 34 Years | 18 (0.6%) | 97 (3.5%) |
| 35 to 64 Years | 173 (2.2%) | 77 (1.0%) |
| 65 to 74 Years | 85 (2.7%) | 94 (3.2%) |
| 75 Years and over | 170 (9.2%) | 173 (8.5%) |
Disability Class: Cognitive Difficulty
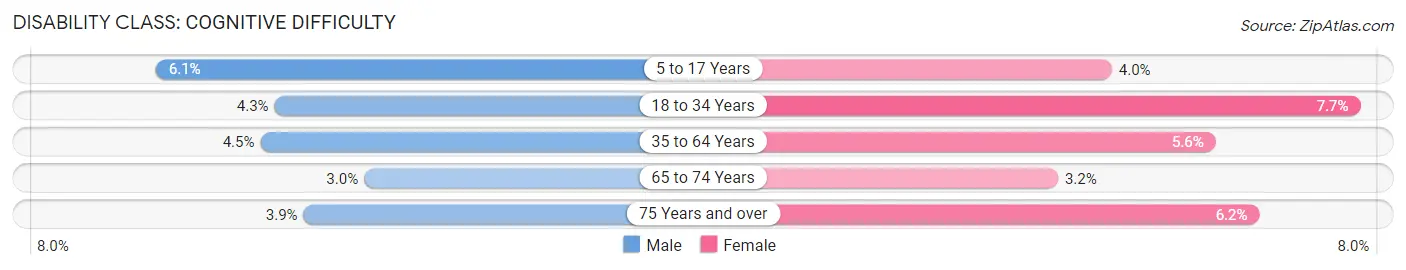
| Age Bracket | Male | Female |
| 5 to 17 Years | 154 (6.0%) | 93 (4.0%) |
| 18 to 34 Years | 124 (4.3%) | 212 (7.7%) |
| 35 to 64 Years | 346 (4.5%) | 419 (5.6%) |
| 65 to 74 Years | 92 (3.0%) | 93 (3.2%) |
| 75 Years and over | 71 (3.9%) | 127 (6.2%) |
Disability Class: Ambulatory Difficulty
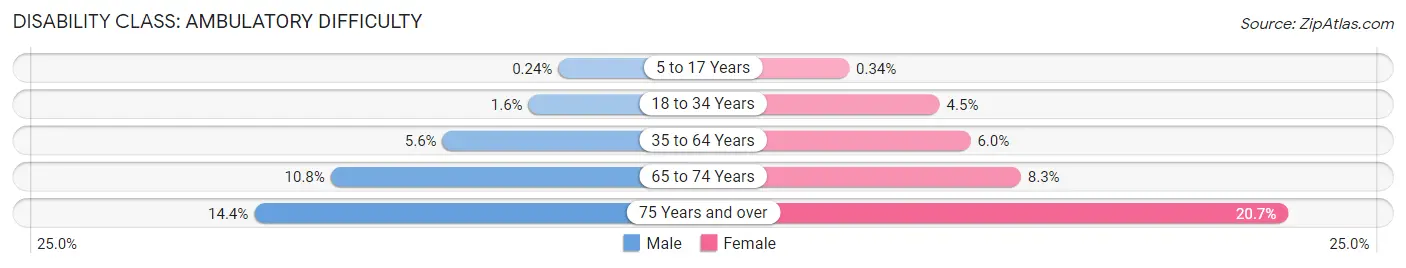
| Age Bracket | Male | Female |
| 5 to 17 Years | 6 (0.2%) | 8 (0.3%) |
| 18 to 34 Years | 47 (1.6%) | 125 (4.5%) |
| 35 to 64 Years | 431 (5.6%) | 451 (6.0%) |
| 65 to 74 Years | 335 (10.8%) | 241 (8.3%) |
| 75 Years and over | 264 (14.3%) | 424 (20.7%) |
Disability Class: Self-Care Difficulty
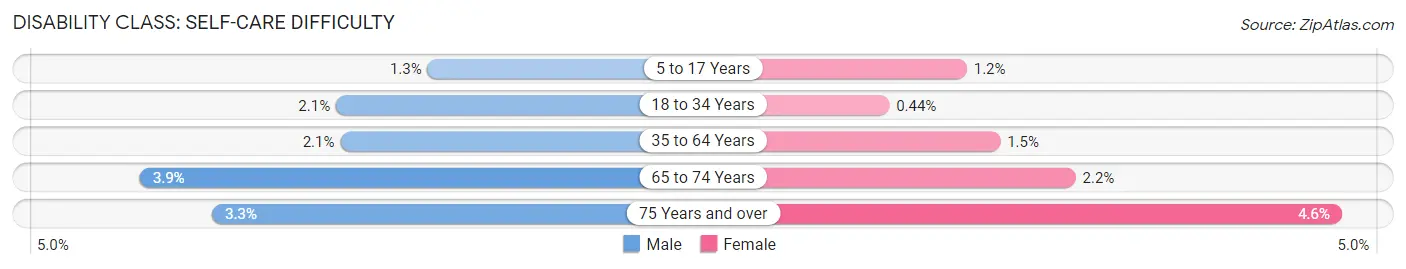
| Age Bracket | Male | Female |
| 5 to 17 Years | 32 (1.3%) | 27 (1.2%) |
| 18 to 34 Years | 61 (2.1%) | 12 (0.4%) |
| 35 to 64 Years | 159 (2.1%) | 111 (1.5%) |
| 65 to 74 Years | 122 (3.9%) | 63 (2.2%) |
| 75 Years and over | 60 (3.3%) | 95 (4.6%) |
Technology Access in Oneida County
Computing Device Access in Oneida County
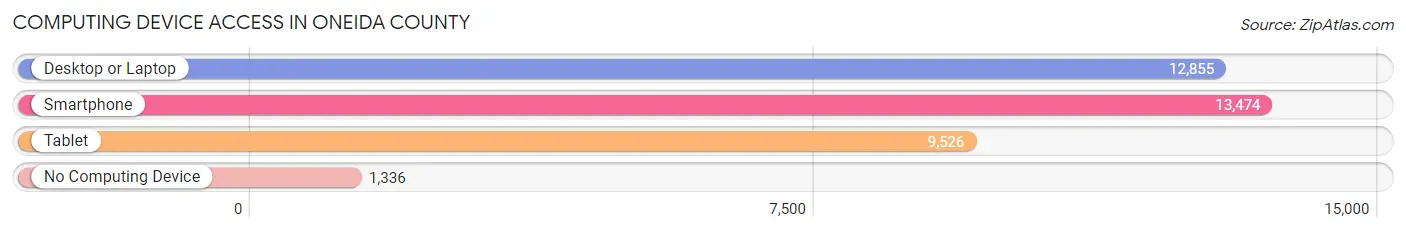
| Device Type | # Households | % Households |
| Desktop or Laptop | 12,855 | 78.3% |
| Smartphone | 13,474 | 82.1% |
| Tablet | 9,526 | 58.0% |
| No Computing Device | 1,336 | 8.1% |
| Total | 16,417 | 100.0% |
Internet Access in Oneida County
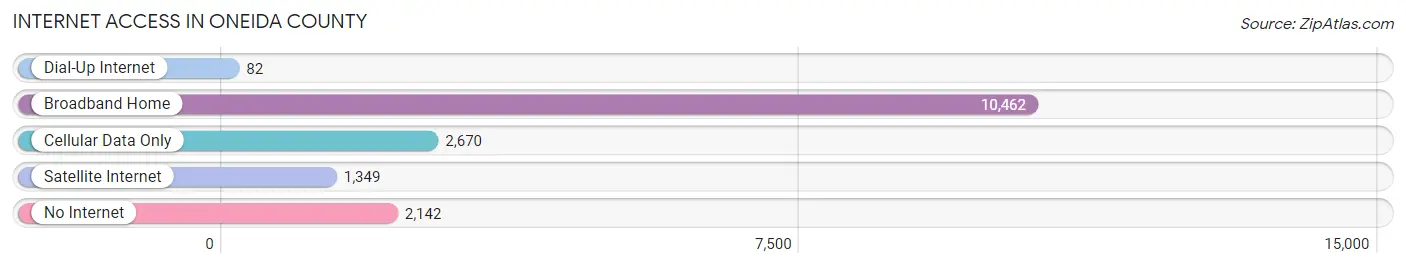
| Internet Type | # Households | % Households |
| Dial-Up Internet | 82 | 0.5% |
| Broadband Home | 10,462 | 63.7% |
| Cellular Data Only | 2,670 | 16.3% |
| Satellite Internet | 1,349 | 8.2% |
| No Internet | 2,142 | 13.1% |
| Total | 16,417 | 100.0% |
Oneida County Summary
Oneida County is located in the north-central part of Wisconsin, and is part of the larger Northwoods region. It is bordered by Vilas County to the north, Forest County to the east, Langlade County to the south, and Lincoln County to the west. The county seat is Rhinelander, and the largest city is also Rhinelander. The county was established in 1887 and named after the Oneida Nation, a Native American tribe that had lived in the area for centuries.
Geography
Oneida County covers an area of 1,567 square miles, making it the fourth largest county in Wisconsin. The terrain is mostly flat, with some rolling hills and low ridges. The highest point in the county is located in the town of Pine Lake, at 1,945 feet above sea level. The county is home to numerous lakes, rivers, and streams, including the Wisconsin River, which forms the western border of the county. The county is also home to the Nicolet National Forest, which covers over 1 million acres of land.
Economy
Oneida County has a diverse economy, with a mix of manufacturing, agriculture, tourism, and service industries. The county is home to several large manufacturing companies, including the Rhinelander Paper Company, which produces paper products, and the Rhinelander Brewing Company, which produces beer. Agriculture is also an important part of the economy, with dairy farming being the most common type of farming in the county. Tourism is also a major industry, with the county being home to numerous resorts, campgrounds, and recreational areas.
Demographics
As of the 2010 census, Oneida County had a population of 35,998. The population is mostly white (94.3%), with small percentages of Native American (1.2%), African American (1.1%), Asian (0.7%), and Hispanic or Latino (1.7%) residents. The median household income is $45,945, and the median home value is $133,400. The county has a relatively low unemployment rate of 4.2%.
Conclusion
Oneida County is a diverse and vibrant county located in the north-central part of Wisconsin. It is home to numerous lakes, rivers, and streams, as well as the Nicolet National Forest. The economy is diverse, with a mix of manufacturing, agriculture, tourism, and service industries. The population is mostly white, with small percentages of other racial and ethnic groups. The median household income is $45,945, and the median home value is $133,400. The county has a relatively low unemployment rate of 4.2%.
Common Questions
What is Per Capita Income in Oneida County?
Per Capita income in Oneida County is $40,086.
What is the Median Family Income in Oneida County?
Median Family Income in Oneida County is $83,980.
What is the Median Household income in Oneida County?
Median Household Income in Oneida County is $66,111.
What is Income or Wage Gap in Oneida County?
Income or Wage Gap in Oneida County is 29.1%.
Women in Oneida County earn 70.9 cents for every dollar earned by a man.
What is Family Income Deficit in Oneida County?
Family Income Deficit in Oneida County is $9,407.
Families that are below poverty line in Oneida County earn $9,407 less on average than the poverty threshold level.
What is Inequality or Gini Index in Oneida County?
Inequality or Gini Index in Oneida County is 0.45.
What is the Total Population of Oneida County?
Total Population of Oneida County is 37,799.
What is the Total Male Population of Oneida County?
Total Male Population of Oneida County is 19,161.
What is the Total Female Population of Oneida County?
Total Female Population of Oneida County is 18,638.
What is the Ratio of Males per 100 Females in Oneida County?
There are 102.81 Males per 100 Females in Oneida County.
What is the Ratio of Females per 100 Males in Oneida County?
There are 97.27 Females per 100 Males in Oneida County.
What is the Median Population Age in Oneida County?
Median Population Age in Oneida County is 51.8 Years.
What is the Average Family Size in Oneida County
Average Family Size in Oneida County is 2.9 People.
What is the Average Household Size in Oneida County
Average Household Size in Oneida County is 2.3 People.
How Large is the Labor Force in Oneida County?
There are 17,199 People in the Labor Forcein in Oneida County.
What is the Percentage of People in the Labor Force in Oneida County?
53.5% of People are in the Labor Force in Oneida County.
What is the Unemployment Rate in Oneida County?
Unemployment Rate in Oneida County is 2.2%.