Black River Falls, WI Map & Demographics
Black River Falls Map
Black River Falls Overview
$35,934
PER CAPITA INCOME
$88,295
AVG FAMILY INCOME
$42,798
AVG HOUSEHOLD INCOME
6.2%
WAGE / INCOME GAP [ % ]
93.8¢/ $1
WAGE / INCOME GAP [ $ ]
0.53
INEQUALITY / GINI INDEX
3,488
TOTAL POPULATION
1,663
MALE POPULATION
1,825
FEMALE POPULATION
91.12
MALES / 100 FEMALES
109.74
FEMALES / 100 MALES
43.2
MEDIAN AGE
3.0
AVG FAMILY SIZE
1.9
AVG HOUSEHOLD SIZE
1,498
LABOR FORCE [ PEOPLE ]
52.9%
PERCENT IN LABOR FORCE
4.5%
UNEMPLOYMENT RATE
Black River Falls Zip Codes
Black River Falls Area Codes
Income in Black River Falls
Income Overview in Black River Falls
Per Capita Income in Black River Falls is $35,934, while median incomes of families and households are $88,295 and $42,798 respectively.
| Characteristic | Number | Measure |
| Per Capita Income | 3,488 | $35,934 |
| Median Family Income | 704 | $88,295 |
| Mean Family Income | 704 | $114,820 |
| Median Household Income | 1,755 | $42,798 |
| Mean Household Income | 1,755 | $68,848 |
| Income Deficit | 704 | $0 |
| Wage / Income Gap (%) | 3,488 | 6.21% |
| Wage / Income Gap ($) | 3,488 | 93.79¢ per $1 |
| Gini / Inequality Index | 3,488 | 0.53 |
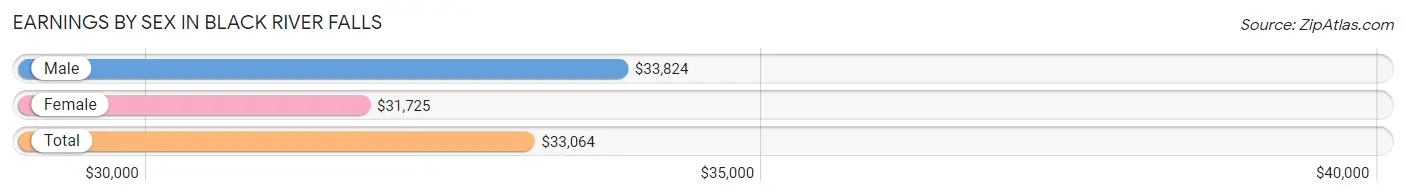
Earnings by Sex in Black River Falls
Average Earnings in Black River Falls are $33,064, $33,824 for men and $31,725 for women, a difference of 6.2%.
| Sex | Number | Average Earnings |
| Male | 872 (53.1%) | $33,824 |
| Female | 769 (46.9%) | $31,725 |
| Total | 1,641 (100.0%) | $33,064 |
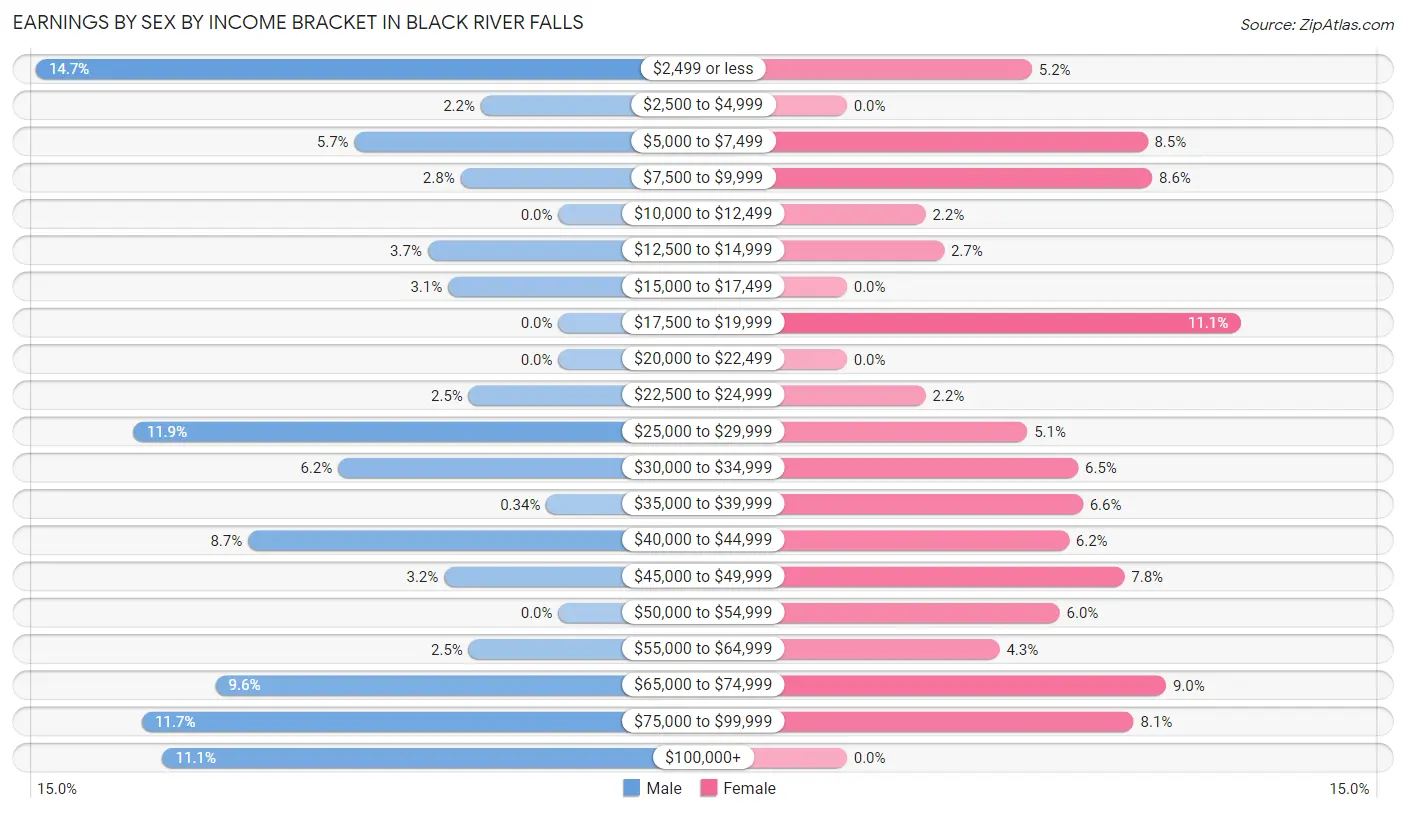
Earnings by Sex by Income Bracket in Black River Falls
The most common earnings brackets in Black River Falls are $2,499 or less for men (128 | 14.7%) and $17,500 to $19,999 for women (85 | 11.1%).
| Income | Male | Female |
| $2,499 or less | 128 (14.7%) | 40 (5.2%) |
| $2,500 to $4,999 | 19 (2.2%) | 0 (0.0%) |
| $5,000 to $7,499 | 50 (5.7%) | 65 (8.5%) |
| $7,500 to $9,999 | 24 (2.8%) | 66 (8.6%) |
| $10,000 to $12,499 | 0 (0.0%) | 17 (2.2%) |
| $12,500 to $14,999 | 32 (3.7%) | 21 (2.7%) |
| $15,000 to $17,499 | 27 (3.1%) | 0 (0.0%) |
| $17,500 to $19,999 | 0 (0.0%) | 85 (11.1%) |
| $20,000 to $22,499 | 0 (0.0%) | 0 (0.0%) |
| $22,500 to $24,999 | 22 (2.5%) | 17 (2.2%) |
| $25,000 to $29,999 | 104 (11.9%) | 39 (5.1%) |
| $30,000 to $34,999 | 54 (6.2%) | 50 (6.5%) |
| $35,000 to $39,999 | 3 (0.3%) | 51 (6.6%) |
| $40,000 to $44,999 | 76 (8.7%) | 48 (6.2%) |
| $45,000 to $49,999 | 28 (3.2%) | 60 (7.8%) |
| $50,000 to $54,999 | 0 (0.0%) | 46 (6.0%) |
| $55,000 to $64,999 | 22 (2.5%) | 33 (4.3%) |
| $65,000 to $74,999 | 84 (9.6%) | 69 (9.0%) |
| $75,000 to $99,999 | 102 (11.7%) | 62 (8.1%) |
| $100,000+ | 97 (11.1%) | 0 (0.0%) |
| Total | 872 (100.0%) | 769 (100.0%) |
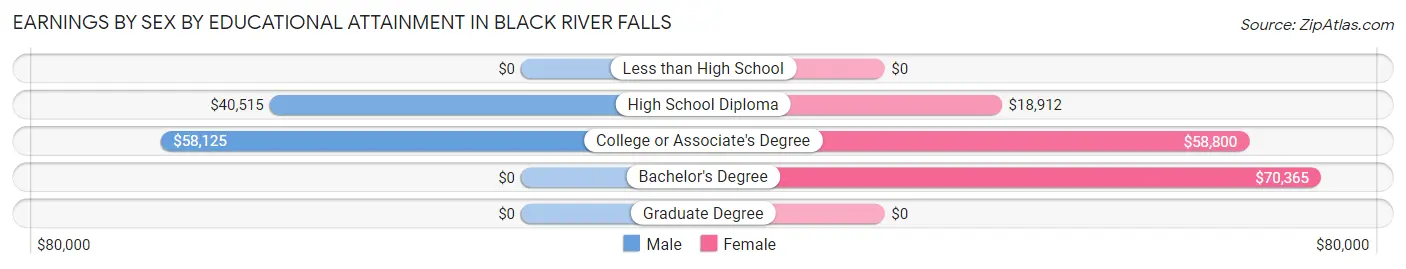
Earnings by Sex by Educational Attainment in Black River Falls
Average earnings in Black River Falls are $40,882 for men and $31,389 for women, a difference of 23.2%. Men with an educational attainment of college or associate's degree enjoy the highest average annual earnings of $58,125, while those with high school diploma education earn the least with $40,515. Women with an educational attainment of bachelor's degree earn the most with the average annual earnings of $70,365, while those with high school diploma education have the smallest earnings of $18,912.
| Educational Attainment | Male Income | Female Income |
| Less than High School | - | - |
| High School Diploma | $40,515 | $18,912 |
| College or Associate's Degree | $58,125 | $58,800 |
| Bachelor's Degree | - | - |
| Graduate Degree | - | - |
| Total | $40,882 | $31,389 |
Family Income in Black River Falls
Family Income Brackets in Black River Falls
According to the Black River Falls family income data, there are 149 families falling into the $50,000 to $74,999 income range, which is the most common income bracket and makes up 21.2% of all families.
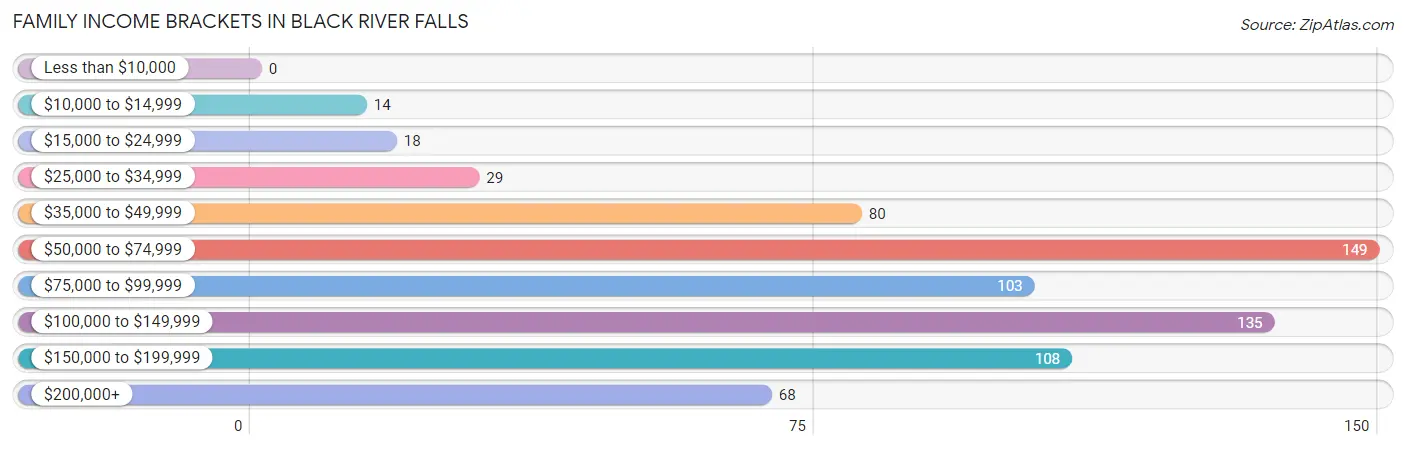
| Income Bracket | # Families | % Families |
| Less than $10,000 | 0 | 0.0% |
| $10,000 to $14,999 | 14 | 2.0% |
| $15,000 to $24,999 | 18 | 2.6% |
| $25,000 to $34,999 | 29 | 4.1% |
| $35,000 to $49,999 | 80 | 11.4% |
| $50,000 to $74,999 | 149 | 21.2% |
| $75,000 to $99,999 | 103 | 14.6% |
| $100,000 to $149,999 | 135 | 19.2% |
| $150,000 to $199,999 | 108 | 15.3% |
| $200,000+ | 68 | 9.7% |
Family Income by Famaliy Size in Black River Falls
5-person families (106 | 15.1%) account for the highest median family income in Black River Falls with $157,833 per family, while 3-person families (113 | 16.1%) have the highest median income of $39,583 per family member.
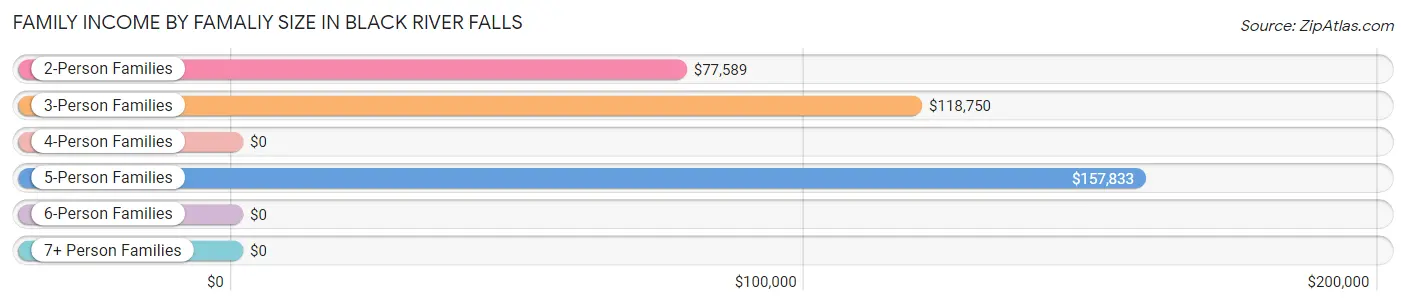
| Income Bracket | # Families | Median Income |
| 2-Person Families | 341 (48.4%) | $77,589 |
| 3-Person Families | 113 (16.1%) | $118,750 |
| 4-Person Families | 100 (14.2%) | $0 |
| 5-Person Families | 106 (15.1%) | $157,833 |
| 6-Person Families | 44 (6.2%) | $0 |
| 7+ Person Families | 0 (0.0%) | $0 |
| Total | 704 (100.0%) | $88,295 |
Family Income by Number of Earners in Black River Falls
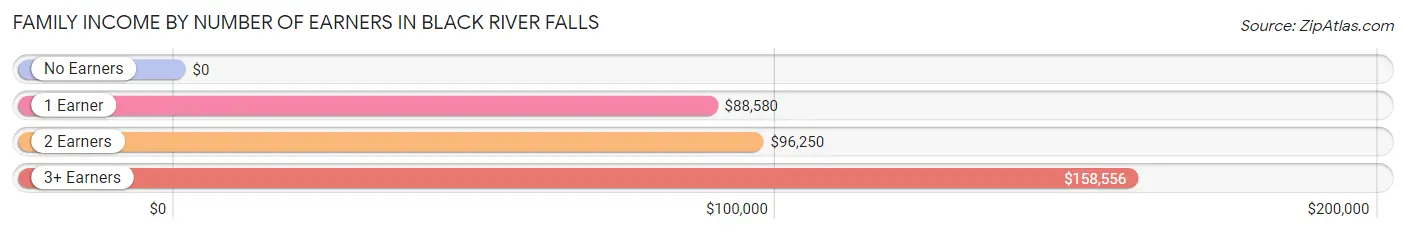
| Number of Earners | # Families | Median Income |
| No Earners | 108 (15.3%) | $0 |
| 1 Earner | 197 (28.0%) | $88,580 |
| 2 Earners | 319 (45.3%) | $96,250 |
| 3+ Earners | 80 (11.4%) | $158,556 |
| Total | 704 (100.0%) | $88,295 |
Household Income in Black River Falls
Household Income Brackets in Black River Falls
With 274 households falling in the category, the $15,000 to $24,999 income range is the most frequent in Black River Falls, accounting for 15.6% of all households. In contrast, only 95 households (5.4%) fall into the $200,000+ income bracket, making it the least populous group.
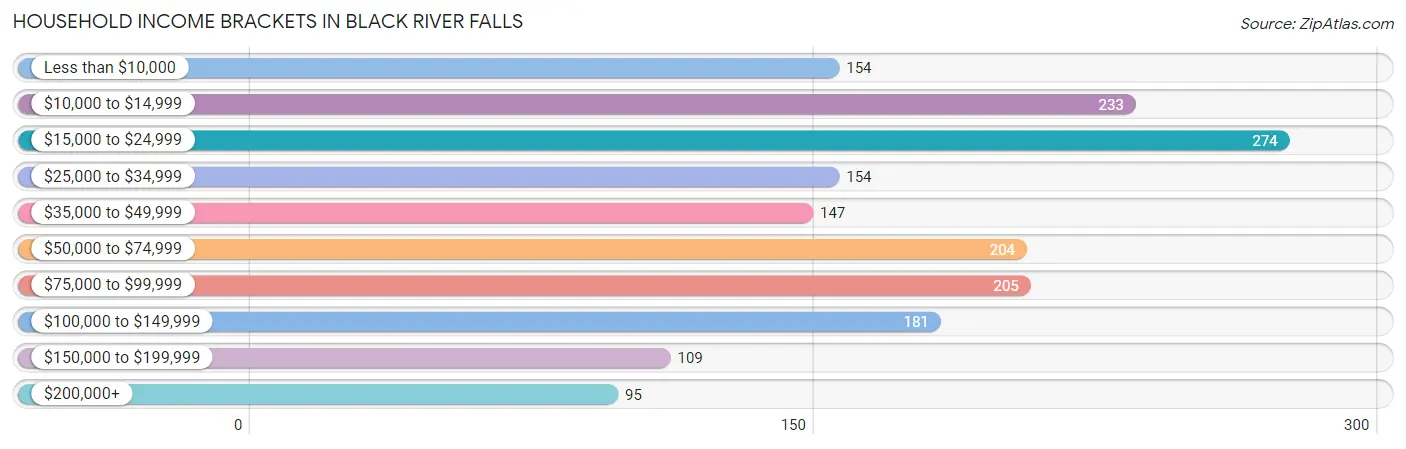
| Income Bracket | # Households | % Households |
| Less than $10,000 | 154 | 8.8% |
| $10,000 to $14,999 | 233 | 13.3% |
| $15,000 to $24,999 | 274 | 15.6% |
| $25,000 to $34,999 | 154 | 8.8% |
| $35,000 to $49,999 | 147 | 8.4% |
| $50,000 to $74,999 | 204 | 11.6% |
| $75,000 to $99,999 | 205 | 11.7% |
| $100,000 to $149,999 | 181 | 10.3% |
| $150,000 to $199,999 | 109 | 6.2% |
| $200,000+ | 95 | 5.4% |
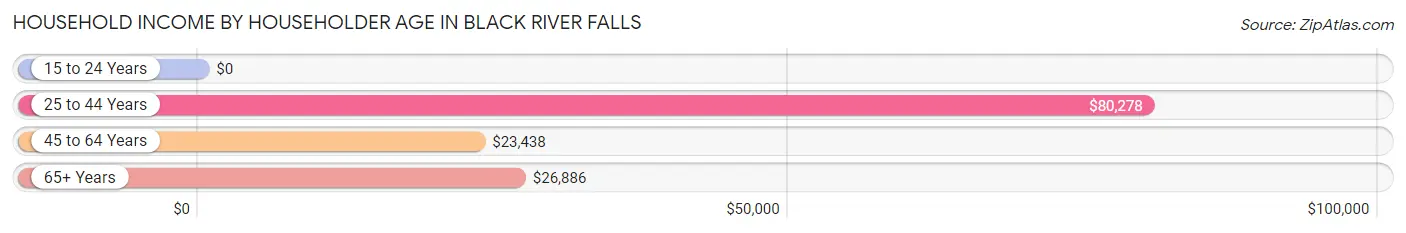
Household Income by Householder Age in Black River Falls
The median household income in Black River Falls is $42,798, with the highest median household income of $80,278 found in the 25 to 44 years age bracket for the primary householder. A total of 490 households (27.9%) fall into this category. Meanwhile, the 15 to 24 years age bracket for the primary householder has the lowest median household income of $0, with 49 households (2.8%) in this group.
| Income Bracket | # Households | Median Income |
| 15 to 24 Years | 49 (2.8%) | $0 |
| 25 to 44 Years | 490 (27.9%) | $80,278 |
| 45 to 64 Years | 640 (36.5%) | $23,438 |
| 65+ Years | 576 (32.8%) | $26,886 |
| Total | 1,755 (100.0%) | $42,798 |
Poverty in Black River Falls
Income Below Poverty by Sex and Age in Black River Falls
With 11.1% poverty level for males and 17.8% for females among the residents of Black River Falls, 16 and 17 year old males and 45 to 54 year old females are the most vulnerable to poverty, with 13 males (100.0%) and 125 females (59.0%) in their respective age groups living below the poverty level.
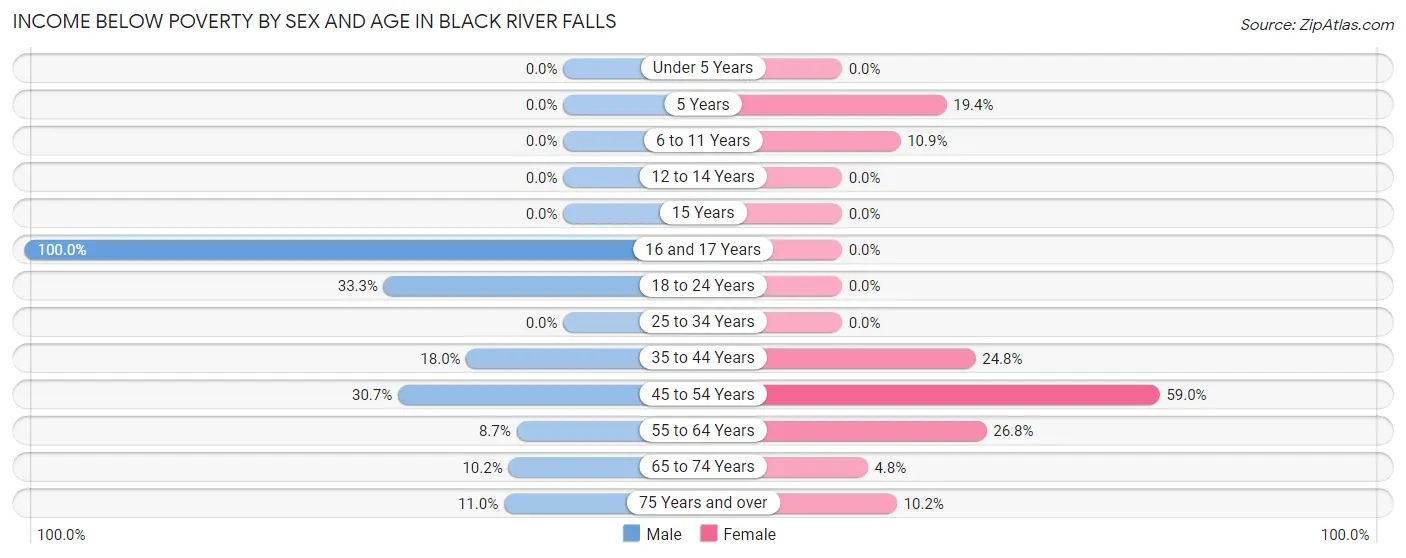
| Age Bracket | Male | Female |
| Under 5 Years | 0 (0.0%) | 0 (0.0%) |
| 5 Years | 0 (0.0%) | 13 (19.4%) |
| 6 to 11 Years | 0 (0.0%) | 14 (10.8%) |
| 12 to 14 Years | 0 (0.0%) | 0 (0.0%) |
| 15 Years | 0 (0.0%) | 0 (0.0%) |
| 16 and 17 Years | 13 (100.0%) | 0 (0.0%) |
| 18 to 24 Years | 32 (33.3%) | 0 (0.0%) |
| 25 to 34 Years | 0 (0.0%) | 0 (0.0%) |
| 35 to 44 Years | 50 (18.0%) | 56 (24.8%) |
| 45 to 54 Years | 27 (30.7%) | 125 (59.0%) |
| 55 to 64 Years | 19 (8.7%) | 70 (26.8%) |
| 65 to 74 Years | 23 (10.2%) | 12 (4.8%) |
| 75 Years and over | 14 (11.0%) | 21 (10.2%) |
| Total | 178 (11.1%) | 311 (17.8%) |
Income Above Poverty by Sex and Age in Black River Falls
According to the poverty statistics in Black River Falls, males aged under 5 years and females aged under 5 years are the age groups that are most secure financially, with 100.0% of males and 100.0% of females in these age groups living above the poverty line.
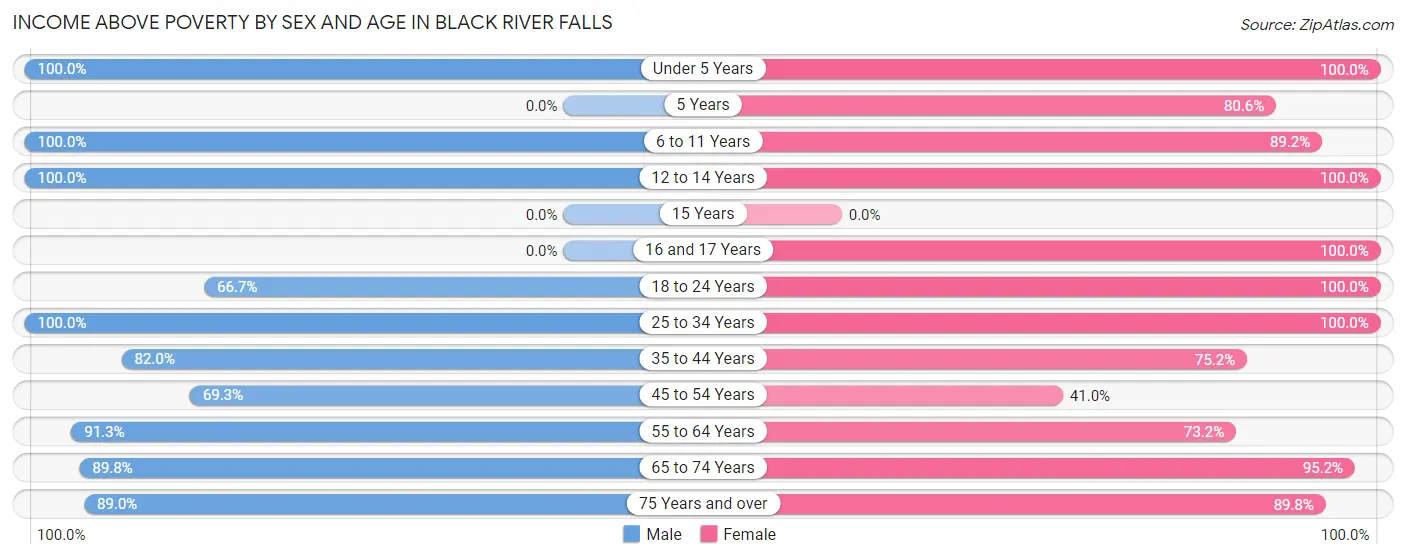
| Age Bracket | Male | Female |
| Under 5 Years | 112 (100.0%) | 53 (100.0%) |
| 5 Years | 0 (0.0%) | 54 (80.6%) |
| 6 to 11 Years | 173 (100.0%) | 115 (89.1%) |
| 12 to 14 Years | 89 (100.0%) | 34 (100.0%) |
| 15 Years | 0 (0.0%) | 0 (0.0%) |
| 16 and 17 Years | 0 (0.0%) | 35 (100.0%) |
| 18 to 24 Years | 64 (66.7%) | 143 (100.0%) |
| 25 to 34 Years | 188 (100.0%) | 127 (100.0%) |
| 35 to 44 Years | 228 (82.0%) | 170 (75.2%) |
| 45 to 54 Years | 61 (69.3%) | 87 (41.0%) |
| 55 to 64 Years | 200 (91.3%) | 191 (73.2%) |
| 65 to 74 Years | 203 (89.8%) | 240 (95.2%) |
| 75 Years and over | 113 (89.0%) | 185 (89.8%) |
| Total | 1,431 (88.9%) | 1,434 (82.2%) |
Income Below Poverty Among Married-Couple Families in Black River Falls
The poverty statistics for married-couple families in Black River Falls show that 2.3% or 14 of the total 599 families live below the poverty line. Families with no children have the highest poverty rate of 4.4%, comprising of 14 families. On the other hand, families with 1 or 2 children have the lowest poverty rate of 0.0%, which includes 0 families.
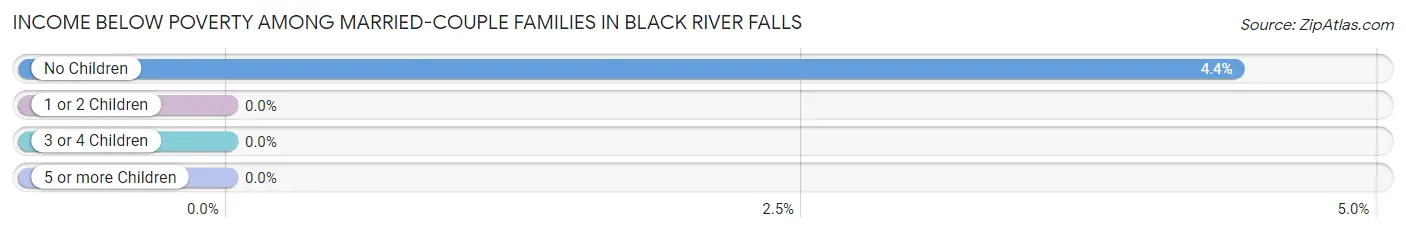
| Children | Above Poverty | Below Poverty |
| No Children | 306 (95.6%) | 14 (4.4%) |
| 1 or 2 Children | 213 (100.0%) | 0 (0.0%) |
| 3 or 4 Children | 66 (100.0%) | 0 (0.0%) |
| 5 or more Children | 0 (0.0%) | 0 (0.0%) |
| Total | 585 (97.7%) | 14 (2.3%) |
Income Below Poverty Among Single-Parent Households in Black River Falls
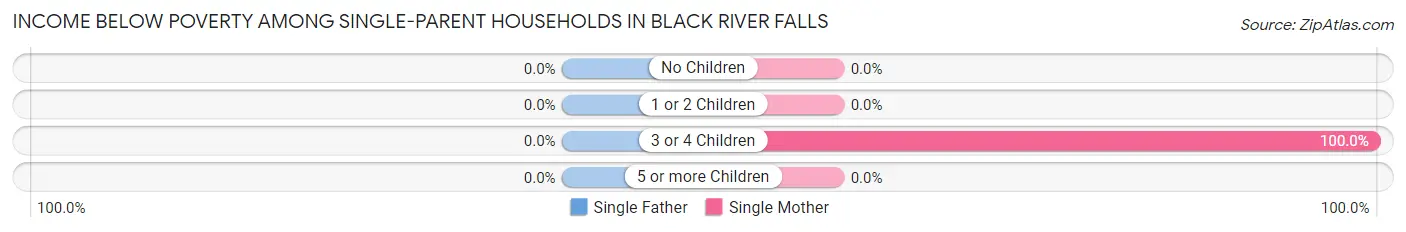
| Children | Single Father | Single Mother |
| No Children | 0 (0.0%) | 0 (0.0%) |
| 1 or 2 Children | 0 (0.0%) | 0 (0.0%) |
| 3 or 4 Children | 0 (0.0%) | 17 (100.0%) |
| 5 or more Children | 0 (0.0%) | 0 (0.0%) |
| Total | 0 (0.0%) | 17 (20.5%) |
Income Below Poverty Among Married-Couple vs Single-Parent Households in Black River Falls
The poverty data for Black River Falls shows that 14 of the married-couple family households (2.3%) and 17 of the single-parent households (16.2%) are living below the poverty level. Within the married-couple family households, those with no children have the highest poverty rate, with 14 households (4.4%) falling below the poverty line. Among the single-parent households, those with 3 or 4 children have the highest poverty rate, with 17 household (100.0%) living below poverty.
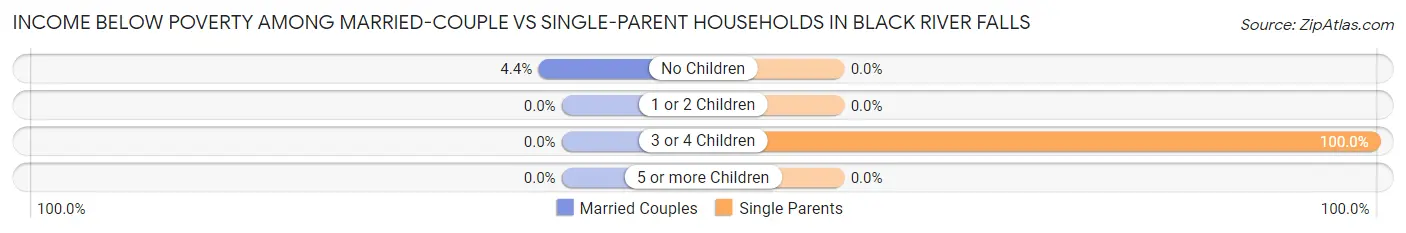
| Children | Married-Couple Families | Single-Parent Households |
| No Children | 14 (4.4%) | 0 (0.0%) |
| 1 or 2 Children | 0 (0.0%) | 0 (0.0%) |
| 3 or 4 Children | 0 (0.0%) | 17 (100.0%) |
| 5 or more Children | 0 (0.0%) | 0 (0.0%) |
| Total | 14 (2.3%) | 17 (16.2%) |
Race in Black River Falls
The most populous races in Black River Falls are White / Caucasian (3,207 | 91.9%), Two or more Races (148 | 4.2%), and Native / Alaskan (104 | 3.0%).
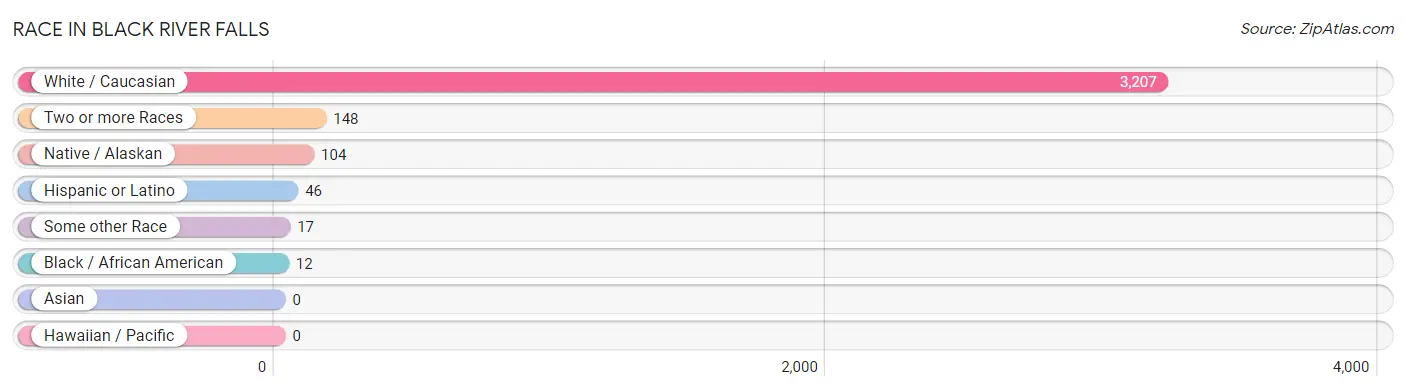
| Race | # Population | % Population |
| Asian | 0 | 0.0% |
| Black / African American | 12 | 0.3% |
| Hawaiian / Pacific | 0 | 0.0% |
| Hispanic or Latino | 46 | 1.3% |
| Native / Alaskan | 104 | 3.0% |
| White / Caucasian | 3,207 | 91.9% |
| Two or more Races | 148 | 4.2% |
| Some other Race | 17 | 0.5% |
| Total | 3,488 | 100.0% |
Ancestry in Black River Falls
The most populous ancestries reported in Black River Falls are German (1,103 | 31.6%), Norwegian (971 | 27.8%), Irish (311 | 8.9%), English (286 | 8.2%), and American (200 | 5.7%), together accounting for 82.3% of all Black River Falls residents.
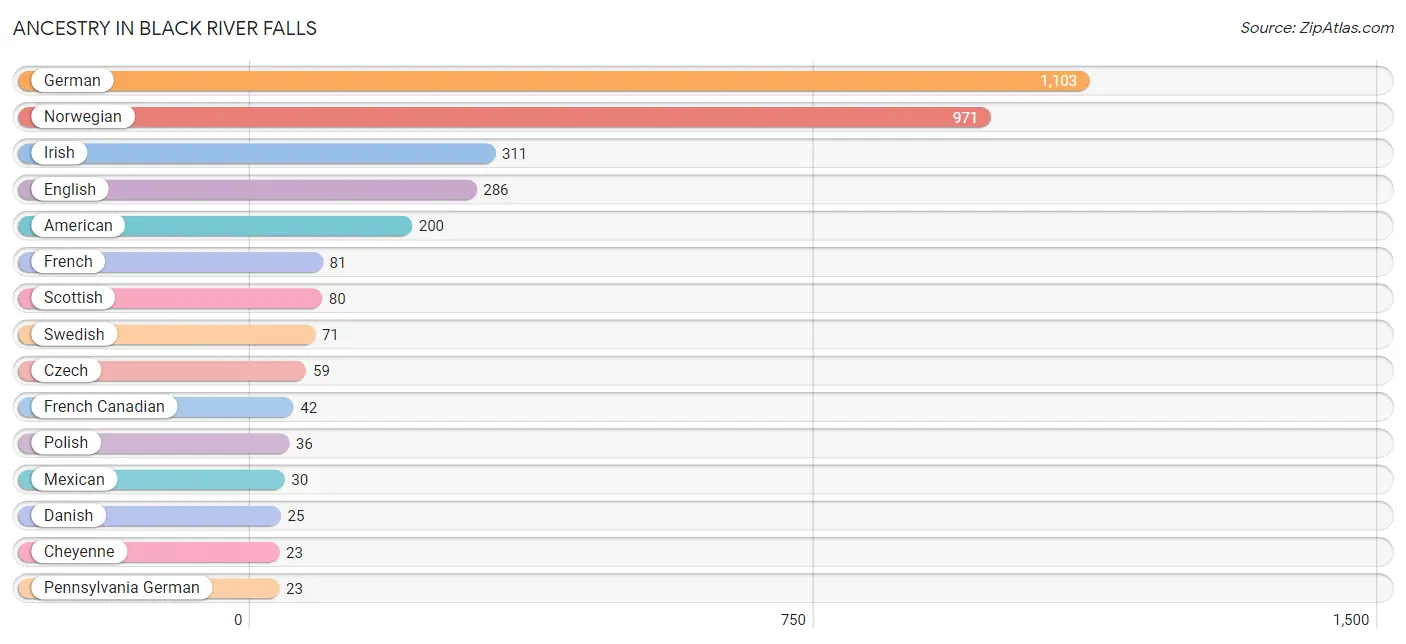
| Ancestry | # Population | % Population |
| American | 200 | 5.7% |
| Bangladeshi | 19 | 0.5% |
| Cheyenne | 23 | 0.7% |
| Colombian | 1 | 0.0% |
| Czech | 59 | 1.7% |
| Danish | 25 | 0.7% |
| Dutch | 22 | 0.6% |
| English | 286 | 8.2% |
| French | 81 | 2.3% |
| French Canadian | 42 | 1.2% |
| German | 1,103 | 31.6% |
| Irish | 311 | 8.9% |
| Italian | 14 | 0.4% |
| Lithuanian | 5 | 0.1% |
| Mexican | 30 | 0.9% |
| Mexican American Indian | 1 | 0.0% |
| Norwegian | 971 | 27.8% |
| Pennsylvania German | 23 | 0.7% |
| Polish | 36 | 1.0% |
| Russian | 21 | 0.6% |
| Scottish | 80 | 2.3% |
| Serbian | 14 | 0.4% |
| Sioux | 13 | 0.4% |
| South American | 1 | 0.0% |
| Spaniard | 15 | 0.4% |
| Swedish | 71 | 2.0% | View All 26 Rows |
Immigrants in Black River Falls
The most numerous immigrant groups reported in Black River Falls came from Europe (41 | 1.2%), England (27 | 0.8%), Northern Europe (27 | 0.8%), Eastern Europe (14 | 0.4%), and Serbia (14 | 0.4%), together accounting for 3.5% of all Black River Falls residents.
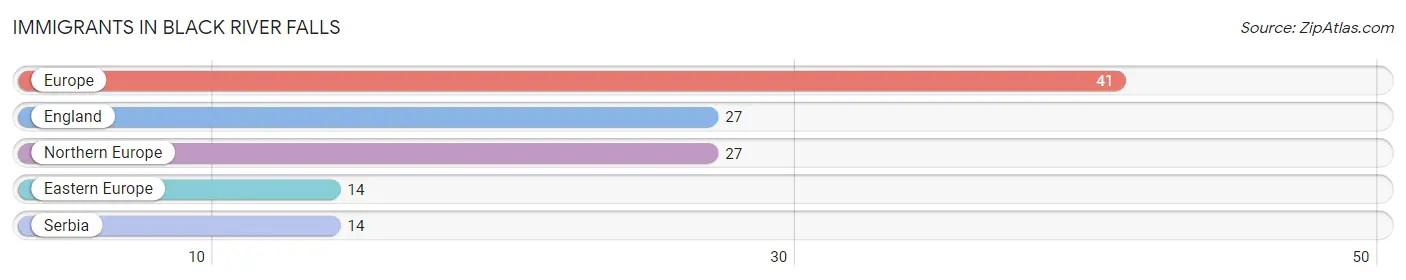
| Immigration Origin | # Population | % Population |
| Eastern Europe | 14 | 0.4% |
| England | 27 | 0.8% |
| Europe | 41 | 1.2% |
| Northern Europe | 27 | 0.8% |
| Serbia | 14 | 0.4% | View All 5 Rows |
Sex and Age in Black River Falls
Sex and Age in Black River Falls
The most populous age groups in Black River Falls are 35 to 39 Years (232 | 14.0%) for men and 60 to 64 Years (233 | 12.8%) for women.
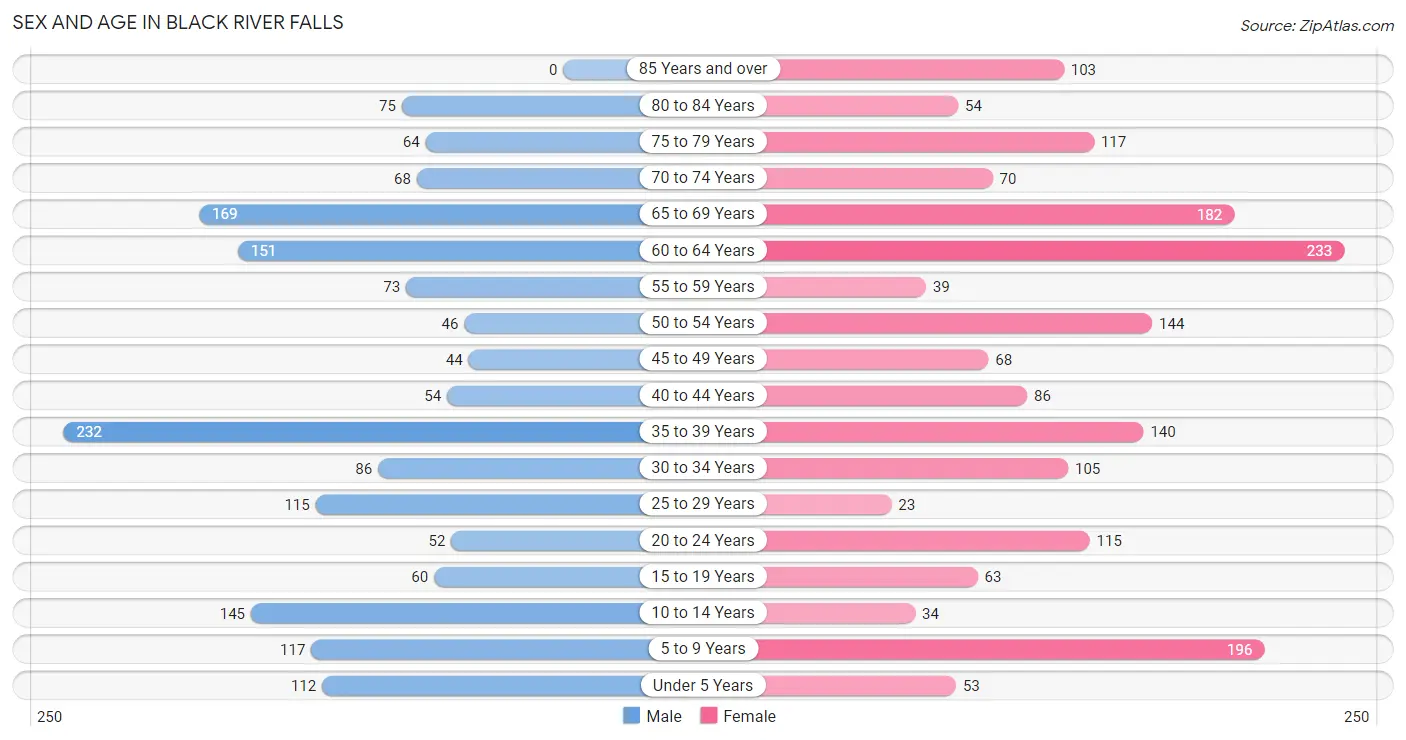
| Age Bracket | Male | Female |
| Under 5 Years | 112 (6.7%) | 53 (2.9%) |
| 5 to 9 Years | 117 (7.0%) | 196 (10.7%) |
| 10 to 14 Years | 145 (8.7%) | 34 (1.9%) |
| 15 to 19 Years | 60 (3.6%) | 63 (3.5%) |
| 20 to 24 Years | 52 (3.1%) | 115 (6.3%) |
| 25 to 29 Years | 115 (6.9%) | 23 (1.3%) |
| 30 to 34 Years | 86 (5.2%) | 105 (5.8%) |
| 35 to 39 Years | 232 (14.0%) | 140 (7.7%) |
| 40 to 44 Years | 54 (3.3%) | 86 (4.7%) |
| 45 to 49 Years | 44 (2.6%) | 68 (3.7%) |
| 50 to 54 Years | 46 (2.8%) | 144 (7.9%) |
| 55 to 59 Years | 73 (4.4%) | 39 (2.1%) |
| 60 to 64 Years | 151 (9.1%) | 233 (12.8%) |
| 65 to 69 Years | 169 (10.2%) | 182 (10.0%) |
| 70 to 74 Years | 68 (4.1%) | 70 (3.8%) |
| 75 to 79 Years | 64 (3.8%) | 117 (6.4%) |
| 80 to 84 Years | 75 (4.5%) | 54 (3.0%) |
| 85 Years and over | 0 (0.0%) | 103 (5.6%) |
| Total | 1,663 (100.0%) | 1,825 (100.0%) |
Families and Households in Black River Falls
Median Family Size in Black River Falls
The median family size in Black River Falls is 3.02 persons per family, with married-couple families (599 | 85.1%) accounting for the largest median family size of 3.05 persons per family. On the other hand, single male/father families (22 | 3.1%) represent the smallest median family size with 2.73 persons per family.
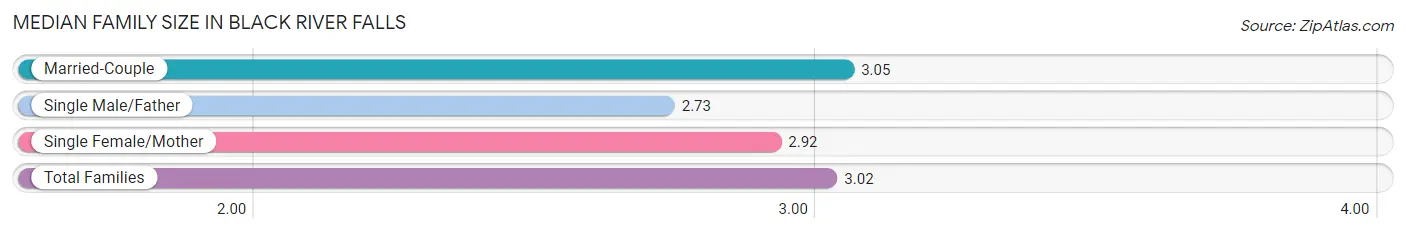
| Family Type | # Families | Family Size |
| Married-Couple | 599 (85.1%) | 3.05 |
| Single Male/Father | 22 (3.1%) | 2.73 |
| Single Female/Mother | 83 (11.8%) | 2.92 |
| Total Families | 704 (100.0%) | 3.02 |
Median Household Size in Black River Falls
The median household size in Black River Falls is 1.87 persons per household, with married-couple households (599 | 34.1%) accounting for the largest median household size of 3.05 persons per household. non-family households (1,051 | 59.9%) represent the smallest median household size with 1.10 persons per household.
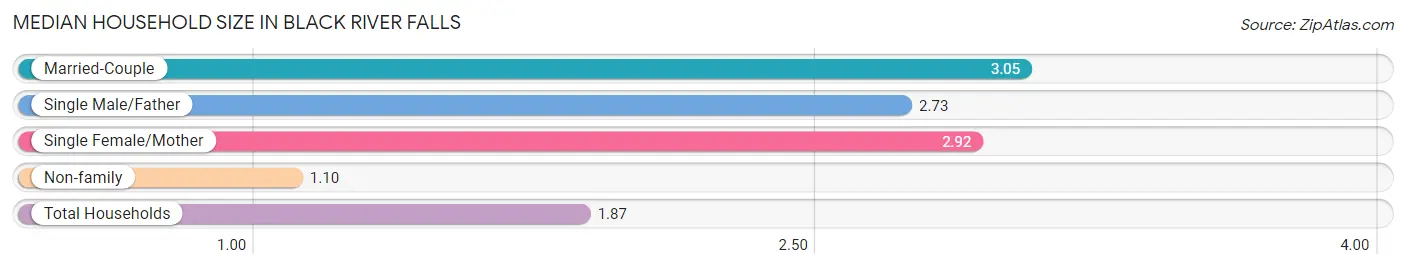
| Household Type | # Households | Household Size |
| Married-Couple | 599 (34.1%) | 3.05 |
| Single Male/Father | 22 (1.3%) | 2.73 |
| Single Female/Mother | 83 (4.7%) | 2.92 |
| Non-family | 1,051 (59.9%) | 1.10 |
| Total Households | 1,755 (100.0%) | 1.87 |
Household Size by Marriage Status in Black River Falls
Out of a total of 1,755 households in Black River Falls, 704 (40.1%) are family households, while 1,051 (59.9%) are nonfamily households. The most numerous type of family households are 2-person households, comprising 341, and the most common type of nonfamily households are 1-person households, comprising 974.
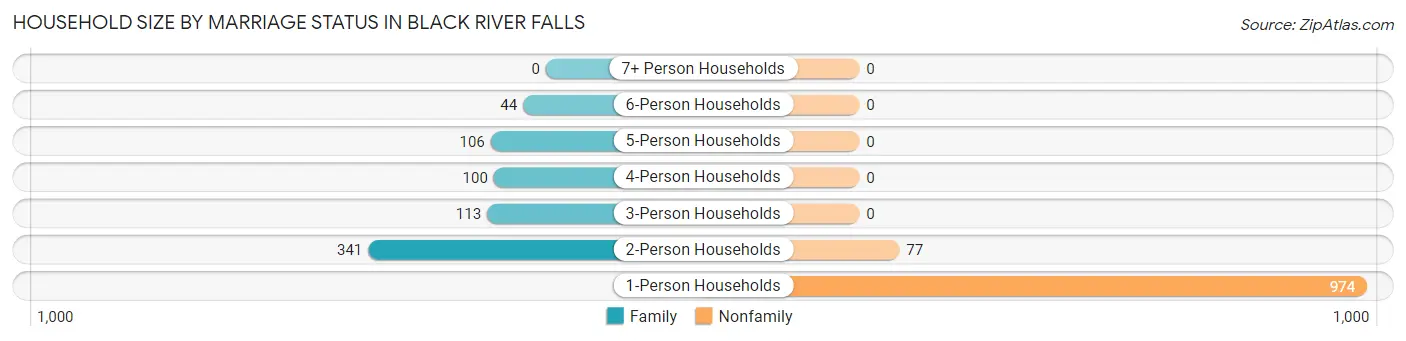
| Household Size | Family Households | Nonfamily Households |
| 1-Person Households | - | 974 (55.5%) |
| 2-Person Households | 341 (19.4%) | 77 (4.4%) |
| 3-Person Households | 113 (6.4%) | 0 (0.0%) |
| 4-Person Households | 100 (5.7%) | 0 (0.0%) |
| 5-Person Households | 106 (6.0%) | 0 (0.0%) |
| 6-Person Households | 44 (2.5%) | 0 (0.0%) |
| 7+ Person Households | 0 (0.0%) | 0 (0.0%) |
| Total | 704 (40.1%) | 1,051 (59.9%) |
Female Fertility in Black River Falls
Fertility by Age in Black River Falls
Average fertility rate in Black River Falls is 71.0 births per 1,000 women. Women in the age bracket of 20 to 34 years have the highest fertility rate with 86.0 births per 1,000 women. Women in the age bracket of 35 to 50 years acount for 54.3% of all women with births.
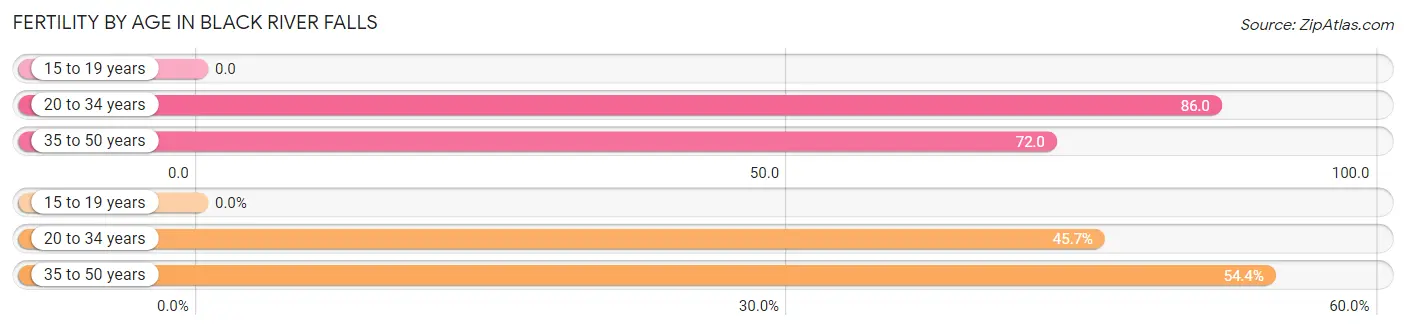
| Age Bracket | Women with Births | Births / 1,000 Women |
| 15 to 19 years | 0 (0.0%) | 0.0 |
| 20 to 34 years | 21 (45.7%) | 86.0 |
| 35 to 50 years | 25 (54.3%) | 72.0 |
| Total | 46 (100.0%) | 71.0 |
Fertility by Age by Marriage Status in Black River Falls
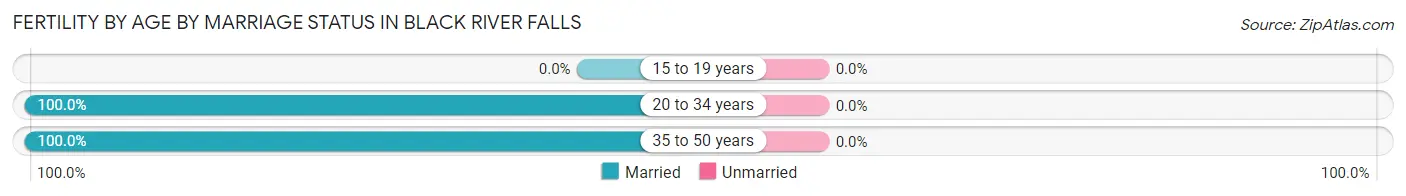
| Age Bracket | Married | Unmarried |
| 15 to 19 years | 0 (0.0%) | 0 (0.0%) |
| 20 to 34 years | 21 (100.0%) | 0 (0.0%) |
| 35 to 50 years | 25 (100.0%) | 0 (0.0%) |
| Total | 46 (100.0%) | 0 (0.0%) |
Fertility by Education in Black River Falls
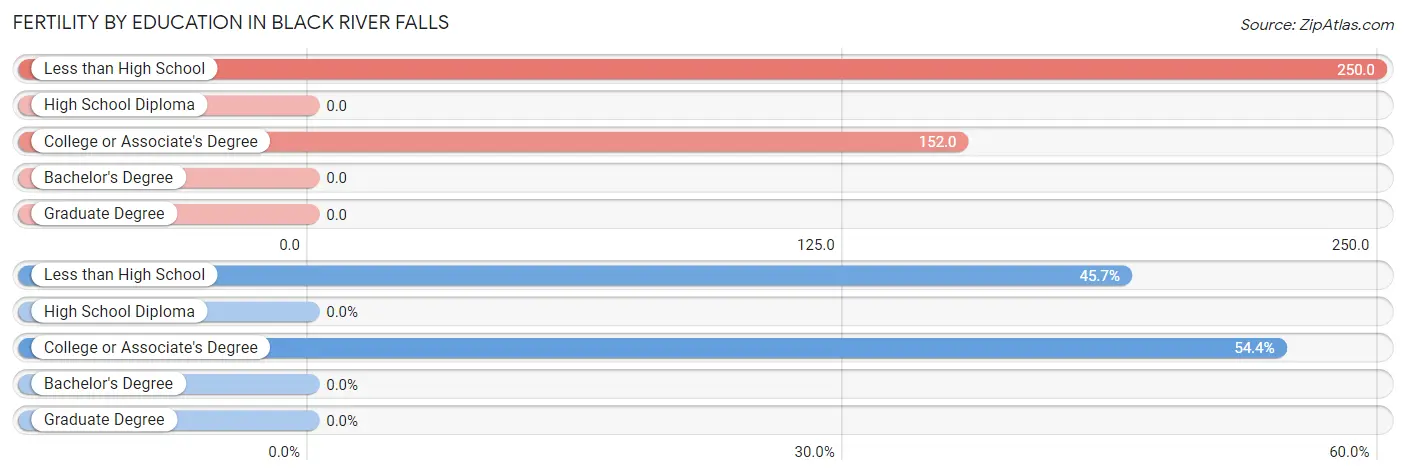
| Educational Attainment | Women with Births | Births / 1,000 Women |
| Less than High School | 21 (45.7%) | 250.0 |
| High School Diploma | 0 (0.0%) | 0.0 |
| College or Associate's Degree | 25 (54.3%) | 152.0 |
| Bachelor's Degree | 0 (0.0%) | 0.0 |
| Graduate Degree | 0 (0.0%) | 0.0 |
| Total | 46 (100.0%) | 71.0 |
Fertility by Education by Marriage Status in Black River Falls
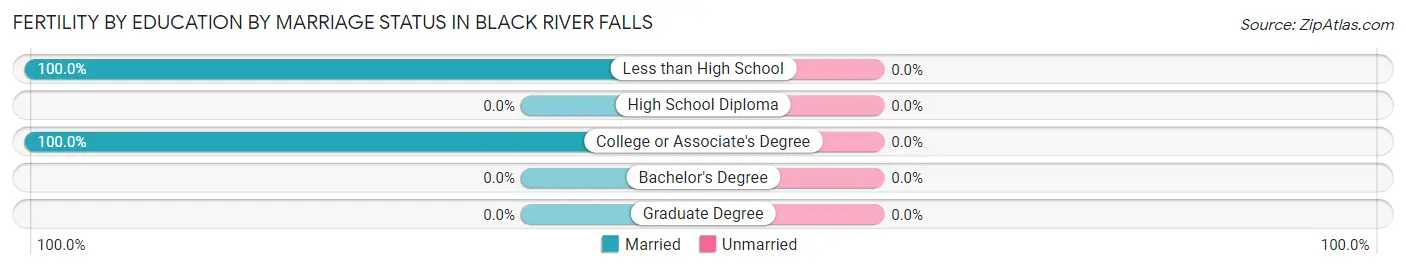
| Educational Attainment | Married | Unmarried |
| Less than High School | 21 (100.0%) | 0 (0.0%) |
| High School Diploma | 0 (0.0%) | 0 (0.0%) |
| College or Associate's Degree | 25 (100.0%) | 0 (0.0%) |
| Bachelor's Degree | 0 (0.0%) | 0 (0.0%) |
| Graduate Degree | 0 (0.0%) | 0 (0.0%) |
| Total | 46 (100.0%) | 0 (0.0%) |
Employment Characteristics in Black River Falls
Employment by Class of Employer in Black River Falls
Among the 1,417 employed individuals in Black River Falls, private company employees (915 | 64.6%), local government employees (134 | 9.5%), and not-for-profit organizations (115 | 8.1%) make up the most common classes of employment.
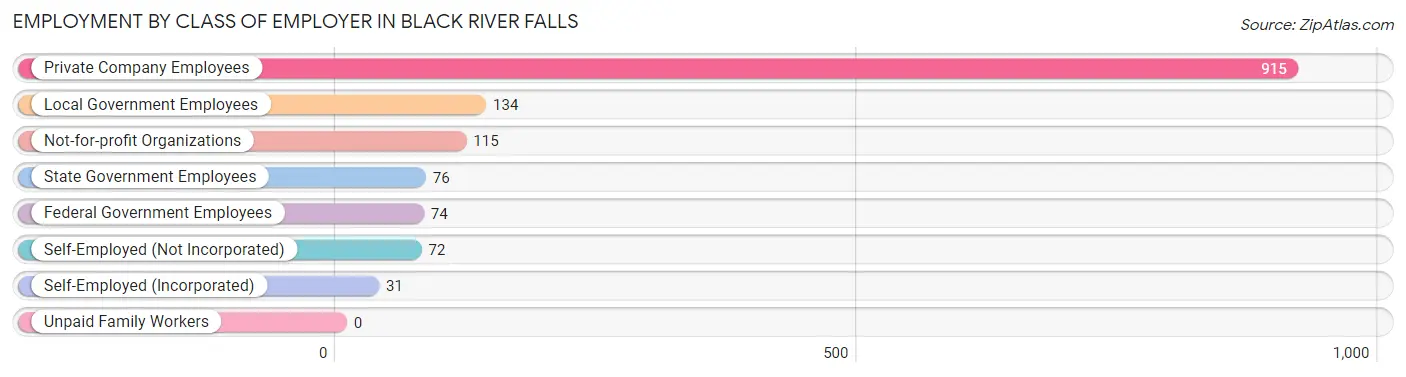
| Employer Class | # Employees | % Employees |
| Private Company Employees | 915 | 64.6% |
| Self-Employed (Incorporated) | 31 | 2.2% |
| Self-Employed (Not Incorporated) | 72 | 5.1% |
| Not-for-profit Organizations | 115 | 8.1% |
| Local Government Employees | 134 | 9.5% |
| State Government Employees | 76 | 5.4% |
| Federal Government Employees | 74 | 5.2% |
| Unpaid Family Workers | 0 | 0.0% |
| Total | 1,417 | 100.0% |
Employment Status by Age in Black River Falls
According to the labor force statistics for Black River Falls, out of the total population over 16 years of age (2,831), 52.9% or 1,498 individuals are in the labor force, with 4.5% or 67 of them unemployed. The age group with the highest labor force participation rate is 25 to 29 years, with 97.8% or 135 individuals in the labor force. Within the labor force, the 55 to 59 years age range has the highest percentage of unemployed individuals, with 19.6% or 18 of them being unemployed.
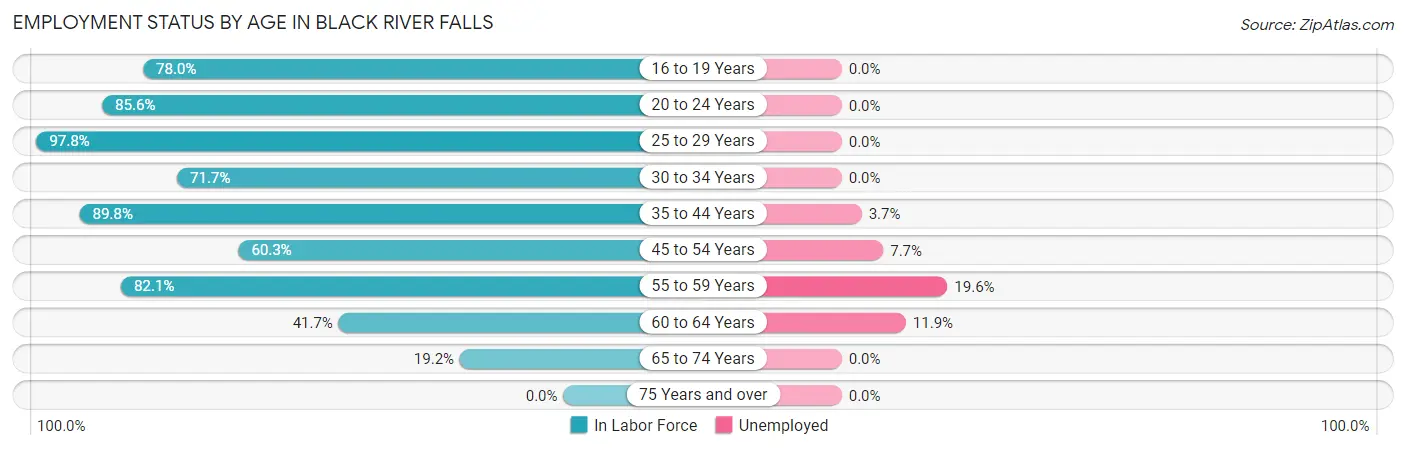
| Age Bracket | In Labor Force | Unemployed |
| 16 to 19 Years | 96 (78.0%) | 0 (0.0%) |
| 20 to 24 Years | 143 (85.6%) | 0 (0.0%) |
| 25 to 29 Years | 135 (97.8%) | 0 (0.0%) |
| 30 to 34 Years | 137 (71.7%) | 0 (0.0%) |
| 35 to 44 Years | 460 (89.8%) | 17 (3.7%) |
| 45 to 54 Years | 182 (60.3%) | 14 (7.7%) |
| 55 to 59 Years | 92 (82.1%) | 18 (19.6%) |
| 60 to 64 Years | 160 (41.7%) | 19 (11.9%) |
| 65 to 74 Years | 94 (19.2%) | 0 (0.0%) |
| 75 Years and over | 0 (0.0%) | 0 (0.0%) |
| Total | 1,498 (52.9%) | 67 (4.5%) |
Employment Status by Educational Attainment in Black River Falls
According to labor force statistics for Black River Falls, 71.1% of individuals (1,165) out of the total population between 25 and 64 years of age (1,639) are in the labor force, with 5.8% or 68 of them being unemployed. The group with the highest labor force participation rate are those with the educational attainment of bachelor's degree or higher, with 98.5% or 269 individuals in the labor force. Within the labor force, individuals with less than high school education have the highest percentage of unemployment, with 100.0% or 19 of them being unemployed.
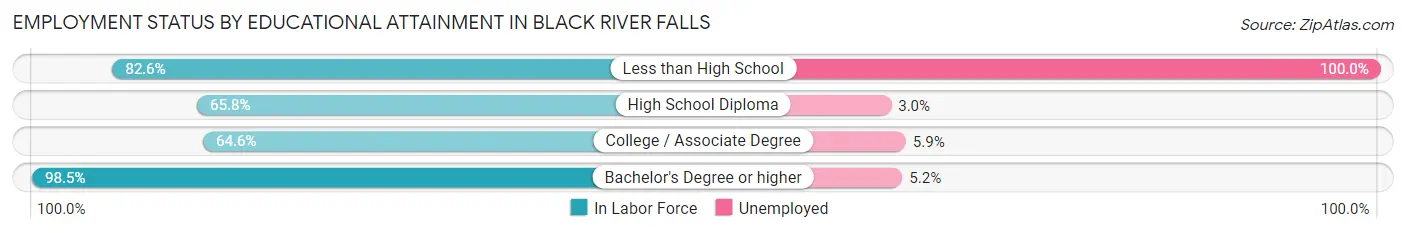
| Educational Attainment | In Labor Force | Unemployed |
| Less than High School | 19 (82.6%) | 23 (100.0%) |
| High School Diploma | 573 (65.8%) | 26 (3.0%) |
| College / Associate Degree | 305 (64.6%) | 28 (5.9%) |
| Bachelor's Degree or higher | 269 (98.5%) | 14 (5.2%) |
| Total | 1,165 (71.1%) | 95 (5.8%) |
Employment Occupations by Sex in Black River Falls
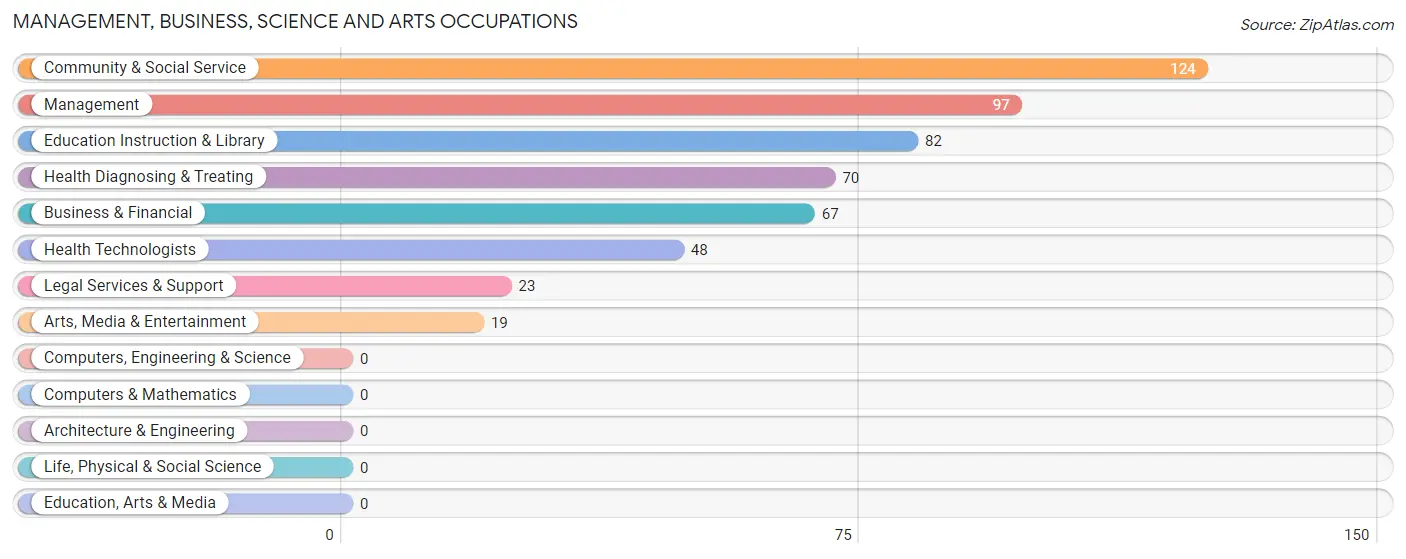
Management, Business, Science and Arts Occupations
The most common Management, Business, Science and Arts occupations in Black River Falls are Community & Social Service (124 | 8.7%), Management (97 | 6.8%), Education Instruction & Library (82 | 5.7%), Health Diagnosing & Treating (70 | 4.9%), and Business & Financial (67 | 4.7%).
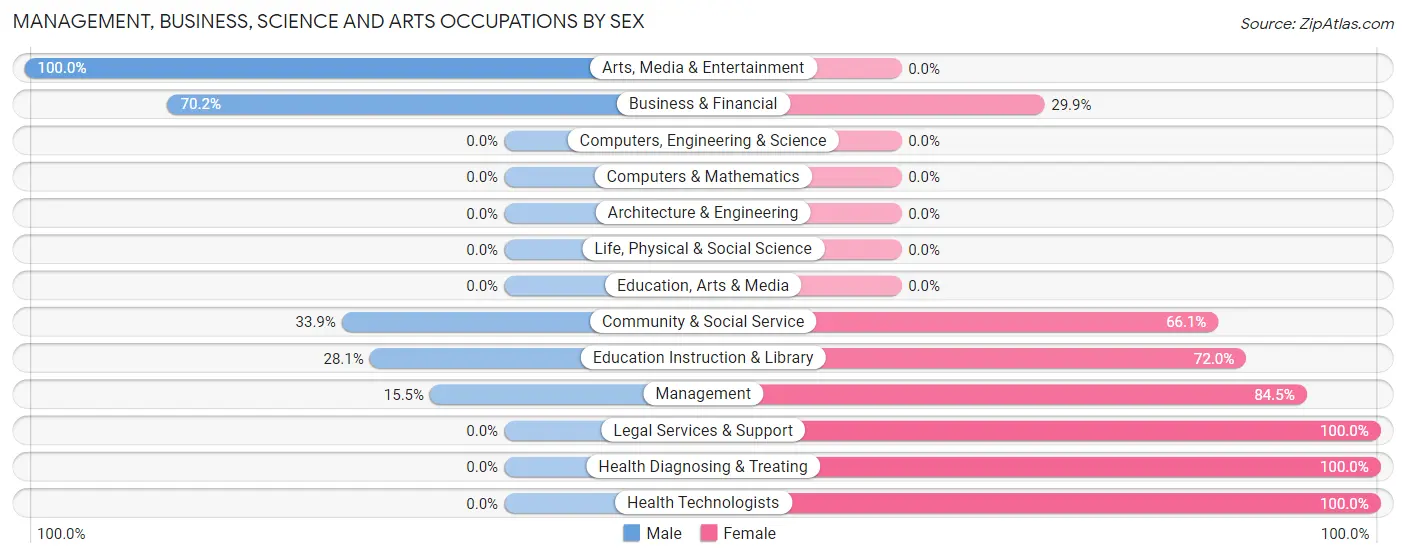
Management, Business, Science and Arts Occupations by Sex
Within the Management, Business, Science and Arts occupations in Black River Falls, the most male-oriented occupations are Arts, Media & Entertainment (100.0%), Business & Financial (70.2%), and Community & Social Service (33.9%), while the most female-oriented occupations are Legal Services & Support (100.0%), Health Diagnosing & Treating (100.0%), and Health Technologists (100.0%).
| Occupation | Male | Female |
| Management | 15 (15.5%) | 82 (84.5%) |
| Business & Financial | 47 (70.2%) | 20 (29.8%) |
| Computers, Engineering & Science | 0 (0.0%) | 0 (0.0%) |
| Computers & Mathematics | 0 (0.0%) | 0 (0.0%) |
| Architecture & Engineering | 0 (0.0%) | 0 (0.0%) |
| Life, Physical & Social Science | 0 (0.0%) | 0 (0.0%) |
| Community & Social Service | 42 (33.9%) | 82 (66.1%) |
| Education, Arts & Media | 0 (0.0%) | 0 (0.0%) |
| Legal Services & Support | 0 (0.0%) | 23 (100.0%) |
| Education Instruction & Library | 23 (28.1%) | 59 (72.0%) |
| Arts, Media & Entertainment | 19 (100.0%) | 0 (0.0%) |
| Health Diagnosing & Treating | 0 (0.0%) | 70 (100.0%) |
| Health Technologists | 0 (0.0%) | 48 (100.0%) |
| Total (Category) | 104 (29.0%) | 254 (71.0%) |
| Total (Overall) | 731 (51.1%) | 700 (48.9%) |
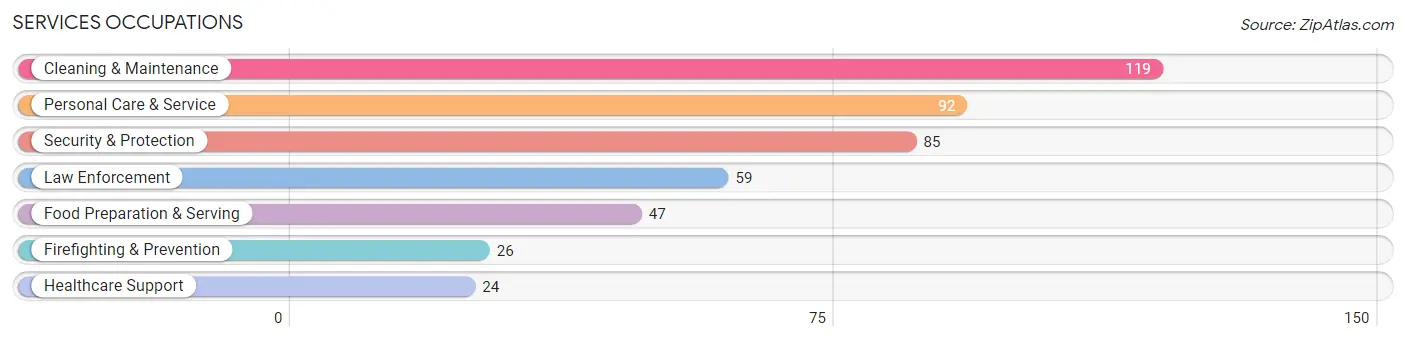
Services Occupations
The most common Services occupations in Black River Falls are Cleaning & Maintenance (119 | 8.3%), Personal Care & Service (92 | 6.4%), Security & Protection (85 | 5.9%), Law Enforcement (59 | 4.1%), and Food Preparation & Serving (47 | 3.3%).
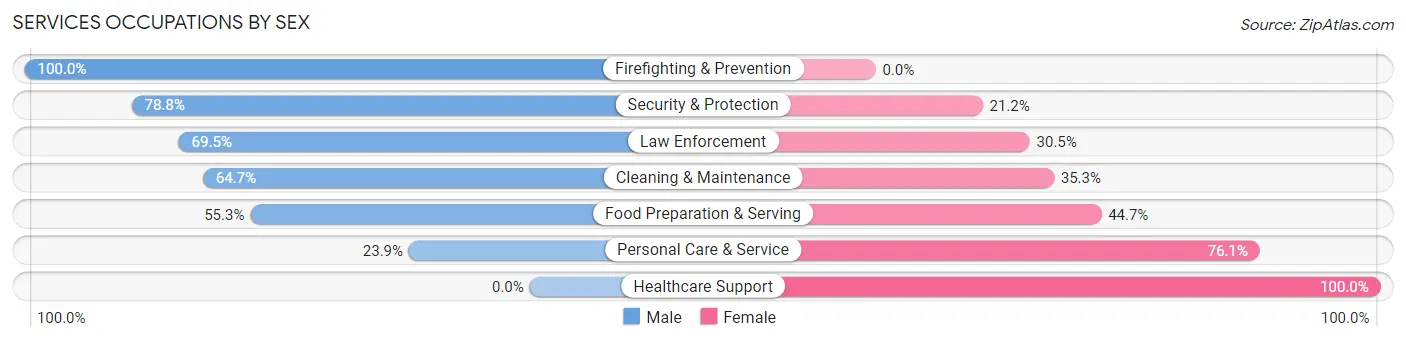
Services Occupations by Sex
Within the Services occupations in Black River Falls, the most male-oriented occupations are Firefighting & Prevention (100.0%), Security & Protection (78.8%), and Law Enforcement (69.5%), while the most female-oriented occupations are Healthcare Support (100.0%), Personal Care & Service (76.1%), and Food Preparation & Serving (44.7%).
| Occupation | Male | Female |
| Healthcare Support | 0 (0.0%) | 24 (100.0%) |
| Security & Protection | 67 (78.8%) | 18 (21.2%) |
| Firefighting & Prevention | 26 (100.0%) | 0 (0.0%) |
| Law Enforcement | 41 (69.5%) | 18 (30.5%) |
| Food Preparation & Serving | 26 (55.3%) | 21 (44.7%) |
| Cleaning & Maintenance | 77 (64.7%) | 42 (35.3%) |
| Personal Care & Service | 22 (23.9%) | 70 (76.1%) |
| Total (Category) | 192 (52.3%) | 175 (47.7%) |
| Total (Overall) | 731 (51.1%) | 700 (48.9%) |
Sales and Office Occupations
The most common Sales and Office occupations in Black River Falls are Sales & Related (178 | 12.4%), and Office & Administration (38 | 2.7%).
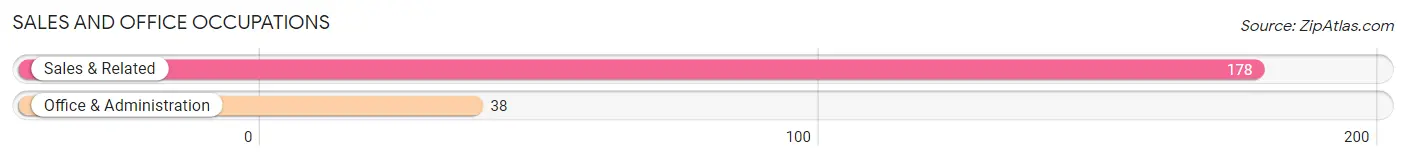
Sales and Office Occupations by Sex

| Occupation | Male | Female |
| Sales & Related | 90 (50.6%) | 88 (49.4%) |
| Office & Administration | 0 (0.0%) | 38 (100.0%) |
| Total (Category) | 90 (41.7%) | 126 (58.3%) |
| Total (Overall) | 731 (51.1%) | 700 (48.9%) |
Natural Resources, Construction and Maintenance Occupations
The most common Natural Resources, Construction and Maintenance occupations in Black River Falls are Installation, Maintenance & Repair (127 | 8.9%), and Construction & Extraction (43 | 3.0%).
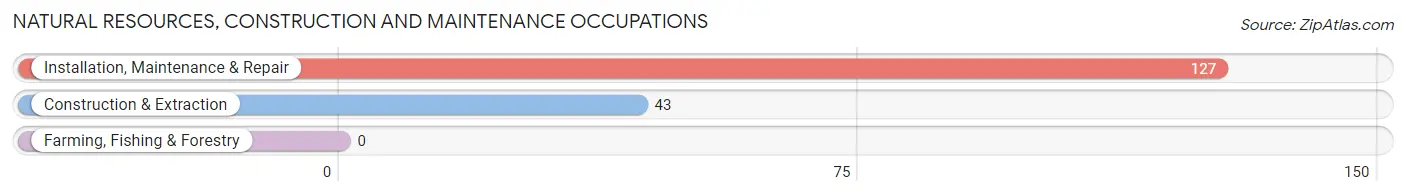
Natural Resources, Construction and Maintenance Occupations by Sex
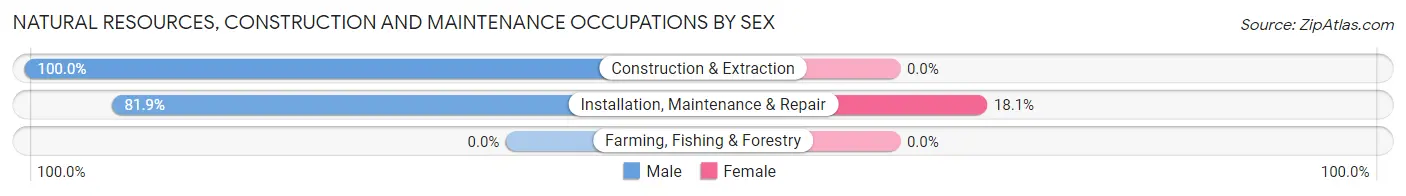
| Occupation | Male | Female |
| Farming, Fishing & Forestry | 0 (0.0%) | 0 (0.0%) |
| Construction & Extraction | 43 (100.0%) | 0 (0.0%) |
| Installation, Maintenance & Repair | 104 (81.9%) | 23 (18.1%) |
| Total (Category) | 147 (86.5%) | 23 (13.5%) |
| Total (Overall) | 731 (51.1%) | 700 (48.9%) |
Production, Transportation and Moving Occupations
The most common Production, Transportation and Moving occupations in Black River Falls are Production (179 | 12.5%), Material Moving (110 | 7.7%), and Transportation (31 | 2.2%).
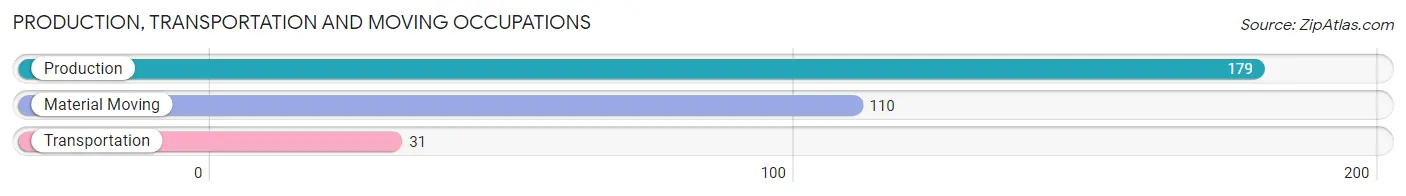
Production, Transportation and Moving Occupations by Sex
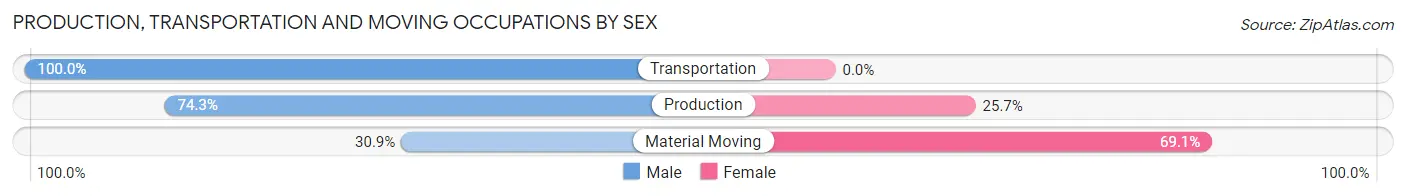
| Occupation | Male | Female |
| Production | 133 (74.3%) | 46 (25.7%) |
| Transportation | 31 (100.0%) | 0 (0.0%) |
| Material Moving | 34 (30.9%) | 76 (69.1%) |
| Total (Category) | 198 (61.9%) | 122 (38.1%) |
| Total (Overall) | 731 (51.1%) | 700 (48.9%) |
Employment Industries by Sex in Black River Falls
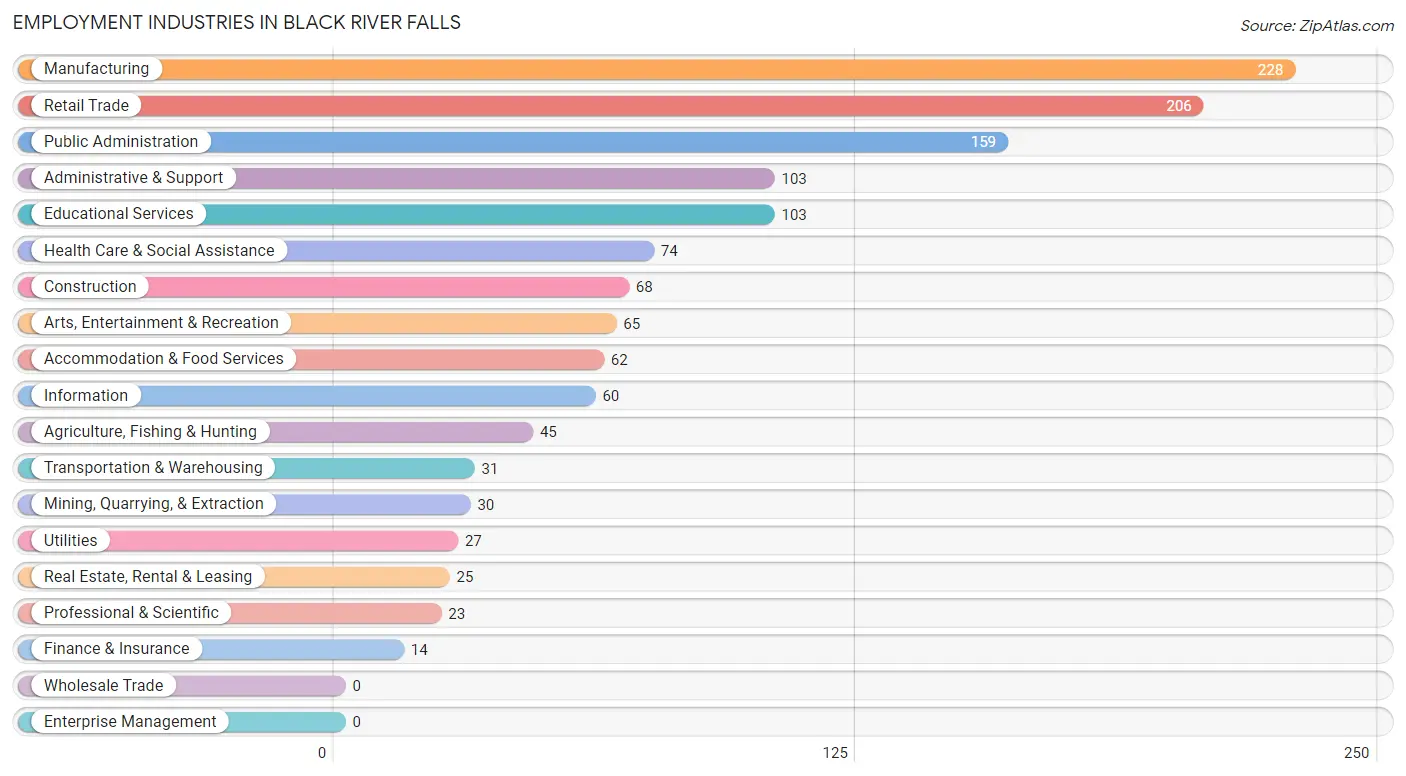
Employment Industries in Black River Falls
The major employment industries in Black River Falls include Manufacturing (228 | 15.9%), Retail Trade (206 | 14.4%), Public Administration (159 | 11.1%), Administrative & Support (103 | 7.2%), and Educational Services (103 | 7.2%).
Employment Industries by Sex in Black River Falls
The Black River Falls industries that see more men than women are Mining, Quarrying, & Extraction (100.0%), Transportation & Warehousing (100.0%), and Utilities (100.0%), whereas the industries that tend to have a higher number of women are Agriculture, Fishing & Hunting (100.0%), Professional & Scientific (100.0%), and Educational Services (77.7%).
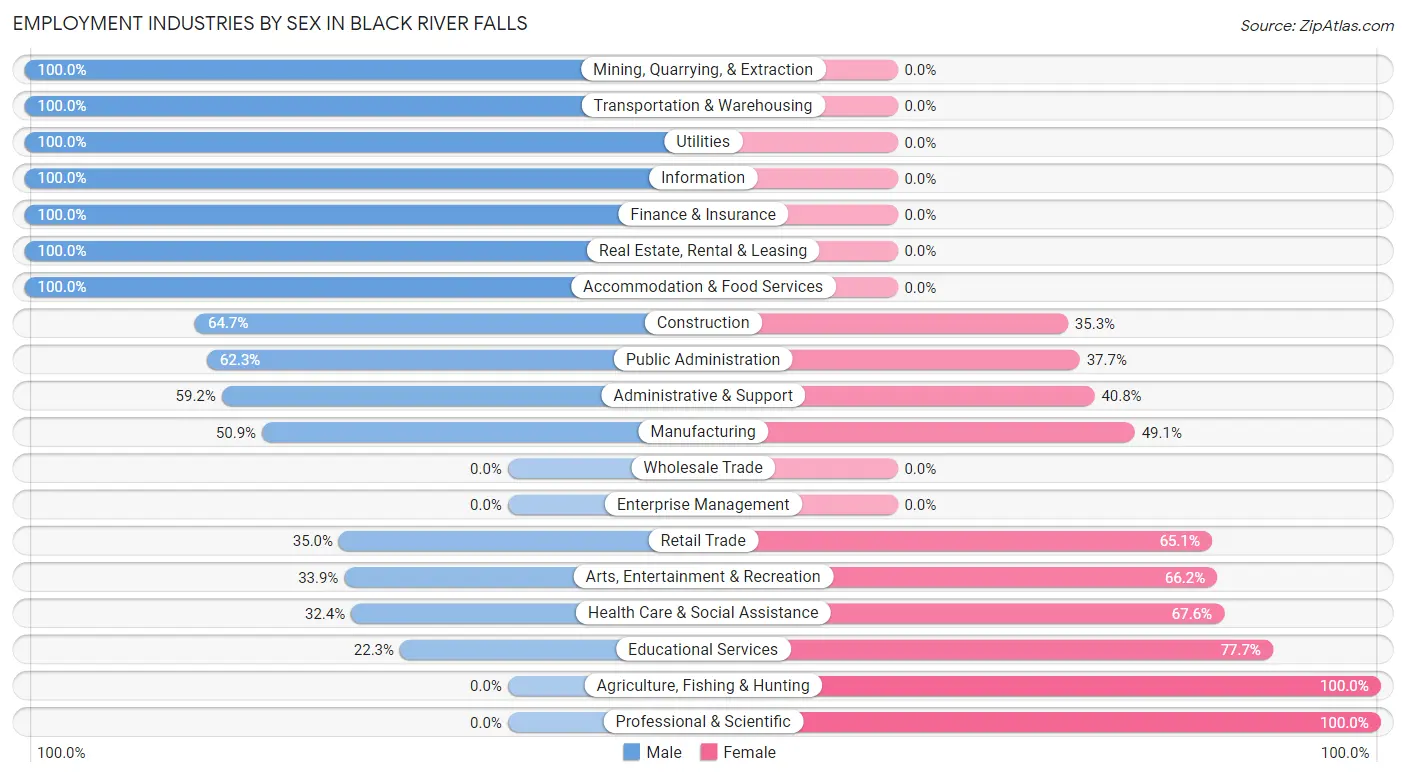
| Industry | Male | Female |
| Agriculture, Fishing & Hunting | 0 (0.0%) | 45 (100.0%) |
| Mining, Quarrying, & Extraction | 30 (100.0%) | 0 (0.0%) |
| Construction | 44 (64.7%) | 24 (35.3%) |
| Manufacturing | 116 (50.9%) | 112 (49.1%) |
| Wholesale Trade | 0 (0.0%) | 0 (0.0%) |
| Retail Trade | 72 (34.9%) | 134 (65.0%) |
| Transportation & Warehousing | 31 (100.0%) | 0 (0.0%) |
| Utilities | 27 (100.0%) | 0 (0.0%) |
| Information | 60 (100.0%) | 0 (0.0%) |
| Finance & Insurance | 14 (100.0%) | 0 (0.0%) |
| Real Estate, Rental & Leasing | 25 (100.0%) | 0 (0.0%) |
| Professional & Scientific | 0 (0.0%) | 23 (100.0%) |
| Enterprise Management | 0 (0.0%) | 0 (0.0%) |
| Administrative & Support | 61 (59.2%) | 42 (40.8%) |
| Educational Services | 23 (22.3%) | 80 (77.7%) |
| Health Care & Social Assistance | 24 (32.4%) | 50 (67.6%) |
| Arts, Entertainment & Recreation | 22 (33.9%) | 43 (66.1%) |
| Accommodation & Food Services | 62 (100.0%) | 0 (0.0%) |
| Public Administration | 99 (62.3%) | 60 (37.7%) |
| Total | 731 (51.1%) | 700 (48.9%) |
Education in Black River Falls
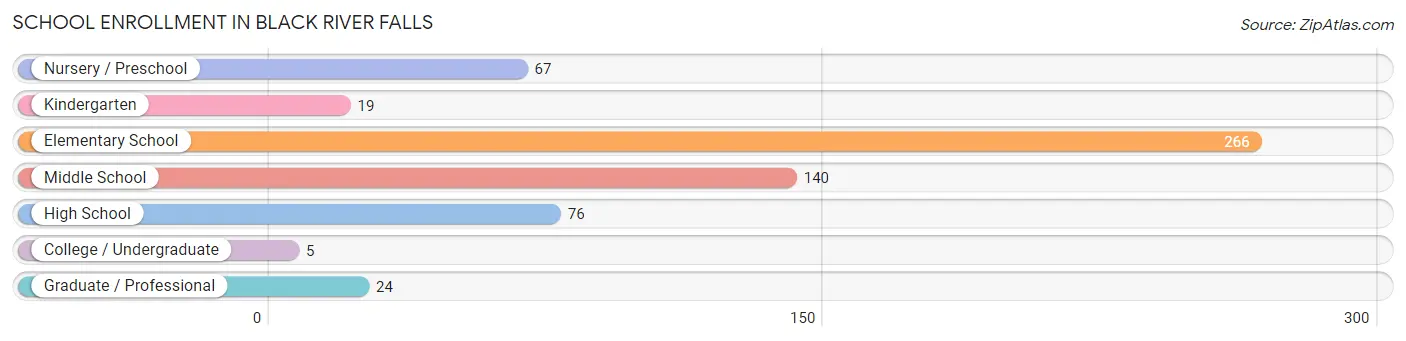
School Enrollment in Black River Falls
The most common levels of schooling among the 597 students in Black River Falls are elementary school (266 | 44.6%), middle school (140 | 23.4%), and high school (76 | 12.7%).
| School Level | # Students | % Students |
| Nursery / Preschool | 67 | 11.2% |
| Kindergarten | 19 | 3.2% |
| Elementary School | 266 | 44.6% |
| Middle School | 140 | 23.4% |
| High School | 76 | 12.7% |
| College / Undergraduate | 5 | 0.8% |
| Graduate / Professional | 24 | 4.0% |
| Total | 597 | 100.0% |
School Enrollment by Age by Funding Source in Black River Falls
Out of a total of 597 students who are enrolled in schools in Black River Falls, 1 (0.2%) attend a private institution, while the remaining 596 (99.8%) are enrolled in public schools. The age group of 35 years and over has the highest likelihood of being enrolled in private schools, with 1 (4.0% in the age bracket) enrolled. Conversely, the age group of 5 to 9 year old has the lowest likelihood of being enrolled in a private school, with 313 (100.0% in the age bracket) attending a public institution.
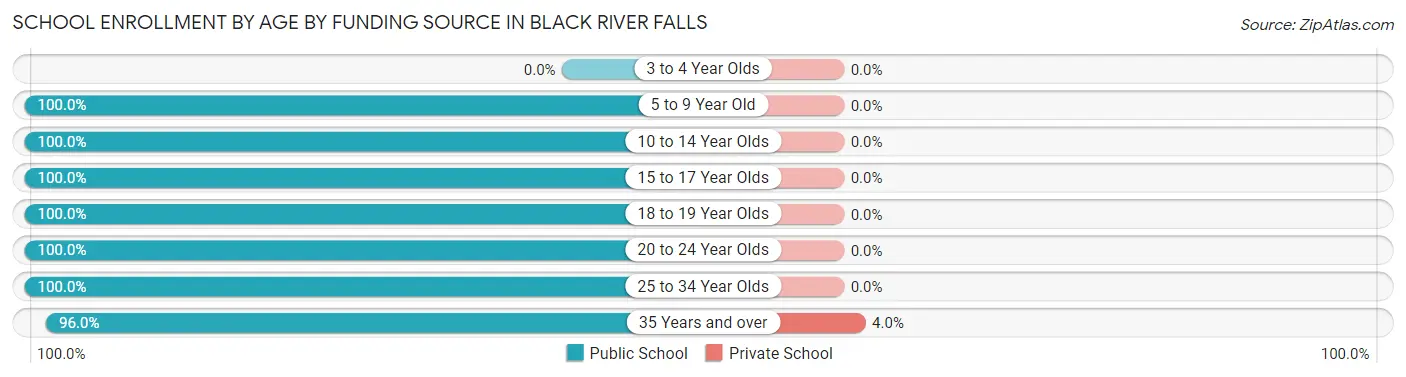
| Age Bracket | Public School | Private School |
| 3 to 4 Year Olds | 0 (0.0%) | 0 (0.0%) |
| 5 to 9 Year Old | 313 (100.0%) | 0 (0.0%) |
| 10 to 14 Year Olds | 179 (100.0%) | 0 (0.0%) |
| 15 to 17 Year Olds | 48 (100.0%) | 0 (0.0%) |
| 18 to 19 Year Olds | 28 (100.0%) | 0 (0.0%) |
| 20 to 24 Year Olds | 3 (100.0%) | 0 (0.0%) |
| 25 to 34 Year Olds | 1 (100.0%) | 0 (0.0%) |
| 35 Years and over | 24 (96.0%) | 1 (4.0%) |
| Total | 596 (99.8%) | 1 (0.2%) |
Educational Attainment by Field of Study in Black River Falls
Education (161 | 30.2%), science & technology (73 | 13.7%), bio, nature & agricultural (59 | 11.1%), business (58 | 10.9%), and psychology (47 | 8.8%) are the most common fields of study among 533 individuals in Black River Falls who have obtained a bachelor's degree or higher.
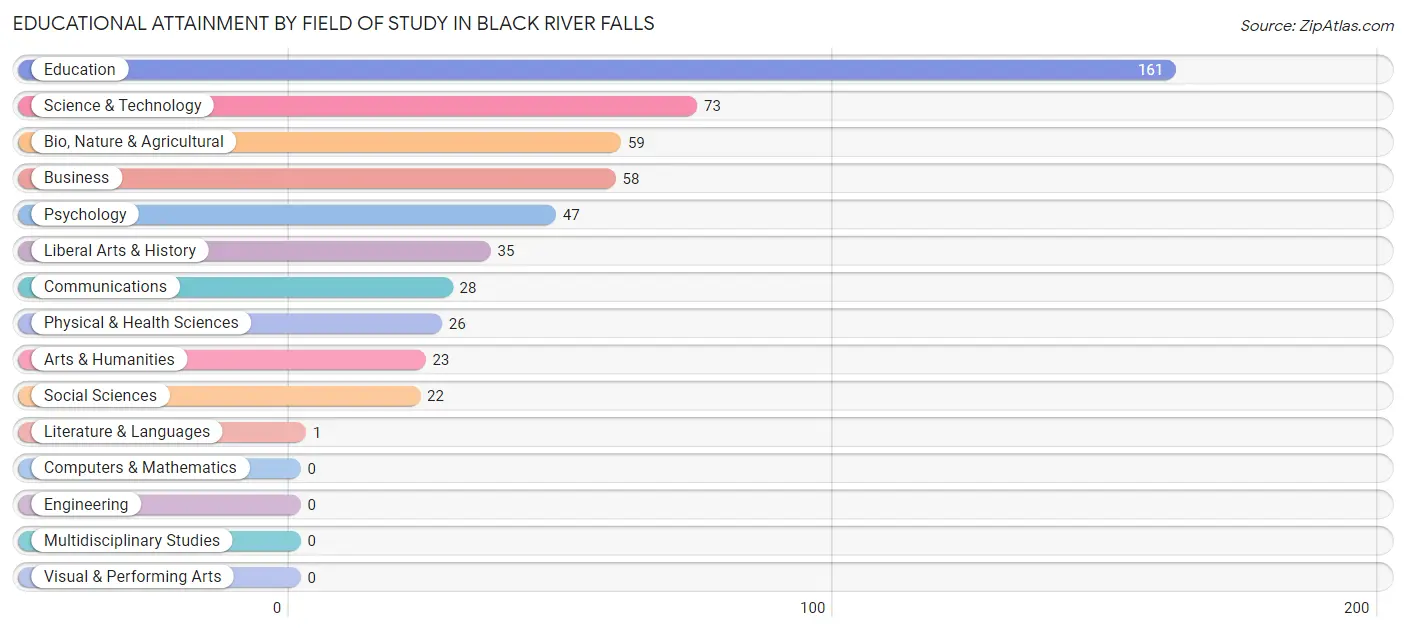
| Field of Study | # Graduates | % Graduates |
| Computers & Mathematics | 0 | 0.0% |
| Bio, Nature & Agricultural | 59 | 11.1% |
| Physical & Health Sciences | 26 | 4.9% |
| Psychology | 47 | 8.8% |
| Social Sciences | 22 | 4.1% |
| Engineering | 0 | 0.0% |
| Multidisciplinary Studies | 0 | 0.0% |
| Science & Technology | 73 | 13.7% |
| Business | 58 | 10.9% |
| Education | 161 | 30.2% |
| Literature & Languages | 1 | 0.2% |
| Liberal Arts & History | 35 | 6.6% |
| Visual & Performing Arts | 0 | 0.0% |
| Communications | 28 | 5.2% |
| Arts & Humanities | 23 | 4.3% |
| Total | 533 | 100.0% |
Transportation & Commute in Black River Falls
Vehicle Availability by Sex in Black River Falls
The most prevalent vehicle ownership categories in Black River Falls are males with 2 vehicles (475, accounting for 65.0%) and females with 2 vehicles (342, making up 69.4%).
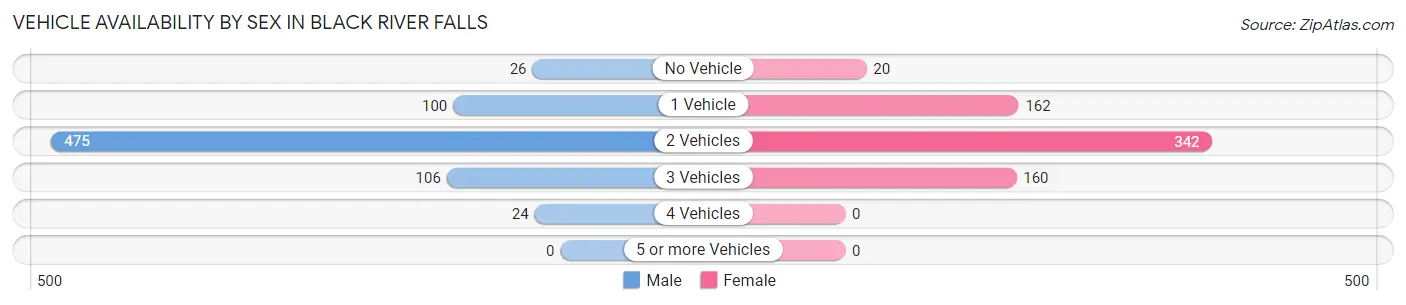
| Vehicles Available | Male | Female |
| No Vehicle | 26 (3.6%) | 20 (2.9%) |
| 1 Vehicle | 100 (13.7%) | 162 (23.7%) |
| 2 Vehicles | 475 (65.0%) | 342 (50.0%) |
| 3 Vehicles | 106 (14.5%) | 160 (23.4%) |
| 4 Vehicles | 24 (3.3%) | 0 (0.0%) |
| 5 or more Vehicles | 0 (0.0%) | 0 (0.0%) |
| Total | 731 (100.0%) | 684 (100.0%) |
Commute Time in Black River Falls
The most frequently occuring commute durations in Black River Falls are 5 to 9 minutes (374 commuters, 27.0%), less than 5 minutes (318 commuters, 23.0%), and 10 to 14 minutes (148 commuters, 10.7%).
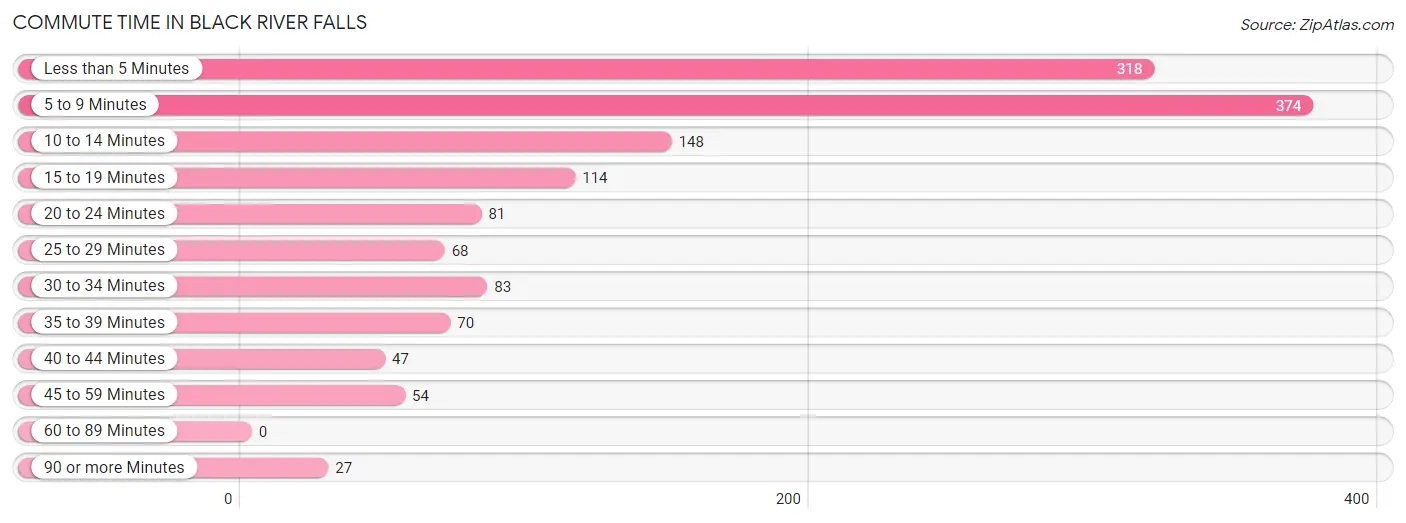
| Commute Time | # Commuters | % Commuters |
| Less than 5 Minutes | 318 | 23.0% |
| 5 to 9 Minutes | 374 | 27.0% |
| 10 to 14 Minutes | 148 | 10.7% |
| 15 to 19 Minutes | 114 | 8.2% |
| 20 to 24 Minutes | 81 | 5.9% |
| 25 to 29 Minutes | 68 | 4.9% |
| 30 to 34 Minutes | 83 | 6.0% |
| 35 to 39 Minutes | 70 | 5.1% |
| 40 to 44 Minutes | 47 | 3.4% |
| 45 to 59 Minutes | 54 | 3.9% |
| 60 to 89 Minutes | 0 | 0.0% |
| 90 or more Minutes | 27 | 1.9% |
Commute Time by Sex in Black River Falls
The most common commute times in Black River Falls are 5 to 9 minutes (167 commuters, 23.9%) for males and 5 to 9 minutes (207 commuters, 30.3%) for females.
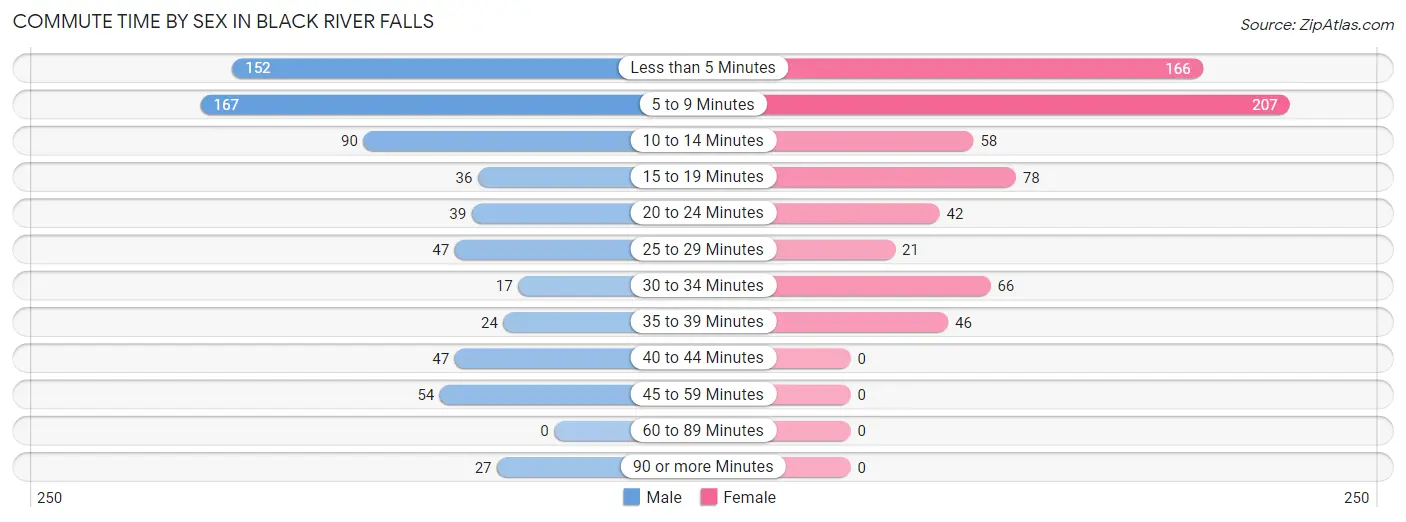
| Commute Time | Male | Female |
| Less than 5 Minutes | 152 (21.7%) | 166 (24.3%) |
| 5 to 9 Minutes | 167 (23.9%) | 207 (30.3%) |
| 10 to 14 Minutes | 90 (12.9%) | 58 (8.5%) |
| 15 to 19 Minutes | 36 (5.1%) | 78 (11.4%) |
| 20 to 24 Minutes | 39 (5.6%) | 42 (6.1%) |
| 25 to 29 Minutes | 47 (6.7%) | 21 (3.1%) |
| 30 to 34 Minutes | 17 (2.4%) | 66 (9.7%) |
| 35 to 39 Minutes | 24 (3.4%) | 46 (6.7%) |
| 40 to 44 Minutes | 47 (6.7%) | 0 (0.0%) |
| 45 to 59 Minutes | 54 (7.7%) | 0 (0.0%) |
| 60 to 89 Minutes | 0 (0.0%) | 0 (0.0%) |
| 90 or more Minutes | 27 (3.9%) | 0 (0.0%) |
Time of Departure to Work by Sex in Black River Falls
The most frequent times of departure to work in Black River Falls are 4:00 PM to 11:59 PM (184, 26.3%) for males and 7:30 AM to 7:59 AM (170, 24.8%) for females.
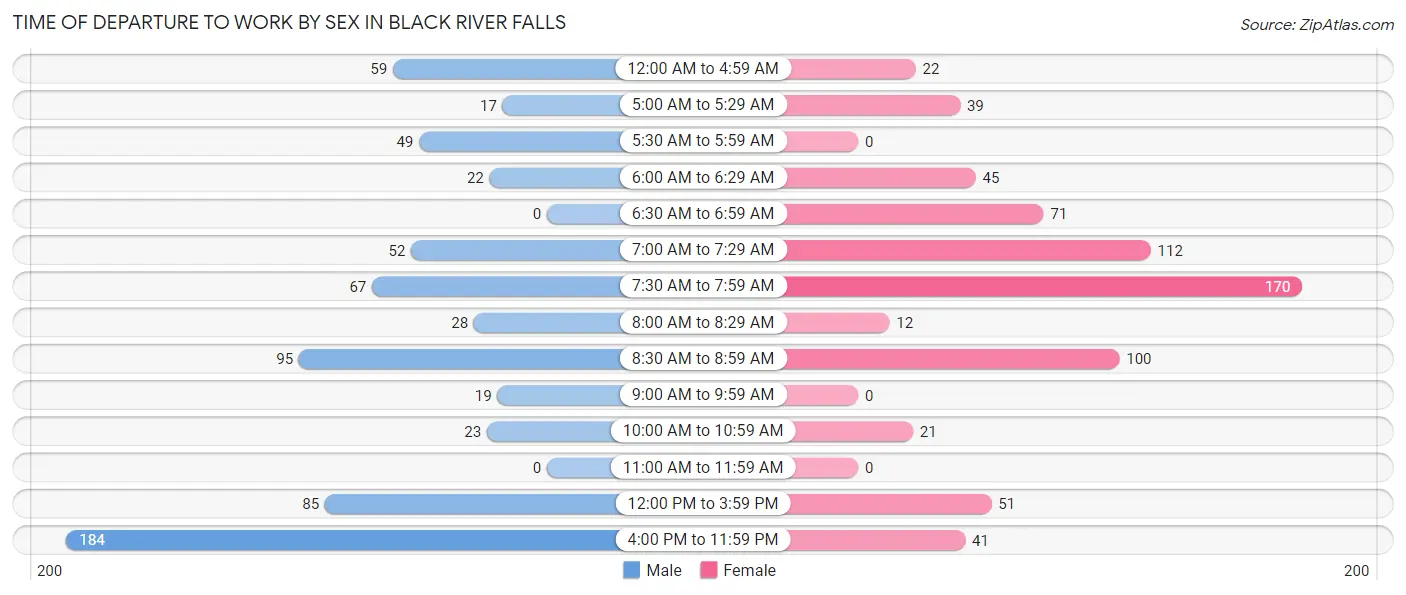
| Time of Departure | Male | Female |
| 12:00 AM to 4:59 AM | 59 (8.4%) | 22 (3.2%) |
| 5:00 AM to 5:29 AM | 17 (2.4%) | 39 (5.7%) |
| 5:30 AM to 5:59 AM | 49 (7.0%) | 0 (0.0%) |
| 6:00 AM to 6:29 AM | 22 (3.1%) | 45 (6.6%) |
| 6:30 AM to 6:59 AM | 0 (0.0%) | 71 (10.4%) |
| 7:00 AM to 7:29 AM | 52 (7.4%) | 112 (16.4%) |
| 7:30 AM to 7:59 AM | 67 (9.6%) | 170 (24.8%) |
| 8:00 AM to 8:29 AM | 28 (4.0%) | 12 (1.8%) |
| 8:30 AM to 8:59 AM | 95 (13.6%) | 100 (14.6%) |
| 9:00 AM to 9:59 AM | 19 (2.7%) | 0 (0.0%) |
| 10:00 AM to 10:59 AM | 23 (3.3%) | 21 (3.1%) |
| 11:00 AM to 11:59 AM | 0 (0.0%) | 0 (0.0%) |
| 12:00 PM to 3:59 PM | 85 (12.1%) | 51 (7.5%) |
| 4:00 PM to 11:59 PM | 184 (26.3%) | 41 (6.0%) |
| Total | 700 (100.0%) | 684 (100.0%) |
Housing Occupancy in Black River Falls
Occupancy by Ownership in Black River Falls
Of the total 1,755 dwellings in Black River Falls, owner-occupied units account for 978 (55.7%), while renter-occupied units make up 777 (44.3%).
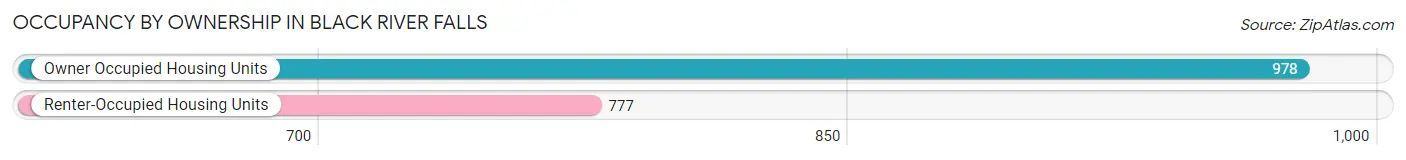
| Occupancy | # Housing Units | % Housing Units |
| Owner Occupied Housing Units | 978 | 55.7% |
| Renter-Occupied Housing Units | 777 | 44.3% |
| Total Occupied Housing Units | 1,755 | 100.0% |
Occupancy by Household Size in Black River Falls
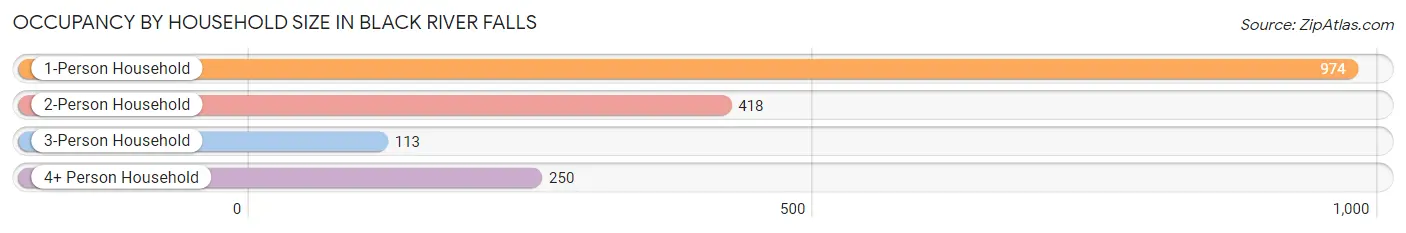
| Household Size | # Housing Units | % Housing Units |
| 1-Person Household | 974 | 55.5% |
| 2-Person Household | 418 | 23.8% |
| 3-Person Household | 113 | 6.4% |
| 4+ Person Household | 250 | 14.2% |
| Total Housing Units | 1,755 | 100.0% |
Occupancy by Ownership by Household Size in Black River Falls
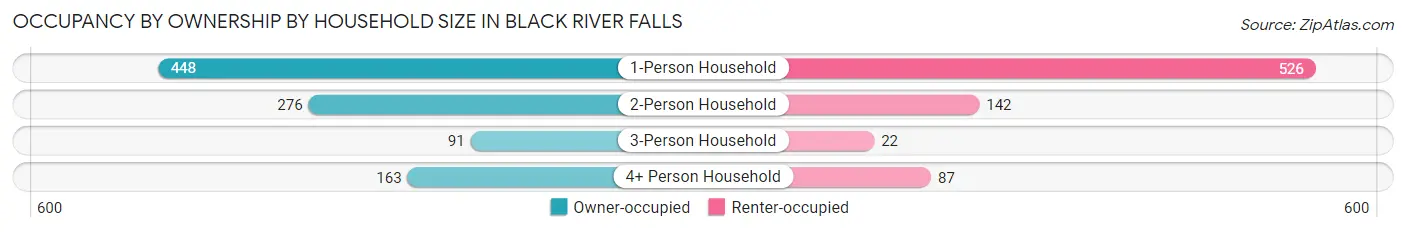
| Household Size | Owner-occupied | Renter-occupied |
| 1-Person Household | 448 (46.0%) | 526 (54.0%) |
| 2-Person Household | 276 (66.0%) | 142 (34.0%) |
| 3-Person Household | 91 (80.5%) | 22 (19.5%) |
| 4+ Person Household | 163 (65.2%) | 87 (34.8%) |
| Total Housing Units | 978 (55.7%) | 777 (44.3%) |
Occupancy by Educational Attainment in Black River Falls
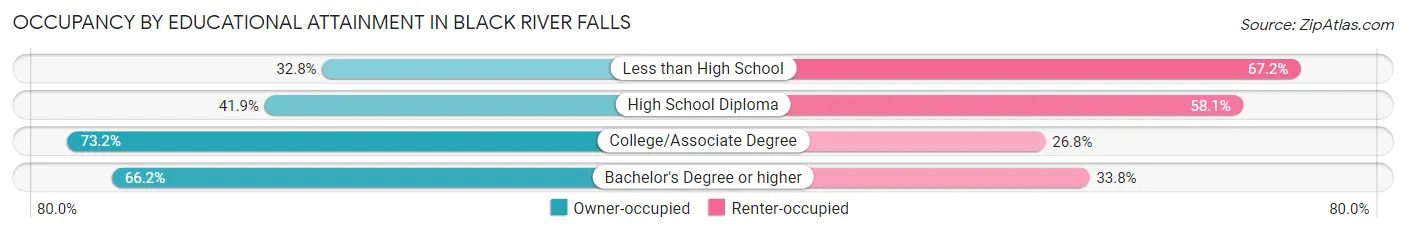
| Household Size | Owner-occupied | Renter-occupied |
| Less than High School | 19 (32.8%) | 39 (67.2%) |
| High School Diploma | 341 (41.9%) | 473 (58.1%) |
| College/Associate Degree | 352 (73.2%) | 129 (26.8%) |
| Bachelor's Degree or higher | 266 (66.2%) | 136 (33.8%) |
Occupancy by Age of Householder in Black River Falls
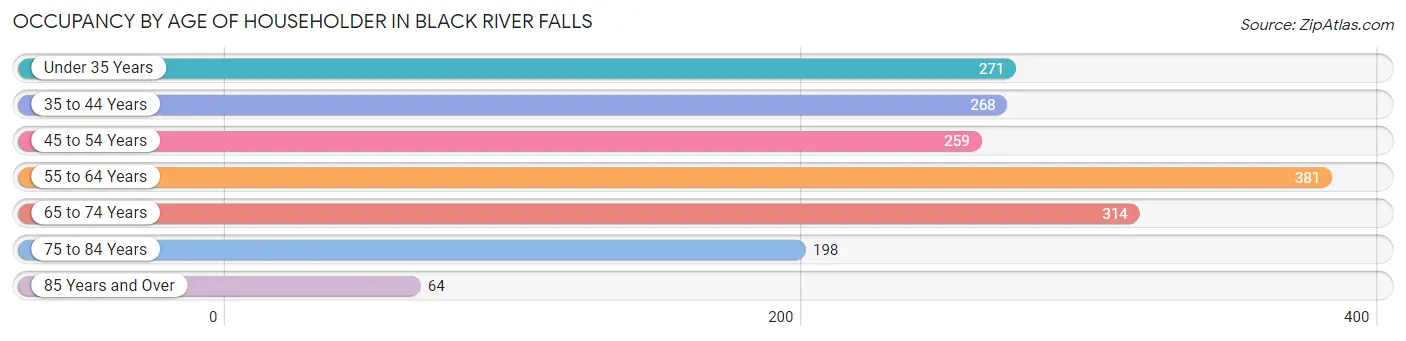
| Age Bracket | # Households | % Households |
| Under 35 Years | 271 | 15.4% |
| 35 to 44 Years | 268 | 15.3% |
| 45 to 54 Years | 259 | 14.8% |
| 55 to 64 Years | 381 | 21.7% |
| 65 to 74 Years | 314 | 17.9% |
| 75 to 84 Years | 198 | 11.3% |
| 85 Years and Over | 64 | 3.6% |
| Total | 1,755 | 100.0% |
Housing Finances in Black River Falls
Median Income by Occupancy in Black River Falls
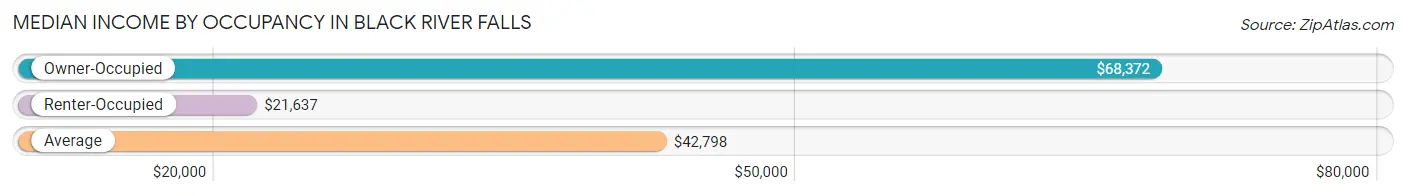
| Occupancy Type | # Households | Median Income |
| Owner-Occupied | 978 (55.7%) | $68,372 |
| Renter-Occupied | 777 (44.3%) | $21,637 |
| Average | 1,755 (100.0%) | $42,798 |
Occupancy by Householder Income Bracket in Black River Falls
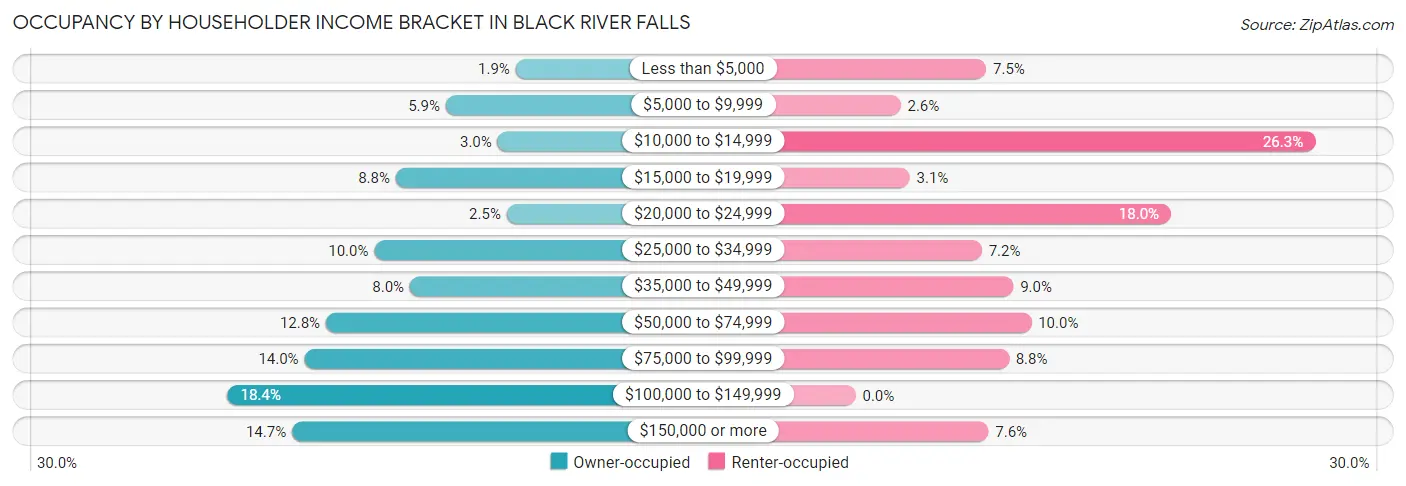
| Income Bracket | Owner-occupied | Renter-occupied |
| Less than $5,000 | 19 (1.9%) | 58 (7.5%) |
| $5,000 to $9,999 | 58 (5.9%) | 20 (2.6%) |
| $10,000 to $14,999 | 29 (3.0%) | 204 (26.3%) |
| $15,000 to $19,999 | 86 (8.8%) | 24 (3.1%) |
| $20,000 to $24,999 | 24 (2.5%) | 140 (18.0%) |
| $25,000 to $34,999 | 98 (10.0%) | 56 (7.2%) |
| $35,000 to $49,999 | 78 (8.0%) | 70 (9.0%) |
| $50,000 to $74,999 | 125 (12.8%) | 78 (10.0%) |
| $75,000 to $99,999 | 137 (14.0%) | 68 (8.7%) |
| $100,000 to $149,999 | 180 (18.4%) | 0 (0.0%) |
| $150,000 or more | 144 (14.7%) | 59 (7.6%) |
| Total | 978 (100.0%) | 777 (100.0%) |
Monthly Housing Cost Tiers in Black River Falls
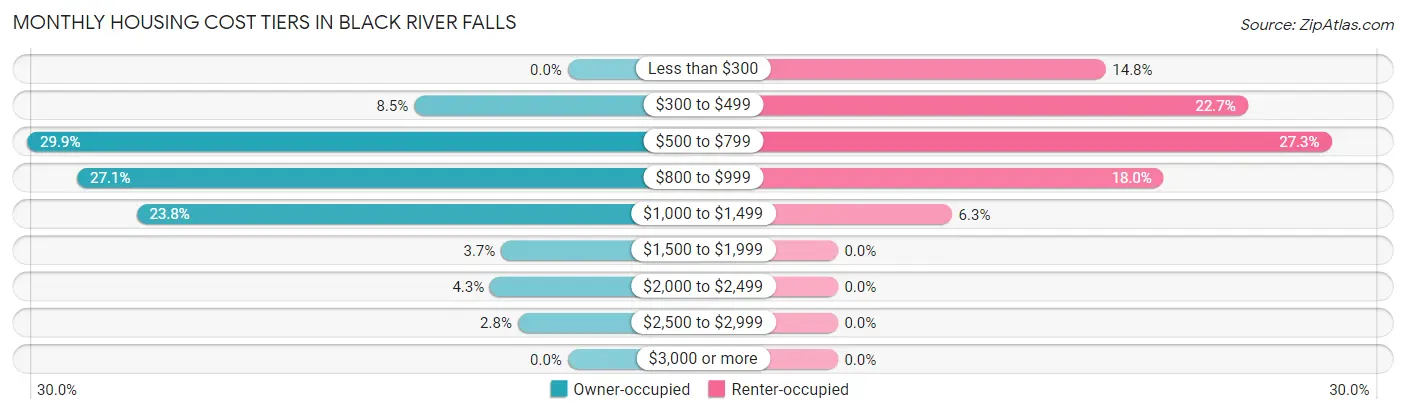
| Monthly Cost | Owner-occupied | Renter-occupied |
| Less than $300 | 0 (0.0%) | 115 (14.8%) |
| $300 to $499 | 83 (8.5%) | 176 (22.7%) |
| $500 to $799 | 292 (29.9%) | 212 (27.3%) |
| $800 to $999 | 265 (27.1%) | 140 (18.0%) |
| $1,000 to $1,499 | 233 (23.8%) | 49 (6.3%) |
| $1,500 to $1,999 | 36 (3.7%) | 0 (0.0%) |
| $2,000 to $2,499 | 42 (4.3%) | 0 (0.0%) |
| $2,500 to $2,999 | 27 (2.8%) | 0 (0.0%) |
| $3,000 or more | 0 (0.0%) | 0 (0.0%) |
| Total | 978 (100.0%) | 777 (100.0%) |
Physical Housing Characteristics in Black River Falls
Housing Structures in Black River Falls
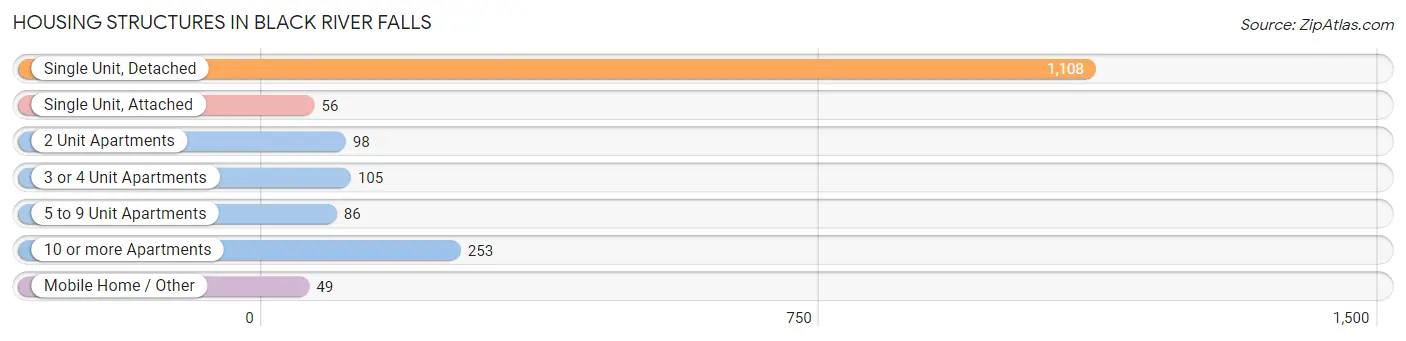
| Structure Type | # Housing Units | % Housing Units |
| Single Unit, Detached | 1,108 | 63.1% |
| Single Unit, Attached | 56 | 3.2% |
| 2 Unit Apartments | 98 | 5.6% |
| 3 or 4 Unit Apartments | 105 | 6.0% |
| 5 to 9 Unit Apartments | 86 | 4.9% |
| 10 or more Apartments | 253 | 14.4% |
| Mobile Home / Other | 49 | 2.8% |
| Total | 1,755 | 100.0% |
Housing Structures by Occupancy in Black River Falls
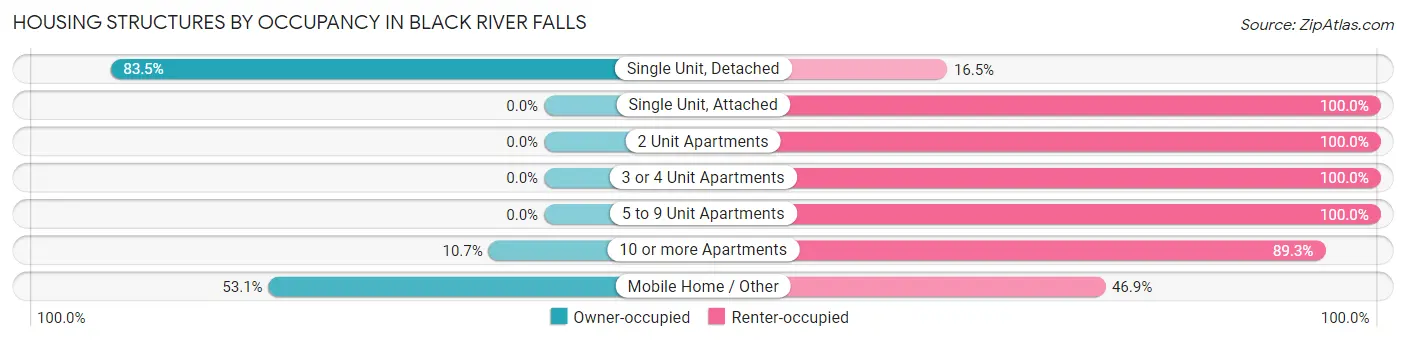
| Structure Type | Owner-occupied | Renter-occupied |
| Single Unit, Detached | 925 (83.5%) | 183 (16.5%) |
| Single Unit, Attached | 0 (0.0%) | 56 (100.0%) |
| 2 Unit Apartments | 0 (0.0%) | 98 (100.0%) |
| 3 or 4 Unit Apartments | 0 (0.0%) | 105 (100.0%) |
| 5 to 9 Unit Apartments | 0 (0.0%) | 86 (100.0%) |
| 10 or more Apartments | 27 (10.7%) | 226 (89.3%) |
| Mobile Home / Other | 26 (53.1%) | 23 (46.9%) |
| Total | 978 (55.7%) | 777 (44.3%) |
Housing Structures by Number of Rooms in Black River Falls
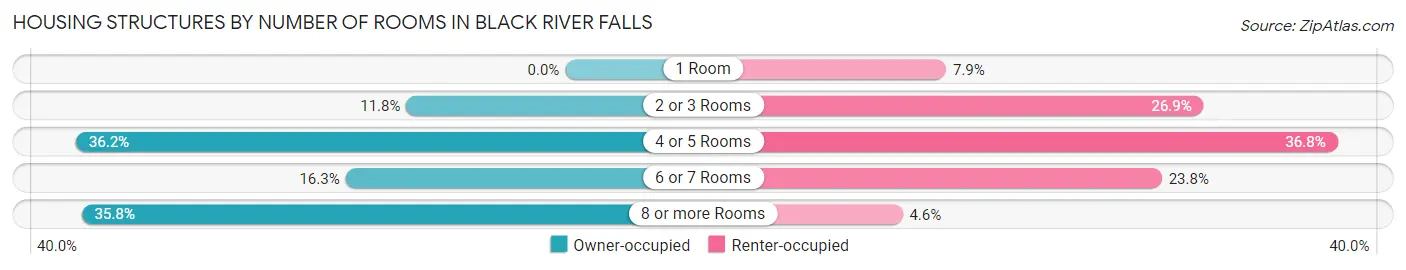
| Number of Rooms | Owner-occupied | Renter-occupied |
| 1 Room | 0 (0.0%) | 61 (7.9%) |
| 2 or 3 Rooms | 115 (11.8%) | 209 (26.9%) |
| 4 or 5 Rooms | 354 (36.2%) | 286 (36.8%) |
| 6 or 7 Rooms | 159 (16.3%) | 185 (23.8%) |
| 8 or more Rooms | 350 (35.8%) | 36 (4.6%) |
| Total | 978 (100.0%) | 777 (100.0%) |
Housing Structure by Heating Type in Black River Falls
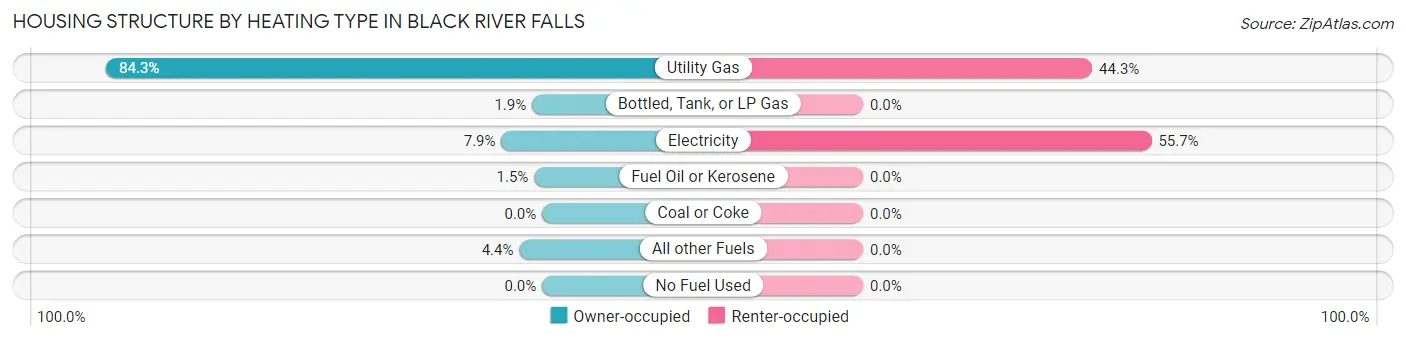
| Heating Type | Owner-occupied | Renter-occupied |
| Utility Gas | 824 (84.3%) | 344 (44.3%) |
| Bottled, Tank, or LP Gas | 19 (1.9%) | 0 (0.0%) |
| Electricity | 77 (7.9%) | 433 (55.7%) |
| Fuel Oil or Kerosene | 15 (1.5%) | 0 (0.0%) |
| Coal or Coke | 0 (0.0%) | 0 (0.0%) |
| All other Fuels | 43 (4.4%) | 0 (0.0%) |
| No Fuel Used | 0 (0.0%) | 0 (0.0%) |
| Total | 978 (100.0%) | 777 (100.0%) |
Household Vehicle Usage in Black River Falls
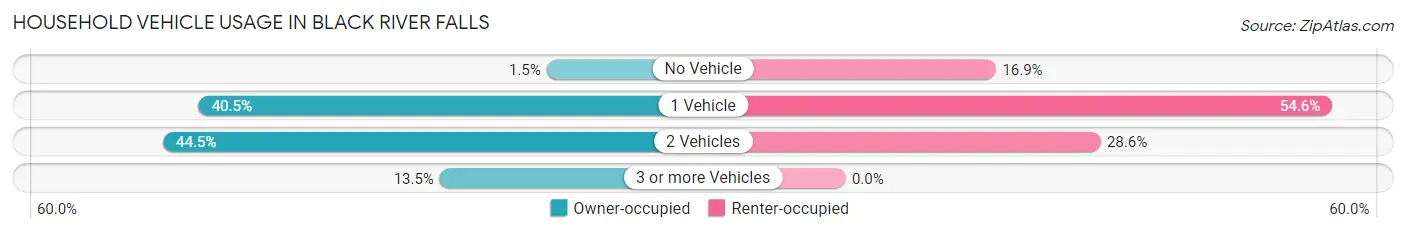
| Vehicles per Household | Owner-occupied | Renter-occupied |
| No Vehicle | 15 (1.5%) | 131 (16.9%) |
| 1 Vehicle | 396 (40.5%) | 424 (54.6%) |
| 2 Vehicles | 435 (44.5%) | 222 (28.6%) |
| 3 or more Vehicles | 132 (13.5%) | 0 (0.0%) |
| Total | 978 (100.0%) | 777 (100.0%) |
Real Estate & Mortgages in Black River Falls
Real Estate and Mortgage Overview in Black River Falls
| Characteristic | Without Mortgage | With Mortgage |
| Housing Units | 388 | 590 |
| Median Property Value | $169,000 | $105,900 |
| Median Household Income | $84,674 | $117 |
| Monthly Housing Costs | $644 | $0 |
| Real Estate Taxes | $3,370 | $17 |
Property Value by Mortgage Status in Black River Falls
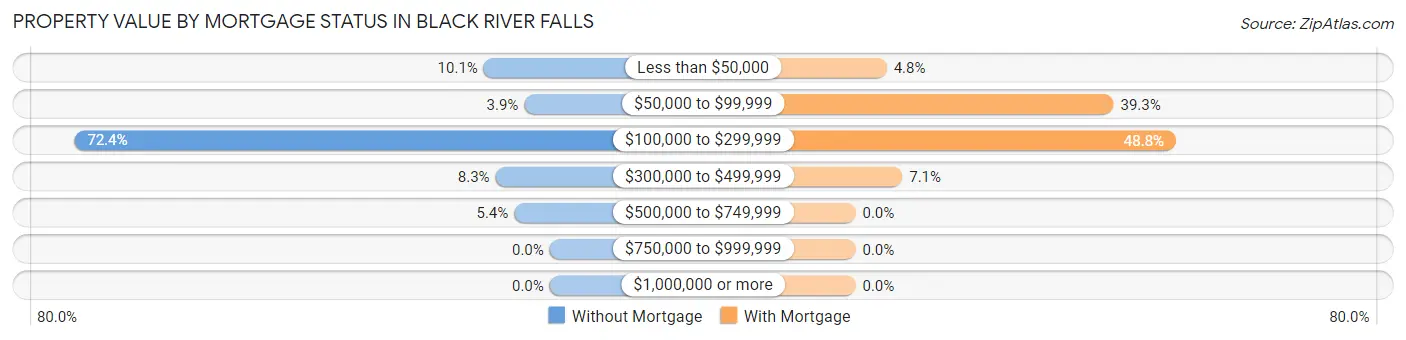
| Property Value | Without Mortgage | With Mortgage |
| Less than $50,000 | 39 (10.1%) | 28 (4.8%) |
| $50,000 to $99,999 | 15 (3.9%) | 232 (39.3%) |
| $100,000 to $299,999 | 281 (72.4%) | 288 (48.8%) |
| $300,000 to $499,999 | 32 (8.3%) | 42 (7.1%) |
| $500,000 to $749,999 | 21 (5.4%) | 0 (0.0%) |
| $750,000 to $999,999 | 0 (0.0%) | 0 (0.0%) |
| $1,000,000 or more | 0 (0.0%) | 0 (0.0%) |
| Total | 388 (100.0%) | 590 (100.0%) |
Household Income by Mortgage Status in Black River Falls
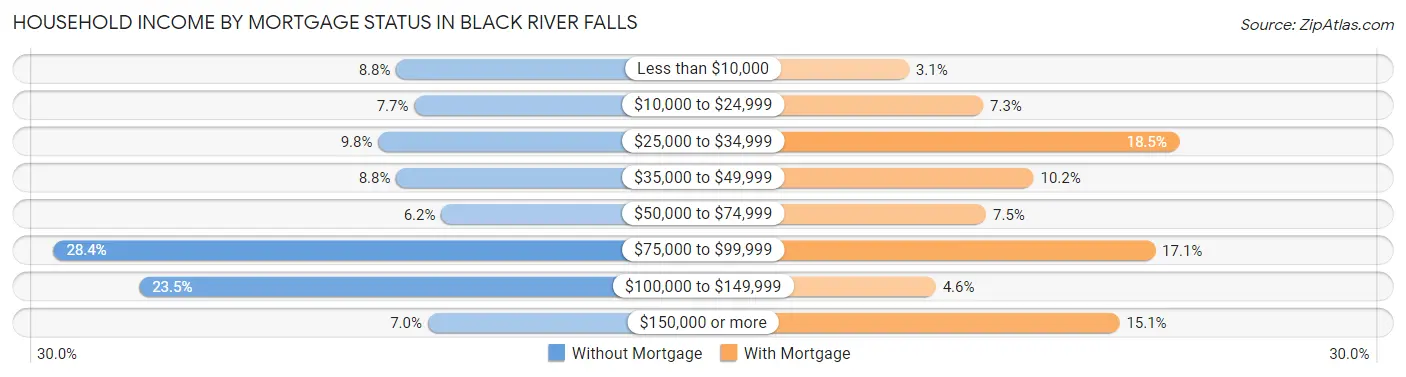
| Household Income | Without Mortgage | With Mortgage |
| Less than $10,000 | 34 (8.8%) | 18 (3.0%) |
| $10,000 to $24,999 | 30 (7.7%) | 43 (7.3%) |
| $25,000 to $34,999 | 38 (9.8%) | 109 (18.5%) |
| $35,000 to $49,999 | 34 (8.8%) | 60 (10.2%) |
| $50,000 to $74,999 | 24 (6.2%) | 44 (7.5%) |
| $75,000 to $99,999 | 110 (28.3%) | 101 (17.1%) |
| $100,000 to $149,999 | 91 (23.4%) | 27 (4.6%) |
| $150,000 or more | 27 (7.0%) | 89 (15.1%) |
| Total | 388 (100.0%) | 590 (100.0%) |
Property Value to Household Income Ratio in Black River Falls
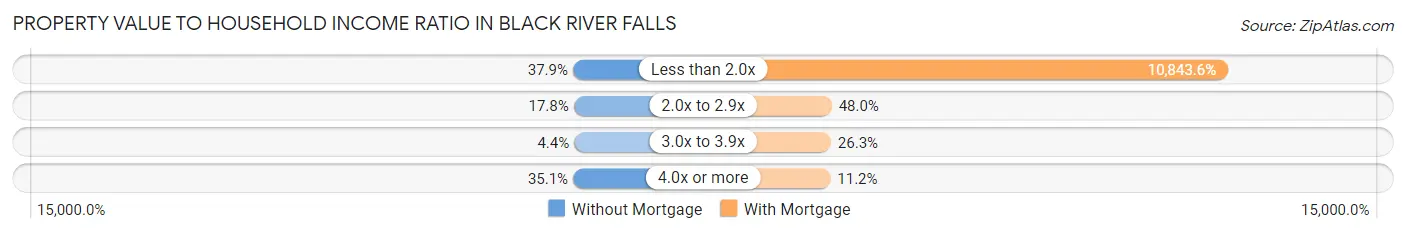
| Value-to-Income Ratio | Without Mortgage | With Mortgage |
| Less than 2.0x | 147 (37.9%) | 63,977 (10,843.6%) |
| 2.0x to 2.9x | 69 (17.8%) | 283 (48.0%) |
| 3.0x to 3.9x | 17 (4.4%) | 155 (26.3%) |
| 4.0x or more | 136 (35.0%) | 66 (11.2%) |
| Total | 388 (100.0%) | 590 (100.0%) |
Real Estate Taxes by Mortgage Status in Black River Falls
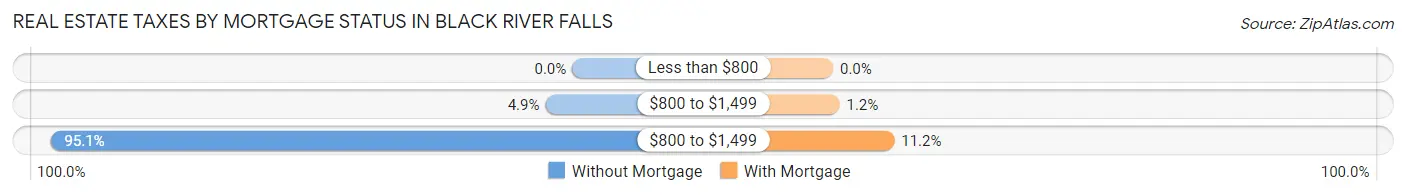
| Property Taxes | Without Mortgage | With Mortgage |
| Less than $800 | 0 (0.0%) | 0 (0.0%) |
| $800 to $1,499 | 19 (4.9%) | 7 (1.2%) |
| $800 to $1,499 | 369 (95.1%) | 66 (11.2%) |
| Total | 388 (100.0%) | 590 (100.0%) |
Health & Disability in Black River Falls
Health Insurance Coverage by Age in Black River Falls
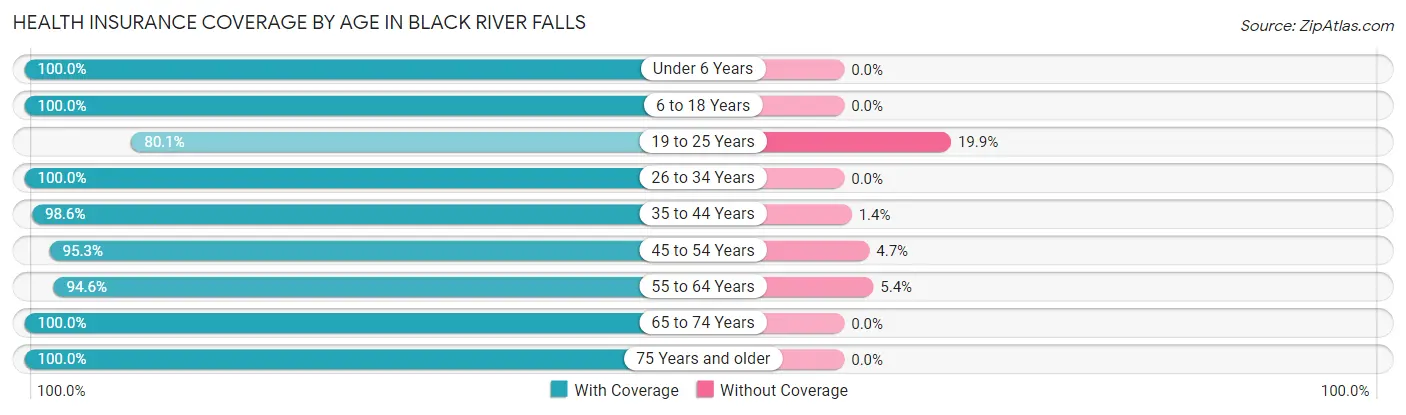
| Age Bracket | With Coverage | Without Coverage |
| Under 6 Years | 232 (100.0%) | 0 (0.0%) |
| 6 to 18 Years | 537 (100.0%) | 0 (0.0%) |
| 19 to 25 Years | 161 (80.1%) | 40 (19.9%) |
| 26 to 34 Years | 289 (100.0%) | 0 (0.0%) |
| 35 to 44 Years | 497 (98.6%) | 7 (1.4%) |
| 45 to 54 Years | 286 (95.3%) | 14 (4.7%) |
| 55 to 64 Years | 454 (94.6%) | 26 (5.4%) |
| 65 to 74 Years | 478 (100.0%) | 0 (0.0%) |
| 75 Years and older | 333 (100.0%) | 0 (0.0%) |
| Total | 3,267 (97.4%) | 87 (2.6%) |
Health Insurance Coverage by Citizenship Status in Black River Falls
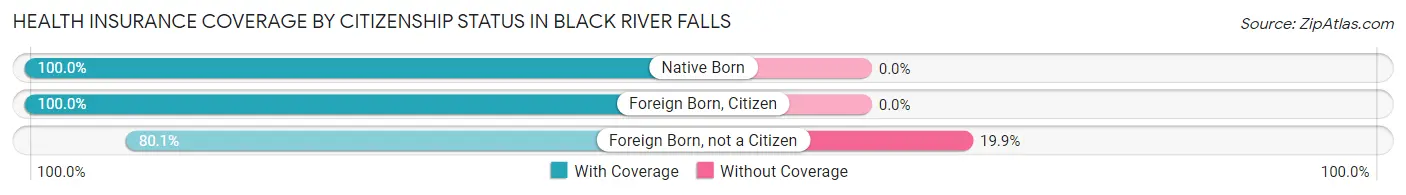
| Citizenship Status | With Coverage | Without Coverage |
| Native Born | 232 (100.0%) | 0 (0.0%) |
| Foreign Born, Citizen | 537 (100.0%) | 0 (0.0%) |
| Foreign Born, not a Citizen | 161 (80.1%) | 40 (19.9%) |
Health Insurance Coverage by Household Income in Black River Falls
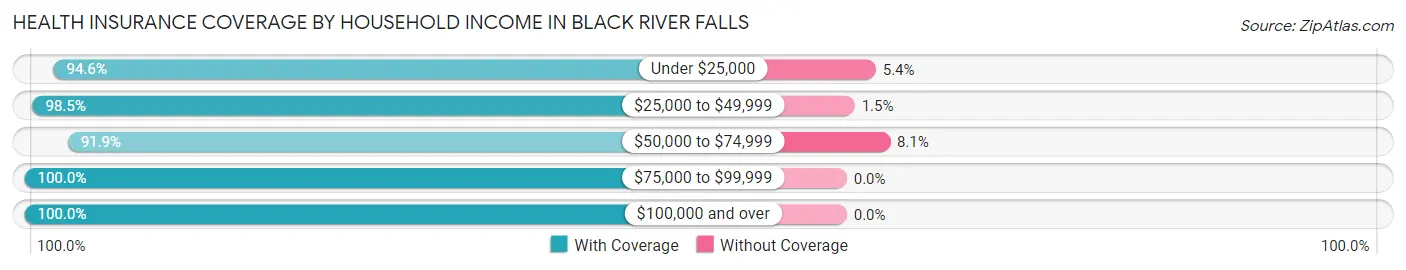
| Household Income | With Coverage | Without Coverage |
| Under $25,000 | 697 (94.6%) | 40 (5.4%) |
| $25,000 to $49,999 | 467 (98.5%) | 7 (1.5%) |
| $50,000 to $74,999 | 455 (91.9%) | 40 (8.1%) |
| $75,000 to $99,999 | 343 (100.0%) | 0 (0.0%) |
| $100,000 and over | 1,237 (100.0%) | 0 (0.0%) |
Public vs Private Health Insurance Coverage by Age in Black River Falls
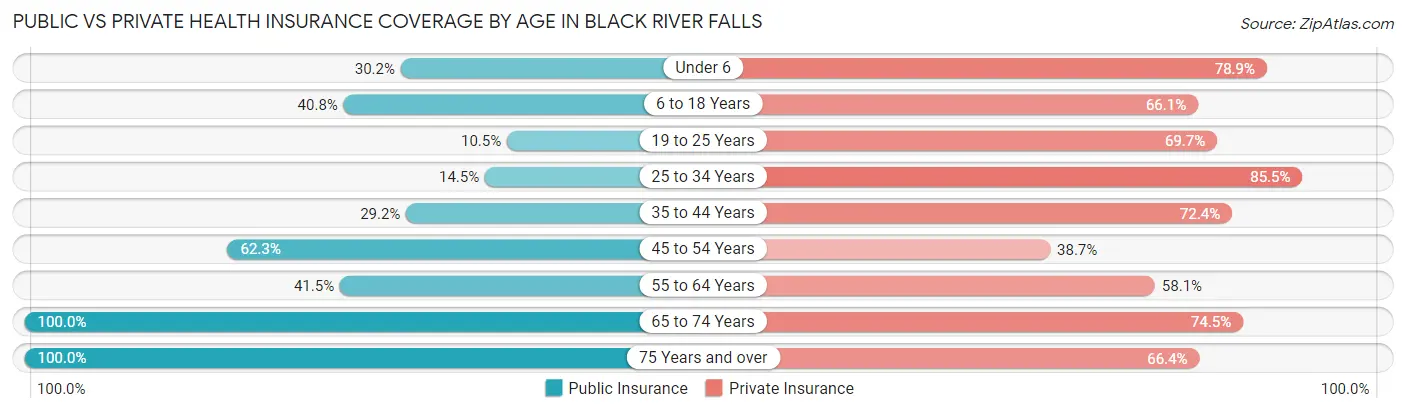
| Age Bracket | Public Insurance | Private Insurance |
| Under 6 | 70 (30.2%) | 183 (78.9%) |
| 6 to 18 Years | 219 (40.8%) | 355 (66.1%) |
| 19 to 25 Years | 21 (10.4%) | 140 (69.7%) |
| 25 to 34 Years | 42 (14.5%) | 247 (85.5%) |
| 35 to 44 Years | 147 (29.2%) | 365 (72.4%) |
| 45 to 54 Years | 187 (62.3%) | 116 (38.7%) |
| 55 to 64 Years | 199 (41.5%) | 279 (58.1%) |
| 65 to 74 Years | 478 (100.0%) | 356 (74.5%) |
| 75 Years and over | 333 (100.0%) | 221 (66.4%) |
| Total | 1,696 (50.6%) | 2,262 (67.4%) |
Disability Status by Sex by Age in Black River Falls
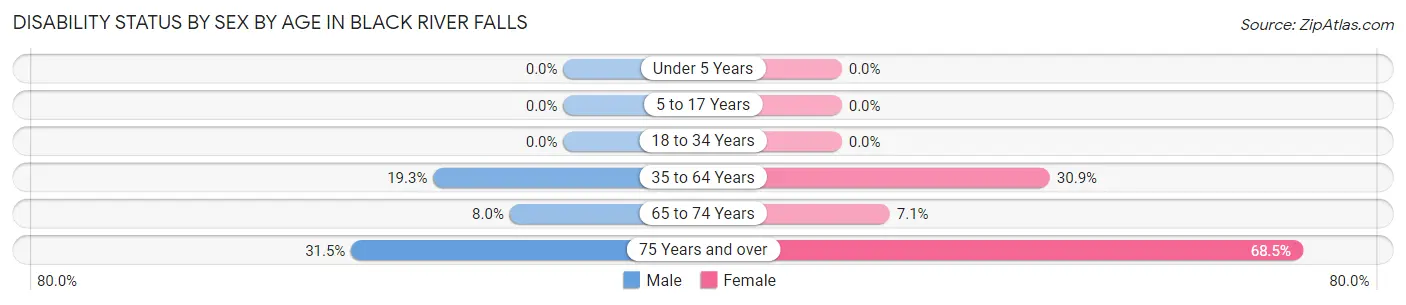
| Age Bracket | Male | Female |
| Under 5 Years | 0 (0.0%) | 0 (0.0%) |
| 5 to 17 Years | 0 (0.0%) | 0 (0.0%) |
| 18 to 34 Years | 0 (0.0%) | 0 (0.0%) |
| 35 to 64 Years | 113 (19.3%) | 216 (30.9%) |
| 65 to 74 Years | 18 (8.0%) | 18 (7.1%) |
| 75 Years and over | 40 (31.5%) | 141 (68.4%) |
Disability Class by Sex by Age in Black River Falls
Disability Class: Hearing Difficulty
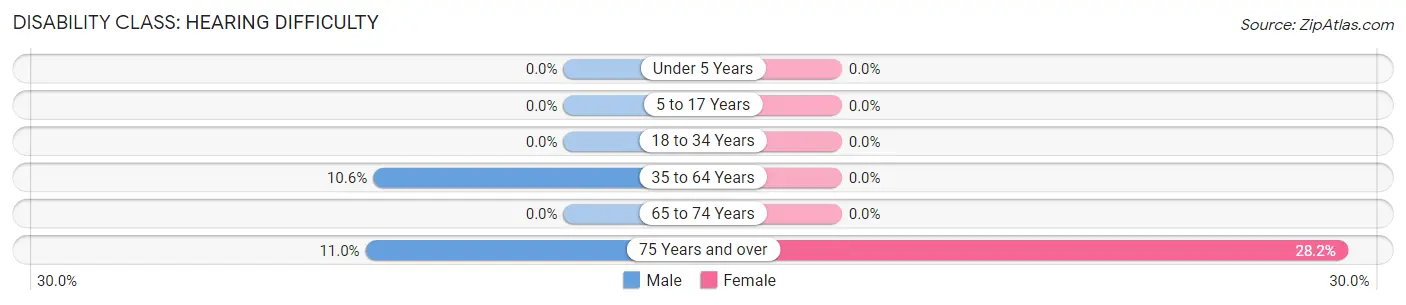
| Age Bracket | Male | Female |
| Under 5 Years | 0 (0.0%) | 0 (0.0%) |
| 5 to 17 Years | 0 (0.0%) | 0 (0.0%) |
| 18 to 34 Years | 0 (0.0%) | 0 (0.0%) |
| 35 to 64 Years | 62 (10.6%) | 0 (0.0%) |
| 65 to 74 Years | 0 (0.0%) | 0 (0.0%) |
| 75 Years and over | 14 (11.0%) | 58 (28.2%) |
Disability Class: Vision Difficulty
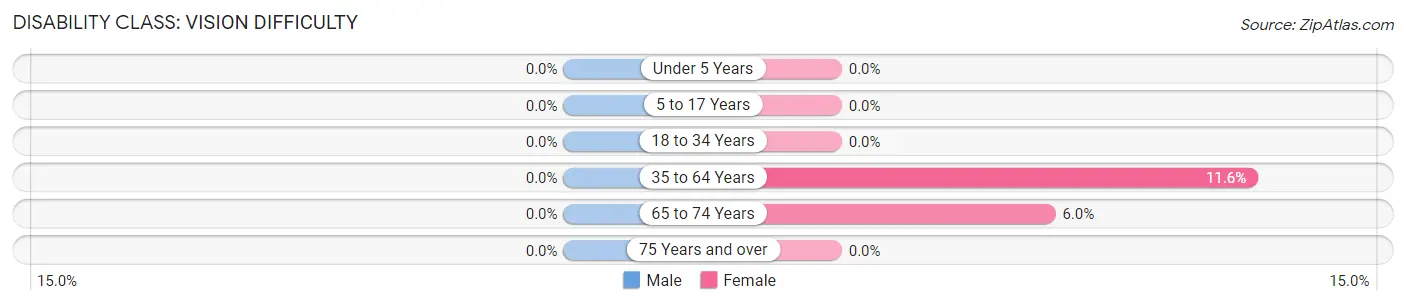
| Age Bracket | Male | Female |
| Under 5 Years | 0 (0.0%) | 0 (0.0%) |
| 5 to 17 Years | 0 (0.0%) | 0 (0.0%) |
| 18 to 34 Years | 0 (0.0%) | 0 (0.0%) |
| 35 to 64 Years | 0 (0.0%) | 81 (11.6%) |
| 65 to 74 Years | 0 (0.0%) | 15 (5.9%) |
| 75 Years and over | 0 (0.0%) | 0 (0.0%) |
Disability Class: Cognitive Difficulty
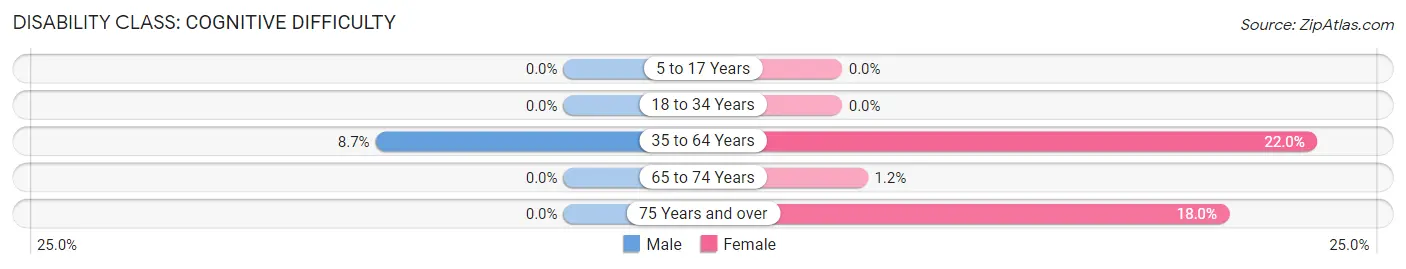
| Age Bracket | Male | Female |
| 5 to 17 Years | 0 (0.0%) | 0 (0.0%) |
| 18 to 34 Years | 0 (0.0%) | 0 (0.0%) |
| 35 to 64 Years | 51 (8.7%) | 154 (22.0%) |
| 65 to 74 Years | 0 (0.0%) | 3 (1.2%) |
| 75 Years and over | 0 (0.0%) | 37 (18.0%) |
Disability Class: Ambulatory Difficulty
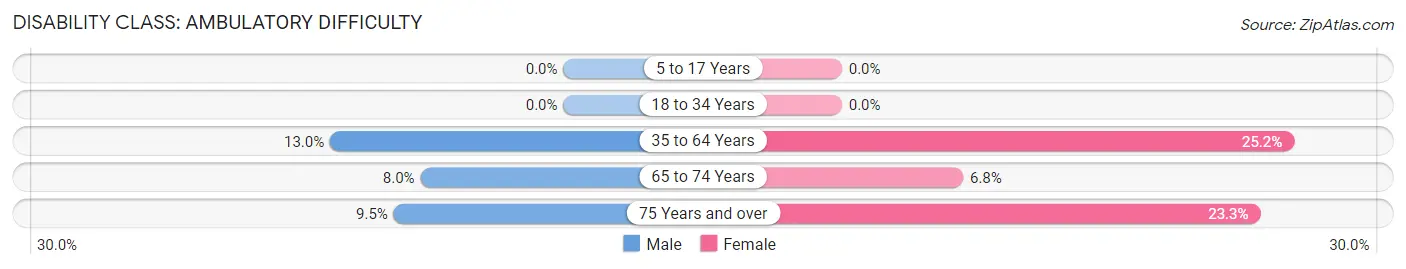
| Age Bracket | Male | Female |
| 5 to 17 Years | 0 (0.0%) | 0 (0.0%) |
| 18 to 34 Years | 0 (0.0%) | 0 (0.0%) |
| 35 to 64 Years | 76 (13.0%) | 176 (25.2%) |
| 65 to 74 Years | 18 (8.0%) | 17 (6.8%) |
| 75 Years and over | 12 (9.5%) | 48 (23.3%) |
Disability Class: Self-Care Difficulty
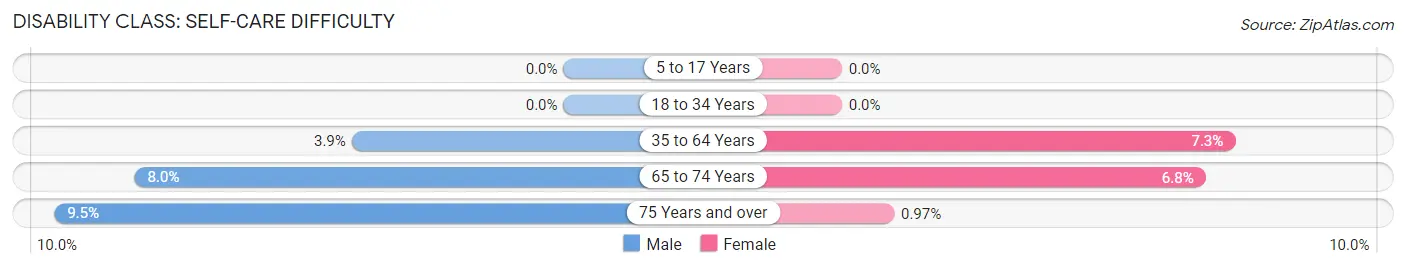
| Age Bracket | Male | Female |
| 5 to 17 Years | 0 (0.0%) | 0 (0.0%) |
| 18 to 34 Years | 0 (0.0%) | 0 (0.0%) |
| 35 to 64 Years | 23 (3.9%) | 51 (7.3%) |
| 65 to 74 Years | 18 (8.0%) | 17 (6.8%) |
| 75 Years and over | 12 (9.5%) | 2 (1.0%) |
Technology Access in Black River Falls
Computing Device Access in Black River Falls
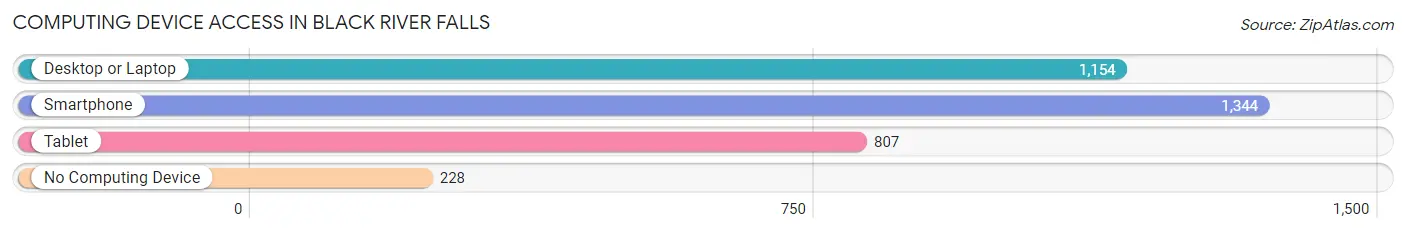
| Device Type | # Households | % Households |
| Desktop or Laptop | 1,154 | 65.7% |
| Smartphone | 1,344 | 76.6% |
| Tablet | 807 | 46.0% |
| No Computing Device | 228 | 13.0% |
| Total | 1,755 | 100.0% |
Internet Access in Black River Falls
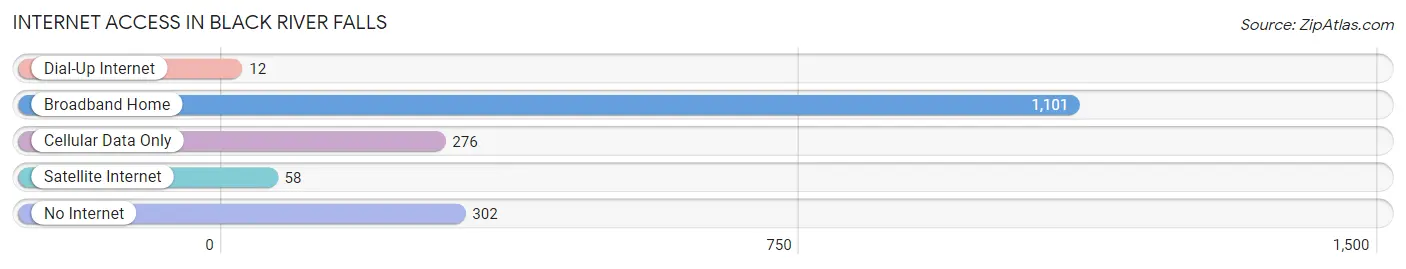
| Internet Type | # Households | % Households |
| Dial-Up Internet | 12 | 0.7% |
| Broadband Home | 1,101 | 62.7% |
| Cellular Data Only | 276 | 15.7% |
| Satellite Internet | 58 | 3.3% |
| No Internet | 302 | 17.2% |
| Total | 1,755 | 100.0% |
Black River Falls Summary
River Falls, Wisconsin is a city located in Jackson County, Wisconsin, United States. The population was 4,711 at the 2010 census. It is the county seat of Jackson County. The city is located on the Black River, which is a tributary of the Chippewa River.
History
The area that is now River Falls was first settled in 1848 by a group of settlers from New York. The settlers named the area after the nearby Black River Falls. The city was officially incorporated in 1872.
In the late 19th century, the city was a major lumbering center. The lumber industry was the main source of employment for the city's residents. The city also had a number of sawmills and other wood-related industries.
In the early 20th century, the city began to diversify its economy. The city became a major center for the production of paper products. The city also had a number of manufacturing plants, including a canning factory, a shoe factory, and a furniture factory.
Geography
River Falls is located at 44°51'N 92°37'W (44.851, -92.619). According to the United States Census Bureau, the city has a total area of 4.2 square miles (10.9 km2), of which 4.1 square miles (10.6 km2) is land and 0.1 square miles (0.3 km2) is water.
The city is located on the Black River, which is a tributary of the Chippewa River. The city is surrounded by rolling hills and wooded areas.
Economy
The economy of River Falls is largely based on manufacturing and services. The city is home to a number of manufacturing plants, including a paper mill, a canning factory, a shoe factory, and a furniture factory. The city also has a number of service-based businesses, including restaurants, retail stores, and medical facilities.
Demographics
As of the census of 2010, there were 4,711 people, 1,945 households, and 1,093 families residing in the city. The population density was 1,143.3 people per square mile (441.2/km2). There were 2,093 housing units at an average density of 507.3 per square mile (195.7/km2). The racial makeup of the city was 95.2% White, 0.7% African American, 0.4% Native American, 1.2% Asian, 0.1% Pacific Islander, 0.9% from other races, and 1.5% from two or more races. Hispanic or Latino of any race were 2.3% of the population.
There were 1,945 households, out of which 25.2% had children under the age of 18 living with them, 43.2% were married couples living together, 10.2% had a female householder with no husband present, and 42.2% were non-families. 35.2% of all households were made up of individuals, and 14.2% had someone living alone who was 65 years of age or older. The average household size was 2.25 and the average family size was 2.93.
In the city, the population was spread out, with 21.7% under the age of 18, 14.2% from 18 to 24, 25.2% from 25 to 44, 22.2% from 45 to 64, and 16.7% who were 65 years of age or older. The median age was 36 years. For every 100 females, there were 91.2 males. For every 100 females age 18 and over, there were 88.3 males.
The median income for a household in the city was $37,917, and the median income for a family was $50,000. Males had a median income of $35,938 versus $25,000 for females. The per capita income for the city was $20,845. About 6.2% of families and 10.2% of the population were below the poverty line, including 11.2% of those under age 18 and 8.2% of those age 65 or over.
Common Questions
What is Per Capita Income in Black River Falls?
Per Capita income in Black River Falls is $35,934.
What is the Median Family Income in Black River Falls?
Median Family Income in Black River Falls is $88,295.
What is the Median Household income in Black River Falls?
Median Household Income in Black River Falls is $42,798.
What is Income or Wage Gap in Black River Falls?
Income or Wage Gap in Black River Falls is 6.2%.
Women in Black River Falls earn 93.8 cents for every dollar earned by a man.
What is Inequality or Gini Index in Black River Falls?
Inequality or Gini Index in Black River Falls is 0.53.
What is the Total Population of Black River Falls?
Total Population of Black River Falls is 3,488.
What is the Total Male Population of Black River Falls?
Total Male Population of Black River Falls is 1,663.
What is the Total Female Population of Black River Falls?
Total Female Population of Black River Falls is 1,825.
What is the Ratio of Males per 100 Females in Black River Falls?
There are 91.12 Males per 100 Females in Black River Falls.
What is the Ratio of Females per 100 Males in Black River Falls?
There are 109.74 Females per 100 Males in Black River Falls.
What is the Median Population Age in Black River Falls?
Median Population Age in Black River Falls is 43.2 Years.
What is the Average Family Size in Black River Falls
Average Family Size in Black River Falls is 3.0 People.
What is the Average Household Size in Black River Falls
Average Household Size in Black River Falls is 1.9 People.
How Large is the Labor Force in Black River Falls?
There are 1,498 People in the Labor Forcein in Black River Falls.
What is the Percentage of People in the Labor Force in Black River Falls?
52.9% of People are in the Labor Force in Black River Falls.
What is the Unemployment Rate in Black River Falls?
Unemployment Rate in Black River Falls is 4.5%.