Immigrants from England vs Greek 3 or more Vehicles in Household
COMPARE
Immigrants from England
Greek
3 or more Vehicles in Household
3 or more Vehicles in Household Comparison
Immigrants from England
Greeks
20.7%
3 OR MORE VEHICLES IN HOUSEHOLD
96.2/ 100
METRIC RATING
113th/ 347
METRIC RANK
20.3%
3 OR MORE VEHICLES IN HOUSEHOLD
88.6/ 100
METRIC RATING
130th/ 347
METRIC RANK
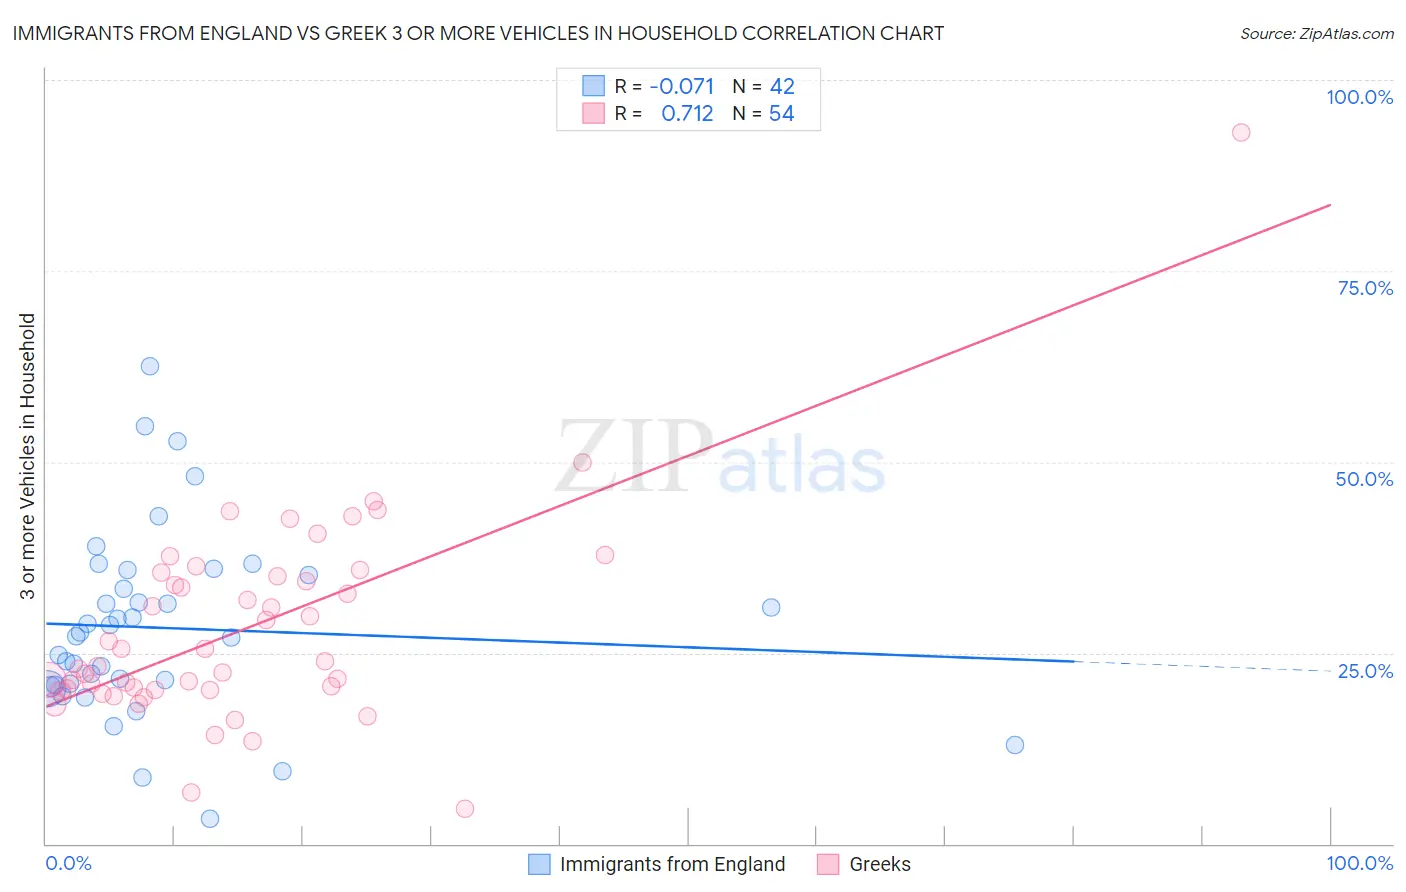
Immigrants from England vs Greek 3 or more Vehicles in Household Correlation Chart
The statistical analysis conducted on geographies consisting of 391,649,997 people shows a slight negative correlation between the proportion of Immigrants from England and percentage of households with 3 or more vehicles available in the United States with a correlation coefficient (R) of -0.071 and weighted average of 20.7%. Similarly, the statistical analysis conducted on geographies consisting of 482,172,821 people shows a strong positive correlation between the proportion of Greeks and percentage of households with 3 or more vehicles available in the United States with a correlation coefficient (R) of 0.712 and weighted average of 20.3%, a difference of 2.1%.
3 or more Vehicles in Household Correlation Summary
| Measurement | Immigrants from England | Greek |
| Minimum | 3.3% | 4.5% |
| Maximum | 62.4% | 93.1% |
| Range | 59.1% | 88.5% |
| Mean | 28.2% | 28.0% |
| Median | 27.4% | 23.6% |
| Interquartile 25% (IQ1) | 20.8% | 20.1% |
| Interquartile 75% (IQ3) | 35.2% | 35.0% |
| Interquartile Range (IQR) | 14.4% | 14.8% |
| Standard Deviation (Sample) | 12.1% | 13.4% |
| Standard Deviation (Population) | 12.0% | 13.3% |
Demographics Similar to Immigrants from England and Greeks by 3 or more Vehicles in Household
In terms of 3 or more vehicles in household, the demographic groups most similar to Immigrants from England are Nicaraguan (20.7%, a difference of 0.010%), Burmese (20.6%, a difference of 0.18%), Immigrants from Micronesia (20.7%, a difference of 0.30%), French Canadian (20.6%, a difference of 0.49%), and Italian (20.6%, a difference of 0.52%). Similarly, the demographic groups most similar to Greeks are Zimbabwean (20.3%, a difference of 0.030%), Immigrants from Asia (20.2%, a difference of 0.070%), New Zealander (20.4%, a difference of 0.55%), Immigrants from Bolivia (20.4%, a difference of 0.72%), and Slavic (20.4%, a difference of 0.75%).
| Demographics | Rating | Rank | 3 or more Vehicles in Household |
| Immigrants | Micronesia | 96.7 /100 | #111 | Exceptional 20.7% |
| Nicaraguans | 96.2 /100 | #112 | Exceptional 20.7% |
| Immigrants | England | 96.2 /100 | #113 | Exceptional 20.7% |
| Burmese | 95.8 /100 | #114 | Exceptional 20.6% |
| French Canadians | 95.0 /100 | #115 | Exceptional 20.6% |
| Italians | 94.9 /100 | #116 | Exceptional 20.6% |
| Croatians | 94.9 /100 | #117 | Exceptional 20.6% |
| Costa Ricans | 94.6 /100 | #118 | Exceptional 20.6% |
| Immigrants | Latin America | 94.5 /100 | #119 | Exceptional 20.5% |
| Maltese | 93.9 /100 | #120 | Exceptional 20.5% |
| Immigrants | Thailand | 93.8 /100 | #121 | Exceptional 20.5% |
| German Russians | 93.7 /100 | #122 | Exceptional 20.5% |
| Immigrants | Korea | 93.7 /100 | #123 | Exceptional 20.5% |
| Central Americans | 93.1 /100 | #124 | Exceptional 20.5% |
| Immigrants | Netherlands | 92.9 /100 | #125 | Exceptional 20.4% |
| Slavs | 92.1 /100 | #126 | Exceptional 20.4% |
| Immigrants | Bolivia | 92.0 /100 | #127 | Exceptional 20.4% |
| New Zealanders | 91.3 /100 | #128 | Exceptional 20.4% |
| Zimbabweans | 88.7 /100 | #129 | Excellent 20.3% |
| Greeks | 88.6 /100 | #130 | Excellent 20.3% |
| Immigrants | Asia | 88.1 /100 | #131 | Excellent 20.2% |