Immigrants from Jordan vs Greek Self-Care Disability
COMPARE
Immigrants from Jordan
Greek
Self-Care Disability
Self-Care Disability Comparison
Immigrants from Jordan
Greeks
2.4%
SELF-CARE DISABILITY
97.7/ 100
METRIC RATING
91st/ 347
METRIC RANK
2.4%
SELF-CARE DISABILITY
94.1/ 100
METRIC RATING
108th/ 347
METRIC RANK
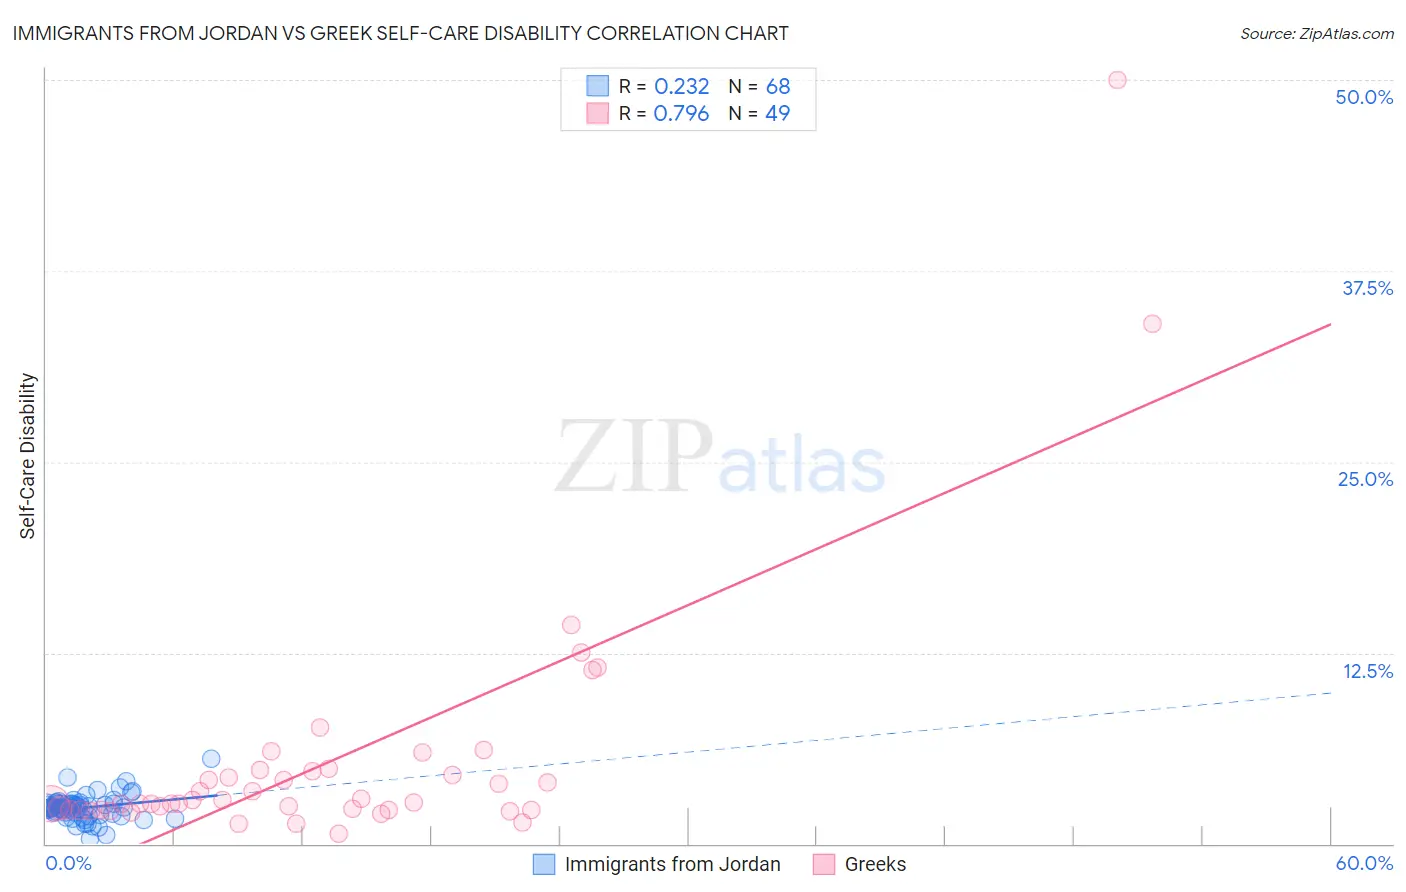
Immigrants from Jordan vs Greek Self-Care Disability Correlation Chart
The statistical analysis conducted on geographies consisting of 181,224,885 people shows a weak positive correlation between the proportion of Immigrants from Jordan and percentage of population with self-care disability in the United States with a correlation coefficient (R) of 0.232 and weighted average of 2.4%. Similarly, the statistical analysis conducted on geographies consisting of 481,876,170 people shows a strong positive correlation between the proportion of Greeks and percentage of population with self-care disability in the United States with a correlation coefficient (R) of 0.796 and weighted average of 2.4%, a difference of 1.2%.
Self-Care Disability Correlation Summary
| Measurement | Immigrants from Jordan | Greek |
| Minimum | 0.35% | 0.63% |
| Maximum | 5.6% | 50.0% |
| Range | 5.2% | 49.4% |
| Mean | 2.4% | 5.5% |
| Median | 2.4% | 2.7% |
| Interquartile 25% (IQ1) | 2.0% | 2.2% |
| Interquartile 75% (IQ3) | 2.6% | 4.8% |
| Interquartile Range (IQR) | 0.64% | 2.6% |
| Standard Deviation (Sample) | 0.80% | 8.3% |
| Standard Deviation (Population) | 0.80% | 8.2% |
Demographics Similar to Immigrants from Jordan and Greeks by Self-Care Disability
In terms of self-care disability, the demographic groups most similar to Immigrants from Jordan are Immigrants from Czechoslovakia (2.4%, a difference of 0.010%), Icelander (2.4%, a difference of 0.14%), Immigrants from Congo (2.4%, a difference of 0.15%), Immigrants from Latvia (2.4%, a difference of 0.34%), and Macedonian (2.4%, a difference of 0.38%). Similarly, the demographic groups most similar to Greeks are Slovene (2.4%, a difference of 0.010%), British (2.4%, a difference of 0.030%), Immigrants from Indonesia (2.4%, a difference of 0.040%), Carpatho Rusyn (2.4%, a difference of 0.050%), and Bhutanese (2.4%, a difference of 0.080%).
| Demographics | Rating | Rank | Self-Care Disability |
| Immigrants | Congo | 98.0 /100 | #89 | Exceptional 2.4% |
| Immigrants | Czechoslovakia | 97.7 /100 | #90 | Exceptional 2.4% |
| Immigrants | Jordan | 97.7 /100 | #91 | Exceptional 2.4% |
| Icelanders | 97.4 /100 | #92 | Exceptional 2.4% |
| Immigrants | Latvia | 97.0 /100 | #93 | Exceptional 2.4% |
| Macedonians | 96.9 /100 | #94 | Exceptional 2.4% |
| Immigrants | Asia | 96.9 /100 | #95 | Exceptional 2.4% |
| Immigrants | Chile | 96.7 /100 | #96 | Exceptional 2.4% |
| Swiss | 96.6 /100 | #97 | Exceptional 2.4% |
| Immigrants | Poland | 96.4 /100 | #98 | Exceptional 2.4% |
| Immigrants | Israel | 96.1 /100 | #99 | Exceptional 2.4% |
| Europeans | 95.8 /100 | #100 | Exceptional 2.4% |
| Immigrants | Scotland | 95.7 /100 | #101 | Exceptional 2.4% |
| Croatians | 95.0 /100 | #102 | Exceptional 2.4% |
| Alsatians | 94.9 /100 | #103 | Exceptional 2.4% |
| Bhutanese | 94.5 /100 | #104 | Exceptional 2.4% |
| Carpatho Rusyns | 94.4 /100 | #105 | Exceptional 2.4% |
| Immigrants | Indonesia | 94.3 /100 | #106 | Exceptional 2.4% |
| British | 94.3 /100 | #107 | Exceptional 2.4% |
| Greeks | 94.1 /100 | #108 | Exceptional 2.4% |
| Slovenes | 94.1 /100 | #109 | Exceptional 2.4% |