Korean vs Greek 3 or more Vehicles in Household
COMPARE
Korean
Greek
3 or more Vehicles in Household
3 or more Vehicles in Household Comparison
Koreans
Greeks
24.1%
3 OR MORE VEHICLES IN HOUSEHOLD
100.0/ 100
METRIC RATING
17th/ 347
METRIC RANK
20.3%
3 OR MORE VEHICLES IN HOUSEHOLD
88.6/ 100
METRIC RATING
130th/ 347
METRIC RANK
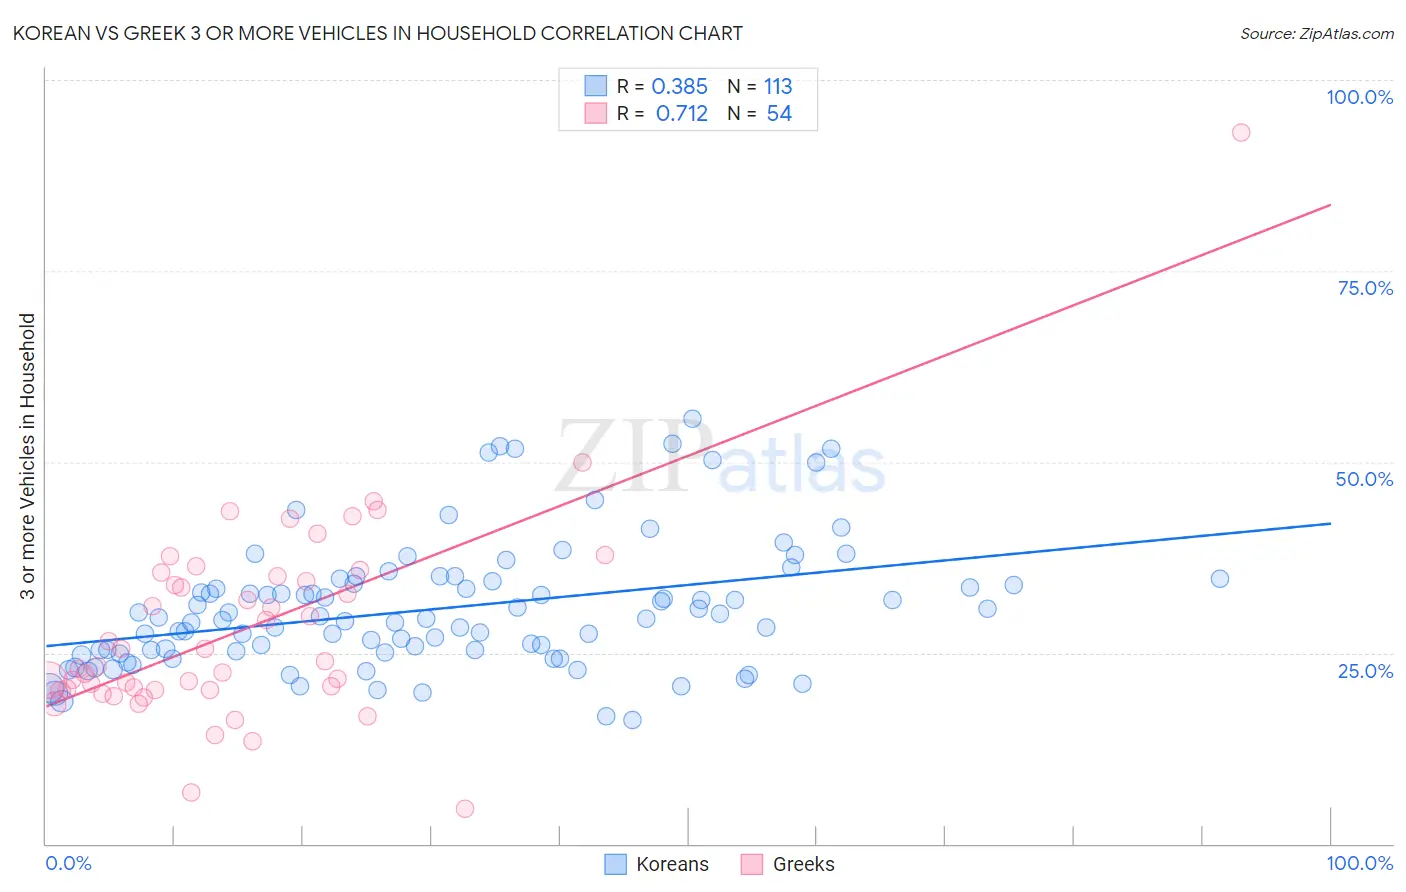
Korean vs Greek 3 or more Vehicles in Household Correlation Chart
The statistical analysis conducted on geographies consisting of 510,183,740 people shows a mild positive correlation between the proportion of Koreans and percentage of households with 3 or more vehicles available in the United States with a correlation coefficient (R) of 0.385 and weighted average of 24.1%. Similarly, the statistical analysis conducted on geographies consisting of 482,172,821 people shows a strong positive correlation between the proportion of Greeks and percentage of households with 3 or more vehicles available in the United States with a correlation coefficient (R) of 0.712 and weighted average of 20.3%, a difference of 18.8%.
3 or more Vehicles in Household Correlation Summary
| Measurement | Korean | Greek |
| Minimum | 16.2% | 4.5% |
| Maximum | 55.6% | 93.1% |
| Range | 39.4% | 88.5% |
| Mean | 30.8% | 28.0% |
| Median | 29.4% | 23.6% |
| Interquartile 25% (IQ1) | 25.1% | 20.1% |
| Interquartile 75% (IQ3) | 34.2% | 35.0% |
| Interquartile Range (IQR) | 9.1% | 14.8% |
| Standard Deviation (Sample) | 8.3% | 13.4% |
| Standard Deviation (Population) | 8.2% | 13.3% |
Similar Demographics by 3 or more Vehicles in Household
Demographics Similar to Koreans by 3 or more Vehicles in Household
In terms of 3 or more vehicles in household, the demographic groups most similar to Koreans are Norwegian (23.9%, a difference of 0.79%), Basque (24.3%, a difference of 0.80%), Chinese (23.9%, a difference of 0.82%), Hawaiian (24.3%, a difference of 0.83%), and Paiute (23.8%, a difference of 1.1%).
| Demographics | Rating | Rank | 3 or more Vehicles in Household |
| Nepalese | 100.0 /100 | #10 | Exceptional 24.9% |
| Shoshone | 100.0 /100 | #11 | Exceptional 24.9% |
| Danes | 100.0 /100 | #12 | Exceptional 24.7% |
| Mexicans | 100.0 /100 | #13 | Exceptional 24.7% |
| Immigrants | Mexico | 100.0 /100 | #14 | Exceptional 24.6% |
| Hawaiians | 100.0 /100 | #15 | Exceptional 24.3% |
| Basques | 100.0 /100 | #16 | Exceptional 24.3% |
| Koreans | 100.0 /100 | #17 | Exceptional 24.1% |
| Norwegians | 100.0 /100 | #18 | Exceptional 23.9% |
| Chinese | 100.0 /100 | #19 | Exceptional 23.9% |
| Paiute | 100.0 /100 | #20 | Exceptional 23.8% |
| Immigrants | Vietnam | 100.0 /100 | #21 | Exceptional 23.8% |
| Immigrants | Philippines | 100.0 /100 | #22 | Exceptional 23.8% |
| Scandinavians | 100.0 /100 | #23 | Exceptional 23.6% |
| Sri Lankans | 100.0 /100 | #24 | Exceptional 23.6% |
Demographics Similar to Greeks by 3 or more Vehicles in Household
In terms of 3 or more vehicles in household, the demographic groups most similar to Greeks are Zimbabwean (20.3%, a difference of 0.030%), Immigrants from Asia (20.2%, a difference of 0.070%), Immigrants from Canada (20.2%, a difference of 0.13%), Immigrants from North America (20.2%, a difference of 0.13%), and Polish (20.2%, a difference of 0.22%).
| Demographics | Rating | Rank | 3 or more Vehicles in Household |
| Immigrants | Korea | 93.7 /100 | #123 | Exceptional 20.5% |
| Central Americans | 93.1 /100 | #124 | Exceptional 20.5% |
| Immigrants | Netherlands | 92.9 /100 | #125 | Exceptional 20.4% |
| Slavs | 92.1 /100 | #126 | Exceptional 20.4% |
| Immigrants | Bolivia | 92.0 /100 | #127 | Exceptional 20.4% |
| New Zealanders | 91.3 /100 | #128 | Exceptional 20.4% |
| Zimbabweans | 88.7 /100 | #129 | Excellent 20.3% |
| Greeks | 88.6 /100 | #130 | Excellent 20.3% |
| Immigrants | Asia | 88.1 /100 | #131 | Excellent 20.2% |
| Immigrants | Canada | 87.8 /100 | #132 | Excellent 20.2% |
| Immigrants | North America | 87.8 /100 | #133 | Excellent 20.2% |
| Poles | 87.3 /100 | #134 | Excellent 20.2% |
| Immigrants | India | 87.2 /100 | #135 | Excellent 20.2% |
| Immigrants | Nicaragua | 87.1 /100 | #136 | Excellent 20.2% |
| Immigrants | Iraq | 87.1 /100 | #137 | Excellent 20.2% |