Korean vs Afghan Unemployment Among Women with Children Ages 6 to 17 years
COMPARE
Korean
Afghan
Unemployment Among Women with Children Ages 6 to 17 years
Unemployment Among Women with Children Ages 6 to 17 years Comparison
Koreans
Afghans
8.2%
UNEMPLOYMENT AMONG WOMEN WITH CHILDREN AGES 6 TO 17 YEARS
100.0/ 100
METRIC RATING
61st/ 347
METRIC RANK
7.6%
UNEMPLOYMENT AMONG WOMEN WITH CHILDREN AGES 6 TO 17 YEARS
100.0/ 100
METRIC RATING
18th/ 347
METRIC RANK
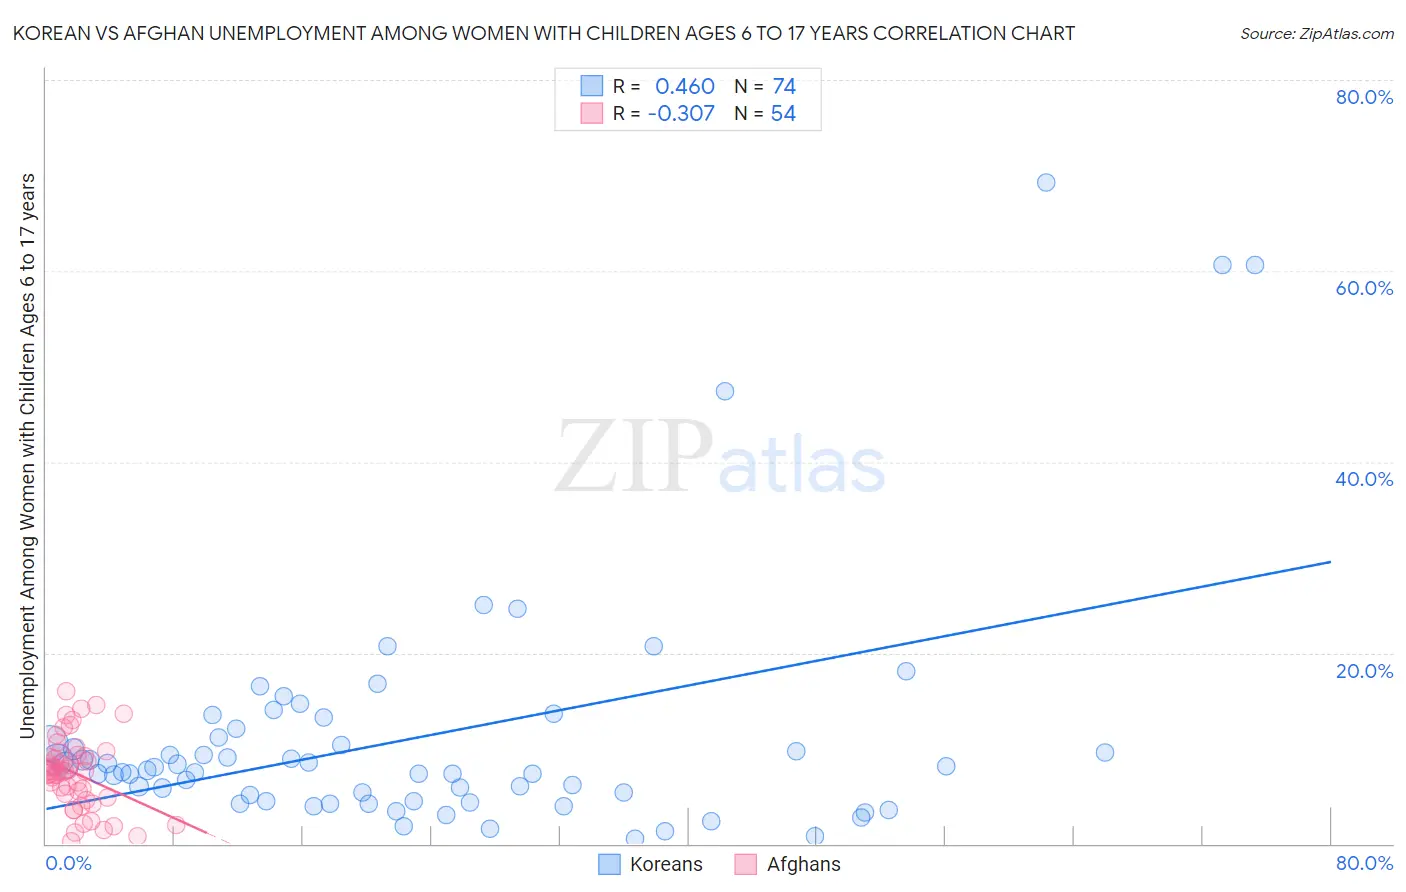
Korean vs Afghan Unemployment Among Women with Children Ages 6 to 17 years Correlation Chart
The statistical analysis conducted on geographies consisting of 342,207,280 people shows a moderate positive correlation between the proportion of Koreans and unemployment rate among women with children between the ages 6 and 17 in the United States with a correlation coefficient (R) of 0.460 and weighted average of 8.2%. Similarly, the statistical analysis conducted on geographies consisting of 127,639,249 people shows a mild negative correlation between the proportion of Afghans and unemployment rate among women with children between the ages 6 and 17 in the United States with a correlation coefficient (R) of -0.307 and weighted average of 7.6%, a difference of 8.2%.
Unemployment Among Women with Children Ages 6 to 17 years Correlation Summary
| Measurement | Korean | Afghan |
| Minimum | 0.50% | 0.30% |
| Maximum | 69.2% | 15.9% |
| Range | 68.7% | 15.6% |
| Mean | 11.2% | 7.4% |
| Median | 7.9% | 7.6% |
| Interquartile 25% (IQ1) | 4.5% | 4.8% |
| Interquartile 75% (IQ3) | 11.2% | 9.3% |
| Interquartile Range (IQR) | 6.6% | 4.4% |
| Standard Deviation (Sample) | 12.8% | 3.8% |
| Standard Deviation (Population) | 12.8% | 3.7% |
Similar Demographics by Unemployment Among Women with Children Ages 6 to 17 years
Demographics Similar to Koreans by Unemployment Among Women with Children Ages 6 to 17 years
In terms of unemployment among women with children ages 6 to 17 years, the demographic groups most similar to Koreans are Spanish American Indian (8.2%, a difference of 0.030%), Basque (8.2%, a difference of 0.18%), Immigrants from Philippines (8.2%, a difference of 0.19%), Immigrants from Malaysia (8.2%, a difference of 0.25%), and Immigrants from South Eastern Asia (8.2%, a difference of 0.43%).
| Demographics | Rating | Rank | Unemployment Among Women with Children Ages 6 to 17 years |
| Immigrants | Armenia | 100.0 /100 | #54 | Exceptional 8.2% |
| Immigrants | Japan | 100.0 /100 | #55 | Exceptional 8.2% |
| Immigrants | Bosnia and Herzegovina | 100.0 /100 | #56 | Exceptional 8.2% |
| Immigrants | Laos | 100.0 /100 | #57 | Exceptional 8.2% |
| Immigrants | Malaysia | 100.0 /100 | #58 | Exceptional 8.2% |
| Immigrants | Philippines | 100.0 /100 | #59 | Exceptional 8.2% |
| Basques | 100.0 /100 | #60 | Exceptional 8.2% |
| Koreans | 100.0 /100 | #61 | Exceptional 8.2% |
| Spanish American Indians | 100.0 /100 | #62 | Exceptional 8.2% |
| Immigrants | South Eastern Asia | 99.9 /100 | #63 | Exceptional 8.2% |
| Immigrants | Kuwait | 99.9 /100 | #64 | Exceptional 8.3% |
| Immigrants | Albania | 99.9 /100 | #65 | Exceptional 8.3% |
| Luxembourgers | 99.9 /100 | #66 | Exceptional 8.3% |
| Armenians | 99.9 /100 | #67 | Exceptional 8.3% |
| Marshallese | 99.9 /100 | #68 | Exceptional 8.3% |
Demographics Similar to Afghans by Unemployment Among Women with Children Ages 6 to 17 years
In terms of unemployment among women with children ages 6 to 17 years, the demographic groups most similar to Afghans are Filipino (7.6%, a difference of 0.020%), Cambodian (7.5%, a difference of 0.65%), Immigrants from Burma/Myanmar (7.5%, a difference of 0.84%), Immigrants from Singapore (7.7%, a difference of 1.0%), and Immigrants from India (7.7%, a difference of 1.2%).
| Demographics | Rating | Rank | Unemployment Among Women with Children Ages 6 to 17 years |
| Immigrants | Taiwan | 100.0 /100 | #11 | Exceptional 7.3% |
| Bangladeshis | 100.0 /100 | #12 | Exceptional 7.4% |
| Indonesians | 100.0 /100 | #13 | Exceptional 7.4% |
| Sudanese | 100.0 /100 | #14 | Exceptional 7.4% |
| Puget Sound Salish | 100.0 /100 | #15 | Exceptional 7.5% |
| Immigrants | Burma/Myanmar | 100.0 /100 | #16 | Exceptional 7.5% |
| Cambodians | 100.0 /100 | #17 | Exceptional 7.5% |
| Afghans | 100.0 /100 | #18 | Exceptional 7.6% |
| Filipinos | 100.0 /100 | #19 | Exceptional 7.6% |
| Immigrants | Singapore | 100.0 /100 | #20 | Exceptional 7.7% |
| Immigrants | India | 100.0 /100 | #21 | Exceptional 7.7% |
| Immigrants | China | 100.0 /100 | #22 | Exceptional 7.7% |
| Immigrants | Indonesia | 100.0 /100 | #23 | Exceptional 7.7% |
| Nepalese | 100.0 /100 | #24 | Exceptional 7.7% |
| Immigrants | Eastern Asia | 100.0 /100 | #25 | Exceptional 7.7% |