Bahamian vs Immigrants from Caribbean Unemployment Among Women with Children Ages 6 to 17 years
COMPARE
Bahamian
Immigrants from Caribbean
Unemployment Among Women with Children Ages 6 to 17 years
Unemployment Among Women with Children Ages 6 to 17 years Comparison
Bahamians
Immigrants from Caribbean
10.4%
UNEMPLOYMENT AMONG WOMEN WITH CHILDREN AGES 6 TO 17 YEARS
0.0/ 100
METRIC RATING
315th/ 347
METRIC RANK
10.1%
UNEMPLOYMENT AMONG WOMEN WITH CHILDREN AGES 6 TO 17 YEARS
0.0/ 100
METRIC RATING
297th/ 347
METRIC RANK
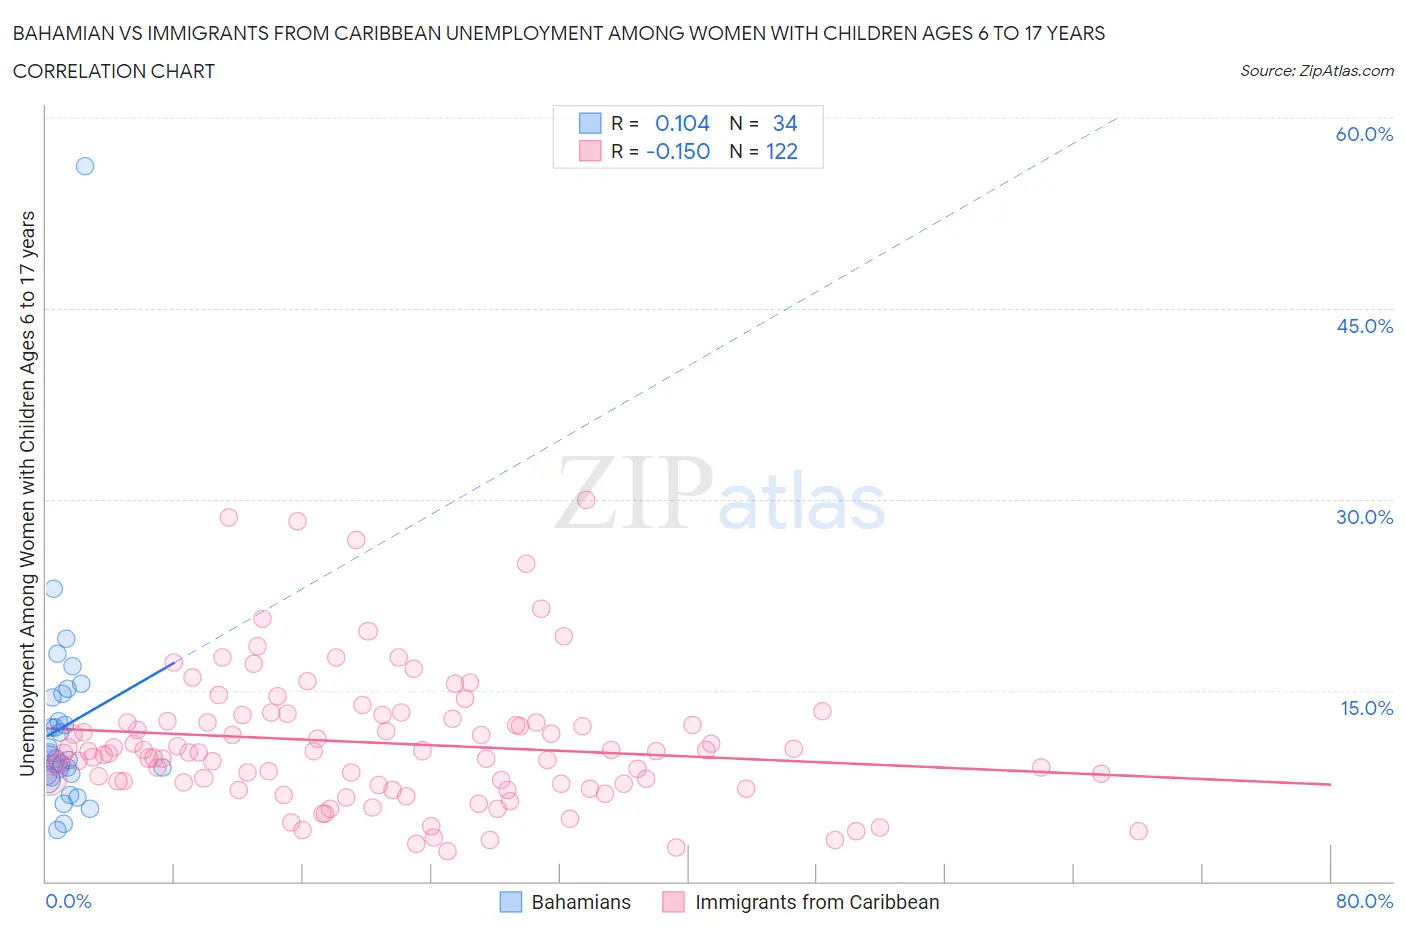
Bahamian vs Immigrants from Caribbean Unemployment Among Women with Children Ages 6 to 17 years Correlation Chart
The statistical analysis conducted on geographies consisting of 97,201,604 people shows a poor positive correlation between the proportion of Bahamians and unemployment rate among women with children between the ages 6 and 17 in the United States with a correlation coefficient (R) of 0.104 and weighted average of 10.4%. Similarly, the statistical analysis conducted on geographies consisting of 317,614,435 people shows a poor negative correlation between the proportion of Immigrants from Caribbean and unemployment rate among women with children between the ages 6 and 17 in the United States with a correlation coefficient (R) of -0.150 and weighted average of 10.1%, a difference of 3.6%.
Unemployment Among Women with Children Ages 6 to 17 years Correlation Summary
| Measurement | Bahamian | Immigrants from Caribbean |
| Minimum | 4.0% | 2.4% |
| Maximum | 56.2% | 30.0% |
| Range | 52.2% | 27.6% |
| Mean | 12.2% | 10.9% |
| Median | 9.7% | 10.1% |
| Interquartile 25% (IQ1) | 8.3% | 7.7% |
| Interquartile 75% (IQ3) | 14.5% | 12.8% |
| Interquartile Range (IQR) | 6.2% | 5.1% |
| Standard Deviation (Sample) | 8.9% | 5.3% |
| Standard Deviation (Population) | 8.7% | 5.3% |
Demographics Similar to Bahamians and Immigrants from Caribbean by Unemployment Among Women with Children Ages 6 to 17 years
In terms of unemployment among women with children ages 6 to 17 years, the demographic groups most similar to Bahamians are Immigrants from Cabo Verde (10.4%, a difference of 0.030%), American (10.4%, a difference of 0.080%), African (10.4%, a difference of 0.26%), Immigrants from Dominica (10.5%, a difference of 0.75%), and Immigrants from Liberia (10.3%, a difference of 1.1%). Similarly, the demographic groups most similar to Immigrants from Caribbean are Immigrants from Western Africa (10.1%, a difference of 0.020%), Immigrants from Haiti (10.1%, a difference of 0.30%), Immigrants from Honduras (10.1%, a difference of 0.32%), Nigerian (10.1%, a difference of 0.34%), and Immigrants from Bahamas (10.1%, a difference of 0.50%).
| Demographics | Rating | Rank | Unemployment Among Women with Children Ages 6 to 17 years |
| Immigrants | Western Africa | 0.0 /100 | #296 | Tragic 10.1% |
| Immigrants | Caribbean | 0.0 /100 | #297 | Tragic 10.1% |
| Immigrants | Haiti | 0.0 /100 | #298 | Tragic 10.1% |
| Immigrants | Honduras | 0.0 /100 | #299 | Tragic 10.1% |
| Nigerians | 0.0 /100 | #300 | Tragic 10.1% |
| Immigrants | Bahamas | 0.0 /100 | #301 | Tragic 10.1% |
| Venezuelans | 0.0 /100 | #302 | Tragic 10.2% |
| Immigrants | Ecuador | 0.0 /100 | #303 | Tragic 10.2% |
| Immigrants | Venezuela | 0.0 /100 | #304 | Tragic 10.2% |
| Immigrants | Nigeria | 0.0 /100 | #305 | Tragic 10.2% |
| Paraguayans | 0.0 /100 | #306 | Tragic 10.2% |
| Immigrants | Senegal | 0.0 /100 | #307 | Tragic 10.2% |
| Dutch West Indians | 0.0 /100 | #308 | Tragic 10.2% |
| French Canadians | 0.0 /100 | #309 | Tragic 10.3% |
| Alaska Natives | 0.0 /100 | #310 | Tragic 10.3% |
| Immigrants | Liberia | 0.0 /100 | #311 | Tragic 10.3% |
| Africans | 0.0 /100 | #312 | Tragic 10.4% |
| Americans | 0.0 /100 | #313 | Tragic 10.4% |
| Immigrants | Cabo Verde | 0.0 /100 | #314 | Tragic 10.4% |
| Bahamians | 0.0 /100 | #315 | Tragic 10.4% |
| Immigrants | Dominica | 0.0 /100 | #316 | Tragic 10.5% |