Zip Codes with the Highest Percentage of Population Employed in Arts, Entertainment & Recreation in Jackson, TN
RELATED REPORTS & OPTIONS
Arts, Entertainment & Recreation
Jackson
Compare Zip Codes
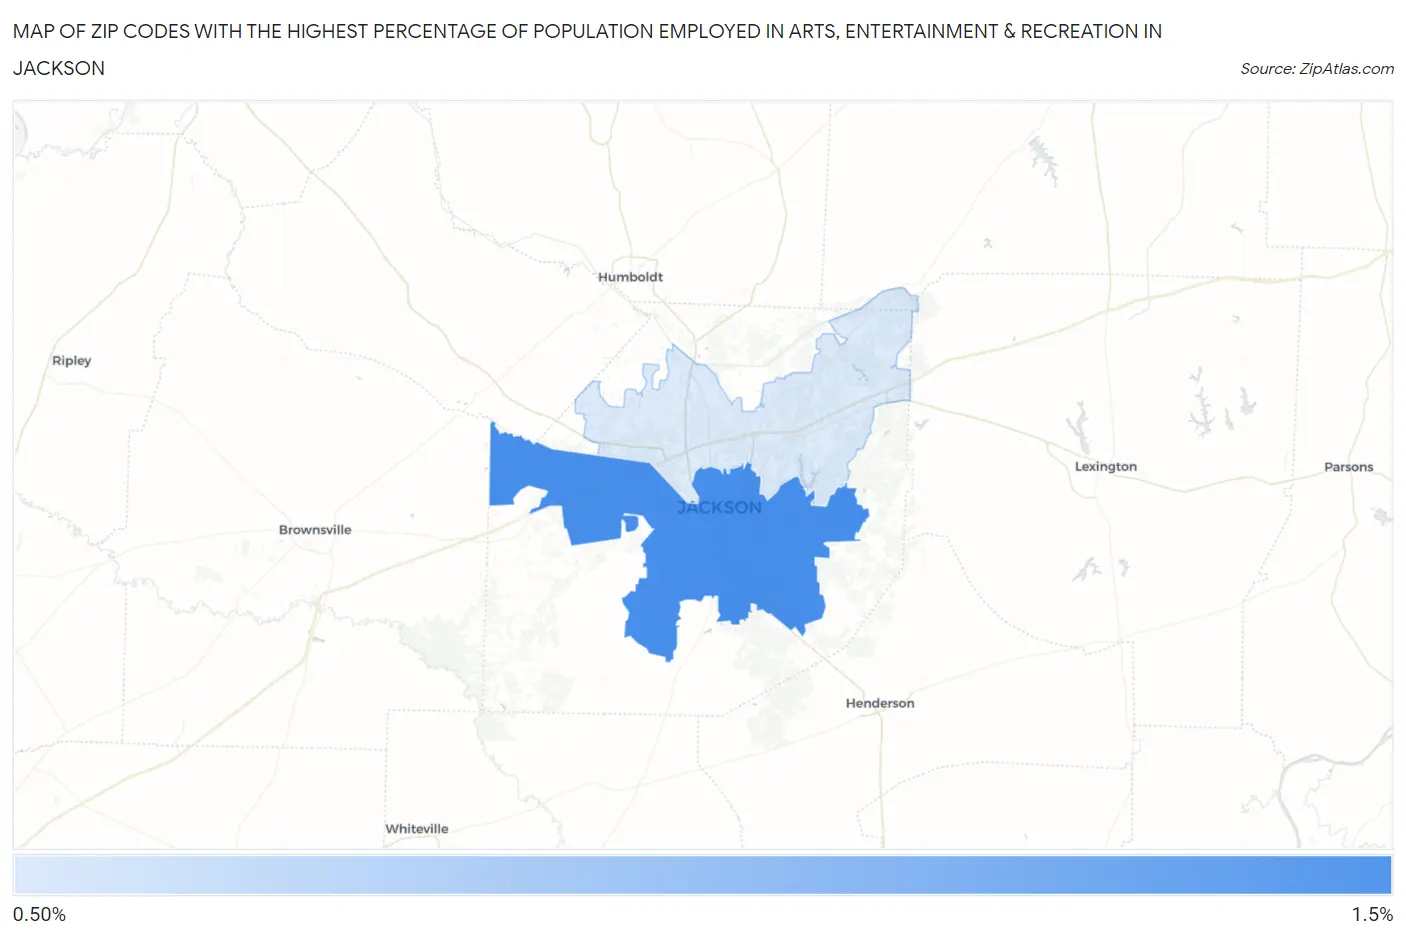
Map of Zip Codes with the Highest Percentage of Population Employed in Arts, Entertainment & Recreation in Jackson
1.4%
1.4%
Zip Codes with the Highest Percentage of Population Employed in Arts, Entertainment & Recreation in Jackson, TN
| Zip Code | % Employed | vs State | vs National | |
| 1. | 38301 | 1.4% | 1.8%(-0.368)#203 | 2.1%(-0.663)#13,818 |
| 2. | 38305 | 1.4% | 1.8%(-0.426)#213 | 2.1%(-0.721)#14,289 |
1
Common Questions
What are the Top Zip Codes with the Highest Percentage of Population Employed in Arts, Entertainment & Recreation in Jackson, TN?
Top Zip Codes with the Highest Percentage of Population Employed in Arts, Entertainment & Recreation in Jackson, TN are:
What zip code has the Highest Percentage of Population Employed in Arts, Entertainment & Recreation in Jackson, TN?
38301 has the Highest Percentage of Population Employed in Arts, Entertainment & Recreation in Jackson, TN with 1.4%.
What is the Percentage of Population Employed in Arts, Entertainment & Recreation in Jackson, TN?
Percentage of Population Employed in Arts, Entertainment & Recreation in Jackson is 1.6%.
What is the Percentage of Population Employed in Arts, Entertainment & Recreation in Tennessee?
Percentage of Population Employed in Arts, Entertainment & Recreation in Tennessee is 1.8%.
What is the Percentage of Population Employed in Arts, Entertainment & Recreation in the United States?
Percentage of Population Employed in Arts, Entertainment & Recreation in the United States is 2.1%.