Zip Codes with the Highest Percentage of Population Employed in Arts, Entertainment & Recreation in Cookeville, TN
RELATED REPORTS & OPTIONS
Arts, Entertainment & Recreation
Cookeville
Compare Zip Codes
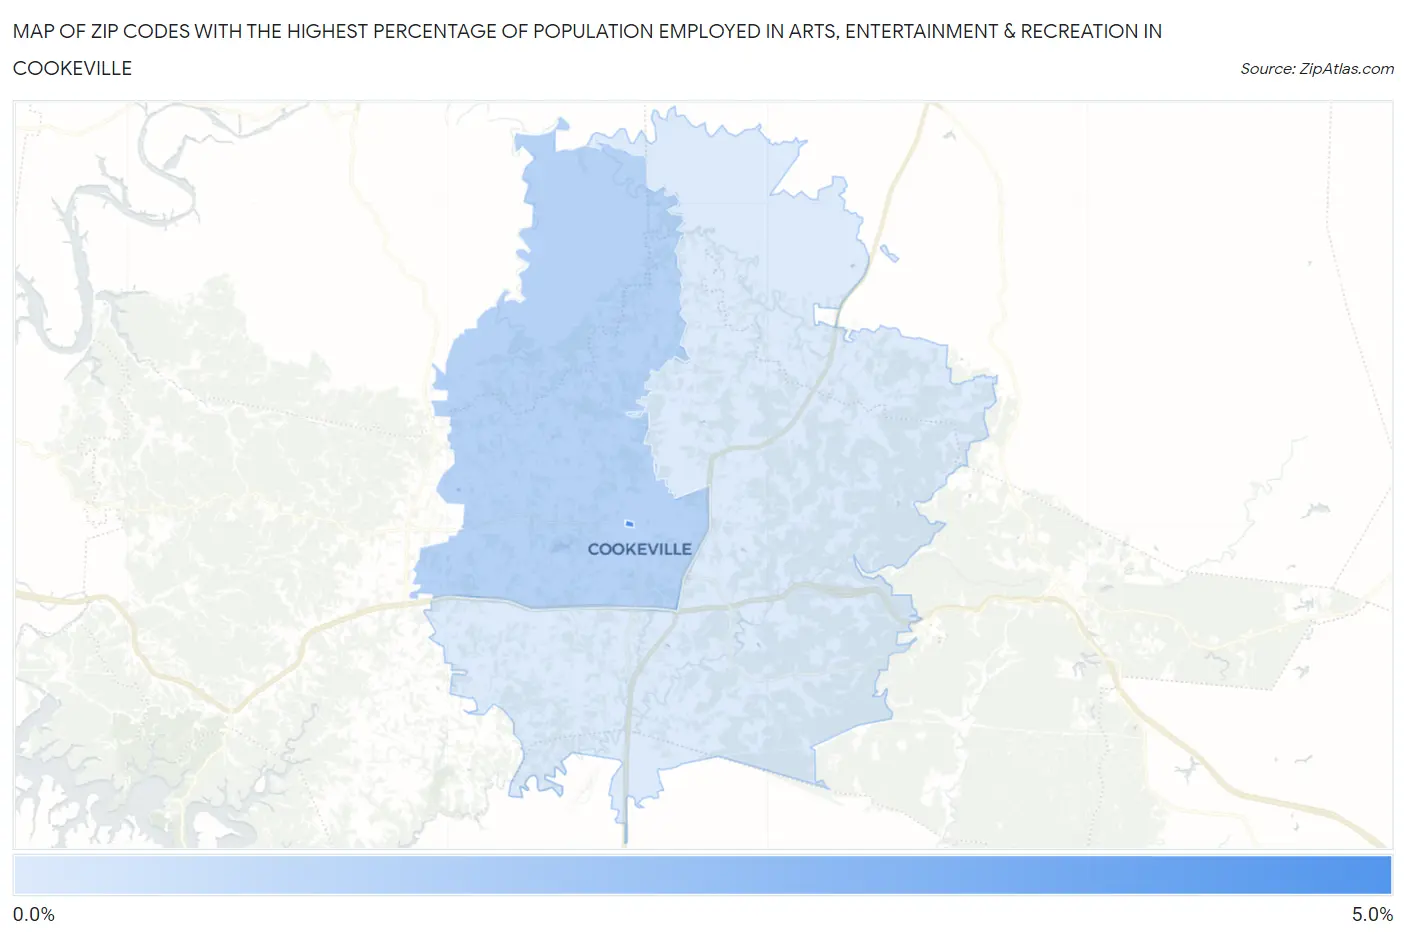
Map of Zip Codes with the Highest Percentage of Population Employed in Arts, Entertainment & Recreation in Cookeville
0.37%
4.5%
Zip Codes with the Highest Percentage of Population Employed in Arts, Entertainment & Recreation in Cookeville, TN
| Zip Code | % Employed | vs State | vs National | |
| 1. | 38505 | 4.5% | 1.8%(+2.67)#38 | 2.1%(+2.38)#2,789 |
| 2. | 38501 | 1.4% | 1.8%(-0.351)#202 | 2.1%(-0.646)#13,713 |
| 3. | 38506 | 0.37% | 1.8%(-1.42)#397 | 2.1%(-1.71)#21,305 |
1
Common Questions
What are the Top Zip Codes with the Highest Percentage of Population Employed in Arts, Entertainment & Recreation in Cookeville, TN?
Top Zip Codes with the Highest Percentage of Population Employed in Arts, Entertainment & Recreation in Cookeville, TN are:
What zip code has the Highest Percentage of Population Employed in Arts, Entertainment & Recreation in Cookeville, TN?
38505 has the Highest Percentage of Population Employed in Arts, Entertainment & Recreation in Cookeville, TN with 4.5%.
What is the Percentage of Population Employed in Arts, Entertainment & Recreation in Cookeville, TN?
Percentage of Population Employed in Arts, Entertainment & Recreation in Cookeville is 1.7%.
What is the Percentage of Population Employed in Arts, Entertainment & Recreation in Tennessee?
Percentage of Population Employed in Arts, Entertainment & Recreation in Tennessee is 1.8%.
What is the Percentage of Population Employed in Arts, Entertainment & Recreation in the United States?
Percentage of Population Employed in Arts, Entertainment & Recreation in the United States is 2.1%.