Black/African American vs Immigrants from China Single Father Poverty
COMPARE
Black/African American
Immigrants from China
Single Father Poverty
Single Father Poverty Comparison
Blacks/African Americans
Immigrants from China
20.4%
SINGLE FATHER POVERTY
0.0/ 100
METRIC RATING
325th/ 347
METRIC RANK
14.9%
SINGLE FATHER POVERTY
99.9/ 100
METRIC RATING
47th/ 347
METRIC RANK
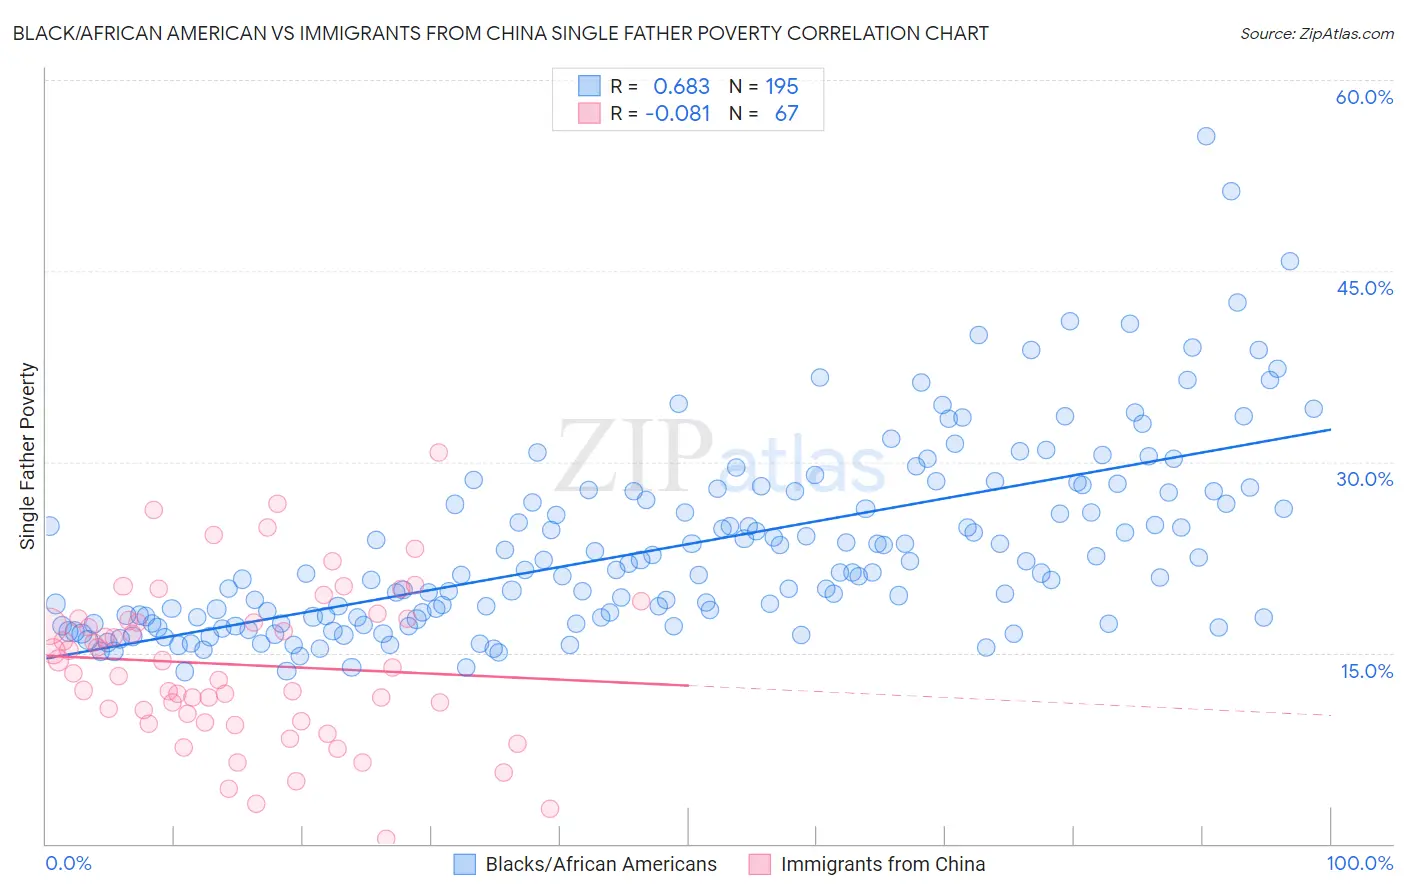
Black/African American vs Immigrants from China Single Father Poverty Correlation Chart
The statistical analysis conducted on geographies consisting of 410,273,271 people shows a significant positive correlation between the proportion of Blacks/African Americans and poverty level among single fathers in the United States with a correlation coefficient (R) of 0.683 and weighted average of 20.4%. Similarly, the statistical analysis conducted on geographies consisting of 348,182,579 people shows a slight negative correlation between the proportion of Immigrants from China and poverty level among single fathers in the United States with a correlation coefficient (R) of -0.081 and weighted average of 14.9%, a difference of 36.4%.
Single Father Poverty Correlation Summary
| Measurement | Black/African American | Immigrants from China |
| Minimum | 13.5% | 0.43% |
| Maximum | 55.6% | 30.8% |
| Range | 42.1% | 30.3% |
| Mean | 23.3% | 14.1% |
| Median | 21.3% | 13.9% |
| Interquartile 25% (IQ1) | 17.6% | 9.6% |
| Interquartile 75% (IQ3) | 27.7% | 17.7% |
| Interquartile Range (IQR) | 10.1% | 8.0% |
| Standard Deviation (Sample) | 7.4% | 6.2% |
| Standard Deviation (Population) | 7.4% | 6.1% |
Similar Demographics by Single Father Poverty
Demographics Similar to Blacks/African Americans by Single Father Poverty
In terms of single father poverty, the demographic groups most similar to Blacks/African Americans are Immigrants from Yemen (20.6%, a difference of 1.0%), American (20.1%, a difference of 1.6%), Choctaw (20.7%, a difference of 1.7%), Pennsylvania German (20.0%, a difference of 1.8%), and Creek (19.8%, a difference of 2.7%).
| Demographics | Rating | Rank | Single Father Poverty |
| Dutch West Indians | 0.0 /100 | #318 | Tragic 19.2% |
| Slovaks | 0.0 /100 | #319 | Tragic 19.3% |
| Inupiat | 0.0 /100 | #320 | Tragic 19.5% |
| Cherokee | 0.0 /100 | #321 | Tragic 19.6% |
| Creek | 0.0 /100 | #322 | Tragic 19.8% |
| Pennsylvania Germans | 0.0 /100 | #323 | Tragic 20.0% |
| Americans | 0.0 /100 | #324 | Tragic 20.1% |
| Blacks/African Americans | 0.0 /100 | #325 | Tragic 20.4% |
| Immigrants | Yemen | 0.0 /100 | #326 | Tragic 20.6% |
| Choctaw | 0.0 /100 | #327 | Tragic 20.7% |
| Pueblo | 0.0 /100 | #328 | Tragic 21.1% |
| Colville | 0.0 /100 | #329 | Tragic 21.4% |
| Paiute | 0.0 /100 | #330 | Tragic 21.6% |
| Central American Indians | 0.0 /100 | #331 | Tragic 21.7% |
| Tohono O'odham | 0.0 /100 | #332 | Tragic 22.0% |
Demographics Similar to Immigrants from China by Single Father Poverty
In terms of single father poverty, the demographic groups most similar to Immigrants from China are Malaysian (14.9%, a difference of 0.010%), Immigrants from Cambodia (14.9%, a difference of 0.030%), Immigrants from Somalia (14.9%, a difference of 0.15%), Immigrants from Eastern Asia (15.0%, a difference of 0.16%), and Bhutanese (15.0%, a difference of 0.21%).
| Demographics | Rating | Rank | Single Father Poverty |
| Pima | 100.0 /100 | #40 | Exceptional 14.8% |
| Indians (Asian) | 100.0 /100 | #41 | Exceptional 14.8% |
| Immigrants | Nepal | 100.0 /100 | #42 | Exceptional 14.8% |
| Immigrants | Eritrea | 100.0 /100 | #43 | Exceptional 14.8% |
| Salvadorans | 100.0 /100 | #44 | Exceptional 14.9% |
| Immigrants | Somalia | 100.0 /100 | #45 | Exceptional 14.9% |
| Immigrants | Cambodia | 99.9 /100 | #46 | Exceptional 14.9% |
| Immigrants | China | 99.9 /100 | #47 | Exceptional 14.9% |
| Malaysians | 99.9 /100 | #48 | Exceptional 14.9% |
| Immigrants | Eastern Asia | 99.9 /100 | #49 | Exceptional 15.0% |
| Bhutanese | 99.9 /100 | #50 | Exceptional 15.0% |
| Immigrants | Pakistan | 99.9 /100 | #51 | Exceptional 15.0% |
| Immigrants | El Salvador | 99.9 /100 | #52 | Exceptional 15.0% |
| Immigrants | Kenya | 99.9 /100 | #53 | Exceptional 15.0% |
| Immigrants | Uzbekistan | 99.9 /100 | #54 | Exceptional 15.0% |