Black/African American vs Immigrants from Cabo Verde Single Father Poverty
COMPARE
Black/African American
Immigrants from Cabo Verde
Single Father Poverty
Single Father Poverty Comparison
Blacks/African Americans
Immigrants from Cabo Verde
20.4%
SINGLE FATHER POVERTY
0.0/ 100
METRIC RATING
325th/ 347
METRIC RANK
17.0%
SINGLE FATHER POVERTY
1.6/ 100
METRIC RATING
243rd/ 347
METRIC RANK
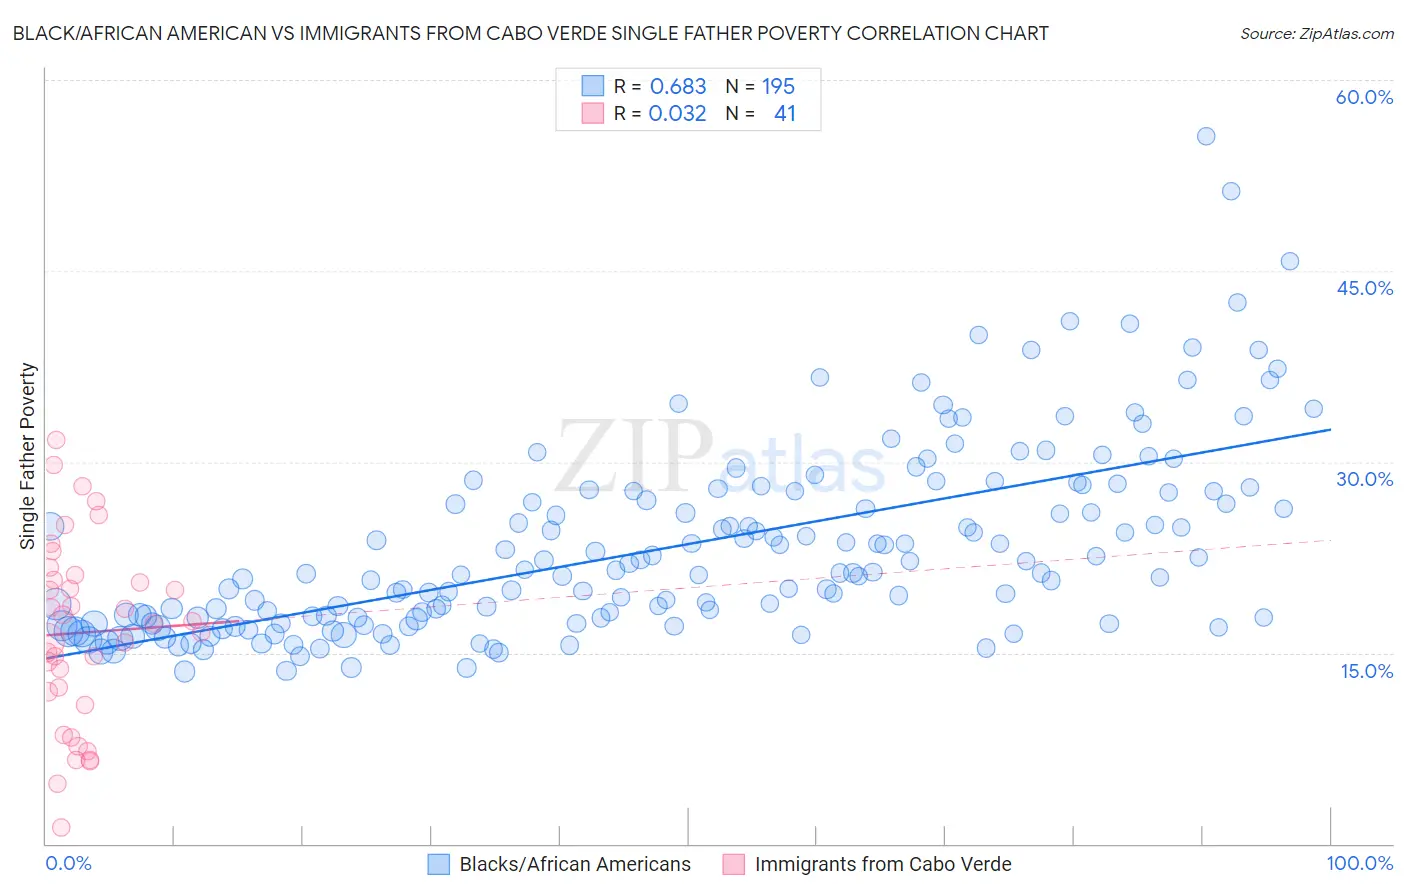
Black/African American vs Immigrants from Cabo Verde Single Father Poverty Correlation Chart
The statistical analysis conducted on geographies consisting of 410,273,271 people shows a significant positive correlation between the proportion of Blacks/African Americans and poverty level among single fathers in the United States with a correlation coefficient (R) of 0.683 and weighted average of 20.4%. Similarly, the statistical analysis conducted on geographies consisting of 35,352,223 people shows no correlation between the proportion of Immigrants from Cabo Verde and poverty level among single fathers in the United States with a correlation coefficient (R) of 0.032 and weighted average of 17.0%, a difference of 19.6%.
Single Father Poverty Correlation Summary
| Measurement | Black/African American | Immigrants from Cabo Verde |
| Minimum | 13.5% | 1.3% |
| Maximum | 55.6% | 31.8% |
| Range | 42.1% | 30.4% |
| Mean | 23.3% | 16.6% |
| Median | 21.3% | 17.3% |
| Interquartile 25% (IQ1) | 17.6% | 11.4% |
| Interquartile 75% (IQ3) | 27.7% | 20.9% |
| Interquartile Range (IQR) | 10.1% | 9.5% |
| Standard Deviation (Sample) | 7.4% | 7.2% |
| Standard Deviation (Population) | 7.4% | 7.1% |
Similar Demographics by Single Father Poverty
Demographics Similar to Blacks/African Americans by Single Father Poverty
In terms of single father poverty, the demographic groups most similar to Blacks/African Americans are Immigrants from Yemen (20.6%, a difference of 1.0%), American (20.1%, a difference of 1.6%), Choctaw (20.7%, a difference of 1.7%), Pennsylvania German (20.0%, a difference of 1.8%), and Creek (19.8%, a difference of 2.7%).
| Demographics | Rating | Rank | Single Father Poverty |
| Dutch West Indians | 0.0 /100 | #318 | Tragic 19.2% |
| Slovaks | 0.0 /100 | #319 | Tragic 19.3% |
| Inupiat | 0.0 /100 | #320 | Tragic 19.5% |
| Cherokee | 0.0 /100 | #321 | Tragic 19.6% |
| Creek | 0.0 /100 | #322 | Tragic 19.8% |
| Pennsylvania Germans | 0.0 /100 | #323 | Tragic 20.0% |
| Americans | 0.0 /100 | #324 | Tragic 20.1% |
| Blacks/African Americans | 0.0 /100 | #325 | Tragic 20.4% |
| Immigrants | Yemen | 0.0 /100 | #326 | Tragic 20.6% |
| Choctaw | 0.0 /100 | #327 | Tragic 20.7% |
| Pueblo | 0.0 /100 | #328 | Tragic 21.1% |
| Colville | 0.0 /100 | #329 | Tragic 21.4% |
| Paiute | 0.0 /100 | #330 | Tragic 21.6% |
| Central American Indians | 0.0 /100 | #331 | Tragic 21.7% |
| Tohono O'odham | 0.0 /100 | #332 | Tragic 22.0% |
Demographics Similar to Immigrants from Cabo Verde by Single Father Poverty
In terms of single father poverty, the demographic groups most similar to Immigrants from Cabo Verde are Honduran (17.0%, a difference of 0.020%), Trinidadian and Tobagonian (17.0%, a difference of 0.060%), Immigrants from Ireland (17.1%, a difference of 0.10%), Greek (17.1%, a difference of 0.20%), and Czechoslovakian (17.1%, a difference of 0.20%).
| Demographics | Rating | Rank | Single Father Poverty |
| Immigrants | Germany | 2.9 /100 | #236 | Tragic 16.9% |
| Sub-Saharan Africans | 2.9 /100 | #237 | Tragic 16.9% |
| Immigrants | Saudi Arabia | 2.7 /100 | #238 | Tragic 16.9% |
| Bermudans | 2.6 /100 | #239 | Tragic 16.9% |
| Finns | 2.6 /100 | #240 | Tragic 16.9% |
| Czechs | 2.3 /100 | #241 | Tragic 17.0% |
| Moroccans | 2.1 /100 | #242 | Tragic 17.0% |
| Immigrants | Cabo Verde | 1.6 /100 | #243 | Tragic 17.0% |
| Hondurans | 1.6 /100 | #244 | Tragic 17.0% |
| Trinidadians and Tobagonians | 1.5 /100 | #245 | Tragic 17.0% |
| Immigrants | Ireland | 1.4 /100 | #246 | Tragic 17.1% |
| Greeks | 1.3 /100 | #247 | Tragic 17.1% |
| Czechoslovakians | 1.3 /100 | #248 | Tragic 17.1% |
| Canadians | 1.3 /100 | #249 | Tragic 17.1% |
| Austrians | 1.1 /100 | #250 | Tragic 17.1% |