Welsh vs Lumbee Married-Couple Family Poverty
COMPARE
Welsh
Lumbee
Married-Couple Family Poverty
Married-Couple Family Poverty Comparison
Welsh
Lumbee
4.3%
MARRIED-COUPLE FAMILY POVERTY
99.7/ 100
METRIC RATING
53rd/ 347
METRIC RANK
8.3%
MARRIED-COUPLE FAMILY POVERTY
0.0/ 100
METRIC RATING
333rd/ 347
METRIC RANK
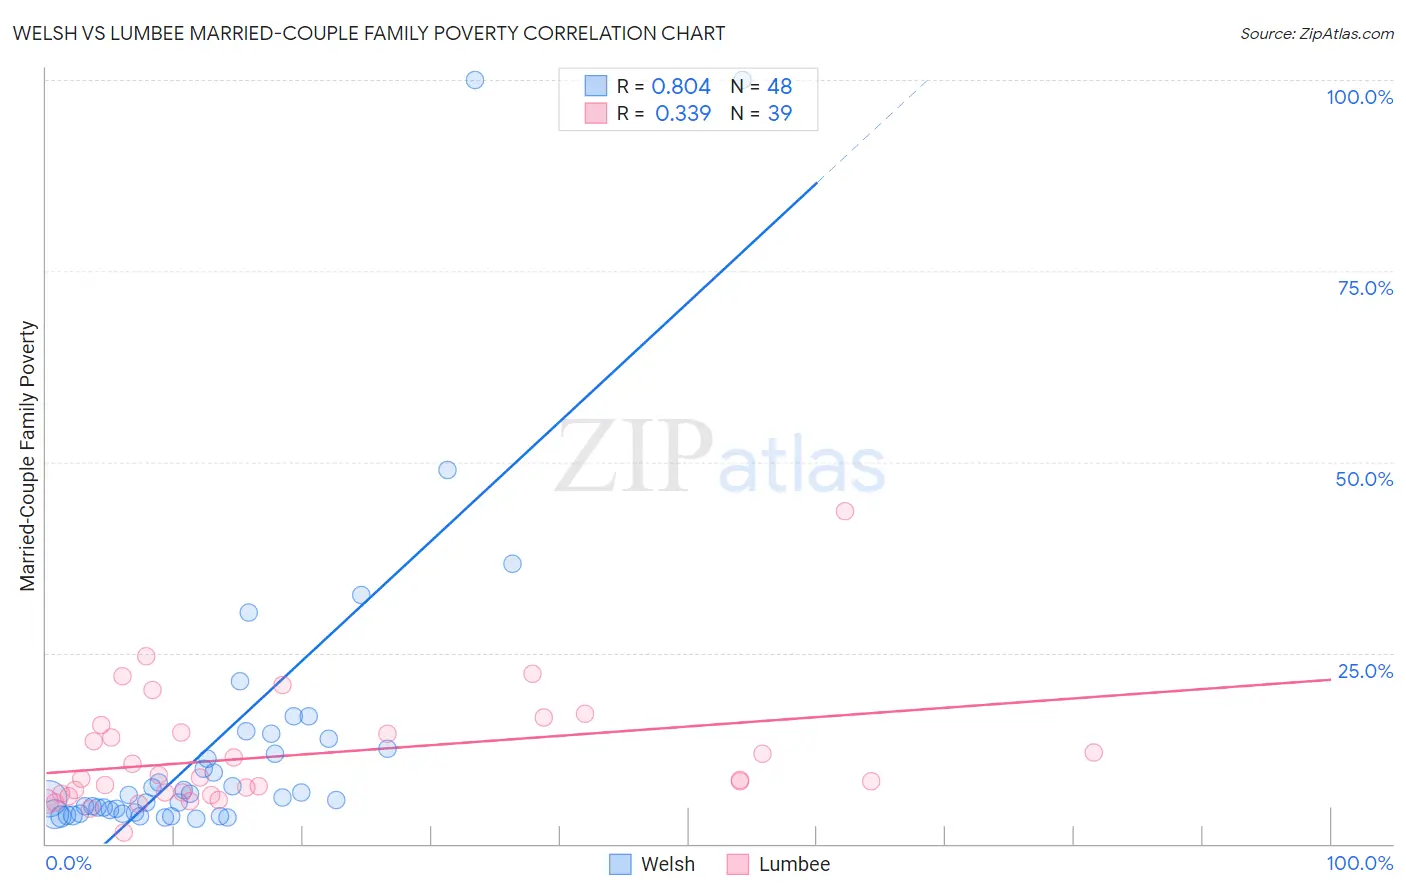
Welsh vs Lumbee Married-Couple Family Poverty Correlation Chart
The statistical analysis conducted on geographies consisting of 518,114,778 people shows a very strong positive correlation between the proportion of Welsh and poverty level among married-couple families in the United States with a correlation coefficient (R) of 0.804 and weighted average of 4.3%. Similarly, the statistical analysis conducted on geographies consisting of 92,019,006 people shows a mild positive correlation between the proportion of Lumbee and poverty level among married-couple families in the United States with a correlation coefficient (R) of 0.339 and weighted average of 8.3%, a difference of 92.8%.
Married-Couple Family Poverty Correlation Summary
| Measurement | Welsh | Lumbee |
| Minimum | 3.3% | 1.5% |
| Maximum | 100.0% | 43.5% |
| Range | 96.7% | 41.9% |
| Mean | 13.6% | 11.6% |
| Median | 6.3% | 8.6% |
| Interquartile 25% (IQ1) | 4.1% | 6.6% |
| Interquartile 75% (IQ3) | 13.2% | 14.5% |
| Interquartile Range (IQR) | 9.1% | 7.9% |
| Standard Deviation (Sample) | 20.5% | 7.7% |
| Standard Deviation (Population) | 20.3% | 7.6% |
Similar Demographics by Married-Couple Family Poverty
Demographics Similar to Welsh by Married-Couple Family Poverty
In terms of married-couple family poverty, the demographic groups most similar to Welsh are Russian (4.3%, a difference of 0.15%), Immigrants from Lithuania (4.3%, a difference of 0.18%), Burmese (4.3%, a difference of 0.19%), Austrian (4.3%, a difference of 0.26%), and Turkish (4.3%, a difference of 0.29%).
| Demographics | Rating | Rank | Married-Couple Family Poverty |
| British | 99.8 /100 | #46 | Exceptional 4.3% |
| Immigrants | South Central Asia | 99.8 /100 | #47 | Exceptional 4.3% |
| Australians | 99.7 /100 | #48 | Exceptional 4.3% |
| Turks | 99.7 /100 | #49 | Exceptional 4.3% |
| Burmese | 99.7 /100 | #50 | Exceptional 4.3% |
| Immigrants | Lithuania | 99.7 /100 | #51 | Exceptional 4.3% |
| Russians | 99.7 /100 | #52 | Exceptional 4.3% |
| Welsh | 99.7 /100 | #53 | Exceptional 4.3% |
| Austrians | 99.7 /100 | #54 | Exceptional 4.3% |
| French | 99.7 /100 | #55 | Exceptional 4.3% |
| Immigrants | Zimbabwe | 99.7 /100 | #56 | Exceptional 4.3% |
| Immigrants | Netherlands | 99.7 /100 | #57 | Exceptional 4.3% |
| Czechoslovakians | 99.7 /100 | #58 | Exceptional 4.4% |
| Immigrants | Sweden | 99.6 /100 | #59 | Exceptional 4.4% |
| Tlingit-Haida | 99.6 /100 | #60 | Exceptional 4.4% |
Demographics Similar to Lumbee by Married-Couple Family Poverty
In terms of married-couple family poverty, the demographic groups most similar to Lumbee are Dominican (8.3%, a difference of 0.47%), Central American Indian (8.3%, a difference of 0.53%), Paiute (8.3%, a difference of 0.59%), Immigrants from Dominican Republic (8.4%, a difference of 0.68%), and Native/Alaskan (8.2%, a difference of 1.9%).
| Demographics | Rating | Rank | Married-Couple Family Poverty |
| Immigrants | Bangladesh | 0.0 /100 | #326 | Tragic 7.5% |
| Hispanics or Latinos | 0.0 /100 | #327 | Tragic 7.5% |
| Immigrants | Mexico | 0.0 /100 | #328 | Tragic 7.6% |
| Natives/Alaskans | 0.0 /100 | #329 | Tragic 8.2% |
| Paiute | 0.0 /100 | #330 | Tragic 8.3% |
| Central American Indians | 0.0 /100 | #331 | Tragic 8.3% |
| Dominicans | 0.0 /100 | #332 | Tragic 8.3% |
| Lumbee | 0.0 /100 | #333 | Tragic 8.3% |
| Immigrants | Dominican Republic | 0.0 /100 | #334 | Tragic 8.4% |
| Sioux | 0.0 /100 | #335 | Tragic 8.7% |
| Apache | 0.0 /100 | #336 | Tragic 9.0% |
| Yakama | 0.0 /100 | #337 | Tragic 9.0% |
| Cheyenne | 0.0 /100 | #338 | Tragic 9.4% |
| Crow | 0.0 /100 | #339 | Tragic 9.6% |
| Yuman | 0.0 /100 | #340 | Tragic 9.7% |